4.1. Resistance Performance
With the rapid advancement of computer technology, the efficiency of numerical computation has significantly improved. CFD technology has been extensively applied in naval architecture and marine engineering due to its superior characteristics of high efficiency, low costs, and strong operability. This study employs the CFD software STAR-CCM+ (Release 18.04.008-R8) for numerical simulations of ship propulsion performance indicators. The Navier–Stokes equations and continuity equation for incompressible fluids are adopted to resolve the turbulent flow problems, with the k-ε turbulence model implemented to close the N-S equations. Recognized as the most prevalent and widely used turbulence model, the k-ε model comprises two governing equations for the turbulent kinetic energy and dissipation rate [
34]. To accurately track free surface deformation and complete resistance calculations for ships in both calm water and waves, the Volume of Fluid (VOF) method is employed to capture free surface variations.
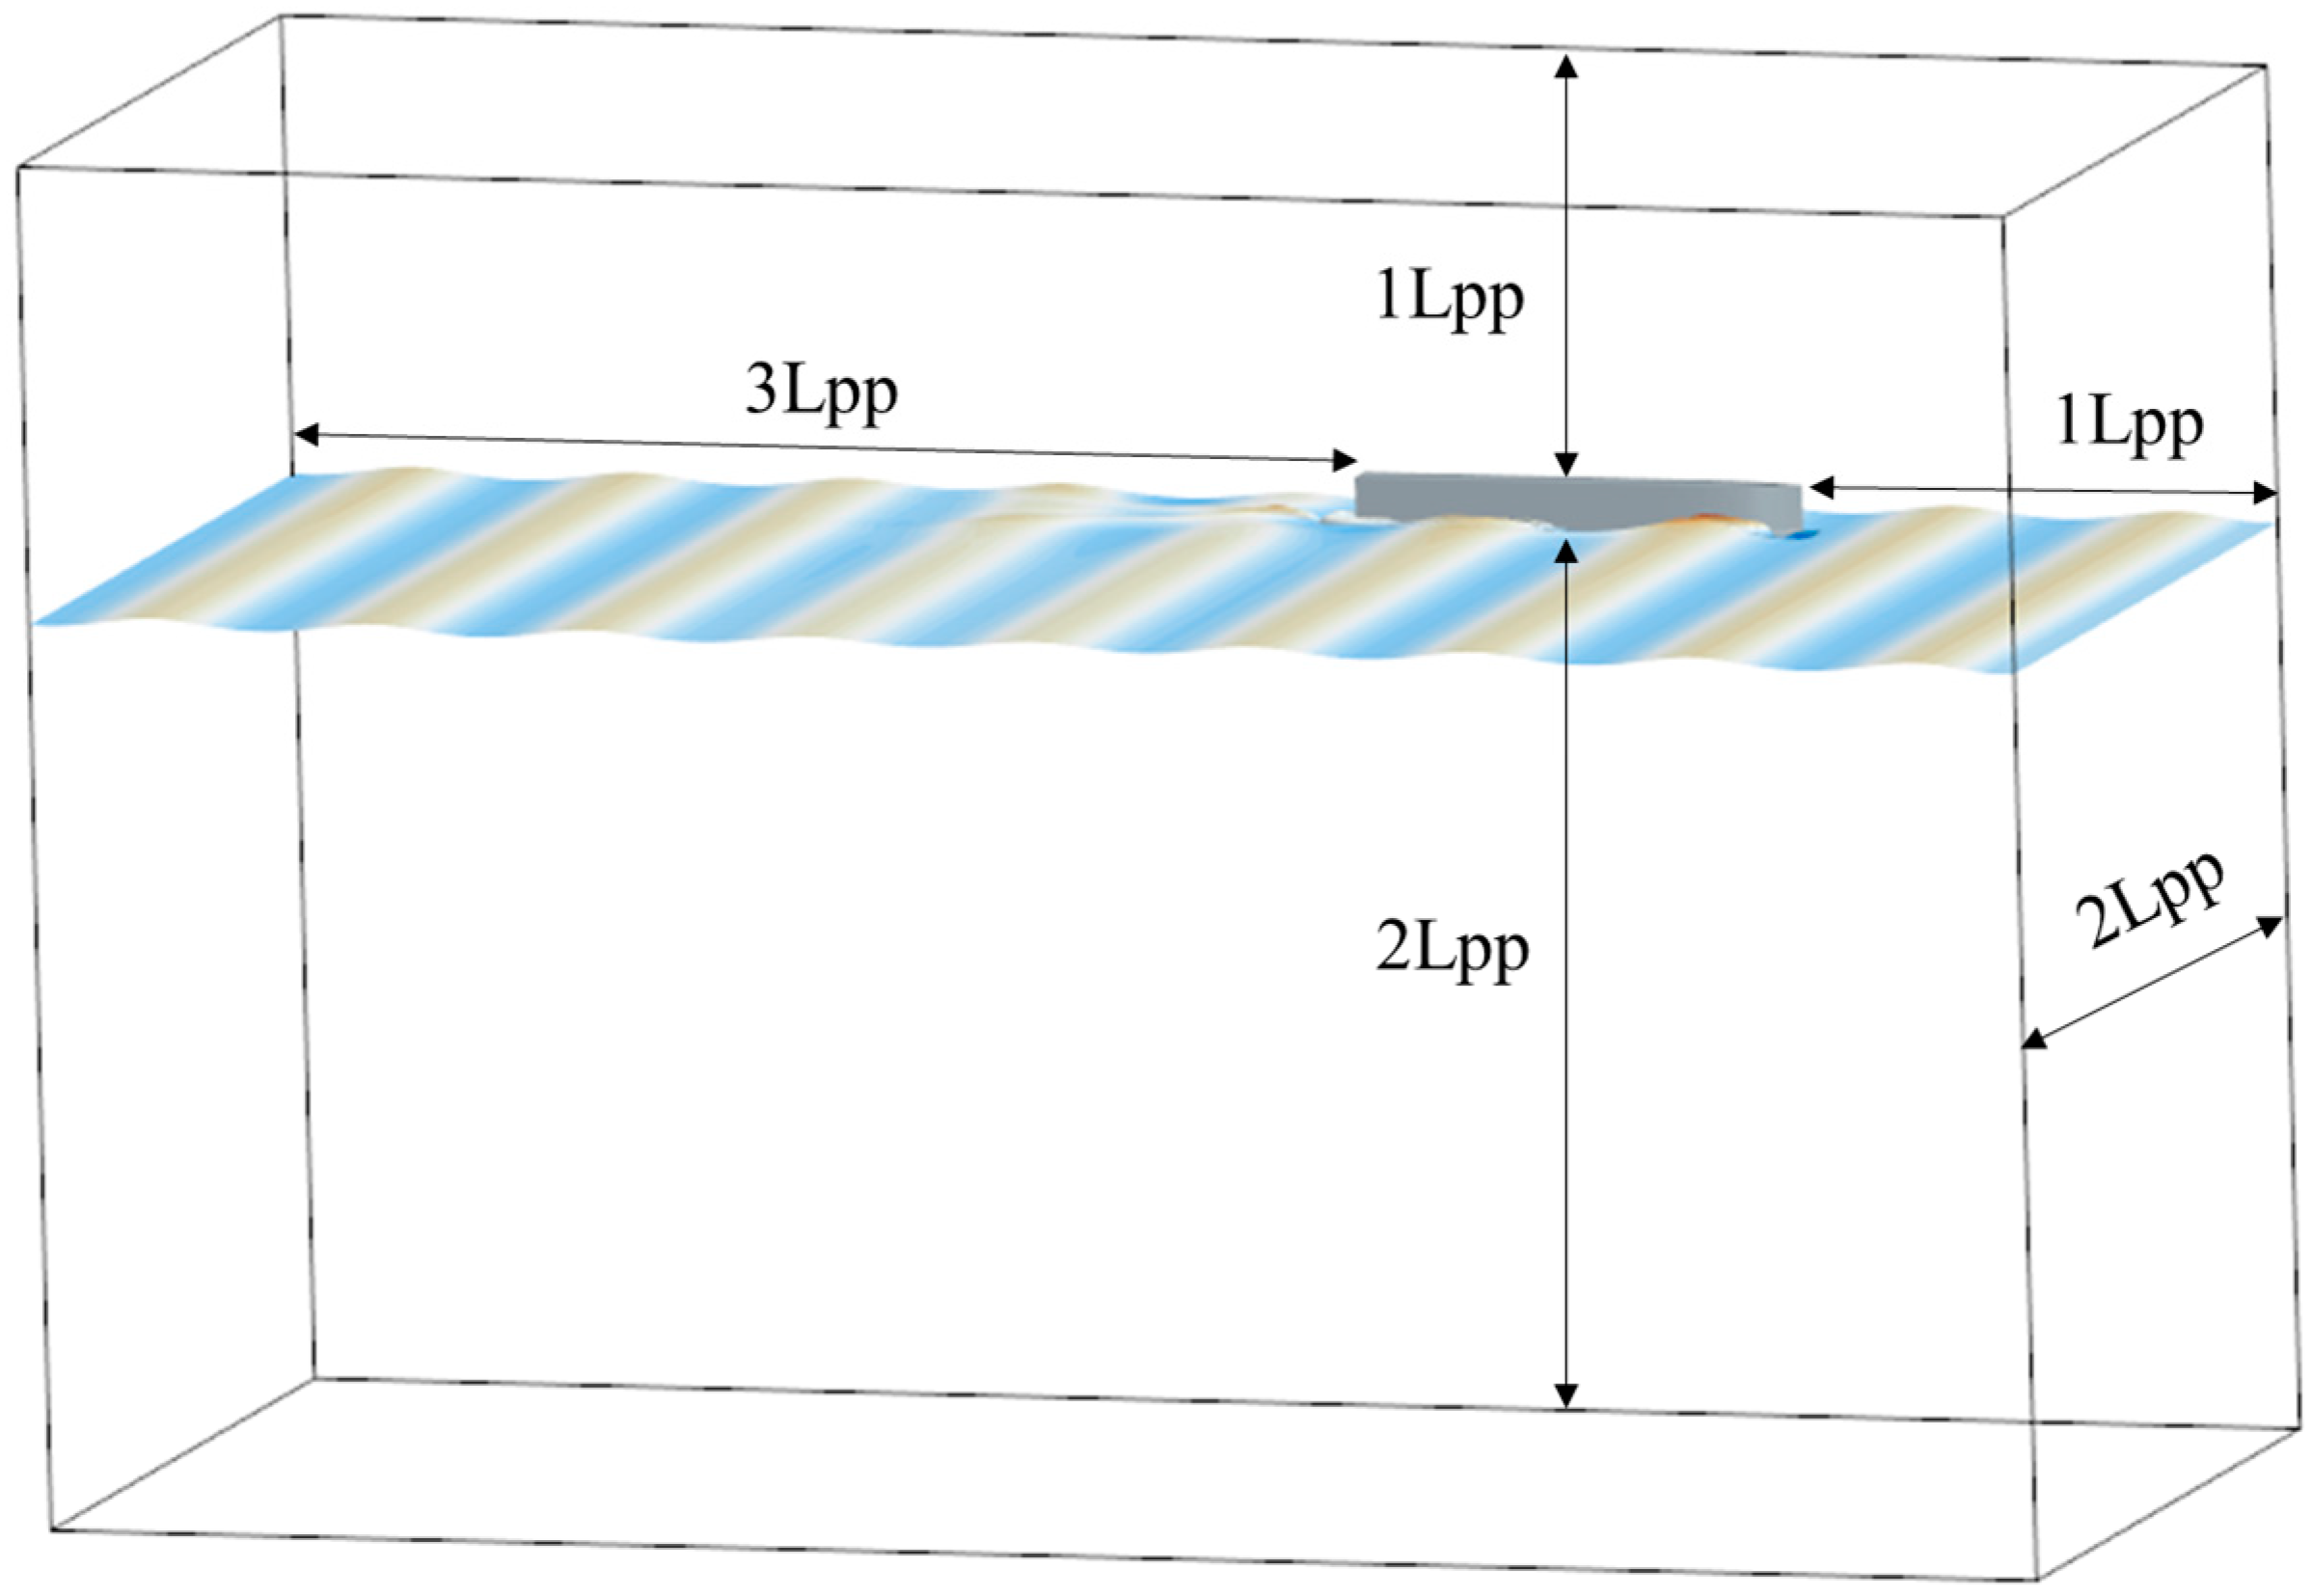
To ensure numerical simulation accuracy, eliminate boundary-induced reflected waves, and enhance computational efficiency, the appropriate configuration of the computational domain is essential. A rectangular computational domain (as illustrated in
Figure 5) is established, with longitudinal dimensions of five times the ship length (Lpp), extending 2 Lpp upstream and 3 Lpp downstream from the stern origin. Vertically, the domain spans 2 Lpp below and 1 Lpp above the design waterline. The transverse dimension is set as 2 Lpp, with a 2.5 Lpp wave damping zone positioned at the domain outlet. The boundary conditions are specified as follows: no-slip wall for the hull surface, velocity inlet for the domain entrance and top, bottom, and far-side boundaries, pressure outlet for the domain exit, and symmetry plane for the near-side boundary. The computational domain and boundary configuration are illustrated in
Figure 6.
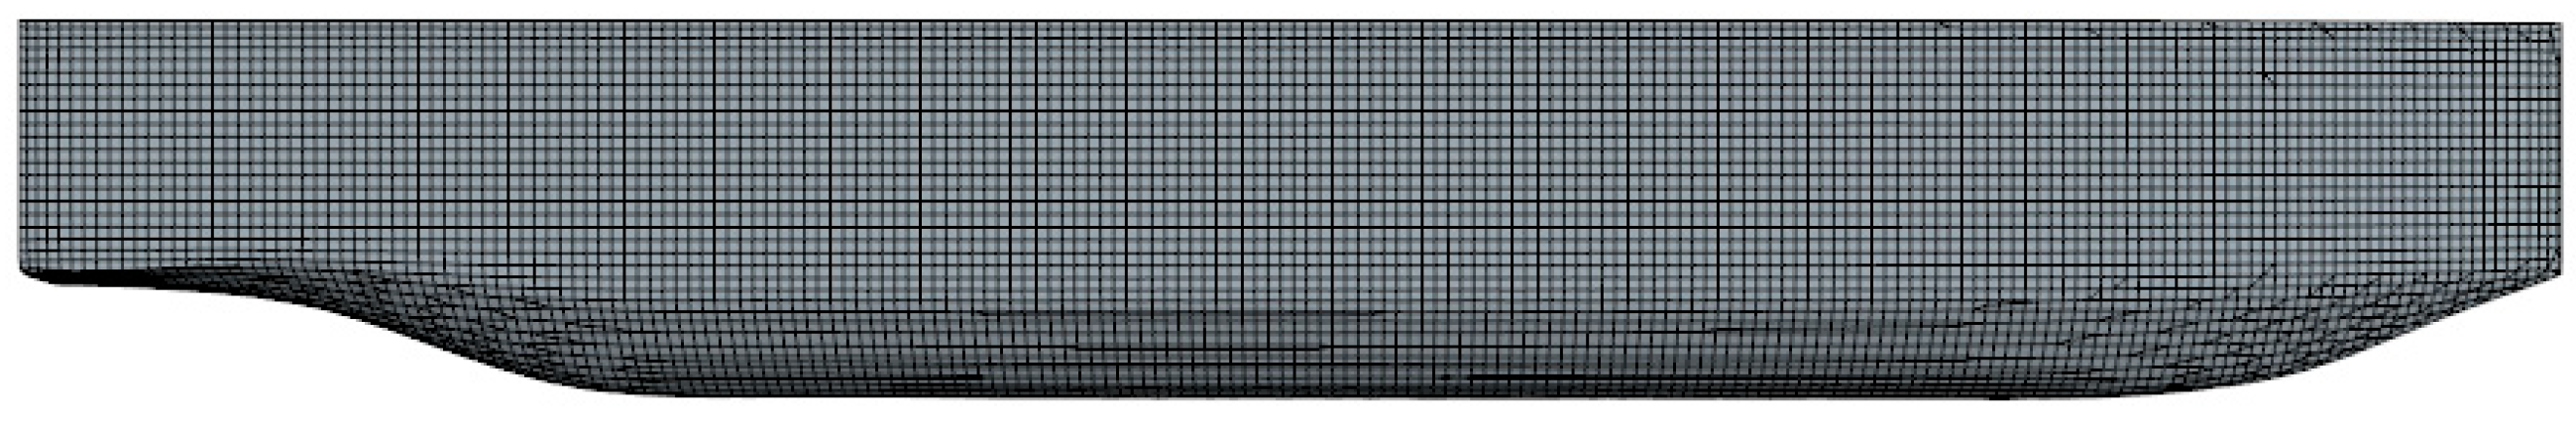
For calm water resistance calculations, local grid refinement is implemented in the Kelvin wave region of the free surface to accurately capture wave patterns. A prism layer mesh with six layers is generated around the hull to resolve the near-wall flow characteristics, employing a growth rate of 1.3 between successive layers. The wall y+ value can be used to evaluate the quality of the near-wall mesh. It represents the dimensionless distance from the wall surface to the first node away from the wall surface. Generally speaking, different turbulence models have different requirements for the wall y+ value. For example, for the standard k-ε turbulence model, it is usually desired that the wall y+ value is within the range from 30 to 300. In this way, it is ensured that the turbulent boundary layer in the near-wall region can be well resolved, making the calculation results more accurate. The hull surface mesh configuration is presented in
Figure 7. To achieve high simulation accuracy and computational efficiency, we have used the method of prism layers and near-wall refinement in the meshing of the hull surface. The meshing method can perform more precise discretization and description of the boundary layer. In addition, the mesh structure of the prism layer can make the mesh denser near the wall surface and gradually sparser in the region away from the wall surface. This gradient mesh distribution not only meets the requirements for mesh resolution in boundary layer simulation, but also avoids excessive mesh refinement throughout the entire computational domain, thus effectively controlling the number of meshes and computational costs. Compared with uniformly distributed meshes, this meshing method can significantly improve computational efficiency on the premise of ensuring computational accuracy.
Numerical simulations of catamarans in irregular waves employ the overset grid technique. The computational domain is divided into two distinct grid zones: overset grids and background grids. Separate meshes are generated for the background and overset domains, with an interface established between them to facilitate data exchange. Considering the VOF wave model implementation, two levels of volumetric grid refinement are created to capture Kelvin waves, hull wake flows, and free surface features. To ensure accurate data transfer between the overlapping regions and the realistic simulation of catamaran motions in regular waves, the grid sizes are strictly matched between the two domains. Sufficient grid resolution along both the wave height and propagation directions is maintained to mitigate numerical dissipation, with the mesh dimensions determined by the incident wavelength requirements: 60–100 cells per wavelength and 10–20 cells in the wave height direction. The grid refinement in overlapping regions and the free surface is illustrated in
Figure 8.
Given the geometric symmetry and identical flow fields around the twin hulls of the catamaran, a half-model configuration is adopted to enhance computational efficiency. The RANS-based standard k-ε model is selected for turbulence closure. The implicit unsteady (second-order backward Euler) method is set as solution method, with the time step as 0.01 s. The governing equations are discretized using the finite volume method and solved through the SIMPLE algorithm. The ship motions in waves are simulated via the Dynamic Fluid Body Interaction (DFBI) approach, while free surface evolution is captured using the VOF method.
To verify the rationality of grid sizing in the numerical simulations of the salvage catamaran and quantify the uncertainties arising from spatial discretization, this study conducted a grid convergence analysis. Three grid sets with varying resolutions (designated as fine, medium, and coarse) were generated [
35]. The grid convergence index (GCI) method was employed to assess the numerical uncertainties and convergence behavior induced by grid density. The complete methodological details of the GCI implementation can be found in [
36].
This study primarily focuses on numerical investigations of resistance and seakeeping performance for the salvage catamaran, with rigorous quantification of the discretization uncertainties inherent in these simulations. Three distinct grid configurations were systematically implemented for each computational case: fine (N
F), medium (N
M), and coarse (N
C) mesh systems. φ1, φ2, and φ3 correspond to the solutions (calm water resistance coefficient and wave-added resistance coefficient) with the fine, medium, and coarse grids. The calm water resistance coefficient was calculated in Fr = 0.7 conditiond, and the wave-added resistance coefficient was calculated under Case4 wave conditions. The convergence ratio R, approximate relative error Ea,21, extrapolated relative error Eext,21, and fine-grid convergence index GCIfine,21, were calculated following the verification methodology. As demonstrated in
Table 4, all spatial convergence studies exhibited monotonic convergence (0 < R < 1). The discretization error for the fine-grid configuration was confirmed to be below 2.11%, validating the numerical reliability of the adopted mesh system. The medium grid was selected for subsequent simulations to balance the accuracy and computational cost.
To validate the reliability of the numerical methodology, experimental data from the internationally recognized Delft-372 benchmark hull are adopted for verification [
37]. This hull form has accumulated extensive experimental datasets under various Froude number (Fr) conditions, including calm water resistance characteristics and motion responses in wave conditions, thereby providing a robust basis for validating numerical approaches. The experiments were conducted in the CNR-INSEAN No. 2 towing tank. Three CCD cameras were employed to measure the model motions, while the total wave-induced resistance was directly measured using load cells installed between the hulls.
Typical Fr values of 0.5, 0.55, 0.6, 0.65, 0.7, and 0.75 are selected for calm water resistance validation. For the hydrodynamic performance evaluation in head wave conditions, numerical simulations are conducted with multiple wave parameters at Fr = 0.7, and the computational results are compared against scaled model test data. To facilitate quantitative comparison, results are processed through non-dimensionalization. The dimensionless form of the mean calm water resistance is expressed as follows:
where
Rcalm represents the longitudinal mean resistance in calm water,
S denotes the wetted surface area, and
Uship is the ship speed.
The wave-added resistance
RAW in regular waves is defined as the difference between the mean resistance in waves and calm water. The nondimensional form of
RAW is as follows:
where
b represents the ship breadth,
η denotes the incident wave amplitude, and
Lpp indicates the length between perpendiculars.
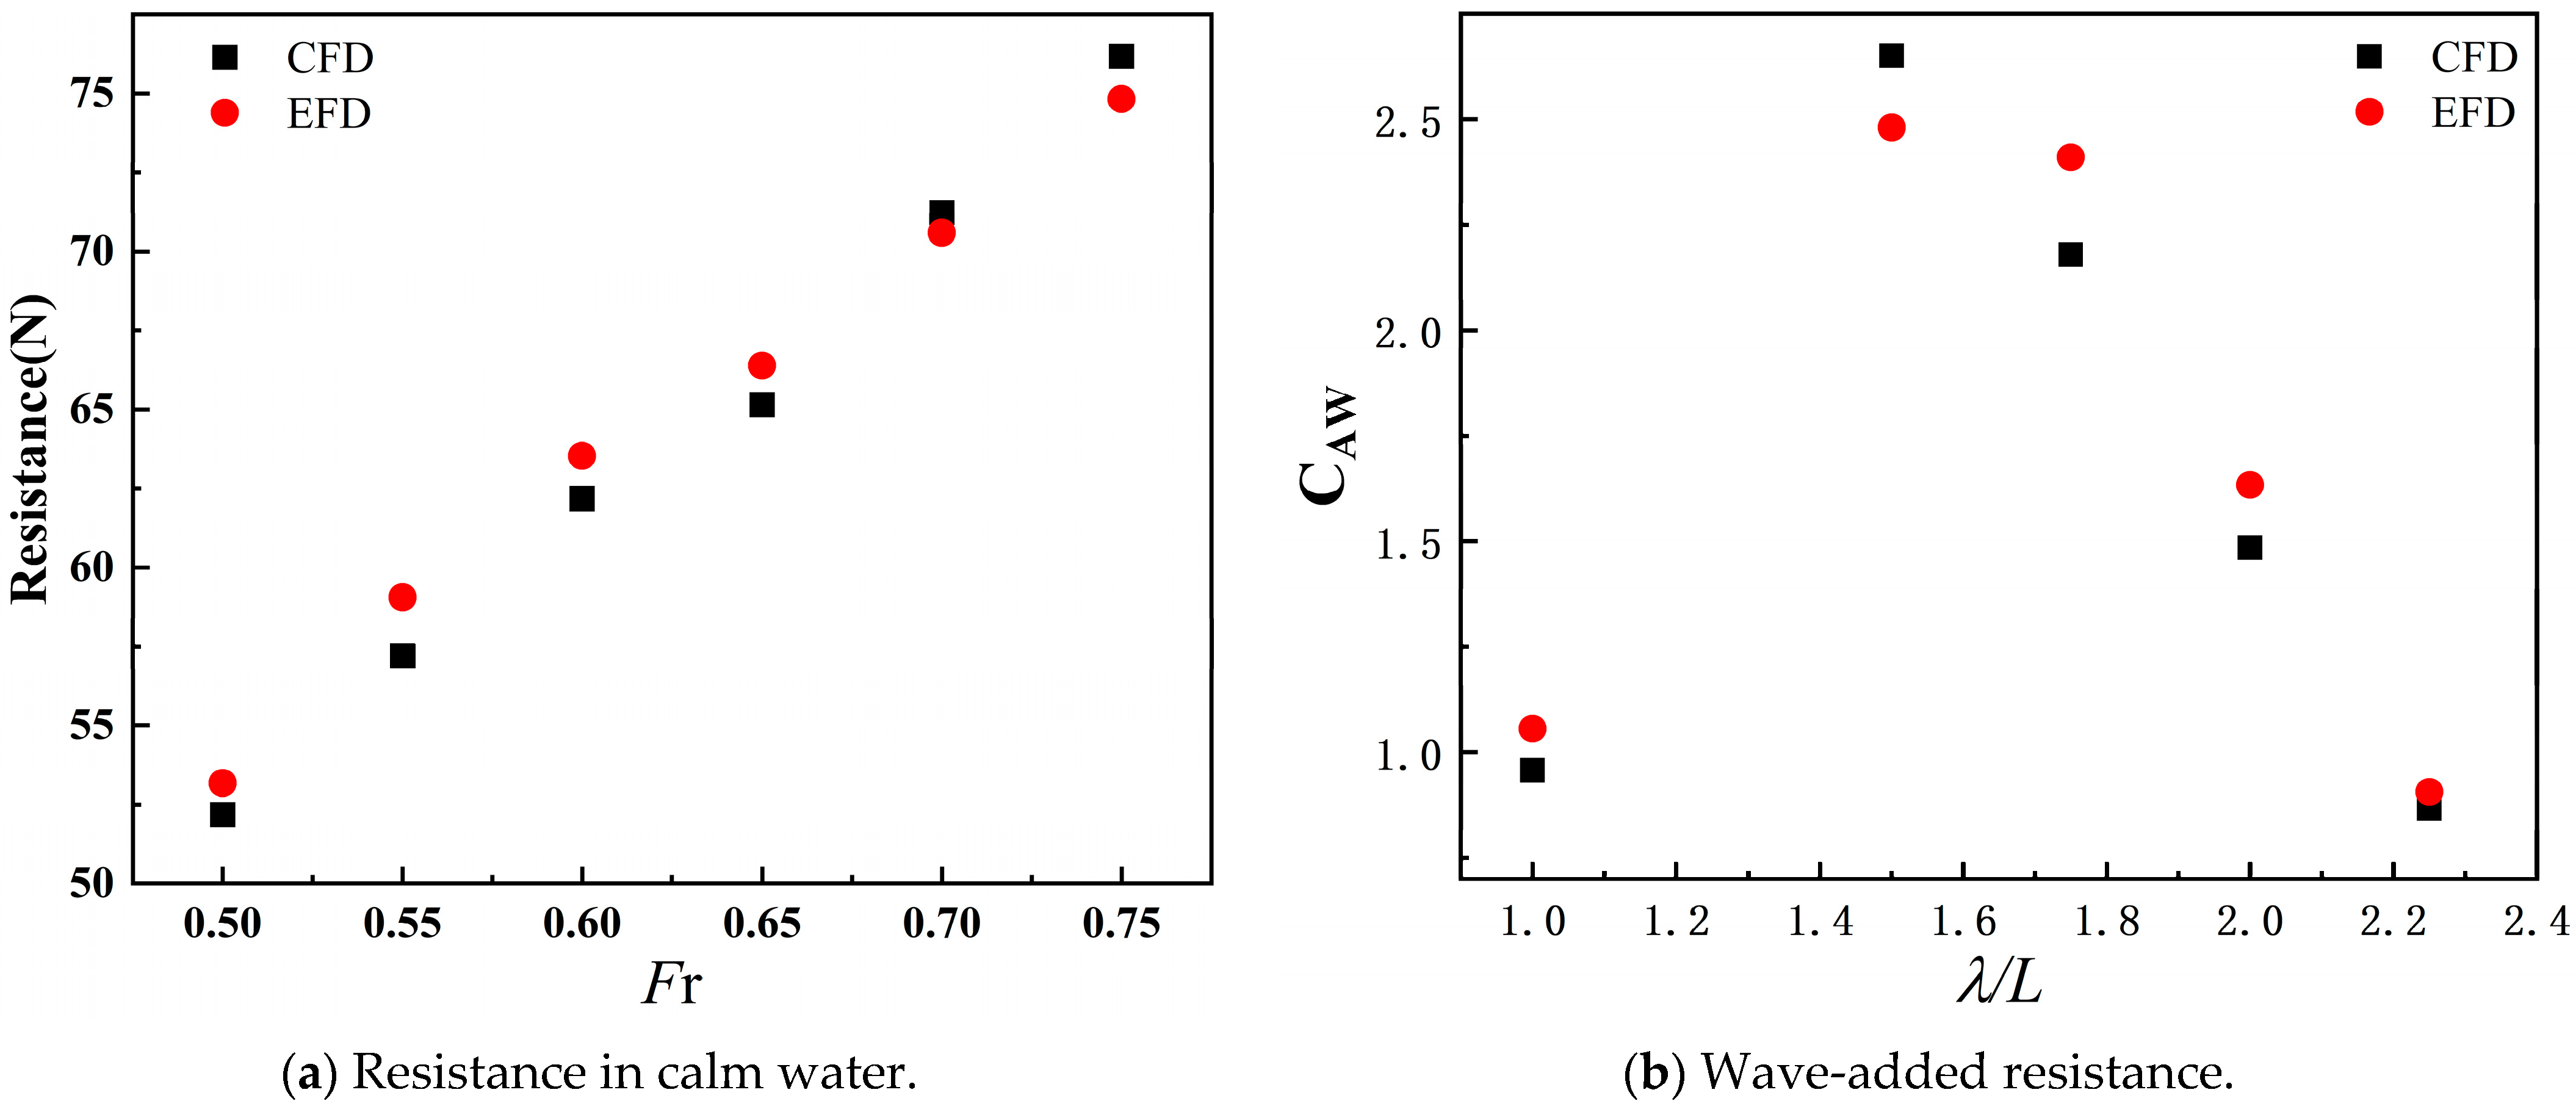
The numerical results and experimental measurements, as illustrated in
Figure 9, demonstrate the validity of the numerical methodology employed in this study. For the calm water resistance, the percentage errors at Fr = 0.5–0.75 are 1.87%, 3.16%, 2.12%, 1.86%, 0.92%, and 1.81%, respectively. Regarding the wave-added resistance coefficient (1.0–2.25), the corresponding errors are 9.38%, 6.85%, 9.54%, 9.12%, and 4.3%, all below 10%. The crossover at λ/L = 1.5 maybe arises from the wave-breaking effects not fully captured by the RANS k-ε model. Viscous damping in experiments reduces the wave-added resistance, causing EFD overprediction, and overestimates turbulence dissipation in steep waves, causing CFD limitations. The close agreement between the computational results and experimental data demonstrates the reliability of the CFD solver employed in this study, confirming its capability to accurately predict ship resistance in both calm water and waves.
For the calm water resistance analysis of the novel catamaran salvage vessel, six operational conditions spanning from low to high speeds are investigated. A single demi-hull with symmetry boundary conditions is simulated, requiring the multiplication of the computed resistance by a factor of two to obtain the total resistance of the twin-hull configuration.
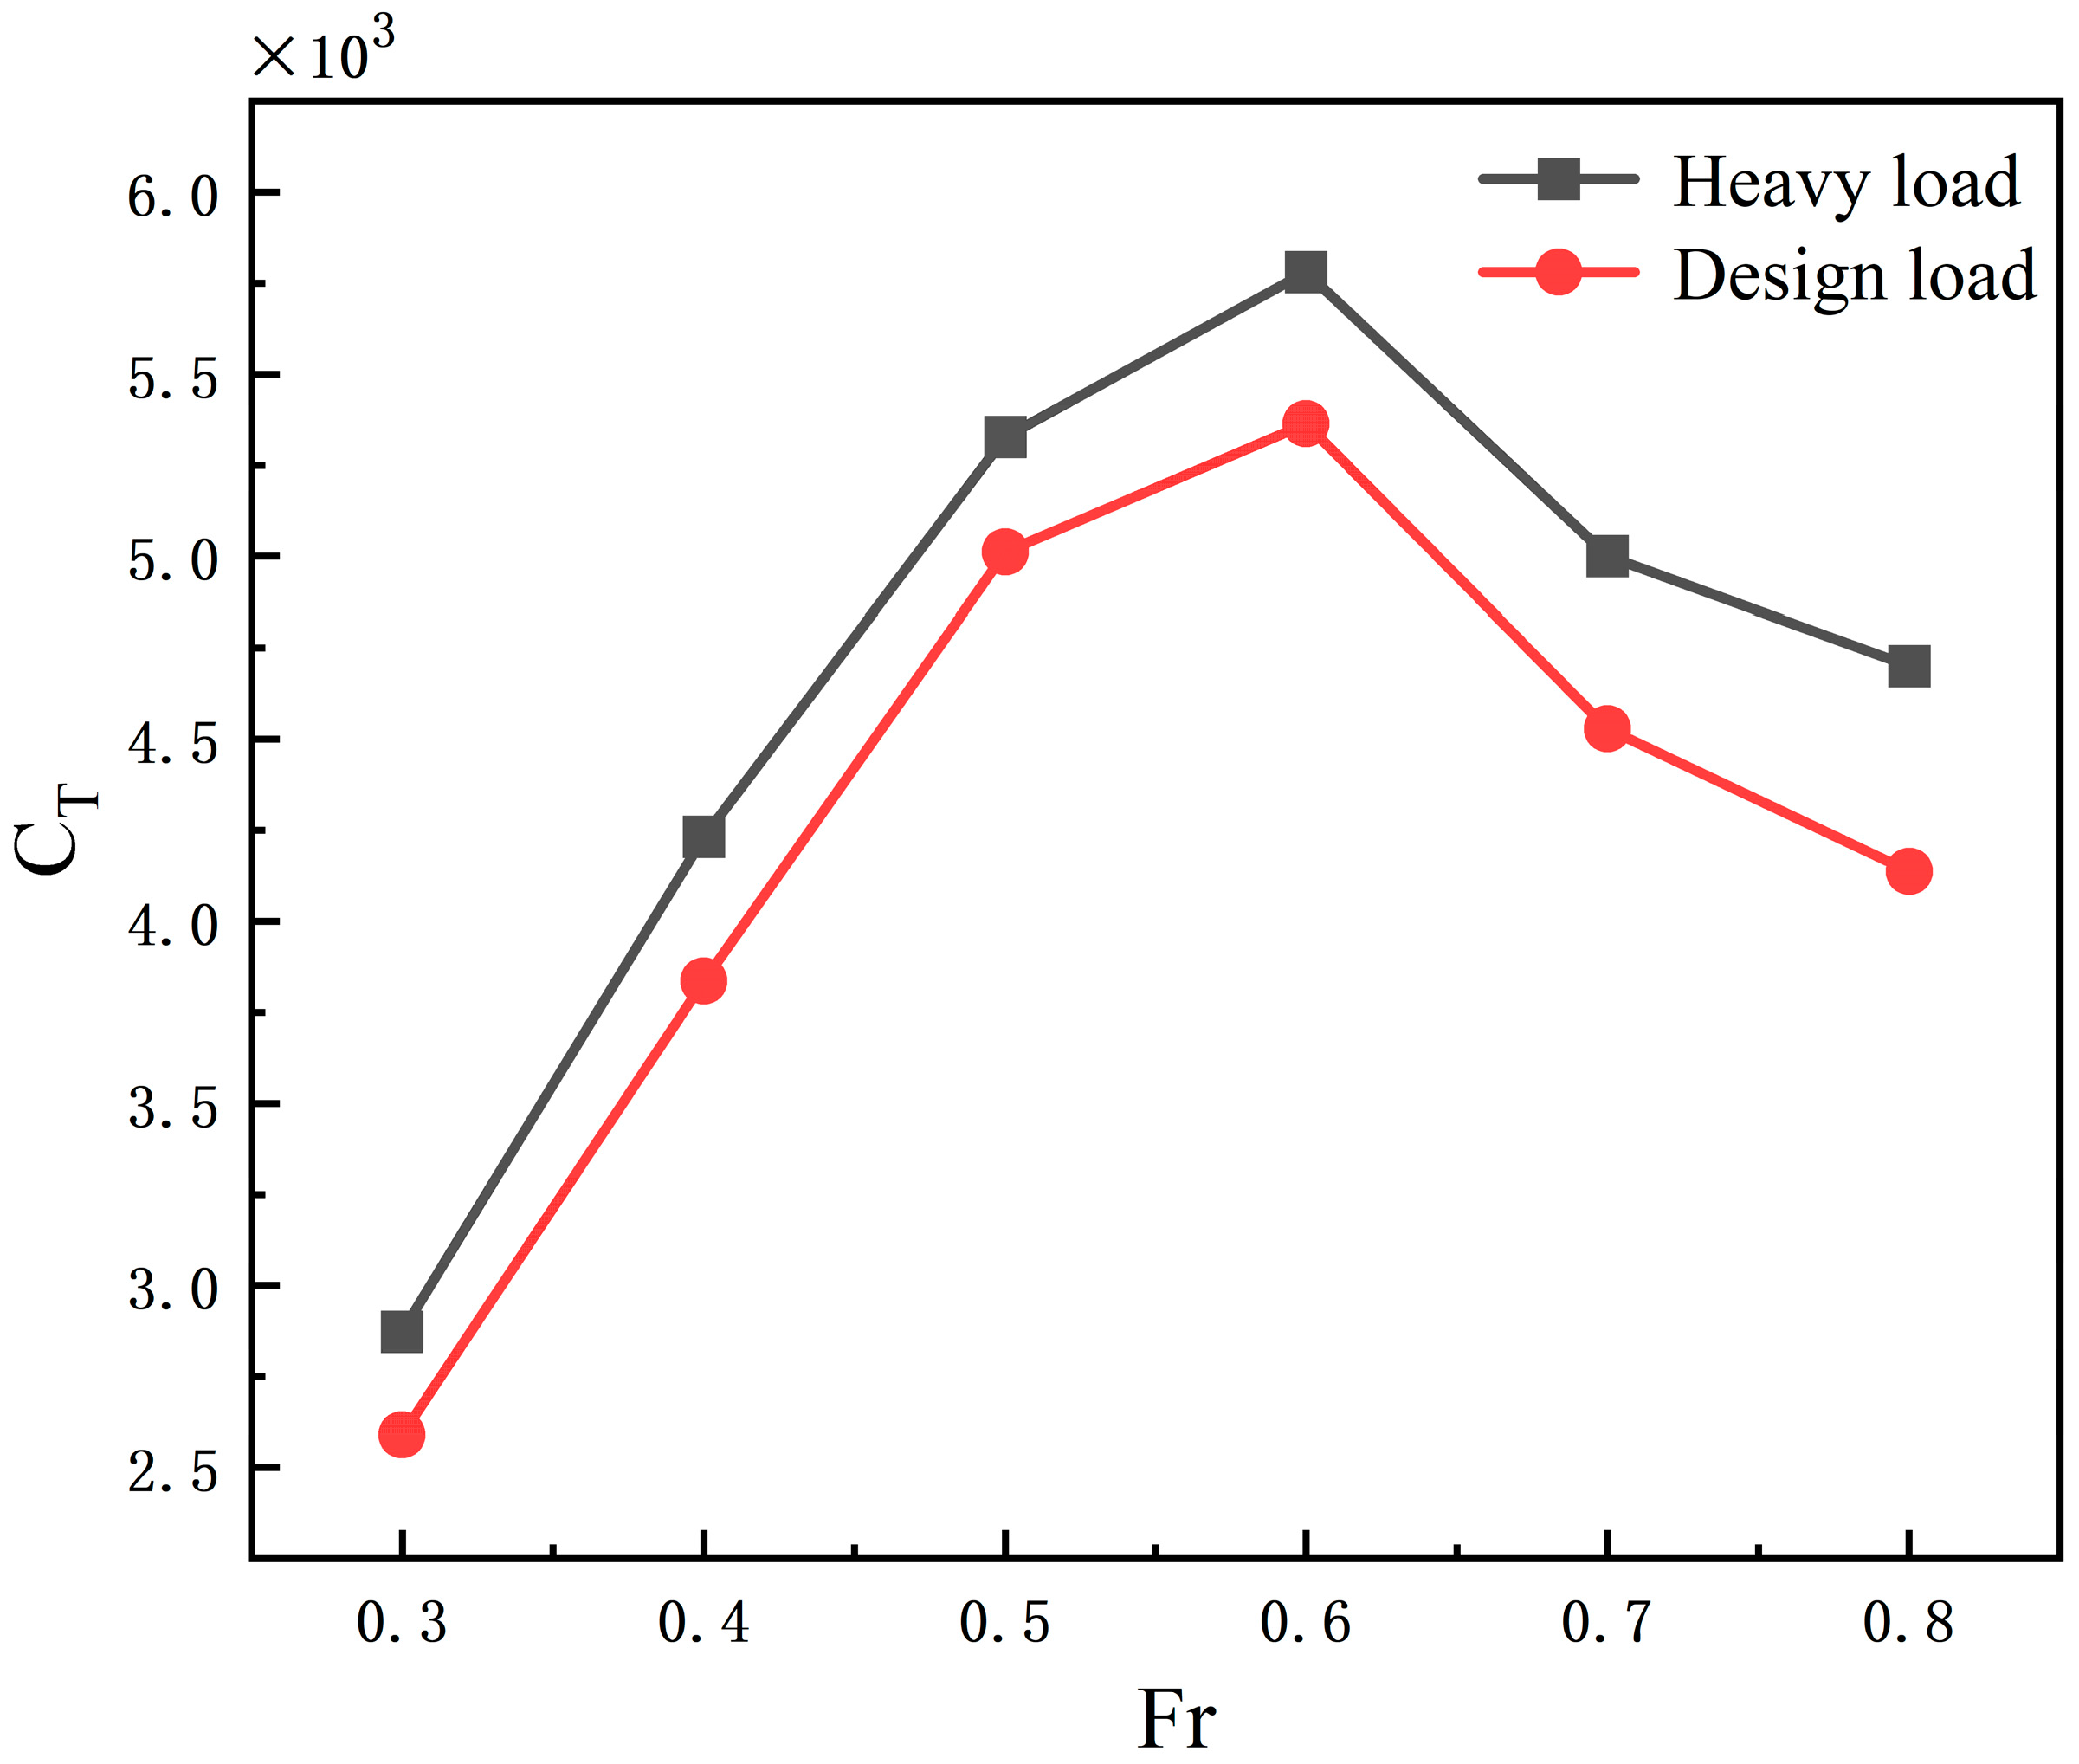
The design speed of the proposed catamaran salvage vessel is 15 knots (Fr ≈ 0.5), which serves as the baseline for propulsion performance evaluation. Calm water resistance coefficients under both light-load and design-load conditions are calculated across varying speeds, as shown in
Figure 10. The results reveal that resistance increases progressively with speed under both loading conditions, peaking at Fr = 0.6 before declining. The design-load condition consistently exhibits higher resistance than the light-load condition across all speeds, with the discrepancy amplifying as speed increases.
Comparative wave pattern profiles at the design speed for both loading conditions in calm water are presented in
Figure 11. The analysis indicates that wave crests and troughs in the design-load condition exceed those in the light-load condition. Under light-load conditions, the average liquid surface elevation measures approximately −0.01 m, closely aligning with the still water level. This indicates a shallower hull draft, exerting minimal influence on the elevation of the surrounding water level. In contrast, heavy-load conditions exhibit an average liquid surface elevation of approximately 0.43 m, significantly surpassing the light-load scenario. This demonstrates deeper hull immersion, resulting in a marked overall water level rise in the vicinity. The intensified hull–fluid interactions under heavy loading further amplify the hydrodynamic disturbances, with the hull exerting stronger fluid disturbance effects on the surrounding flow field.
Based on the irregular wave conditions under different sea states described in
Section 2.2, the wave-added resistance coefficients for Cases 1–5 are calculated using the JONSWAP wave spectrum. Numerical simulations are conducted at the design speed (15 knots) in head wave conditions, with the computational results of wave-added resistance coefficients across varying sea states presented in
Figure 12. For sea states 1 to 5, the wave-added resistance coefficients under heavy-load conditions exhibit increments of 0.334, 0.476, 0.51, 0.62, and 0.641 compared to light-load conditions, with corresponding growth rates of 30.71%, 28.85%, 23.39%, 22.88%, and 21.82%, respectively. This demonstrates a monotonic decline in the growth rates from 30.71% (sea state 1) to 21.82% (sea state 5), indicating that the influence of heavy-load conditions on wave-added resistance marginally diminishes with increasing sea state severity. In lower sea states (1–2), where wave disturbances are relatively mild, the increased draft under heavy-load conditions induces significant flow field modifications, resulting in higher sensitivity in resistance amplification. In higher sea states (4–5), an elevated wave energy intensity dominates ship–wave interactions, where nonlinear hydrodynamic interactions govern hull motions. Consequently, the percentage contribution of heavy-load effects to resistance increments becomes less pronounced compared to the baseline resistance induced by intense wave actions. The results demonstrate that the wave-added resistance coefficients for both loading conditions exhibit a positive correlation with sea state severity, increasing proportionally with significant wave height (Hs) and spectral peak period (Tp). The comparative free surface profiles between the two loading conditions at the design speed under irregular wave conditions are illustrated in
Figure 13. The analysis reveals that the wave crests and troughs of irregular waves are more pronounced in the design-load condition than in the light-load condition. Under light-load conditions, the wave amplitudes are smaller with gentler liquid surface fluctuations, while heavy-load conditions exhibit larger wave amplitudes and more pronounced liquid surface variations. This indicates that the ship hull exerts a greater influence on wave patterns during heavy-load operations, resulting in stronger hydrodynamic responses. Wave propagation appears more dispersed in light-load scenarios, allowing for relatively unrestricted wave transmission, whereas under heavy-load conditions, wave patterns become more concentrated with increased obstruction and disturbance near the hull region, leading to alterations in both the wave propagation direction and morphological characteristics.
4.2. Seakeeping Performance
To optimize computational efficiency, seakeeping analysis in this section is performed using the potential flow-theory-based AQWA software (Release 15.0, ANSYS, Inc.). Initially, hydrodynamic meshes are generated for the catamaran hulls. During the numerical setup, each wavelength must span at least seven maximum element sizes. Insufficient grid density may lead to non-convergent results, while excessive refinement would cause computational inefficiency. Therefore, the mesh size is determined based on the maximum frequency of interest during grid generation. The resulting mesh configuration is illustrated in
Figure 14.
The hydrodynamic responses are analyzed through simulations of unit amplitude regular waves with varying frequencies and incident directions, providing preliminary insights into the vessel’s hydrodynamic performance [
10]. Given the catamaran’s structural symmetry, the wave directions are limited to 0–180° with 45° increments: 0° (head waves), 90° (beam waves), and 180° (following waves). The wave frequency range is set from 0.01592 Hz to 1.04151 Hz according to the mesh resolution requirements. The detailed parameters are listed in
Table 5.
Prior to analysis, the validation of the computational results is essential. The experimental data for validation are obtained from the Delft model tests [
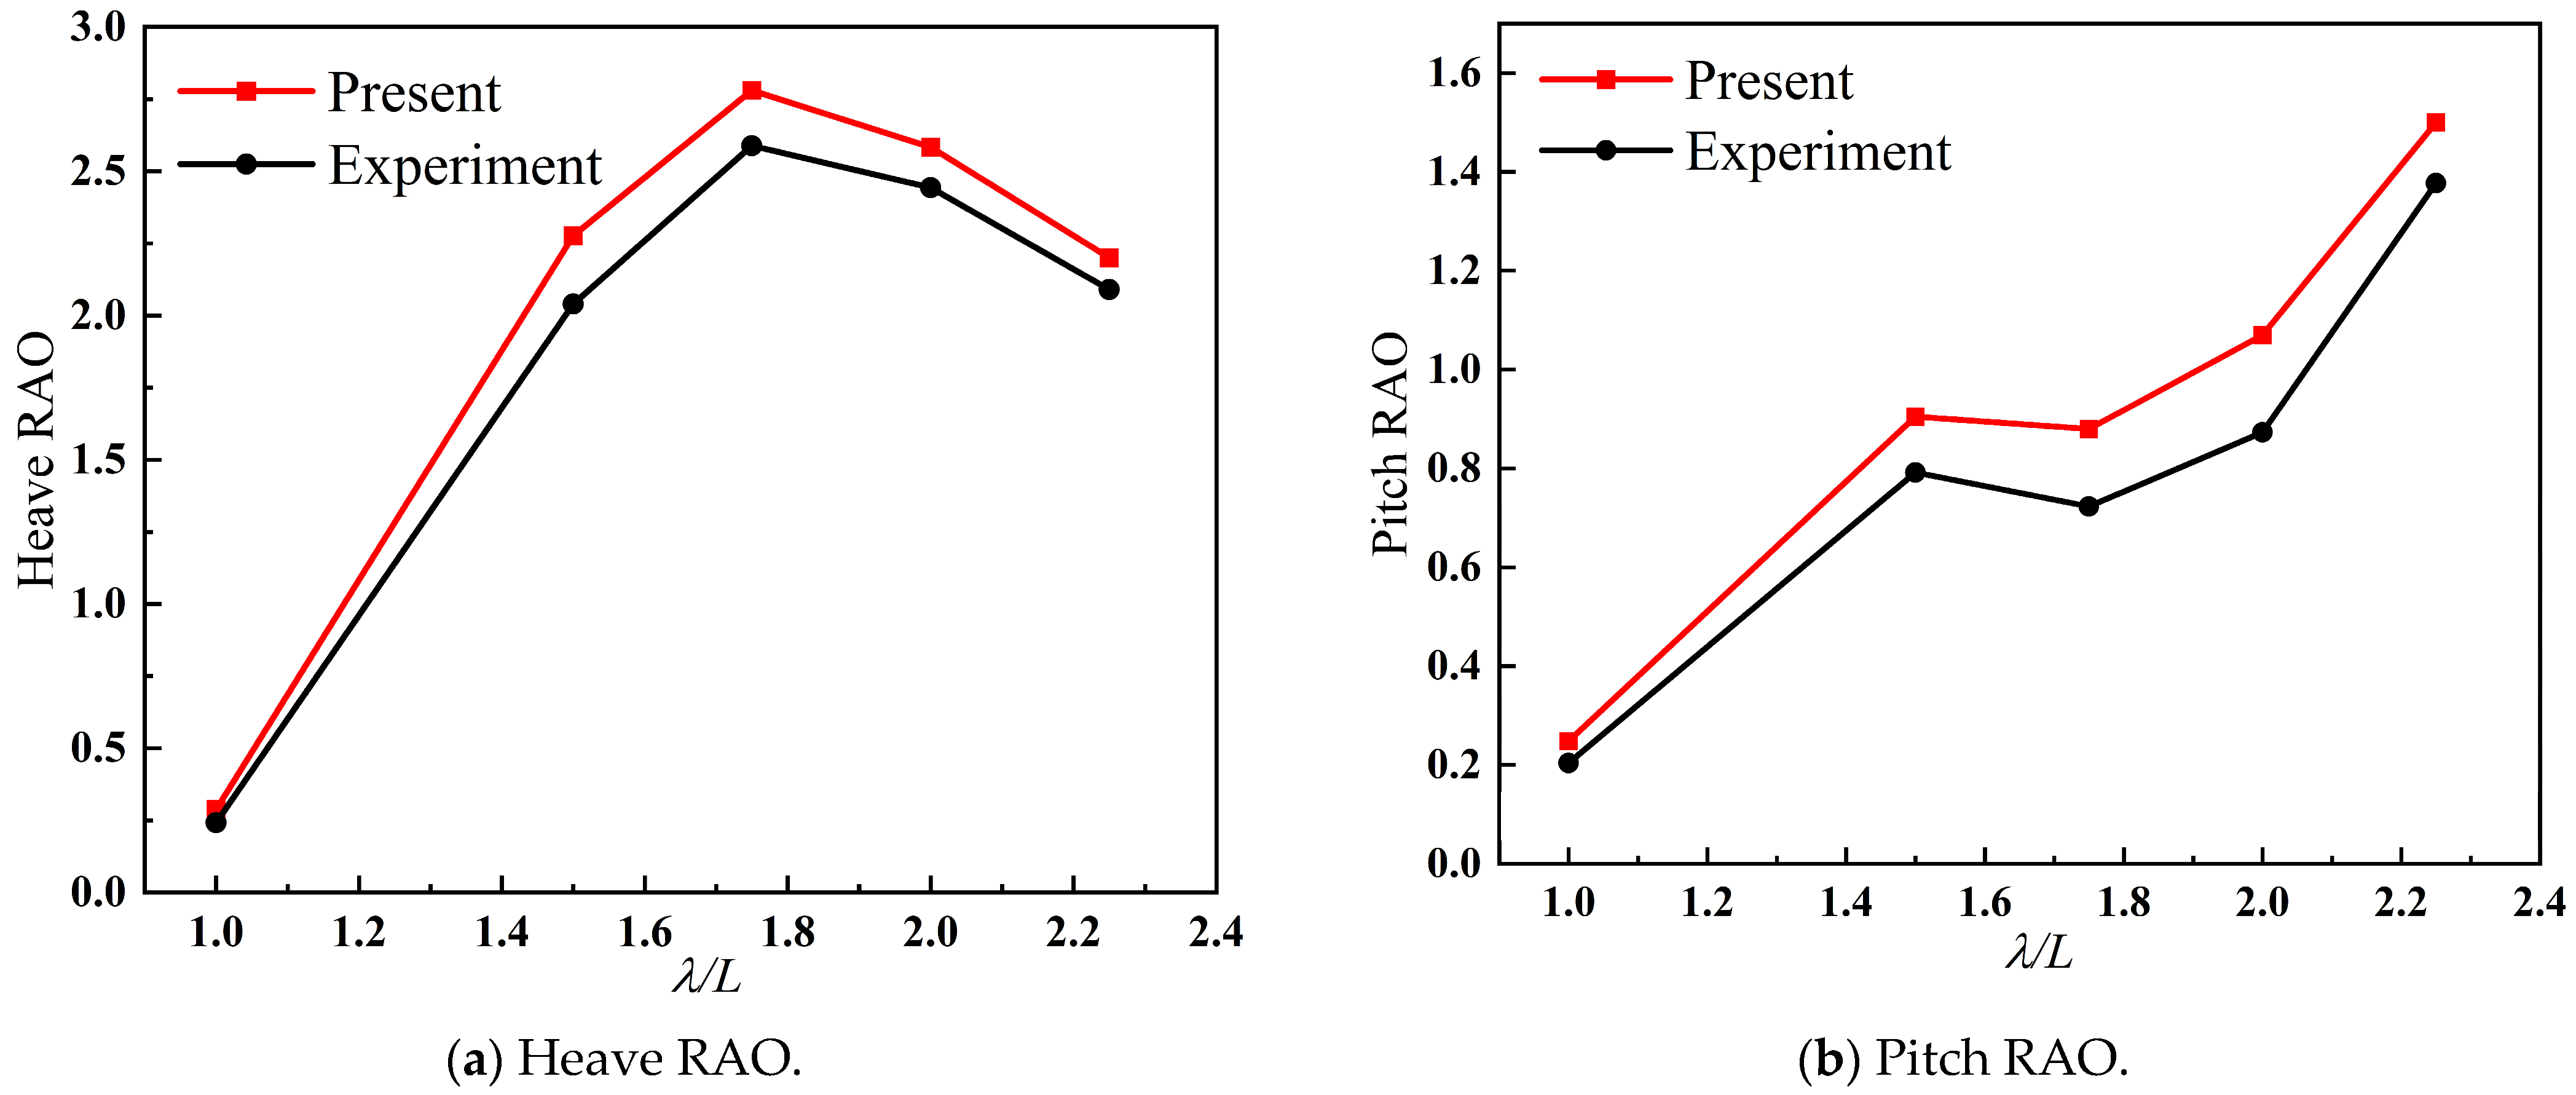
37], which have been extensively studied with comprehensive datasets including calm water resistance at various speeds and motion responses in waves. This internationally recognized benchmark is therefore selected to verify the rationality of the numerical methodology. Based on the experimental data, numerical simulations of multiple head wave conditions at Fr = 0.7 are conducted, and a comparative analysis with scaled model test results is performed. The validation outcomes, as shown in
Figure 15, confirm the effectiveness of the proposed numerical approach.
A close agreement in trend is observed between the computational and experimental results, though the former generally overestimates the latter due to the neglect of fluid viscosity in the potential flow theory. This discrepancy validates the reliability of the potential flow solver, demonstrating its applicability for predicting catamaran motions in waves.
Using the unit amplitude regular waves with varying frequencies and incident angles defined in the previous section, hydrodynamic responses are calculated for both the light-load and design-load conditions. The relationships between frequency, wave direction, and Response Amplitude Operators (RAOs) are comprehensively illustrated in
Figure 16,
Figure 17 and
Figure 18. The results indicate that motion amplitudes generally decrease with increasing wave frequencies, with the design-load condition exhibiting larger RAO magnitudes than the light-load condition. Pronounced low-frequency characteristics are observed at reduced wave frequencies, while motion responses asymptotically approach zero at higher frequencies.
As shown in the heave RAO curves (
Figure 16), the maximum heave motions occur under beam wave conditions (90°), while oblique waves show minimal influence. Similar heave variation patterns are observed across all wave directions except 90°. For the light-load condition, RAOs exhibit a steep waterfall-like decline in the low-frequency regions, reaching the first trough at 0.3 Hz. A moderate recovery occurs in the mid-frequency regions with limited amplitude growth. The twin-hull configuration induces dual RAO peaks at a 90° wave incidence, where the maximum peak corresponds to the global extremum. This suggests intense motion responses between 0.3 and 0.6 Hz under beam waves. Despite sharing similar RAO trends, the design-load condition produces larger motion magnitudes. Dual peaks are also observed in mid-frequency regions at 90° incidence, but the secondary peak is smaller than in the light-load condition, indicating stabilized motions around 0.5 Hz for the design-load case.
Wave direction significantly affects the rotational motion responses. The pitch RAO curves (
Figure 17) reveal maximum pitch motions under head (0°) and following (180°) waves. Longitudinal wave forces show limited impact on pitch amplitude variations, with negligible changes observed at 90° incidence. For light-load conditions, RAOs demonstrate an initial rise followed by a decline in the low-frequency regions. Complex multi-peak phenomena emerge in the mid-frequency ranges, where oblique waves generate higher peak responses than head/following waves. In contrast, the design-load condition eliminates mid-frequency multi-peak behavior at 0° and 180° incidences, while maintaining other trend similarities.
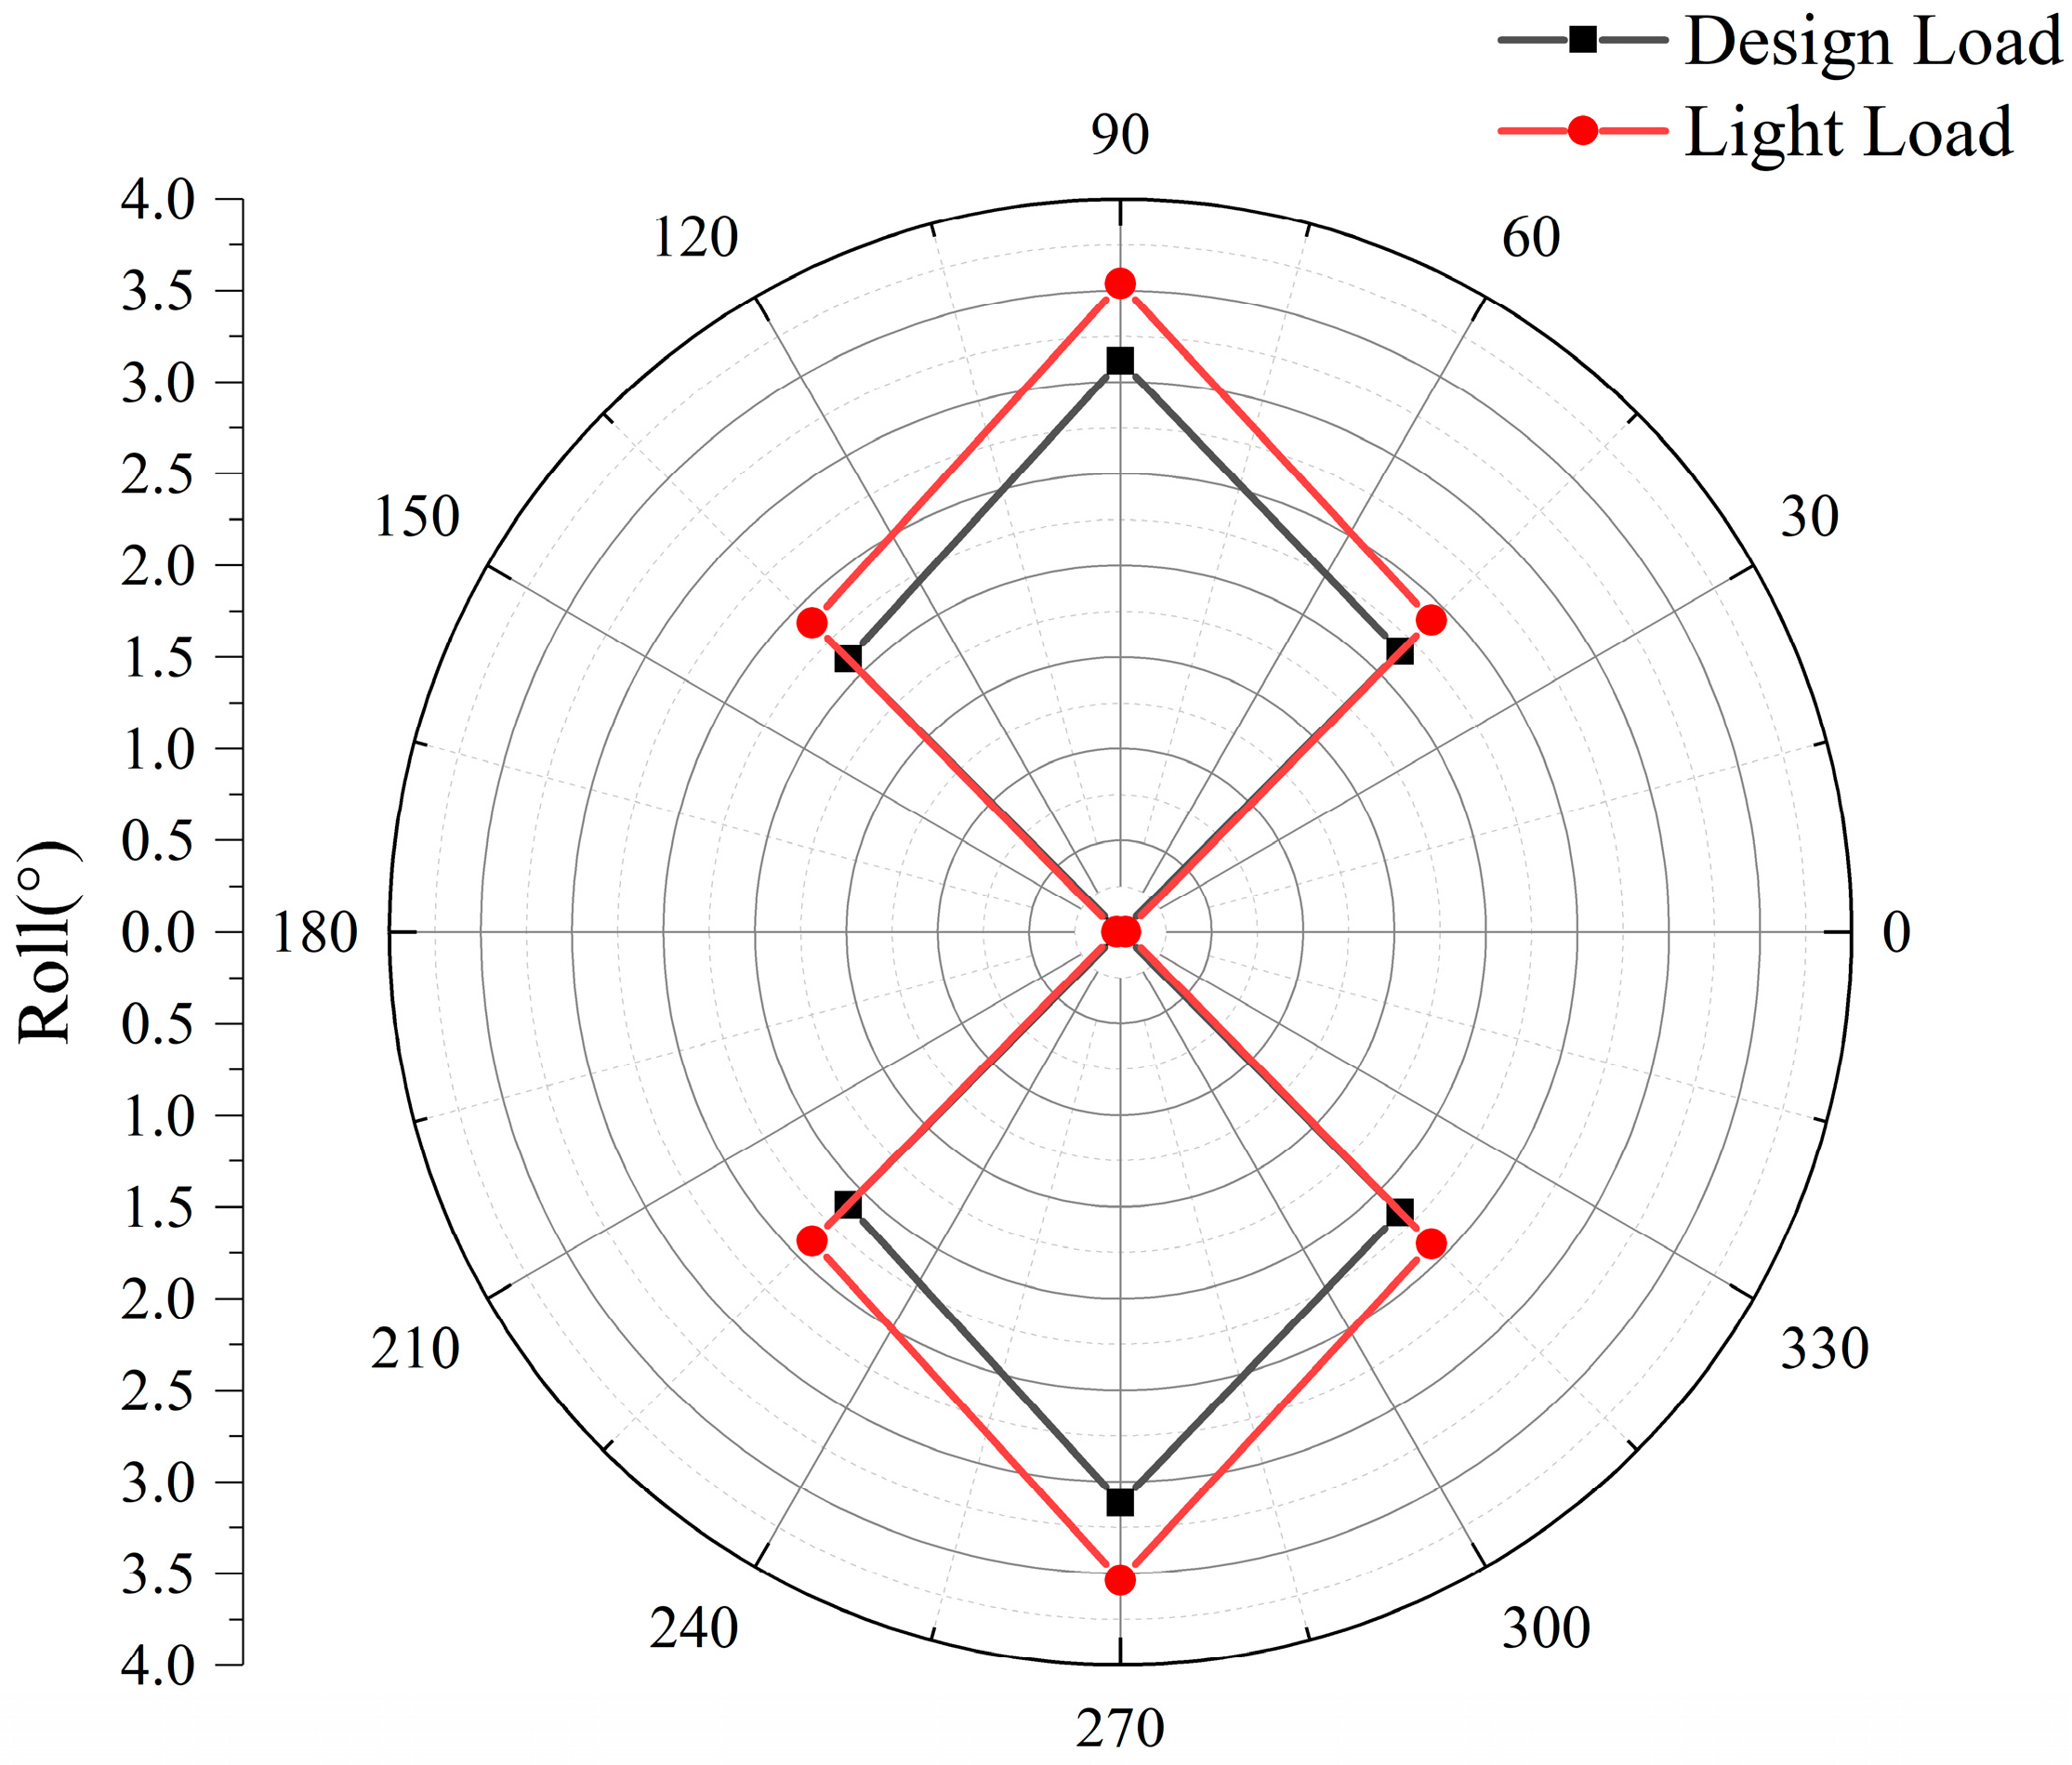
The roll RAO curves (
Figure 18) show maximum roll motions under beam waves (90°), with significantly amplified peaks compared to other wave directions. Longitudinal wave forces minimally influence the roll amplitude variations, as evidenced by near-zero RAO values at 0° and 180° incidences. At a 90° wave incidence, the light-load condition exhibits dual RAO peaks, with the mid-frequency peak reaching the maximum magnitude. The design-load condition displays a single peak at 90° incidence, but develops dual peaks in the mid-frequency regions under oblique waves.
Based on the irregular wave conditions under varying sea states defined in
Section 2.2, numerical simulations of Cases 1–5 are conducted using the JONSWAP spectrum. The simulations are carried out at the design speed with wave incidence angles ranging from 0° to 180° at 45° intervals, yielding five directional conditions. Head waves (0°) are selected as the evaluation basis for heave and pitch motions, while beam waves (90°) serve as the reference for roll motions.
Figure 19,
Figure 20 and
Figure 21 present motion response envelope diagrams of heave, roll, and pitch under Case4 sea conditions, where the radial coordinates represent significant motion response values.
The response amplitudes of heave, pitch, and roll decrease with the increasing payload across all wave directions. For the heave motion, both loading conditions exhibit consistent response patterns with positive values, though the payload variation significantly affects the heave motion characteristics. The wave incidence angles show limited influence on the heave responses, with maximum amplitudes occurring under 90° beam waves, aligning with the findings from regular wave analyses. Pitch motion responses demonstrate consistent trends between loading conditions, with payload showing a negligible impact. Maximum pitch amplitudes occur at 0° (head waves), diminish to near-zero values at 90° (beam waves), and exhibit intermediate magnitudes at 45° (oblique waves). Roll motion patterns remain consistent across loading conditions, with payload exerting minimal influence. Roll amplitudes approach zero at 0° (head waves), peak at 90° (beam waves), and progressively increase at 45° (oblique waves), reaching magnitudes comparable to the beam wave conditions.


