Article

Seasonal Effects of Nakdong River Freshwater Inflow and Coastal Environmental Changes on Phytoplankton Community Structure, Including Harmful Species, in Eastern Jinhae Bay, Korea

1
Ecological Risk Research Department, KIOST (Korea Institute of Ocean Science and Technology), Geoje 53201, Republic of Korea
2
Department of Earth, Environmental & Space Sciences, Chungnam National University, Daejeon 34134, Republic of Korea
3
Ocean Climate Response & Ecosystem Research Department, KIOST (Korea Institute of Ocean Science and Technology), Busan 49111, Republic of Korea
*
Authors to whom correspondence should be addressed.
J. Mar. Sci. Eng. 2025, 13(4), 669; https://doi.org/10.3390/jmse13040669
Submission received: 24 February 2025 / Revised: 15 March 2025 / Accepted: 18 March 2025 / Published: 26 March 2025

Abstract

:
Rainfall-induced freshwater influx is a major nutrient source in estuarine and coastal waters, often driving changes in phytoplankton community structure and blooms. In Jinhae Bay of Korea, a critical area for shellfish aquaculture, the interaction between the Nakdong River discharge and the Tsushima Warm Current creates a frontal zone conducive to phytoplankton proliferation. This study investigated the seasonal variation in phytoplankton communities, including harmful and toxin-producing species, in relation to environmental factors from February 2022 to November 2023 in Jinhae Bay. Except for the summer increase in certain dinoflagellates, diatoms, including Chaetoceros spp., Pseudo-nitzschia spp., and Skeletonema spp., dominated the phytoplankton community across seasons. In addition, nutrient influx from the Nakdong River, particularly nitrate + nitrite and silicate (p < 0.001), was a key driver of phytoplankton community structure. Spatially, phytoplankton communities differed between the inner (St. 1 and 4) and outer (St. 2 and 3) areas in the bay, likely due to the influences of seasonal river discharge, the Tsushima Warm Current, and tidal currents. Among harmful algal blooms causative species, dinoflagellate Margalefidnium polykrikoides was correlated with water temperature, exhibiting higher densities in summer. In contrast, Akashiwo sanguinea was mainly observed in winter. In addition, we found that toxin-producing dinoflagellates, such as Alexandrium catenella, Dinophysis acuminata, and Gonyaulax spinifera, were most prevalent in spring and summer, and their appearance was linked to complex interactions among freshwater influx, water temperature, and current dynamics. Our findings underscore the critical role of bay-specific oceanographic conditions, shaped by tidal and current patterns, in conjunction with riverine nutrient inputs, in driving seasonal phytoplankton blooms. This study provides valuable baseline data for understanding harmful/toxic microalgal dynamics in Jinhae Bay and offers key insights for effective coastal ecosystem management and conservation along the Korean Peninsula.

1. Introduction

In temperate regions, the seasonal changes in harmful and toxic microalgae are intricately influenced by various environmental factors, such as nutrient inputs in the water column, as well as biological interactions, including interspecies competition [1,2,3]. In spring, the residual nutrients in the euphotic layer from winter mixing, along with improved light conditions and rising water temperatures, promote the initial bloom of diatoms [4]. In summer, freshwater inflows from rivers and streams, combined with coastal nutrient input, temporarily stimulate the growth of specific phytoplankton, such as diatoms, in response to favorable conditions [4,5]. However, as nutrient depletion and water column stabilization progress, diatom populations decline, creating an environment where harmful dinoflagellates can thrive. The motility of some dinoflagellates allows them to overcome nutrient limitations by migrating to deeper waters [6,7]. Under certain conditions, they can form large-scale blooms, significantly impacting marine ecosystems and aquaculture activities. In autumn, intensified mixing and nutrient replenishment can reignite competition between harmful microalgae and Crytophyta [3,5]. Subsequently, in winter, lower water temperatures and light availability generally suppress the growth of harmful microalgae, leading to a relatively higher occurrence of non-harmful microalga such as diatoms [8,9].
During the monsoon rainy season in coastal regions, a rapid increase in rainfall leads to a large influx of nutrients from rivers, significantly affecting the coastal environment. During this period, river runoff is rich in key nutrients such as nitrogen, phosphorus, and silica, and their influx into coastal waters causes rapid changes in the upper euphotic layer [10]. During the dry season, the absence of rainfall, combined with lower atmospheric temperatures and strong winds, leads to water column mixing, resulting in the enrichment of nutrients in the whole water column [11]. These environmental changes can have complex effects on the population dynamics and distribution patterns of phytoplankton in coastal areas. In particular, the sudden influx of nutrients can lead to large-scale blooms of specific species [4,5]. Over time, however, a succession process often occurs, with shifts to different species.
In addition to the impact of river water, the coastal waters of southern Korea are more strongly influenced by the Jeju Warm Current and Tsushima Warm Current (TWC) during the autumn and winter seasons, both of which originate from the Kuroshio Warm Current (Figure 1). The eastern coastal waters of Jinhae Bay, located near the Nakdong River Estuary, which is the longest river in Korea and has the second-largest estuary, are along the southeastern Korean Peninsula. During the rainy season, the area is heavily influenced by the Nakdong River, while in the dry season, it is strongly affected by the Tsushima Warm Current, resulting in high productivity and diverse marine organisms. Heavy rainfall during the monsoon season (June–August) and concentrated rainfall from typhoons (August–September) lead to freshwater inflows from the Nakdong River, causing low salinity and supplying large amounts of nutrients along the coasts of Gadeok and Geoje Islands. As a result, phytoplankton blooms frequently occur in the eastern part of Jinhae Bay, which includes our sampling sites [12].
The aim of this study was to investigate the seasonal distribution patterns of phytoplankton groups from January 2022 to November 2023 and to examine various environmental factors associated with large-scale blooms of specific microalgae. Specifically, we focused on seasonal variations in nutrient supply during rainy and non-rainy periods and analyzed the seasonal patterns of harmful algae that cause mass mortality, as well as toxic microalgae, along with changes in community structure in the eastern part of Jinhae Bay.

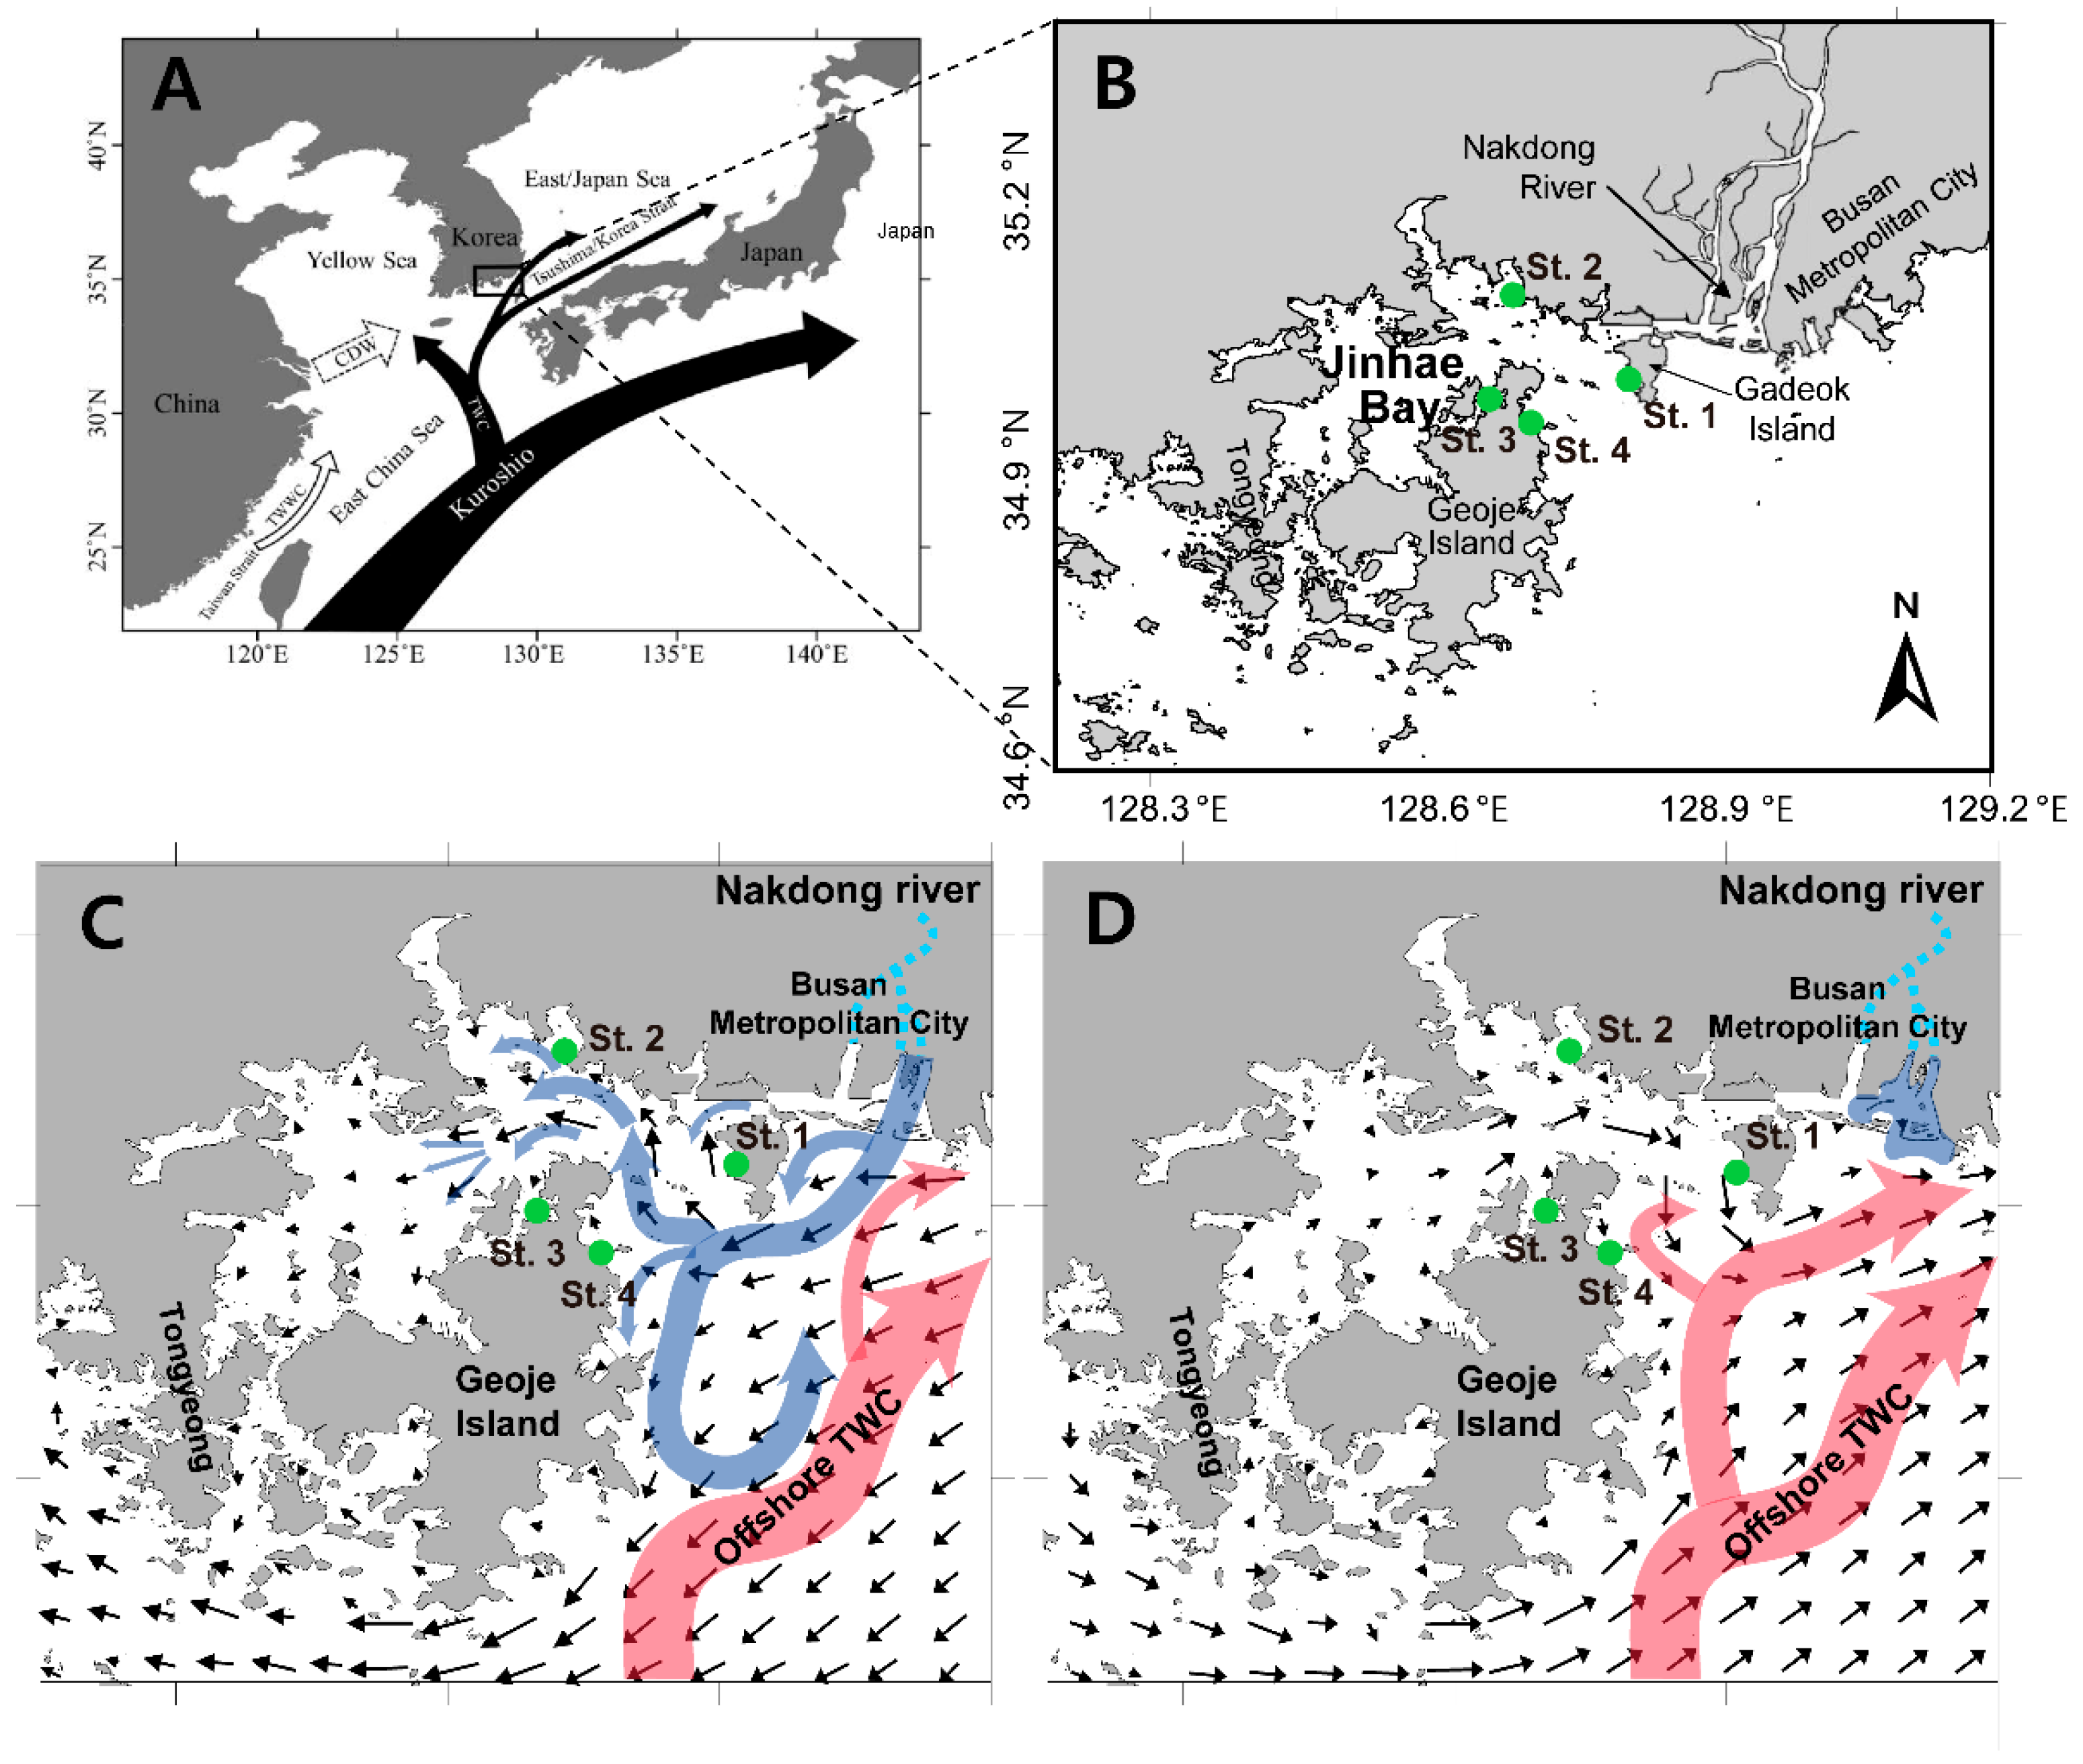
2. Materials and Methods

2.1. Field Sampling and Analysis

Field sampling was conducted at four stations (St. 1–St. 4) in the eastern area of Jinhae Bay, Korea, from January 2022 to November 2023 (Figure 1). All survey sites had depths of less than 10 m. Water quality parameters, including temperature, salinity, pH, and dissolved oxygen (DO), were measured at the surface using YSI EXO2 Sonde probes (Yellow Springs, OH, USA). At each station, surface water samples were collected using a bucket. For nutrient analysis, 50 mL of water samples were collected after being filtered through a cellulose-acetate membrane syringe filter with a 0.45 µm pore size (Advantec, Tokyo, Japan). The filtrates were transferred to acid-cleaned 15 mL conical tubes (SPL Life Sciences, Pocheon, Korea), with HgCl2 added to a final concentration of 0.1% to prevent biological activity. Both filters and filtrates were stored in a cooler with dry ice at −20 °C in dark conditions until laboratory analysis. Phytoplankton samples were preserved by adding Lugol’s solution to 500 mL of surface water, achieving a final concentration of 3% in the field. These samples were stored at room temperature in the dark until examination, following methods previously reported by Yoon et al. [14].

2.2. Sample Analyses

The concentrations of inorganic nutrients, including ammonia, nitrate + nitrite, phosphate, and silicate, were determined using a flow injection autoanalyzer (Quattro 39; Seal Analytical, Fareham, Hampshire, UK). The instrument was calibrated using reference materials for nutrients in seawater (KANSO Technos Co., Ltd., Osaka, Japan) to ensure measurement accuracy. For phytoplankton counting and species identification, each 0.5 L sample preserved in Lugol’s solution was concentrated to approximately 50 mL by carefully decanting the supernatant, following the procedure described by Sournia [15]. After gentle mixing, subsamples were placed in a Sedgewick-Rafter counting chamber, and cells were enumerated using a light microscope (Carl Zeiss, Göttingen, Germany) at 200× magnification. Species identification was conducted at 400× magnification based on morphological characteristics, with reference to phytoplankton identification guides provided by Omura et al. [16].

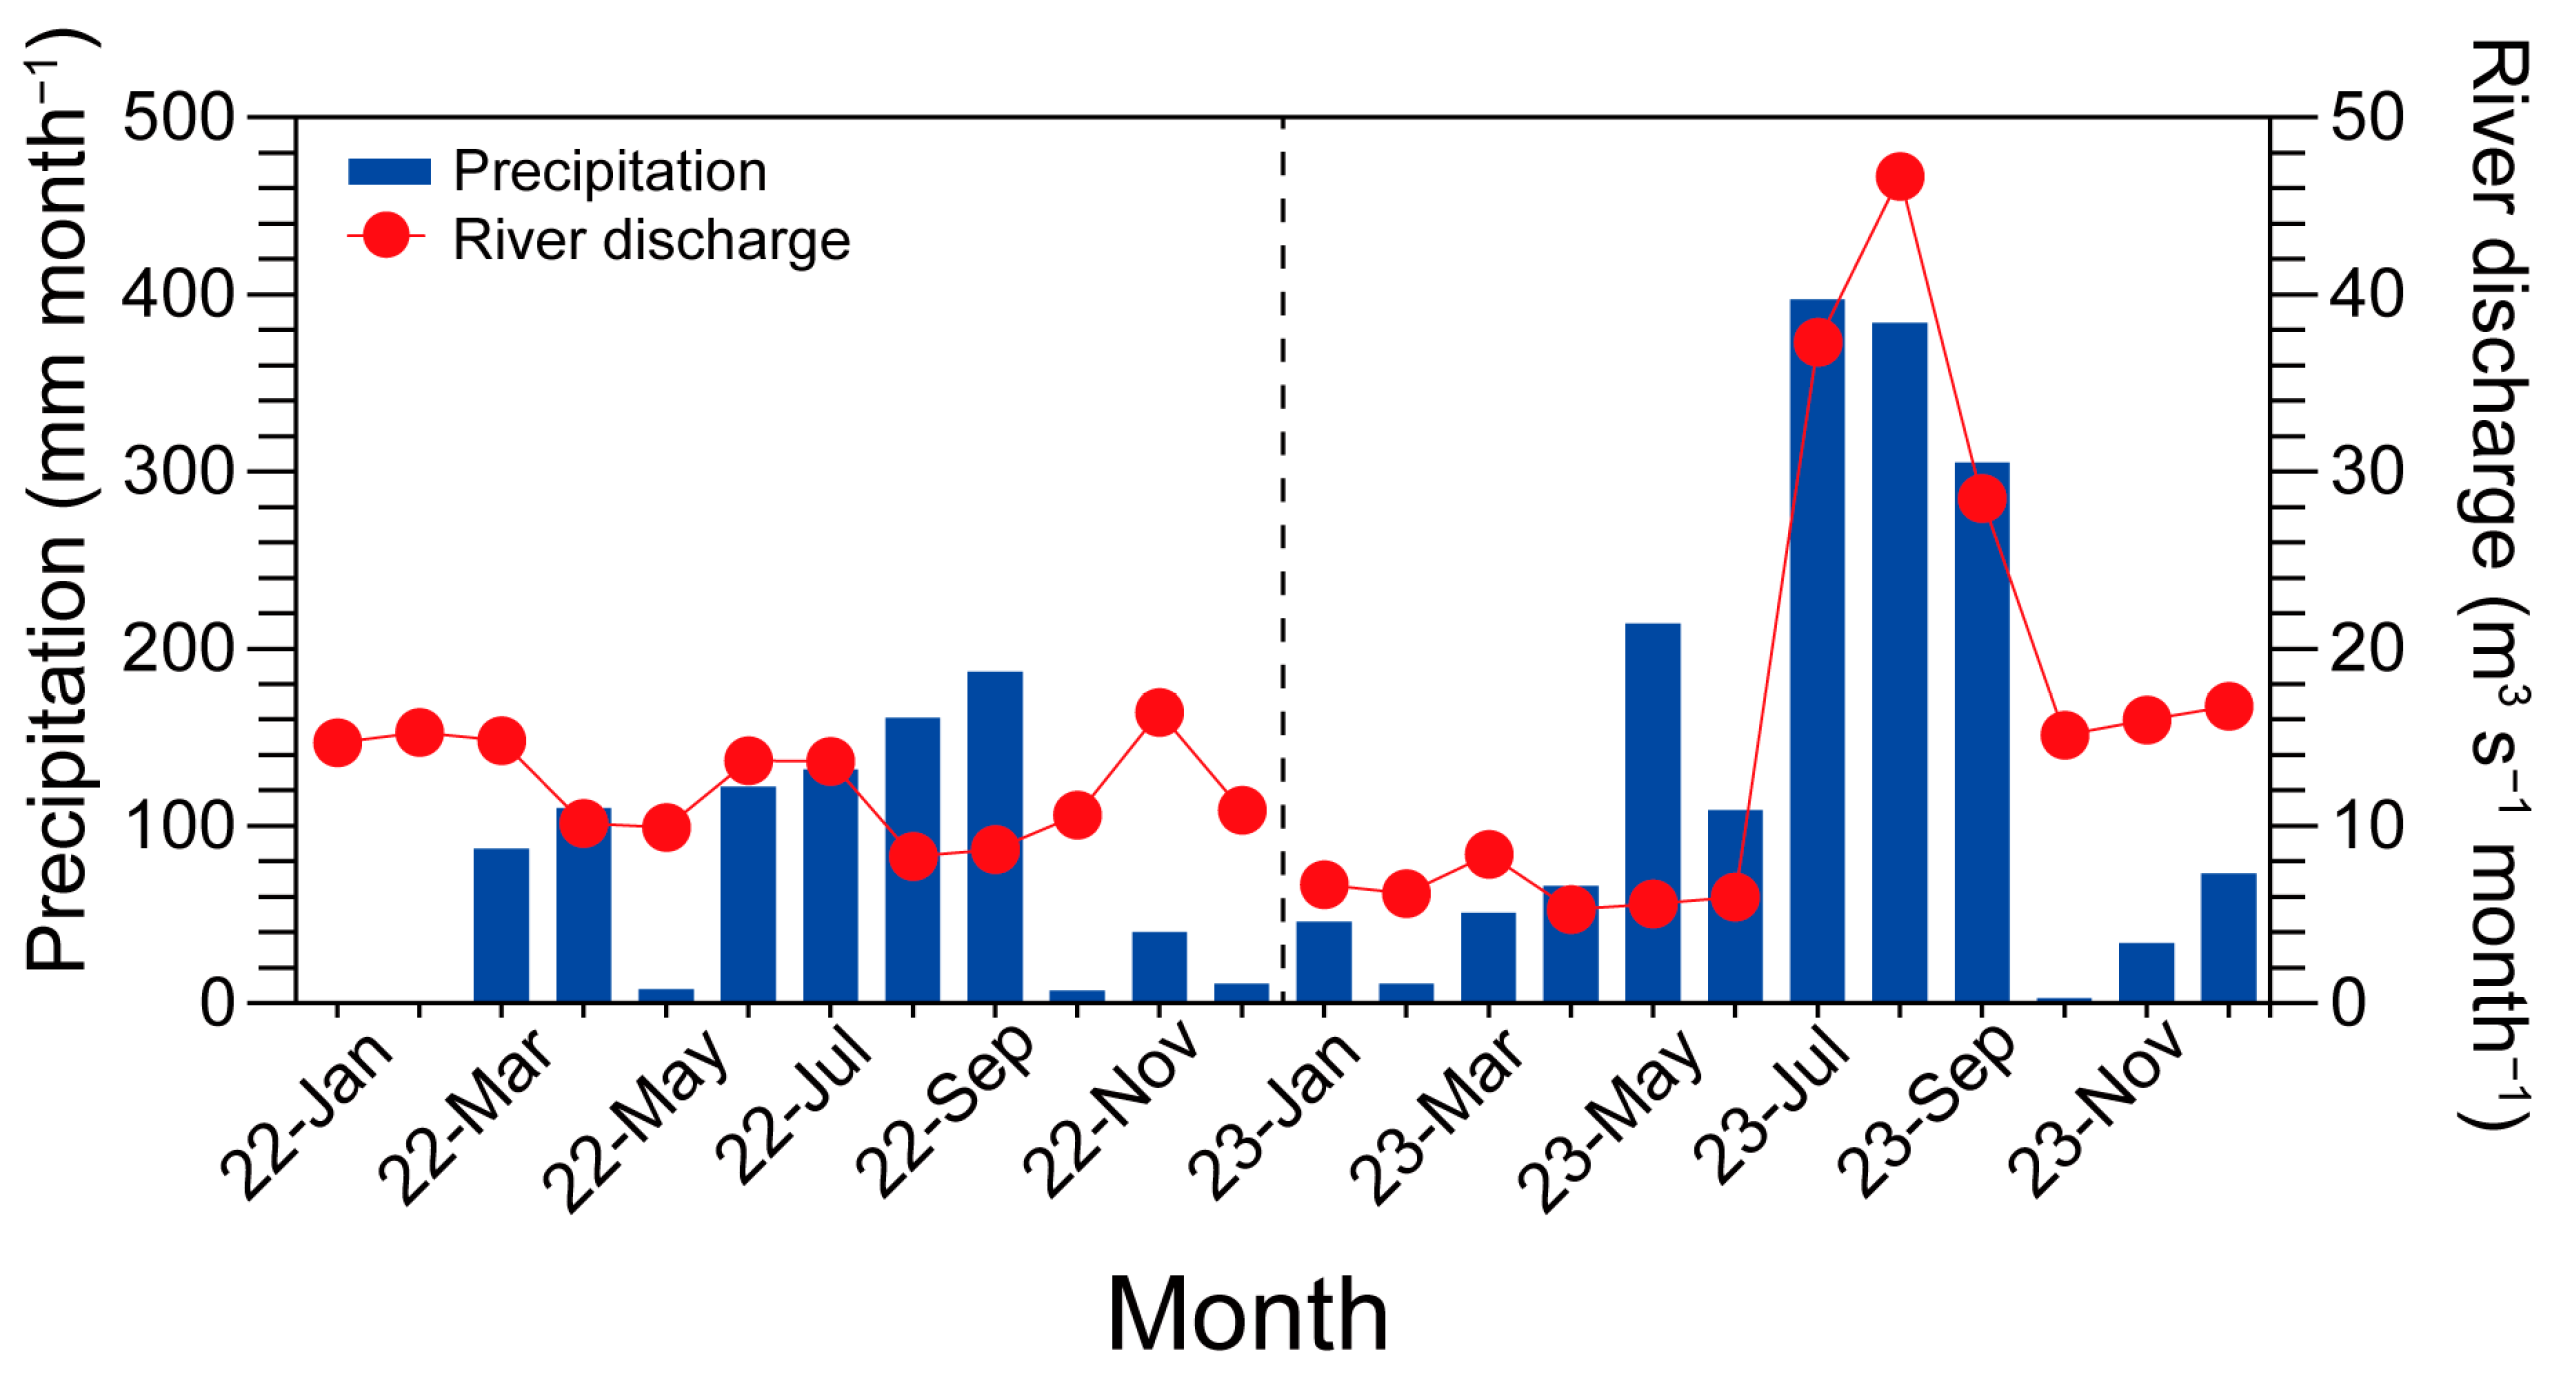
2.3. Hydrological Data Acquisition

Rainfall and discharge data were obtained from the National Water Resources Management Information System (WAMIS, www.wamis.go.kr). Daily rainfall data were collected from Gupo Bridge, and daily discharge data were collected from Hapcheon Weir, both located in the Nakdong River basin.

2.4. Statistical Analysis

Phytoplankton abundance, environmental factors, and nutrient concentrations varied across seasons and stations but did not consistently meet the assumptions of normality and homogeneity of variances required for one-way analysis of variance (ANOVA). Therefore, the non-parametric Kruskal–Wallis test was used to assess differences among groups, followed by the Mann–Whitney U-test for pairwise post hoc comparisons. To account for multiple comparisons, a Bonferroni correction was applied, setting the significance level at p = 0.017 (adjusted from p < 0.05/3). All statistical analyses were conducted using SPSS version 25 (IBM Corp., Armonk, NY, USA). To examine the relationships between harmful or toxic algal species and environmental factors, including temperature, salinity, pH, dissolved oxygen, ammonium, nitrate + nitrite, phosphate, and silicate, principal component analysis (PCA) was performed using R version 4.2.1 [17]. The prcomp and biplot functions were used for PCA visualization, and the ellipse package was applied to define 95% confidence regions. PCA identified key environmental gradients influencing the distribution of harmful algal species across seasons and stations. Additionally, correlations between environmental factors and harmful algal species were analyzed using Spearman’s rank correlation combined with Mantel’s test, implemented in the linkET package in R. To further investigate phytoplankton community structure, hierarchical cluster analysis was conducted using the group-average linkage method, and non-metric multidimensional scaling (nMDS) ordination was applied with the Bray–Curtis similarity index. Both analyses were performed using Primer version 5 software, providing insights into seasonal and spatial variations in phytoplankton communities and their responses to environmental changes.

3. Results

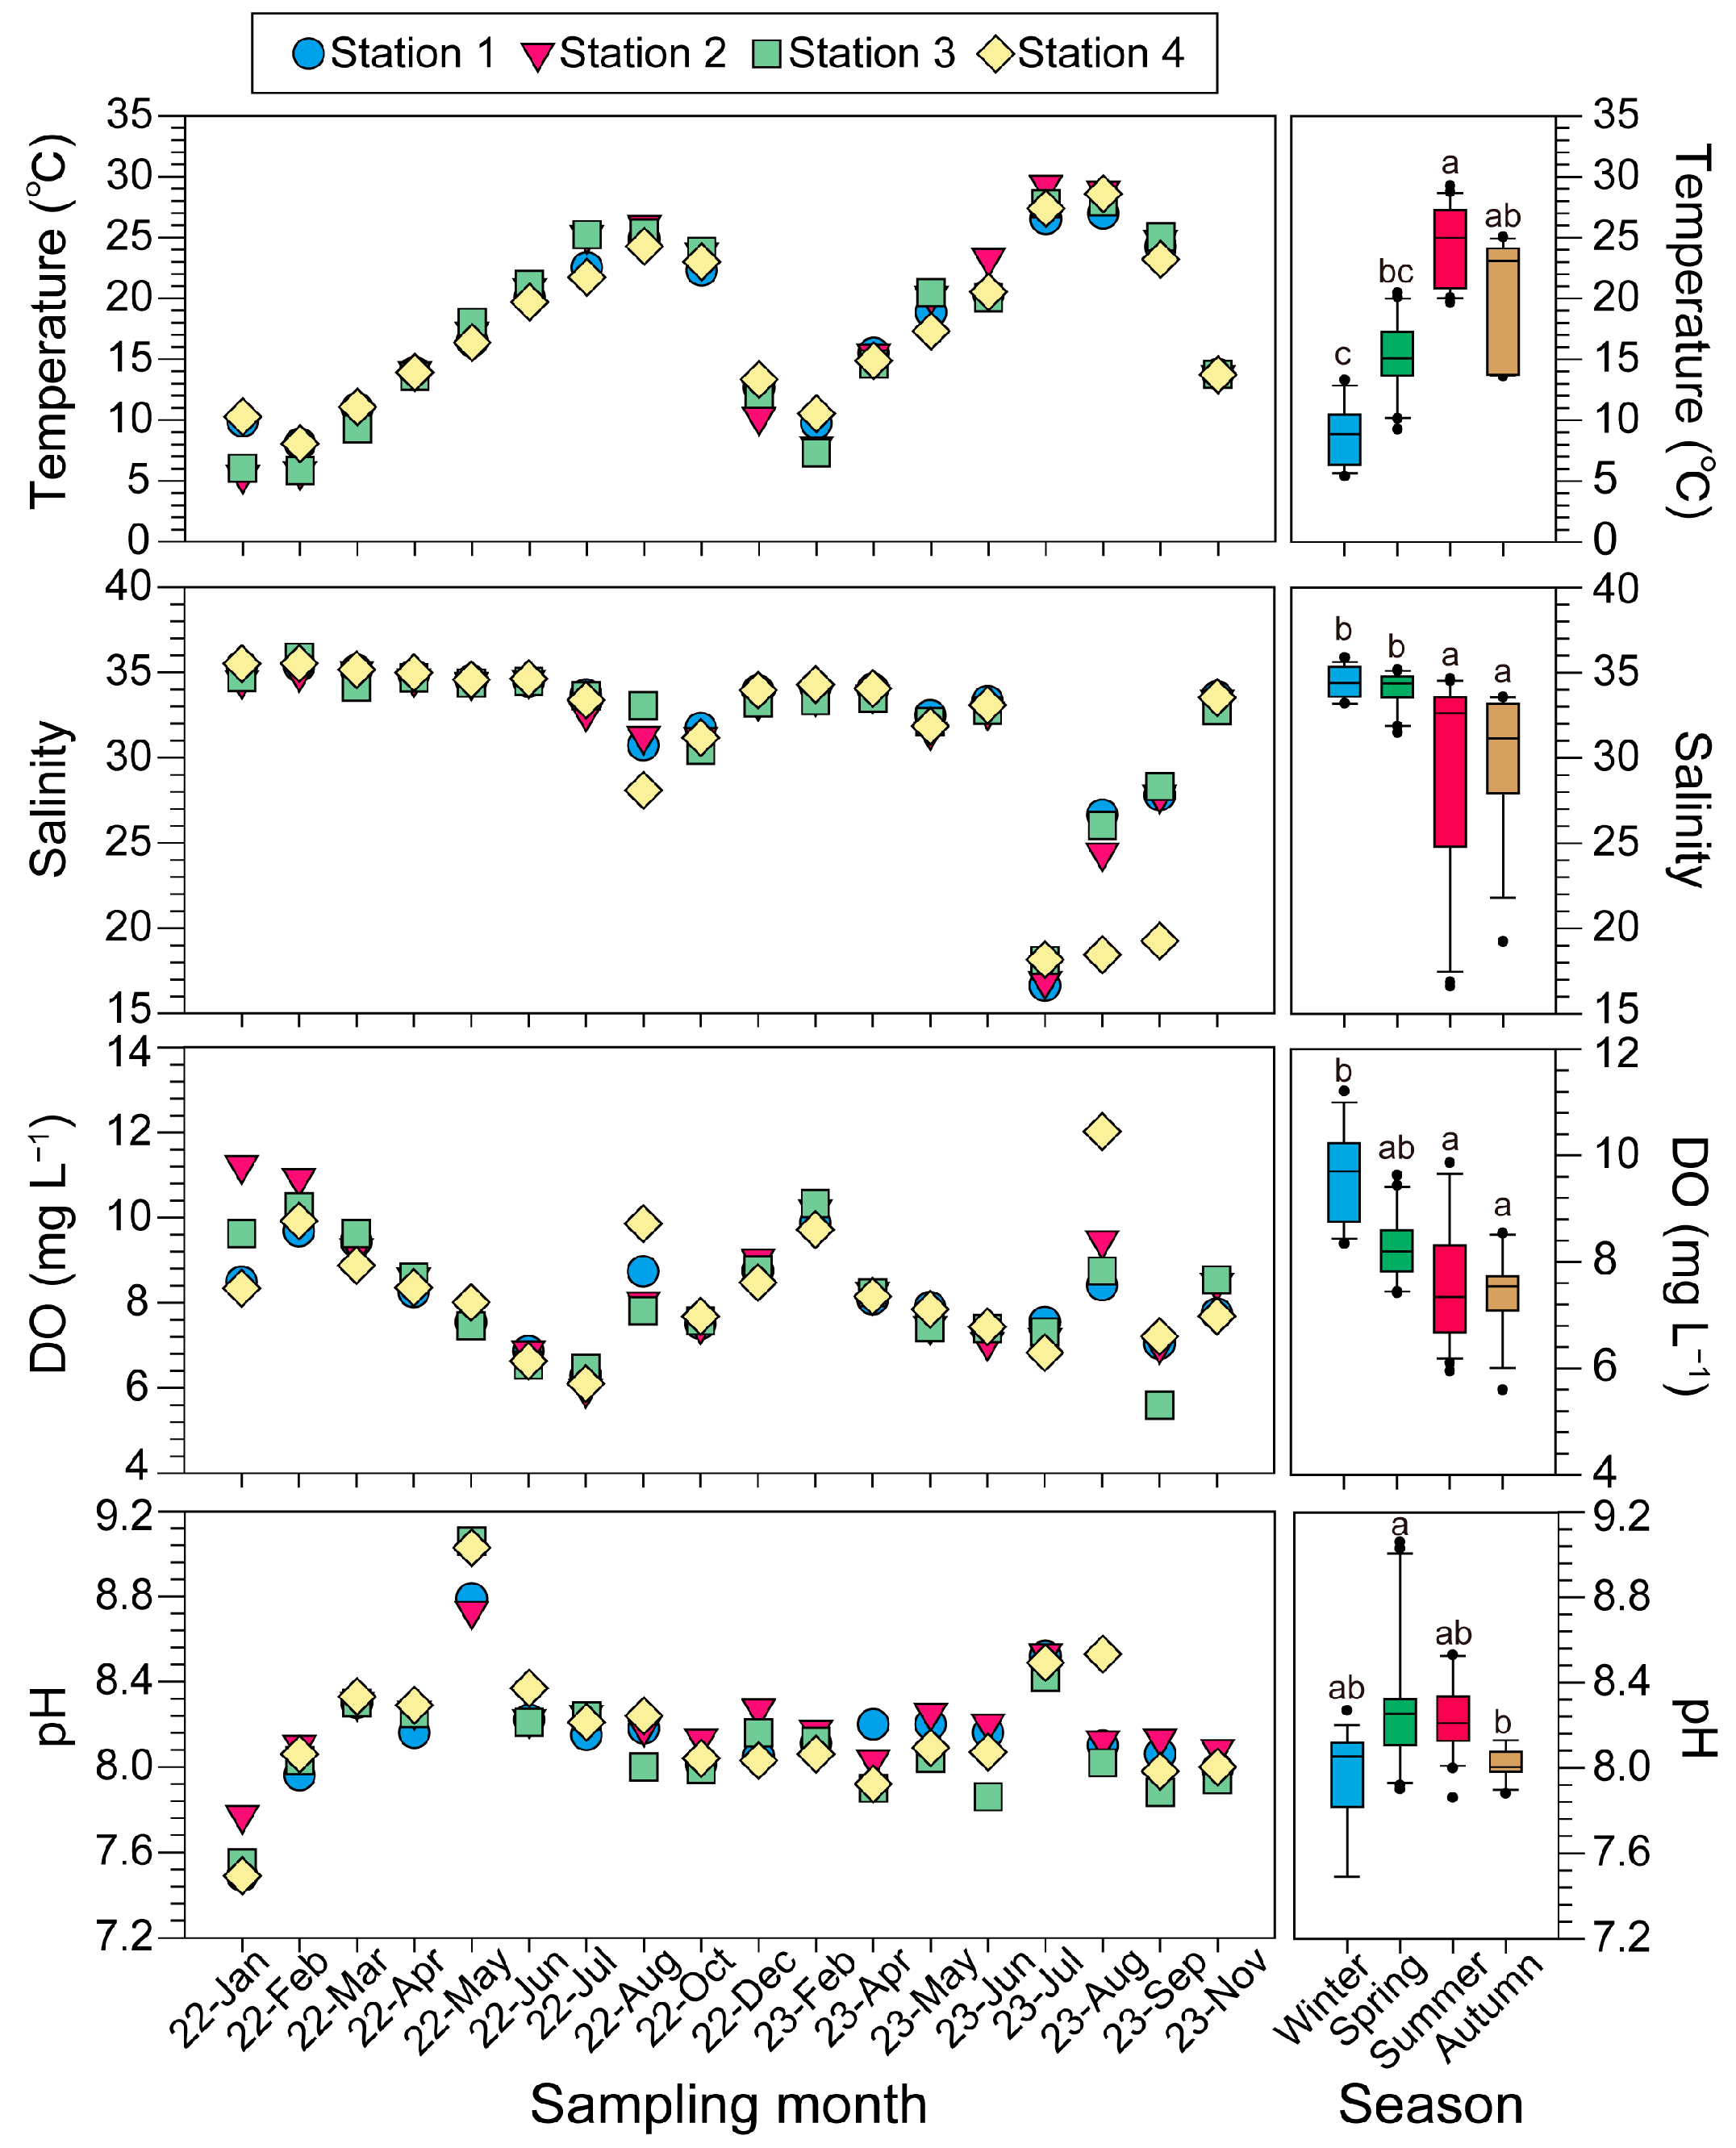
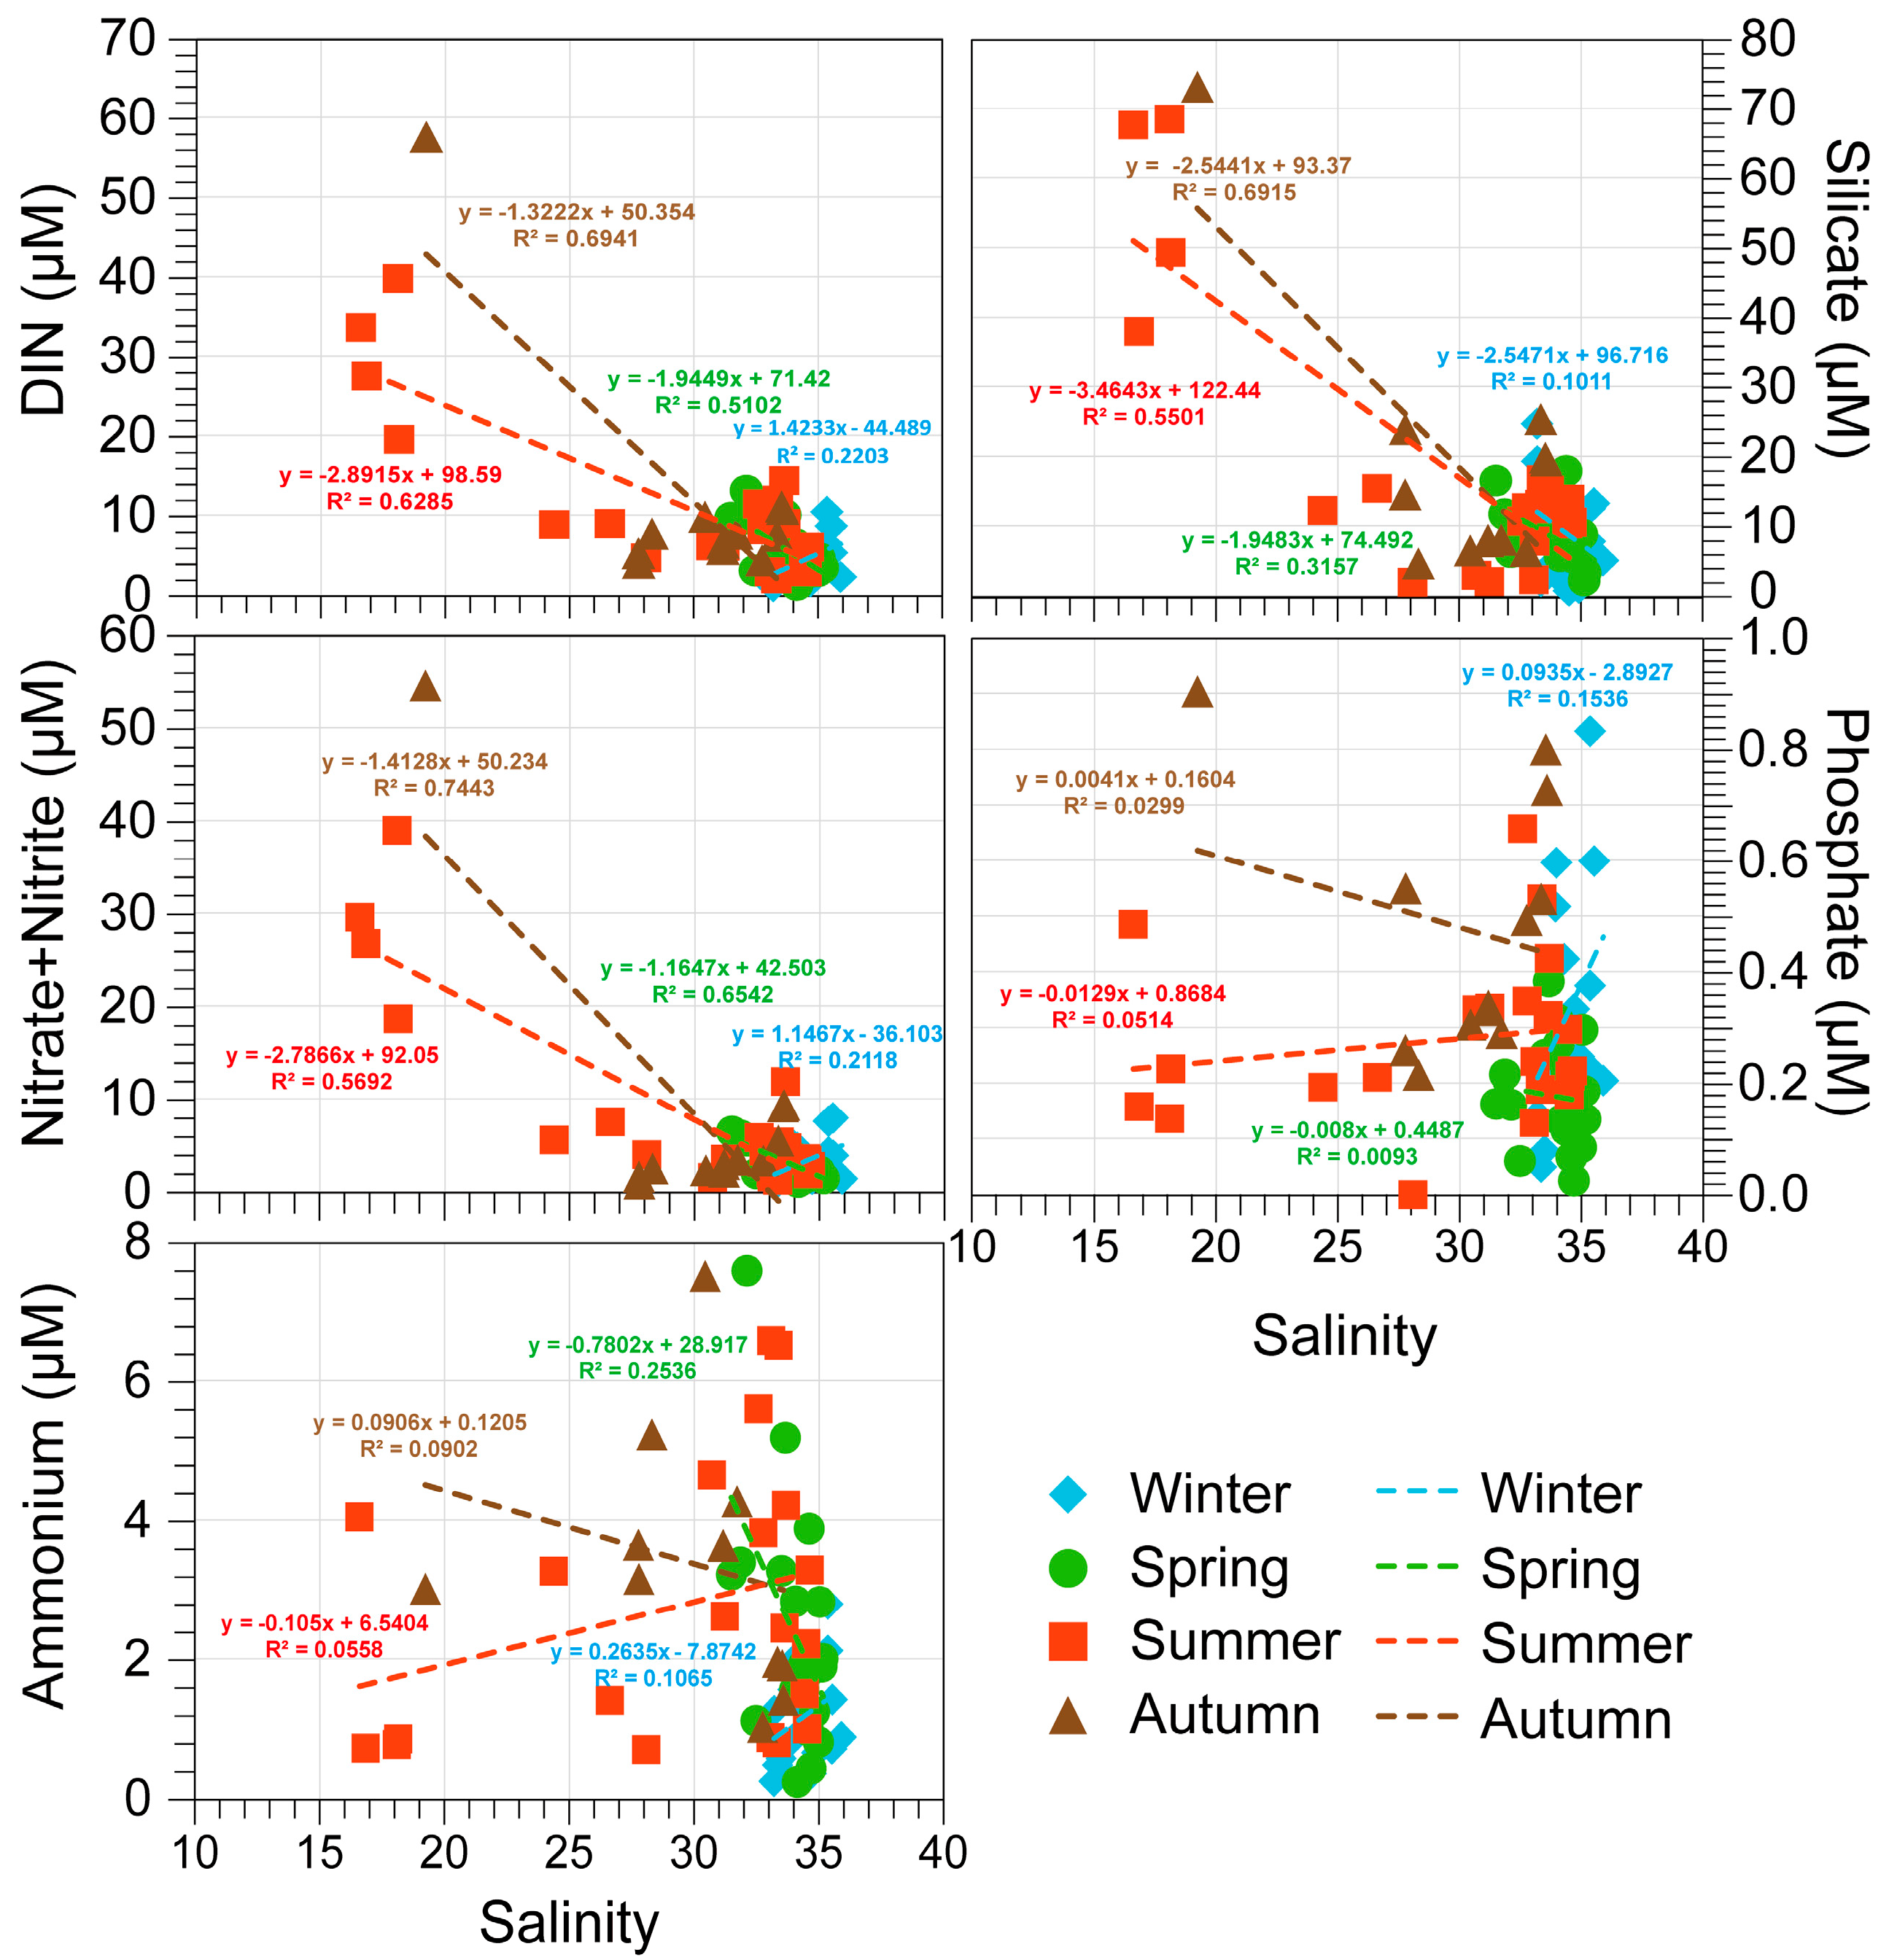
3.1. Environmental Factors

The seasonal variations in temperature, salinity, dissolved oxygen (DO), and pH at four observation stations from 2022 to 2023 are presented in Figure 2. Temperature exhibited distinct seasonal fluctuations, rising to a maximum of 30 °C between June and August before decreasing to approximately 5–8 °C in February. Salinity varied between 30 and 35 during the dry season but decreased to around 28 in August 2022 during the rainy season. In some stations, it dropped below 20 between July and September 2023. DO concentrations show an inverse relationship with temperature. In January 2022, DO was recorded at 10 mg L−1, decreasing to 6 mg L−1 in June, followed by fluctuations within the range of 7–10 mg L−1. pH remained relatively stable within a range of 7.6–8.8, with minor seasonal variations. However, in January 2022, pH was lower (7.4–7.8), while the highest values (8.7–9.1) were observed in May. Boxplot analysis of seasonal variations (Winter: 12–2, Spring: 3–5, Summer: 6–8, Autumn: 9–11) indicated that temperature was highest and DO concentration was lowest during summer (June–July). Salinity was highest in winter and showed a decreasing trend in summer and autumn. DO concentrations decreased from winter to summer but increased again in autumn. pH was lowest in winter and slightly higher in spring and summer.
From January 2022 to December 2023, river discharge ranged from 0.1 m3/s to 408.9 m3/s (average 14.4 ± 9.8 m3/s), showing clear seasonal variations, with peak discharge observed in July (408.9 m3/s) and August 2023 (349.2 m3/s) (Figure 3). The lowest discharge levels were recorded in January and February 2022 (below 1 m3/s). Precipitation also demonstrated seasonal patterns, peaking in July and August 2023 (397 mm and 384 mm, respectively), corresponding to the highest river discharge values.
Figure 4 illustrates the seasonal variations in dissolved inorganic nutrient concentrations at four stations. The concentration of nitrate + nitrite (NO3 + NO2) was 9 μM at Station 4 in January 2022 and remained below 5 μM from February to June. It rose to 10 μM at Station 3 in July but dropped below 5 μM again until June 2023. Notably, in July 2023, concentrations ranged from 20 to 40 μM at all four stations, with the peak reaching 54.7 μM at Station 4 in September. Boxplot analysis revealed that while mean concentrations were relatively consistent across seasons, fluctuations were greatest in summer and autumn. Ammonium (NH4+) concentrations ranged from 0.25 to 7.60 μM, with an increasing trend observed in summer and autumn. Phosphate (PO43−) concentrations varied by station, being higher in winter and autumn, and lower in spring and summer. Except for specific periods and stations, phosphate levels remained stable, ranging from 0.1 to 0.4 μM. Silicate (SiO44−) concentrations typically remained around 10 μM but spiked to 60–80 μM at Stations 3 and 4 in July and September 2023.
The relationship between salinity and various nutrients (DIN [Dissolved inorganic nitrogen; nitrate + nitrite + ammonium], nitrate + nitrite, ammonium, phosphate, silicate) across different seasons is shown in Figure 5. The concentrations of DIN and nitrate + nitrite exhibited a negative correlation with salinity, with decreases in salinity during summer (R2 = 0.63) and autumn (R2 = 0.70) significantly contributing to the increase in DIN concentrations. For ammonium, no clear seasonal correlation with salinity was observed. Silicate also showed a strong negative correlation with salinity, similar to DIN, with this trend being most evident in summer (R2 = 0.55) and autumn (R2 = 0.69). In contrast, phosphate exhibited a weaker correlation with salinity compared to other nutrients, with minimal correlation observed in summer (R2 = 0.05) and autumn (R2 = 0.03). Notably, phosphate was supplied to the euphotic layer through winter water column mixing.

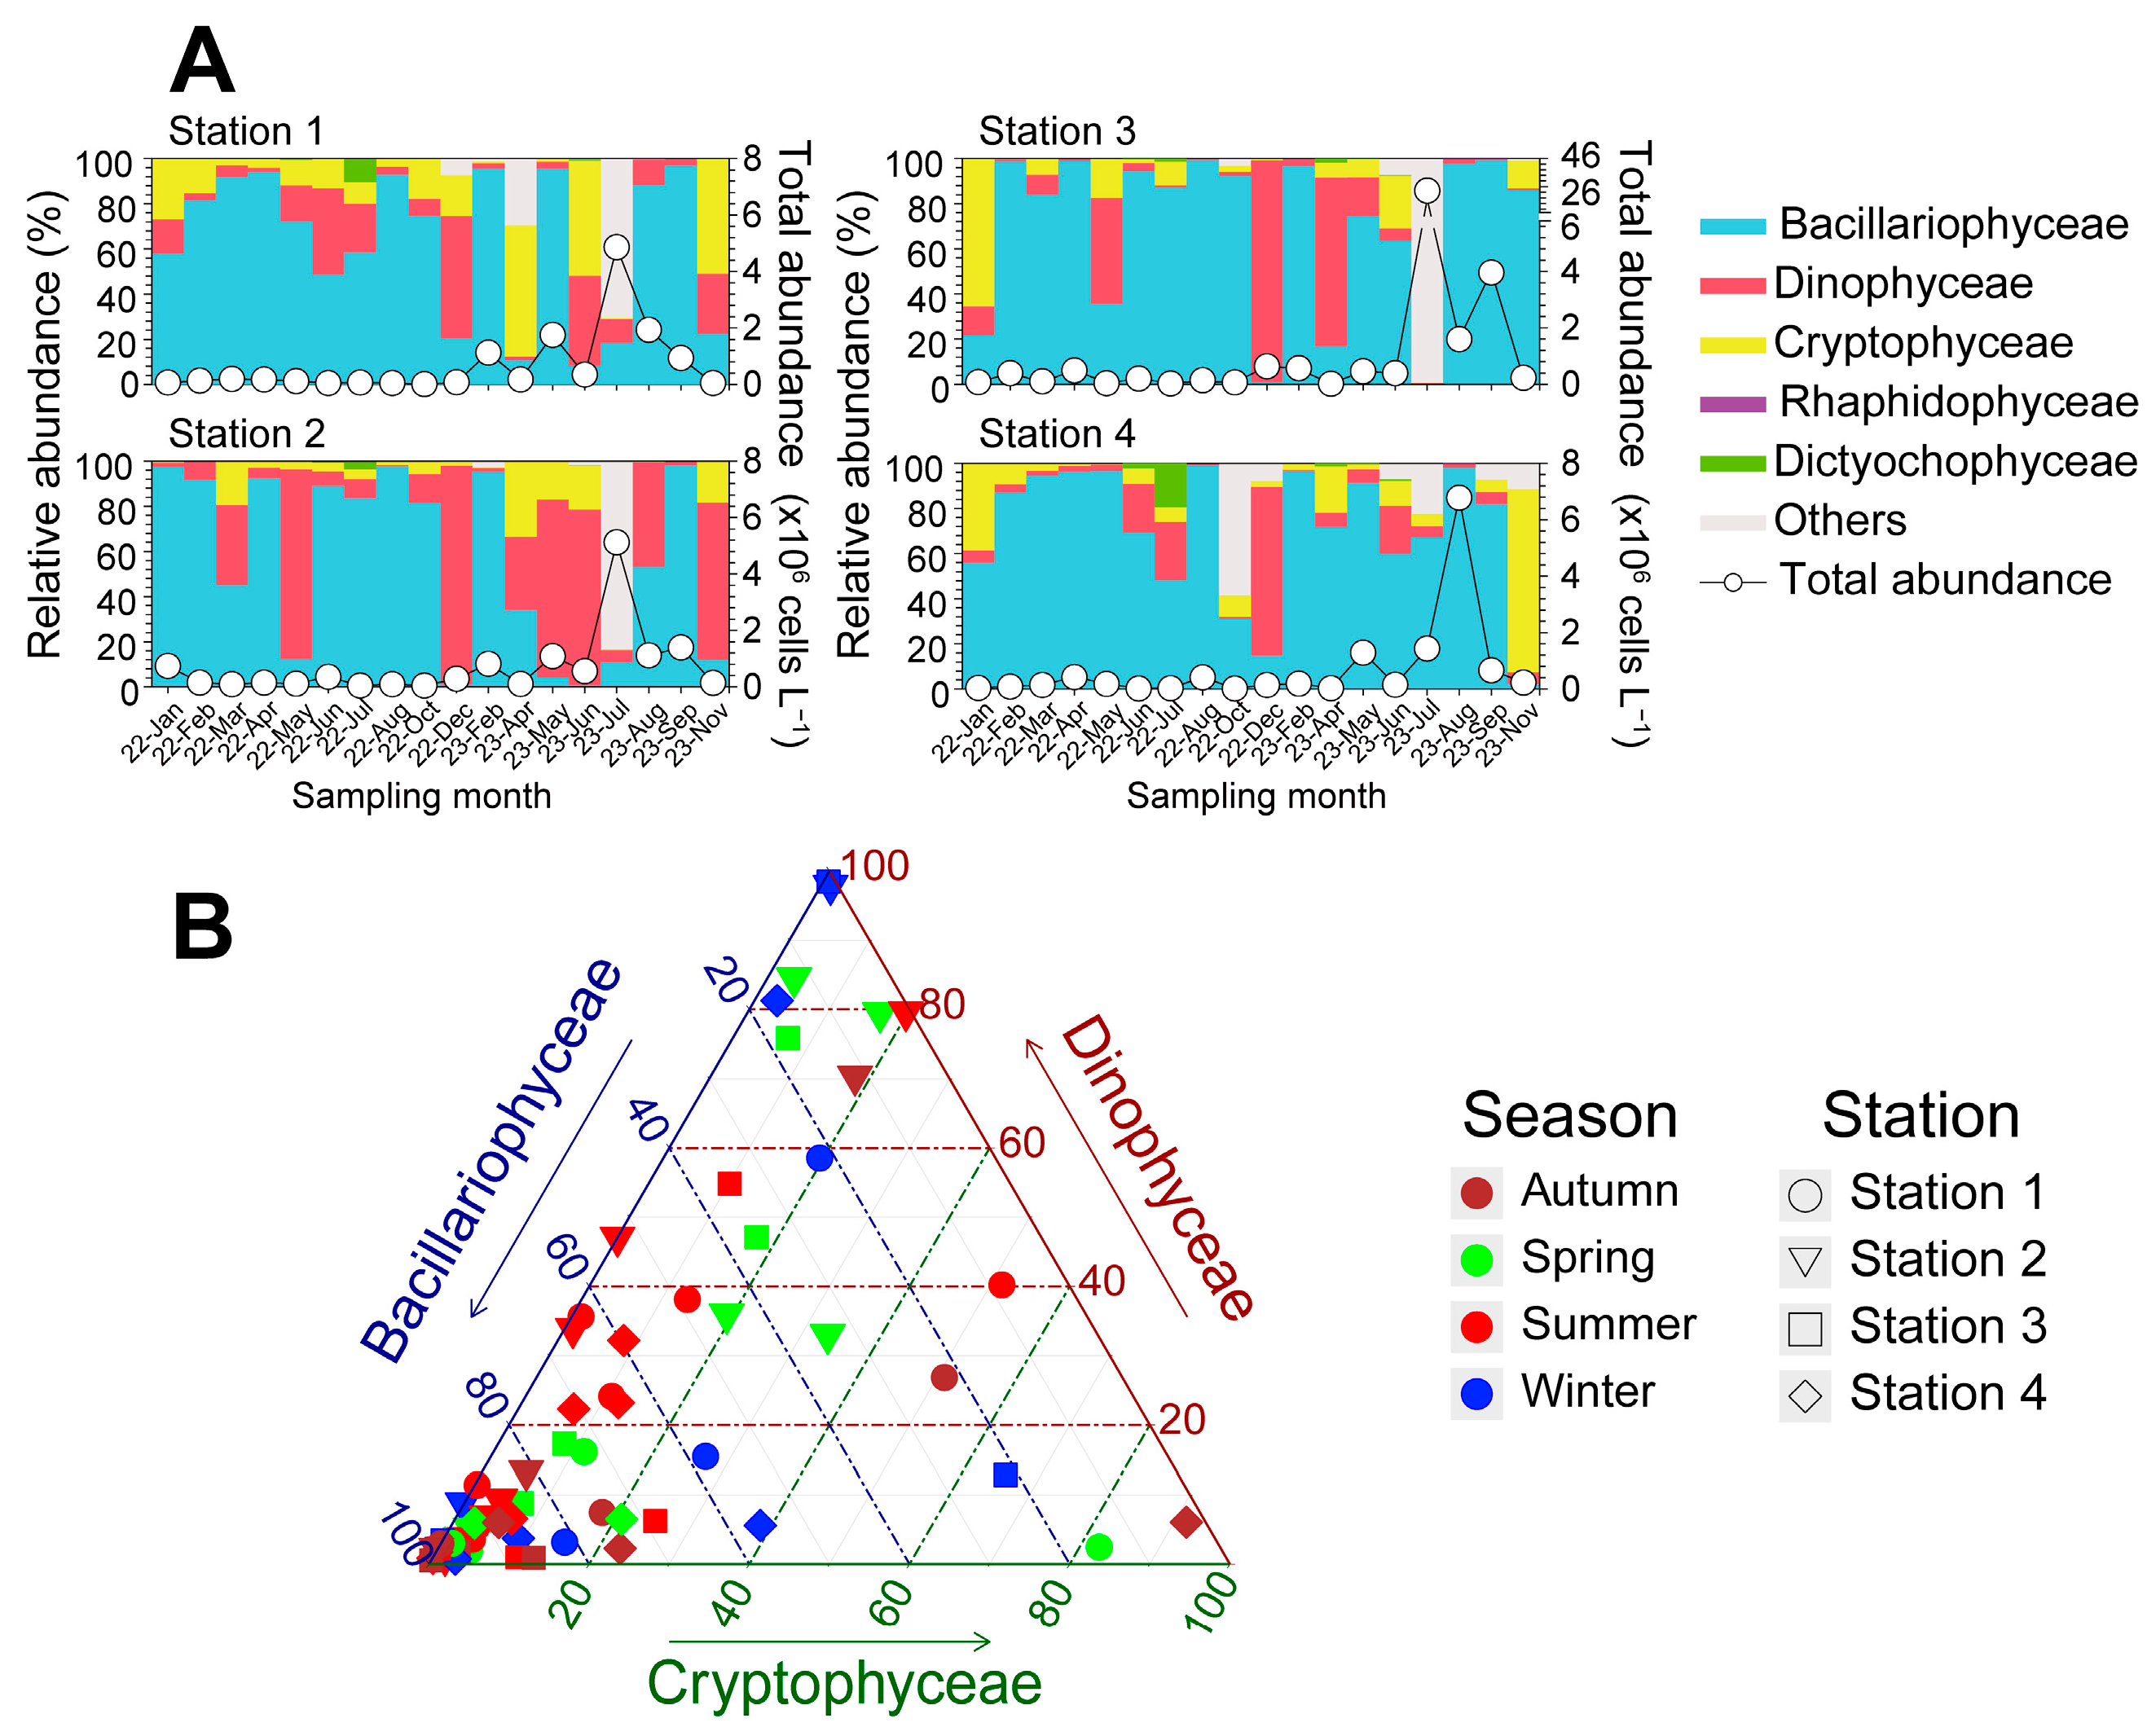
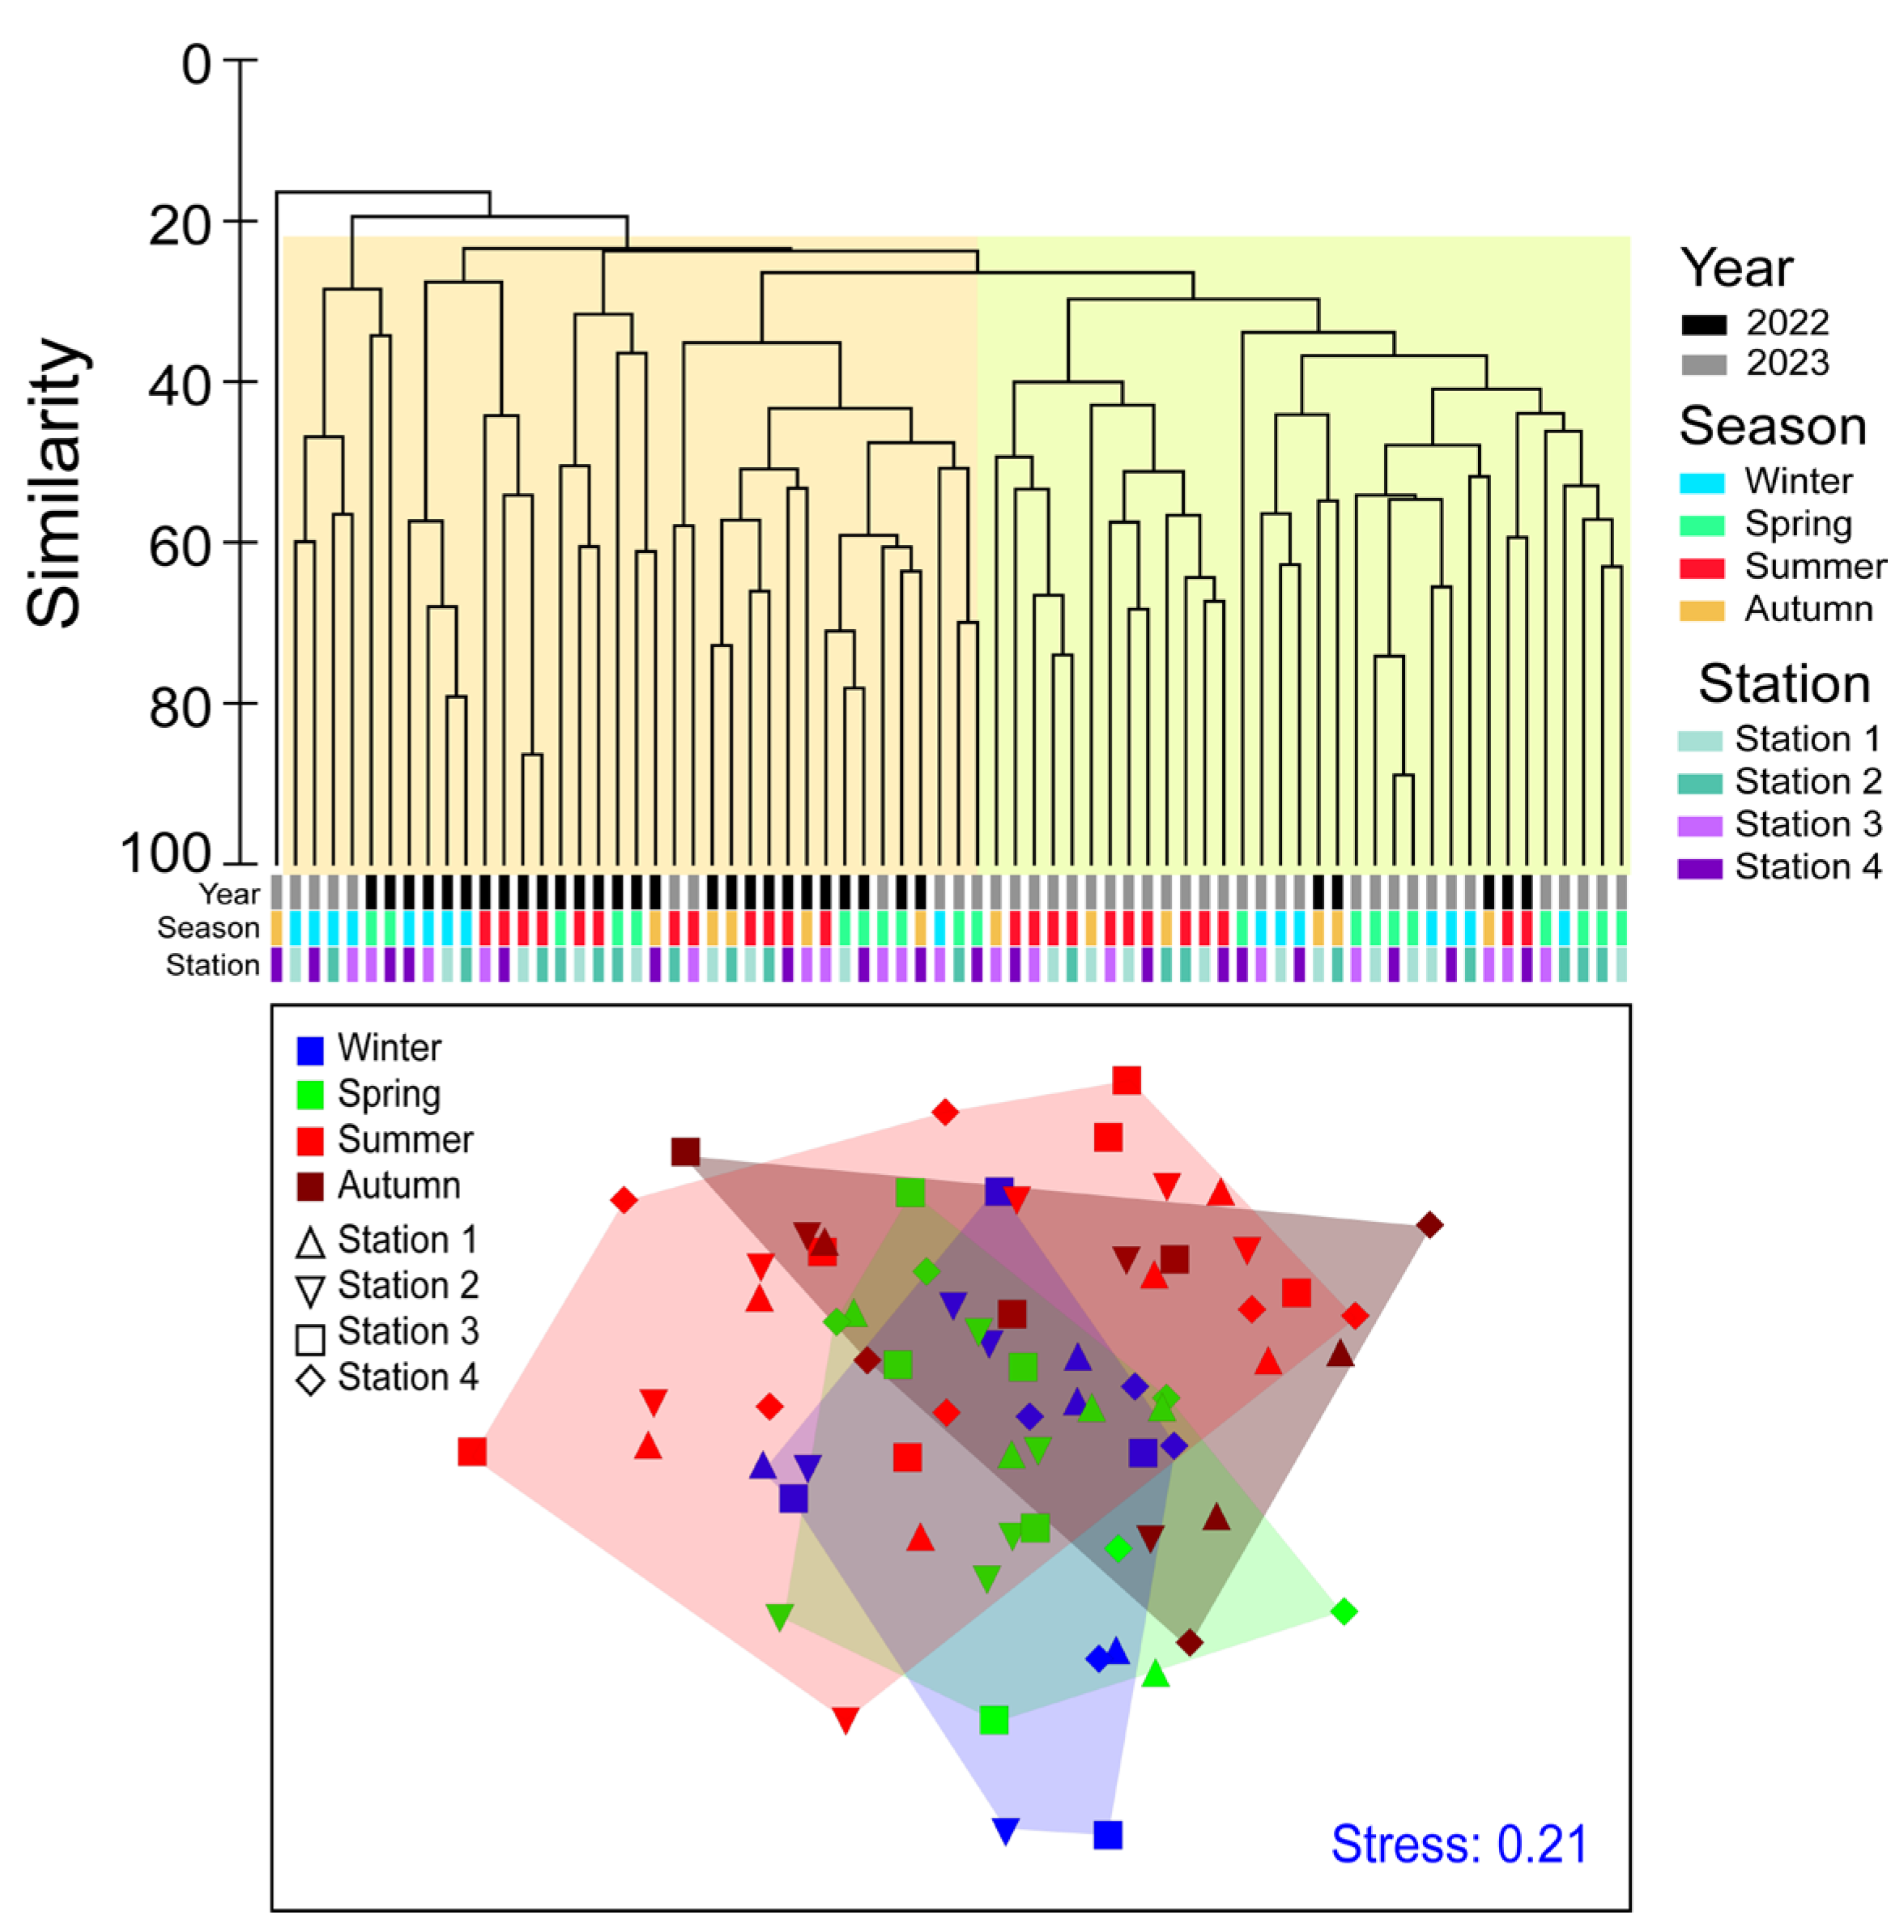
3.2. Seasonal Phytoplankton Abundances and Community in Each Coastal Region

The total abundance and seasonal distribution characteristics of major phytoplankton groups (class level) from 2022 to 2023 are presented in Figure 6A. While there were differences among the four stations, Bacillariophyceae (=diatoms) have mainly exhibited. The total phytoplankton abundance remained relatively low throughout 2022 but increased sharply from August to October 2023. From January to May 2022, diatoms accounted for a high proportion, while in June, the proportion of Dinophyceae (=dinoflagellates) temporarily increased before diatoms regained dominance, occupying approximately 80%. Notably, in December 2022, dinoflagellates exhibited an exceptionally high proportion at most stations. In 2023, dinoflagellates and cryptophytes (Cryptophyceae) were predominant at Station 2 from April to June. Additionally, in July 2023, the total phytoplankton abundance was extremely high at Stations 1–3, with unidentified nano-sized phytoplankton accounting for more than 90% of the population.
To analyze the relative proportions of the three dominant groups (Bacillariophyceae, Dinophyceae, and Cryptophyceae) in coastal waters, a ternary plot analysis was conducted (Figure 6B). Except for a few stations, Bacillariophyceae accounted for 60–100% of the community at most stations and seasons. In contrast, Dinophyceae showed a tendency to be relatively higher during summer, with particularly high proportions (80–100%) observed at Station 2. The proportion of Cryptophyceae generally remained below 20%, showing no clear correlation with season or station. Overall, Bacillariophyceae maintained a stable proportion throughout the year, while the proportions of Dinophyceae and Cryptophyceae increased during summer and autumn, leading to changes in the phytoplankton community structure.
Figure 7 presents the seasonal relative proportions of phytoplankton species at each station. Three diatom groups, Pseudo-nitzschia spp., Skeletonema spp., and Chaetoceros spp., consistently dominated with high relative abundance across all stations. In particular, Pseudo-nitzschia delicatissima exhibited relatively high proportions at Station 3 during spring and autumn. Skeletonema spp. showed a relatively high abundance at all stations, with an especially high dominance of over 80% at Station 2 in February 2023. Dinoflagellate Alexandrium catenella had a relatively high proportion at Station 2 from February to May, while dinoflagellate Akashiwo sanguinea bloom occurred in December 2023, accounting for 40–80% of the phytoplankton community across all stations. Additionally, dinoflagellate Prorocentrum spp. showed a tendency for population increases at specific times at Station 2. Of these, P. donghaiense and P. triestinum were relatively low. The dinoflagellates Tripos furca and Tripos fusus were observed at most stations between June and November. In particular, T. furca showed a high abundance at Station 2 in November 2023. The dinoflagellate Gyrodinium spirale appeared at low concentrations between April and November but particularly showed a consistently high abundance at Station 3 in May. Additionally, the dinoflagellate Katodinium glaucum, though present in low numbers during the summer, was a frequently occurring group, and notably appeared at a consistently high proportion at Station 2 in December 2022, when A. sanguinea was present in high abundance. Among Cryptophyceae and other groups, Cryptomonas spp. appeared at low proportions across all stations but showed relatively higher abundances in winter and spring.
The cell densities of the six key harmful/toxic microalgal species at each station from January 2022 to November 2023 are shown in Figure 8. Margalefidinium polykrikoides and A. sanguinea, which appear at high densities in coastal areas and cause damage to farmed fish, were categorized as harmful species and toxin-producing species (PSP-causing species: A. catenella; DSP-causing species: Dinophysis acuminata; yessotoxin-causing species: Gonyaulax spinifera; ASP-causing species: P. delicatissima), and their seasonal distribution characteristics were analyzed. The harmful species M. polykrikoides increased at Station 1 and Station 2 during June and July 2023, with the highest cell density recorded at Station 2 in August at 26.2 × 10⁴ cells L−1. As mentioned earlier, A. sanguinea appeared intermittently from November 2022 and maintained a high density at all stations in December, with the highest density recorded at Station 3 at 62.4 × 10⁴ cells L−1. The toxin-producing species A. catenella mainly appeared in March and May 2022, and May and June 2023, with the highest density reaching 1.7 × 10⁴ cells L−1 at Station 2. D. acuminata showed relatively high densities at Station 2 in May and June 2023, with a peak of 1.4 × 10⁴ cells L−1, and then showed a declining trend. G. spinifera exhibited the lowest cell density but reached a relatively higher abundance of 0.17 × 10⁴ cells L−1 at Station 2 in June 2023, with a slight increase in cell density also observed in June 2022. The ASP-causing species P. delicatissima, though small in cell size, exhibited the highest cell density among toxin-producing species during the study period. The seasonal appearance of P. delicatissima showed a tendency to peak in the summer, with relatively low cell densities in June and July 2022, but the highest density was recorded in June and July 2023 at Station 3, reaching 1.83 × 10⁶ cells L⁻1.
The relationship between phytoplankton community structure and environmental factors was investigated using cluster analysis and principal component analysis (PCA) (Figure 9A,B). The cluster analysis of phytoplankton community structure and environmental factors at each station (Figure 9A) showed that Station 1 and Station 2 had similar community structures, while Station 3 and Station 4 formed separate clusters. This suggests that tidal and current patterns influenced the unique characteristics of each station. Seasonal cluster analysis revealed that spring and autumn communities were grouped together, followed by winter and summer. The clear separation of the summer community structure indicates that frequent rainfall during the summer leads to noticeable differences in phytoplankton composition. According to the PCA biplots, M. polykrikoides and P. delicatissima exhibited a negative correlation with salinity and a positive correlation with nitrate + nitrite concentrations. DO and pH were weakly associated with the occurrence of D. acuminate and G. spinifera. The Mantel test, which assessed correlations between environmental variables and harmful algal species (Figure 9C), revealed that temperature and salinity significantly influenced the abundance and density of harmful/toxic microalgae. Specifically, temperature showed a significant positive correlation with the abundance of M. polykrikoides (Mantel’s p < 0.05). Salinity was strongly negatively correlated with nutrient concentrations (nitrate + nitrite, ammonium), with the most pronounced correlation observed with nitrate + nitrite concentrations (Pearson’s r = −0.8). Furthermore, the appearance of A. sanguinea in winter was negatively correlated with temperature.
Cluster analysis and non-metric multidimensional scaling (nMDS) were used to assess the spatial and temporal variability of phytoplankton community structure in 2022 and 2023 (Figure 10). Hierarchical clustering revealed that the community structure of 2022 and 2023 was generally divided into two main groups (at the 25% similarity level), with some samples forming distinct clusters. The nMDS analysis showed clear seasonal separation of community structures, with summer samples forming independent clusters and displaying increased variance within the groups. Winter and spring samples overlapped, reflecting minimal environmental differences during these periods. Autumn samples showed some overlap with summer but maintained distinct community structures. Station-specific analysis highlighted pronounced seasonal shifts at Station 3 and Station 4, particularly during summer, while Station 1 and Station 2 exhibited relatively stable community structures throughout the year.

4. Discussion

It is well known that the large influx of freshwater following rainfall serves as a key source of nutrients in estuarine and coastal frontal regions, often triggering phytoplankton blooms [3,5]. During the mixing process of freshwater and seawater, species with high salinity tolerance proliferate first. Over time, the organic matter they produce, along with bacterial decomposition processes, facilitates the growth of mixotrophic harmful dinoflagellates [18]. Nutrients such as nitrate, phosphate, and silicate introduced from the Nakdong River undergo dispersion and dilution under the combined influence of tidal currents and water circulation within Jinhae Bay. Data from the National Water Resources Management Information System (WAMIS, www.wamis.go.kr) indicate that approximately 6.8–11.3 × 10⁹ m3 of freshwater is discharged annually from the Nakdong River into the Busan coastal area. Although river discharge is typically regulated by a large estuarine barrage constructed in 1987, exceptionally heavy rainfall events, such as those in summer 2023, caused a sudden increase in discharge beyond its capacity, leading to a rapid decrease in salinity at our study area. In addition, due to its semi-enclosed structure, Jinhae Bay retains these incoming nutrients for a certain period, allowing them to accumulate and influence biological processes. In particular, the northeastern waters of the bay, where a front forms due to the interaction between Nakdong River freshwater and the Tsushima Warm Current, frequently experience phytoplankton blooms [14,19,20]. After rainfall, it takes approximately one day for freshwater to reach the eastern waters of Jinhae Bay, with its dispersion and dilution rates influenced by tidal fluctuations. The duration of phytoplankton blooms induced by nutrient influx from rainfall varies seasonally. In summer, phytoplankton blooms typically last for about a week, whereas in spring and autumn, they generally persist for around two weeks, as demonstrated in the bioassay experiments conducted by Baek et al. [3,5]. Based on the difference in salinity and nutrient level (Figure 2 and Figure 3), we found that the influence of Nakdong River freshwater was first detected at Stations 1 and 4, followed by a delayed response observed at Stations 2 and 3. In addition, the interaction between riverine nutrient input and water circulation was well-matched with the phytoplankton blooms in the eastern waters of Jinhae Bay, indicating that Nakdong River freshwater has a significant impact on the dynamics of the phytoplankton community in this area. Moreover, seasonal variations influence the duration and intensity of these blooms, highlighting the dynamic nature of nutrient-driven ecosystem responses.
In temperate coastal waters, nutrient supply to the euphotic zone originates from two major sources: (1) terrestrial input driven by monsoon-related rainfall and (2) ocean-derived nutrients supplied through water column mixing and upwelling [3,5]. The dynamics of these nutrients play a crucial role in regulating phytoplankton growth and community succession. In the present study, a negative correlation was observed between salinity and nitrate + nitrite (p < 0.001), as well as between salinity and silicate (p < 0.001), indicating that nutrient enrichment occurred alongside a decrease in seawater salinity due to freshwater input. This relationship was particularly evident during summer and autumn, when increased rainfall resulted in stronger correlations and more pronounced freshwater influence. In contrast to nitrate and silicate, phosphate exhibited no significant correlation with salinity, suggesting that its supply was not predominantly governed by freshwater input (p > 0.05). The transport of nutrients into coastal waters along with low-salinity water has been reported in several studies [21,22]. In the study area, previous research has also shown that during the rainy season, nutrient input from the Nakdong River influences the eastern waters of Geoje Island and Jinhae Bay [5,14]. In contrast, during non-rainfall periods, cooling-induced water column mixing becomes more active, transporting ocean-derived nutrients from the bottom layer to the surface. This process acts as a trigger for phytoplankton blooms, particularly in spring, when increased solar radiation further promotes growth. Therefore, freshwater-derived nutrients supplied by rainfall play a key role in triggering summer phytoplankton blooms, particularly those dominated by diatoms. Meanwhile, ocean-derived nutrients supplied through water column mixing during non-rainfall periods are crucial in driving spring phytoplankton blooms.
It is well known that some diatoms and dinoflagellates have been identified as producers of biotoxins, and mass mortality in aquaculture farms has been linked to high cell density, with each categorized based on its specific harmful effects [23]. The mixotrophic dinoflagellate Margalefidinium polykrikoides (=Cochlodinium polykrikoides) [24], known for forming high-density blooms that impact marine organisms and fisheries, was intermittently observed at high cell densities in the eastern waters of Jinhae Bay. Although this species does not produce toxins, it can cause mass mortality of caged fish when its density exceeds 2000–5000 cells mL−1, leading to significant economic losses in the aquaculture industry. In particular, its mucous secretions can clog fish gills, resulting in respiratory distress and large-scale fish kills [25]. In the southern coastal waters of Korea, M. polykrikoides blooms occur annually, with peak occurrences typically from mid-July to late August [26]. These red tides initially develop in the waters off Goheung and subsequently spread eastward along the southern coast of the Korean Peninsula, influenced by wind, ocean currents, and particularly the Jeju Warm Current (JWC) [26]. Baek et al. [27] also reported high densities of M. polykrikoides in the Nakdong River estuary under high temperatures in August. In the present study, high cell densities of M. polykrikoides were observed at Station 1 (2.5 × 10⁵ cells L−1) and Station 3 (0.9 × 10⁶ cells L−1) in August. Correlation analysis revealed a significant positive relationship between M. polykrikoides abundance and seawater temperature, indicating that this species has an optimization in high water temperature conditions. Together with previous and present studies, M. polykrikoides is likely to appear in high densities during the summer when seawater temperatures rise and strong stratification develops in the upper euphotic zone. Given its potential to form large-scale harmful algal blooms (HABs) through biological aggregation, continuous monitoring and effective management strategies are essential to mitigate its impact.
Akashiwo sanguinea is a non-toxic, red tide-forming dinoflagellate found in marine and estuarine environments worldwide [28,29]. During periods of high proliferation, it can cause seawater discoloration, turning it brown and potentially disrupting marine ecosystems [30]. This species exhibits mixotrophic behavior and thrives within an optimal temperature range of 5–25 °C and a salinity range of 10–35 [31,32]. In Korean coastal waters, A. sanguinea maintains a stable population density during summer but frequently forms red tides from autumn (at ~18 °C) through winter (at ~5 °C) [33]. Notably, in Jangmok Bay (Station 3), recurrent red tide events have been reported during winter (December–February) when seawater temperatures range from 5 to 12 °C. In the present study, a high cell density of A. sanguinea was also observed in December, with higher concentrations recorded at Station 3 compared to Station 2 (inner bay). In the eastern waters of Jinhae Bay, the seasonal decline in zooplankton abundance during winter suggests a reduction in grazing pressure by higher trophic-level organisms [34,35,36]. Concurrently, the low-temperature conditions hinder the growth of competing diatoms and other dinoflagellates, creating an environment favorable for A. sanguinea proliferation [29,33]. Thus, while interannual variations in the initial seeding population and oceanographic conditions may influence bloom dynamics, A. sanguinea appears to benefit from winter conditions in Jinhae Bay. The combination of reduced competition, diminished grazing pressure, and stable population maintenance under low temperatures facilitates large-scale proliferation. Furthermore, hydrodynamic factors such as currents and wind contribute to the localized accumulation of A. sanguinea, leading to red tide formation in the coastal waters of the eastern area of Jinhae Bay.
Before the first case of paralytic shellfish poisoning (PSP) caused by Alexandrium catenella (formerly A. tamarense) in Korea in 1986, awareness of shellfish toxin contamination was low [37]. Following this incident, PSP was recognized as a significant public health and aquaculture concern. In 1996, a second case of paralytic shellfish toxin (PST) contamination was reported off the coast of Geoje, prompting the government to establish an early warning system for spring outbreaks [38,39]. Currently, shellfish toxin monitoring is conducted in production areas, and if PST levels exceed the regulatory limit (80 μg STX diHCl equivalents per 100 g), harvesting and distribution are prohibited (NIFS: https://www.nifs.go.kr/board/actionBoard0021List.do; accessed on 2 January 2025). Wind-driven surface currents play a crucial role in the accumulation of phytoplankton blooms in specific areas [40,41]. Our field observations, along with PST occurrence data from NIFS (Figure 11), indicate that PSP toxins accumulated in bivalves in the waters around Jinhae Bay and Geoje Island from February to April 2022 and from April to June 2023, coinciding with the expansion of A. catenella populations. Our field surveys consistently detected A. catenella populations during these periods. Each year, from February to April, as surface water temperatures decline, the entire water column undergoes physical mixing. This process is particularly pronounced in shallow coastal areas, where bottom-layer nutrients are continuously transported to the euphotic zone. In this study, A. catenella proliferated alongside diatom blooms under these conditions. Between February and May, A. catenella densities in Jinhae Bay and the eastern waters of Geoje Island remain between 1 and 10 cells mL⁻¹. However, in certain years (e.g., 2020), offshore populations, initially present at lower densities, were transported to coastal areas by wind-driven currents, resulting in elevated concentrations and subsequent bans on shellfish harvesting [41]. Hyung et al. [39] and Baek et al. [41] also reported that in the eastern waters of Geoje Island, A. catenella populations appeared at high densities between February and April, coinciding with elevated nutrient levels. During periods of strong easterly winds, populations from the Nakdong River estuary and offshore waters were accumulated toward the coast. Thus, the mass proliferation of A. catenella in the eastern coastal waters of Geoje Island is likely driven not only by optimal water temperatures (14–18 °C) for population growth but also by the influence of currents and wind-driven surface water transport, which concentrate populations in specific areas. Meanwhile, Anderson et al. [42] reported that both physical and biological factors play a significant role in the proliferation and dispersal of Alexandrium species. The findings of this study further highlight the strong relationship between these physical environmental factors and population dynamics.
Dinophysis acuminata is a mixotrophic dinoflagellate known to produce diarrhetic shellfish poisoning (DSP) toxins, with relatively high densities observed in June 2022 and May 2023. A survey by Kim et al. [43] along the southern coast of Korea in 2021 analyzed the spatial and seasonal distribution of 12 lipophilic marine biotoxins (LMTs) in phytoplankton and mussels. The results showed that PTX-2 and homo-YTX reached a maximum concentration of 2300 ng g−1 (wet weight) in phytoplankton in May, while mussels primarily contained homo-YTX and YTX, with the highest concentration of 1300 ng g−1 (wet weight) detected in July. These findings suggest that D. acuminata and G. spinifera may become seasonally dominant between May and June. The average water temperature from April to June ranged from 16 to 22° C, which is within the optimal range for D. acuminata growth. Previous studies, including those by Fiorendino et al. [44] and Kamiyama and Suzuki [45], have shown that D. acuminata achieves higher growth rates and maximum toxin production at temperatures between 18 and 24 °C. In contrast, G. spinifera is a photophilic organism that thrives in a broader temperature range of 5 to 25 °C. Reports by Vishal et al. [46] and Boivin-Rioux et al. [47] indicate that both species also appeared at high densities during the spring and early summer. Additionally, Kim et al. [43] confirmed a significant correlation between G. spinifera density and YTX concentrations in phytoplankton with a p-value of less than 0.01. These findings indicate that D. acuminata and G. spinifera, which produce PTX-2, homo-YTX, and YTX, are likely to proliferate along the southern coast of Korea between April and June. This increases the risk of toxin accumulation, emphasizing the need for continuous monitoring.
Pseudo-nitzschia is a potentially toxic diatom genus with a global distribution. Some species are capable of producing domoic acid (DA), an amnesic shellfish toxin [48]. This toxin has been linked to food poisoning, with documented cases of human fatalities [47,48] and mass mortality events in marine mammals [49,50]. Such poisoning incidents frequently occur following blooms of Pseudo-nitzschia species. In this study, P. delicatissima exhibited high cell densities in May at Station 1, a site strongly influenced by the Nakdong River estuary, whereas in August and September, elevated densities were observed at Station 3, an inner bay location. Notably, despite the large-scale bloom of P. delicatissima during summer, rapid nutrient depletion in the inner bay led to low concentrations of silicate and phosphate at Station 3, even under persistently low salinity conditions resulting from freshwater input due to rainfall. Based on the PCA, P. delicatissima showed a positive correlation with water temperature and a negative correlation with salinity, suggesting that freshwater influx from rainfall supplies nutrients that promote the rapid proliferation of this species, ultimately resulting in lower nutrient concentrations in the inner bay. Similarly, Lifanchuk et al. [51] analyzed long-term field data collected in the Black Sea from 1948 to 2020 and reported that P. delicatissima exhibited peak cell densities during summer and autumn, while remaining at lower levels in winter (February–March). Additionally, previous studies have suggested that elevated nitrogen (N) concentrations combined with low dissolved silicate (DSi) levels (N–DSi ratio < 2.0 µM) may promote the growth of P. delicatissima [52]. Furthermore, national monitoring conducted along the southern coast of Korea confirmed that amnesic shellfish poisoning (ASP) toxins were not detected, indicating that even when P. delicatissima reaches high population densities, toxin production may not necessarily occur. Overall, our findings suggest that P. delicatissima does not thrive under the low-temperature conditions of winter and spring but proliferates effectively when nutrient availability increases during the high-temperature period in summer.
Understanding shifts in dominant phytoplankton groups in response to environmental variations is crucial for elucidating the mechanisms governing phytoplankton bloom dynamics, which are closely tied to species- and group-specific ecological and physiological traits. In this study, no distinct seasonal variations in major phytoplankton groups were observed in the eastern coastal waters of Jinhae Bay. However, diatoms were generally dominant in spring, summer, and autumn, particularly during the rainy season, with Chaetoceros spp., Pseudo-nitzschia spp., and Skeletonema spp. exhibiting high cell densities. Notably, Skeletonema spp. showed a marked increase following summer rainfall events. In contrast, cryptophytes did not exhibit any clear seasonal patterns. Dinoflagellates were relatively abundant from May to September, with A. sanguinea demonstrating strong dominance even in winter. These findings suggest a seasonal succession from diatoms to dinoflagellates, driven by region-specific environmental factors. In particular, the substantial increase in diatom abundance following nutrient influx from rainfall highlights the significant role of external nutrient loading in shaping phytoplankton community composition. This study provides valuable insights into seasonal phytoplankton dynamics, contributing to a deeper understanding of planktonic food web structures in coastal ecosystems. Given that Jinhae Bay is a key site for bivalve aquaculture, fluctuations in phytoplankton communities directly affect filter-feeding organisms. The proliferation of toxin-producing microalgae poses potential risks to both human health and marine ecosystems. Therefore, continuous monitoring of harmful algal species is essential for mitigating ecological and economic risks and ensuring the sustainable management of aquaculture in the region.

5. Summaries and Conclusions

The seasonal distribution of harmful species, such as Margalefidinium and Akashiwo, along with toxin-producing genera Alexandrium, Dinophysis, Gonyaulax, and Pseudo-nitzschia, was analyzed in relation to environmental factors in the eastern coastal waters of Jinhae Bay. In addition, we analyzed the influence of coastal environmental factors, such as Nakdong River discharge, tidal forces, and water mass mixing, on seasonal microalgal occurrence and examined how these variations shape differences in phytoplankton bloom dynamics based on nutrient availability. Nitrate + nitrite, phosphate, and silicate introduced from the Nakdong River were mixed by tidal and current activity, spreading into the eastern coastal waters of Jinhae Bay. Due to the semi-enclosed nature of the bay, these nutrients remained in the system for a certain period, leading to recurrent phytoplankton blooms. During the rainy season, the intensity of phytoplankton blooms increased when freshwater inflow from the Nakdong River and water mass mixing coincided with changes in marine environmental conditions. In contrast, during the non-rainy season, vertical mixing played a crucial role in maintaining nutrient availability in the euphotic zone. In winter, the growth of most microalgae slowed due to low water temperatures. Our results thus indicate that the interplay between bay-specific oceanographic conditions, shaped by tidal and current dynamics, and riverine nutrient inputs is a key driver of phytoplankton blooms, with seasonal variations in these factors leading to distinct bloom patterns throughout the year. Our findings provide insights into the seasonal variability of harmful/toxic microalgae in the eastern area of Jinhae Bay, which is strongly influenced by the Nakdong River and the Tsushima Current along the southern coast of Korea. These results hold significant value as fundamental data for effective coastal ecosystem management and conservation in various coastal waters of the Korean Peninsula.

Author Contributions

Conceptualization, S.H.B.; Methodology, S.H.B.; Formal analysis, Y.K.L.; Investigation, S.H.B., C.H.L., M.K. and Y.K.L.; Writing—original draft, S.H.B.; Writing—review & editing, Y.K.L.; Visualization, C.H.L.; Project administration, S.H.; Funding acquisition, S.H. All authors have read and agreed to the published version of the manuscript.

Funding

This research was supported by grant 20163MFDS641 from the Ministry of Food and Drug Safety and by “Technical development for tracking microplastic migration using marine protist-vehicle” of the National Research Foundation of Korea (NRF) grant funded by the Ministry of Science and ICT (RS-2024–00336054), Republic of Korea. This research was also supported by a grant from the Korea Institute of Ocean Science and Technology (grant number: PEA0305).

Data Availability Statement

The raw data supporting the conclusions of this article will be made available by the authors, without undue reservation, to any qualified researcher.

Acknowledgments

Paralytic Shellfish Poisoning (PSP) data used in this paper were provided by the National Institute of Fisheries Science (NIFS) Shellfish Toxin Bulletin, Korea.

Conflicts of Interest

The authors declare that they have no known competing financial interests or personal relationships that could have appeared to influence the work reported in this paper.

References

  1. Kremp, A.; Godhe, A.; Egardt, J.; Dupont, S.; Suikkanen, S.; Casabianca, S.; Penna, A. Intraspecific variability in the response of bloom-forming marine microalgae to changed climate conditions. Ecol. Evol. 2012, 2, 1195–1207. [Google Scholar] [PubMed]
  2. Litchman, E. Understanding and predicting harmful algal blooms in a changing climate: A trait-based framework. Limnol. Oceanogr. Lett. 2023, 8, 229–246. [Google Scholar]
  3. Baek, S.H.; Kim, D.; Son, M.; Yun, S.M.; Kim, Y.O. Seasonal distribution of phytoplankton assemblages and nutrient-enriched bioassays as indicators of nutrient limitation of phytoplankton growth in Gwangyang Bay, Korea. Estuar. Coast. Shelf Sci. 2015, 163, 265–278. [Google Scholar]
  4. Kim, D.; Ji, R.; Feng, Z.; Jang, J.; Lee, D.I.; Lee, W.C.; Kang, C.K. Estuarine dam water discharge enhances summertime primary productivity near the southwestern Korean coast. Mar. Pollut. Bull. 2023, 191, 114971. [Google Scholar]
  5. Baek, S.H.; Kim, D.; Kim, Y.O.; Son, M.; Kim, Y.-J.; Lee, M.; Park, B.S. Seasonal changes in abiotic environmental conditions in the Busan coastal region (South Korea) due to the Nakdong River in 2013 and effect of these changes on phytoplankton communities. Cont. Shelf Res. 2019, 175, 116–126. [Google Scholar]
  6. de Souza, K.B.; Jephson, T.; Hasper, T.B.; Carlsson, P. Species-specific dinoflagellate vertical distribution in temperature-stratified waters. Mar. Biol. 2014, 161, 1725–1734. [Google Scholar]
  7. Hall, N.S.; Paerl, H.W. Vertical migration patterns of phytoflagellates in relation to light and nutrient availability in a shallow microtidal estuary. Mar. Ecol. Prog. Ser. 2011, 425, 1–19. [Google Scholar]
  8. Zahir, M.; Su, Y.; Shahzad, M.I.; Ayub, G.; Rahman, S.U.; Ijaz, J. A review on monitoring, forecasting, and early warning of harmful algal bloom. Aquaculture 2024, 593, 741351. [Google Scholar]
  9. Lim, Y.K.; Hong, S.; Lee, C.H.; Kim, M.; Baek, S.H. Influence of Region-Specific Marine Environments on Phytoplankton and Bacterial Communities in the Korean Coastal Waters in Winter 2021. Ocean Sci. J. 2024, 59, 48. [Google Scholar]
  10. Cotrim da Cunha, L.; Buitenhuis, E.T.; Le Quéré, C.; Giraud, X.; Ludwig, W. Potential impact of changes in river nutrient supply on global ocean biogeochemistry. Glob. Biogeochem. Cycles 2007, 21, GB4007. [Google Scholar] [CrossRef]
  11. Jäger, C.G.; Diehl, S.; Schmidt, G.M. Influence of water-column depth and mixing on phytoplankton biomass, community composition, and nutrients. Limnol. Oceanogr. 2008, 53, 2361–2373. [Google Scholar]
  12. Baek, S.H.; Shin, H.H.; Choi, H.-W.; Shimode, S.; Hwang, O.M.; Shin, K.; Kim, Y.-O. Ecological behavior of the dinoflagellate Ceratium furca in Jangmok harbor of Jinhae Bay, Korea. J. Plankton Res. 2011, 33, 1842–1846. [Google Scholar]
  13. Baek, S.H.; Lee, M.; Park, B.S.; Lim, Y.K. Variation in phytoplankton community due to an autumn typhoon and winter water turbulence in southern Korean coastal waters. Sustainability 2020, 12, 2781. [Google Scholar] [CrossRef]
  14. Yoon, J.N.; Lim, Y.K.; Hong, S.; Baek, S.H. Use of mesocosm and field studies to assess the effects of nutrient levels on phytoplankton population dynamics in Korean coastal waters. Front. Mar. Sci. 2024, 11, 1253708–1253725. [Google Scholar]
  15. Sournia, A. Phytoplankton Manual; UNESCO: Paris, France, 1978; ISBN 92-3-101572-9. [Google Scholar]
  16. Omura, T.; Lwataki, M.; Borja, V.; Takayama, H.; Fukuyo, Y. Marine Phytoplankton of the Western Pacific (Kouseisha Kouseikaku); Kouseisha Kouseikaku Co. Ltd.: Tokyo, Japan, 2012; p. 160. [Google Scholar]
  17. R Core Team. R: A Language and Environment for Statistical Computing; R Foundation for Statistical Computing: Vienna, Austria, 2020. [Google Scholar]
  18. Jeong, H.J.; Yoo, Y.D.; Kim, J.S.; Seong, K.A.; Kang, N.S.; Kim, T.H. Growth, feeding and ecological roles of the mixotrophic and heterotrophic dinoflagellates in marine planktonic food webs. Ocean Sci. J. 2010, 45, 65–91. [Google Scholar]
  19. Jang, P.; Shin, H.; Baek, S.; Jang, M.; Lee, T.; Shin, K. Nutrient distribution and effects on phytoplankton assemblages in the western Korea/Tsushima Strait. N. Z. J. Mar. Freshw. Res. 2013, 47, 21–37. [Google Scholar]
  20. Kim, J.H.; Lee, M.; Lim, Y.K.; Kim, Y.J.; Baek, S.H. Occurrence characteristics of harmful and non-harmful algal species related to coastal environments in the southern sea of Korea. Mar. Freshw. Res. 2019, 70, 794–806. [Google Scholar]
  21. Ma, Y.; Yin, W.; Huang, D.; Xuan, J.; He, Y.; Meng, Q.; Wei, Y.; Zhou, F.; Chen, J. Synoptic Cross-Shore Movements of Outer Salinity Fronts in China’s Changjiang River Plume. J. Phys. Oceanogr. 2024, 54, 2553–2578. [Google Scholar]
  22. Wagawa, T.; Igeta, Y.; Sakamoto, K.; Takeuchi, M.; Okuyama, S.; Abe, S.; Yabe, I. Freshwater spreading far offshore the Japanese coast. Sci. Rep. 2024, 14, 14508. [Google Scholar]
  23. Szewczyk, T.M.; Aleynik, D.; Davidson, K. Ensemble models improve near-term forecasts of harmful algal bloom and biotoxin risk. Harmful Algae 2025, 142, 102781. [Google Scholar]
  24. Gómez, F.; Richlen, M.L.; Anderson, D.M. Molecular characterization and morphology of Cochlodinium strangulatum, the type species of Cochlodinium, and Margalefidinium gen. nov. for C. polykrikoides and allied species (Gymnodiniales, Dinophyceae). Harmful Algae 2017, 63, 32–44. [Google Scholar] [CrossRef] [PubMed]
  25. Razali, R.M.; Mustapa, N.I.; NOORDIN, M.A.; Rahim, M.A.; Hii, K.S.; Lim, P.T.; Leaw, C.; Muhd-Farouk, H.; Yaacob, K.K.K. Report of a fish kill due to a dinoflagellate bloom in Perak and Penang, Malaysia. Asian Fish. Sci. 2022, 35, 257–268. [Google Scholar] [CrossRef]
  26. Lim, Y.K.; Baek, S.H.; Lee, M.; Kim, Y.O.; Choi, K.-H.; Kim, J.H. Phytoplankton composition associated with physical and chemical variables during summer in the southern sea of Korea: Implication of the succession of the two toxic dinoflagellates Cochlodinium (aka Margalefidinium) polykrikoides and Alexandrium affine. J. Exp. Mar. Biol. Ecol. 2019, 516, 51–66. [Google Scholar] [CrossRef]
  27. Baek, S.H.; Kim, Y.; Lee, M.; Ahn, C.-Y.; Cho, K.H.; Park, B.S. Potential cause of decrease in bloom events of the harmful dinoflagellate Cochlodinium polykrikoides in southern Korean coastal waters in 2016. Toxins 2020, 12, 390. [Google Scholar] [CrossRef] [PubMed]
  28. White, A.E.; Watkins-Brandt, K.S.; McKibben, S.M.; Wood, A.M.; Hunter, M.; Forster, Z.; Du, X.; Peterson, W.T. Large-scale bloom of Akashiwo sanguinea in the Northern California current system in 2009. Harmful Algae 2014, 37, 38–46. [Google Scholar]
  29. Jung, S.W.; Kang, J.; Park, J.S.; Joo, H.M.; Suh, S.-S.; Kang, D.; Lee, T.-K.; Kim, H.-J. Dynamic bacterial community response to Akashiwo sanguinea (Dinophyceae) bloom in indoor marine microcosms. Sci. Rep. 2021, 11, 6983. [Google Scholar]
  30. Du, X.; Peterson, W.; McCulloch, A.; Liu, G. An unusual bloom of the dinoflagellate Akashiwo sanguinea off the central Oregon, USA, coast in autumn 2009. Harmful Algae 2011, 10, 784–793. [Google Scholar] [CrossRef]
  31. Luo, Z.; Yang, W.; Leaw, C.P.; Pospelova, V.; Bilien, G.; Liow, G.R.; Lim, P.T.; Gu, H. Cryptic diversity within the harmful dinoflagellate Akashiwo sanguinea in coastal Chinese waters is related to differentiated ecological niches. Harmful Algae 2017, 66, 88–96. [Google Scholar] [CrossRef]
  32. Islabão, C.A.; Odebrecht, C. Influence of salinity on the growth of Akashiwo sanguinea and Prorocentrum micans (Dinophyta) under acclimated conditions and abrupt changes. Mar. Biol. Res. 2015, 11, 965–973. [Google Scholar]
  33. Lee, M.; Kang, Y.; Kim, D.; Hyun, B.; Baek, S.H. High and fine resolution of bloom dynamics using HPLC analysis in a semi-enclosed harbour. Estuar. Coast. Shelf Sci. 2024, 309, 108950. [Google Scholar]
  34. Hwang, O.-M.; Shin, K.-S.; Baek, S.-H.; Lee, W.-J.; Kim, S.-A.; Jang, M.-C. Annual variations in community structure of mesozooplankton by short-term sampling in Jangmok Harbor of Jinhae Bay. Ocean Polar Res. 2011, 33, 235–253. [Google Scholar]
  35. Choi, S.Y.; Jang, P.-G.; Cha, H.-G.; Hyun, B.; Lee, E.H.; Jeong, Y.S.; Shin, K.; Seo, M.H.; Soh, H.Y.; Youn, S.H. Dynamics of Noctiluca scintillans blooms: A 20-year study in Jangmok Bay, Korea. Sci. Total Environ. 2024, 947, 174592. [Google Scholar] [PubMed]
  36. Jang, M.-C.; Shin, K.; Lee, T.; Noh, I. Feeding selectivity of calanoid copepods on phytoplankton in Jangmok Bay, south coast of Korea. Ocean Sci. J. 2010, 45, 101–111. [Google Scholar]
  37. Han, M.-S.; Jeon, J.-K.; Kim, Y.-O. Occurrence of dinoflagellate Alexandrium tamarense, a causative organism of paralytic shellfish poisoning in Chinhae Bay, Korea. J. Plankton Res. 1992, 14, 1581–1592. [Google Scholar]
  38. Mok, J.-S.; Song, K.-C.; Lee, K.-J.; Kim, J.-H. Variation and profile of paralytic shellfish poisoning toxins in Jinhae bay, Korea. Fish. Aquat. Sci. 2013, 16, 137–142. [Google Scholar]
  39. Hyung, J.H.; Moon, S.J.; Kim, E.J.; Kim, D.W.; Park, J. Quantification of Alexandrium catenella (Group I) using sxtA4-based digital PCR for screening of paralytic shellfish toxins in Jinhae-Masan Bay, Korea. Mar. Pollut. Bull. 2024, 200, 116048. [Google Scholar]
  40. Franks, P.J.; Walstad, L.J. Phytoplankton patches at fronts: A model of formation and response to wind events. J. Mar. Res. 1997, 55, 1–29. [Google Scholar]
  41. Baek, S.H.; Choi, J.M.; Lee, M.; Park, B.S.; Zhang, Y.; Arakawa, O.; Takatani, T.; Jeon, J.-K.; Kim, Y.O. Change in paralytic shellfish toxins in the mussel Mytilus galloprovincialis depending on dynamics of harmful Alexandrium catenella (Group I) in the Geoje coast (South Korea) during bloom season. Toxins 2020, 12, 442. [Google Scholar] [CrossRef]
  42. Anderson, D.M.; Stock, C.A.; Keafer, B.A.; Nelson, A.B.; Thompson, B.; McGillicuddy Jr, D.J.; Keller, M.; Matrai, P.A.; Martin, J. Alexandrium fundyense cyst dynamics in the Gulf of Maine. Deep-Sea Res. Part II Top. Stud. Oceanogr. 2005, 52, 2522–2542. [Google Scholar]
  43. Kim, M.; Kim, S.-Y.; Lim, Y.K.; Baek, S.H.; Hong, S. Nationwide seasonal monitoring of lipophilic marine algal toxins in shellfish and causative microalgae along the coasts of South Korea. Mar. Pollut. Bull. 2024, 207, 116855. [Google Scholar]
  44. Fiorendino, J.M.; Smith, J.L.; Campbell, L. Growth response of Dinophysis, Mesodinium, and Teleaulax cultures to temperature, irradiance, and salinity. Harmful Algae 2020, 98, 101896. [Google Scholar] [PubMed]
  45. Kamiyama, T.; Suzuki, T. Production of dinophysistoxin-1 and pectenotoxin-2 by a culture of Dinophysis acuminata (Dinophyceae). Harmful Algae 2009, 8, 312–317. [Google Scholar]
  46. Vishal, C.R.; Parvathi, A.; Anil, P.; Mohammed Iqbal, P.M.; Muraleedharan, K.R.; Abdul Azeez, S.; Furtado, C.M. In situ measurements of bioluminescence response of Gonyaulax spinifera to various mechanical stimuli. Aquat. Ecol. 2021, 55, 437–451. [Google Scholar]
  47. Boivin-Rioux, A.; Starr, M.; Lavoie, D.; Chass, J.; Scarratt, M.; Perrie, W.; Long, Z.; Lavoie, D. Harmful algae and climate change on the Canadian East Coast: Exploring occurrence predictions of Dinophysis acuminata, D. norvegica, and Pseudo-nitzschia seriata. Harmful Algae 2022, 112, 102183. [Google Scholar]
  48. Bates, S.S.; Garrison, D.L.; Horner, R.A. Bloom dynamics and physiology of domoic-acid-producing Pseudo-nitzschia species. NATO ASI Ser. G Ecol. Sci. 1998, 41, 267–292. [Google Scholar]
  49. Kumar, K.P.; Kumar, S.P.; Nair, G.A. Risk assessment of the amnesic shellfish poison, domoic acid, on animals and humans. J. Environ. Biol. 2009, 30, 319–325. [Google Scholar]
  50. Scholin, C.A.; Gulland, F.; Doucette, G.J.; Benson, S.; Busman, M.; Chavez, F.P.; Cordaro, J.; DeLong, R.; De Vogelaere, A.; Harvey, J. Mortality of sea lions along the central California coast linked to a toxic diatom bloom. Nature 2000, 403, 80–84. [Google Scholar]
  51. Lifanchuk, A.V.; Mikaelyan, A.S.; Sergeeva, A.V.; Silkin, V.A. Seasonal dynamics and ecology of the Pseudo-nitzschia delicatissima group in the Black Sea. Reg. Stud. Mar. Sci. 2023, 68, 103249. [Google Scholar]
  52. Thorel, M.; Claquin, P.; Schapira, M.; Le Gendre, R.; Riou, P.; Goux, D.; Le Roy, B.; Raimbault, V.; Deton-Cabanillas, A.-F.; Bazin, P. Nutrient ratios influence variability in Pseudo-nitzschia species diversity and particulate domoic acid production in the Bay of Seine (France). Harmful Algae 2017, 68, 192–205. [Google Scholar]
Figure 1. (A) Major ocean currents influencing the study area, including the Tsushima Warm Current. (B) Study area map showing sampling stations (St. 1–4) in the eastern area of Jinhae Bay. (C,D) Hydrodynamic conditions: (C) high tide during the rainy season and (D) low tide during the dry season, illustrating inshore waters influenced by Nakdong River discharge (blue) and offshore waters influenced by the Tsushima Warm Current (red), based on the report by Baek et al. [13]. Black arrows indicate tidal vectors and their direction.
Jmse 13 00669 g001
Figure 2. Monthly and parameters at four sampling stations (St. 1–4) in the study area. The parameters include temperature (°C), salinity, dissolved oxygen (mg L−1), and pH. Different stations and seasons are represented by colors. The right panels show boxplots summarizing seasonal variations for each parameter with black dots representing outliers beyond 1.5 times the interquartile range (IQR). Seasonal divisions are as follows: winter (December–February), spring (March–May), summer (June–August), and autumn (September–November). Different letters above the boxplots indicate significant differences among seasons based on the Mann–Whitney U-test.
Jmse 13 00669 g002
Figure 3. Monthly precipitation (blue bars) and the discharge of the Nakdong River (red line and circle symbols) during the survey period.
Jmse 13 00669 g003
Figure 4. Monthly and seasonal variations in nutrient concentrations (nitrate + nitrite (µM), ammonium (µM), phosphate (µM), and silicate (µM)) at four sampling stations (St. 1–4) within the study area. Different stations and seasons are represented by colors. The right panels display boxplots summarizing the seasonal variations for each nutrient with black dots representing outliers beyond 1.5 times the interquartile range (IQR). Seasonal divisions are as follows: winter (December–February), spring (March–May), summer (June–August), and autumn (September–November). Different letters above the box plots indicate significant differences among seasons based on the Mann–Whitney U-test.
Jmse 13 00669 g004
Figure 5. Relationships between salinity and nutrient concentrations (DIN [Dissolved inorganic nitrogen; nitrate + nitrite + ammonium], nitrate + nitrite, ammonium, silicate, and phosphate) across different seasons in the study area are shown. Different colors and symbols represent the seasons: winter (blue diamonds), spring (green circles), summer (red squares), and autumn (brown triangles). Regression lines for each season are displayed, along with their corresponding equations and R2 values. Dashed lines indicate seasonal trends in nutrient variation relative to salinity.
Jmse 13 00669 g005
Figure 6. Monthly and seasonal variations in phytoplankton composition at four sampling stations (St. 1–4) in the eastern part of Jinhae Bay. (A) Temporal variations in the relative abundance of major phytoplankton groups (Bacillariophyceae, Dinophyceae, Raphidophyceae, Dictyochophyceae, Cryptophyceae, and others) and total cell abundance. (B) Ternary plot showing the distribution of the three dominant phytoplankton groups across different stations and seasons.
Jmse 13 00669 g006
Figure 7. Monthly variations in phytoplankton composition at each station in the eastern waters of Jinhae Bay. The color of the histogram indicates the major phytoplankton groups: Bacillariophyceae (blue), Dinophyceae (red), Dictyochophyceae (purple), Cryptophyceae (green), Euglenophyceae (yellow), and Raphidophyceae (pink).
Jmse 13 00669 g007
Figure 8. Monthly variations in the cell abundance of harmful and toxin-producing microalgal species at four sampling stations (St. 1–4) in the eastern area of Jinhae Bay. We categorized the harmful algae Akashiwo sanguinea and Margalefidinium polykrikoides, as well as toxin-causing species such as Alexandrium catenella, Dinophysis acuminata, Gonyaulax spinifera, and Pseudo-nitzschia delicatissima. Bars represent the cell abundance (×104 cells L−1) at each station.
Jmse 13 00669 g008
Figure 9. Multivariate analysis of environmental factors and harmful and toxic algal species in the eastern area of Jinhae Bay. (A,B) Bray–Curtis similarity analysis coupled with principal component analysis (PCA) biplots, illustrating variations by station (A) and season (B). Environmental variables (blue) and harmful algal species (red) are represented as vectors. (C) Results of the Mantel test show correlations between environmental variables and harmful algal species. Pearson’s correlation coefficients are indicated by the intensity of the color, with significant relationships marked by asterisks (* p < 0.05, ** p < 0.01, *** p < 0.001).
Jmse 13 00669 g009
Figure 10. Similarity analysis and non-metric multidimensional scaling (nMDS) ordination plot of samples based on environmental factors and phytoplankton community data, with colors representing seasons and different shapes for stations.
Jmse 13 00669 g010
Figure 11. Spatial and temporal distribution of paralytic shellfish poisoning (PSP) toxin detections from February to December 2022 and April to June 2023 in the study area. Black dots represent sampling stations, with blue circles indicating PSP toxin levels below the regulatory standard (<0.8 mg/kg) and red circles indicating above-standard detections (>0.8 mg/kg). Shaded areas highlight PSP occurrence zones (blue) and regions under shellfish collection bans (red). Data from the National Institute of Fisheries Science (NIFS) Shellfish Toxin Bulletin were used.
Jmse 13 00669 g011
Disclaimer/Publisher’s Note: The statements, opinions and data contained in all publications are solely those of the individual author(s) and contributor(s) and not of MDPI and/or the editor(s). MDPI and/or the editor(s) disclaim responsibility for any injury to people or property resulting from any ideas, methods, instructions or products referred to in the content.

