Article

Large Eddy Simulation of Hydrodynamic Characteristics of Hydrofoils Based on Blow Suction Combined Jet

1
State Key Laboratory of Hydrodynamics, China Ship Scientific Research Centre, Wuxi 214082, China
2
Taihu Laboratory of Deepsea Technological Science, Wuxi 214082, China
3
National Key Laboratory of Hydrodynamics, Wuxi 214082, China
*
Author to whom correspondence should be addressed.
J. Mar. Sci. Eng. 2025, 13(4), 651; https://doi.org/10.3390/jmse13040651
Submission received: 24 February 2025 / Revised: 18 March 2025 / Accepted: 24 March 2025 / Published: 25 March 2025
(This article belongs to the Section Ocean Engineering)

Abstract

:
A unique flow control approach, blow suction combined jet (BSCJ), was presented to enhance the hydrodynamic performance of hydrofoils without the need of external energy resources. Utilizing the three-dimensional (3D) NACA0015 (National Advisory Committee for Aeronautics, NACA) foil as a case study, the orthogonal design methodology is employed to enhance the design of geometric and flow parameters, including the suction/blow point and the jet momentum coefficient. The fluid dynamics of the BSCJ foil at various angles of attack were numerically assessed using the large eddy simulation (LES) approach. The flow structures, encompassing vortex formations, pressure coefficients, and the impact of boundary layer velocity, were presented and evaluated to elucidate the control mechanism and influence of BSCJ. The simulation results indicate that the BSCJ primarily enhances the separation point of the rear wing surface by eliminating low-momentum fluid from the hydrofoil’s suction surface, thereby substantially augmenting the pressure differential across the hydrofoil and ultimately enhancing its hydrodynamic performance. The jet momentum coefficient is the primary determinant influencing the hydrodynamic performance of the hydrofoil, with best conditions attained when the suction slot is positioned at 0.25 C from the leading edge, the blowing slot at 0 C from the trailing edge, and the jet momentum coefficient is 0.1. The conclusions derived from the current study can offer theoretical advice for the future application of the BSCJ approach in underwater vehicles.

1. Introduction

The maneuverability of a submarine pertains to its capacity to sustain or alter its speed, orientation, direction, depth, and other motion characteristics via its control mechanisms. All submarines primarily depend on control surfaces to execute maneuvers [1]. The control surface typically consists of four hydrofoils that regulate the submarine’s navigation state by altering the rudder angle or the angle of attack of the hydrofoils. As competition for marine resources intensifies, there are elevated demands for the operability of submarines. To expedite the submarine’s swift maneuvering, it must execute significant rudder angles for rapid turns. As the rudder angle increases, the substantial local attack angle renders the rudder surface very susceptible to stalling. The stall phenomena denote the condition in which the rudder force ceases to increase upon reaching a specific rudder angle. Currently, the leading or trailing edge of the rudder produces separation vortices, resulting in substantial vibrations within the rudder structure and a marked decrease in rudder efficiency, thereby complicating the control of depth orientation and stability of the submarine’s attitude angle [2]. Conversely, the formation of distinct vortices on the rudder surface deteriorates the flow field quality of the propeller’s inlet section and diminishes the propeller’s propulsion efficiency [3,4]. Consequently, mitigating flow separation and enhancing the stall phenomena has emerged as an urgent issue that requires resolution.
Currently, researchers, both domestically and internationally, have examined numerous flow control techniques to enhance the hydrodynamic efficiency of foils. Based on the necessity for external energy input, it can be categorized into passive control and active control [5,6]. Passive control necessitates no energy input [7], hence enhancing the hydrodynamic performance of the foil through human modification of the airfoil surface. Common representative technologies encompass vortex generators, serrated airfoils, Gurney flaps, and micro-grooves, among others [8,9,10,11,12]. The benefit of passive control technology is its independence from external energy sources, together with its comparatively uncomplicated form and structure. Nonetheless, its deficiencies are also more conspicuous. The application scope is limited, and the adaptability is inadequate [13]. In contrast to passive control, active control significantly enhances the hydrodynamic performance of the foil with reduced external energy input. The blow suction combined jet (BSCJ), as a prevalent active control method, modifies the fluid momentum distribution on the airfoil surface and enhances its resistance to reverse pressure fluid via blow/suction mechanisms, thereby mitigating or preventing flow separation [14,15].
Currently, the majority of research on combined blowing/suction jets is concentrated on enhancing the aerodynamic efficiency of foils. Aziz [16] implemented consistent suction by creating an aperture in the head of the wind turbine blade. The findings indicated that implementing suction techniques might substantially enhance the pressure differential on the wind turbine blade’s surface, thereby augmenting its lift coefficient and energy capture efficiency. Qiang [17] conducted numerical simulations on an OA213 (Office National Recherché Aerospatiale’s 213) airfoil utilizing combined jet technology for blowing and suction. The calculation findings indicate that the best active control efficacy is attained when the blowing/suction combined jet arrangement points align with the flow separation points of the OA213 airfoil. Müller [18] investigated the impact of a blowing/suction mixed jet device on the aerodynamic performance of the NACA0018 airfoil in a low-speed wind tunnel. The experimental findings indicate that for medium Reynolds numbers (1.5 × 10⁵ to 5.0 × 10⁵), the lift coefficient can be enhanced by over 25% with the implementation of combined blowing and suction jet active control strategies. Wahidi [19] examined the LA2573 (Liebeck Airfoil 2573) airfoil, investigating the impact of an active control strategy utilizing blowing/suction combination jets on the reduction of the airfoil’s resistance characteristics at short angles of attack (0°~6°) in a wind tunnel. The experimental findings indicate that the suction mechanism can significantly postpone flow separation on the airfoil surface, resulting in a resistance reduction of 14% to 24%. Sun et al. [20] focused on the NACA0021 airfoil and determined the optimal parameters for the suction/blowing combined jet scheme, including the ideal suction/blowing position and flow rates, by employing the three-factor orthogonal design methodology.
The aforementioned research has conclusively demonstrated the efficacy of a combined blowing/suction jet in enhancing the flow separation of an airfoil from both theoretical and experimental perspectives. Nevertheless, the majority of study subjects concentrate on the aerodynamic efficacy of airfoils, and it remains uncertain if the integration of blowing and suction jets enhances the hydrodynamic performance of airfoils. Furthermore, owing to constraints in processing resources, the majority of contemporary research is concentrated on two-dimensional airfoils. In actual engineering applications, turbine blades or the control surfaces of airplanes utilize three-dimensional hydrofoils. This work examined the three-dimensional NACA0015 airfoil and used large eddy simulation numerical methods to analyze the impact of active control measures, including blowing and suction jets, on its hydrodynamic performance. The internal mechanism of the blowing and suction jet in enhancing the hydrodynamic performance of hydrofoils is elucidated through detailed flow field numerical simulation. The findings of this study can offer a theoretical foundation for the implementation of blowing suction jets in underwater vehicles. The structure of this article is as follows: Section 2 delineates the research subject, succeeded by the numerical methodology and validation in Section 3. The influence of BSCJ on fluid dynamics and flow structures of the hydrofoil will be articulated and examined in Section 4. Section 5 delineates the conclusions.

2. Research Object

Figure 1 illustrates that the computational model presented in this study is a three-dimensional NACA0015 hydrofoil, with the chord length defined as the characteristic length (C = 1.0 m) and the ratio of span length (B) to chord length (C) is B/C = 1.0. This study presents the BSCJ device based on the NACA0015 foil. The suction (blue mark) and blowing (red mark) mechanisms are positioned on the suction surface and pressure surface of the foil, respectively. In Figure 1, Vs and Vb signify the suction and blowing velocities, respectively; Ls and Lb indicate the distances from the suction and blowing apparatus to the trailing edge of the foil; Ws and Wb represent the width of suction and blow port, respectively. Reference [21] suggests that the blowing and suction devices maintain identical flow rates, with their respective blowing and suction speeds adjusted to the same value.
The characteristics pertinent to the fluid dynamics of the hydrofoil are presented in Equations (1)–(4), where CL, CD and CP represent the lift force coefficient, drag force coefficient, and pressure force coefficient, respectively. L, D, and P denote the lift force, drag force, and pressure force of the hydrofoil, respectively. ζ represents the lift-to-drag ratio, whereas ρ denotes the fluid density and the value is set as 998.2 kg/m3.
C L = F L / ( 0.5 · ρ · V 2 · B · C )
  C D = F D / ( 0.5 · ρ · V 2 · B · C )
  ζ =     C D /   C D
C P = ( p p ) / ( 0.5 · ρ · V 2 · B · C )
The dimensionless coefficient K is established to quantify the jet strength. Using the suction device as an illustration, its definition is presented in Formula (5), where V represents the incoming flow velocity, ms denotes the mass flow, and Vs indicates the suction velocity.
K = m s V s 0.5 · ρ · V 2 · B · C     = ρ · V s · W s · B · V s 0.5 · ρ · V 2 · B · C       = 2 · C · W s · ( V s / V ) 2

3. Numerical Method

3.1. Governing Equation

The continuity equation and the momentum equation [22] are shown in Formulas (6) and (7), respectively, where u i ¯ denotes the mean value of velocity component, u i is the fluctuating value, ρ u i u j ¯ represents the Reynolds stress, and ν is the viscosity coefficient.
u i ¯ x i = 0 ,  
u i ¯ t + u i u j ¯ x j = 1 ρ p x i + x j ( ν u i ¯ x j u i u j ¯ ) ,  
In the current study, the finite volume method was adopted to discretize the Equations (6) and (7), while the SST (Shear Stress Transfer) K–ω model was employed to enclose the above governing equation according to its high precision in handling with the nonlinear eddy viscosities [23]. The classical SIMPLE (Semi-Implicit Method for Pressure-Linked Equations) algorithm was adopted to solve the pressure and velocity in Equation (6). The specific procedure is as follows: The first step is to assume an initial velocity field and pressure field. Secondly, solve the momentum equation. Based on the assumed pressure field, calculate the momentum equation of dissociation and dispersion to obtain the intermediate velocity field. Thirdly, construct the pressure correction equation. Substitute the intermediate velocity field into the continuity equation and derive the pressure correction equation. Fifthly, adjust the velocity and pressure to ensure convergence. The first-order implicit method and second-order upwind scheme are adopted to solve the time term and convection term, respectively.

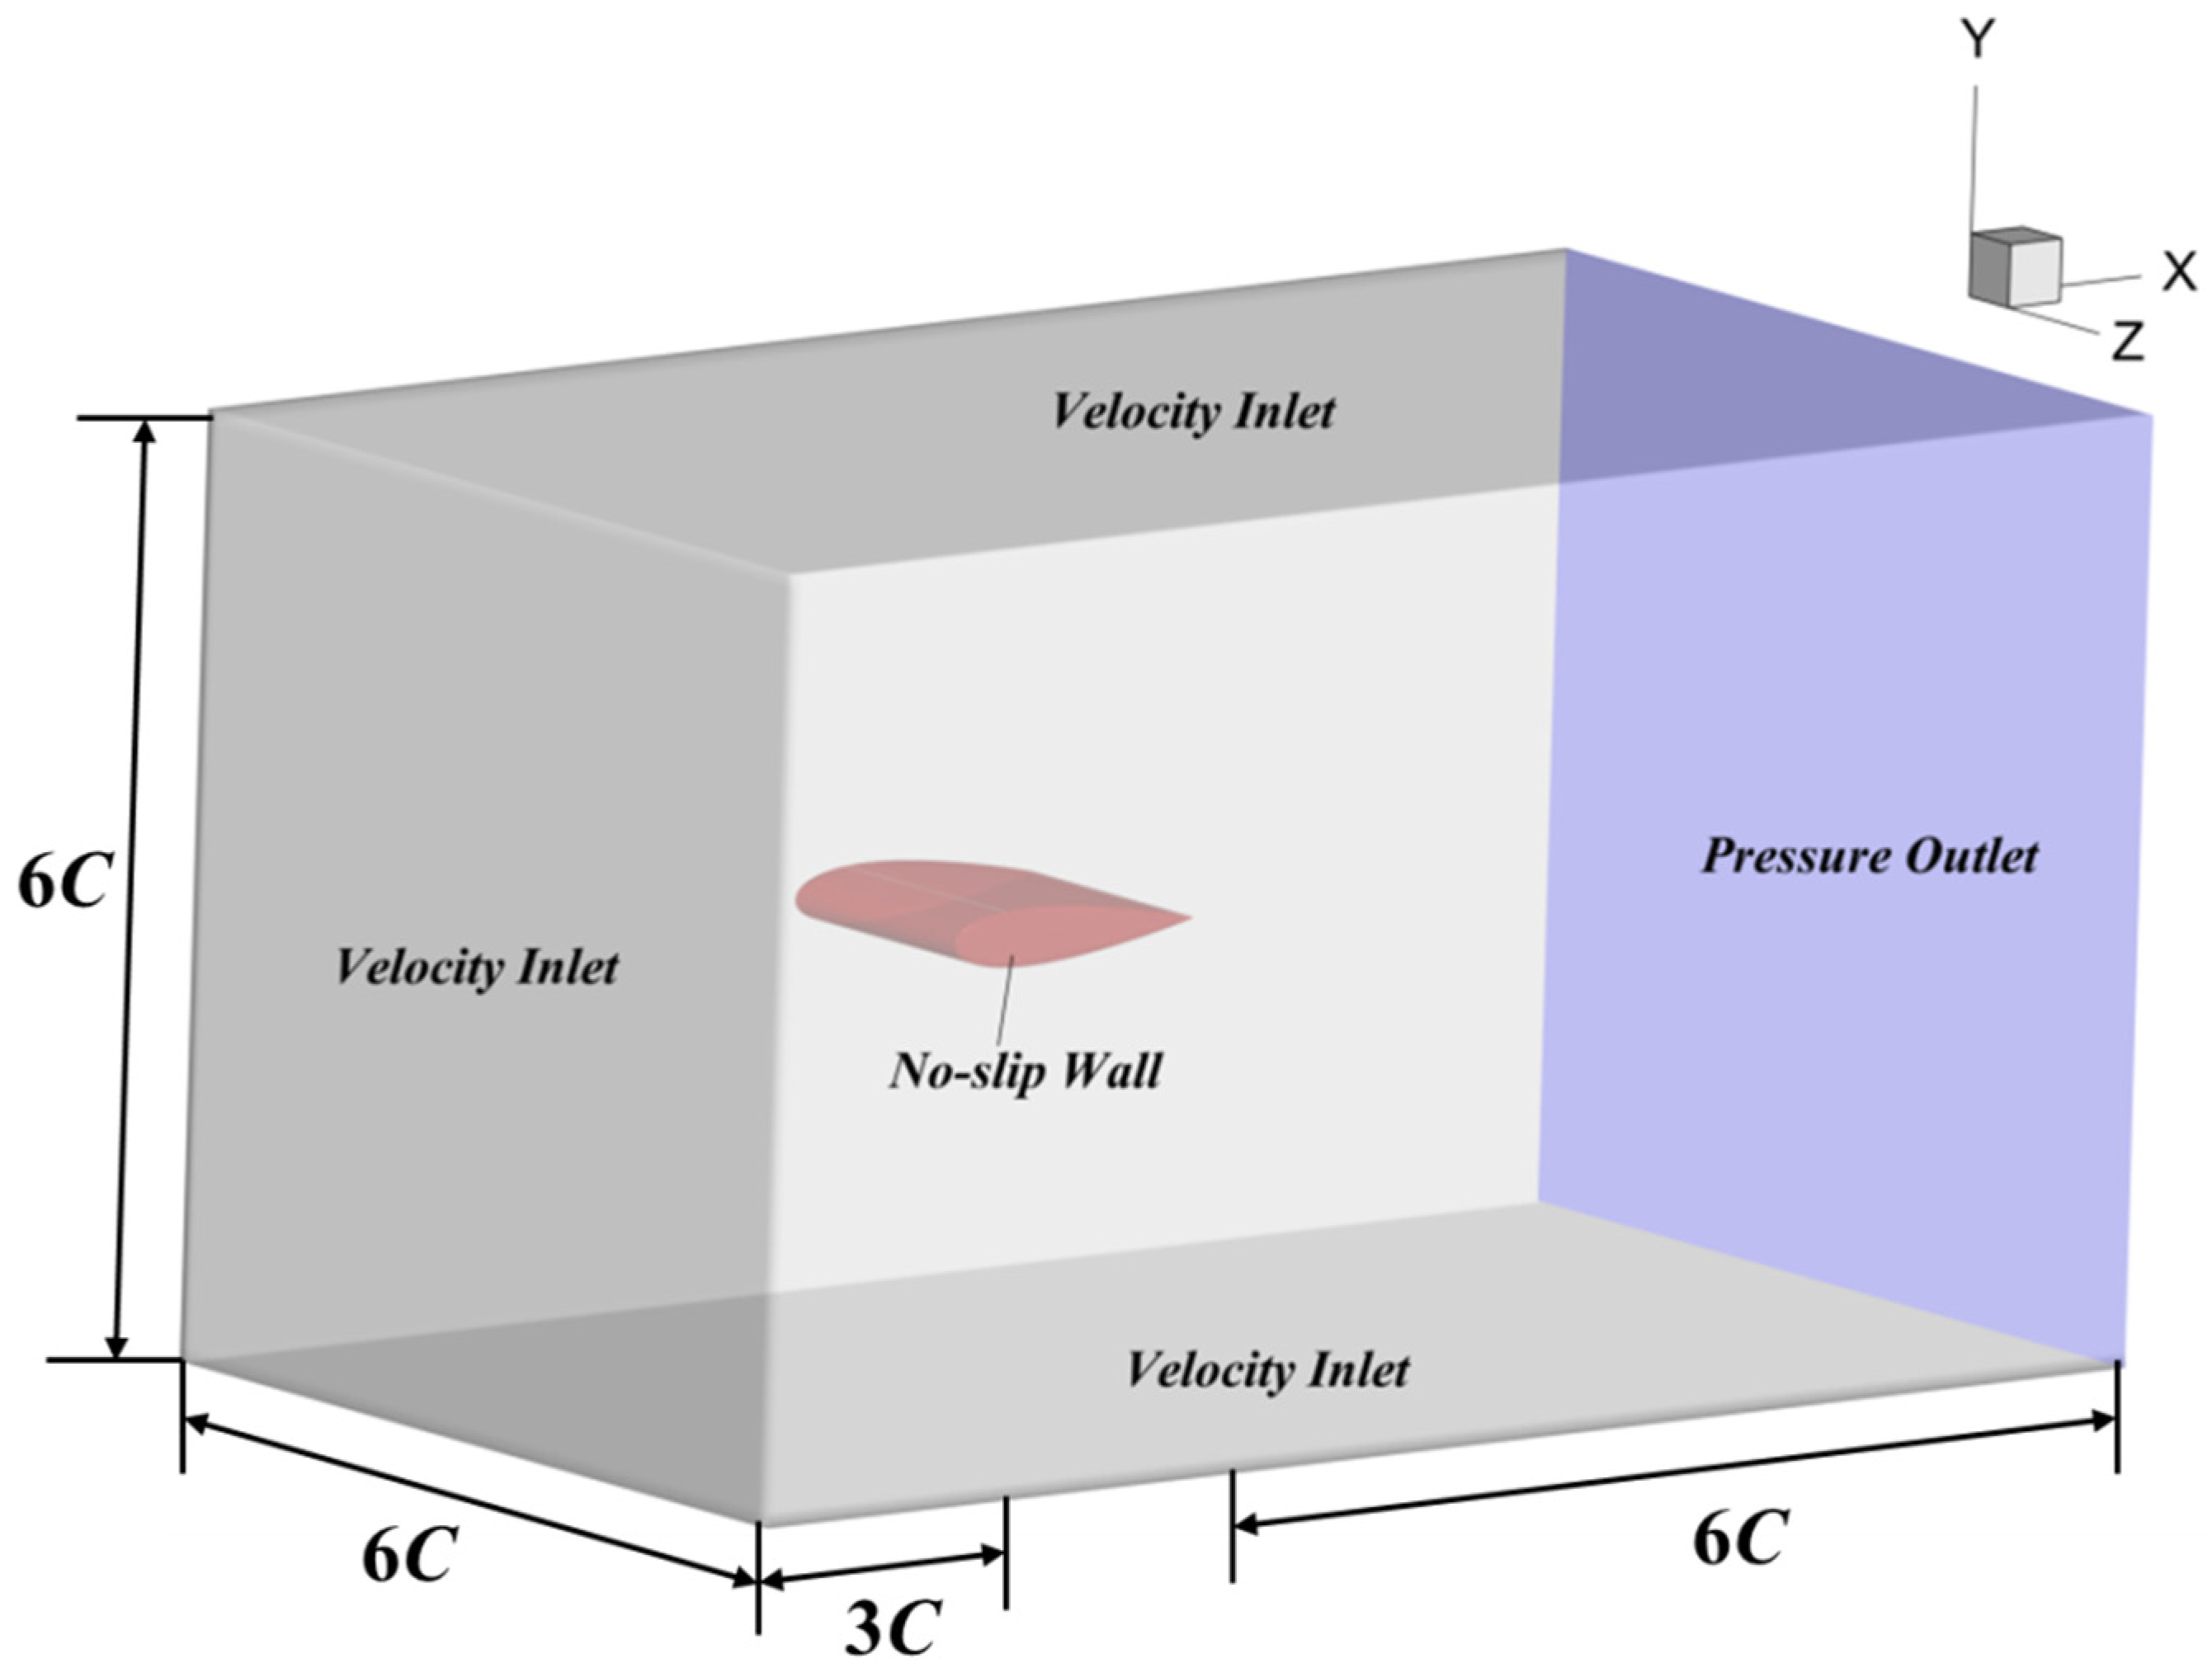
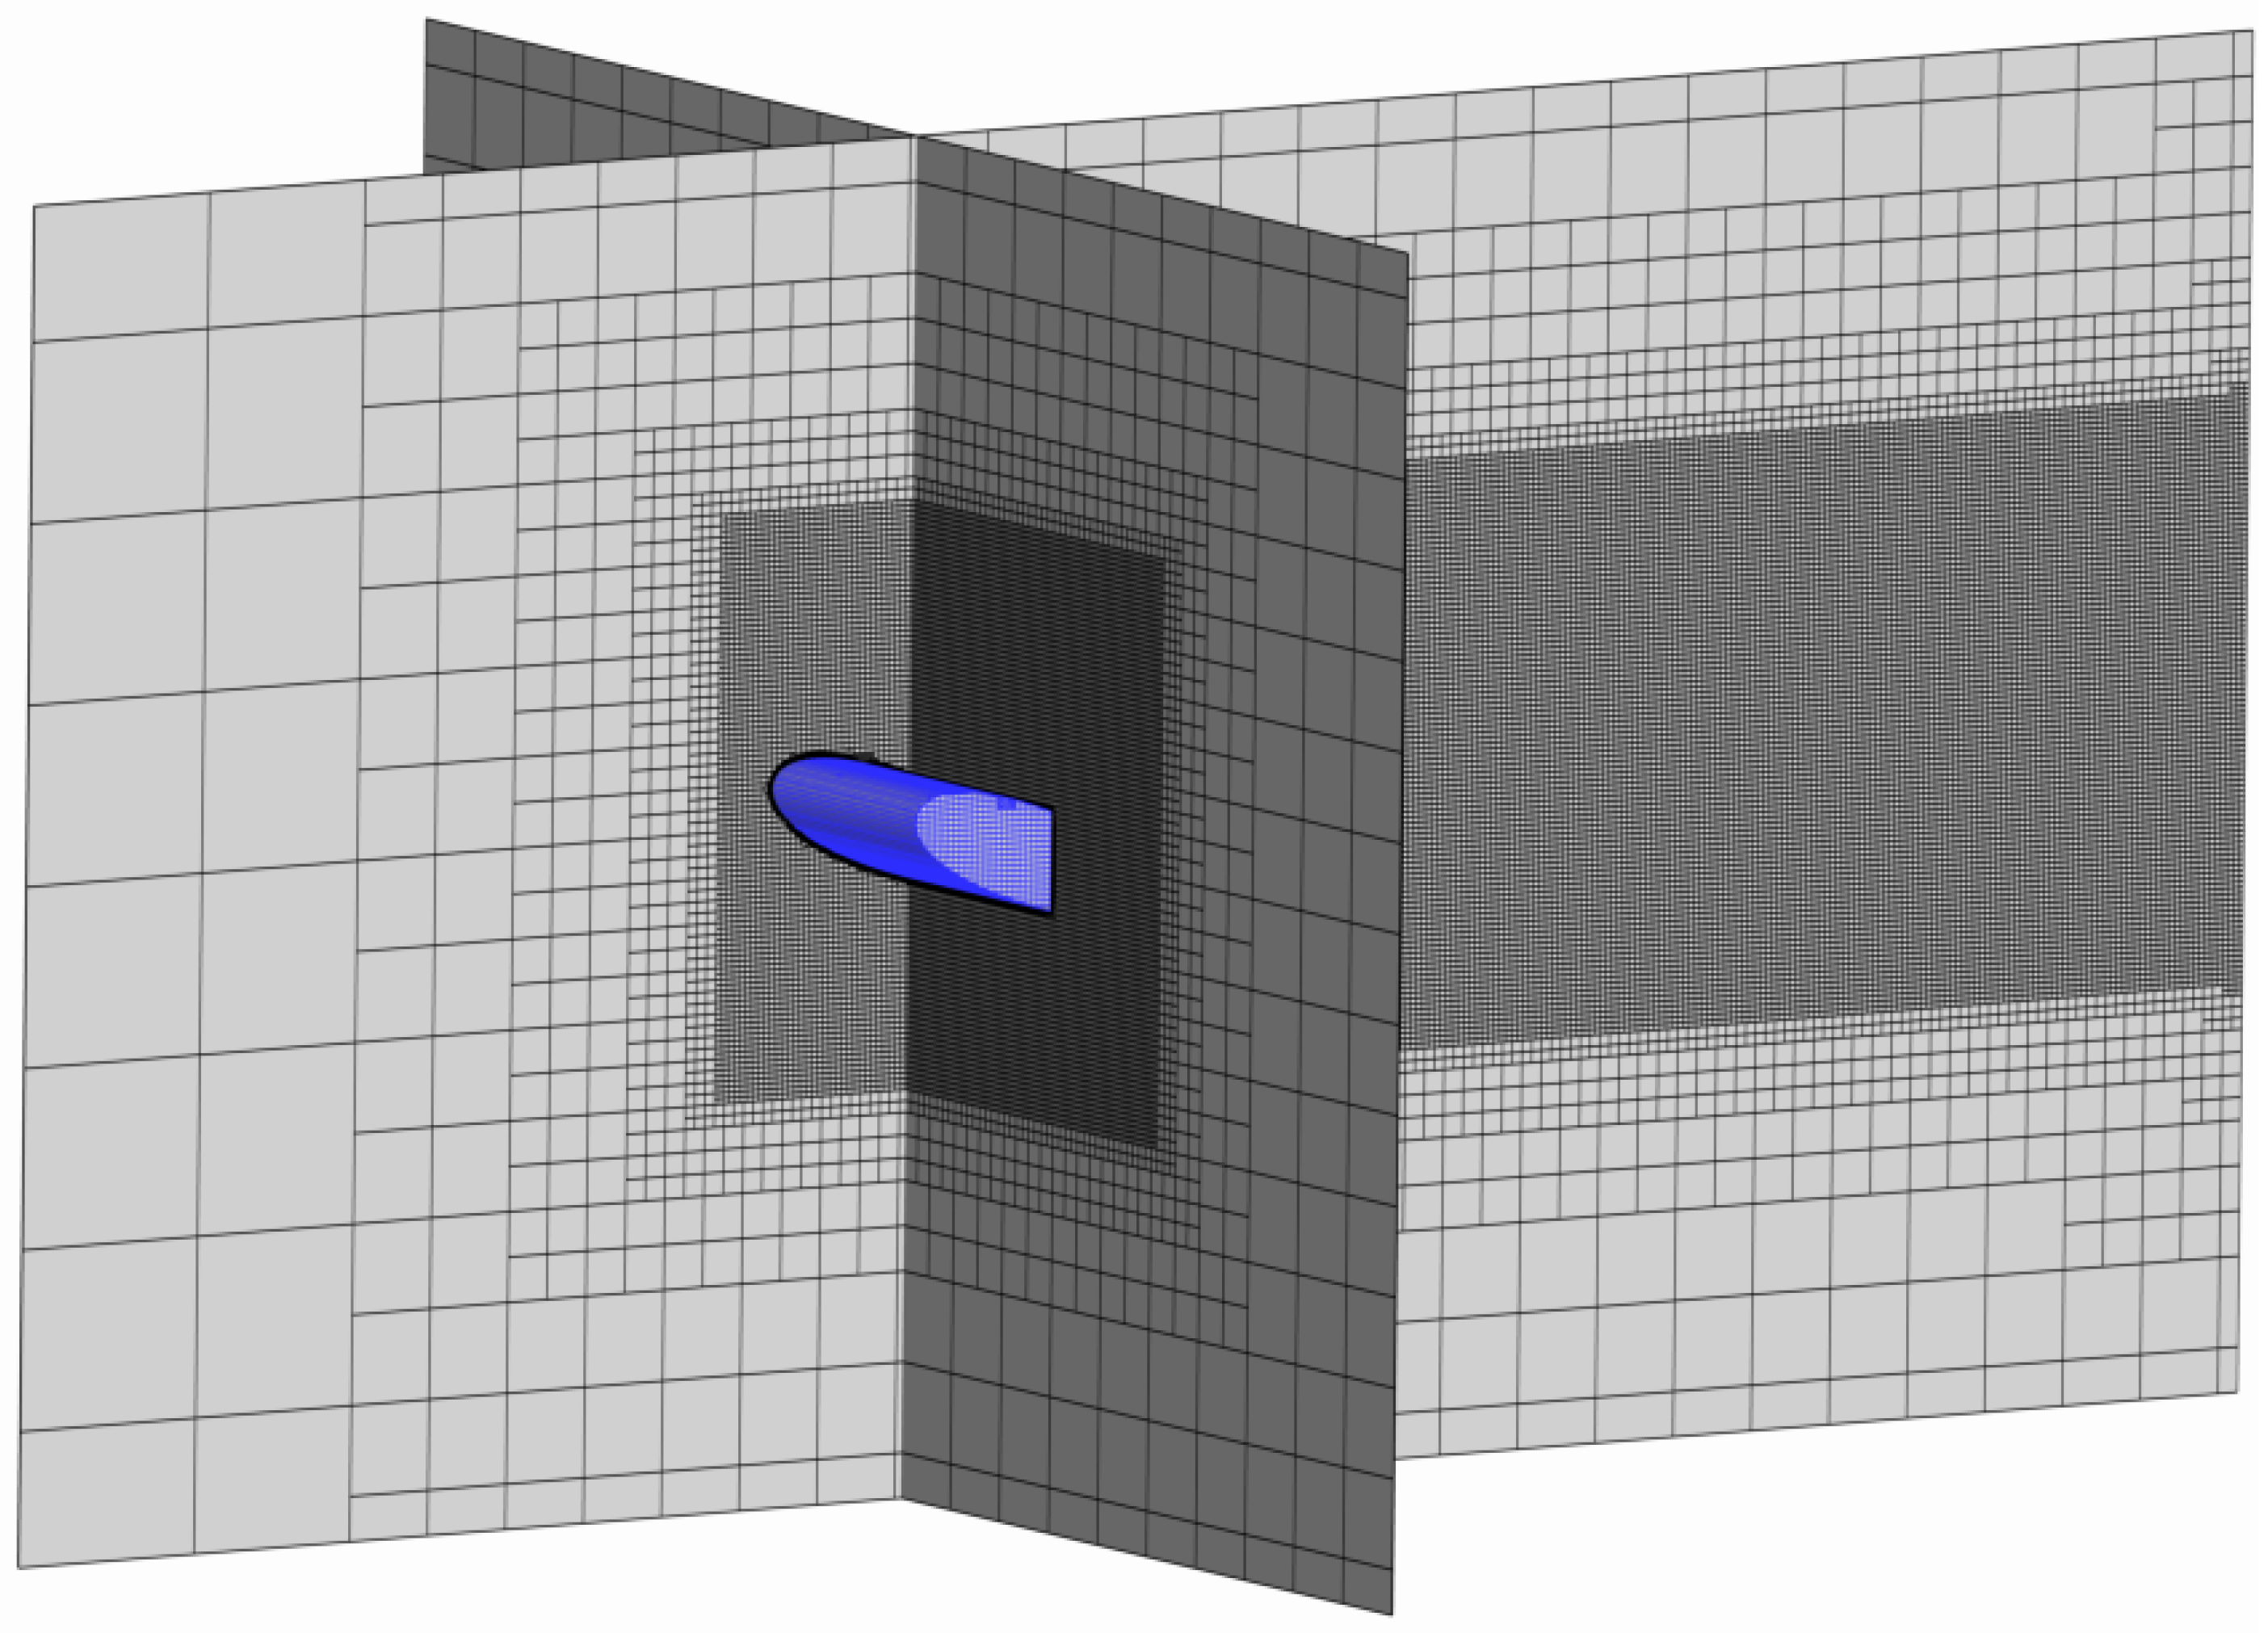
3.2. Computation Domain and Grid

This paper utilized a cuboid-shaped computation domain, as illustrated in Figure 2, with the following principal dimensions: (length, width, height) = (10 C, 7 C, 6 C). Concerning the boundary conditions, the right border of the calculation domain is designated as the pressure outlet condition, while the remaining five surfaces are established as velocity inlet conditions, with an incoming flow velocity of 1.028 m/s. The corresponding Reynolds number is 1.0 × 10⁶. The hydrofoil is designated as a non-slip wall condition. As for the BSCJ foil, the velocity inlet boundary condition is imposed on the blow and suction surface, and the direction is perpendicular to the surface (seen in Figure 1a).
The hexahedron-shaped grid was utilized in the grid design to enhance calculation accuracy by using of commercial software STAR-CCM+ 12.06. The local grid refinement technique was employed to capture the flow structure. The height of the initial layer adjacent to the foil met the criterion of y+ = yuτ/ν ≈ 1 [24], where uτ denotes the wall shear stress and y indicates the distance from the first layer to the foil’s surface. Figure 3 and Figure 4 depict the grids of the hydrofoil surface and the representative sections of the computational domain, respectively.

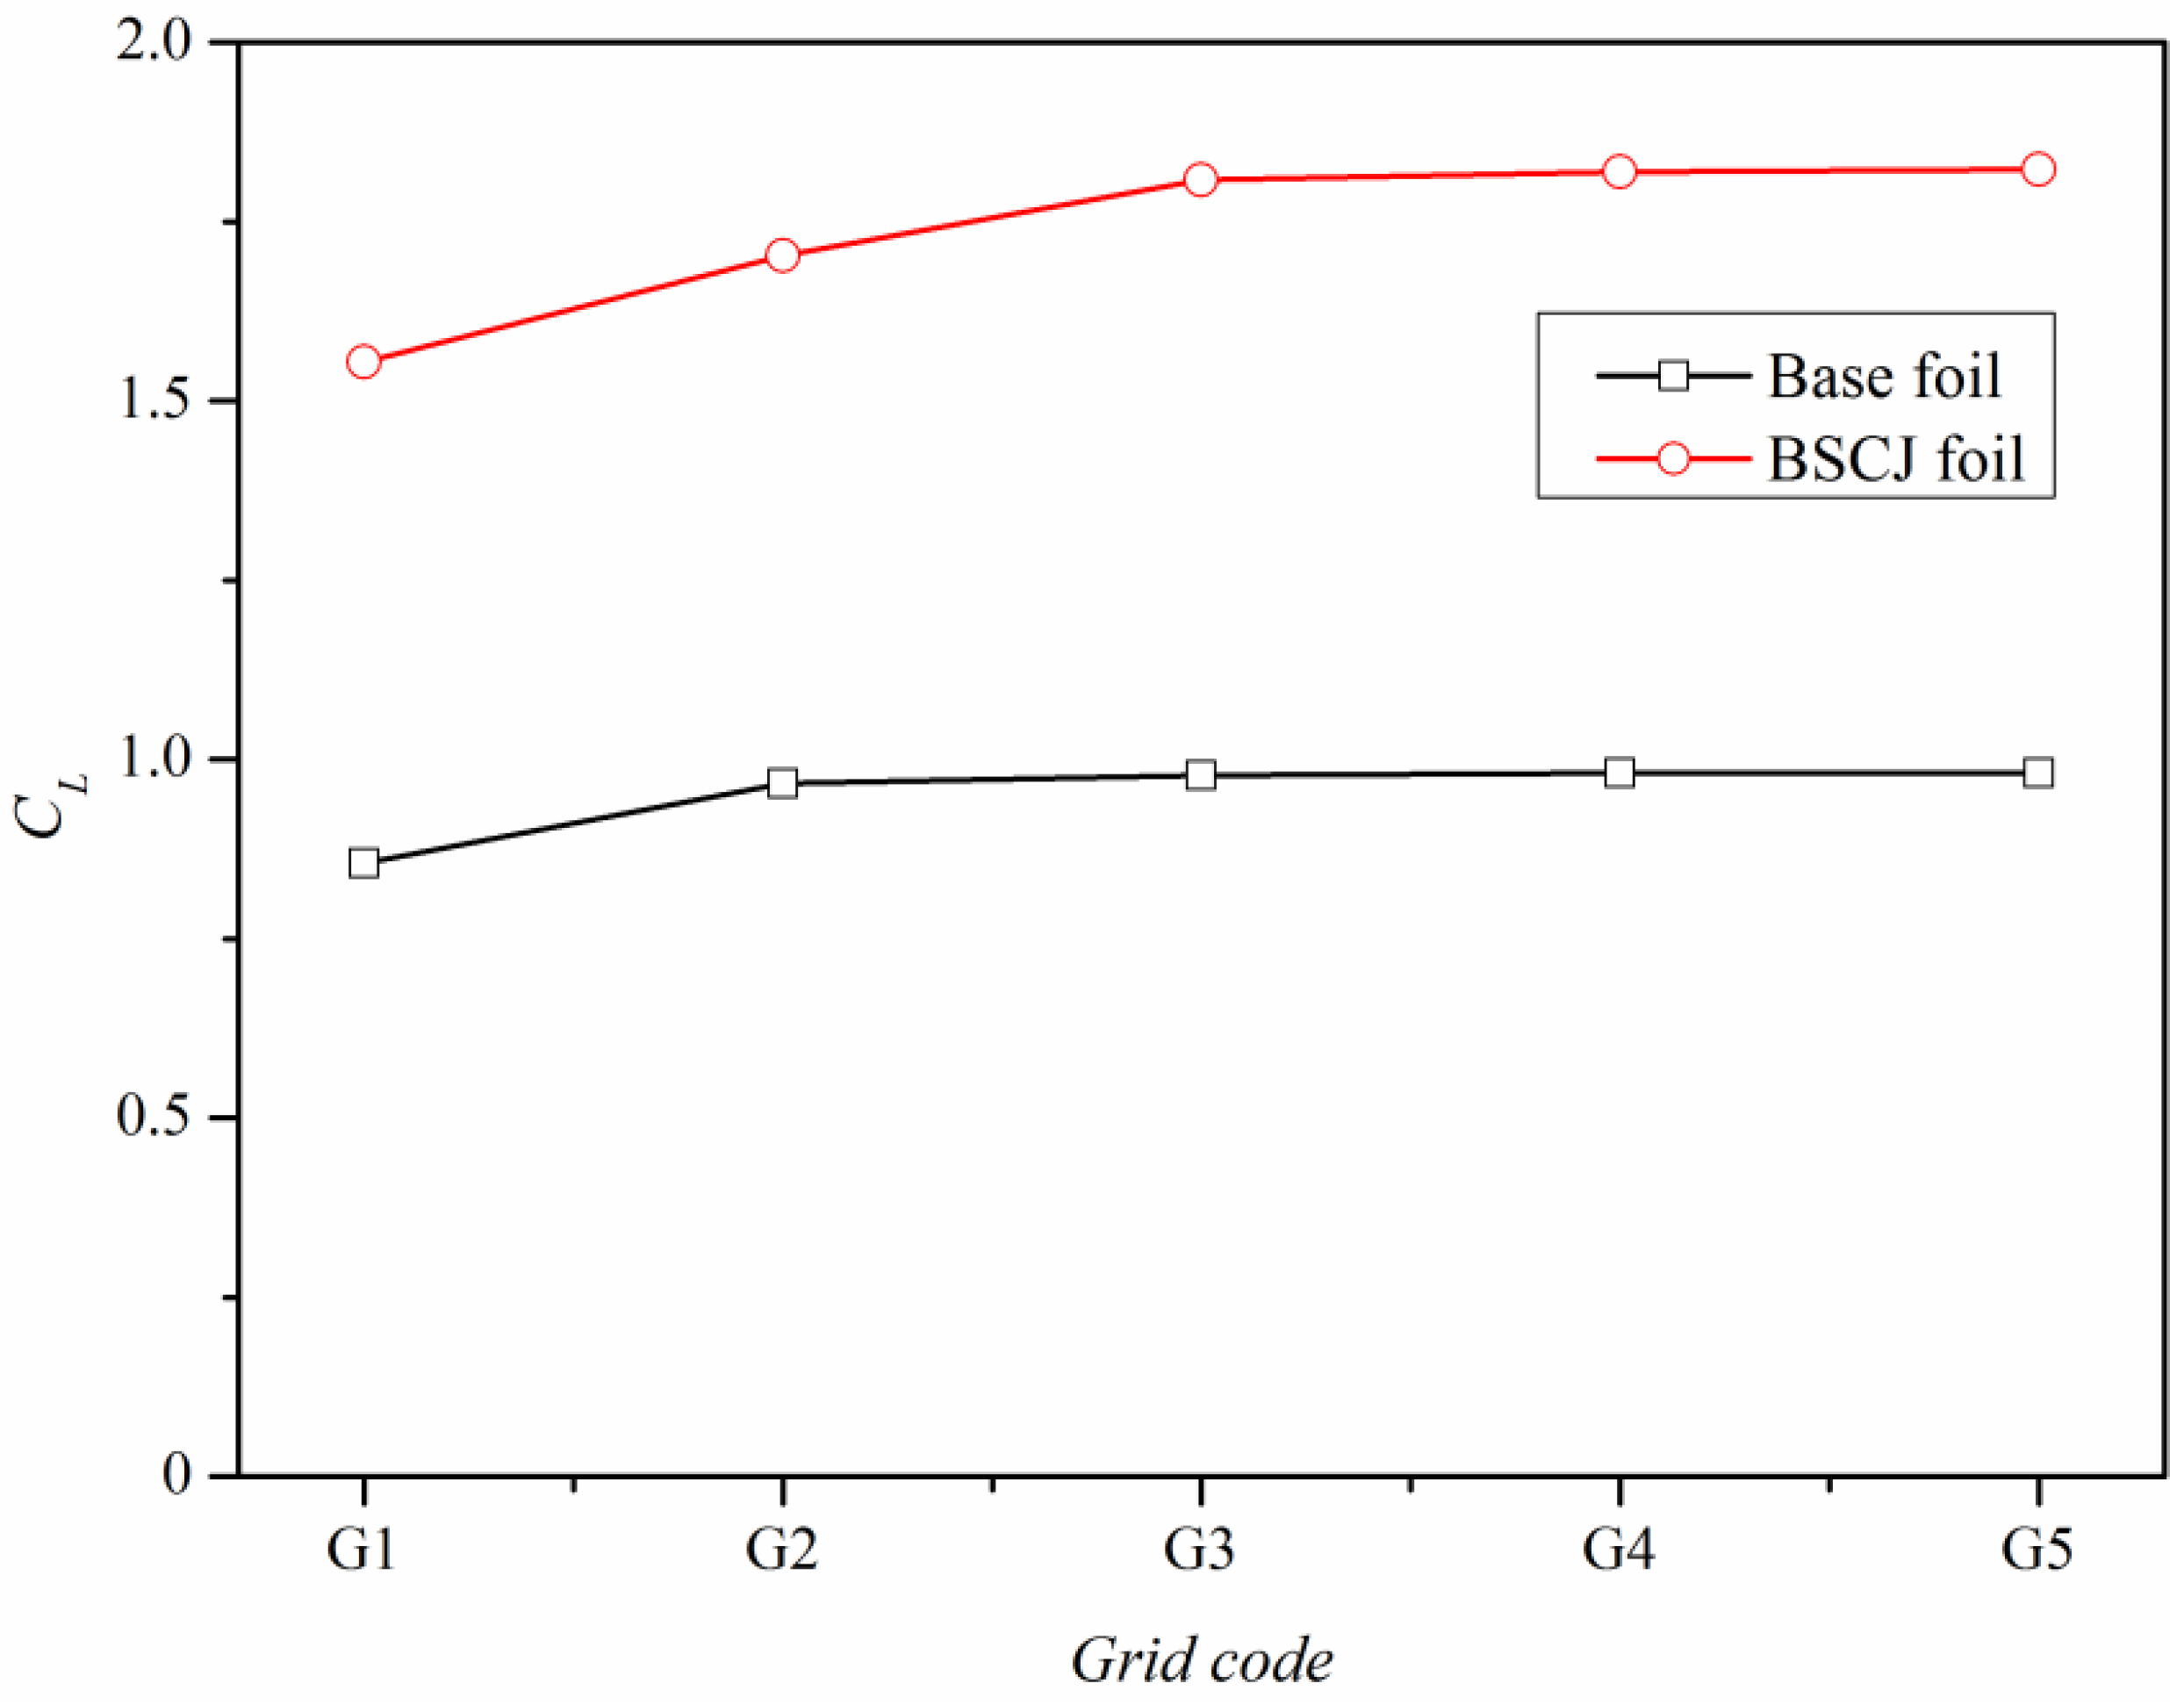
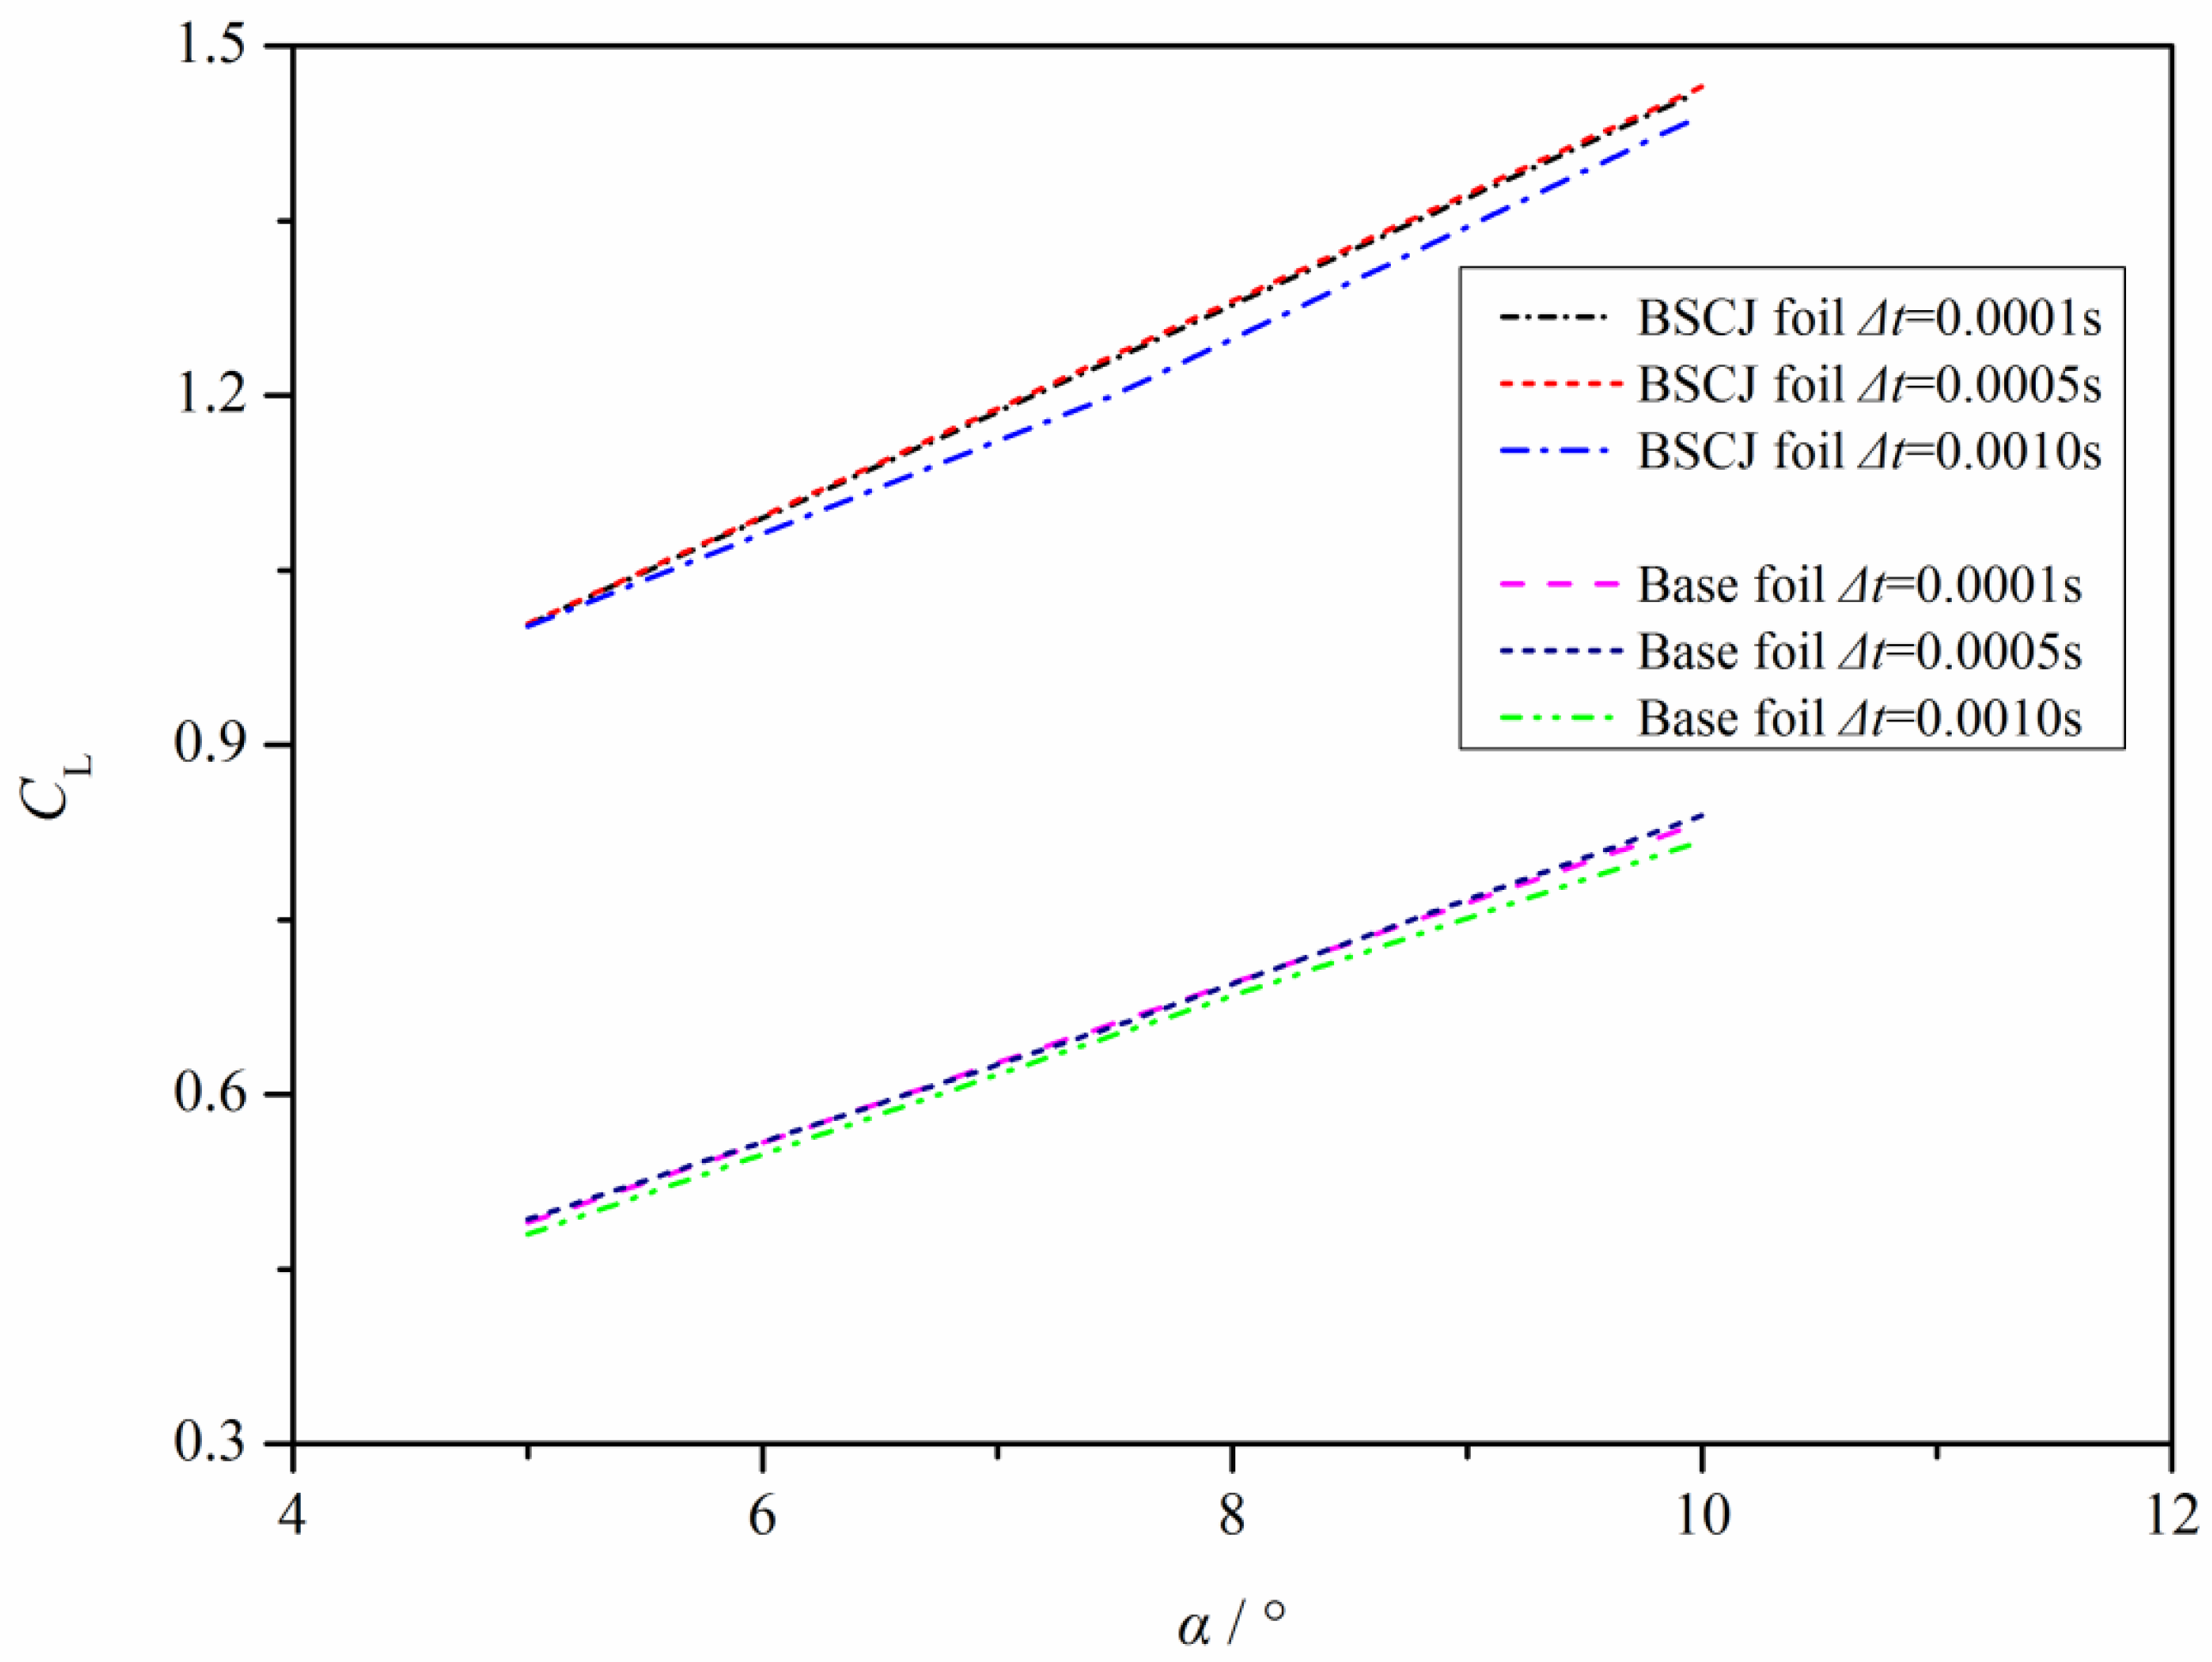
3.3. Sensitivity Study and Accuracy Test

This subsection will conduct a sensitivity study on the grid independence test and time step selection. Regarding the grid independence test, five grid sets were constructed following the ITTC guidelines, with the three-directional refinement ratio established 2 accordingly. The quantities of the five sets of grids are 282,400, 798,750, 2,259,200, 6,389,900, and 18,073,600, respectively, with the codes designated as G1 through G5. The lift coefficients of the base foil and the foil equipped with BSCJ at various grid numbers are depicted in Figure 5, with a corresponding incoming angle of attack of 10° and a specified time step. Figure 5 illustrates that when the grid number increases, the values of CL in base foil and BSCJ exhibit a trend of gradual stabilization. Specifically, regarding the base foil, when the grid count surpasses 798,750 (equivalent to the G2 grid), the lift coefficient attains a steady value. Thereafter, when the grid number increases further, the variation in lift coefficient remains within 0.5%. For BSCJ, the presence of suction and blowing apertures necessitates a grid over 2.25 million to achieve a steady lift coefficient, similar to the G3 grid. To guarantee the stability of hydrodynamic results and achieve a more detailed flow structure, the G4 grid will be employed in the following calculation.
When it comes to time step selection, three various values of time step were selected and they are t = 0.0001   s   , t = 0.0005   s ,   a n d   t = 0.001   s , respectively. The value of CL under various magnitude of t are plotted in Figure 6, where the corresponding attack angle varies from 5° to 10° and the fourth set of gird (G4) is chosen. As can be seen in Figure 6, when the value of time step alters from t = 0.0001   s to t = 0.0005   s , the relevant difference in magnitude of CL is somewhat minute. Specifically, the biggest difference is less than 0.18%. However, when the value of t climbs to t = 0.001   s , the relevant difference keeps increasing with the increase of attack angle. In particular, the peak value of difference in CL between the t = 0.001   s and t = 0.0005   s is 0.89% (corresponds to the condition of base foil) and 2.12% (corresponds to the condition of foil_BSCJ), respectively. Therefore, the value of time step will be set as t = 0.0005   s in the following calculation.
Concerning the accuracy verification work, we take the model test results carried out by our research group as a reference. The test model is consistent with the calculation model, and the test is carried out in a small wind tunnel (Seen in Figure 7). The test wind speed was 30 m/s, the velocity attack angles were set at 0°, 3.67°, 6.15°, 9.19°, 11.21°, 12.22°, 13.22°, and 14.27°, respectively, and the characteristic Reynolds number was 4.12 × 10⁵. The comparison results of the lift coefficient are shown in Figure 8. The relevant data processing software is Origin 8.5. It is noted that the data acquired from the experiment have been modified by using binary boundary correction and the effect of the supporting part has been eliminated. Considering that the flow is turbulent, the repeatability test results are also given in Figure 8.
Figure 8 demonstrates that the computational conclusions presented in this work align closely with the experimental findings. In addition, the repeatability of three sets of experimental data is good, with a maximum deviation of 1.6%. The most significant discrepancy between the calculated values and the experimental data is 1.85%. Furthermore, the stall phenomena transpires when the angle of attack exceeds 12°, and the stall point aligns well, meaning that the accuracy of the current numerical method is suitable for the following calculation.

4. Results and Discussion

4.1. Orthogonal Design and Results

The hydrodynamic performance parameters of the BSCJ foil are intricately linked to the blowing and suction velocity, aperture width, and the locations of suction and blowing points, among other factors. To acquire the ideal parameter combination, analyzing and calculating each factor individually incurs excessive costs and complicates the identification of the dominating factor. This section introduces the orthogonal design method to determine the optimal parameter combination [25].
The distance from the suction point to the leading edge of the hydrofoil (LS), the distance from the blowing point to the trailing edge of the hydrofoil (LB), and the jet momentum coefficient (K) are identified as three key parameters. For each characteristic factor, three horizontal arrays are chosen to create a 3 × 3 orthogonal design matrix. The precise selection of parameters is presented in Table 1.
Two parameters were established to assess the enhancement of hydrofoil performance following the implementation of BSCJ, with its definition presented in Formula (8). We computed the average value of the disparity between the base foil and the BSCJ foil for an angle of attack ranging from 0° to 25°. Table 2 presents the computation results for various parameter combinations. It is observed that positive values of ΔCL and Δζ indicate an enhancement in the hydrodynamic performance of the hydrofoil following the implementation of BSCJ. Conversely, it signifies a decline in performance.
C L ¯ = 1 n i = 1 n ( C L B S C J - i C L B a s e - i ) ,   ς ¯ = 1 n i = 1 n ( ς L B S C J - i ς L B a s e - i )
As seen in Table 2, compared with the base foil, the introduction of BSCJ device increases its lift coefficient and lift drag ratio. Further analysis can obtain the average value of each factor index, and the statistical results are shown in Table 3 and Table 4. It is noted that the larger the values of C L ¯ and K C ¯ are, the more the hydrodynamic performance of the BSCJ foil will be improved.
As illustrated in Table 3 and Table 4, the influence of K on the fluid dynamics of the foil is far more pronounced than that of Ls and LB, suggesting that K is the primary component affecting BSCJ foil. Furthermore, regarding the indices of CL and ζ, the latter encompasses both the augmentation of the lift coefficient and the variation of the drag coefficient. Consequently, it can more accurately represent the hydrodynamic performance of the BSCJ foil. Table 3 indicates that for factor A, the maximum value occurs at level 2 (26.283). Factor B attains its peak value at level 1 (25.463). Factor C attains its peak value at level 1 (28.835). In summary, within the specified parameter range, the optimal hydrodynamic performance is achieved when LS = 0.25 C, LB = 0 C and ζ = 0.1.

4.2. Hydrodynamic Characteristics of BSCJ Foil and Internal Mechanism

The aforementioned research determined the ideal parameter combination for BSCJ foil. This section examines the hydrodynamic performance of the BSCJ foil at various angles of attack. The flow control efficacy of the BSCJ device is validated through comparison with the conventional foil. Figure 9 illustrates the lift coefficient and lift-to-drag ratio of both the base foil and the BSCJ foil at various angles of attack.
Figure 9 illustrates that when the BSCJ device is affixed to the conventional foil, the corresponding value of CL exhibits a significant rise at all attack angles, with the maximum value attained at α = 21°. In comparison to the conventional foil, the use of BSCJ not only increases the value of CL but also postpones the stalling point. The stall phenomena for the base foil occurs at an angle of 12°. However, when the BSCJ is affixed to the foil, the stalling point can stretch to 21°. Conversely, regarding the CD, there is a negligible difference in the value of CD between the standard foil and BSCJ foil when the attack angle is within a narrow range (α < 4°). As the attack angle increases, the corresponding value of CD in the BSCJ foil diminishes relative to that of the traditional foil, indicating that the implementation of the BSCJ device contributes to a reduction in drag force.
To investigate the internal mechanisms of drag reduction and lift enhancement of the BSCJ foil, the vortex structures and streamline distribution at the mid-span region of the hydrofoil at a typical angle of attack are illustrated in Figure 10.
Figure 10 illustrates that, for the base foil, flow separation does not manifest on the foil surface at α = 0°and the streamline remains predominantly attached to the foil. The BSCJ foil exhibits minimal suction on the upper surface; however, the pronounced shear flow induced by blowing on the lower surface results in a blocking effect at the hydrofoil’s trailing edge. This phenomenon is similar to the implementation of a virtual Gurney plate at the tail, thereby augmenting the effective curvature of the foil. Consequently, a substantial lift force can be generated even at α = 0° (as evidenced by the results in Figure 9a). As the attack angle increases further (α = 10°), vortex and streamline separation transpire at the trailing edge of the base foil. In contrast, the BSCJ foil effectively eliminates low-momentum fluid from the upper surface due to the suction device, thereby enhancing its capacity to withstand the adverse pressure gradient. Consequently, there is no occurrence of flow separation at this angle of attack. Moreover, as the attack angle (α = 10°~20°) increases, a significant region of flow separation develops on the base foil’s surface, with the flow separation point progressively advancing. The associated value of CL diminishes markedly, resulting in the occurrence of stalling. Regarding the BSCJ foil, Figure 10d,e illustrate that the mutual interplay of suction and blowing jets causes the stagnation point at the leading edge of the foil surface to shift rearward, significantly improving the circulation of the foil. Enhancing circulation will augment the capacity to withstand unfavorable pressure gradients and elevate lift force. At an angle of attack of α = 25°, the vortex structure on the surface of the base foil periodically detaches, resulting in a significant flow separation zone. The flow separation phenomenon also manifests at the tail of the BSCJ foil, resulting in the occurrence of stalling at this juncture. Nonetheless, in comparison to the base foil, the flow separation zone is relatively diminutive. The presence of a suction/blowing jet primarily improves fluid attachment capability and the curvature of the nearby streamline.
To more intuitively illustrate the internal process of the BSCJ foil in preventing flow separation, Figure 11 illustrates the vortex field configuration of the base foil and the BSCJ foil at α = 25°. The λ2 criterion was employed to define the vortex structure, with the pertinent value established at λ2 = −0.5. The flow velocity was utilized for staining purposes. Figure 11 illustrates that for the initial foil, vortex formations of varying scales in the fluid domain surrounding the foil dissipate sequentially. Currently, the tip vortices and the separated vortices on the surface are intermingled, resulting in a significantly low fluid velocity at the foil surface. In the case of the BSCJ foil, the suction/blowing jet action results in flow separation occurring only on a limited portion of the foil surface, with the associated fluid velocity significantly exceeding that of the base foil.
The lift/drag properties of a hydrofoil are intricately linked to the pressure distribution on its surface; thus, the pressure coefficient distribution of the foil at the mid-span section under various typical angles is illustrated in Figure 12.
When α = 0°, it is evident from Figure 12a that the pressure coefficients on the top and lower surfaces of the base foil are identical, resulting in a lift coefficient of zero. The presence of the jet at the leading edge of the BSCJ foil results in significant negative pressure on the lower surface of the hydrofoil, hence amplifying the pressure coefficient differential and enabling the generation of a substantial positive lift. This conclusion aligns with Figure 9a. As the angle of attack continues to rise, a boundary layer on the pressure surface, induced by the head jet, re-emerges. This results in an expansion of the negative pressure region on the pressure surface, thereby augmenting the pressure differential between the upper and lower surfaces, which in turn elevates the lift coefficient of the hydrofoil. Furthermore, in conjunction with Figure 12, it is evident that the presence of the blowing jet at the tail of the BSCJ hydrofoil causes the trailing edge of the foil to deflect towards the pressure surface, hence augmenting the camber of the hydrofoil, which enhances lift performance.
Given that the formation of the boundary layer significantly influences the hydrodynamic performance of the hydrofoil, Figure 13 illustrates the normal velocity distribution curve at the mid-span portion of the hydrofoil at various angles of attack. The relative locations from left to right are x/C = 0.1, x/C = 0.3, x/C = 0.5, x/C = 0.7, and x/C = 0.19, respectively. u* and y* represent dimensionless velocity and normal height, respectively. It is defined as u* = u/V, y* = y/C, where u represents the local velocity and y denotes the perpendicular height from the grid point to the hydrofoil surface. The blue line denotes the base foil, whereas the red line signifies the BSCJ foil.
Figure 13 illustrates that the normal velocity at each section of both the base foil and the BSCJ foil is positive at low angles of attack, indicating the absence of backflow and flow separation. However, the velocity profile of the BSCJ foil is more complex due to the presence of blowing and suction jets. As the angle of attack increases to 15°, the flow velocity at the tail of the initial foil (x/C = 0.9) becomes negative, indicating flow separation has occurred. Conversely, the BSCJ foil exhibits no flow separation owing to the presence of the tail blowing jet. As the attack angle rises to α = 20°, the flow separation point of the initial foil advances, resulting in a negative flow velocity at x/C = 0.3. Flow separation transpires in the majority of regions on the upper surface of the respective foil, aligning with the findings presented in Figure 10e. Ultimately, when the attack angle attains α = 25°, the velocity throughout the base foil is negative, indicating that the entire foil is situated within the flow separation region. Conversely, the negative flow velocity of the BSCJ foil manifests solely when x/C exceeds 0.5, demonstrating that the presence of the BSCJ device can effectively postpone flow separation, diminish the flow separation area, and markedly enhance the hydrodynamic performance of the foil.
In order to further elaborate why the BSCJ can improve the fluid dynamics of the foil, the distribution of turbulent kinetic energy around the foil with/without BSCJ are presented in Figure 14. Three large attack angles were selected and they are 15°, 20° and 25° respectively. As seen in Figure 14, with the increase of attack angle, the intensity of turbulent kinetic energy exhibits a sharp growth, resulting in huge energy consumption. Severe flow separation also took place in the corresponding area and that phenomenon is in good consistency with Figure 10. However, when the BSCJ is introduced, the corresponding intensity of turbulent kinematic energy is significantly reduced and there exists little flow separation. Therefore, one conclusion can be drawn that the introduction of BSCJ can effectively cut down the intensity of turbulent kinetic energy and it can also rectify the flow, reducing the flow separation.

5. Conclusions

A novel design of the BSCJ approach is presented to enhance the fluid dynamics of the hydrofoil. The three-dimensional NACA0015 airfoil is utilized as the research subject, employing an orthogonal design method in conjunction with computational fluid dynamics (CFD) for the study. The large eddy simulation (LES) approach is employed to computationally model the fluid dynamics of the standard foil and BSCJ foil throughout a substantial range of attack angles, with typical flow patterns being captured and examined. The principal conclusions derived from the current investigation are summarized as follows:
(1)
Based on the analysis of orthogonal design, the jet momentum coefficient is the dominant factor affecting the hydrodynamic performance of the foil, and the optimal condition can be achieved when the suction slot is 0.25 C from the leading edge, the blowing slot is 0 C from the trailing edge, and the jet momentum coefficient is 0.1.
(2)
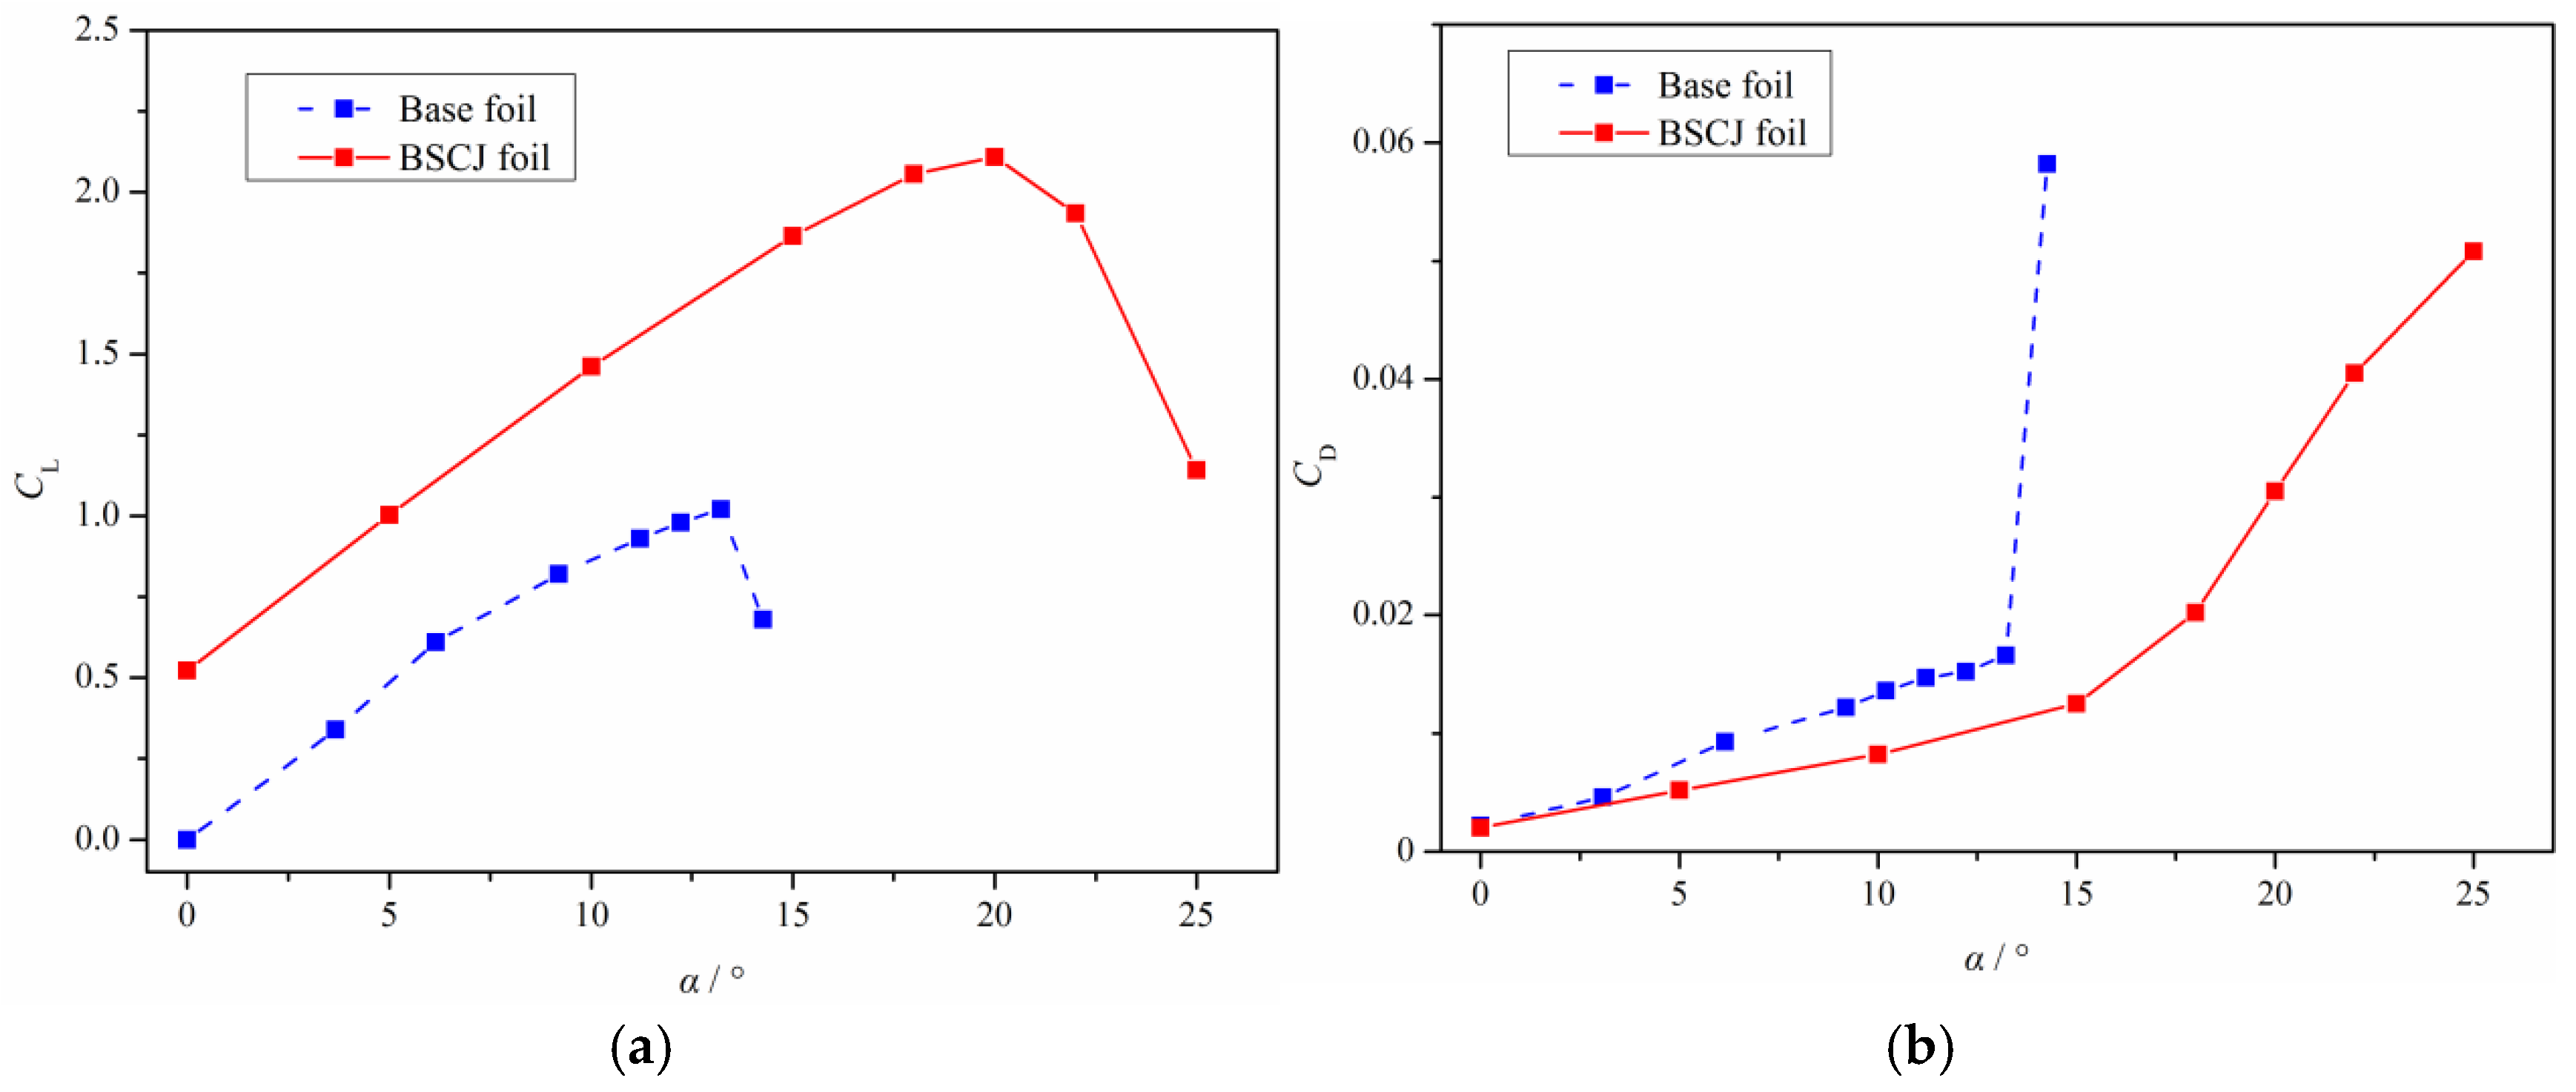
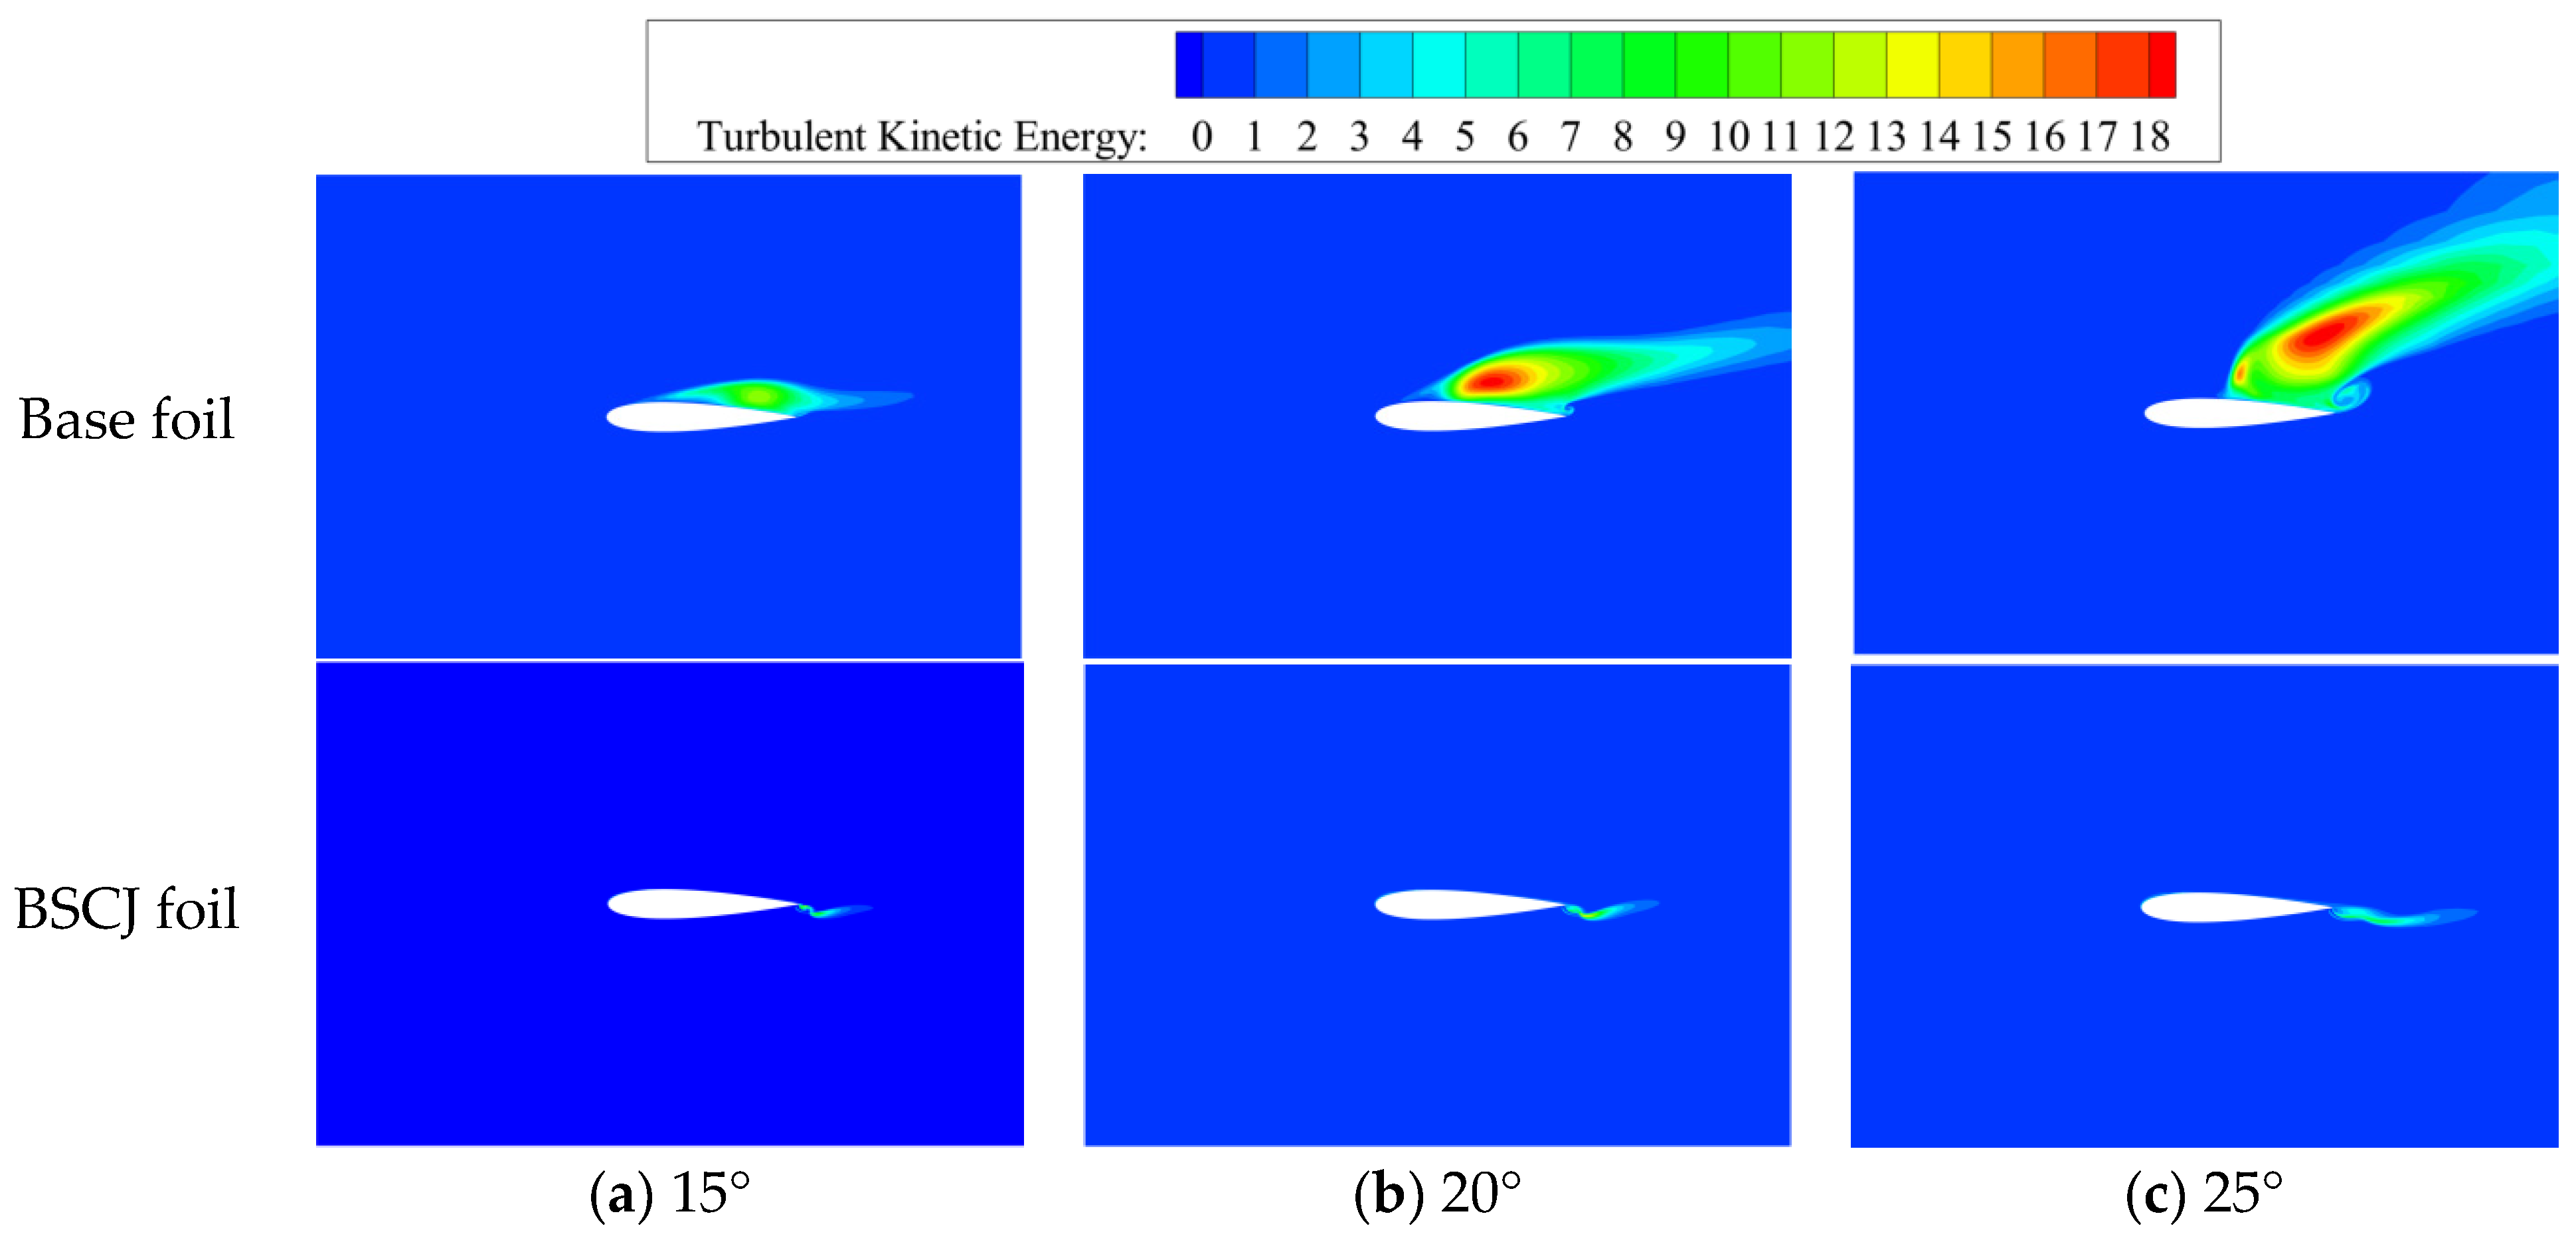
The introduction of BSCJ does much good on improving the fluid dynamics of hydrofoil. Specifically, the peak value of CL in BSCJ foil can reach 2.11, improved by 1.06 times compared with the traditional foil. The corresponding stalling point was extended from 12° to 21°.
(3)
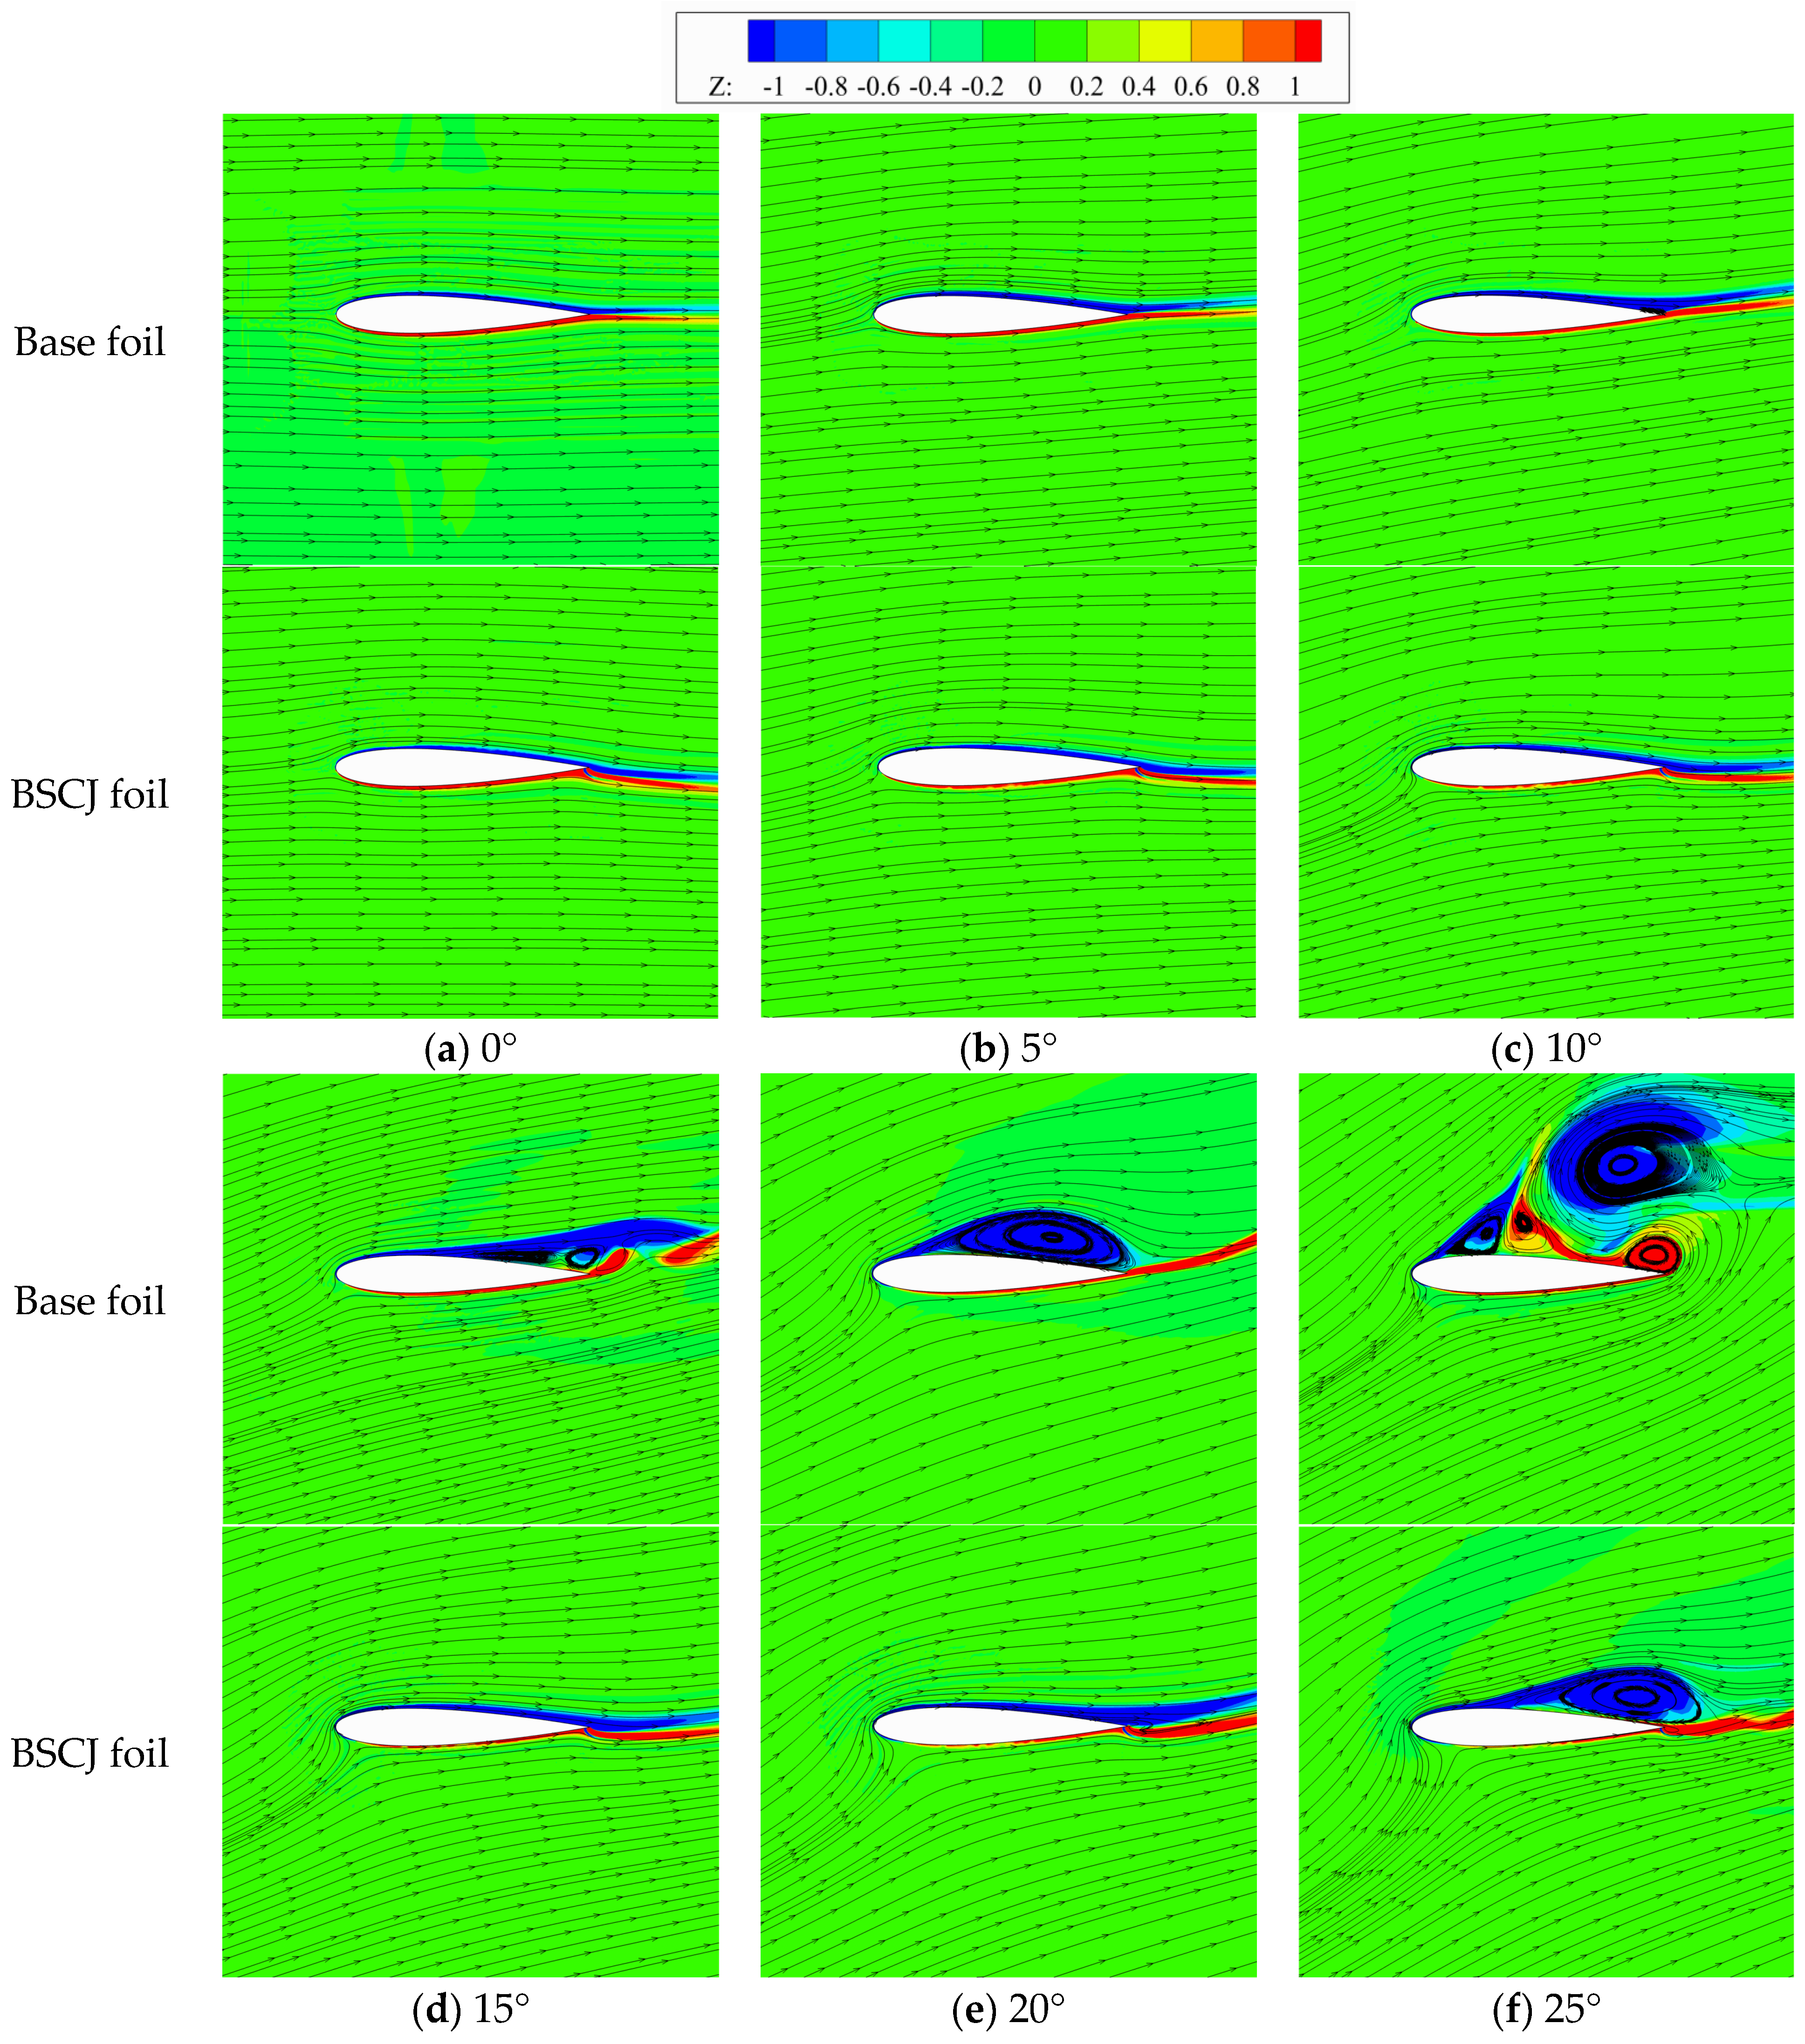
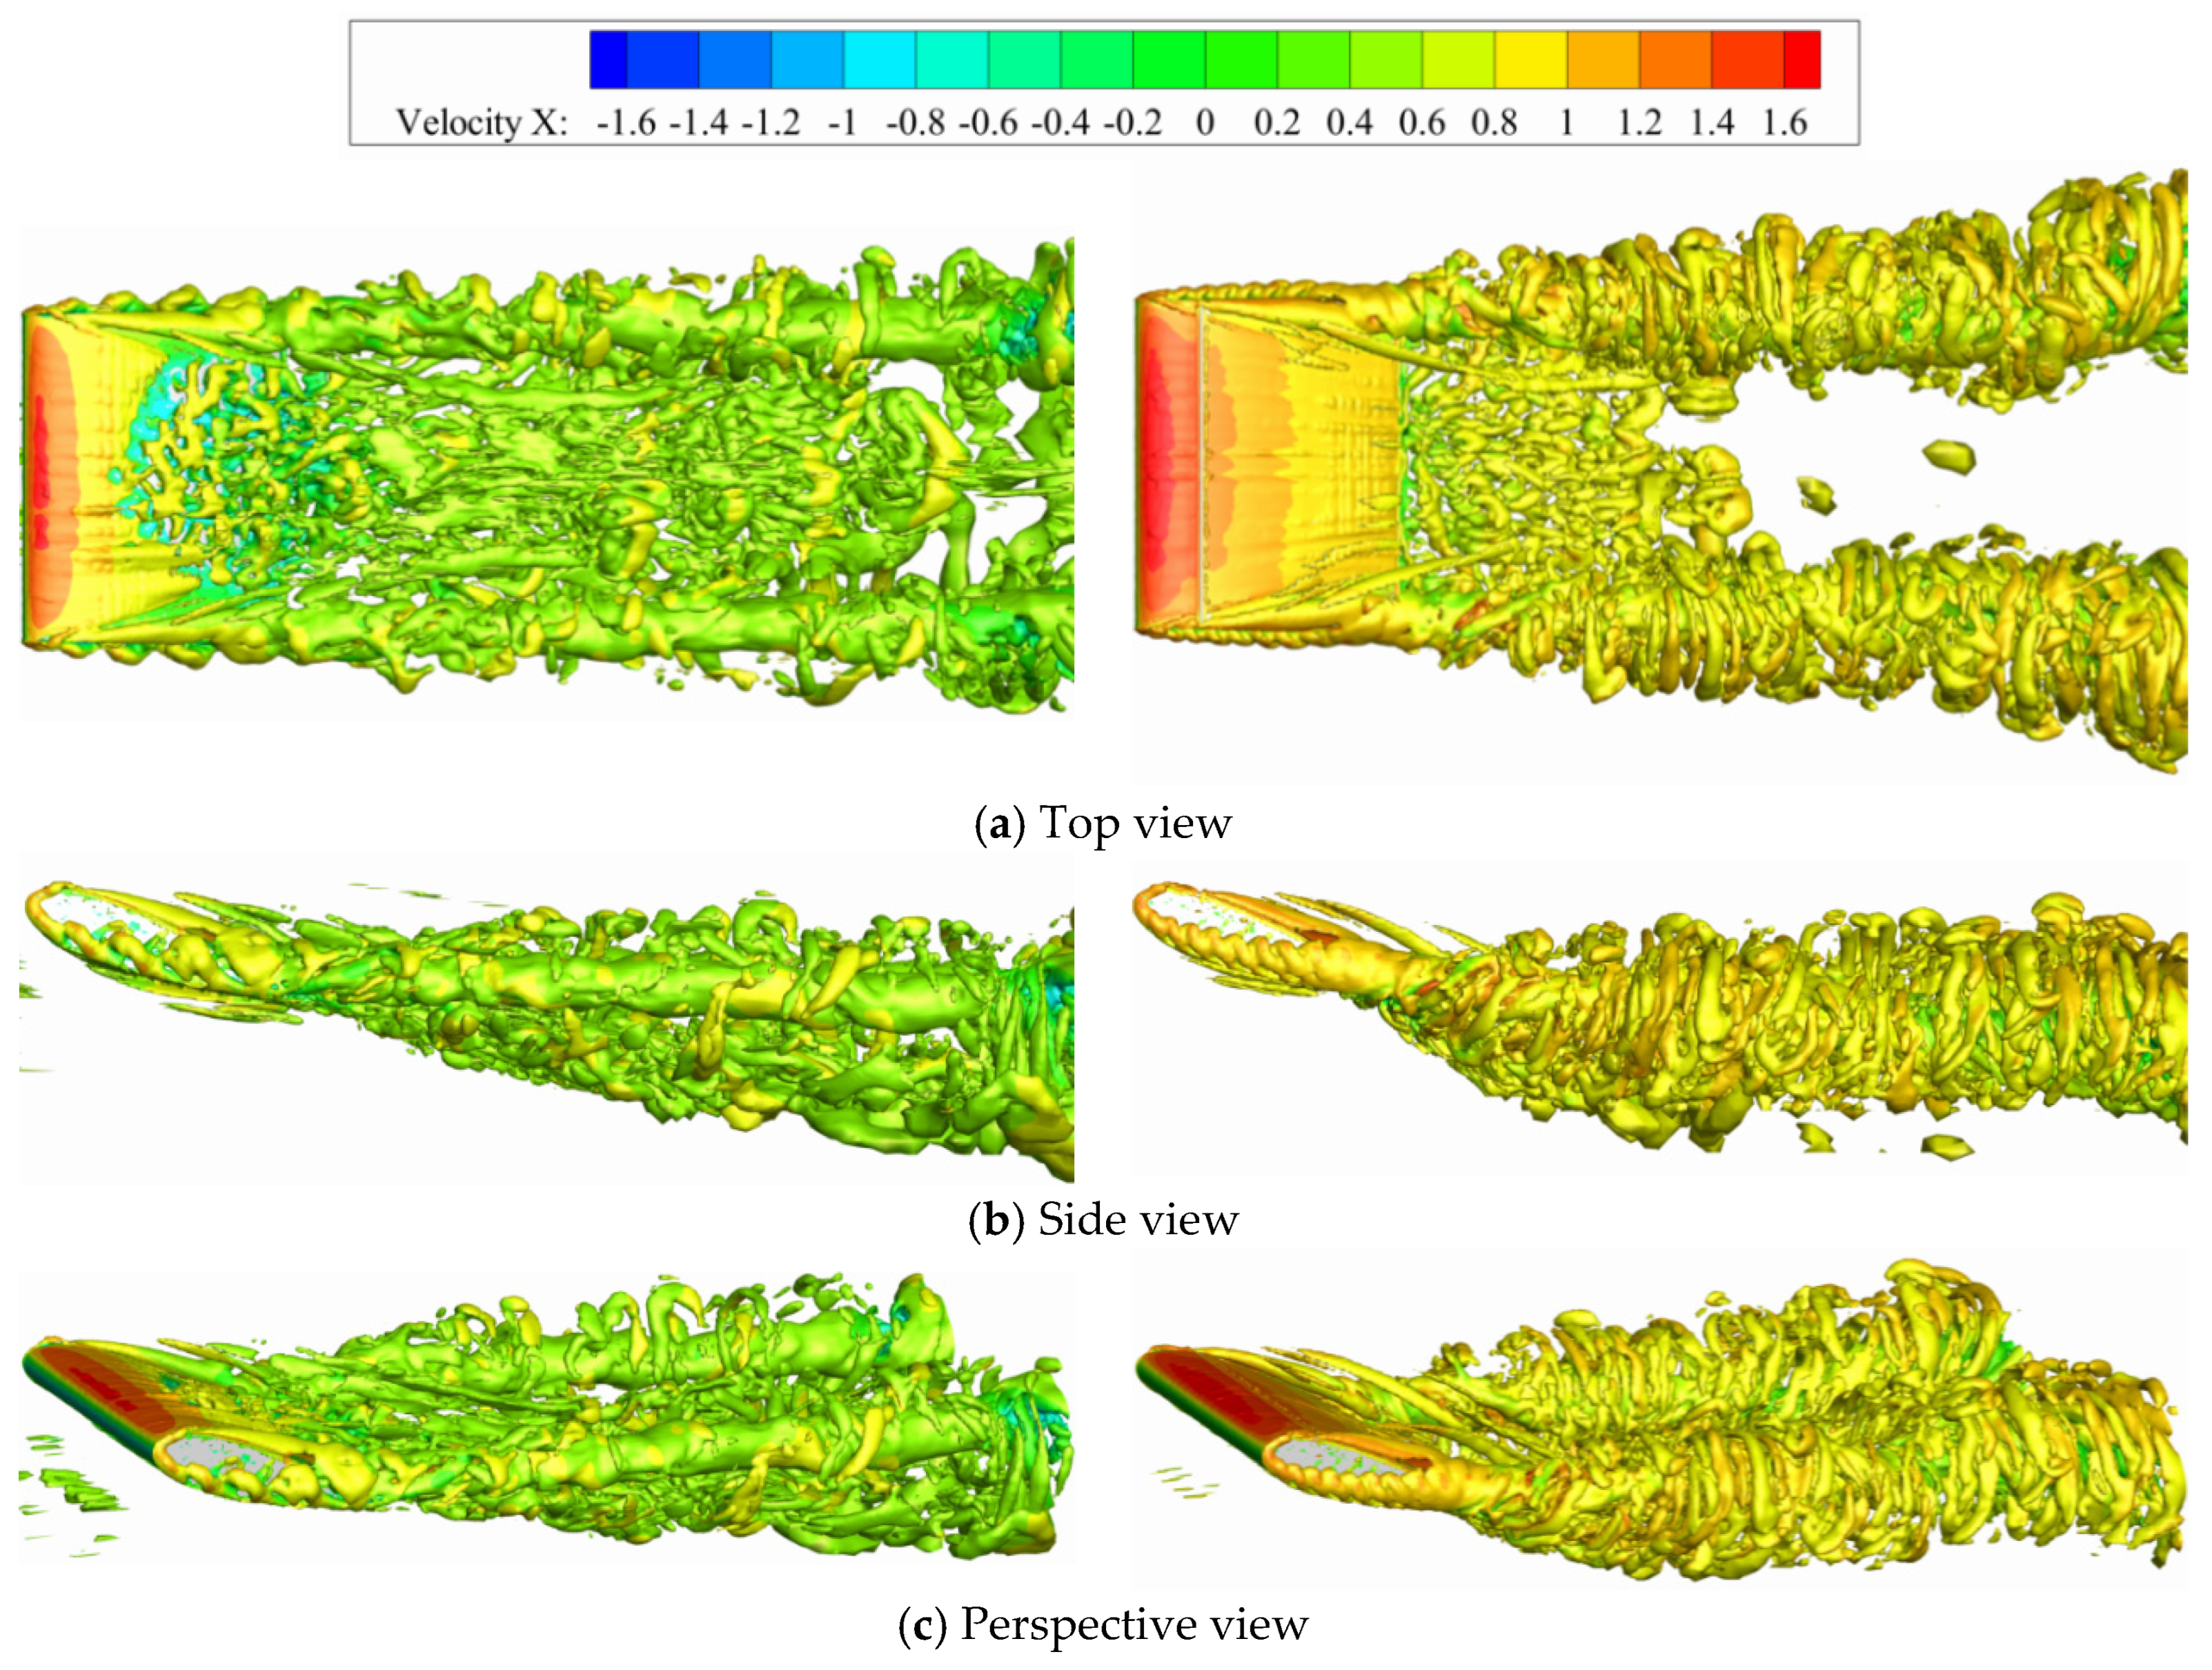
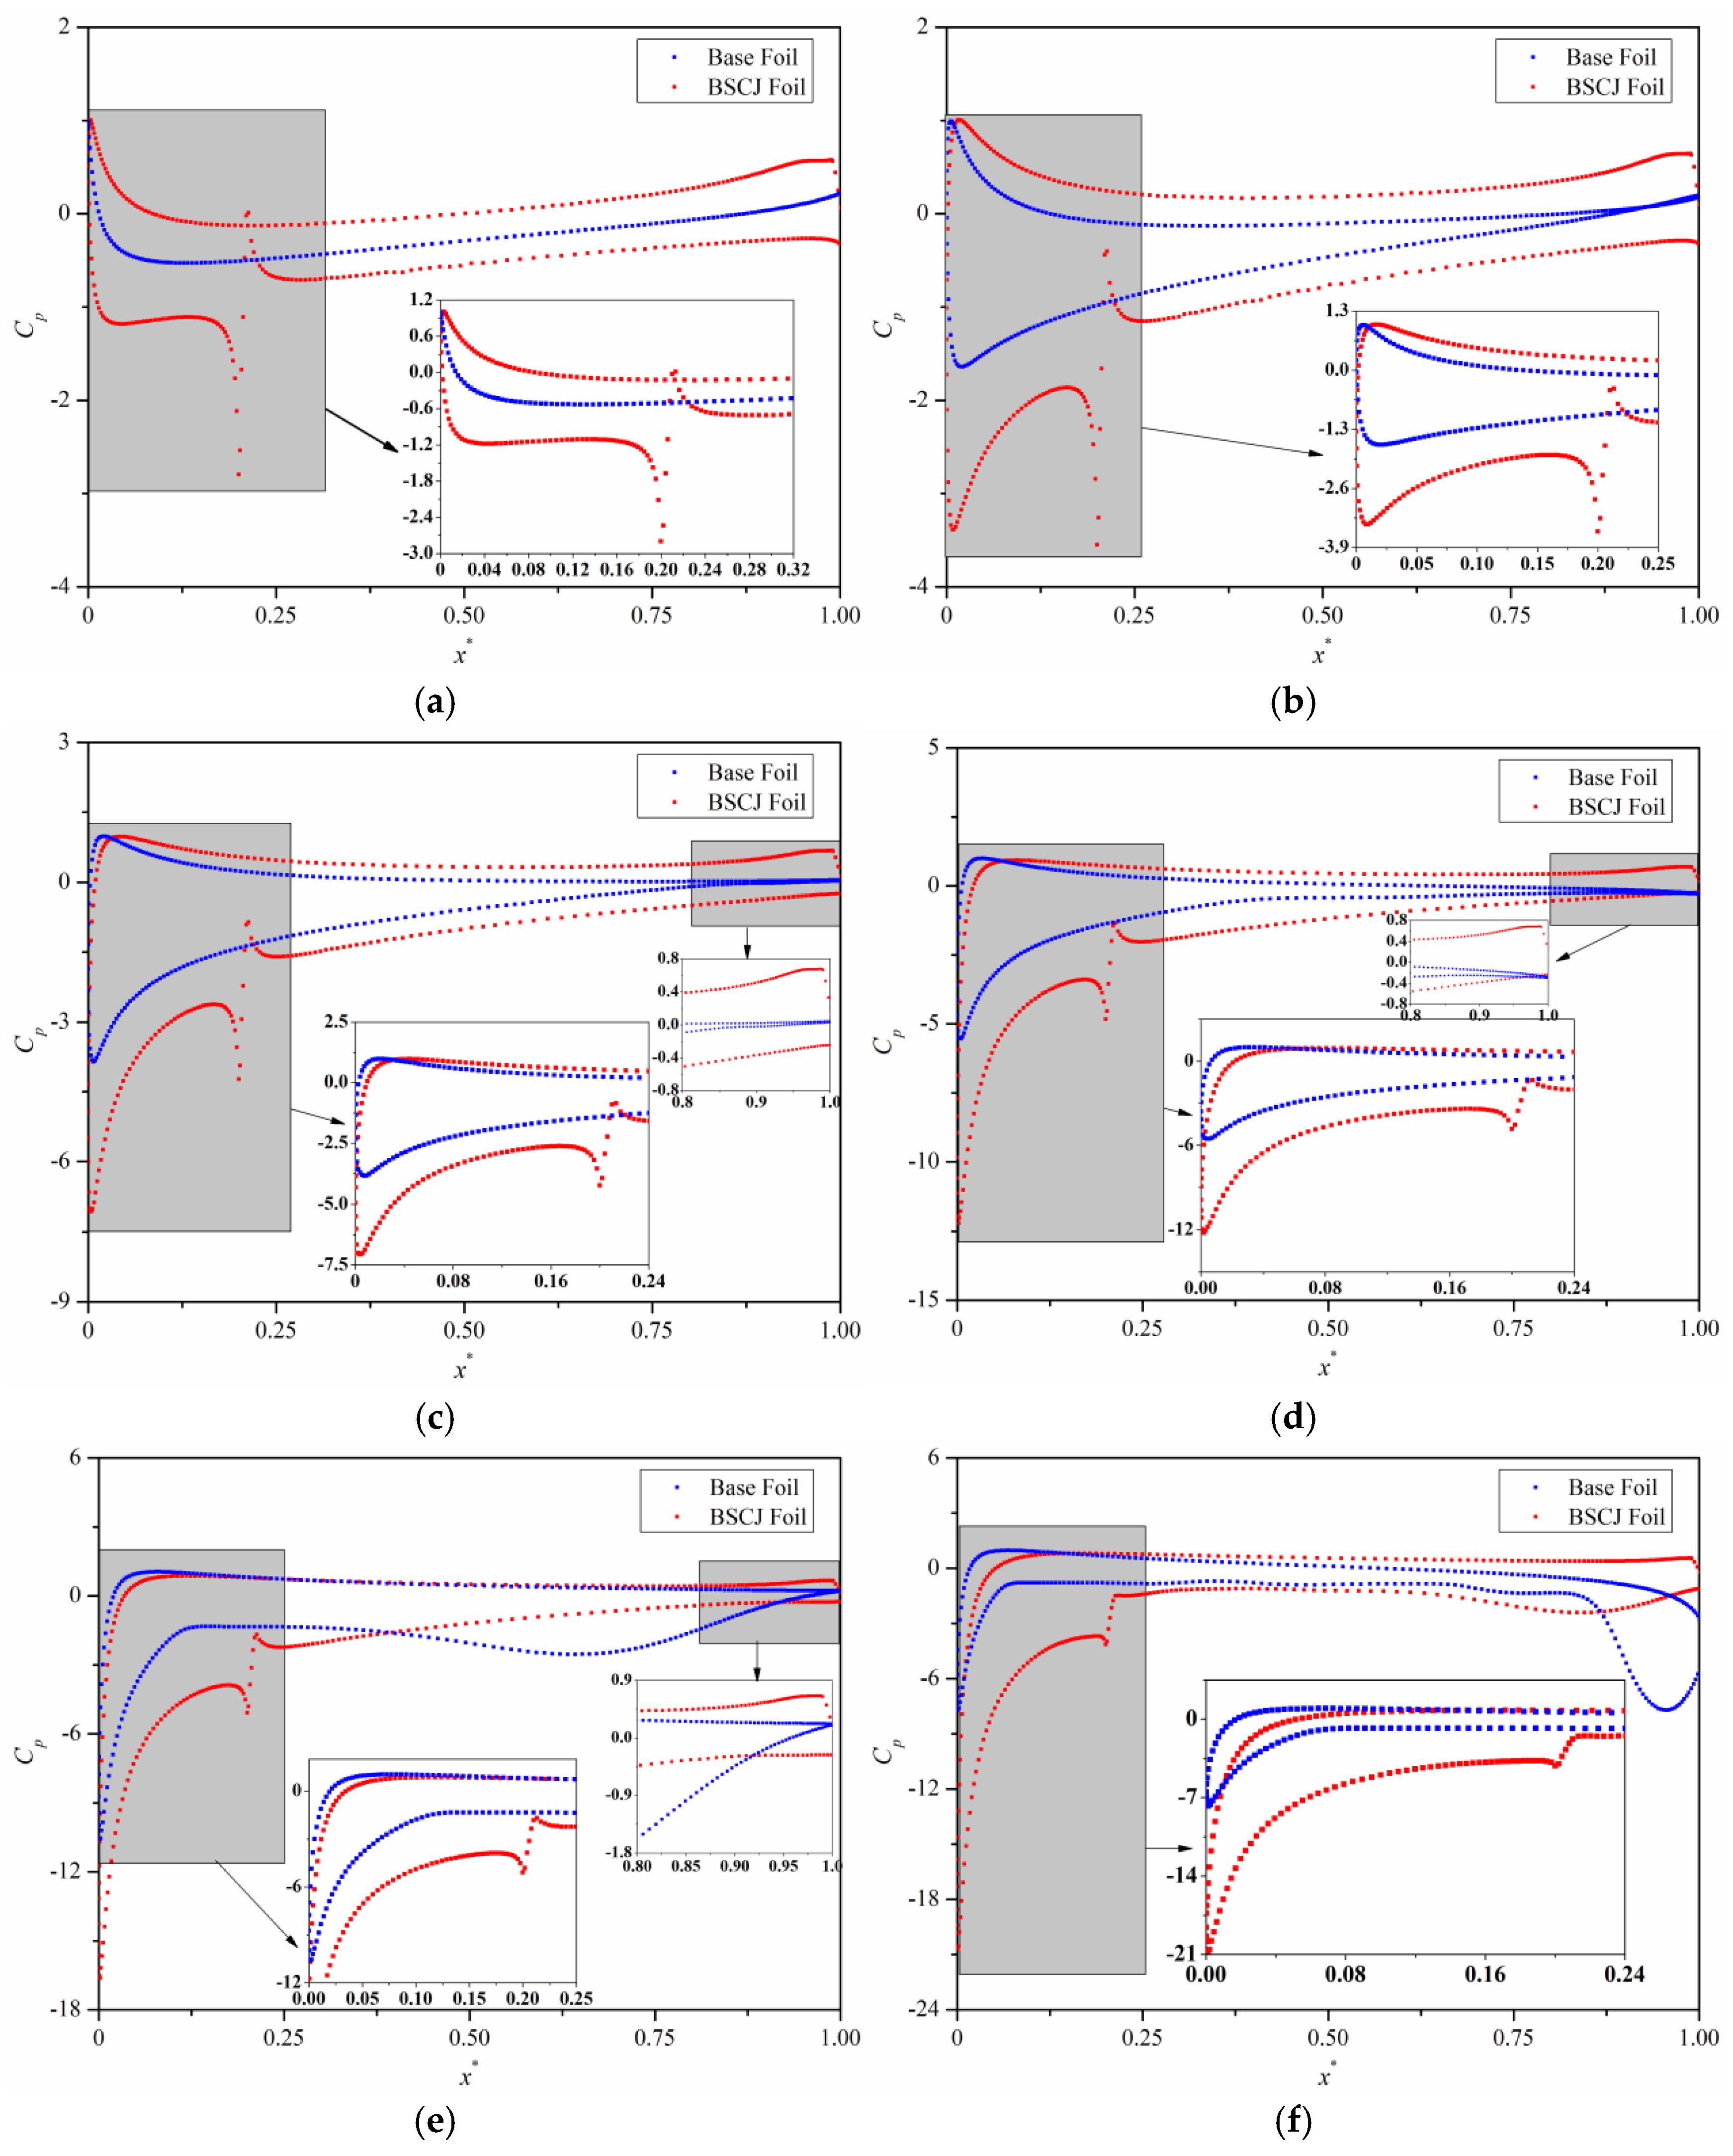
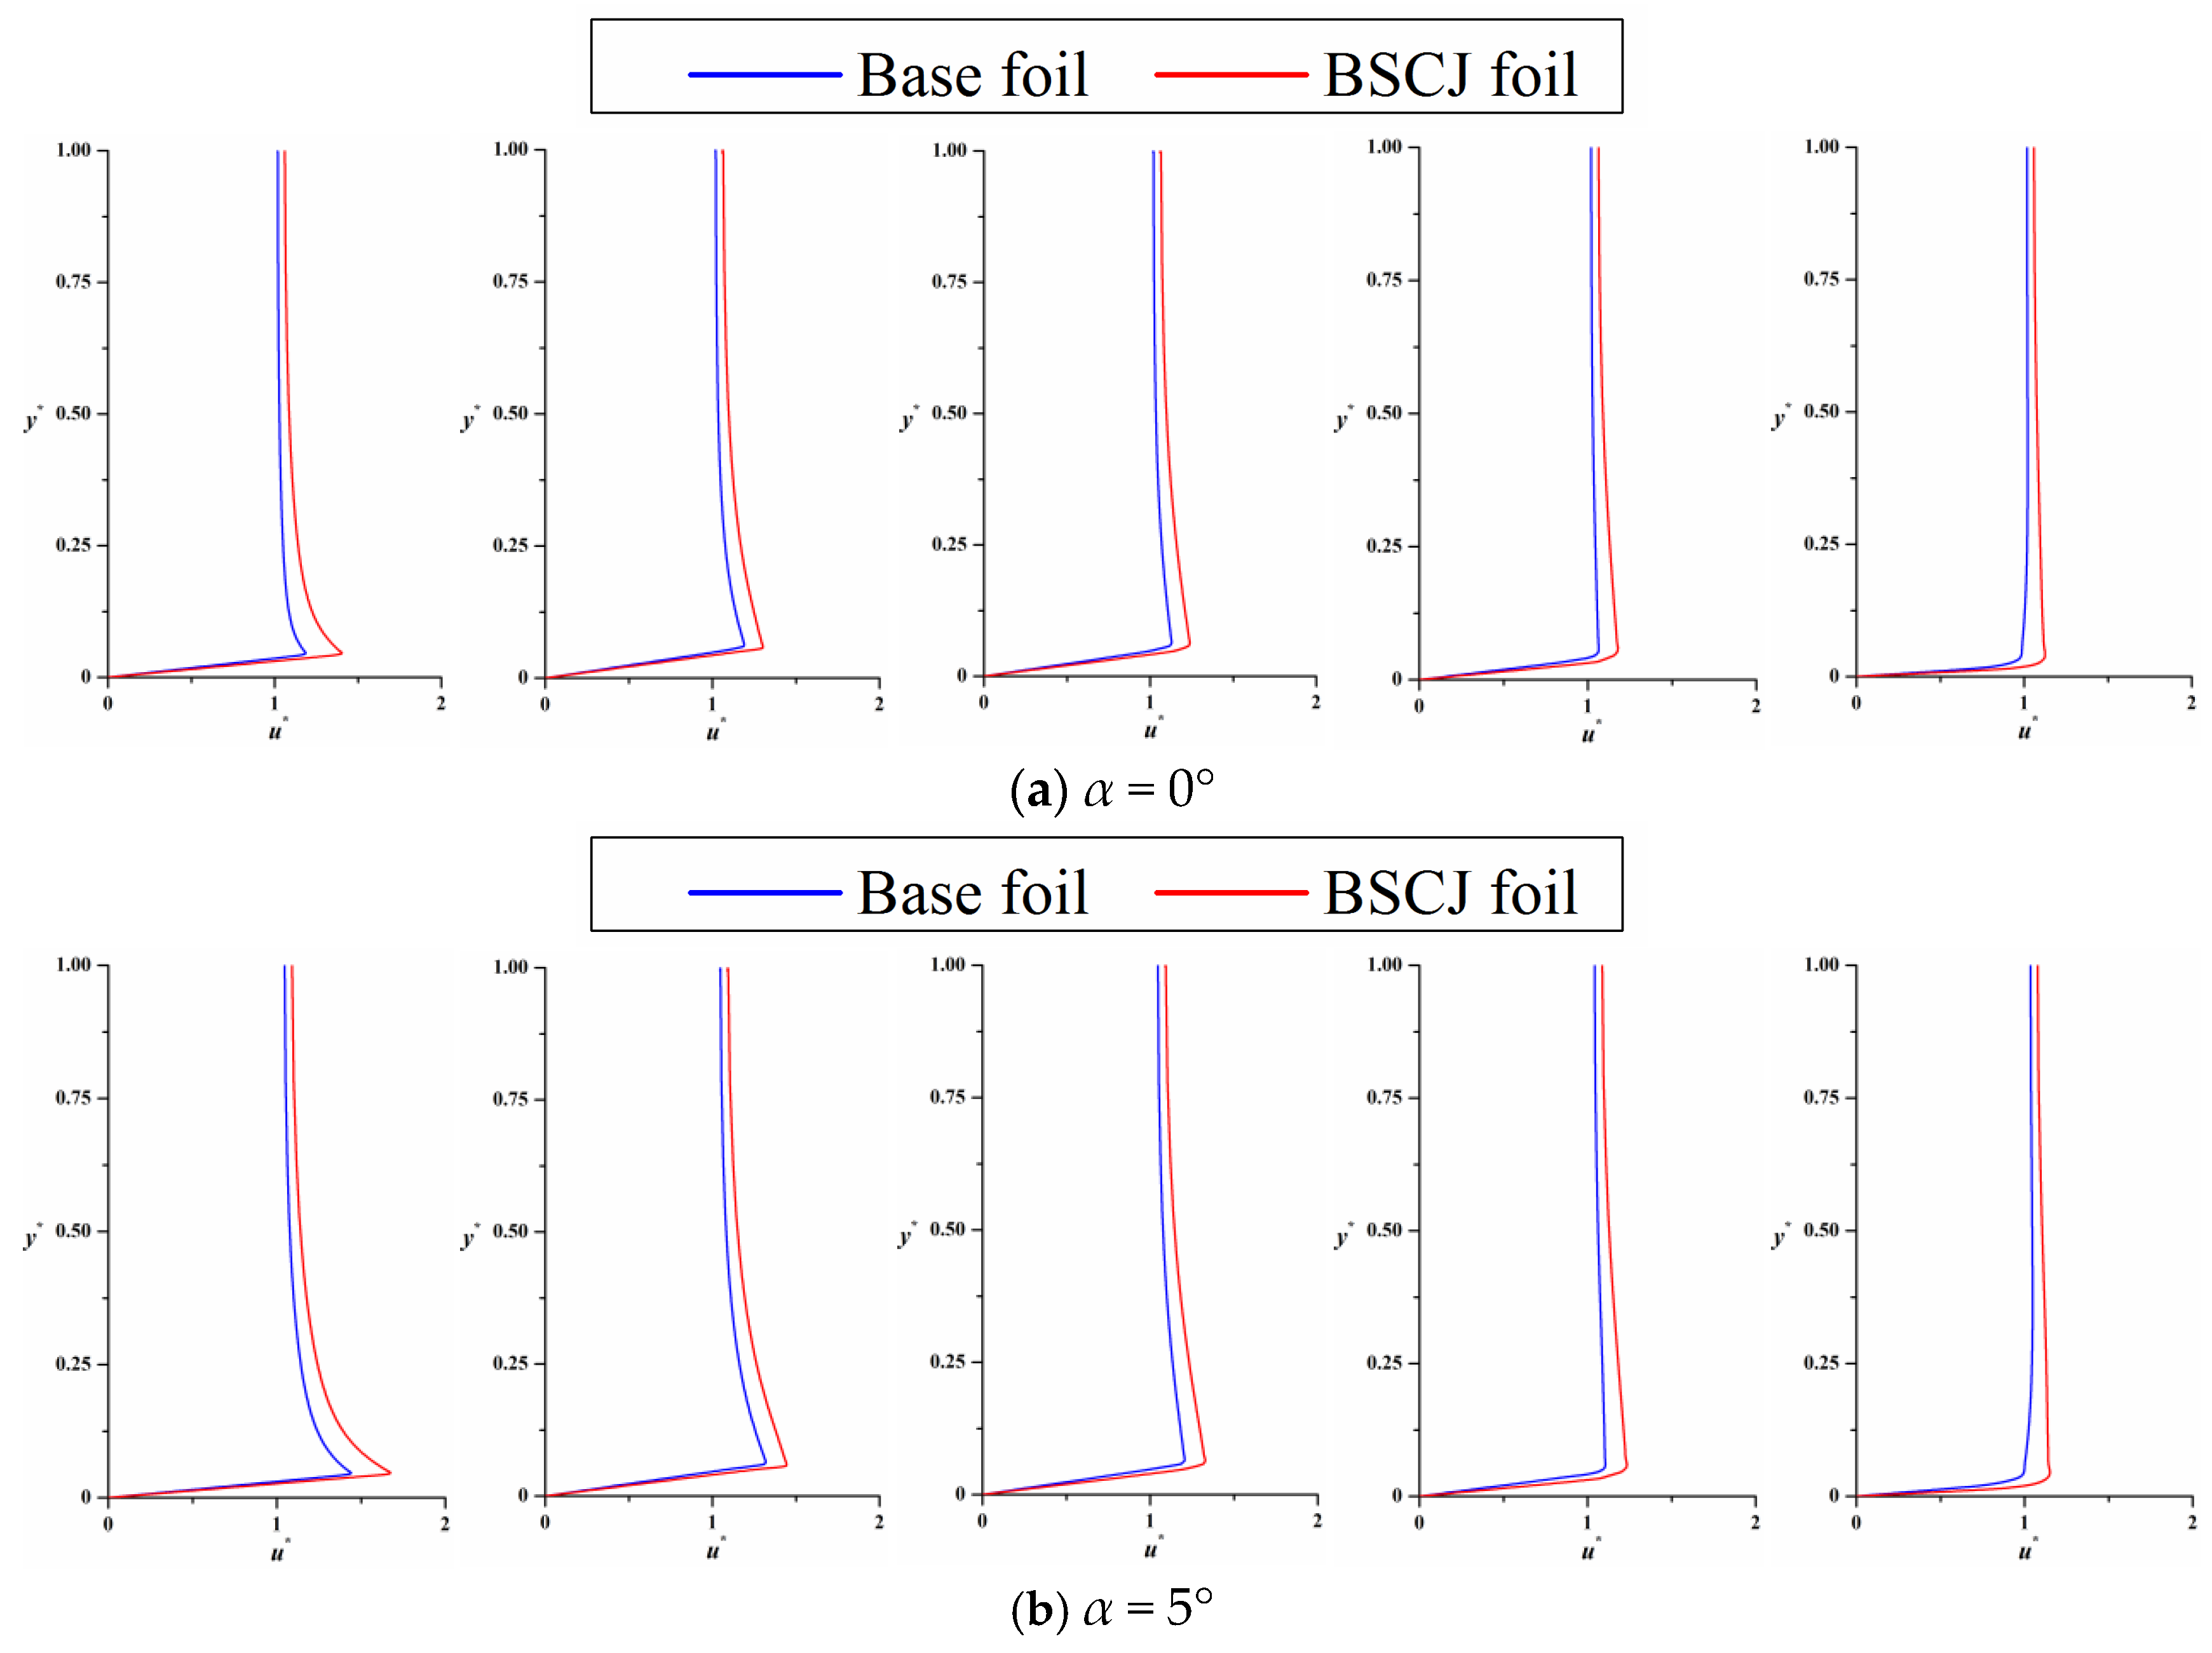
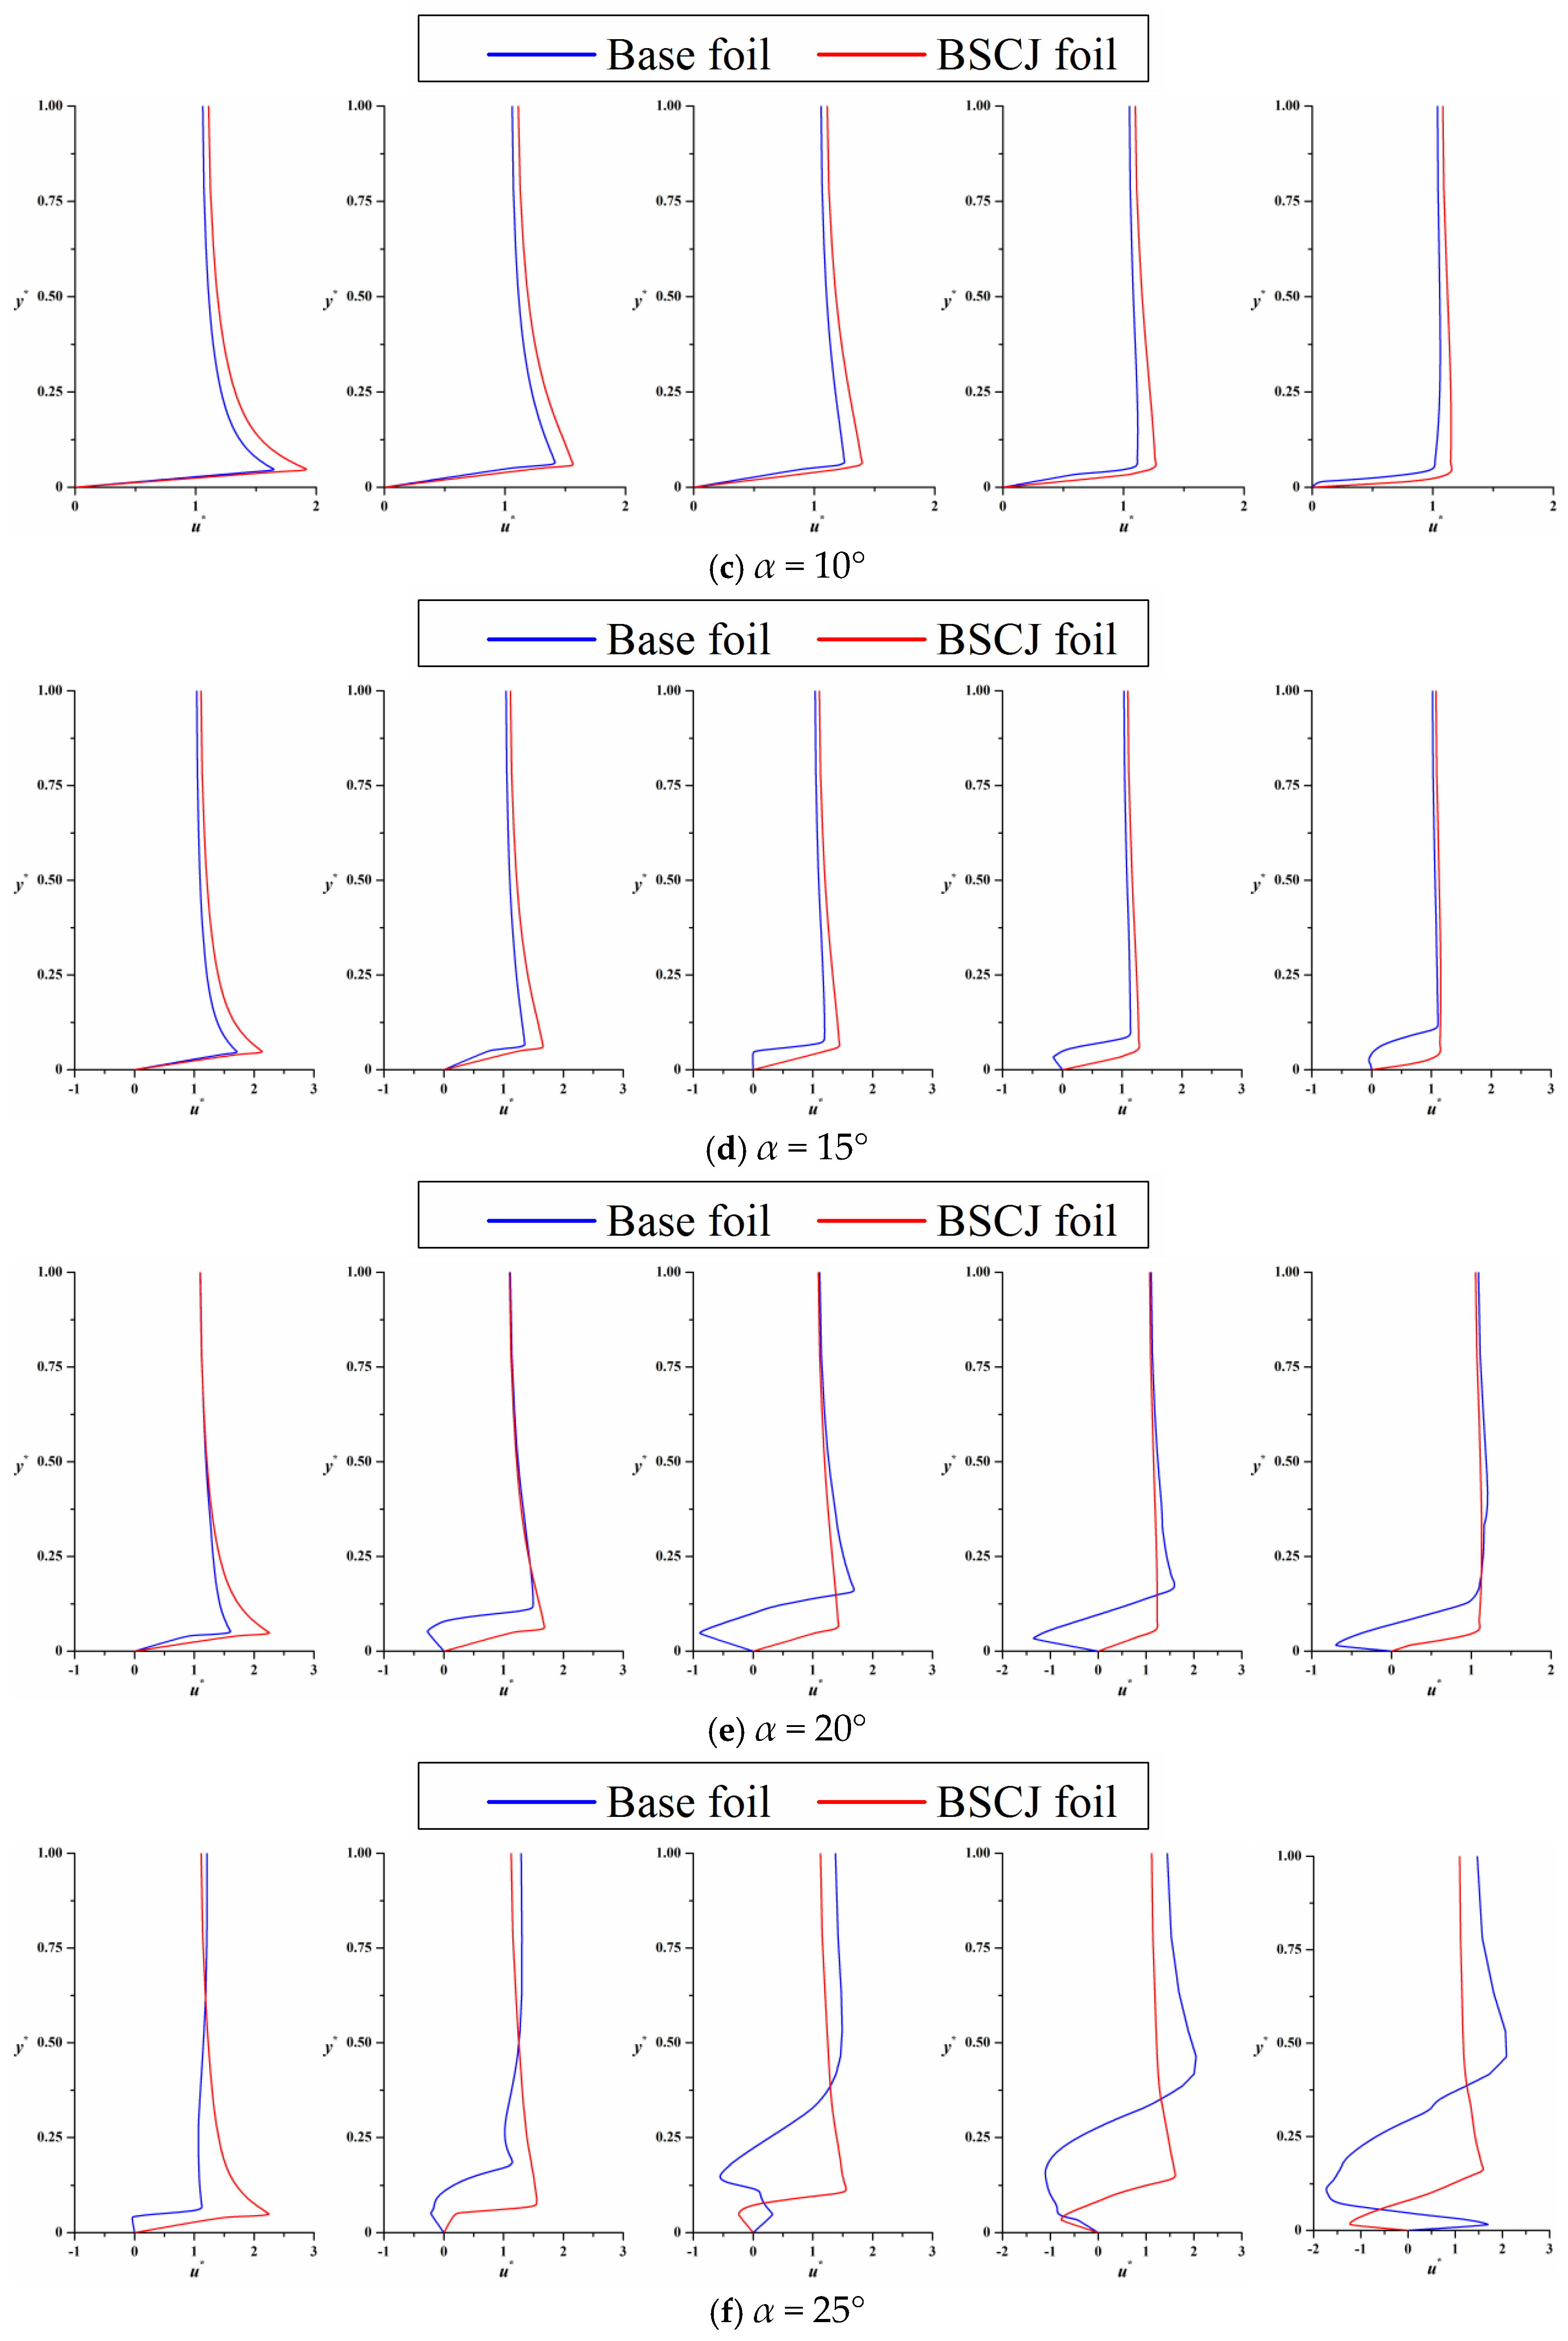
The low-momentum fluid on the surface of the hydrofoil is removed by the blowing/suction jet of the BSCJ hydrofoil, the corresponding velocity gradient of the boundary layer is reduced, and the ability to resist the adverse pressure gradient is enhanced, therefore the hydrodynamic performance of the BSCJ hydrofoil is better than that of the traditional hydrofoil.

Author Contributions

Methodology, conceptualization, investigation, writing—original draft preparation, Y.L. (Yongcheng Li); software, validation, data curation, C.S.; writing—review and editing, resources, project administration, Z.P.; funding acquisition, Y.L. (Yinghua Li). All authors have read and agreed to the published version of the manuscript.

Funding

Support from the National Key Laboratory of Hydrodynamics (funding number 97331625) is acknowledged.

Data Availability Statement

Data are contained within the article.

Conflicts of Interest

The authors declare no conflicts of interest.

References

  1. Wang, F.; Liu, J.; Qin, H. Unsteady aerodynamic characteristics of slender body at extra-wide angle-of-attack range. Aerosp. Sci. Technol. 2021, 110, 106477. [Google Scholar] [CrossRef]
  2. Obeid, O.; AlQadi, I.; AlMutairi, J. Investigation of asymmetric flow past a slender body at high angles of attack. Theor. Comput. Fluid Dyn. 2019, 33, 481–508. [Google Scholar] [CrossRef]
  3. Zhu, Y.; Yuan, H.; Lee, C. Experimental investigations of the initial growth of flow asymmetries over a slender body of revolution at high angles of attack. Phys. Fluids. 2015, 27, 084103. [Google Scholar] [CrossRef]
  4. Wang, H.; Luo, Z.; Deng, X. Enhancement of flying wing aerodynamics in crossflow at high angle of attack using dual synthetic jets. Aerosp. Sci. Technol. 2025, 156, 109773. [Google Scholar] [CrossRef]
  5. Kumar, P.; Prasad, J. Mechanism of side force generation and its alleviation over a slender body. J. Spacecr. Rockets 2016, 53, 195–208. [Google Scholar] [CrossRef]
  6. Kamakoli, G.; Mansour, K. Determining the side force appearance and its magnitude over a slender body at high angle of attack. Thermophys. Aeromech. 2021, 28, 919–930. [Google Scholar] [CrossRef]
  7. Li, Y.; Zhang, L.; Gao, C. Investigation of Asymmetric Flow of a Slender Body with Low-Aspect Ratio Fins Having Large Deflection Angles. Aerospace 2024, 11, 835. [Google Scholar] [CrossRef]
  8. Ganguly, A.; Gupta, A. Going in circles: Slender body analysis of a self-propelling bent rod. Phys. Rev. Fluids 2023, 8, 014103. [Google Scholar] [CrossRef]
  9. Zhang, X.; Cao, N.; Ni, Z. Study on the asymmetric separation characteristics of slender body at high angle of attack under lateral jet conditions. J. Phys. Conf. Ser. 2022, 2381, 012086. [Google Scholar] [CrossRef]
  10. Benkherouf, T.; Mekadem, M.; Oualli, H.; Hanchi, S.; Keirsbulck, L.; Labraga, L. Efficiency of an auto-propelled flapping airfoil. J. Fluids Struct. 2011, 27, 552–566. [Google Scholar] [CrossRef]
  11. Karthikeyan, K.V.; Harish, R. Advancements in Flow Control Using Plasma Actuators: A Comprehensive Review. Eng. Res. Express 2025, 7, 012502. [Google Scholar] [CrossRef]
  12. Yokoyama, H.; Nagao, N.; Tokai, K. Control of flow and acoustic fields around an axial fan utilizing plasma actuators. J. Fluids Eng. 2025, 147, 011201. [Google Scholar]
  13. Baldan, G.; Manara, F.; Frassoldati, G. The effects of turbulence modeling on dynamic stall. Acta Mech. 2025, 236, 1411–1427. [Google Scholar]
  14. Zheng, B.; Yao, W.; Xu, M. Enhancing the Goman–Khrabrov dynamic stall model through flow delay analysis. Phys. Fluids 2025, 37, 015172. [Google Scholar]
  15. Liu, Y.; Nan, Q.; Chen, C. The influence of shield effect of high-pressure water jet on rock breakage. Geoenergy Sci. Eng. 2025, 246, 213578. [Google Scholar]
  16. Aziz, M.; Khalifa, M.; Abdelrahman, M. Multi-slotted airfoil design for enhanced aerodynamic performance and economic efficiency. Sci. Rep. 2025, 15, 4290. [Google Scholar] [CrossRef]
  17. Qiang, P.; Li, R.; Han, W. Mechanism of tandem cascade slot jet control for gas–liquid separation in multiphase pumps. Phys. Fluids 2025, 37, 013368. [Google Scholar]
  18. Müller-Vahl, H.F.; Nayeri, C.N.; Paschereit, C.O.; Greenblatt, D. Dynamic stall control via adaptive blowing. Renew. Energy 2016, 97, 47–64. [Google Scholar]
  19. Wahidi, R.; Bridges, D. Effects of distributed suctionon an airfoil at low Reynolds number. AIAA J. 2012, 50, 523–539. [Google Scholar]
  20. Sun, Y.; Qian, Y.; Wang, T. Quantitative impact of combining blowing and suction flow control on a floating offshore wind turbine aerodynamic performance under the surge motion. Renew. Energy 2025, 238, 121945. [Google Scholar]
  21. Tu, W.; Shu, D.; Gu, X. Effect of scour-hole dimensions on the failure mechanism of suction caisson for offshore wind turbine in clay. Ocean Eng. 2025, 320, 120320. [Google Scholar]
  22. Gao, B.; Li, C.; Zhou, F. Shaking table tests of offshore wind turbine systems with a suction bucket foundation in sandy seabed subject to earthquake and wind loads. Mar. Struct. 2025, 99, 103706. [Google Scholar]
  23. Patar, E.; Jin, H. Power extraction performance of three types of flapping hydrofoils at a reynolds number of 1.7e6. Renew. Energy 2025, 99, 103706. [Google Scholar]
  24. Posa, A.; Broglia, R.; Felli, M.; Falchi, M.; Balaras, E. Characterization of the wake of a submarine propeller via large-eddy simulation. Comput. Fluids 2019, 184, 138–152. [Google Scholar]
  25. Li, Z.; Du, S. Experimental Optimization Design and Statistical Analysis; China Science Press: Beijing, China, 2010. [Google Scholar]
Figure 1. Schematic diagram of BSCJ hydrofoil. (a) Front view and (b) perspective view.
Jmse 13 00651 g001
Figure 2. Schematic diagram of calculation domain. Left: perspective view, right: side view.
Jmse 13 00651 g002
Figure 3. Grid distribution on the surface of hydrofoil.
Jmse 13 00651 g003
Figure 4. Grid at typical section of computational domain.
Jmse 13 00651 g004
Figure 5. Grid independence test results.
Jmse 13 00651 g005
Figure 6. Time step test results.
Jmse 13 00651 g006
Figure 7. Schematic diagram of experiment setup. (a) Schematic diagram of force measurement. (b) Experimental photo.
Jmse 13 00651 g007
Figure 8. Accuracy verification results.
Jmse 13 00651 g008
Figure 9. Comparison results of hydrodynamic coefficients. (a) Lift force coefficient. (b) Drag force coefficient.
Jmse 13 00651 g009
Figure 10. Vortex structures and streamline of foil with/out BSCJ at different angles of attack.
Jmse 13 00651 g010
Figure 11. Vortex structures of base foil and BSCJ foil at α = 25° (left: base foil; right: BSCJ foil).
Jmse 13 00651 g011
Figure 12. Pressure coefficient distribution of the foil at the mid-span section of the foil under various typical angles. (a) α = 0°. (b) α = 5°. (c) α = 10°. (d) α = 15°. (e) α = 20°. (f) α = 25°.
Jmse 13 00651 g012
Figure 13. Normal velocity distribution on the surface of the base foil and BSCJ foil.
Jmse 13 00651 g013aJmse 13 00651 g013b
Figure 14. Distribution of turbulent kinetic energy around the foil with/without BSCJ.
Jmse 13 00651 g014
Table 1. Orthogonal design table.
FactorsLevels
123
A (Ls)0 C0.1 C0.2 C
B (Lb)0 C0.1 C0.2 C
C (K)0.0010.010.1
Table 2. Orthogonal test combination and results.
Serial No.Factors C L ¯ ζ ¯
ABC
10.15 C0 C0.11.09026.051
20.15 C0.1 C0.010.88223.674
30.15 C0.2 C0.0010.67319.650
40.25 C0 C0.0010.66720.870
50.25 C0.1 C0.11.11532.322
60.25 C0.2 C0.010.82625.658
70.35 C0 C0.010.84329.470
80.35 C0.1 C0.0010.59219.832
90.35 C0.2 C0.11.15828.134
Table 3. Orthogonal test combination and results for C L ¯ .
FactorsMean Value of Level 1Mean Value of Level 2Mean Value of Level 3
A0.8820.8690.864
B0.8670.8630.886
C1.1210.8500.644
Table 4. Orthogonal test combination and results for K C ¯ .
FactorsMean Value of Level 1Mean Value of Level 2Mean Value of Level 3
A23.12526.28325.812
B25.46325.27624.480
C28.83526.26720.117
Disclaimer/Publisher’s Note: The statements, opinions and data contained in all publications are solely those of the individual author(s) and contributor(s) and not of MDPI and/or the editor(s). MDPI and/or the editor(s) disclaim responsibility for any injury to people or property resulting from any ideas, methods, instructions or products referred to in the content.

