Abstract
Environmental temperature declines significantly impact the physiological processes of marine organisms, particularly under the cool La Nina conditions, challenging yellowfin tuna (Thunnus albacares) aquaculture. Low temperatures affect fish metabolism and immune functions and can alter the gut microbiota composition, influencing health and growth. This study investigates the impact of low temperatures on the gut microbiota of juvenile yellowfin tuna. Fish were divided into a Low Temperature (LT) group (24 °C), an Ultra Low Temperature (ULT) group (18 °C), and a Control group (CG) (30 °C), with evaluations at 0, 12, 24, and 36 h using α-diversity analysis and microbial species composition. Results indicated a significant increase in the Ace index for the ULT group after 36 h of cold stress (p < 0.05), with no significant changes in the Shannon index. A decline in Proteobacteria and increases in Verrucomicrobiota and Firmicutes were observed in both LT and ULT groups. Additionally, both LT and ULT groups showed a significant rise in the Ace index at 36 h (p < 0.05), with a significant decrease in the Shannon index in the ULT group at 24 h. Furthermore, Firmicutes significantly increased at 12 h in both temperature groups (p < 0.05). These findings highlight the potential role of the gut microbiome in adapting yellowfin tuna to cold environments and provide microbial insights into their physiological adaptations, laying a foundation for further research and practical applications in aquaculture under cold conditions.
1. Introduction
The microbial communities within fish are diverse, comprising protozoa, fungi, yeasts, viruses, bacteria, and archaea [1]. Among these, bacteria are the most abundant microbes in the fish gut, playing crucial roles in digestion, immune regulation, and nutrient metabolism [2]. Compared to terrestrial animals, the gut microbial communities in fish exhibit greater complexity across different aquatic environments. Aquatic microbes can interact with the host through fish gills, skin, and intestines, forming a dynamically balanced ecosystem [3]. Studies have indicated that gut microbes are involved in physiological processes such as vitamin synthesis, lipid metabolism, and nitrogen cycling within the fish [4]. However, tuna possess a unique thermoregulatory mechanism known as regional endothermy, which allows them to maintain higher temperatures in certain tissues, such as the brain and muscles, compared to the surrounding environment [5]. This thermoregulatory ability is not present in all tuna species but is particularly evident in those within the Thunnini tribe. This adaptation enables tuna to function efficiently in colder waters, avoiding thermal stress that typically affects ectothermic fish [6]. The thermoregulatory mechanism in tuna may influence the response of their gut microbiota to cold stress, as warmer body tissues experience less temperature fluctuation. In contrast, fish that do not regulate their body temperature, such as Cyprinus carpio and Micropterus salmoides, may undergo more significant changes in microbiota composition and activity under cold stress [7]. Nonetheless, current research on the impacts of cold stress on the gut microbiota of tuna remains insufficient. Most studies on the gut microbiota and temperature stress in fish have focused on other ectothermic species [8]. Research has shown that in ectothermic species like zebrafish (Danio rerio), the composition and function of the gut microbiota change under low-temperature conditions, particularly the abundance of microbes related to immune regulation and metabolism [9,10]. However, similar research is scarce for species with advanced thermoregulatory abilities, such as tuna.
Yellowfin tuna (Thunnus albacares), a high-speed pelagic species, not only holds a significant position in the global fishery market but also serves as an important apex predator in marine ecosystems [11]. Widely distributed across global tropical and subtropical waters, yellowfin tuna thrive in warm waters and exhibit strong temperature adaptability [12]. Studies have shown that the optimal growth temperature for yellowfin tuna in the Western Indian Ocean typically ranges from 20 to 30 °C. Within this temperature range, their metabolic rate remains high, their growth rate is maximized, and their gut microbiota maintains greater stability and diversity. However, temperatures below 18 °C may negatively impact metabolism, growth, and the stability of the gut microbial community [13]. However, due to the variability of marine environments, their habitat is often affected by external climate changes, particularly temperature fluctuations [14]. Influenced by the La Nina phenomenon, significant low-temperature variations have recently occurred in the South China Sea [15]. La Nina typically leads to cooler sea temperatures in the central and eastern equatorial Pacific, triggering global climate anomalies, especially intensifying cold air activities in Asia [16]. These abnormal low-temperature variations disrupt the marine ecosystem in the South China Sea and profoundly affect aquatic life. Water temperature is a critical ecological factor that influences the growth, reproduction, and survival of marine fish, and drastic changes can impose significant physiological and metabolic stress, forcing fish to adapt to these environmental shifts [17,18]. For fish, low temperatures pose not just a physical challenge but also a biological stress, significantly impacting their metabolic rate, growth, reproduction, and behavioral patterns [19]. In cold environments, the gut microbial communities in fish are also significantly affected [20]. Research indicates that low temperatures can alter the structure of microbial communities within the fish gut, affecting the diversity and functionality of these microbes [8]. In a study by Lv et al. on large yellow croaker (Larimichthys crocea), when water temperatures dropped from 12 °C to 8 °C, significant changes occurred in the diversity and abundance of gut microbiota [21]. These findings further demonstrate the impact of low temperatures on fish health and adaptability through changes in gut microbial communities.
Under cold stress conditions, metabolic activities in fish may slow down, altering the flow of nutrients, and thereby affecting the balance of microbial communities [22]. Additionally, microbes with cold tolerance may become selectively enriched in the gut under certain low-temperature conditions, while species coexisting in warmer waters might diminish or disappear [23]. These microbial changes can affect not only the efficiency of digestion and absorption in fish but also impact their immune systems, as gut microbes play a crucial role in regulating host immune responses [24,25]. Studies have shown that under low temperatures, a decrease in beneficial bacteria and an increase in harmful bacteria can lead to dysbiosis, further triggering intestinal health issues such as impaired gut barrier functions and heightened inflammatory responses [26,27]. For juvenile yellowfin tuna, cold stress could exacerbate physiological burdens such as impaired metabolism, reduced immune function, and compromised cellular processes, further affecting the stability and functionality of their gut microbiota. Moreover, the gut microbiota of juveniles is not fully matured, making them relatively vulnerable to environmental changes and susceptible to the effects of cold stress [28].
In this study, we set the minimum experimental water temperature at 18 °C. This decision is based on actual observations of winter water temperatures in the northern South China Sea under the influence of extreme cold currents. Under La Nina conditions, sea surface temperatures in this region can drop to 18 °C, representing one of the lowest temperatures that yellowfin tuna may encounter in their natural environment [29]. Despite this, there remains limited research on the impact of low-temperature stress on the gut microbiota of yellowfin tuna. Therefore, our study compared the effects on gut microbiota at two different low temperatures (24 °C and 18 °C) relative to normal water temperature (30 °C) over 36 h, as well as the distribution characteristics of gut microbiota communities at 0, 12, 24, and 36 h under the two different low-temperature conditions. Utilizing high-throughput sequencing technology to analyze the gut microbiota, we focused on α-diversity and community distribution characteristics under different temperature treatments to clarify the impact of low-temperature stress on microbial community structure and function. Additionally, we explored the abundance changes in key functional microbial groups involved in metabolism and immune regulation under low-temperature stress conditions. Through these analyses, this study provides new insights into the physiological adaptation mechanisms of yellowfin tuna in response to climate change, offers foundational information on changes in the gut microbiota of yellowfin tuna in cold environments, and further supports the optimization of aquaculture environments and management strategies for yellowfin tuna.
2. Materials and Methods
2.1. Experimental Fish and Design
For this experiment, 180 juvenile yellowfin tuna (average body length: 30.26 ± 2.79 cm; average weight: 384.88 ± 58.04 g) were wild-caught from the waters off Xincun Town, Lingshui Li Autonomous County, Hainan Province. The fish were then provided by the Tropical Aquatic Product Research and Development Center of the South China Sea Fisheries Research Institute, China. The juvenile yellowfin tuna were placed in circular recirculating aquaculture tanks with a radius of 1.5 m and a height of 1.5 m, filled with 10 m3 of filtered seawater, and maintained with a daily water exchange rate of 300%. Before the experiment, the fish underwent a 7-day acclimation period in the experimental tanks. During acclimation, they were fed fresh chopped fish (2 × 2 cm) once daily at 8:00 a.m., at a feeding rate of 5–8% of body weight to satiation. Feeding was suspended one day before the experiment and throughout the trial. During the acclimation period, the fish were closely monitored, with no mortality or abnormal stress behaviors observed, and their feeding activity remained stable.
The experiment was divided into three groups: CG (30 °C, ambient water temperature), LT (24 °C, low temperature), and ULT (18 °C, ultra-low temperature). Each group had three replicate tanks, with 15 juvenile yellowfin tuna each, and lasted for 36 h. During the experiment, salinity was maintained at 32‰, dissolved oxygen (DO) > 7.50 mg·L−1, pH at 7.93 ± 0.12, ammonia nitrogen < 0.1 mg·L−1, and nitrite nitrogen < 0.05 mg·L−1. Temperature reduction in LT and ULT groups was achieved using a chiller (Haier, Qingdao, China) at a rate of 2 °C per hour until the set temperatures were reached. Sampling occurred at 0, 12, 24, and 36 h during cold exposure, with three fish randomly selected from each tank for analysis. The selected fish were anesthetized with an overdose of MS-222, and their intestines were rapidly excised for microbiota analysis. The excised intestinal tissues were immediately rinsed with sterile water, and their contents were carefully transferred into 1.5 mL sterile centrifuge tubes, which were then stored at −80 °C until further analysis.
2.2. DNA Extraction, PCR Amplification, and Construction of a 16S rDNA Library
According to the protocol provided with the DNA kit, total DNA was extracted from the intestinal contents of 36 samples using the TIANGEN Marine Animal Tissue DNA Extraction Kit (Tiangen Biotech Co., Beijing, China). The quantity and quality of the DNA were assessed using the Qubit 3.0 Fluorometer and agarose gel electrophoresis.
Specific primers designed for the Illumina MiSeq platform were used to PCR amplify the bacterial 16S rDNA gene V3-V4 hypervariable regions (Forward primer: 5′-ACTCCTACGGGAGGCAGCAG-3′, Reverse primer: 5′-GGACTACHVGGGTWTCTAAT-3′). Sequencing adapters were added to the PCR products to facilitate subsequent MiSeq sequencing. All PCR amplifications were performed in a 25 μL reaction mixture containing: 2.5 μL TransStart buffer, 2 μL dNTP mix, 1 μL of each primer, and 20 ng template DNA. The thermocycling conditions were as follows: initial denaturation at 94 °C for 3 min, denaturation at 94 °C for 5 min, annealing at 57 °C for 90 min, extension at 72 °C for 10 s, and a final extension at 72 °C for 5 min. The PCR amplicons were assessed for quality using 1.5% (w/v) agarose gel electrophoresis and purified with the Quick Gel Extraction Kit (Qiagen, Hilden, Germany). To ensure the reliability of sequencing data, a series of quality control measures were conducted prior to sequencing. DNA concentration and purity were measured using a Qubit 3.0 fluorometer, and DNA integrity was evaluated via agarose gel electrophoresis. Only samples meeting the following criteria were selected for downstream library construction and sequencing: DNA concentration ≥ 10 ng/µL, A260/A280 ratio between 1.8 and 2.0, and intact DNA bands without significant degradation. Samples that did not meet these criteria were excluded from further analysis. Additionally, no-template controls (NTCs) were included in the PCR process to detect potential contamination. Only PCR products that met the required concentration and quality standards were used for library construction and high-throughput sequencing.
2.3. Bioinformatics Analysis
The gene library concentration was measured using the Qubit 3.0 spectrophotometer and normalized to 10 nM. According to the instructions, it was then loaded onto an Illumina MiSeq system for high-throughput sequencing (Illumina, San Diego, CA, USA), using PE 300 for paired-end sequencing. Image analysis and base calling were conducted using the MiSeq Control Software (version 4.1.0) included with the MiSeq system [30]. Post-sequencing, paired-end read frames were added, and samples were classified based on barcodes, trimming barcodes, and primer sequences [31]. Quality filtering was performed based on linker sequences, removing reads with ambiguous bases, a quality score of Q ≥ 20, or shorter than 200 bp. Raw data were merged using Flash (version v1.2.7) and filtered with Qiime (version v1.9.1). Uchime analysis was then conducted to remove chimeric clusters from the sequencing data of each sample [32]. Effective data with 99% sequence identity were clustered into operational taxonomic units (OTUs) using Uparse (version 7.0.1001), and OTU taxonomic assignment was completed using the Ribosomal Database Project (RDP) classifier [33]. Representative sequences of OTUs were aligned using the Silva_128 16S rRNA database [34]. Rarefaction curves were analyzed with mothur (version v.1.30). Bacterial α-diversity indices, including the Shannon index (diversity), abundance-based coverage estimator (Ace index, richness), and coverage (Good’s coverage), were calculated using Qiime. Effective data were clustered into OTUs at 99% similarity using Uparse, and species annotation was performed using the RDP Classifier tool, based on the Green Genes database. Beta diversity analyses were conducted to compare microbial communities among different samples. Heatmaps were generated using the ‘ggplot2’ package in R [35], and principal component analysis was performed using UniFrac principal component analysis. The version of R used was R 4.0.5.
2.4. Statistical Analysis
Data were organized using Microsoft Excel 2021 and analyzed using SPSS version 26.0. All values are presented as means ± standard deviation (mean ± SD). For microbial community analysis, statistical differences were assessed using PERMANOVA with p < 0.05 considered statistically significant. The plots were generated using Origin 2021.
3. Results
3.1. Distribution of the 16S rRNA Gene Library
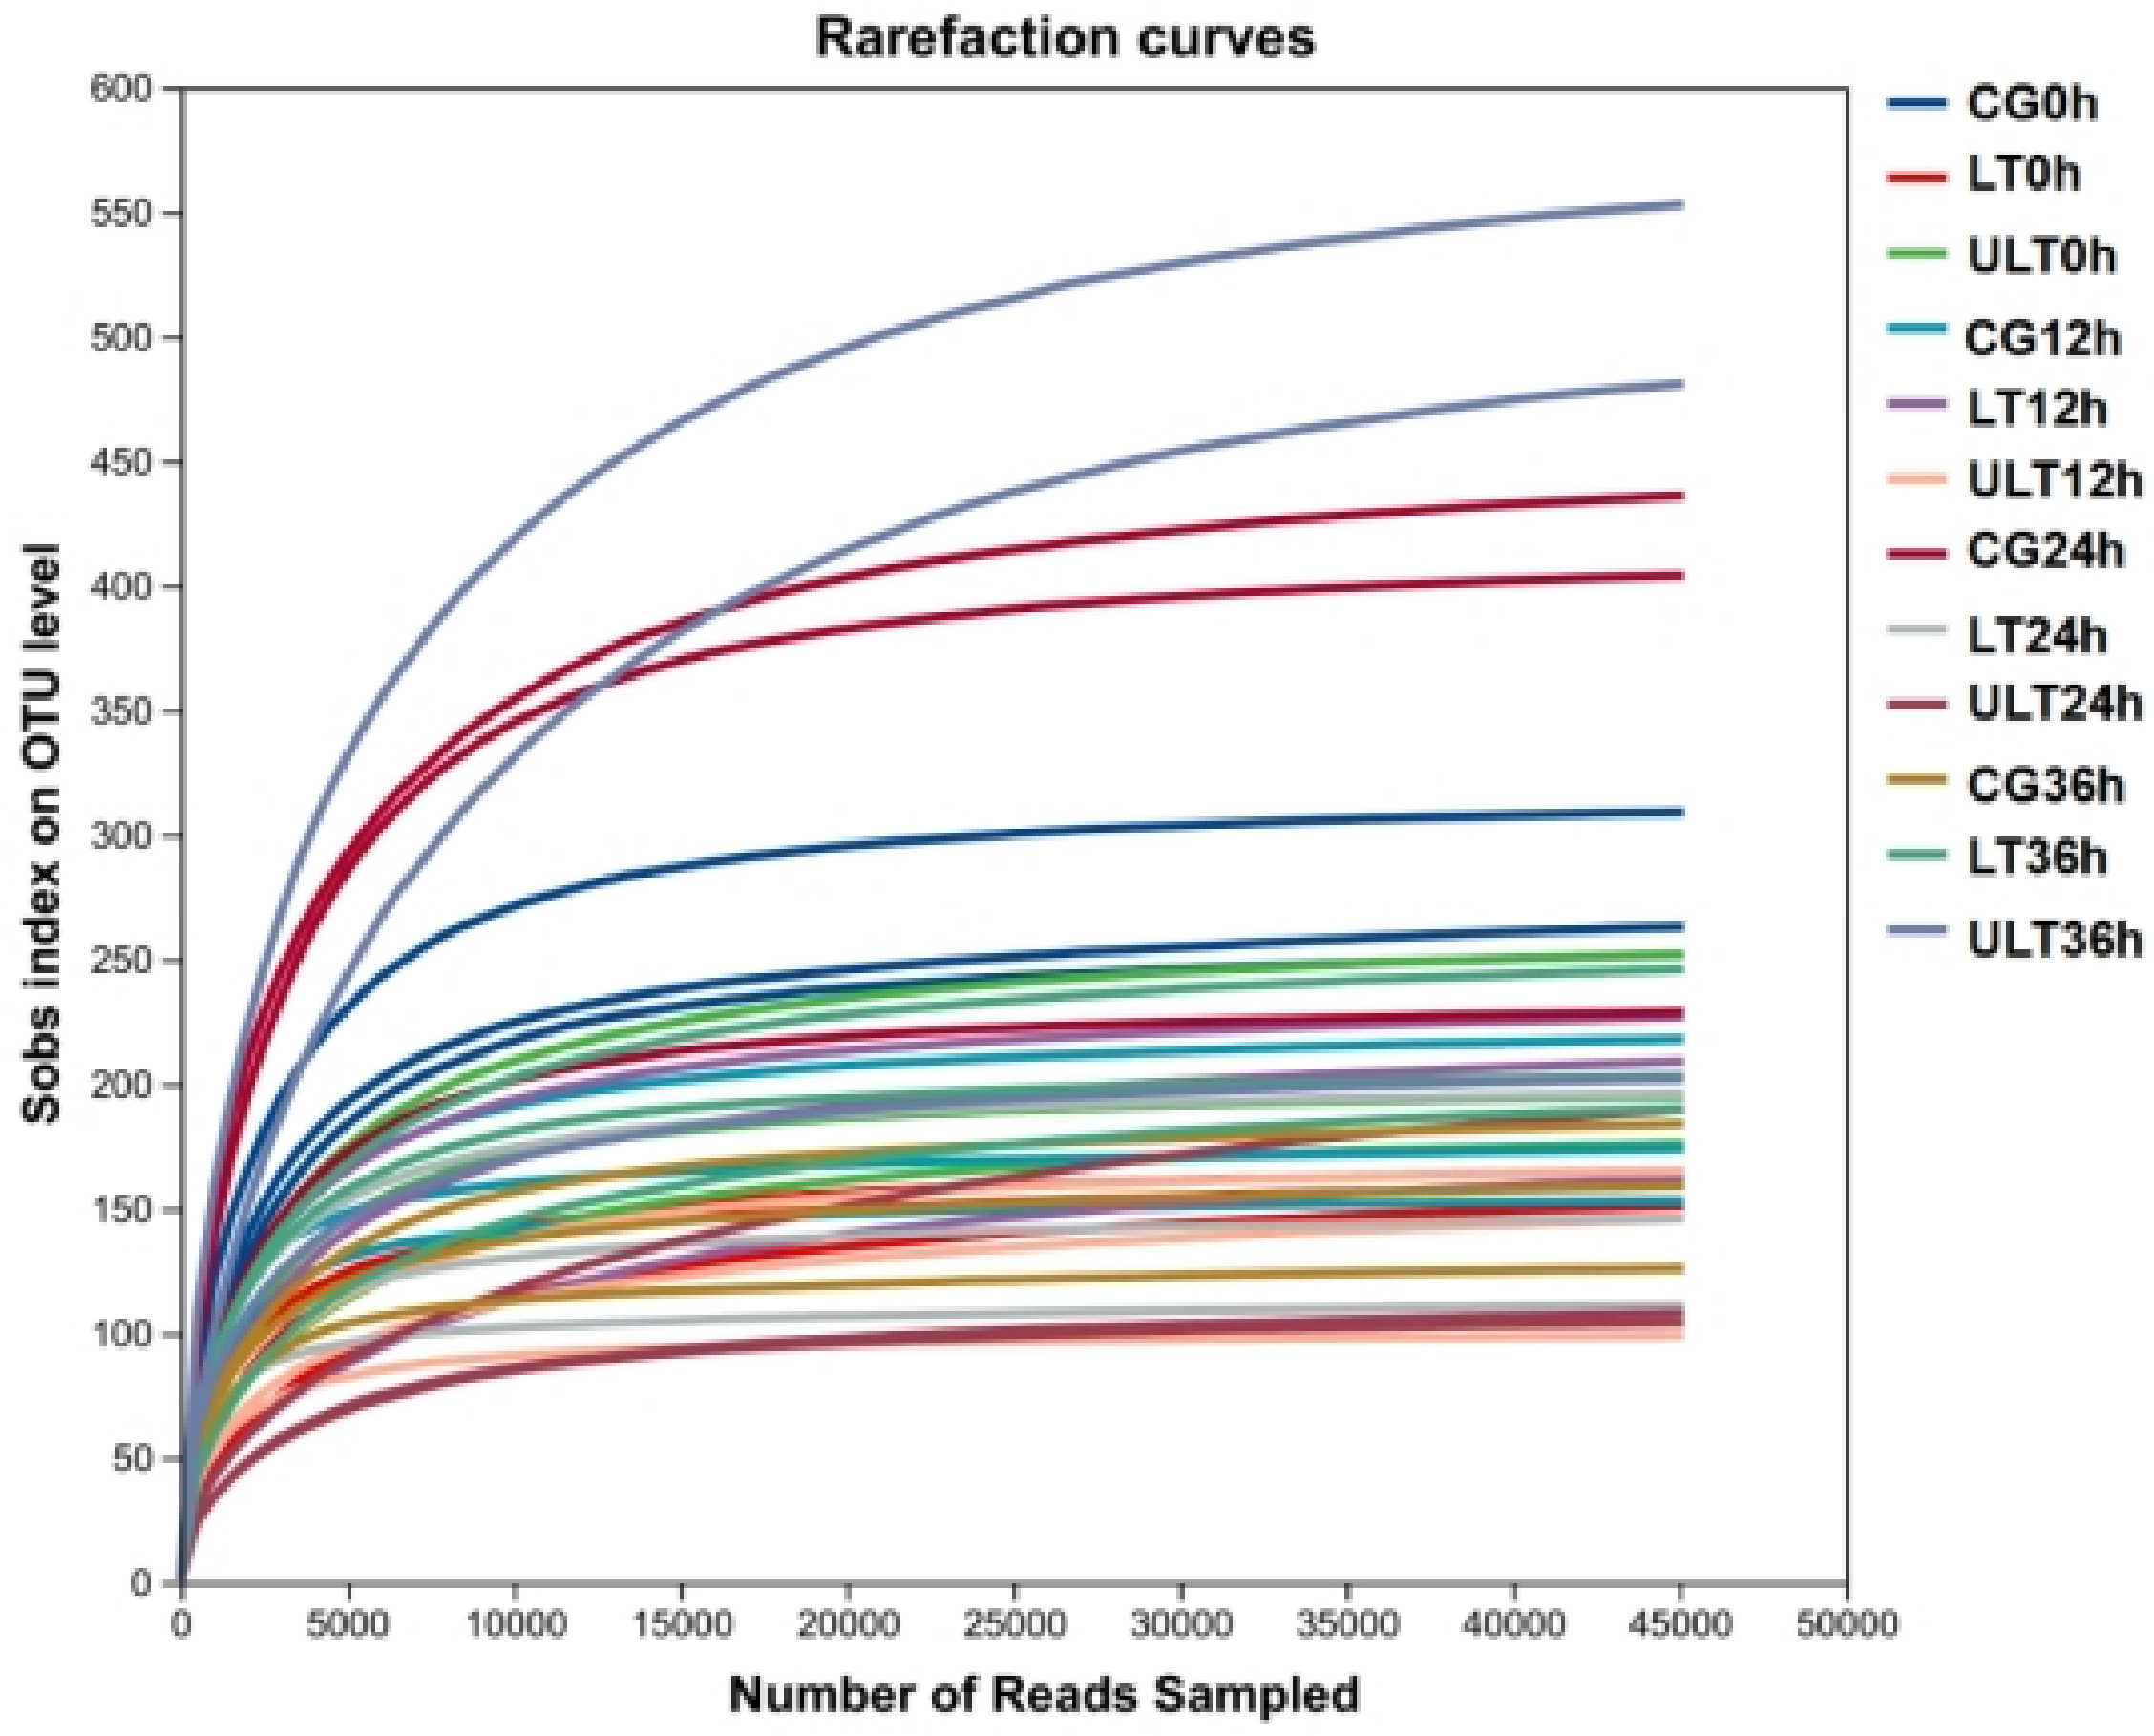
Following the processing of the 36 samples, a total of 2,126,867 effective sequences were obtained, with the number of sequences per sample ranging from 45,983 to 152,254, and an average sequence length of 421.13 bp (Table S1). Rarefaction curves (Figure 1) approached an asymptote as sequencing depth increased, indicating that additional sequencing would yield minimal new operational taxonomic units (OTUs), thus confirming sequencing saturation. Additionally, Good’s coverage values for all samples exceeded 99.8% (Table S2), further supporting that sequencing depth was sufficient to comprehensively capture microbiota diversity.
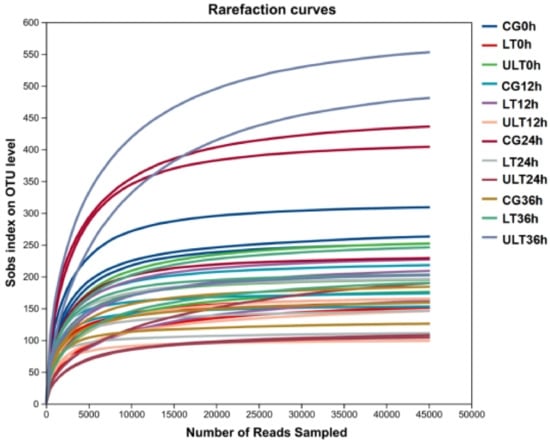
Figure 1.
Rarefaction curves of gut content samples from the CG, HT group, and ULT group under different durations of cold stress.
3.2. Analysis of α-Diversity and the Number of OTUs Among Different Treatment Groups
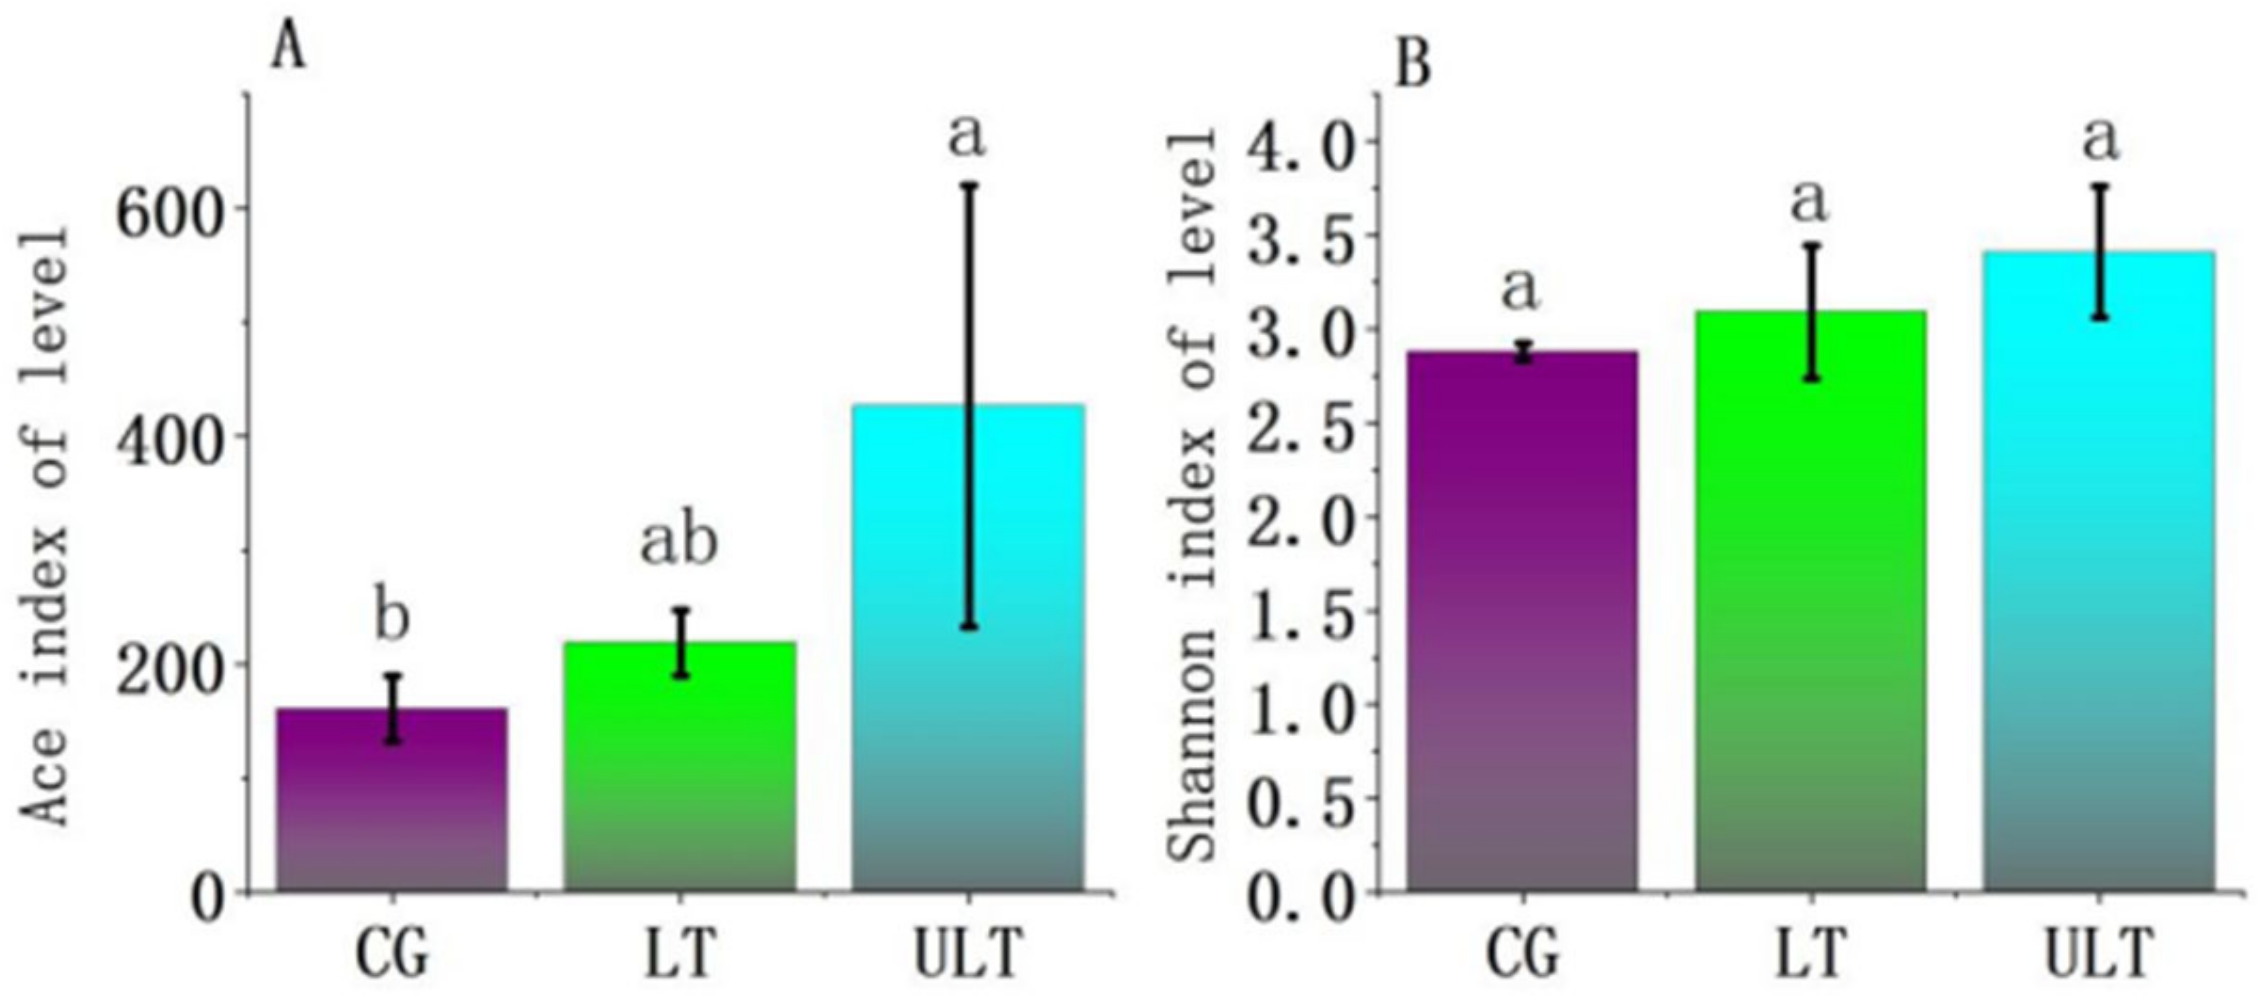
At 36 h into the experiment, α-diversity analyses were conducted for different experimental treatment groups (Figure 2). The Ace and Shannon indices, reflecting community richness and both diversity and evenness, respectively, were analyzed for the CG, LT group, and ULT group at 36 h of cold stress. Based on the Ace index (Figure 2A), the ULT group exhibited a significantly higher Ace index compared to the CG (p < 0.05), while the differences between CG and LT groups as well as between LT and ULT groups were not significant (p > 0.05). In the analysis based on the Shannon index (Figure 2B), there were no significant differences in the Shannon index among the three groups (p > 0.05).

Figure 2.
Analysis of α-diversity among different treatment groups ((A) Ace index diversity analysis; (B) Shannon index diversity analysis; different lowercase letters indicate significant differences between groups, p < 0.05).
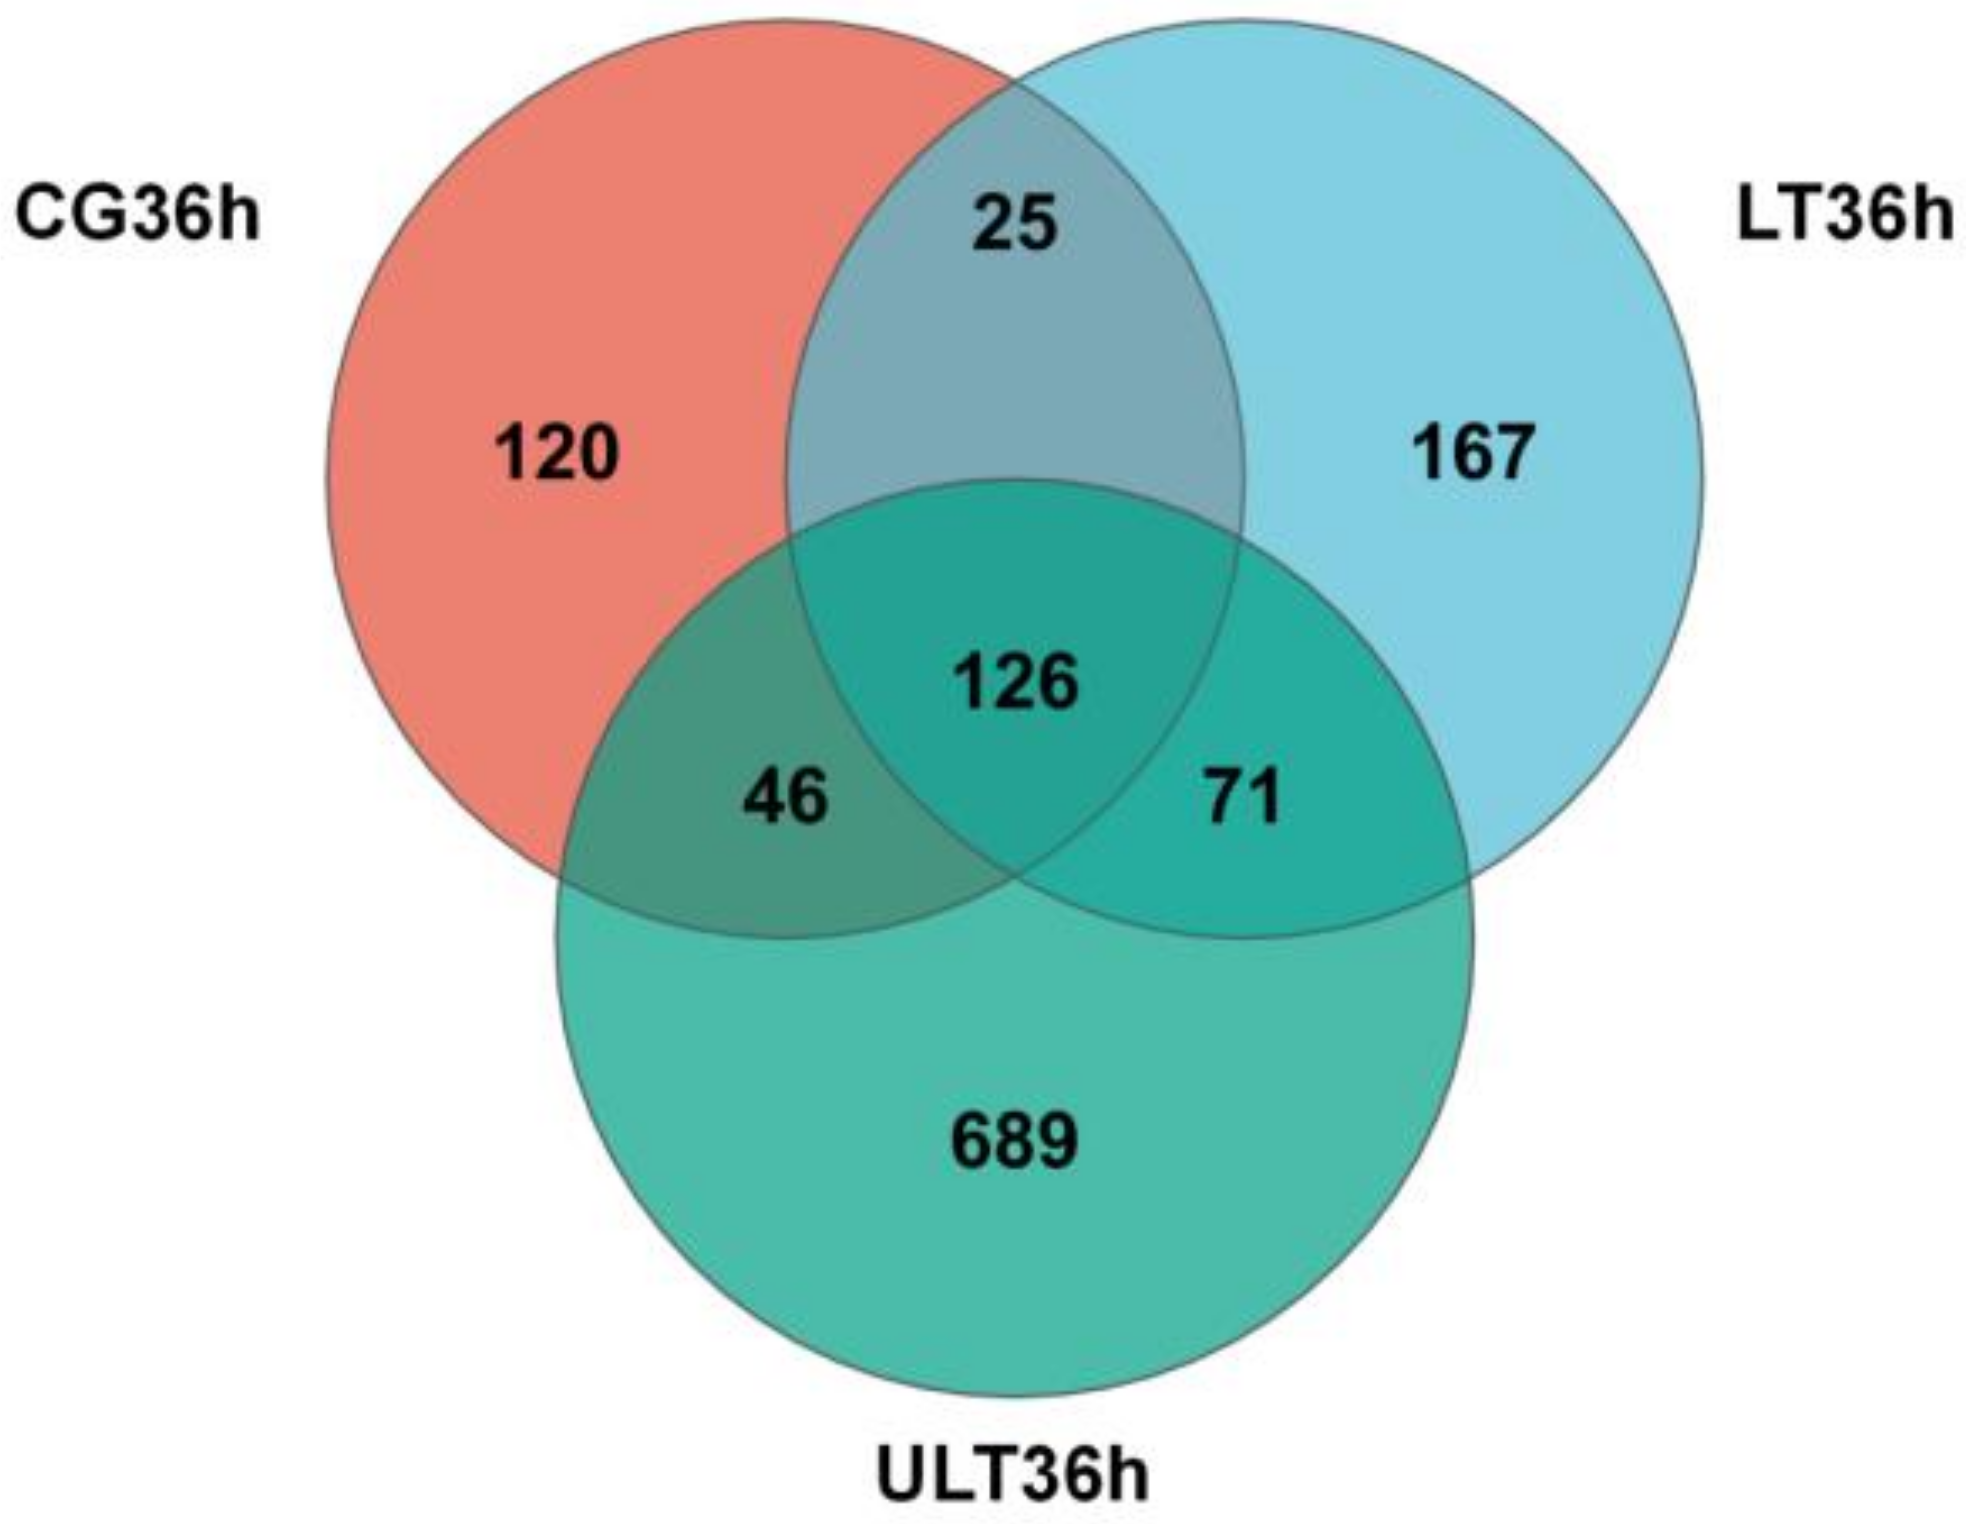
A Venn diagram was constructed to analyze the distribution of OTUs among the CG, HT group, and ULT group at 36 h (Figure 3). The total number of OTUs for the CG, HT group, and ULT group were 317, 389, and 932, respectively, consistent with the Ace and Shannon index results. After 36 h, there were 25 common OTUs between the CG and LT group, 46 common OTUs between the CG and ULT group, and 71 common OTUs between the LT and ULT groups. Specifically, there were 120 unique OTUs in the CG, 167 in the LT group, and 689 in the ULT group, with 126 OTUs shared among all three groups.

Figure 3.
Venn diagram analyzing the number of OTUs at 36 h among the CG, HT group, and ULT group.
3.3. Diversity and Composition of Gut Microbiota Among Different Treatment Groups
After 36 h of cold stress, the gut microbiota compositions of the different experimental groups varied at the phylum level. As shown in Figure 4, Proteobacteria was the most predominant phylum in the CG, LT group, and ULT group after 36 h of cold stress. With decreasing temperature, the proportion of Proteobacteria decreased, accounting for 93.6%, 83.7%, and 81.7% of the total bacterial count in the CG, HT group, and ULT group, respectively. Proteobacteria, Verrucomicrobiota, and Bacteroidota were dominant phyla in both the CG and ULT group. In the CG, Verrucomicrobiota and Bacteroidota represented 1.98% and 1.84% of the total bacterial count, respectively, and 12.53% and 1.61% in the LT group. However, there was a shift in the dominant phyla in the ULT group, where Proteobacteria, Firmicutes, and Bacteroidota were prevalent. In the ULT group, Firmicutes and Bacteroidota accounted for 9.05% and 3.73% of the total bacterial count, respectively.
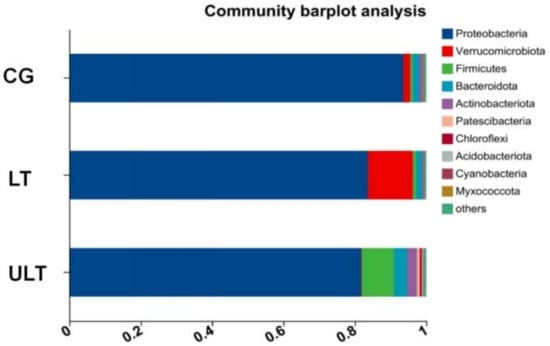
Figure 4.
Bar graph analysis of gut microbiota composition at the phylum level among different treatment groups.
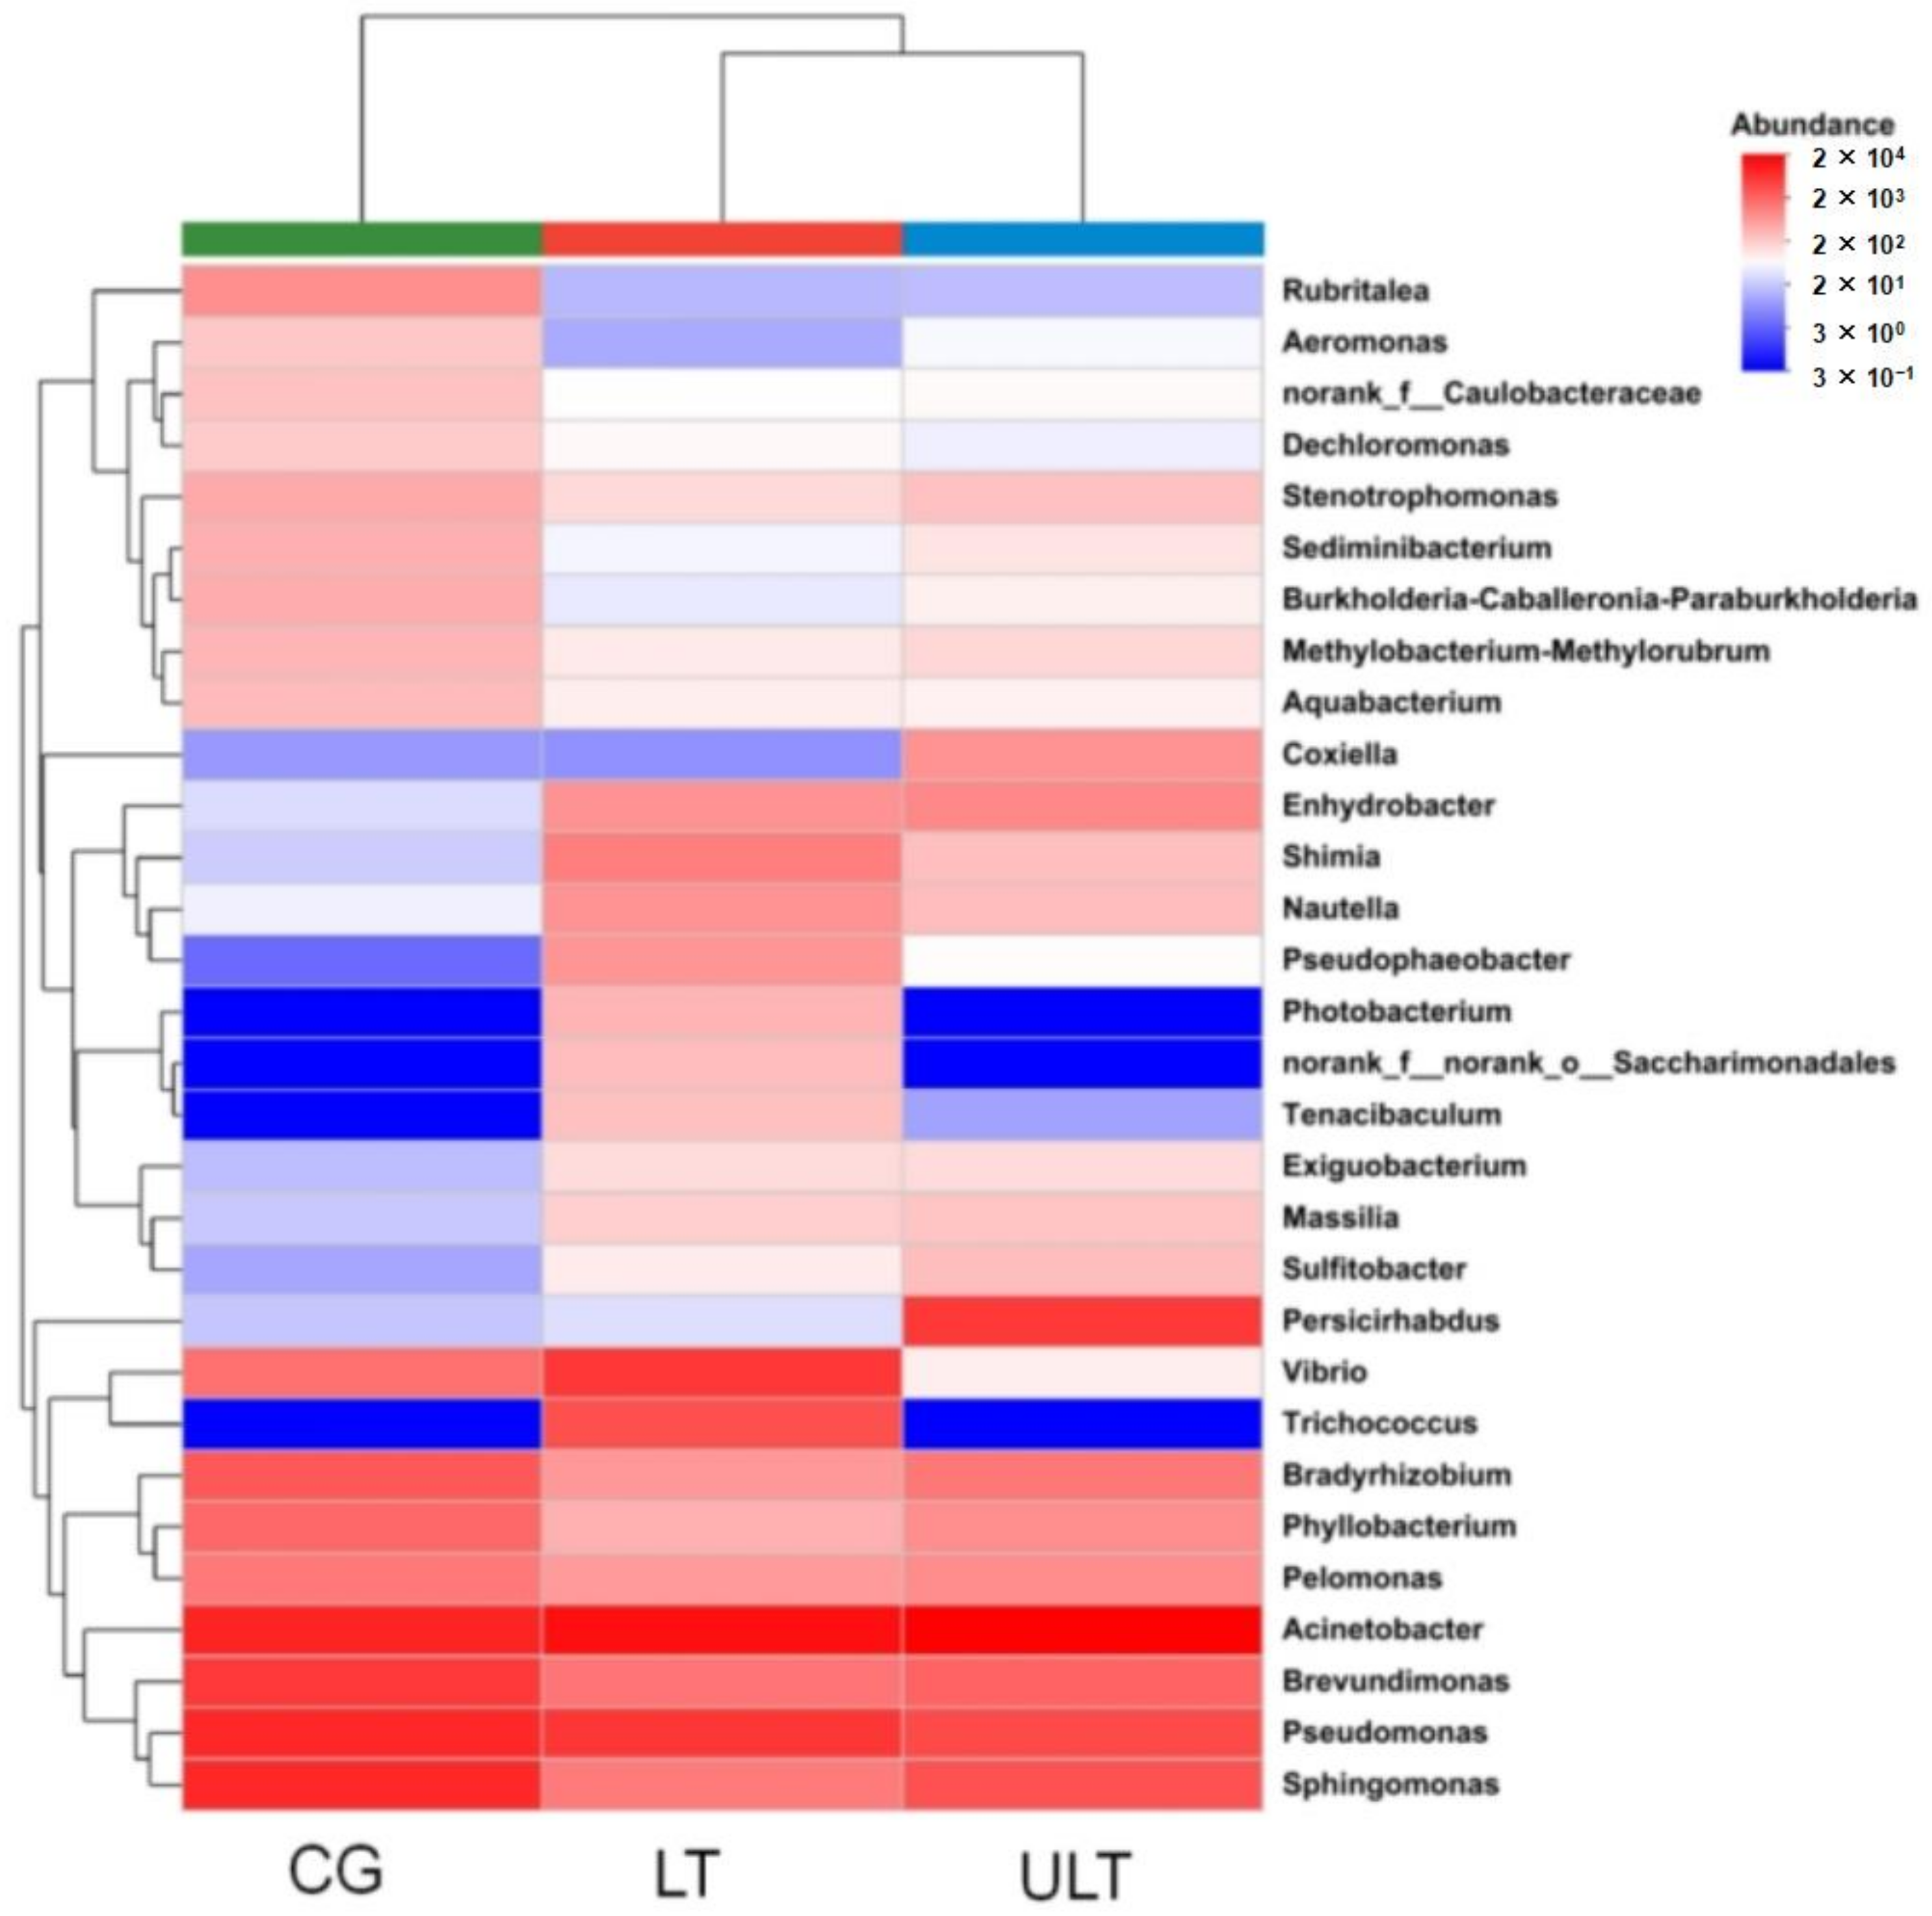
Cluster analysis of the gut microbiota at the genus level was conducted for the three treatment groups (Figure 5), including the 30 most abundant microbial genera in each group. The analysis revealed that the dominant genera in the CG were primarily Acinetobacter, Brevundimonas, Pseudomonas, and Sphingomonas. In the LT group and ULT group, the dominant genera differed from those in the CG. In the LT group, the predominant genera were Acinetobacter, Pseudomonas, and Trichococcus. In the ULT group, the dominant genera were Acinetobacter, Persicirhabdus, Pseudomonas, and Sphingomonas.

Figure 5.
Heatmap of the abundance of gut microbiota at the genus level across different treatment groups.
3.4. Analysis of α-Diversity and Distribution of OTUs over Time in Different Low-Temperature Treatment Groups
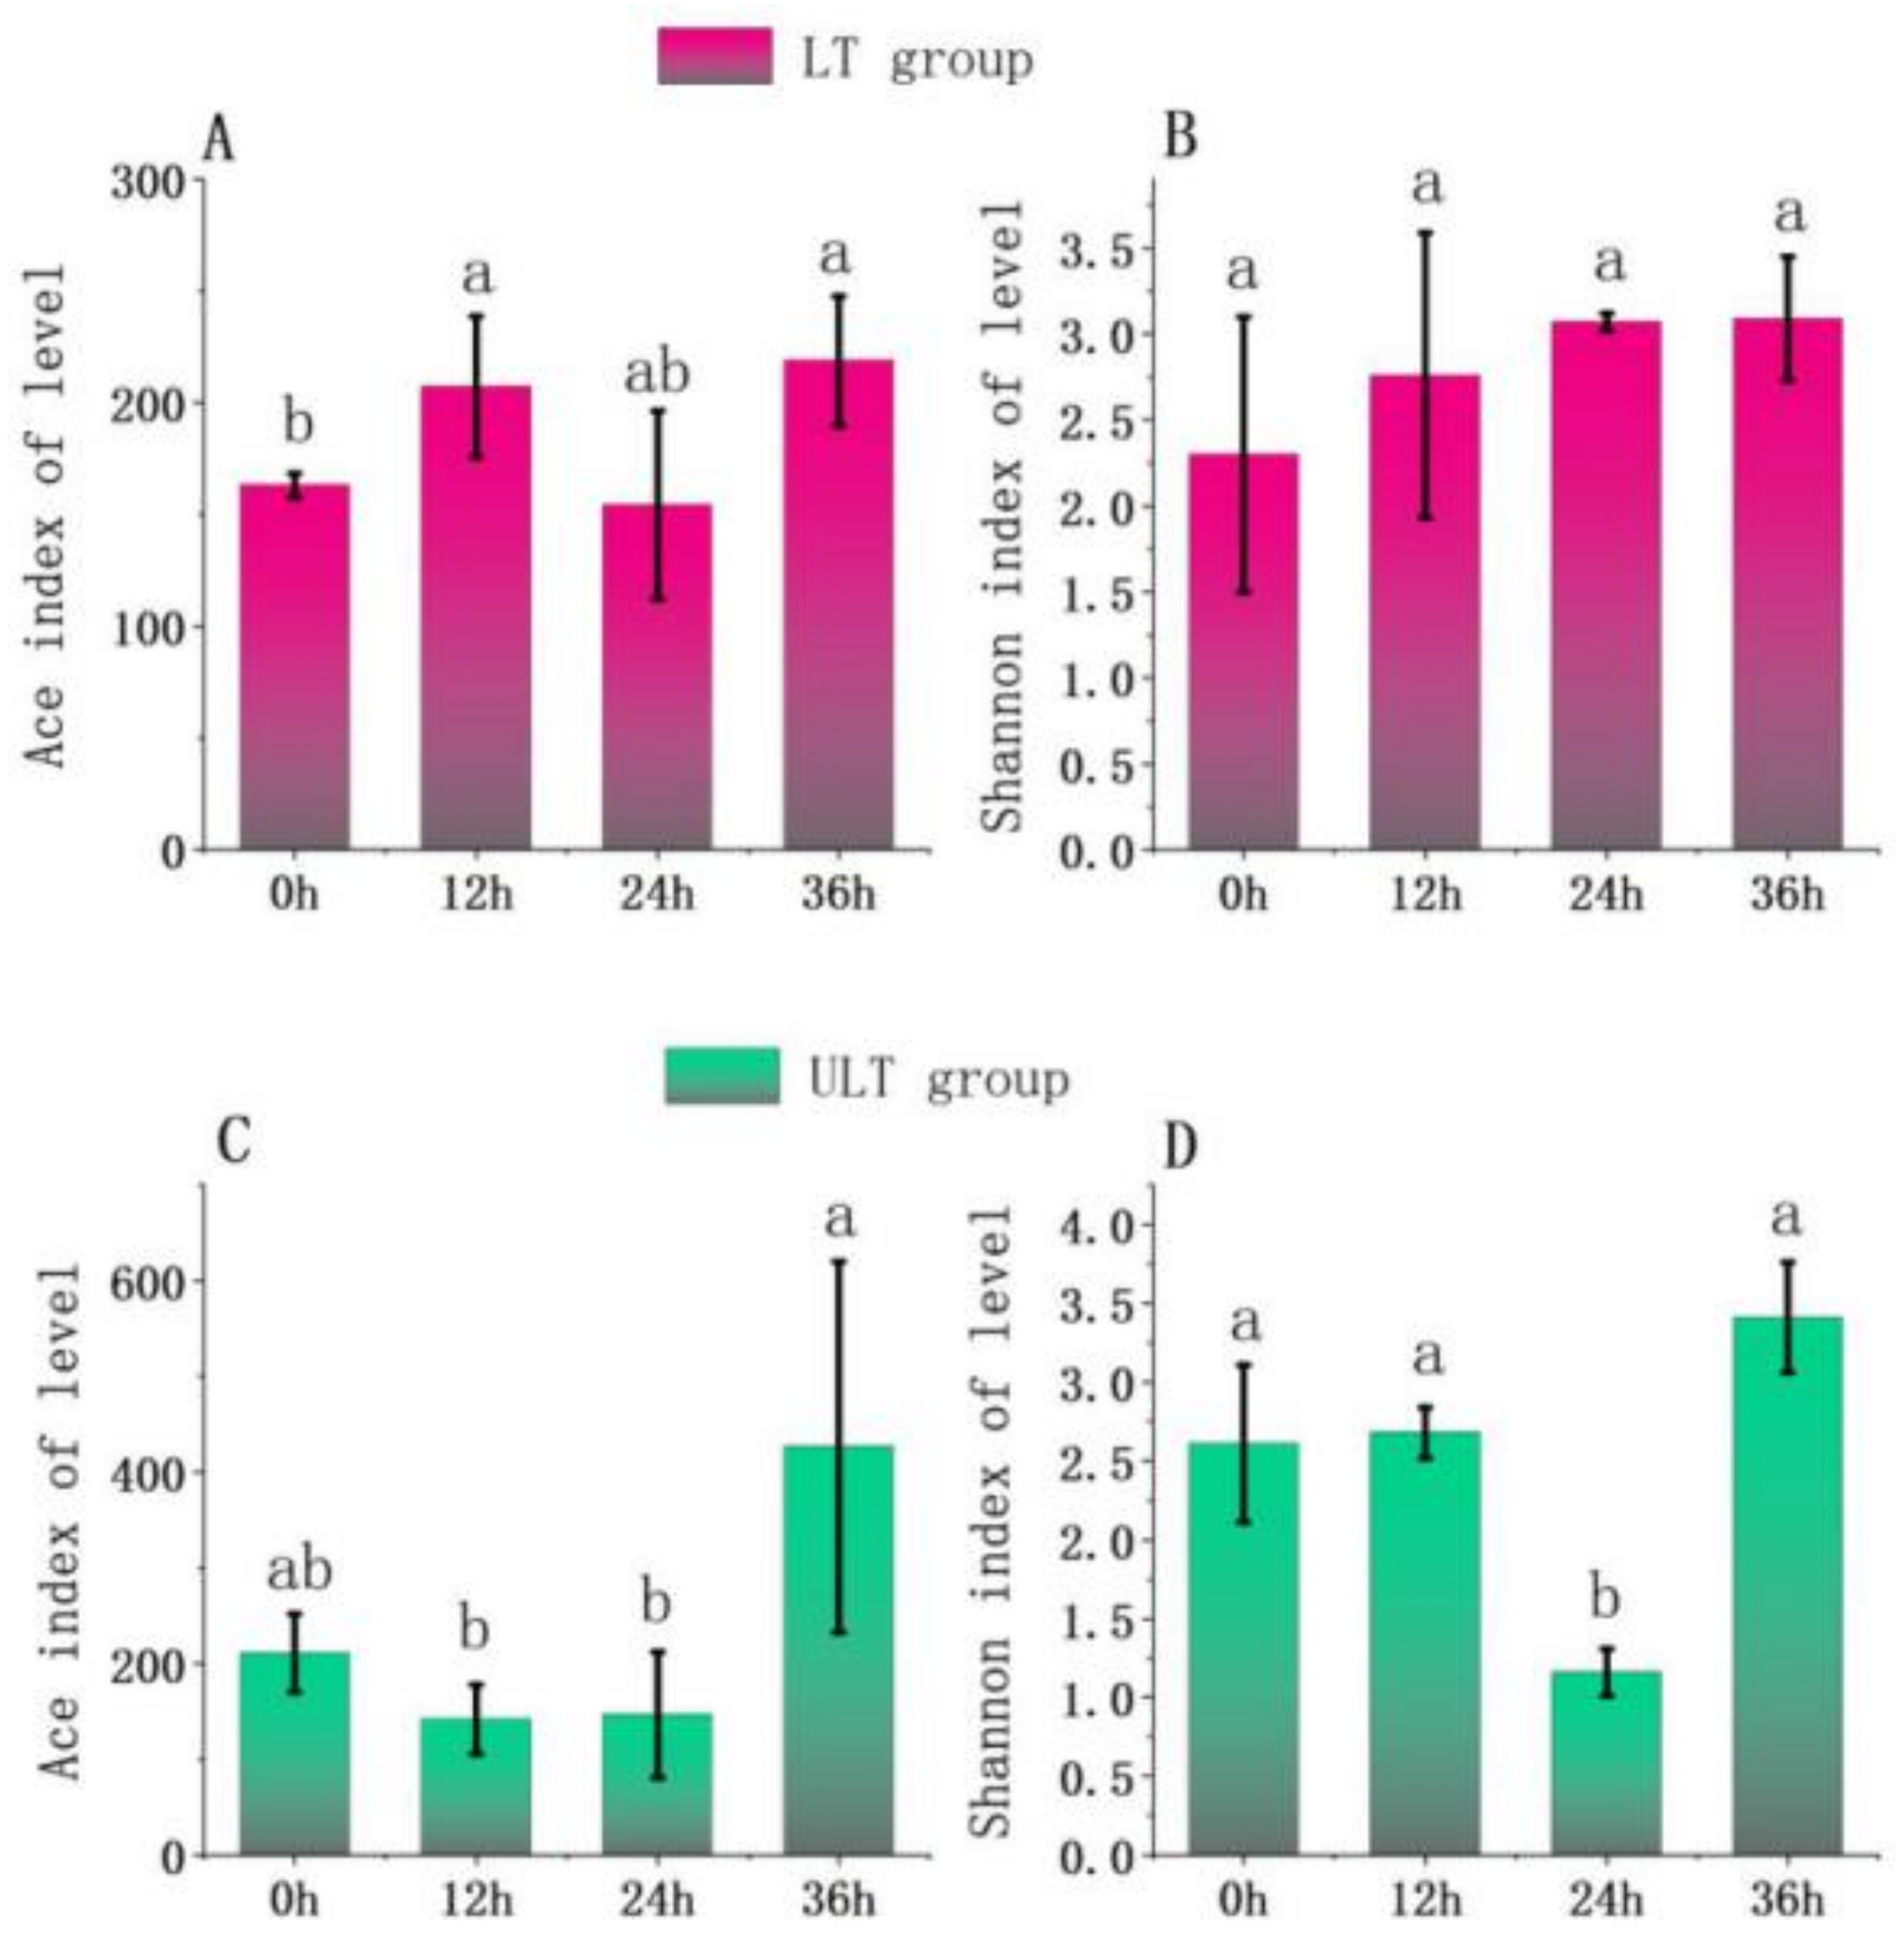
Analysis of α-diversity was conducted for two different low-temperature groups at various time intervals (Figure 6). After 36 h of cold stress, the LT group showed a significantly lower Ace index at 0 h compared to 12 h and 36 h (p < 0.05) (Figure 6A). The Shannon index in the LT group did not show significant differences across the stress periods (p > 0.05) (Figure 6B). For the ULT group, as depicted in Figure 7, the Ace index was significantly higher at 36 h compared to 12 h and 24 h (p < 0.05), but there was no significant difference compared to 0 h (p > 0.05). The Shannon index in the ULT group was significantly lower at 24 h compared to other time intervals (p < 0.05) (Figure 6D).
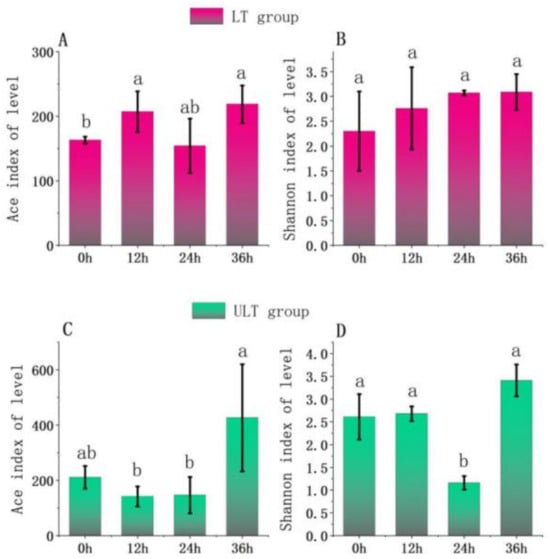
Figure 6.
Changes in richness and diversity indices of gut microbiota over time in LT and ULT groups ((A) Ace index for LT group; (B) Shannon index for LT group; (C) Ace index for ULT group; (D) Shannon index for ULT group; different lowercase letters indicate significant differences between groups, p < 0.05).
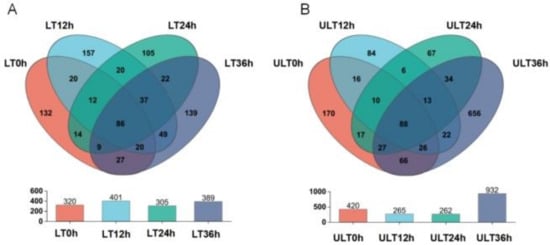
Figure 7.
Venn diagram analysis of OTU numbers at different time intervals under varying low-temperature stress conditions, with bar graphs showing the total number of OTUs at each time interval ((A) LT group; (B) ULT group).
Venn diagrams analyzing the distribution of OTUs over time under different low-temperature conditions are shown in Figure 7. In the LT group, the numbers of OTUs at 0, 12, 24, and 36 h were 320, 401, 305, and 389, respectively, with unique OTUs at these time points numbering 132, 157, 105, and 139, and 86 OTUs common across all four time points (Figure 7A). In the ULT group, the numbers of OTUs at 0, 12, 24, and 36 h were 420, 265, 262, and 932, respectively, with unique OTUs at these intervals numbering 179, 84, 67, and 656. The ULT group had 88 OTUs common across all four different time intervals (Figure 7B).
3.5. Diversity and Analysis of Gut Microbiota in Different Low-Temperature Treatment Groups
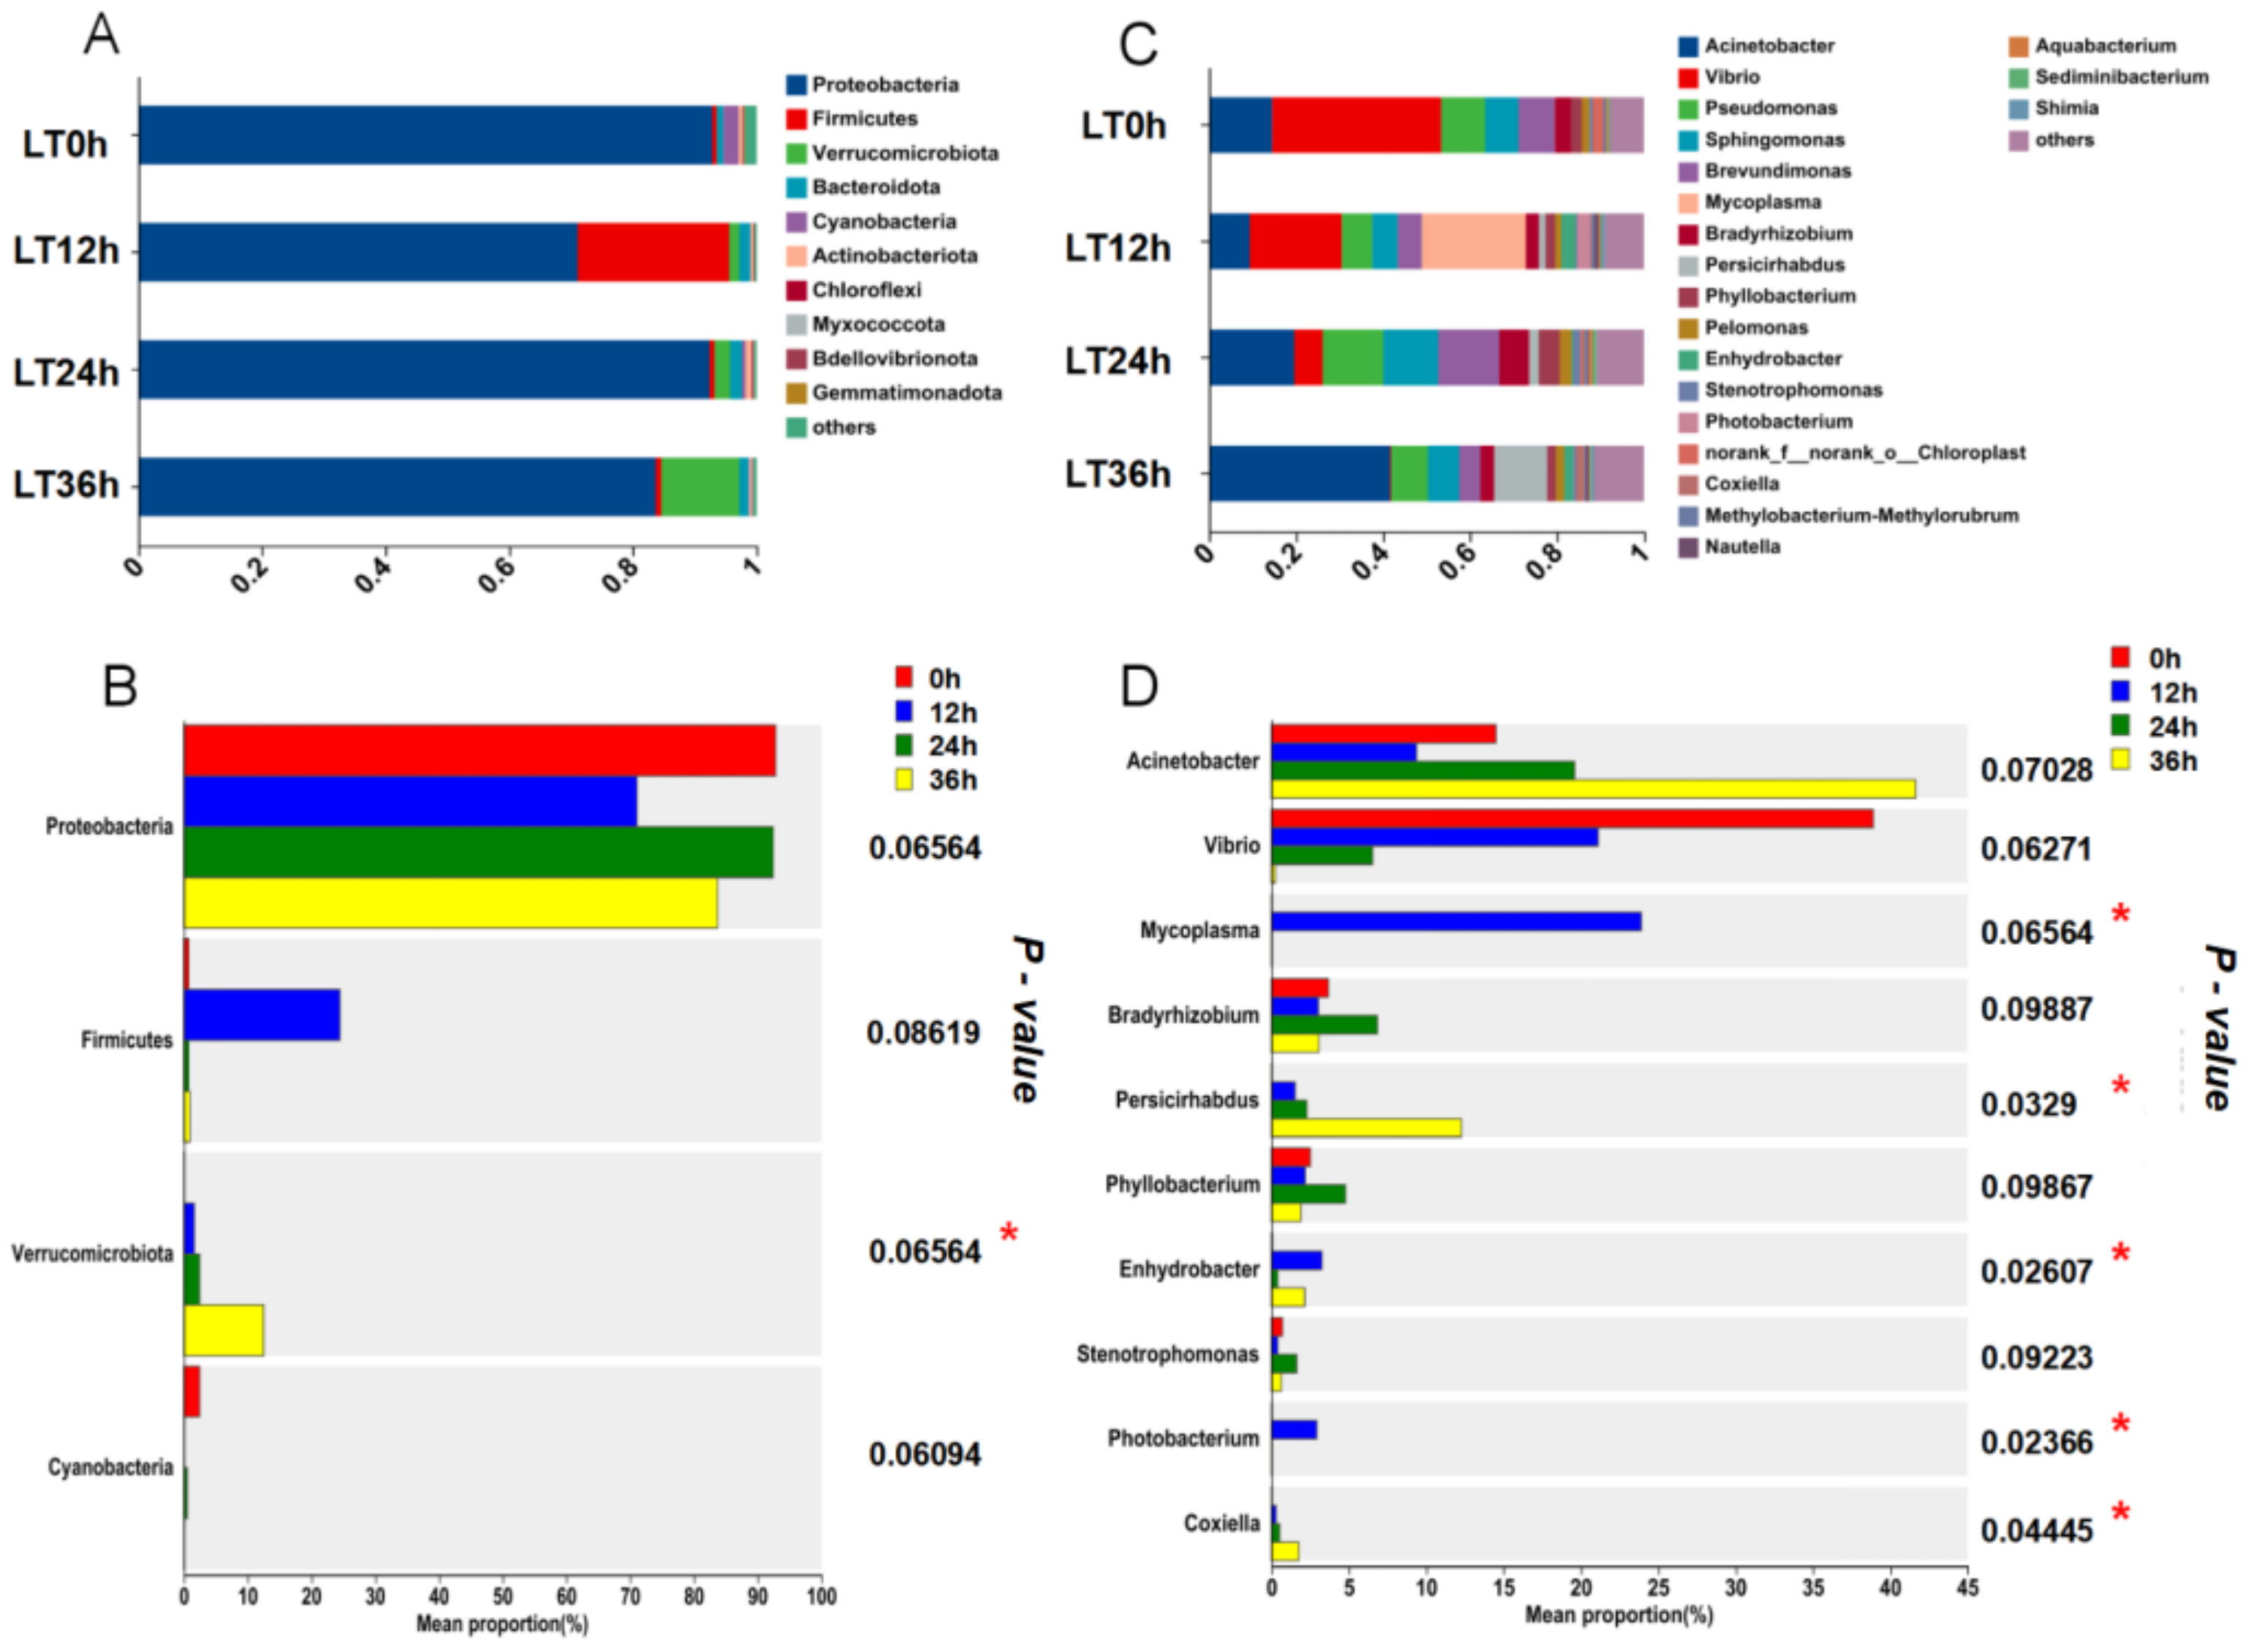
In the LT group’s phylum-level microbial community analysis, Proteobacteria was the dominant phylum across all time points, with an increase in the proportion of Firmicutes at 12 h, accounting for 24.5% of the total microbial population at that time before returning to baseline levels at 24 and 36 h. Verrucomicrobiota increased to 12.5% of the total microbial population at 36 h (Figure 8A). As shown in Figure 8B, significant differences were observed only in Verrucomicrobiota across different time intervals (p < 0.05). At the genus level, Vibrio showed a declining trend over time under cold stress, whereas Mycoplasma significantly increased at 12 h (p < 0.05), becoming the dominant genus at this time point before returning to initial levels at 24 and 36 h. Acinetobacter showed a rising trend at 24 and 36 h, becoming the dominant genus at these time points (Figure 8C). According to Figure 8D, significant differences were observed in Mycoplasma, Persicirhabdus, Enhydrobacter, Photobacterium, and Coxiella across different time intervals (p < 0.05).

Figure 8.
Temporal changes in the gut microbiota composition of the LT group at phylum and genus levels ((A) Bar graph of gut microbiota composition at the phylum level in the LT group; (B) differences in average relative abundance at the phylum level in the LT group; (C) bar graph of gut microbiota composition at the genus level in the LT group; (D) differences in average relative abundance at the genus level in the LT group; ‘*’ indicates significant differences, p < 0.05).
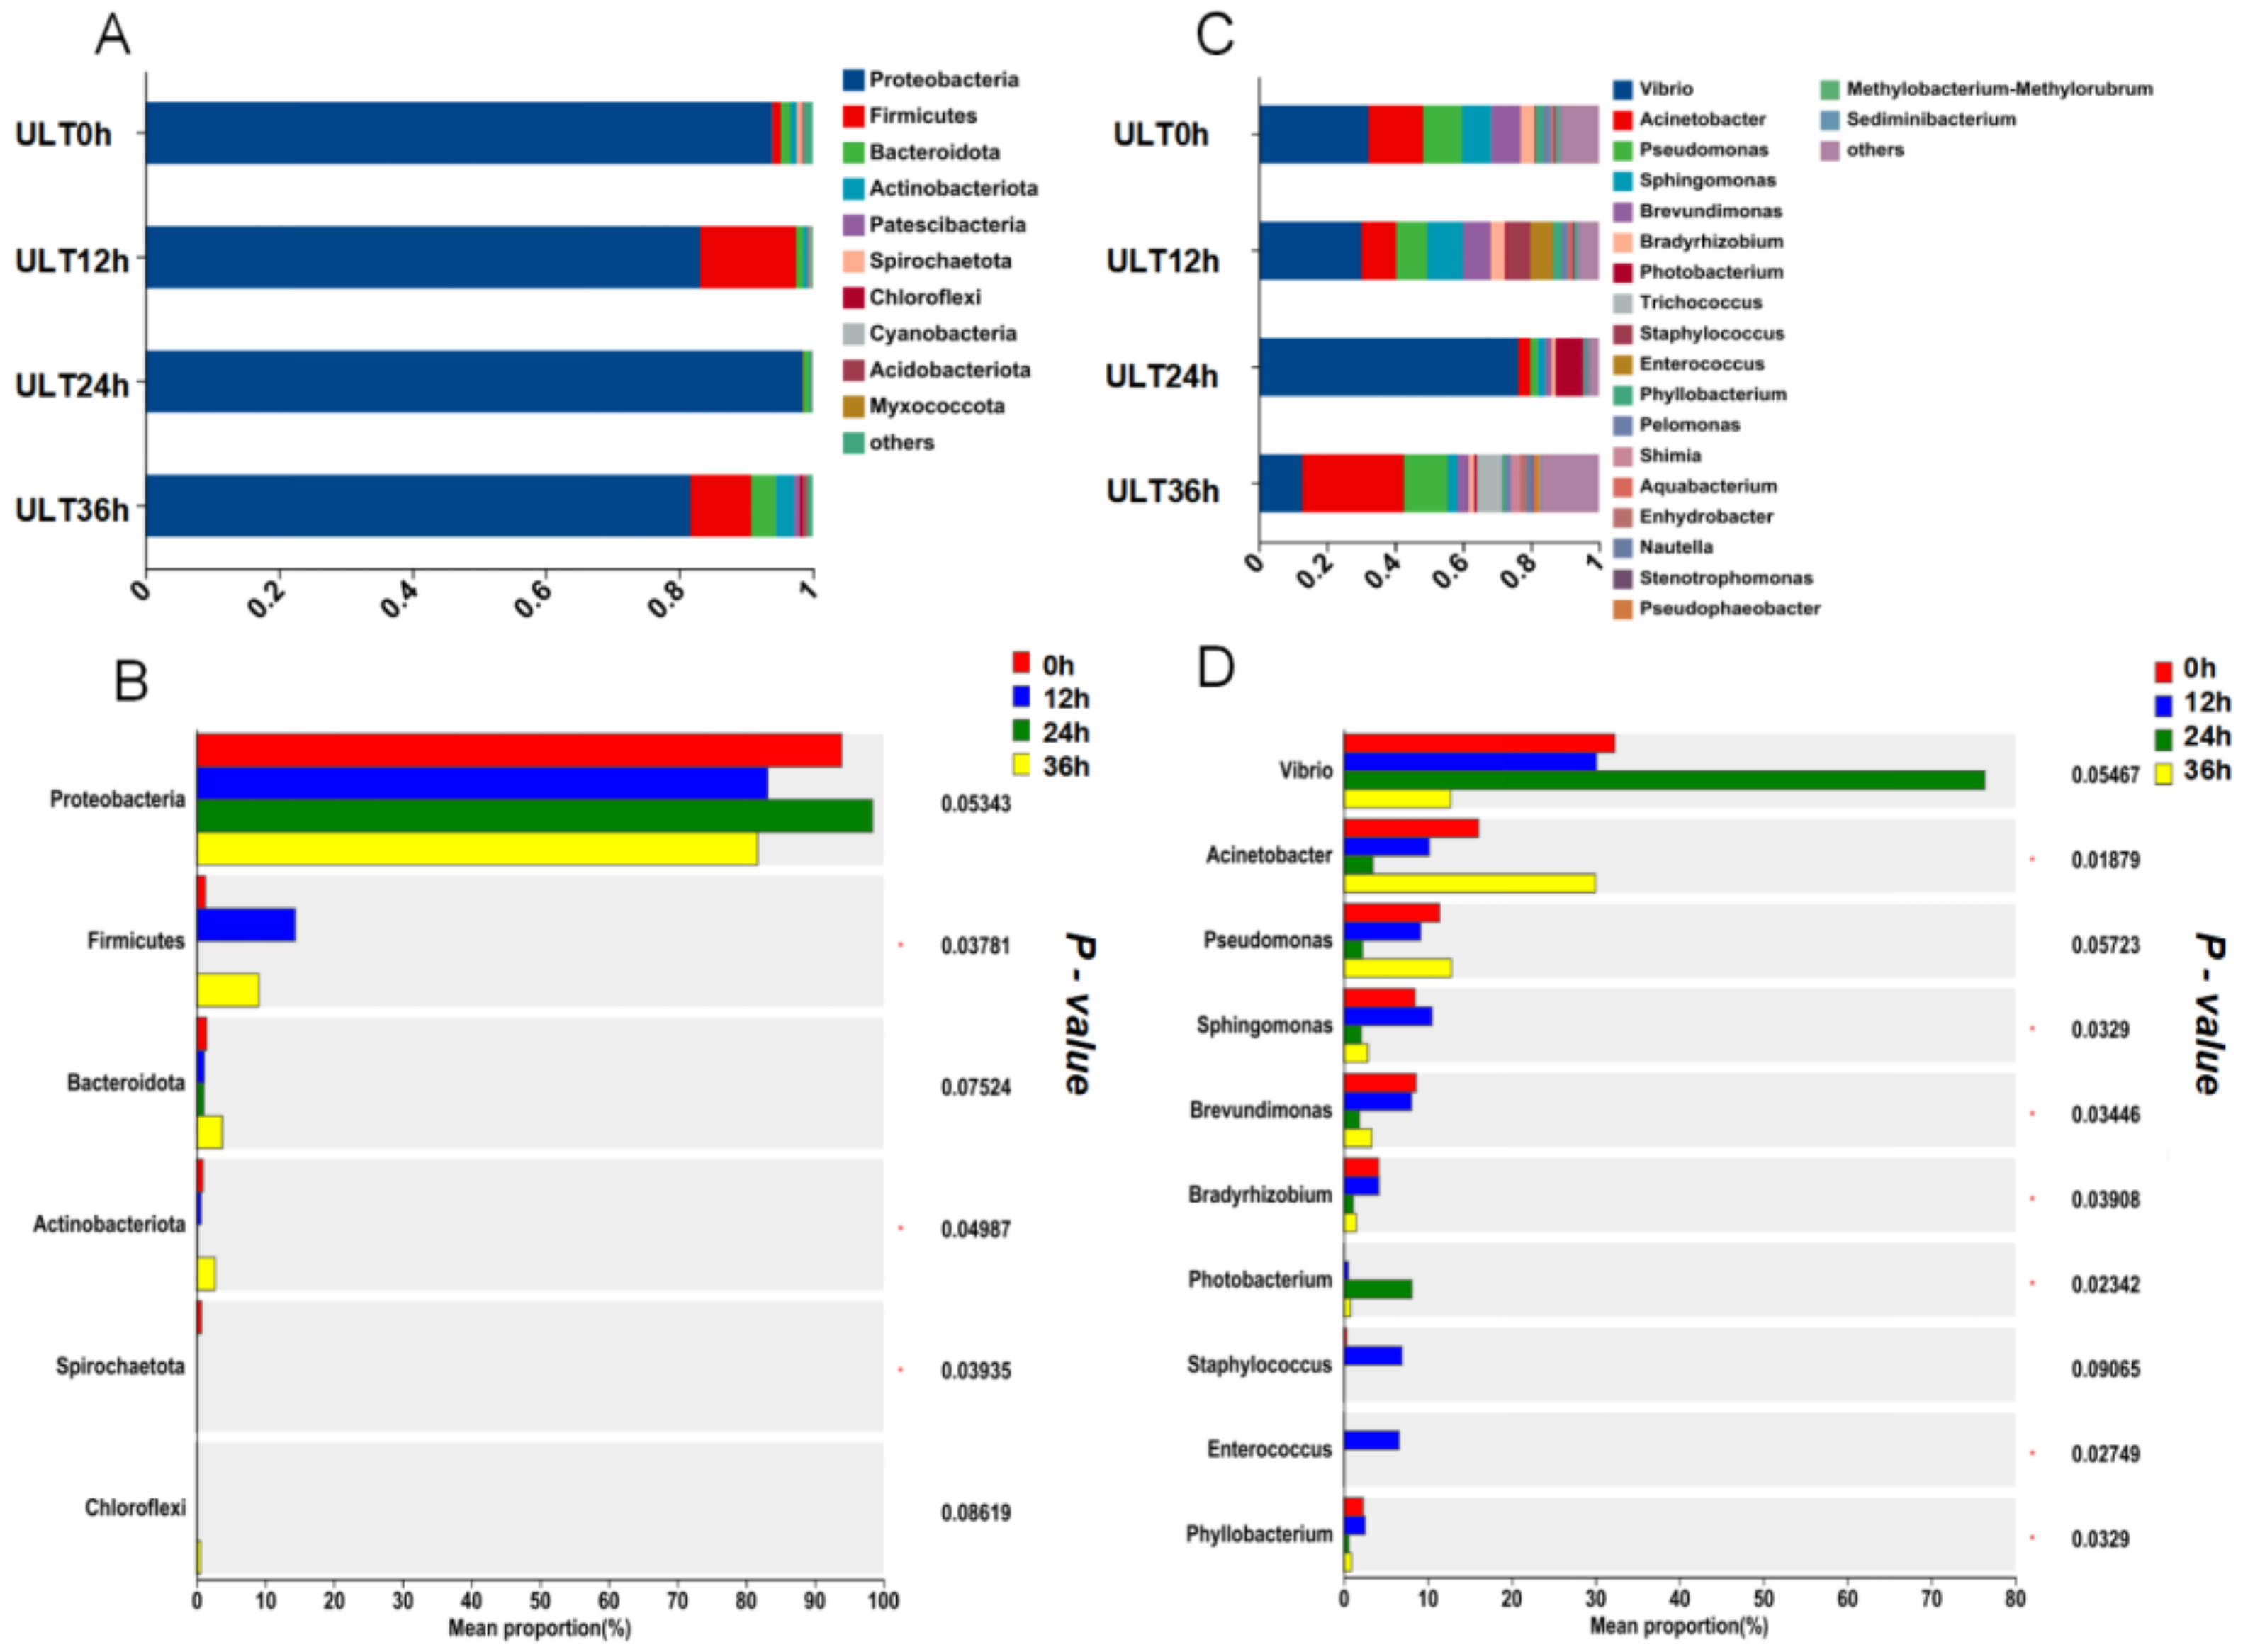
In the ULT group’s phylum-level microbial community analysis, Proteobacteria remained the dominant phylum across all time points. Notably, there was an increase in the proportion of Firmicutes at 12 and 36 h, accounting for 14.4% and 9.1% of the total bacterial count, respectively. Additionally, the proportions of Bacteroidota and Actinobacteriota also increased at 36 h (Figure 9A). As shown in Figure 9B, significant differences were observed in Actinobacteriota, Spirochaetota, and Chloroflexi across different time intervals (p < 0.05). At the genus level, Vibrio was the dominant genus at 0, 12, and 24 h, reaching its highest proportion at 24 h, comprising 76.4% of the total bacterial count. However, by 36 h, Acinetobacter emerged as the dominant genus, significantly increasing at this time point (p < 0.05) and accounting for 30% of the total bacterial count. Additionally, Pseudomonas showed a declining trend at 0, 12, and 24 h, returning to its original level by 36 h (Figure 9C). According to Figure 9D, significant differences in the relative abundances of Acinetobacter, Sphingomonas, Brevundimonas, Bradyrhizobium, Photobacterium, Enterococcus, and Phyllobacterium were observed across different time intervals within the ULT group (p < 0.05).
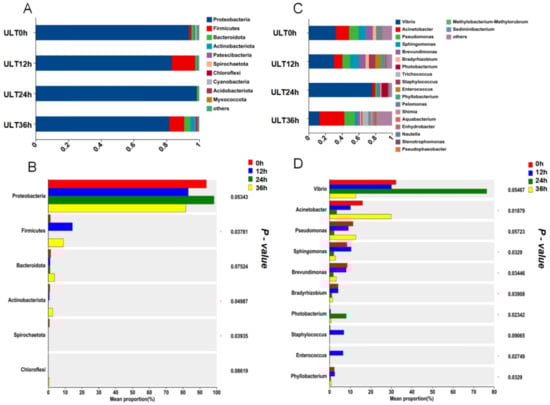
Figure 9.
Temporal changes in the gut microbiota composition of the ULT group at phylum and genus levels ((A) Bar graph of gut microbiota composition at the phylum level in the ULT group; (B) Differences in average relative abundance at the phylum level in the ULT group; (C) Bar graph of gut microbiota composition at the genus level in the ULT group; (D) Differences in average relative abundance at the genus level in the ULT group; ‘*’ indicates significant differences, p < 0.05).
4. Discussion
The gut microbiota of animals comprises a complex and diverse array of microbial communities that form a crucial functional unit, playing significant roles in host growth, metabolism, and immunity [36,37]. Under cold environmental conditions, the composition and functionality of the gut microbiota undergo significant changes, often closely related to the host’s physiological stress responses [38]. Previous studies have shown that in golden pompano (Trachinotus ovatus), the composition of the main microbial communities in the gut changes under low-temperature stress at 18 °C, although the abundance of these communities does not show significant changes [39]. In contrast, research on yellow catfish (Pelteobagrus fulvidraco) has revealed a decline in gut microbiota abundance under cold stress, with Plesiomonas dominating the microbial community in such conditions [40]. Additionally, Ma et al. found that low-temperature stress led to a significant decrease in the relative abundance of Firmicutes and Verrucomicrobiota, while increasing the relative abundance of Clostridia, Actinobacteria, and Proteobacteria in the gut microbiota of largemouth bass (Micropterus salmoides) [41]. Additionally, under high-temperature conditions, Koji Murashita et al. found that trypsin, chymotrypsin, and amylase activity decreased in juvenile Pacific bluefin tuna (Thunnus orientalis) [42]. In our study, after 36 h of acute cold stress, the composition and abundance of the gut microbiota in juvenile yellowfin tuna exhibited significant changes. The Ace index, a key indicator of microbial community richness, typically increases when low-abundance species become more prevalent [43]. Under cold stress conditions, alterations in host physiological status—such as changes in intestinal mucus secretion, digestive enzyme activity, and immune responses—can modulate the gut environment, thereby influencing the microbial community structure [44]. However, contrary to the expected trend, the Ace index in the ULT group increased significantly at 36 h. This suggests that certain low-abundance or rare bacterial taxa may have expanded under cold stress, or that shifts in microbial community dynamics contributed to an overall increase in diversity. Moreover, Proteobacteria remained the dominant phylum across all groups, yet its relative abundance decreased under cold conditions. In contrast, the proportions of Firmicutes and Bacteroidota increased significantly in the ULT group. Previous studies have suggested that Proteobacteria, as a metabolically active bacterial group, can efficiently utilize nutrients in the intestinal environment through rapid metabolic responses, particularly in warm conditions [45]. The observed decline in Proteobacteria under cold stress may indicate a temperature-dependent shift in microbial metabolism, favoring bacterial taxa that are more adapted to lower temperatures. These findings highlight the complex interplay between environmental stressors and microbial community dynamics, warranting further investigation into the functional implications of these compositional shifts [46,47]. Additionally, under cold conditions, the overall metabolic rate of fish decreases, and the levels of oxygen and nutrient supply in the intestines might reduce, thereby limiting the growth and reproduction of Proteobacteria [48]. This dependency on high metabolic demands makes them less adaptable under cold conditions [49]. Moreover, changes in the gut microenvironment under cold conditions, such as changes in pH and redox potential, can affect the survival advantage of Proteobacteria [50]. Conversely, microbial groups like Firmicutes and Bacteroidota, with their strong metabolic diversity, can efficiently utilize complex carbohydrates and other metabolic substrates through fermentation pathways in energy-limited environments, giving them a competitive advantage under low temperatures [51,52]. Studies have shown that Firmicutes possess a strong ability to degrade carbohydrates and produce short-chain fatty acids (SCFAs), which serve as an energy source for the intestinal epithelium while also regulating host energy metabolism and immune function. Meanwhile, Bacteroidota play a crucial role in maintaining gut microbial balance, degrading polysaccharides, and modulating host immune responses [53]. The significant increase in Firmicutes and Bacteroidota may represent a cold adaptation strategy, enhancing the gut microbiota’s ability to break down complex carbohydrates, maintain intestinal barrier stability, and regulate host immune function, thereby optimizing the physiological state of fish under cold stress. Additionally, at the genus level, Acinetobacter dominates under cold conditions. Bacteria of the genus Acinetobacter are known for their metabolic diversity and flexibility and are capable of metabolizing a variety of organic compounds, including complex carbohydrates, lipids, and proteins, under cold conditions. This metabolic flexibility allows them to sustain growth and survival in cold environments [54]. Studies have shown that as temperature decreases, Acinetobacter also becomes the dominant genus in the gut microbiota of Carassius auratus [20], further supporting its competitive advantage in cold environments. These microbial shifts reflect the selective pressure exerted by cold stress on the gut microbiota, leading to the redistribution of different bacterial species based on their metabolic traits and environmental adaptability [40]. In this study, the significant increase in Acinetobacter in the ULT group suggests its potential role in host nutrient metabolism under cold conditions, particularly in lipid and protein degradation [55]. This finding indicates that Acinetobacter may contribute to host energy acquisition in cold environments through metabolic adaptation.
In our dynamic temporal analysis, significant changes in the gut microbiota composition of both LT and ULT groups were observed as the duration of cold stress increased. α-Diversity analysis revealed that in the LT group, the Ace index at 0 h was significantly lower than at 12 h and 36 h, while the Shannon index remained unchanged across all time points. This suggests that although species richness initially declined under cold stress, overall microbial diversity remained stable. In contrast, in the more extreme cold conditions of the ULT group, the Ace index increased significantly at 36 h, whereas the Shannon index showed a marked decline at 24 h before recovering at 36 h. This pattern may indicate an initial phase of dysbiosis in response to cold stress, followed by the recolonization of bacteria better adapted to low temperatures [56]. Notably, in the ULT group, the stronger selective pressure exerted by cold stress likely reduced the abundance of temperature-sensitive bacterial taxa, leading to the observed decrease in the Shannon index at 24 h. However, by 36 h, microbial community restructuring occurred, with an expansion of cold-tolerant taxa, resulting in a significant increase in the Ace index and a subsequent recovery of Shannon diversity. This process may be driven by host-microbiota interactions, where cold stress influences the intestinal physiological environment, including mucus secretion, digestive enzyme activity, and immune modulation, thereby shaping the dynamic shifts in microbial composition [57]. In the LT group, there was a significant increase in the proportion of Firmicutes at 12 h, possibly related to short-term metabolic regulation in fish. Firmicutes are known for their robust metabolic adaptability, capable of efficiently utilizing complex carbon sources and other substrates through fermentation pathways to help maintain energy balance in cold environments [58]. This short-term enrichment suggests that they can rapidly respond to sudden temperature changes, thereby supporting the host’s metabolic needs [59]. Additionally, the proportion of Verrucomicrobiota significantly increased after 36 h of cold stress, possibly reflecting their metabolic adaptation to nutritional limitations and cold conditions within the gut. Verrucomicrobiota are known for their unique capabilities in carbohydrate degradation and mucin utilization, effectively breaking down complex carbon sources at low temperatures and using host-secreted mucus as an energy source to maintain activity and proliferation under resource-limited conditions [60,61]. Cold environments often coincide with a reduction in the host’s metabolic rate, leading to decreased nutrient availability in the gut, including carbohydrates and other energy sources [62]. Under such conditions, Verrucomicrobiota can exhibit a strong survival advantage by metabolizing complex sugars and utilizing host-secreted mucus [63]. In the ULT group, the proportion of Proteobacteria decreased at 12 and 36 h, consistent with the trend observed in the LT group, suggesting that cold stress may have a similar inhibitory effect on Proteobacteria over time. Consistent with the LT group, the proportion of Firmicutes significantly increased at 12 h, indicating temporal differences in the adaptation of different microbial communities to cold stress. In colder conditions, the rapid enrichment of Firmicutes in the early stages of cold stress may be indicative of their adaptation to maintain the energy supply for the host in cold environments [64]. Meanwhile, a significant increase in Bacteroidota at 36 h suggests that they may require a longer period to adapt to cold conditions. These microbes are known for their ability to decompose complex polysaccharides and cellulose, often enriching the gut over extended periods of stress by efficiently utilizing limited resources [65].
At the genus level in the LT group, Acinetobacter and Vibrio were dominant at 0 h and 12 h, particularly Vibrio, which occupied a major proportion at 0 h but decreased over time. This suggests that the cold environment may inhibit the growth of Vibrio [66], while Acinetobacter, which has greater environmental adaptability, became the dominant genus at 36 h. Concurrently, Mycoplasma showed a significant increase at 12 h, suggesting a strong adaptive capacity to short-term cold exposure. Known for its streamlined metabolic pathways and tolerance to extreme environments, Mycoplasma can survive under low-nutrient conditions, a trait that may provide it with a competitive advantage during the early phase of cold stress [67]. As a result, Mycoplasma may act as a transiently responsive bacterial group, rapidly proliferating in the initial stages of cold exposure. However, as the cold stress persists, the host gradually adapts to environmental changes, leading to a stabilization of the gut microbiota structure. Consequently, Mycoplasma may be replaced by more stable bacterial communities. This dynamic shift suggests that certain bacterial groups may transiently expand in response to environmental stress. Yet, as ecological niches adjust and host adaptation strengthens, a more stable microbial community ultimately emerges [68,69]. In the ULT group, Vibrio was the dominant genus at 0 h, 12 h, and 24 h, with a sharp increase in abundance at 24 h, followed by a sharp decline at 36 h. This reflects Vibrio’s poor adaptation to even lower temperatures. Although Vibrio maintained a high abundance at 0 h, 12 h, and peaked at 24 h, indicating it could still sustain metabolic activity in short-term low-temperature environments [70], its ability to adapt diminishes as cold exposure persists. The drastic decline in Vibrio abundance at 36 h indicates that it may struggle to survive under prolonged low-temperature conditions, likely due to shifts in nutrient availability and host metabolic changes. In contrast, Acinetobacter exhibited a substantial increase at 36 h, emerging as the dominant genus, a pattern consistent with the LT group. Acinetobacter is well known for its metabolic versatility and strong environmental adaptability, allowing it to thrive in cold and nutrient-limited conditions [71,72]. Its replacement of Vibrio at 36 h may reflect the gut environment’s further adaptation to prolonged cold stress, favoring the proliferation and colonization of more resilient bacterial communities. This shift also suggests that low temperatures not only alter the composition of the microbial community but may also influence its succession dynamics by modulating host metabolism and gut barrier function.
Sphingomonas and Brevundimonas both experienced a significant decline in abundance at 24 h. Sphingomonas is known for its capacity to degrade complex organic materials, particularly in environmental remediation [73]. However, its rate of complex organic matter decomposition may decrease under low temperatures, reducing its competitiveness [74]. Similarly, Brevundimonas has a wide distribution in various environments, but its metabolic efficiency may be limited under cold conditions, resulting in suppressed growth and reproduction [75]. Therefore, the decline of these two microbial groups may indicate weaker metabolic pathways and adaptability in cold environments, gradually being replaced by other microbial communities better adapted to prolonged low-temperature stress.
5. Conclusions
This study analyzed the gut microbiota changes in juvenile yellowfin tuna under cold stress, revealing the significant impacts of low temperatures on microbial diversity, composition, and metabolism. Results showed a gradual decrease in Proteobacteria abundance with lower temperatures, indicating weaker adaptability, while Verrucomicrobiota, Firmicutes, and Bacteroidota exhibited increases at 36 h, reflecting their stronger metabolic adaptability. Additionally, Vibrio abundance dropped significantly, suggesting poor adaptability to prolonged cold. Overall, this study provides new insights into the gut microbiota regulation of Thunnus albacares under low-temperature conditions, highlighting the metabolic adaptability of specific bacterial communities to cold stress. These findings have practical implications for aquaculture, aiding in optimizing feed formulations, probiotic supplementation, and temperature control to enhance fish health and growth. This study deepens our understanding of fish adaptation to extreme climates and offers valuable guidance for aquaculture management in cold environments.
Supplementary Materials
The following supporting information can be downloaded at: https://www.mdpi.com/article/10.3390/jmse13030602/s1, Table S1: 36 valid sequences of samples; Table S2: Table of sample coverage and diversity indices for the three treatment groups at different low-temperature stress time points.
Author Contributions
Conceptualization, J.H., Z.F. and T.Z.; Methodology, J.H. and Z.F.; Software, J.W. and B.H.; Validation, J.H., Z.F., W.Y. and B.H.; Formal analysis, J.H. and W.Y.; Investigation, J.H. and T.Z.; Resources, J.W. and Z.M.; Data curation, J.H. and B.H.; Writing—original draft, J.H.; Writing—review & editing, Z.F. and Z.M.; Visualization, J.H. and T.Z.; Supervision, Z.M.; Project administration, J.W. and W.Y.; Funding acquisition, J.W., W.Y. and Z.M. All authors have read and agreed to the published version of the manuscript.
Funding
This work was supported by the Research on Breeding Technology of Candidate Species for Guangdong Modern Marine Ranching (2024-MRB-00-001); the National Natural Science Foundation of China (32460927); the Science and Technology special fund of Hainan Province (ZDYF2024XDNY247); and the Central Public-interest Scientific Institution Basal Research Fund, CAFS (2024XT04, 2023TD58). The research was supported by the Project of Sanya Yazhou Bay Science and Technology City (SKJC-2022-PTDX-015).
Institutional Review Board Statement
The experiments were in compliance with the regulations and guidelines established by the Animal Care and Use Committee of South China Sea Fisheries Research Institute, Chinese Academy of Fishery Sciences, and permitted by this committee.
Data Availability Statement
The data presented in this study are openly available in NCBI Sequence Read Archive at https://www.ncbi.nlm.nih.gov/bioproject/PRJNA1190122/ (accessed on 24 November 2024), reference number PRJNA1190122.
Conflicts of Interest
Author Bowen Hou was employed by Hainan Haiken Marine Industry Group Co., Ltd. Author Jinhui Wu was employed by Agro-Tech Extension Center of Guangdong Province. Author Tao Zhang was employed by Dalian Tianzheng Industrial Co., Ltd. The remaining authors declare that the research was conducted in the absence of any commercial or financial relationships that could be construed as a potential conflict of interest.
References
- Merrifield, D.L.; Rodiles, A. The Fish Microbiome and Its Interactions with Mucosal Tissues. In Mucosal Health in Aquaculture; Elsevier: Amsterdam, The Netherlands, 2015; pp. 273–295. [Google Scholar]
- Banerjee, G.; Ray, A.K. Bacterial Symbiosis in the Fish Gut and Its Role in Health and Metabolism. Symbiosis 2017, 72, 1–11. [Google Scholar] [CrossRef]
- Sehnal, L.; Brammer-Robbins, E.; Wormington, A.M.; Blaha, L.; Bisesi, J.; Larkin, I.; Martyniuk, C.J.; Simonin, M.; Adamovsky, O. Microbiome Composition and Function in Aquatic Vertebrates: Small Organisms Making Big Impacts on Aquatic Animal Health. Front. Microbiol. 2021, 12, 567408. [Google Scholar] [CrossRef]
- Romero, J.; Ringø, E.; Merrifield, D.L. The Gut Microbiota of Fish. In Aquaculture Nutrition: Gut Health, Probiotics and Prebiotics; John Wiley & Sons, Ltd.: Hoboken, NJ, USA, 2014; pp. 75–100. [Google Scholar]
- Altringham, J.D.; Block, B.A. Why Do Tuna Maintain Elevated Slow Muscle Temperatures? Power Output of Muscle Isolated from Endothermic and Ectothermic Fish. J. Exp. Biol. 1997, 200, 2617–2627. [Google Scholar] [CrossRef]
- Stevens, E.D.; Neill, W.H. Body Temperature Relations of Tunas, Especially Skipjack. In Fish Physiology; Elsevier: Amsterdam, The Netherlands, 1978; pp. 315–359. [Google Scholar]
- Zhang, L.; Yang, Z.; Yang, F.; Wang, G.; Zeng, M.; Zhang, Z.; Yang, M.; Wang, Z.; Li, Z. Gut Microbiota of Two Invasive Fishes Respond Differently to Temperature. Front. Microbiol. 2023, 14, 1087777. [Google Scholar] [CrossRef] [PubMed]
- Sepulveda, J.; Moeller, A.H. The Effects of Temperature on Animal Gut Microbiomes. Front. Microbiol. 2020, 11, 384. [Google Scholar] [CrossRef]
- Wang, B.; Zhang, S.-Q.; Dong, J.-L.; Li, Y.; Jin, Y.-X.; Xiao, H.-W.; Wang, H.-C.; Fan, S.-J.; Cui, M. Ambient Temperature Structures the Gut Microbiota of Zebrafish to Impact the Response to Radioactive Pollution. Environ. Pollut. 2022, 293, 118539. [Google Scholar] [CrossRef] [PubMed]
- Li, P.; Zhang, J.; Liu, X.; Gan, L.; Xie, Y.; Zhang, H.; Si, J. The Function and the Affecting Factors of the Zebrafish Gut Microbiota. Front. Microbiol. 2022, 13, 903471. [Google Scholar] [CrossRef]
- Block, B.A.; Keen, J.E.; Castillo, B.; Dewar, H.; Freund, E.V.; Marcinek, D.J.; Brill, R.W.; Farwell, C. Environmental Preferences of Yellowfin Tuna (Thunnus albacares) at the Northern Extent of Its Range. Mar. Biol. 1997, 130, 119–132. [Google Scholar] [CrossRef]
- Artetxe-Arrate, I.; Fraile, I.; Marsac, F.; Farley, J.H.; Rodriguez-Ezpeleta, N.; Davies, C.R.; Clear, N.P.; Grewe, P.; Murua, H. A Review of the Fisheries, Life History and Stock Structure of Tropical Tuna (Skipjack Katsuwonus pelamis, Yellowfin Thunnus albacares and Bigeye Thunnus obesus) in the Indian Ocean. Adv. Mar. Biol. 2021, 88, 39–89. [Google Scholar]
- Lan, K.-W.; Evans, K.; Lee, M.-A. Effects of Climate Variability on the Distribution and Fishing Conditions of Yellowfin Tuna (Thunnus albacares) in the Western Indian Ocean. Clim. Change 2013, 119, 63–77. [Google Scholar] [CrossRef]
- Lilly, L.E.; Bonaventura, J.; Lipnick, M.S.; Block, B.A. Effect of Temperature Acclimation on Red Blood Cell Oxygen Affinity in Pacific Bluefin Tuna (Thunnus orientalis) and Yellowfin Tuna (Thunnus albacares). Comp. Biochem. Physiol. Part A Mol. Integr. Physiol. 2015, 181, 36–44. [Google Scholar] [CrossRef] [PubMed]
- Sun, W.; Zhang, J.; Meng, J.; Liu, Y. Sea Surface Temperature Characteristics and Trends in China Offshore Seas from 1982 to 2017. J. Coast. Res. 2019, 90, 27–34. [Google Scholar] [CrossRef]
- Schwing, F.B.; Murphree, T.; deWitt, L.; Green, P.M. The Evolution of Oceanic and Atmospheric Anomalies in the Northeast Pacific During the El Niño and La Niña Events of 1995–2001. Prog. Oceanogr. 2002, 54, 459–491. [Google Scholar] [CrossRef]
- Pörtner, H.-O.; Berdal, B.; Blust, R.; Brix, O.; Colosimo, A.; De Wachter, B.; Giuliani, A.; Johansen, T.; Fischer, T.; Knust, R.; et al. Climate Induced Temperature Effects on Growth Performance, Fecundity and Recruitment in Marine Fish: Developing a Hypothesis for Cause and Effect Relationships in Atlantic Cod (Gadus morhua) and Common Eelpout (Zoarces viviparus). Cont. Shelf Res. 2001, 21, 1975–1997. [Google Scholar] [CrossRef]
- McKenzie, D.J.; Axelsson, M.; Chabot, D.; Claireaux, G.; Cooke, S.J.; Corner, R.A.; De Boeck, G.; Domenici, P.; Guerreiro, P.M.; Hamer, B.; et al. Conservation Physiology of Marine Fishes: State of the Art and Prospects for Policy. Conserv. Physiol. 2016, 4, cow046. [Google Scholar] [CrossRef]
- Crawshaw, L.I. Low-Temperature Dormancy in Fish. Am. J. Physiol.-Regul. Integr. Comp. Physiol. 1984, 246, R479–R486. [Google Scholar] [CrossRef]
- Liu, Y.; Lv, H.; Xu, L.; Zhang, K.; Mei, Y.; Chen, J.; Wang, M.; Guan, Y.; Pang, H.; Wang, Y.; et al. The Effect of Dietary Lactic Acid Bacteria on Intestinal Microbiota and Immune Responses of Crucian Carp (Carassius auratus) under Water Temperature Decrease. Front. Microbiol. 2022, 13, 847167. [Google Scholar] [CrossRef] [PubMed]
- Lv, H.; Liu, Y.; Li, H.; Yin, X.; Wang, P.; Qu, X.; Gao, Y.; Li, W.; Chu, Z. Modulation of Antioxidant Enzymes, Heat Shock Protein, and Intestinal Microbiota of Large Yellow Croaker (Larimichthys crocea) under Acute Cold Stress. Front. Mar. Sci. 2021, 8, 725899. [Google Scholar] [CrossRef]
- Liu, C.; Zhao, L.-P.; Shen, Y.-Q. A Systematic Review of Advances in Intestinal Microflora of Fish. Fish Physiol. Biochem. 2021, 47, 2041–2053. [Google Scholar] [CrossRef]
- Chen, C.-Z.; Li, P.; Liu, L.; Li, Z.-H. Exploring the Interactions between the Gut Microbiome and the Shifting Surrounding Aquatic Environment in Fisheries and Aquaculture: A Review. Environ. Res. 2022, 214, 114202. [Google Scholar] [CrossRef]
- Bakke, A.M.; Glover, C.; Krogdahl, Å. Feeding, Digestion and Absorption of Nutrients. In Fish Physiology; Elsevier: Amsterdam, The Netherlands, 2010; pp. 57–110. [Google Scholar]
- Ray, A.K.; Ringø, E. The Gastrointestinal Tract of Fish. In Aquaculture Nutrition: Gut Health, Probiotics and Prebiotics; John Wiley & Sons, Ltd.: Hoboken, NJ, USA, 2014; pp. 1–13. [Google Scholar]
- Lobionda, S.; Sittipo, P.; Kwon, H.Y.; Lee, Y.K. The Role of Gut Microbiota in Intestinal Inflammation with Respect to Diet and Extrinsic Stressors. Microorganisms 2019, 7, 271. [Google Scholar] [CrossRef]
- Gasaly, N.; de Vos, P.; Hermoso, M.A. Impact of Bacterial Metabolites on Gut Barrier Function and Host Immunity: A Focus on Bacterial Metabolism and Its Relevance for Intestinal Inflammation. Front. Immunol. 2021, 12, 658354. [Google Scholar] [CrossRef]
- Hansen, G.H.; Olafsen, J.A. Bacterial Interactions in Early Life Stages of Marine Cold Water Fish. Microb. Ecol. 1999, 38, 1–26. [Google Scholar] [CrossRef] [PubMed]
- Yan, H.; Soon, W.; Wang, Y. A Composite Sea Surface Temperature Record of the Northern South China Sea for the Past 2500 Years: A Unique Look into Seasonality and Seasonal Climate Changes During Warm and Cold Periods. Earth-Sci. Rev. 2015, 141, 122–135. [Google Scholar] [CrossRef]
- Cakin, I.; Morrissey, B.; Gordon, M.; Gaffney, P.P.; Marcello, L.; Macgregor, K.; Taggart, M.A. Comparing DNA Isolation and Sequencing Strategies for 16S rRNA Gene Amplicon Analysis in Biofilm Containing Environments. J. Microbiol. Methods 2024, 220, 106921. [Google Scholar] [CrossRef] [PubMed]
- Schloss, P.D.; Westcott, S.L.; Ryabin, T.; Hall, J.R.; Hartmann, M.; Hollister, E.B.; Lesniewski, R.A.; Oakley, B.B.; Parks, D.H.; Robinson, C.J.; et al. Introducing Mothur: Open-Source, Platform-Independent, Community-Supported Software for Describing and Comparing Microbial Communities. Appl. Environ. Microbiol. 2009, 75, 7537–7541. [Google Scholar] [CrossRef] [PubMed]
- Edgar, R.C.; Haas, B.J.; Clemente, J.C.; Quince, C.; Knight, R. Uchime Improves Sensitivity and Speed of Chimera Detection. Bioinformatics 2011, 27, 2194–2200. [Google Scholar] [CrossRef]
- Lan, Y.; Wang, Q.; Cole, J.R.; Rosen, G.L. Using the Rdp Classifier to Predict Taxonomic Novelty and Reduce the Search Space for Finding Novel Organisms. PLoS ONE 2012, 7, e32491. [Google Scholar] [CrossRef]
- Koetschan, C.; Kittelmann, S.; Lu, J.; Al-Halbouni, D.; Jarvis, G.N.; Müller, T.; Wolf, M.; Janssen, P.H. Internal Transcribed Spacer 1 Secondary Structure Analysis Reveals a Common Core Throughout the Anaerobic Fungi (Neocallimastigomycota). PLoS ONE 2014, 9, e91928. [Google Scholar] [CrossRef]
- Kang, X.; Liu, G.; Liu, Y.; Xu, Q.; Zhang, M.; Fang, M. Transcriptome Profile at Different Physiological Stages Reveals Potential Mode for Curly Fleece in Chinese Tan Sheep. PLoS ONE 2013, 8, e71763. [Google Scholar] [CrossRef]
- Hong, J.; Chen, M.; Deng, Z.; Li, Y.; Wang, Y. Variance Analysis of Intestinal Microbial Diversity of the Noble Scallop (Chlamys nobilis) under Enrofloxacin Exposure. Pak. J. Zool. 2021, 53, 1221–1231. [Google Scholar] [CrossRef]
- Ming, J.; Fu, Z.; Ma, Z.; Zhou, L.; Zhang, Z.; Song, C.; Yuan, X.; Wu, Q. The Effect of Sulfamonomethoxine Treatment on the Gut Microbiota of Nile Tilapia (Oreochromis niloticus). MicrobiologyOpen 2020, 9, e1116. [Google Scholar] [CrossRef]
- Kim, J.A.; Park, Y.-S.; Kim, J.-H.; Choi, C.Y. Impact of Water Temperature on Oxidative Stress and Intestinal Microbiota in Pearl-Spot Chromis, Chromis notata (Temminck & Schlegel, 1843). Comp. Biochem. Physiol. Part B Biochem. Mol. Biol. 2024, 275, 111029. [Google Scholar]
- Li, R.-X.; Amenyogbe, E.; Lu, Y.; Jin, J.-H.; Xie, R.-T.; Huang, J.-S. Effects of Low-Temperature Stress on Serum Biochemical Indicators, Intestinal Microbiome, and Transcriptome of Juvenile Golden Pompano (Trachinotus ovatus). Aquac. Int. 2024, 32, 5551–5578. [Google Scholar] [CrossRef]
- Hu, J.; Zhao, H.; Wang, G.; Sun, Y.; Wang, L. Energy Consumption and Intestinal Microbiome Disorders of Yellow Catfish (Pelteobagrus fulvidraco) under Cold Stress. Front. Physiol. 2022, 13, 985046. [Google Scholar] [CrossRef]
- Ma, S.; Lv, Y.; Hou, L.; Jia, Z.; Lin, S.; Wang, S.; He, X.; Hou, J. Effect of Acute Temperature Stress on Energy Metabolism, Immune Performance and Gut Microbiome of Largemouth Bass (Micropterus salmoides). Aquac. Fish. 2023, in press. [CrossRef]
- Murashita, K.; Hashimoto, H.; Takashi, T.; Eba, T.; Kumon, K.; Matsunari, H.; Soma, S.; Oku, H.; Furuita, H.; Yoshinaga, H.; et al. Characterization of Digestive Physiology in Pacific Bluefin Tuna Thunnus orientalis juveniles fed a raw fish feed and a commercial diet. Aquaculture 2021, 538, 736562. [Google Scholar] [CrossRef]
- Villarini, G.; Vecchi, G.A. Multiseason Lead Forecast of the North Atlantic Power Dissipation Index (PDI) and Accumulated Cyclone Energy (ACE). J. Clim. 2013, 26, 3631–3643. [Google Scholar] [CrossRef]
- Li, R.-X.; Amenyogbe, E.; Lu, Y.; Jin, J.-H.; Xie, R.-T.; Huang, J.-S. Effects of Low-Temperature Stress on Intestinal Structure, Enzyme Activities and Metabolomic Analysis of Juvenile Golden Pompano (Trachinotus ovatus). Front. Mar. Sci. 2023, 10, 1114120. [Google Scholar] [CrossRef]
- Liu, Y.; Cheng, J.; Xia, Y.; Li, X.; Liu, Y.; Liu, P.-F. Response Mechanism of Gut Microbiome and Metabolism of European Seabass (Dicentrarchus labrax) to Temperature Stress. Sci. Total Environ. 2022, 813, 151786. [Google Scholar] [CrossRef]
- Huus, K.E.; Ley, R.E. Blowing Hot and Cold: Body Temperature and the Microbiome. mSystems 2021, 6, e0070721. [Google Scholar] [CrossRef] [PubMed]
- Zhou, C.; Yang, S.; Ka, W.; Gao, P.; Li, Y.; Long, R.; Wang, J. Association of Gut Microbiota with Metabolism in Rainbow Trout under Acute Heat Stress. Front. Microbiol. 2022, 13, 846336. [Google Scholar] [CrossRef] [PubMed]
- Yoon, D.-S.; Kim, D.-H.; Kim, J.-H.; Sakakura, Y.; Hagiwara, A.; Park, H.G.; Lee, M.-C.; Lee, J.-S. Interactions Between Lipid Metabolism and the Microbiome in Aquatic Organisms: A Review. Mar. Pollut. Bull. 2024, 207, 116858. [Google Scholar] [CrossRef] [PubMed]
- Huang, K.; He, Y.; Wang, W.; Jiang, R.; Zhang, Y.; Li, J.; Zhang, X.-X.; Wang, D. Temporal Differentiation in the Adaptation of Functional Bacteria to Low-Temperature Stress in Partial Denitrification and Anammox System. Environ. Res. 2024, 244, 117933. [Google Scholar] [CrossRef]
- Quatrini, R.; Johnson, D.B. Microbiomes in Extremely Acidic Environments: Functionalities and Interactions That Allow Survival and Growth of Prokaryotes at Low pH. Curr. Opin. Microbiol. 2018, 43, 139–147. [Google Scholar] [CrossRef]
- Reineke, W.; Schlömann, M. Carbon Cycle. In Environmental Microbiology; Springer: Berlin/Heidelberg, Germany, 2023; pp. 71–126. [Google Scholar]
- Wasmund, K.; Pelikan, C.; Schintlmeister, A.; Wagner, M.; Watzka, M.; Richter, A.; Bhatnagar, S.; Noel, A.; Hubert, C.R.J.; Rattei, T. Genomic Insights into Diverse Bacterial Taxa That Degrade Extracellular DNA in Marine Sediments. Nat. Microbiol. 2021, 6, 885–898. [Google Scholar] [CrossRef]
- Sun, Y.; Zhang, S.; Nie, Q.; He, H.; Tan, H.; Geng, F.; Ji, H.; Hu, J.; Nie, S. Gut Firmicutes: Relationship with Dietary Fiber and Role in Host Homeostasis. Crit. Rev. Food Sci. Nutr. 2023, 63, 12073–12088. [Google Scholar] [CrossRef]
- Towner, K.J. The Genus Acinetobacter. In The Prokaryotes: A Handbook on the Biology of Bacteria: Ecophysiology, Isolation, Identification, Applications; Springer: Berlin/Heidelberg, Germany, 1992; pp. 3137–3143. [Google Scholar]
- Wang, X.-Y.; Xie, J. Characterization of Metabolite, Genome and Volatile Organic Compound Changes Provides Insights into the Spoilage and Cold Adaptive Markers of Acinetobacter Johnsonii XY27. LWT 2022, 162, 113453. [Google Scholar] [CrossRef]
- Yi, W.; Cheng, J.; Wei, Q.; Pan, R.; Song, S.; He, Y.; Tang, C.; Liu, X.; Zhou, Y.; Su, H. Effect of Temperature Stress on Gut-Brain Axis in Mice: Regulation of Intestinal Microbiome and Central Nlrp3 Inflammasomes. Sci. Total Environ. 2021, 772, 144568. [Google Scholar] [CrossRef]
- Sanahuja, I.; Fernández-Alacid, L.; Sánchez-Nuño, S.; Ordóñez-Grande, B.; Ibarz, A. Chronic Cold Stress Alters the Skin Mucus Interactome in a Temperate Fish Model. Front. Physiol. 2019, 9, 1916. [Google Scholar] [CrossRef]
- Zhang, X.-Y.; Sukhchuluun, G.; Bo, T.-B.; Chi, Q.-S.; Yang, J.-J.; Chen, B.; Zhang, L.; Wang, D.-H. Huddling Remodels Gut Microbiota to Reduce Energy Requirements in a Small Mammal Species During Cold Exposure. Microbiome 2018, 6, 103. [Google Scholar]
- Zhang, X.-Y.; Wang, D.-H. Gut Microbial Community and Host Thermoregulation in Small Mammals. Front. Physiol. 2022, 13, 888324. [Google Scholar] [CrossRef]
- Pan, Y.; Sun, R.-Z.; Wang, Y.; Chen, G.-L.; Fu, Y.-Y.; Yu, H.-Q. Carbon Source Shaped Microbial Ecology, Metabolism and Performance in Denitrification Systems. Water Res. 2023, 243, 120330. [Google Scholar] [CrossRef] [PubMed]
- Panah, F.M.; Lauridsen, C.; Højberg, O.; Jensen, H.E.; Nielsen, T.S. Composition of Mucus-and Digesta-Associated Bacteria in Growing Pigs with and without Diarrhea Differed According to the Presence of Colonic Inflammation. BMC Microbiol. 2023, 23, 145. [Google Scholar] [CrossRef]
- Carey, H.V.; Assadi-Porter, F.M. The Hibernator Microbiome: Host-Bacterial Interactions in an Extreme Nutritional Symbiosis. Annu. Rev. Nutr. 2017, 37, 477–500. [Google Scholar] [CrossRef] [PubMed]
- Zhang, F.; Zhao, Y.; Liu, X.; Li, Z.; Liu, N.; Tang, L.; Jiang, Q.; Fan, Z.; Tan, B.; Li, Y.; et al. Effects of Soluble Glucomannan and Insoluble Cellulose Treatment on Mucin Secretion and Mucin Glycosylation-Related Gene Expression in the Colons of Mice. J. Sci. Food Agric. 2023, 103, 7739–7746. [Google Scholar] [CrossRef]
- Karl, J.P.; Hatch, A.M.; Arcidiacono, S.M.; Pearce, S.C.; Pantoja-Feliciano, I.G.; Doherty, L.A.; Soares, J.W. Effects of Psychological, Environmental and Physical Stressors on the Gut Microbiota. Front. Microbiol. 2018, 9, 2013. [Google Scholar] [CrossRef]
- Ma, X.; La, Y.; Yang, G.; Dai, R.; Zhang, J.; Zhang, Y.; Jin, J.; Ma, X.; Guo, X.; Chu, M.; et al. Multi-Omics Revealed the Effects of Dietary Energy Levels on the Rumen Microbiota and Metabolites in Yaks under House-Feeding Conditions. Front. Microbiol. 2024, 14, 1309535. [Google Scholar] [CrossRef]
- Biosca, E.G.; Amaro, C.; Marco-Noales, E.; Oliver, J.D. Effect of Low Temperature on Starvation-Survival of the Eel Pathogen Vibrio Vulnificus Biotype 2. Appl. Environ. Microbiol. 1996, 62, 450–455. [Google Scholar] [CrossRef]
- Tardy, F.; Mick, V.; Dordet-Frisoni, E.; Marenda, M.S.; Sirand-Pugnet, P.; Blanchard, A.; Citti, C. Integrative Conjugative Elements Are Widespread in Field Isolates of Mycoplasma Species Pathogenic for Ruminants. Appl. Environ. Microbiol. 2015, 81, 1634–1643. [Google Scholar] [CrossRef]
- Kaboré, O.D.; Godreuil, S.; Drancourt, M. Planctomycetes as Host-Associated Bacteria: A Perspective That Holds Promise for Their Future Isolations, by Mimicking Their Native Environmental Niches in Clinical Microbiology Laboratories. Front. Cell. Infect. Microbiol. 2020, 10, 519301. [Google Scholar] [CrossRef] [PubMed]
- Gaca, A.O.; Lemos, J.A. Adaptation to Adversity: The Intermingling of Stress Tolerance and Pathogenesis in Enterococci. Microbiol. Mol. Biol. Rev. 2019, 83, e00074-18. [Google Scholar] [CrossRef] [PubMed]
- Singleton, F.L.; Attwell, R.; Jangi, S.; Colwell, R.R. Effects of Temperature and Salinity on Vibrio Cholerae Growth. Appl. Environ. Microbiol. 1982, 44, 1047–1058. [Google Scholar] [CrossRef] [PubMed]
- Percival, S.L.; Yates, M.V.; Williams, D.W.; Chalmers, R.M.; Gray, N.F. Acinetobacter. In Microbiology of Waterborne Diseases; Elsevier: Amsterdam, The Netherlands, 2014; pp. 35–48. [Google Scholar]
- Kour, D.; Yadav, A.N. Alleviation of Cold Stress in Wheat with Psychrotrophic Phosphorus Solubilizing Acinetobacter Rhizosphaerae Eu-Kl44. Braz. J. Microbiol. 2023, 54, 371–383. [Google Scholar] [CrossRef]
- Asaf, S.; Numan, M.; Khan, A.L.; Al-Harrasi, A. Sphingomonas: From Diversity and Genomics to Functional Role in Environmental Remediation and Plant Growth. Crit. Rev. Biotechnol. 2020, 40, 138–152. [Google Scholar] [CrossRef]
- Yi, X.; Guo, H.; Deng, J.; Bai, Z.J.; Shi, X.F.; Qiang, J.B. Effect of Sphingomonas polyaromaticivorans on Spontaneous Combustion of Lignite During Low-Temperature Oxidation. Fuel 2024, 377, 132786. [Google Scholar] [CrossRef]
- Deshpande, N.M.; Sarnaik, S.S.; Paranjpe, S.A.; Kanekar, P.P. Optimization of Dimethoate Degradation by Brevundimonas sp. MCM B-427 Using Factorial Design: Studies on Interactive Effects of Environmental Factors. World J. Microbiol. Biotechnol. 2004, 20, 455–462. [Google Scholar] [CrossRef]


Disclaimer/Publisher’s Note: The statements, opinions and data contained in all publications are solely those of the individual author(s) and contributor(s) and not of MDPI and/or the editor(s). MDPI and/or the editor(s) disclaim responsibility for any injury to people or property resulting from any ideas, methods, instructions or products referred to in the content. |
© 2025 by the authors. Licensee MDPI, Basel, Switzerland. This article is an open access article distributed under the terms and conditions of the Creative Commons Attribution (CC BY) license (https://creativecommons.org/licenses/by/4.0/).