Article

Study on Dynamic Characteristics and Fracture Failure of Rigid Truss Trawl System During Towing Process

1
Ship and Maritime College, Guangdong Ocean University, Zhanjiang 524005, China
2
Department of Applied Mathematics and Mathematical Modeling, Saint Petersburg State Marine Technical University, Saint Petersburg 190121, Russia
3
Faculty of Maritime and Transportation, Ningbo University, Ningbo 315211, China
4
Guangdong Provincial Key Laboratory of Intelligent Equipment for South China Sea Marine Ranching, Guangdong Ocean University, Zhanjiang 524088, China
*
Author to whom correspondence should be addressed.
These authors contributed equally to this work.
J. Mar. Sci. Eng. 2025, 13(3), 586; https://doi.org/10.3390/jmse13030586
Submission received: 1 March 2025 / Revised: 13 March 2025 / Accepted: 13 March 2025 / Published: 17 March 2025

Abstract

:
Deep-sea fisheries depend on various fishing methods, including trawling, purse seining, and longline fishing, among others. Studying the dynamic characteristics of trawling operations is essential for the trawl mechanism. Because of the solid truss support, the beam trawl system may be employed in extreme sea conditions, the high-speed driving of tugs, and maneuvering situations. This study systematically investigates the dynamic responses and structural safety of a midwater beam trawl during towing via the lumped mass method and OrcaFlex 9.7e simulations. Firstly, a trawl model with four towlines was developed and validated against flume tank experiments. Secondly, multiple operational scenarios were analyzed: towing speeds, angular velocity variations under a fixed turning radius, and radius effects under constant angular velocity. The results show that line tension increases with the speed increment and that the rigid frame destabilizes at angular velocities exceeding 20°/s due to centrifugal overload. Furthermore, line fracture scenarios during startup and straight-line towing were emphasized. Single-line failure leads to edge constraint loss, redistributing stress to the remaining lines, and asymmetric dual-line fracture triggers net torsion, reducing fishing efficiency. This study provides theoretical guidance for optimizing the safe operational parameters of midwater beam trawls.

1. Introduction

Rich in resources, the deep sea is particularly abundant in fish [1,2]. Marine fisheries are a key component of the marine industry, and fishing is an essential part of this sector [3,4]. The bottom trawling mechanism is key in deep-sea fishing and is typically towed from either the stern or the sides of the fishing vessel [5,6]. Once fish are located, the vessel employs various maneuvers such as accelerating forward and making sharp turns to chase, intercept, and capture them using a midwater trawl [7]. A typical marine trawl system is shown in Figure 1.
The dynamic behavior and properties of trawl systems (TSs) have been widely studied by researchers using various approaches. As early as the 1980s, efforts were made to characterize these systems. Over time, the field has garnered increasing attention, with numerous research methods being proposed to investigate the dynamic behavior and characteristics of trawl systems (TSs) [8,9,10,11]. Dealteris et al. assessed two different trawl designs—shrimp trawls and high-level trawls—using both scaled model testing and field-testing methods [12]. Buxton and Alteris found that under test conditions, webbing sturdiness and drag speed significantly influenced the velocity gradient, while webbing sturdiness and the mean angle of incidence affected the drag coefficient. However, drag speed had minimal impact on drag. [13]. Hu et al. numerically analyzed the dynamic characteristics of a trawling system, providing key details about the net and otter boards, including drag coefficients. The study also found that changes in trawler speed influence the sinking distance of both the net and the otter board [14]. Sangster and Breen employed a proto-scale experimental approach to compare the fishing and engineering performance of single and double trawls. Specifically, they examined the effects of gate width, wingspan, and rein angle on the area of the seafloor effectively fished using each type of trawl [15]. Reite and Asgeir combined steady-state and transient hydrodynamic effects into a comprehensive mathematical model, which can be effectively used in the design of trawl door control systems. They derived the steady-state hydrodynamic coefficients for trawl doors through wind tunnel experiments [16]. To evaluate the performance of two trawl doors, Sala et al. conducted a comparative experiment—the existing AR door and the new Clarck-Y door—focusing primarily on demersal fisheries. By comparing the results of flume tank tests and full-scale at-sea trials, they highlighted significant performance differences between the two trawl doors. The study found variations in drag, lift, and efficiency factors between the two designs [17]. In their study, Sun et al. designed a mathematical model to simulate the trawling process of a single-vessel midwater trawl system. In addition to simulating the trawler and fishing gear separately, the model considers the influence of wind and current. Simulations were used to evaluate hydrodynamic performance. [18]. Zhao et al. analyzed a box-shaped mesh cage using numerical methods and developed a numerical model to predict its hydrodynamic response to waves and currents. The model was validated through physical tests [19].
According to the literature, approaches for investigating trawl system hydrodynamic performance include model testing, numerical modeling, and full-scale sea tests. With the advancement of computer technology, numerical simulation is seen as an effective strategy [20,21]. Numerical simulation is becoming more and more popular among scholars since it is an efficient way to address a variety of challenging issues in the study of trawl systems. For example, Li et al. [22] designed a new deep-sea trawl for deep-water fishing vessels, evaluating its hydrodynamic performance through numerical simulations and physical modeling. In their study, Liu et al. [23] introduced a calculation method for a frustum-type pressure reducer used in midwater trawls targeting larval and juvenile fish. This study employed flume experiments alongside computational fluid dynamics (CFD) simulations to analyze the flow field distribution and optimize the design parameters of the pressure reducer. Guan et al. conducted the research. Reference [24] explored the hydrodynamic interactions between sorting nets and bottom trawls to improve trawl selectivity and reduce bycatch. Their study combined numerical simulations and physical model tests, revealing that the sorting net significantly influences the jetty shape and net tension distribution. Xiong et al. [25] investigated the drag characteristics of a Chinese Antarctic krill vessel operating in an ice flow zone, employing MATLAB 2021B and genetic algorithms to simulate ice flow and evaluate the interactions between the ship’s trawl grid and the ice. Their results indicated that ice drag increases with ice concentration and velocity, while trawl drag becomes more pronounced at higher velocities. Neill and Karsten [26] modeled the flow through mesh panels. Tang et al. [27] examined how twine diameter and mesh size, as well as the material, impacts the effectiveness of fishing nets, with an emphasis on the interaction between turbulence and hydrodynamic forces around the mesh structure. To simulate the viscous three-dimensional unsteady boundary layer turbulent flow, the fishing net was modeled as a knotless net with diamond-shaped mesh, using cylinders as flow obstacles to represent the mesh structure. To further explore the effect of hydrodynamic forces on the net’s deformation, a porous medium model and finite element structural dynamics (FEM) analysis were applied. Nsangue et al. [28] studied the hydrodynamic properties of gillnets, particularly how design parameters influence net performance, through numerical simulation and experimental validation. A CFD model was combined with the k-Ω (SST) turbulence model in a one-way coupled approach to simulate the fluid–net interaction, providing insights into the stresses, strains, deformations, and motions of the gillnet. Numerical simulation methods have played a crucial role in these studies by providing detailed insights into the flow field and structural behavior.
Trawl structures, particularly beam trawl systems characterized by rigid truss supports, differ significantly from fully flexible trawl systems due to their inherent flexibility. The rigid beam framework minimizes deformation during towing, ensuring a consistent fishing area even under high-speed operations. However, localized stress concentrations caused by abrupt maneuvers or excessive towing speeds may still lead to the horizontal/vertical misalignment of the net gear, increasing risks of entanglement, line fracture, or structural collapse. These challenges are exacerbated during rapid tugboat rotations, where the asymmetric force distribution on the rigid frame edges heightens deformation risks. Unlike bottom trawls, which rely on hydrodynamic forces or otter boards for horizontal expansion, beam trawls depend on their truss structure to maintain shape integrity. Consequently, precise control of the towing parameters (e.g., speed, angular velocity, angle of attack of the beam) is critical to prevent stress overload on the rigid frame and lines. Li et al. [29] designed three types of beams—cylindrical, airfoil, and elliptical—and studied the hydrodynamic performances of beams with different shapes at different angles of attack. They draw the conclusion that compared to the cylindrical beam, the hydrodynamic performances of the airfoil beam and elliptical beam are superior. Rijnsdorp [30] estimated the hydrodynamic drag of individual gear components of the beam trawl using empirical measurements of similarly shaped objects, including cylinders, cubes, and nets. He et al. [31] proposed a depth variable device installed on the beam to adjust the trawling depth independently, aiming to track the depth where the shoal of Antarctic krill is located for accurate fishing.
The research employs the lumped mass method in OrcaFlex to simulate the trawl warp and net, capturing their dynamic behavior under different towing conditions. The simulation helps to analyze how different towing speeds influence the deformation, stability, and forces acting on the system, providing insights into the operational limits and optimization of towing practices for beam trawl systems. The structure of this article is illustrated in Figure 2.

2. Methodology of the Trawl System (TS) Model

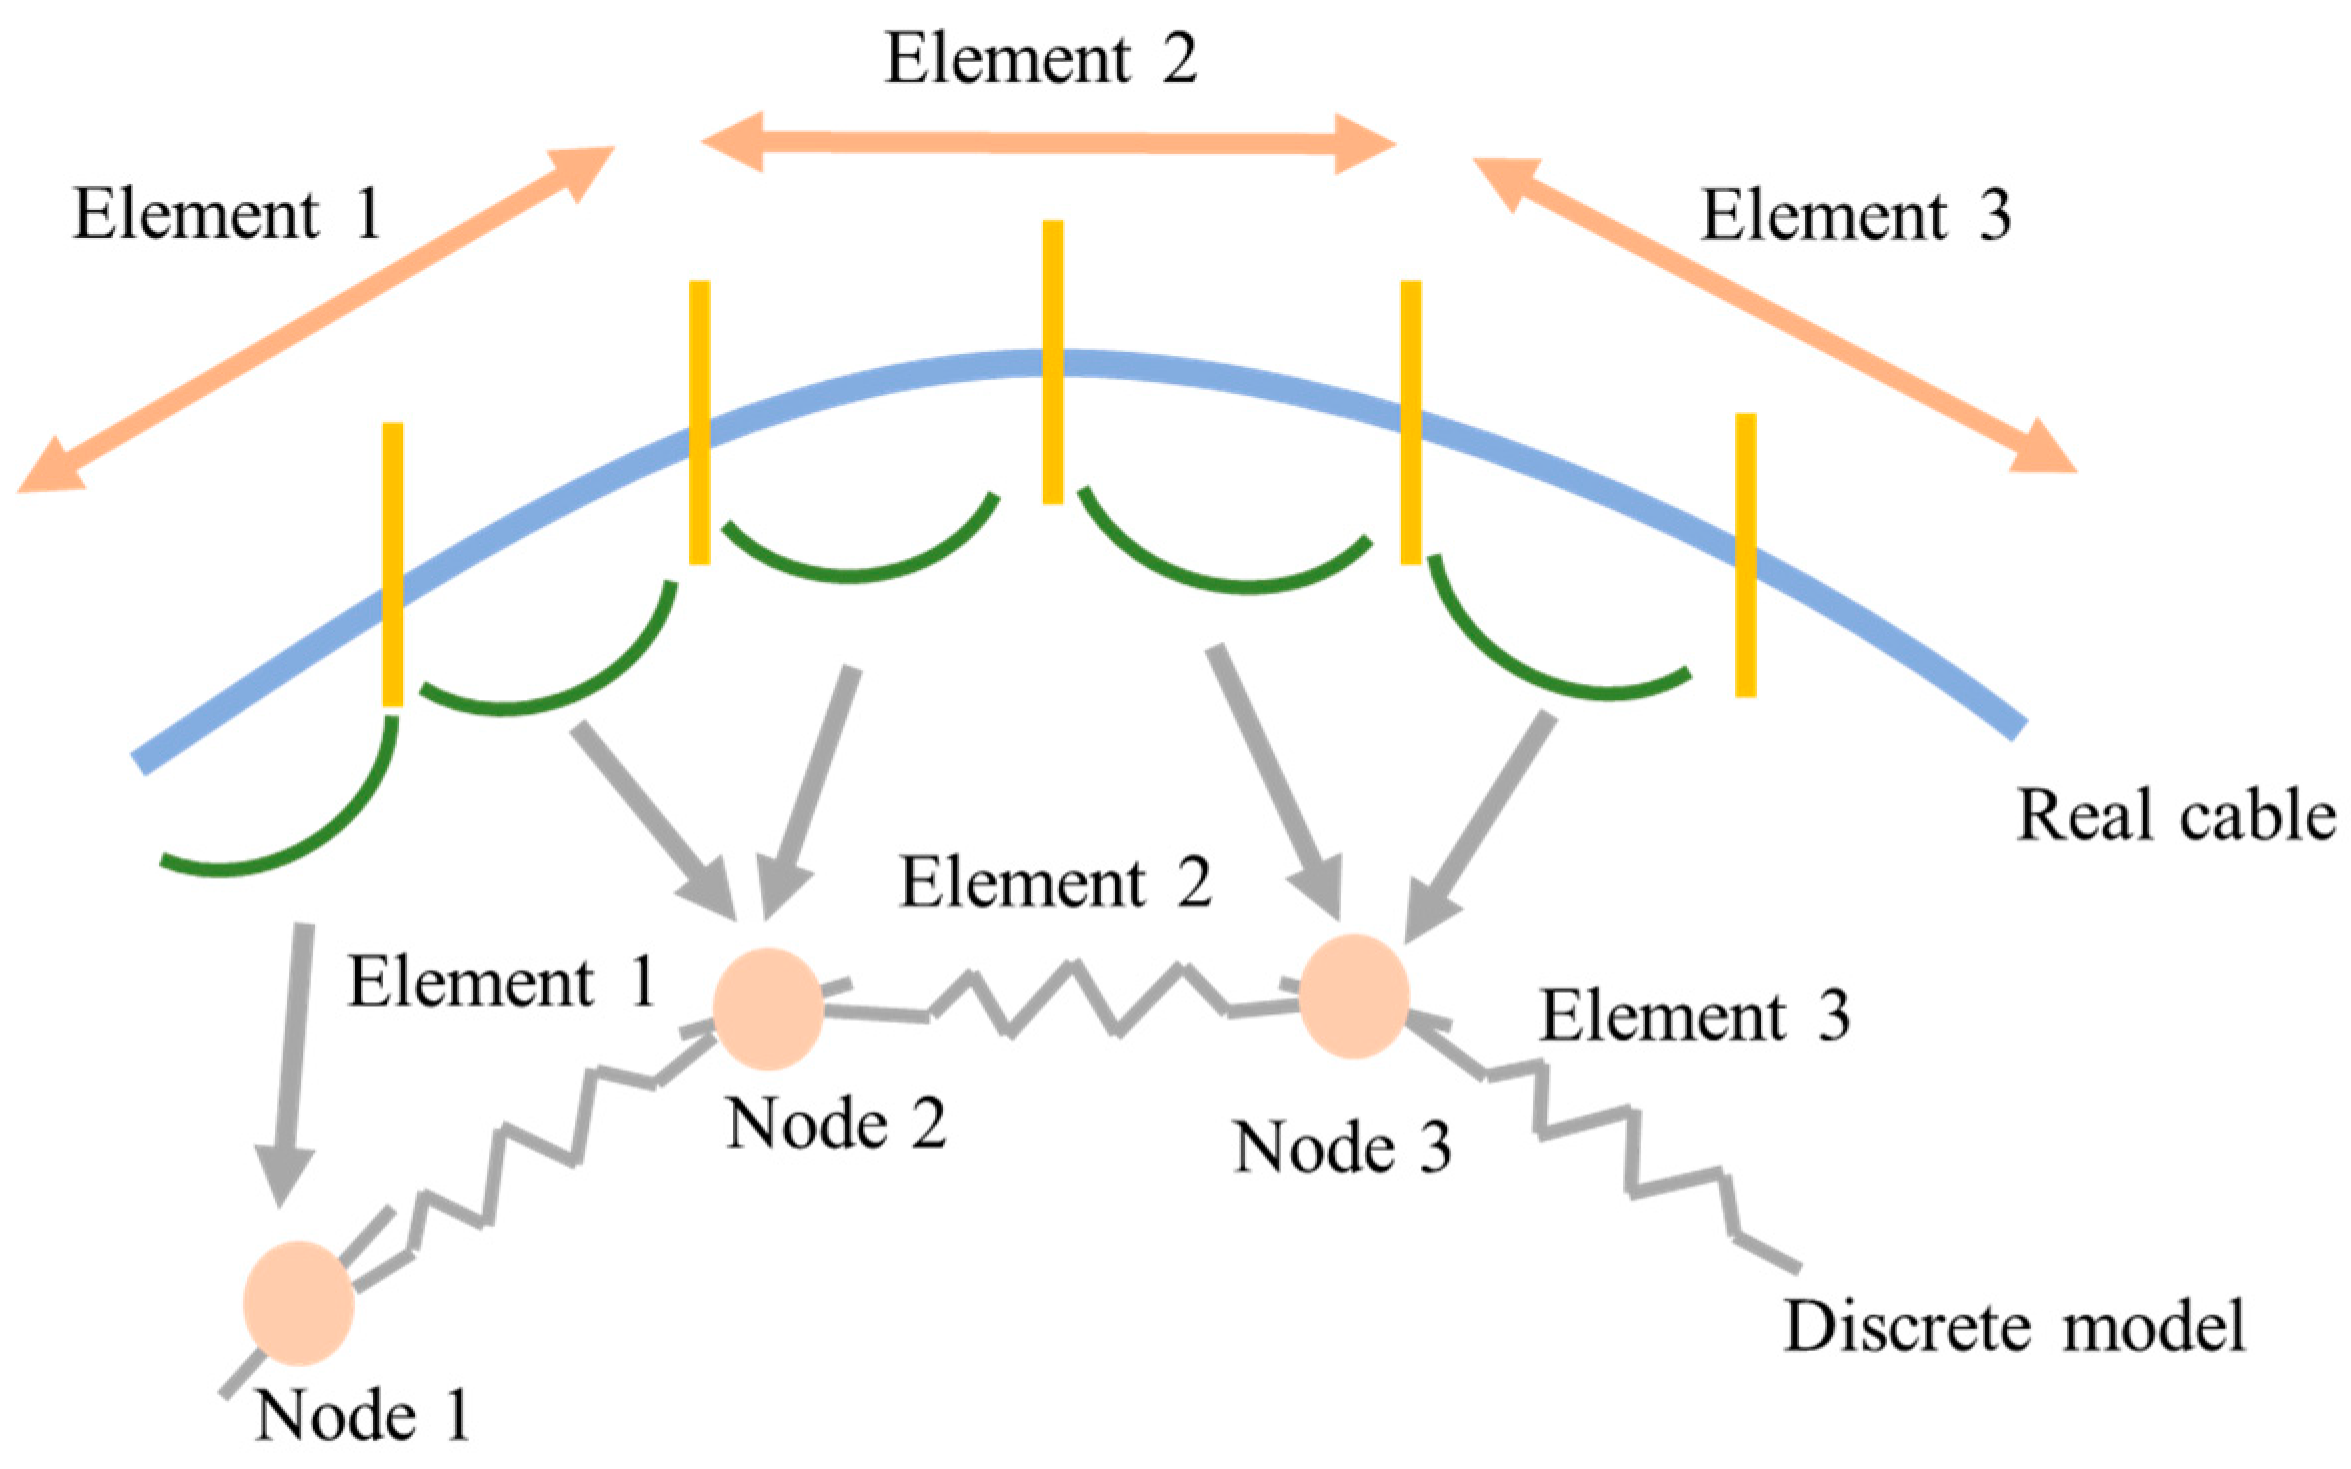
2.1. The Lumped Mass Model

To address the nonlinear boundary value issue, the discrete lumped mass model is utilized. The core concept of this model involves segmenting the line being towed into N distinct pieces, with each segment being considered individually and each segment’s mass concentrated at one node, creating a total of N + 1 nodes. The pulling force and shearing forces at the ends of each segment, together with any external hydrodynamic loads, are applied at the nodes. The equation of motion of i-th node (i = 0, 1…N) is as follows:
M A i R ¨ i = T e i T e i 1 + F d I i + V i V i 1 + w i Δ s ¯ i
Among them, R represents the node position of the line.
M A i = Δ s ¯ i m i + π 4 D i 2 ( C a n 1 ) I Δ s ¯ i π 4 D i 2 ( C a n 1 ) ( τ i τ i 1 ) represents the mass matrix associated with each node; I denotes a 3 × 3 identity matrix; T e i = E A ε i = E A Δ s 0 i Δ s ε i , which stands for effective tension at a certain node; Δ s 0 i = L 0 / N 1 , which represents the initial length attributed to each segment; Δ s ε i = R i + 1 R i , which represents the stretched length of each segment; and EA denotes the axial stiffness of the line.
F d I i indicates the external hydrodynamic forces [32] of each node, which are calculated according to the Morison equation:
F d I i = 1 2 ρ D i 1 + ε i Δ s ¯ i ( C d n i v n i v n i + π C d t i v t i v t i ) + π 4 D i 2 ρ C a n i Δ s ¯ i a w i ( a w i · τ i ) τ i
where ρ means sea water density, Di means the diameter of each line, Cdni means the normal drag coefficient, Cdti means the tangential drag coefficient, and Cani means the inertia coefficient.
V i = E I i + 1 τ i × ( τ i × τ i + 1 ) Δ s ε i Δ s ε i + 1 E I i τ i × ( τ i - 1 × τ i ) Δ s ε i 2 + H i + 1 τ i × τ i + 1 Δ s ε i , V represents the shear force at the node and H is the torsion.
The lumped mass model is shown in Figure 3.

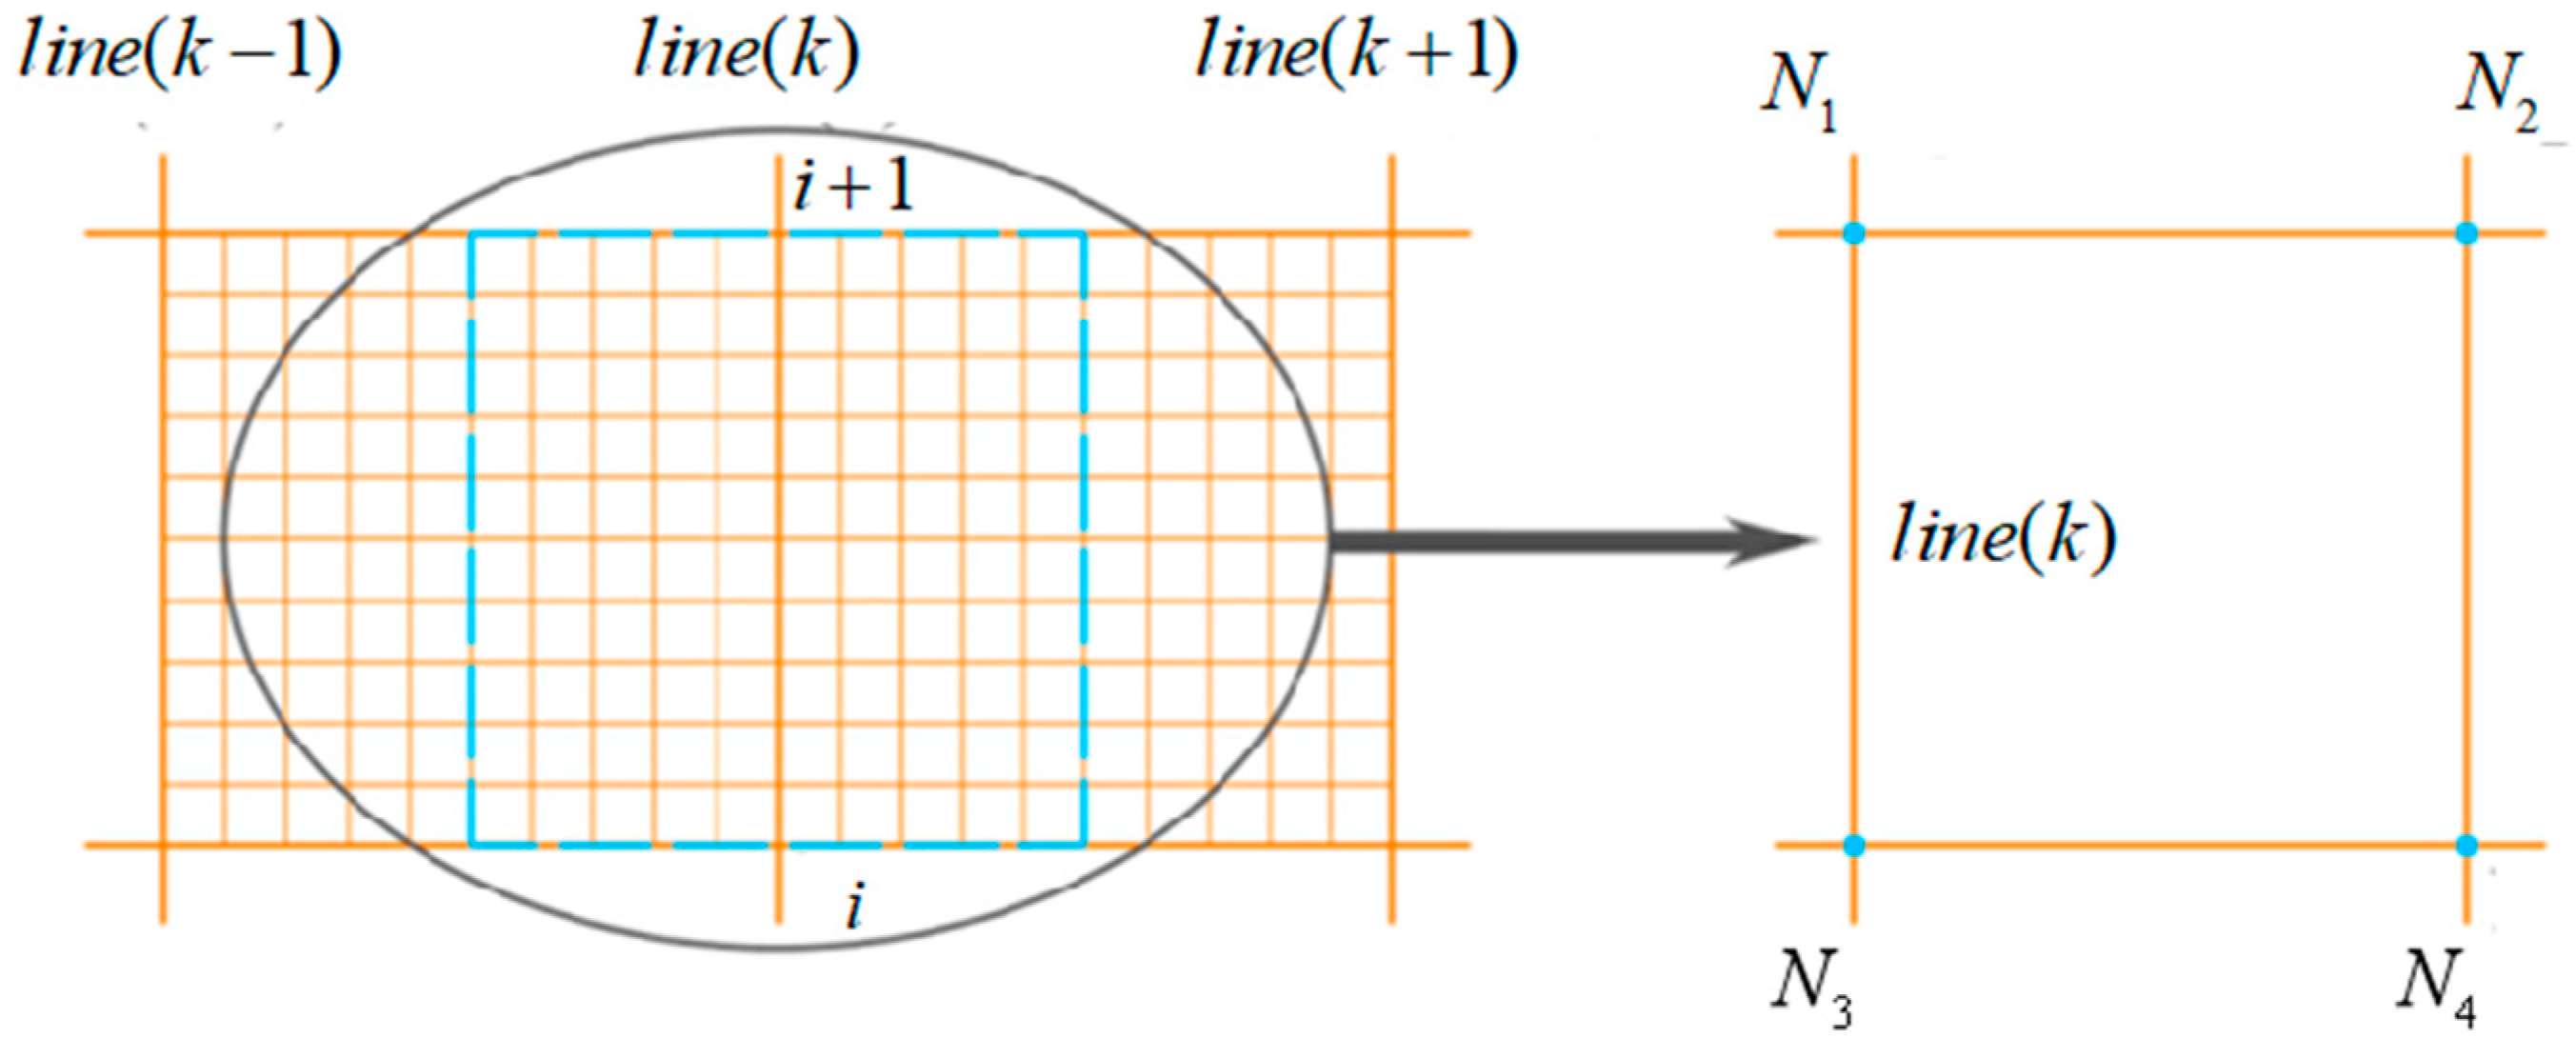
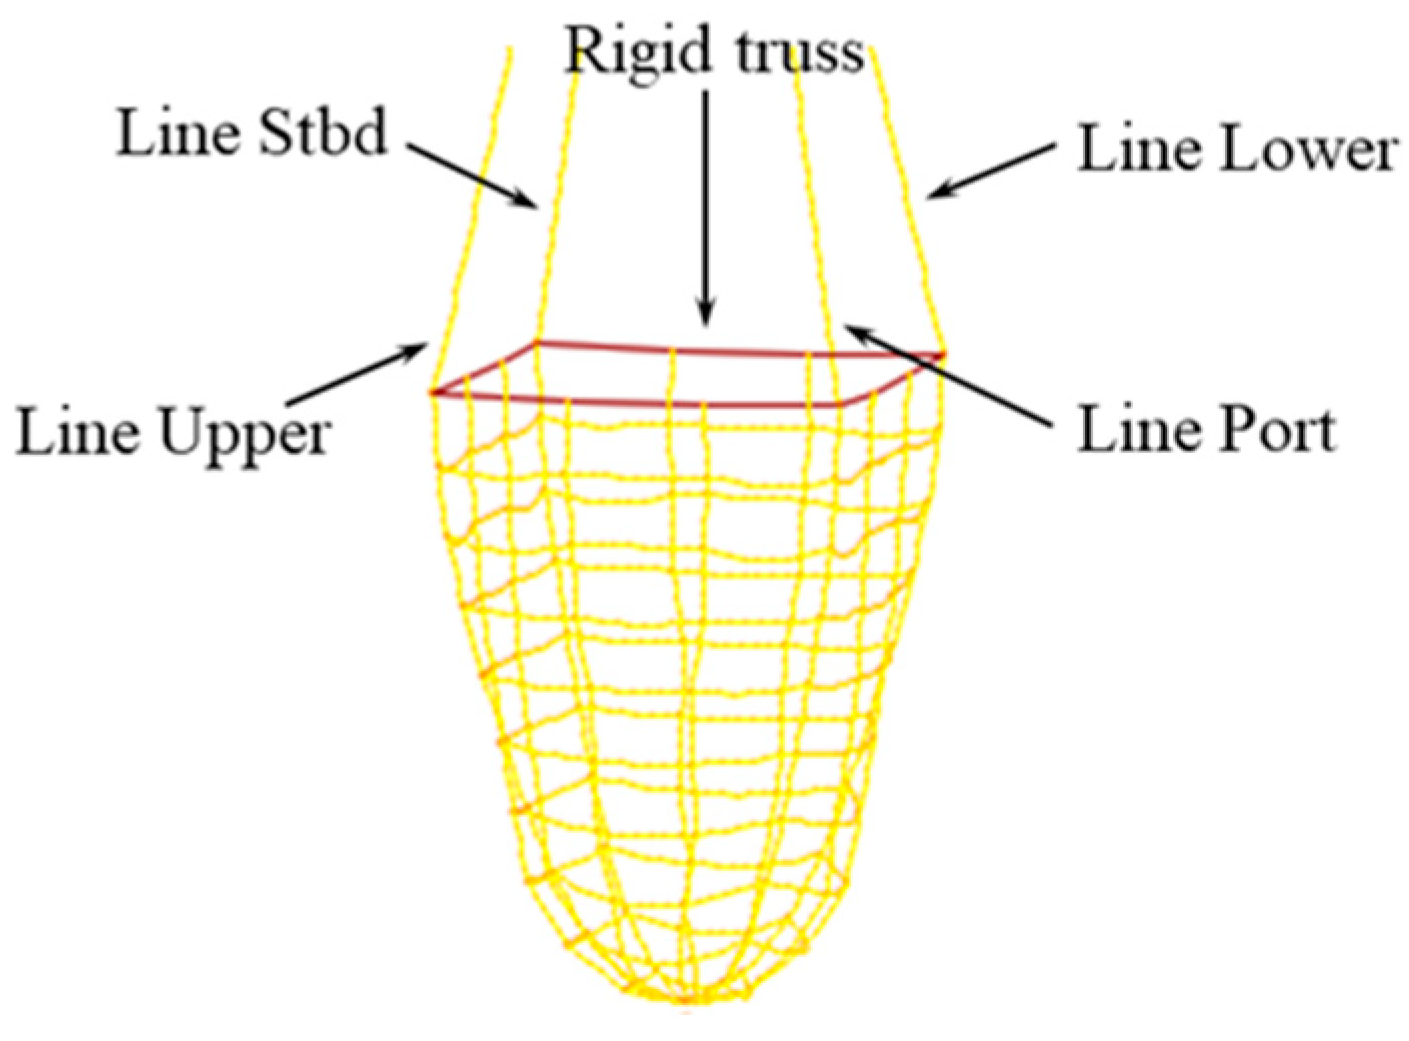
2.2. Equivalent of Trawl Net

In Figure 4, the analogous model of the netting is shown, where k represents the k-th line of the net, and I marks the node located at the center of the aggregate horizontal length of the n neighboring net lines at the lower boundary. With the diameter of each actual net line being d0 and its hydrodynamic coefficient Cd, when merging n adjacent lines to form a single new line, this combined line features a diameter of D and a hydrodynamic coefficient of CD. The conservation of the overall volume of the lines in the net leads to the subsequent equations.
n π 4 d 0 2 = π 4 D 2
D = d 0 n
If we assume that the hydrodynamic coefficients are equal before and after equivalence, we can reach the following conclusion:
C D = C d n
As illustrated in Figure 5, the equivalent net model experiences drag and lift forces resulting from the flow. The equations describing the horizontal drag and vertical lift are outlined below:
F D = C D 1 2 ρ A U 2
F L = C L 1 2 ρ A U 2
In these equations, A signifies the net’s area, ρ stands for the density of water, and U represents the velocity of the current, whereas CD and CL denote the coefficients for drag and lift, respectively.
The determination of hydrodynamic coefficients has been a focal point in the study of net equivalence, and the empirical formula method is generally used, as shown in Equations (8) and (9) [33].
C D S n , θ = 0.04 + 0.04 + 0.33 S n + 6.54 S n 2 4.88 S n 3 cos θ
C L S n , θ = 0.05 S n + 2.3 S n 2 1.76 S n 2 sin 2 θ
Within this framework, the symbol θ is utilized to denote the inclination of the water current’s trajectory, which is a critical parameter for understanding the dynamics of the net’s interaction with the fluid environment. Sn represents the water permeability of the net, which is determined using the following calculation:
S n = 2 d ω l ω d ω l ω 2
where dω represents the outer diameter of the net mesh length, while lω denotes the length between two nodes in the mesh garment.

2.3. Modeling of the Beam Trawl System in OrcaFlex
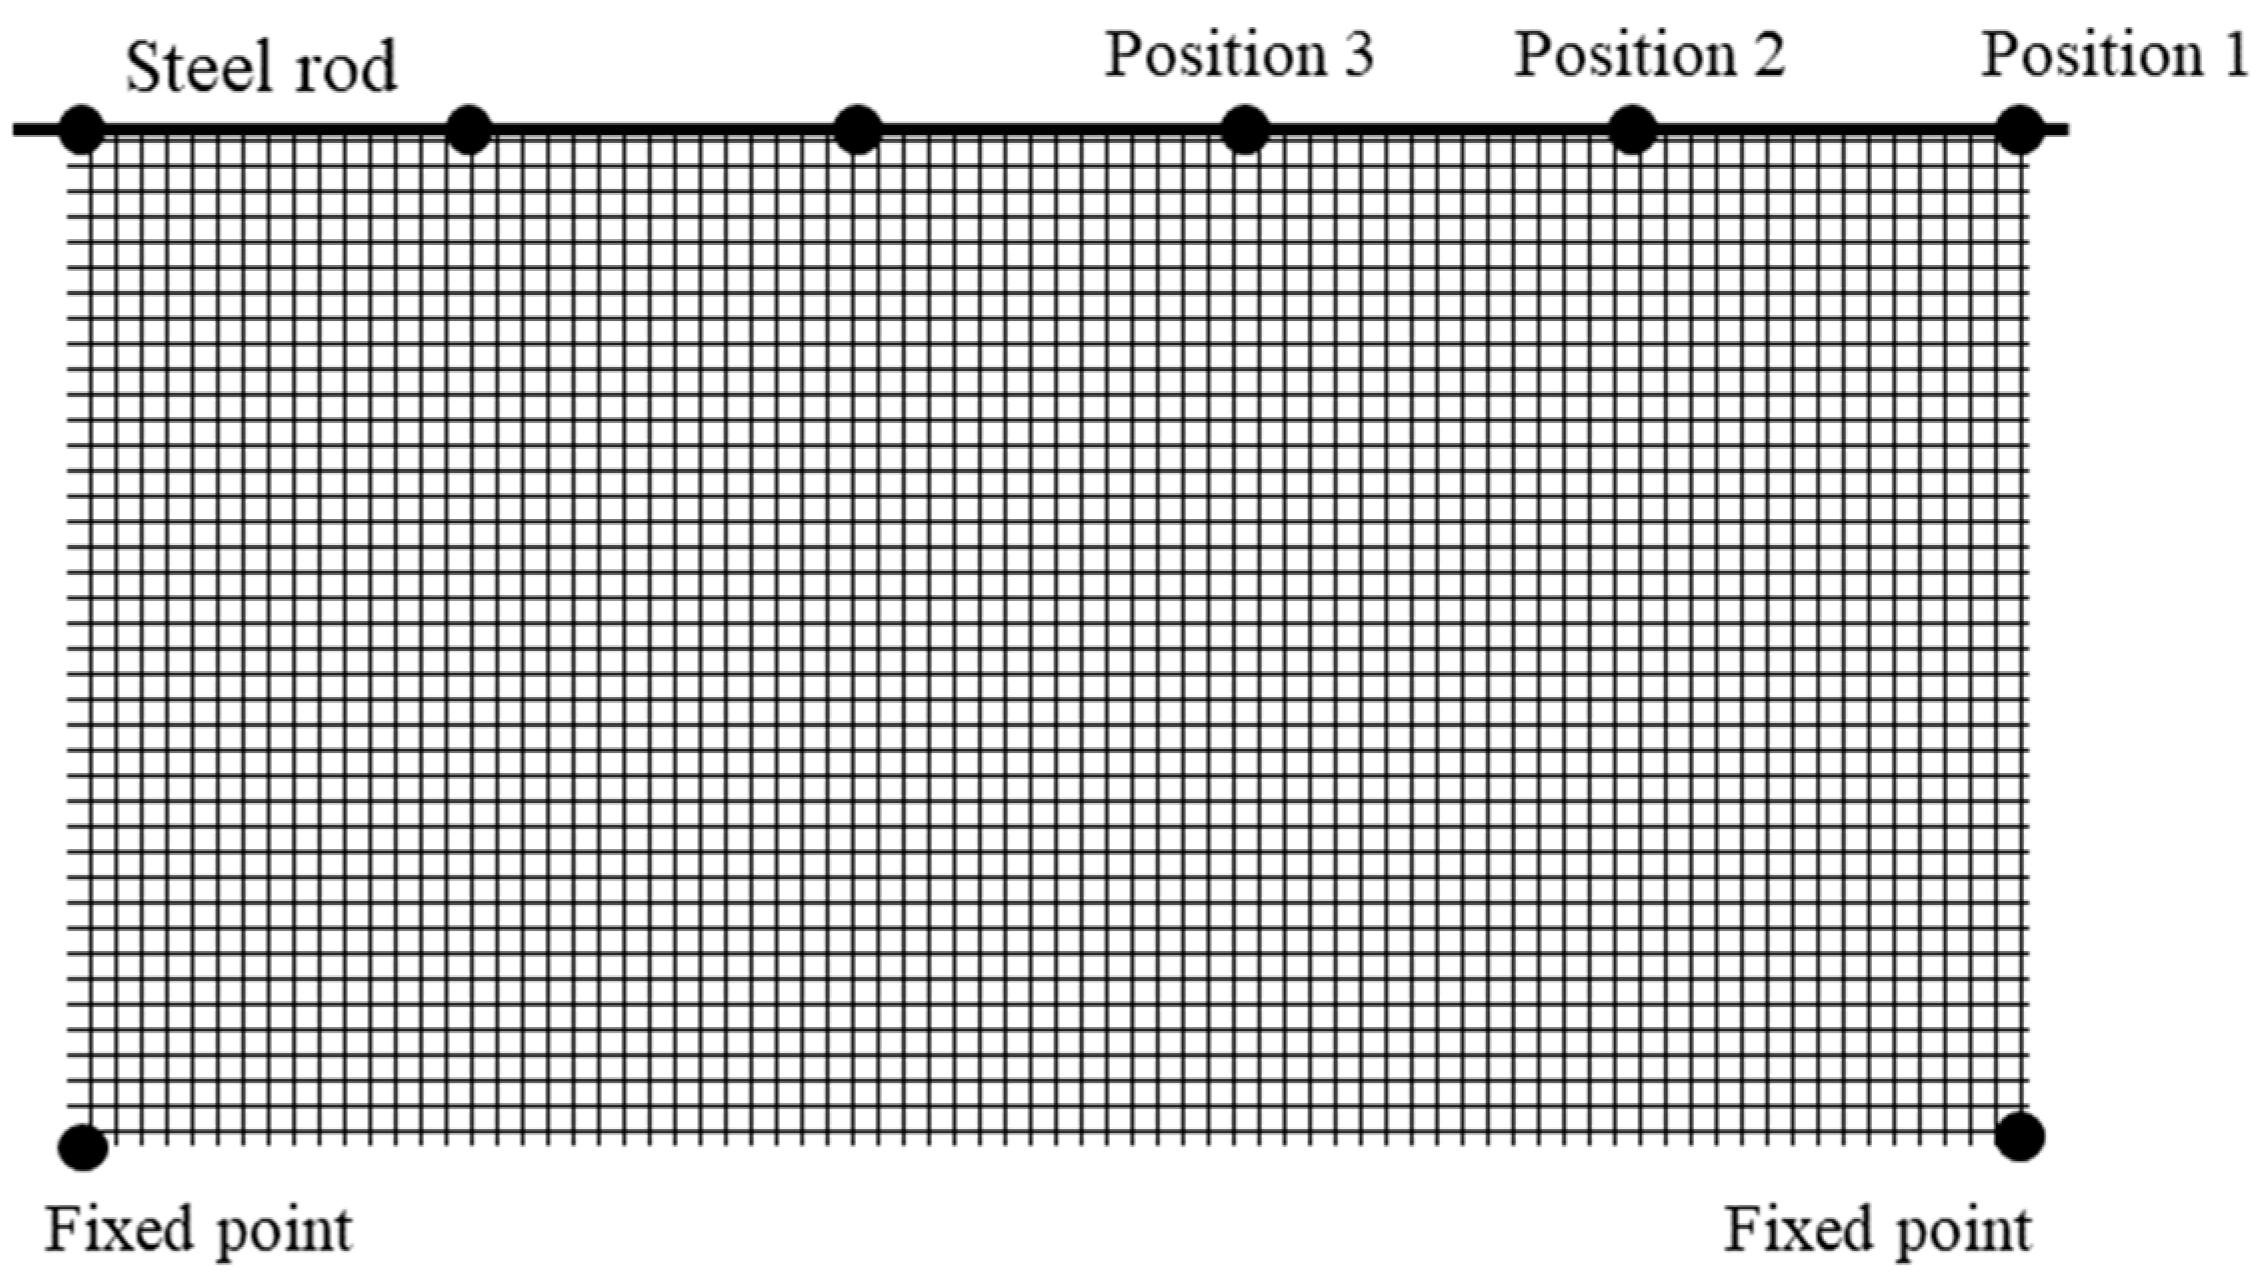
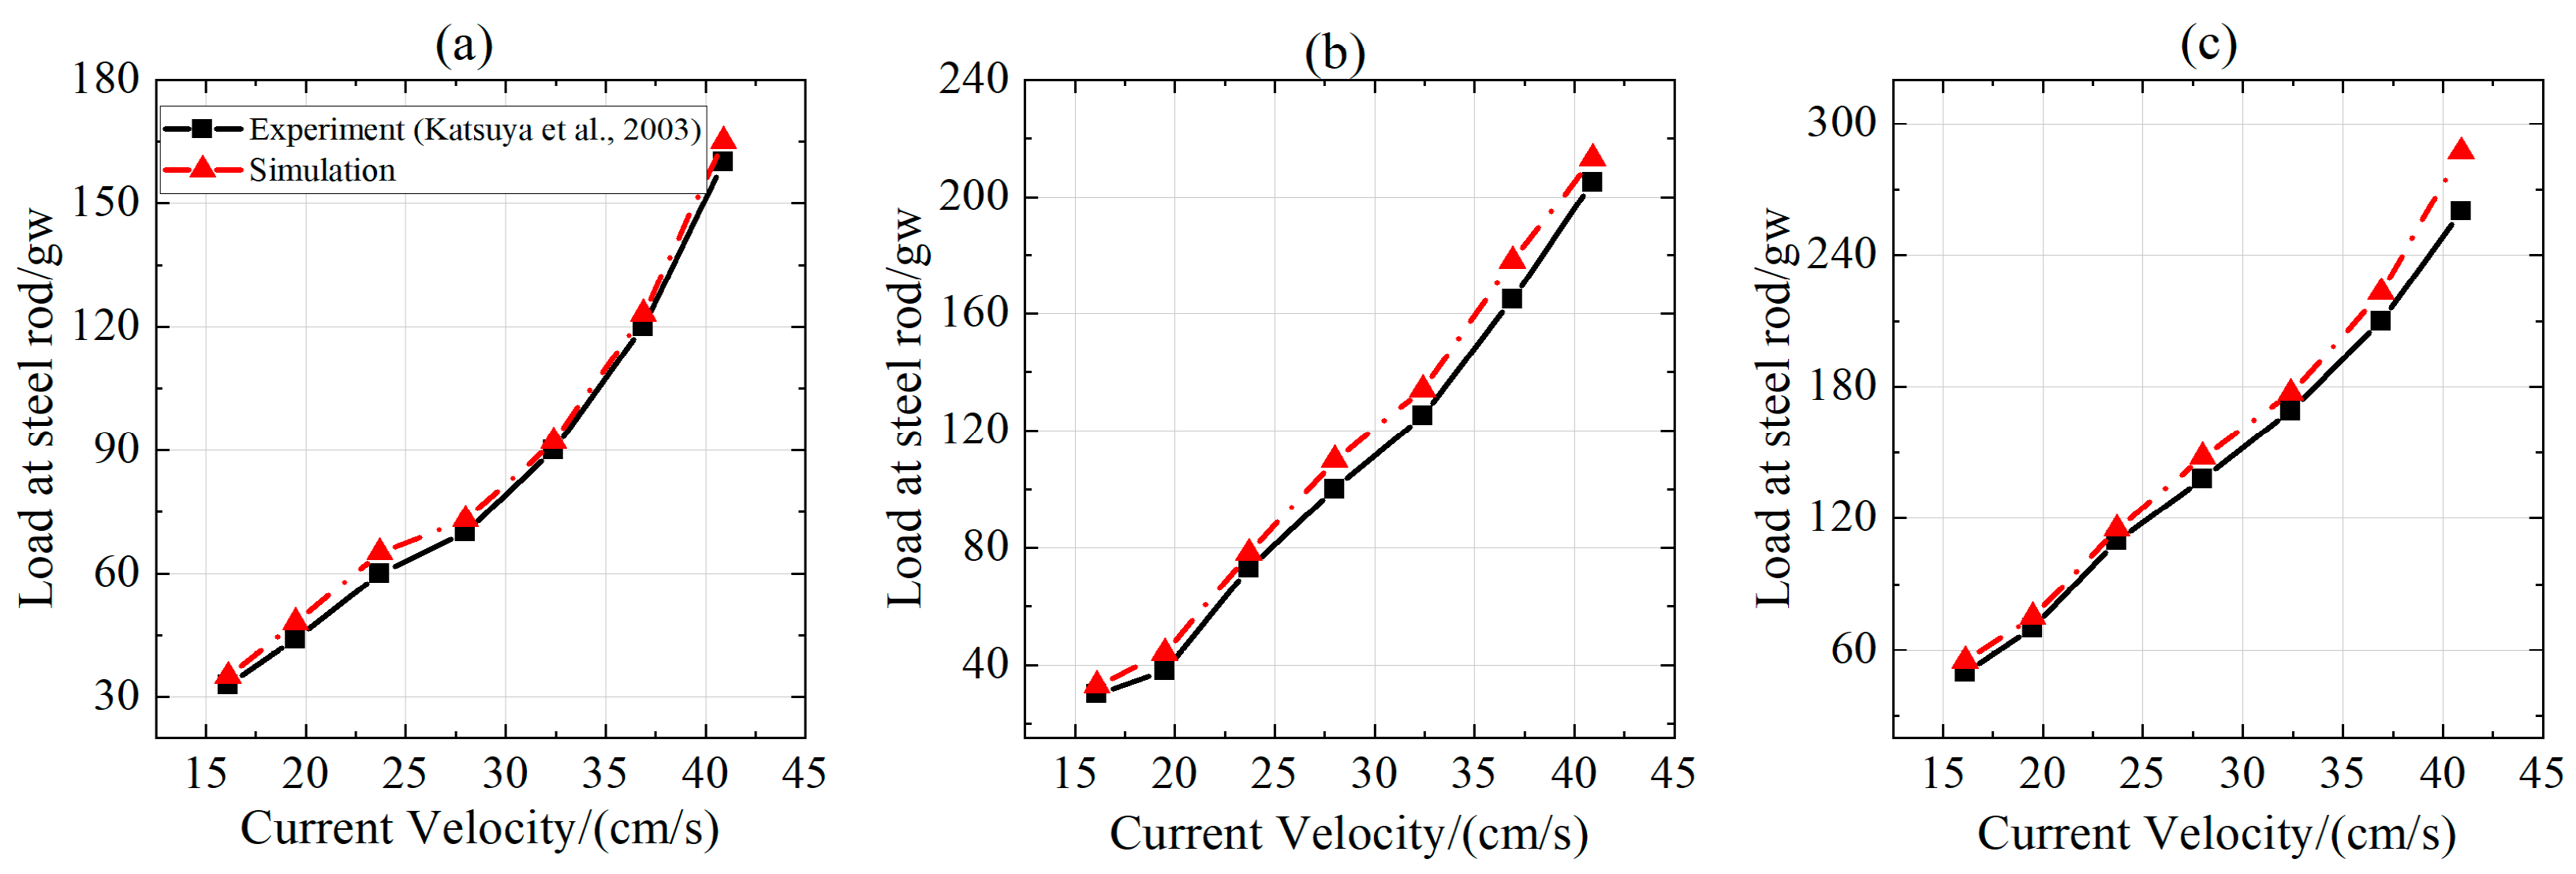
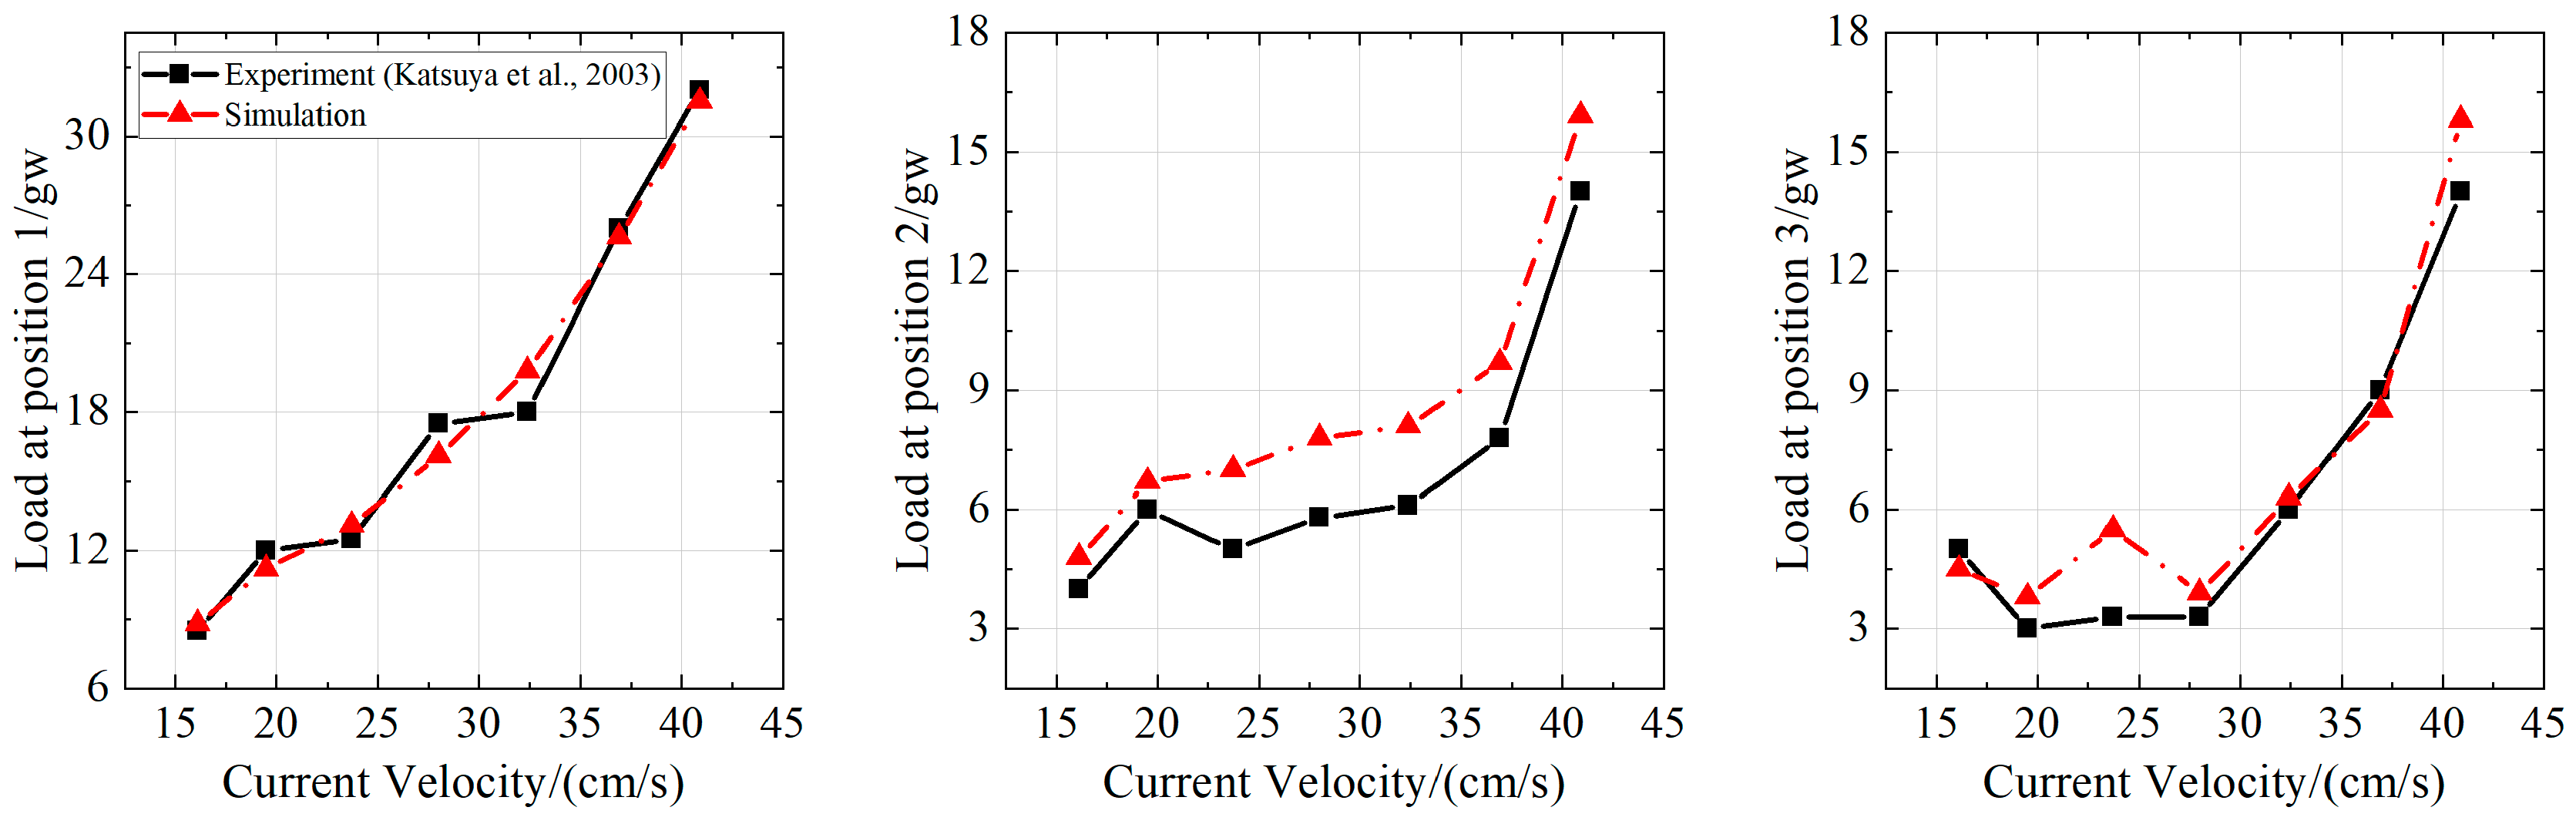
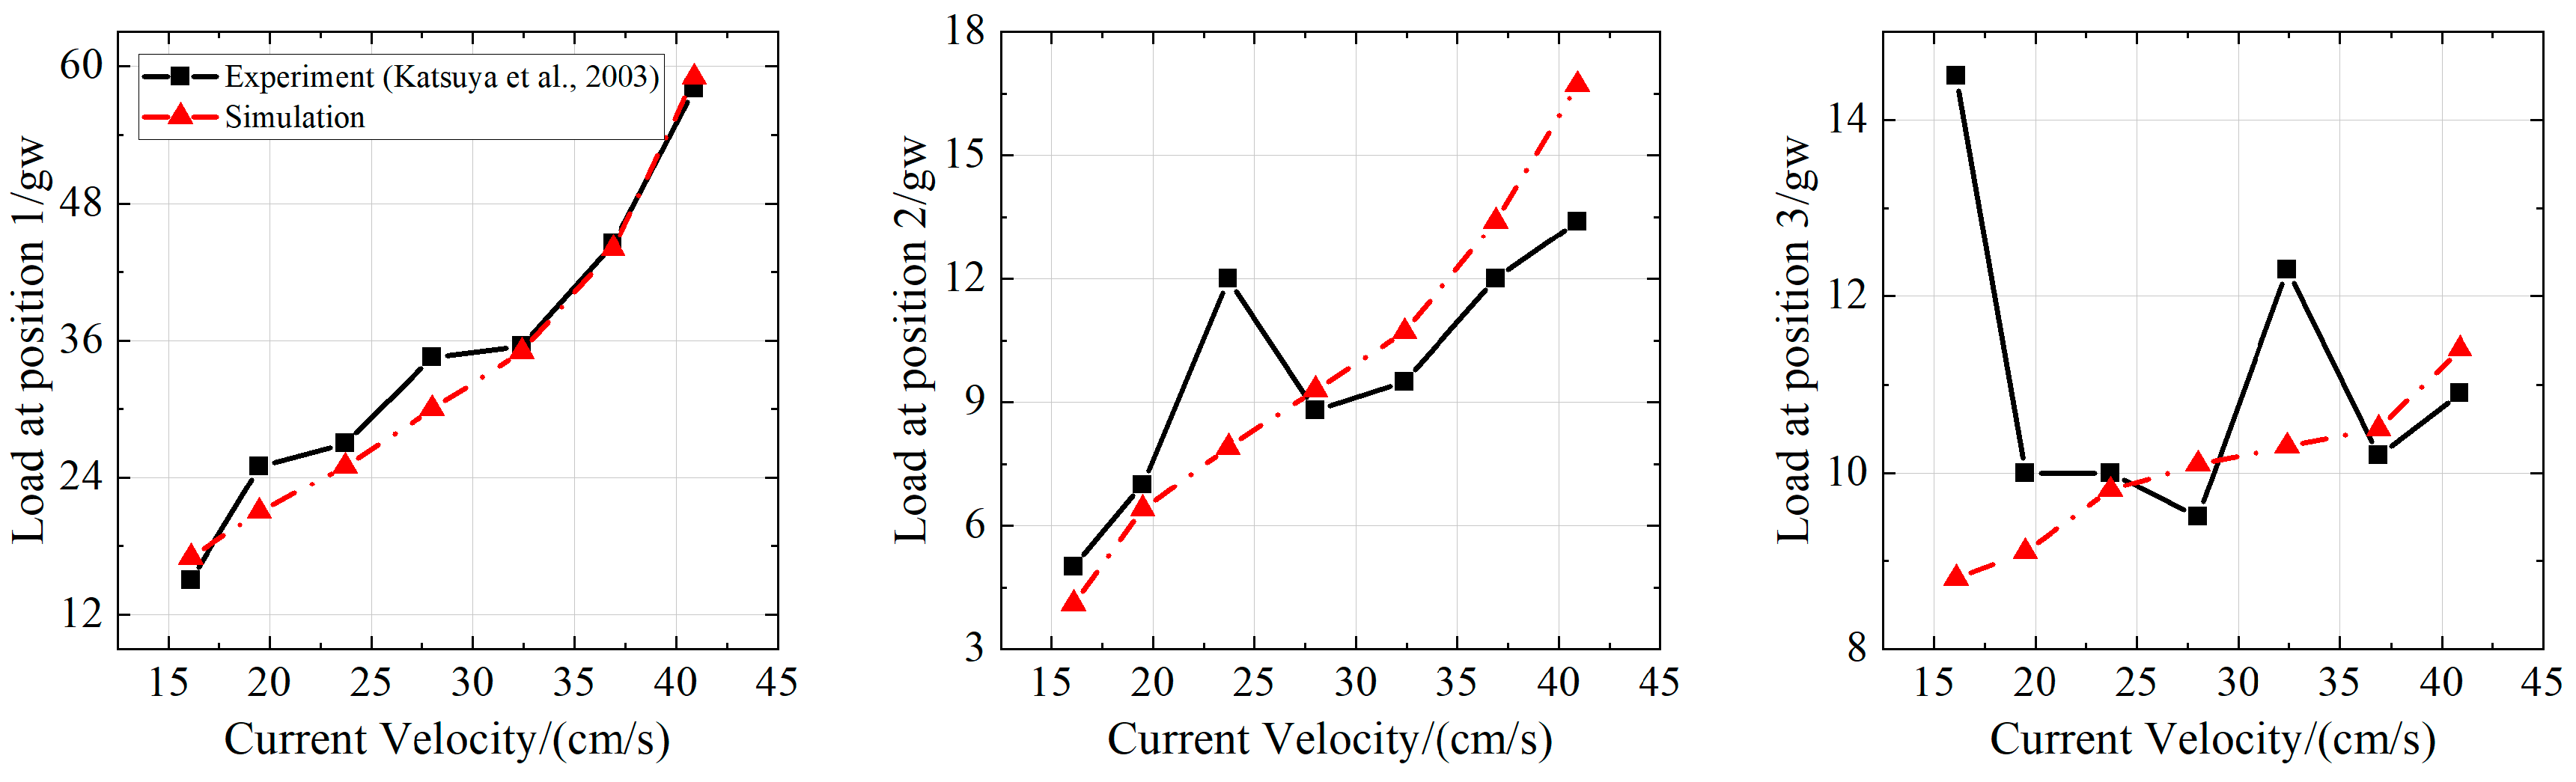
This study employs a midwater beam trawl system (Figure 6) designed for midwater operations with a rigid truss structure. The system operates at depths of 50–200 m, with a total warp length of 150 m and towing speeds ranging from 1 to 5 m/s. In Figure 6, it is illustrated that the upper part of the beam trawl consists of four sturdy rods. This configuration contributes to the structural integrity and functionality of the trawl system. These bars also serve to maintain the trawl’s effective fishing area, ensuring it remains constant during operation. The rigid bars are connected to each other and form one square rigid frame. Four towing lines connect the tug’s stern to the beam trawl. To accurately assess the towing line fracture breakdown, it is essential to identify the four towed lines. When the tug is at rest, the Line Port and Line Stbd, which are symmetrical to the tug’s longitudinal plane, are located on the tug, The Line Port is assigned to the vessel’s right-hand side, while the Line Stbd occupies the left-hand side. This strategic placement is essential for maintaining equilibrium and enhancing the operational effectiveness of the system.
During high-speed straight-line towing, line fractures pose severe risks to trawl system safety. The tugboat parameters in this study are as follows: maximum towing speed 12 knots (≈6.17 m/s), bollard pull force 1200 kN, main engine power 5000 kW, rudder area 12 m2, and rudder effectiveness coefficient 0.65. Maneuverability was calibrated via zigzag tests, showing a heading change rate of 15°/s and a turning diameter of 2.5× ship length. Simulations covered towing speeds of 1–5 m/s (encompassing operational ranges) to evaluate the impact of tugboat dynamics on trawl system behavior.
Comprising the towing line known as the trawl warp, the trawl system features a towed line model that is thin, flexible, and cylindrical. In the OrcaFlex simulation, the four rigid frame edges are modeled as hollow, uniform cylindrical tubes with a theoretical infinite stiffness. The lines feature an outer diameter of 0.35 m and an inner diameter of 0.25 m. Furthermore, these lines exhibit a linear mass density of 0.18 tons per meter, a flexural stiffness of 120 kN·m2, a torsional stiffness of 80 kN·m2, and an axial stiffness of 700,000 kN. The mechanical properties of the trawl’s nets are identical to those of the lines. The overall tilt of the trawl system and the variations in towline tension are crucial research areas for this trawl system, which is known for its substantial resistance to deformation. The mechanical properties of the trawl’s nets are the same as those of the lines. The primary focus of research for this type of trawl system lies in the tilt of the trawl system and the changes in towline tension, which are due to its remarkable ability to resist deformation. The trawl winch is mainly used for lifting and releasing nets and twisting and retracting ropes. In the trawling operation, the length and speed of the towed wire are adjusted to maintain different water layer positions of the net. In OrcaFlex, the simplified winch model is used to control the towing lines [34]. Figure 7 depicts the tug and beam trawl in OrcaFlex.

2.4. Validation

To verify the precision of the proposed method, a numerical simulation of the trawl net system was performed, and the results were compared with experimental data [35]. Three types of nylon nets, types A, B, and C, were used, as shown in Table 1. Figure 8 illustrates the diagram of the validation model.
Figure 9 illustrates a comparative study of the dynamic forces acting on the steel rod, as derived from simulation versus experimental data, while Figure 10, Figure 11 and Figure 12 offer an exhaustive analysis of the tension forces at three pivotal locations for a variety of net configurations. Overall, there is a high degree of correlation between the outcomes of the computational models and the experimental results. Table 2 presents the validation results and errors.

3. Results and Discussion

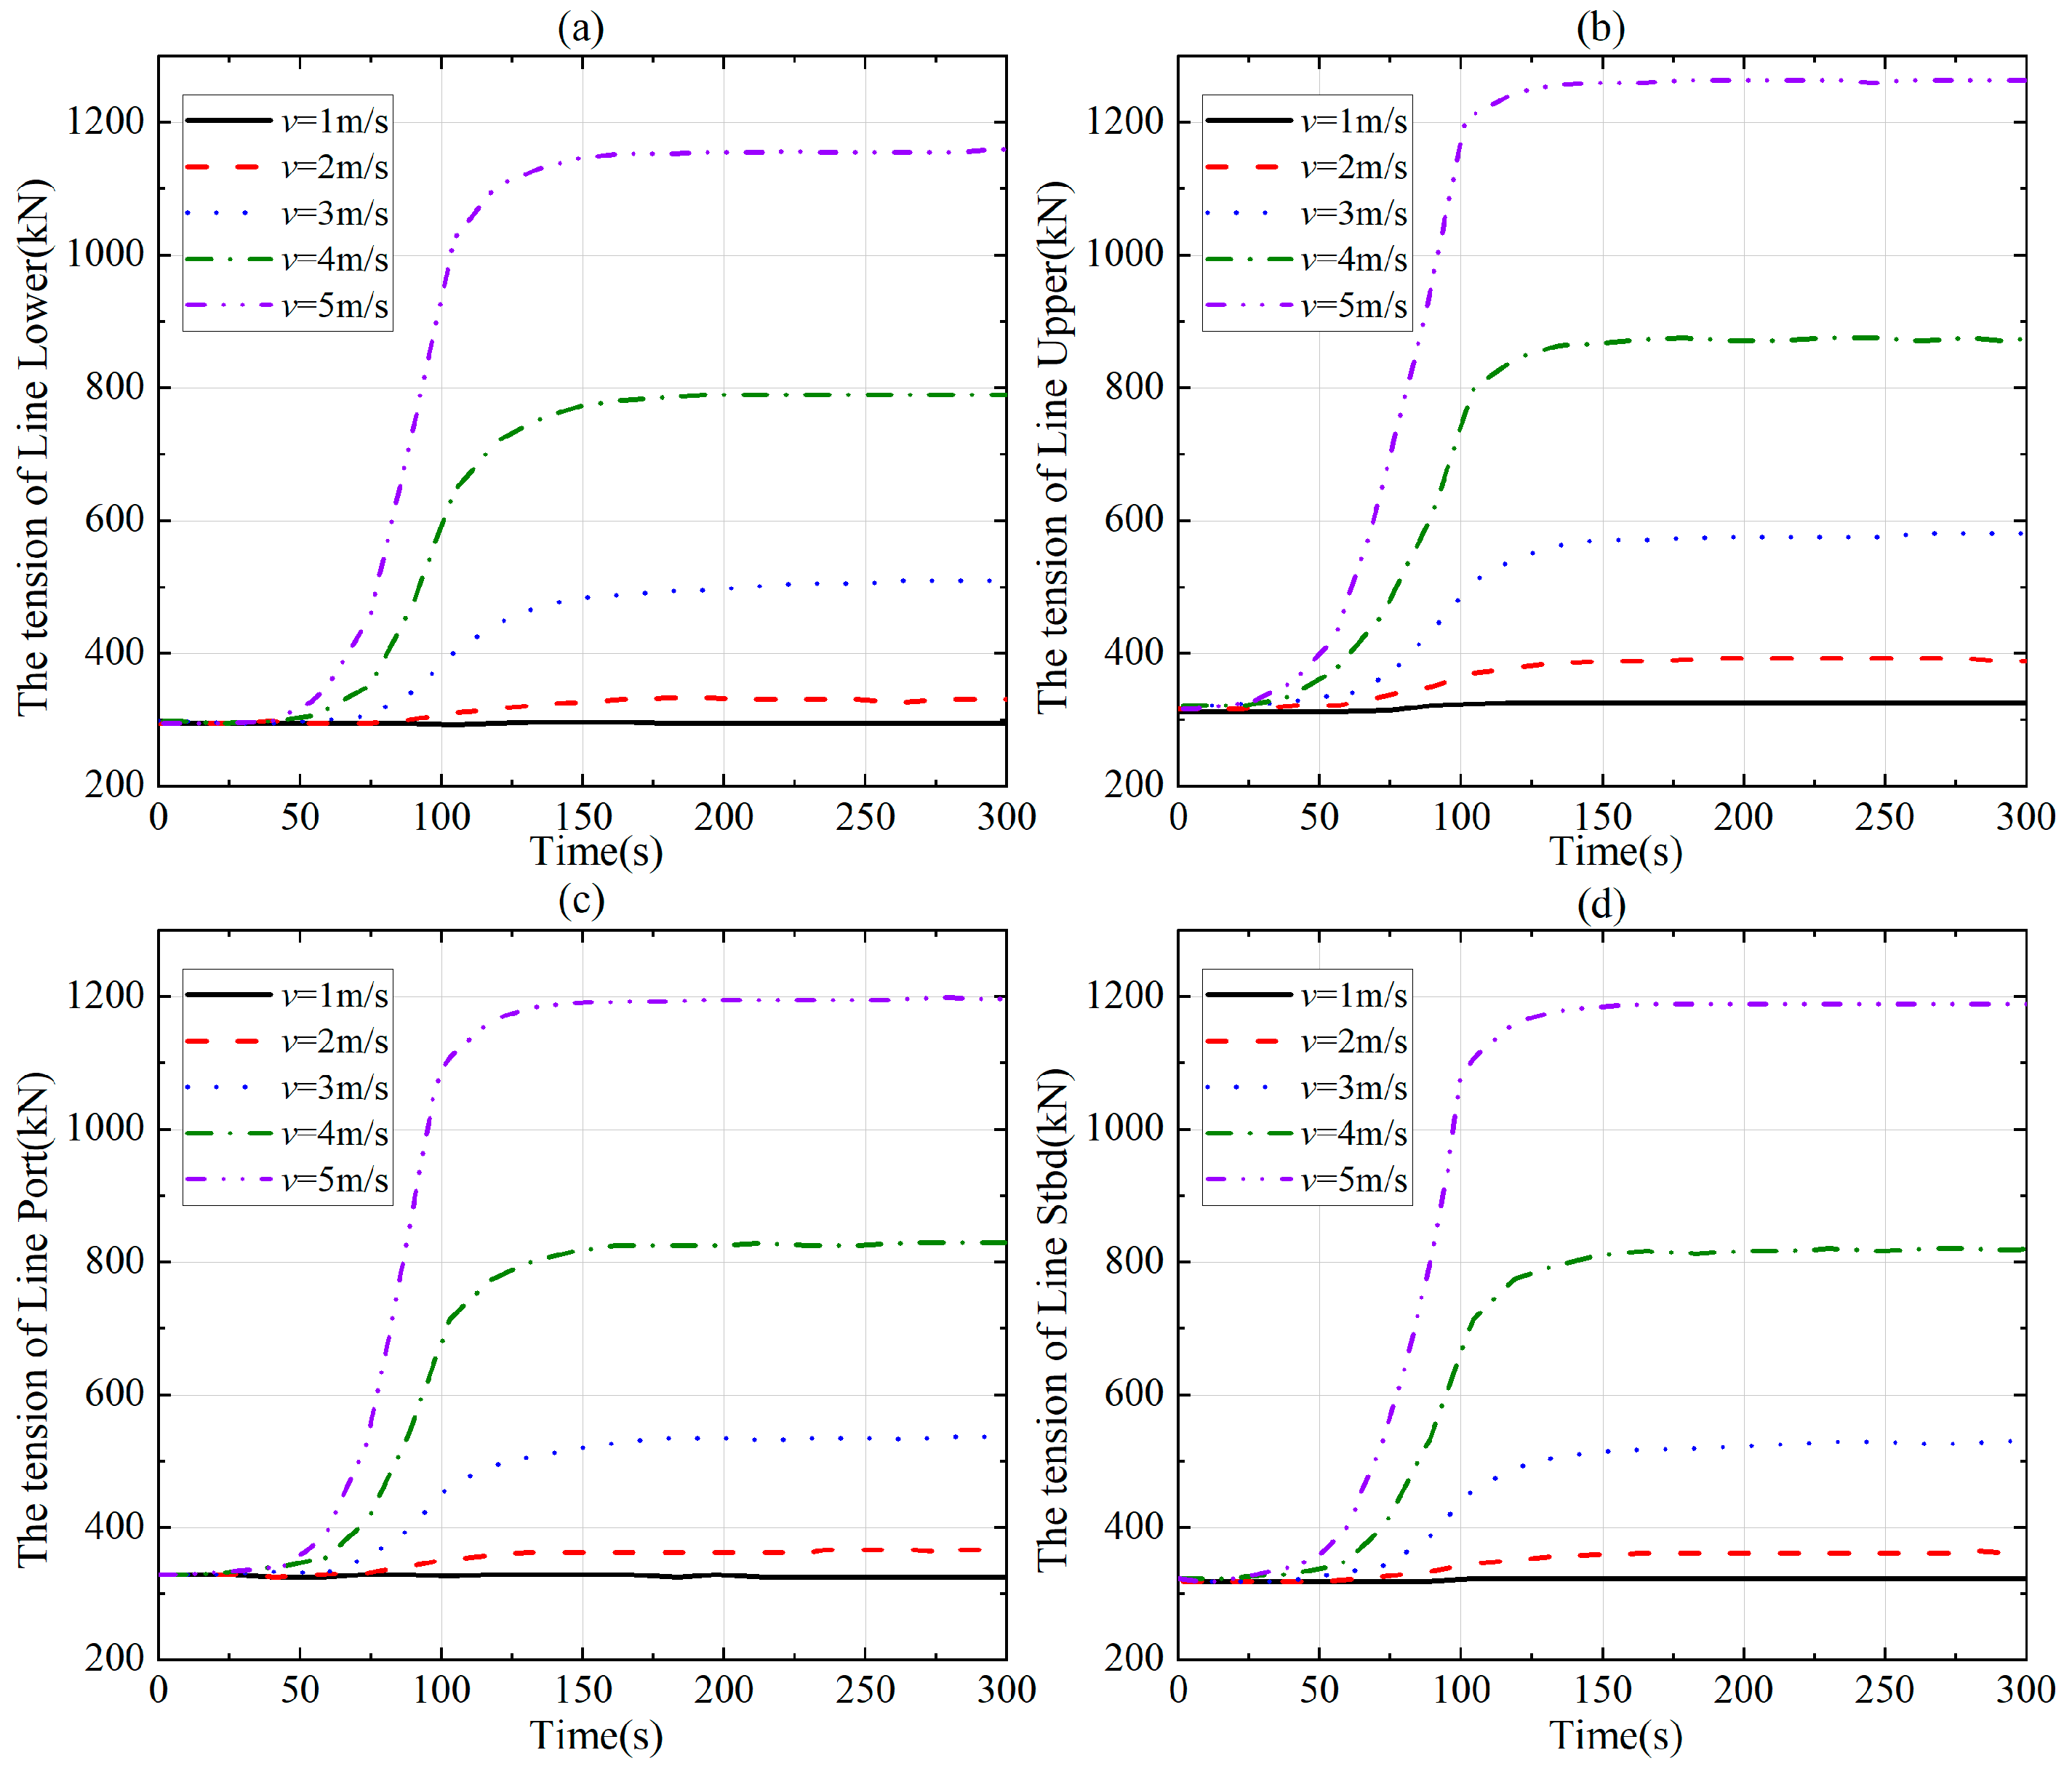
3.1. Effects of the Speeds During Straight-Line Towing

Figure 13 illustrates the variations in tension of the four lines as time progresses and at different speeds. The tug slowly accelerates from the speed of 0 m/s to the set speed, and the acceleration time is set to 100 s. When the tugboat moves at a slow speed, the line tension remains almost constant over time. However, at elevated towing speeds, the tension in the lines increases from a lower baseline to a higher plateau. An increase in the rate of towing leads to a consistent upward trend in the tension experienced by the four lines. With the increment in towing velocity, the instant when the line tension starts to increase significantly in the temporal dimension occurs sooner, and the velocity of tension alteration also rises correspondingly with the increase in towing speed. The line is mostly subjected to stress in this state. The stress causes the line, which is slightly bent, to straighten in the axial direction. As a result, the line exhibits very little bending deformation during straight-line towing. Although the line’s bending distortion is essentially minor due to the line’s inherent bending stiffness, the tension of the line together with this stiffness prevents the trawl from deforming throughout the towing operation. As a result, even if there is very little bending distortion, the bending force still has an impact on the wire. At the point where each line connects to the back of the tugboat, at about 1.5 m, the greatest bending moment occurs.
Figure 14, Figure 15, Figure 16, Figure 17 and Figure 18 analyze how the form of trawl nets changes at various speeds. When pulled in a straight line, the beam trawl does not experience substantial deformation. On the contrary, the inclination change in the beam trawl mainly affects the angle between the trawl and the vertical direction. Once the towing speed of the beam trawl increases and reaches stability, the angle between its angle and the vertical direction gradually expands. On the one hand, the tilt angle of the trawl relative to the vertical direction and the towing speed both increase, thereby expanding the trawl’s effective fishing area. This expansion facilitates the entry of fish into the net as they are pursued. Alternatively, when the towing speed stabilizes and increases, the depth of the entire trawl diminishes steadily. As the trawl reaches a specific velocity, it aligns with the horizontal plane. In such scenarios, fish have a higher chance of evading capture. The orientation change in the trawl nets predominantly occurs within the XZ plane. The key characteristics of a trawl involve steady progression along the X-axis and minimal elevation change along the Z-axis, as well as in the angular motion relative to the vertical Z-axis. Consequently, when the towing vessel moves at a high speed, it is beneficial to herd fish and swiftly direct them into the net to prevent the escape of those already caught. To ensure that the fish already captured do not escape, it is essential to promptly decrease the line length as soon as the fish enter the net.

3.2. Effects of the Speeds Under a Fixed Turning Radius

In most scenarios, the tugboat’s turning radius is set at 57.32 m due to its small-radius turning maneuvers.
Figure 19 illustrates the temporal variation in line tension during rotating towing at a constant turning radius, with the angular velocity ranging from 1°/s to 5°/s. This range is specified by the centripetal acceleration formula a = ω2R. During the turning maneuver, the tension element within the towed line supplies the centripetal force essential for the trawl to execute a turn in sync with the tugboat. At a given instant, should we define the total mass of the towed system as m, the tension force component can be represented by the formula F = 2R. The portion of the line tension responsible for the trawl’s rotation rises sharply in proportion to the square of the angular speed, not in direct proportion to the angular speed itself. With the increase in angular speed, the value of ω2 significantly increases, thereby causing a corresponding rise in the tension within the line. When tension reaches excessive levels, it can ultimately inflict substantial harm on the boundary conditions that sustain the edges of the rigid frame. Under such circumstances, the trawl may completely disintegrate. This research aims to determine the rigid trawl’s maximum allowable angular velocity while maintaining the turning speed at 1 m/s to verify this theory. Upon continuous debugging and calculation, it has been determined that at an angular velocity of 20°/s, the shape of the trawl remains essentially stable due to the square frame, which with its four rigid edges, remains closed and unchanged.
As the angular velocity rises, the square frame begins to experience substantial distortion, with the degree of deformation progressively increasing. When the angular velocity reaches a specific threshold, the deformation of the frame edge attains its maximum permissible extent, rendering the square frame entirely unstable. With an angular velocity of 57.3°/s, the trawl is observed to disintegrate completely, as illustrated in Figure 20.
Figure 21, Figure 22, Figure 23, Figure 24 and Figure 25 illustrate the morphological alterations of the trawl system during rotational towing with a fixed turning radius but varying speeds. The angle between the beam trawl and the vertical axis changes dynamically as the tugboat turns. The trawl exhibits the peculiar behavior of spinning around its central axis while moving outward against the direction of the immediate rotation. This outward movement can occur on either the port or starboard side of the tug and may move toward or away from the stern. The lateral displacement of the trawl is a resultant motion arising from the interplay of multiple forces and movements during the turning maneuver. Exceeding the torsional limit causes an outward drift, leading to the intertwining of the four lines attached to the top of the pulling device and thereby increasing stress on the towed line. During the tug’s return maneuver, the streamer will undergo torsional forces in addition to tension and bending stresses. As the trawl rotates, its spatial orientation changes in a more complex manner. When the tugboat moves in a straight line, the primary change in the trawl’s spatial orientation is the variation in the angle between the trawl and the vertical axis. These changes are shown within the two-dimensional x-z plane of the global coordinate system. Meanwhile, the trawl’s lateral displacement as the tugboat turns occurs within the three-dimensional coordinate framework. Additionally, the trawl’s rotation around its central axis must be tracked along the vertical axis. Therefore, the change in trawl orientation during the tug’s turning maneuver occurs in three-dimensional space. Conversely, when the tug is moving in a straight line, the trawl possesses two translational degrees of freedom and a single rotational degree of freedom. Nevertheless, when the tugboat performs turning maneuvers, the trawl exhibits three degrees of freedom in translation and two axes of rotation.
In addition, when the turning radius is fixed, the trawl’s total lateral displacement expands incrementally as the towing speed rises. The load on the four lines varies proportionally with the increase in lateral displacement. Initially, there is a steep rise in the tension of the lines during the turning phase, succeeded by oscillations that occur in a cyclical pattern over time. In contrast, the tension levels off during linear towing operations. Assuming a fixed turning radius, a rise in angular velocity results in a more rapid alteration in the turning angle across the horizontal plane, consequently prompting an expansion in the lateral displacement of the trawl. To put it another way, as the tugboat turns at varying angular speeds, the tension in the rope and the floating distance of the trawl increase with the angular speed. Thanks to the cyclical pattern of turning, there are recurring variations in both the trawl’s outward drift and the line’s tension. With an escalation in the tugboat’s angular velocity, the duration of these periodic changes shortens.

3.3. Effects of the Speeds Under Fixed Angular Velocity

The effects of different speeds are further studied while maintaining the tugboat’s angular velocity at a constant 1°/s. The emphasis of this section is on examining the impact of the turning radius on the dynamic characteristics of the trawl. The time-domain image of the four tensioned wires in a revolving tow at a constant angular velocity is depicted in Figure 26. It is found that the towing speed is the most important element impacting the rise in line tension. Therefore, assuming that the trawl’s floating distance diminishes, the line strain will continue to rise as the towing speed rises. Since the angular velocity in this case is very low, it is difficult to see how the tension will fluctuate over time under different towing speeds at this point. Instead, it tends to become stable as towing speed increases.
Under these conditions, fluctuations in tension over time are less significant than those observed with a constant radius of rotation. This difference stems from the formula for centripetal acceleration, which is a = ω2R. Maintaining a constant turning radius reveals that the tension component responsible for supplying centripetal force is linearly associated with the radius. Furthermore, when the angular velocity during the turn is constant, this tension component is proportional to the square of the angular velocity. The overall disparity in line tension variation between the two scenarios arises from the distinct variation patterns of this tension component across the two conditions. The computed outcomes for the two turning conditions indicate that the four lines will distinctly experience curvature as they are towed in a rotational manner, which contrasts sharply with the relatively slight bending deformation of the wires when being towed in a straight path. Throughout the turning operation, the towing speed, the floating distance of the trawl, and the angular velocity all increase, leading to a rise in line tension. Among the various factors, the rise in angular velocity notably influences both the lateral displacement and the shape alteration in the trawl, as previously indicated. The elevation of the mesh opening fluctuates in accordance with the towing operations, whereas the breadth stays unaltered owing to the rigidity of the frame edges under typical line tension conditions.
Figure 27, Figure 28, Figure 29, Figure 30 and Figure 31 depict the form variations in a trawl in rotating towing at various speeds while maintaining a constant angular velocity. Under a steady angular velocity, the increase in towing speed is predominantly influenced by adjustments to the turning radius. In this particular case, as the speed of towing escalates, it is anticipated that the turning radius will also increase accordingly. However, contrary to this expectation, an increase in the turning radius is observed to reduce the trawl’s floating distance. This unexpected outcome can be rationalized via the following explanation: while the principal factor driving the speed increase in this scenario is indeed the lengthening of the turning arc during navigation, the tug’s unit of horizontal movement leads to an alteration in the tug’s directional angle in the horizontal plane due to the enlarged turning circle.

3.4. Dynamic Response of Line Fracture Failure in Startup Phase

This section, along with Section 3.5, simulates the breaking behavior of the lines in the startup phase and under a condition of constant straight-line towing speed. The line fracture scenarios are based on real-world abrupt events during trawling operations, such as seabed obstruction collisions, human operational errors, and equipment degradation. Towlines may snap instantaneously due to impacts with rocky seabed obstructions or shipwrecks, typically accompanied by localized shock loads (e.g., 50~80% peak tension surge). Human operational errors include overspeed towing, winch control failures, or emergency braking overloads. For example, sudden evasive maneuvers to avoid other vessels may cause unilateral cable overload and rupture. In addition, long-term corrosion, fatigue, or joint wear also forms weak points, leading to fractures under routine towing.
The dynamic response of line fracture failure is investigated across two distinct stages. The startup phase is defined as the period when the tugboat is on the verge of moving but has not yet begun to move. In the study of line fracture failure, the stage line breaks at the beginning of modeling. No matter how many lines there are, the moment of fracture is the same. When the tugboat travels at high speeds, the breakage of the towed line has the most serious impact on the safety of the trawl system. The tugboat’s speed typically ranges from above 4 kn to a maximum of 6 kn, but it does not exceed 5 m/s. Therefore, in the simulation of straight-line towing, the towing speed is 5 m/s. The behavior of line fracture failure includes one line of breakage, two lines of breakage and three of lines breakage, respectively.
Figure 32, Figure 33, Figure 34, Figure 35 and Figure 36 illustrate the alterations in the trawl’s shape in the case of the fracture failure of one line. The alterations in the trawl’s shape in the case of the fracture failure of two symmetrical and asymmetrical lines are shown in Figure 36 and Figure 37 and Figure 38, Figure 39, Figure 40 and Figure 41, respectively. Figure 42 illustrates the morphological transformations of the trawl during the event of the fracture failure of three lines. It can be found that under the premise of one-line failure in the startup stage, no matter which lines fail, the tensile effect of the line is lost, and the towing box begins to deform rapidly. This kind of trawl has a certain tensile stiffness and bending stiffness itself and can maintain the trawl shape under the combined stiffness of the line and the frame. The trawl begins to internally collapse into a flat form after a line breaks and loses tension, at which point it collapses. Therefore, with this stiff trawl system, even a single line failure can have a catastrophic impact on how well the entire trawl system works. While the fracture of the trawling net after the tugboat has run at high speed offers a higher hazard to the safety of the employees at the stern, failure at this point poses very little risk to the staff at the stern.
By studying the alterations in the trawl’s shape following the failure of two symmetrical lines during the startup stage, it is discovered that following the failure of two symmetrical lines, the trawl begins to quickly collapse from both sides to the interior, eventually collapsing into a flat shape. In contrast to the distortion of the trawl when one line breaks, the flat trawl after final deformation in this case is symmetrical. Because the boundary restrictions that keep the trawl stable when one line breaks are no longer symmetrical, this event occurs. As a result, the ultimate deformation in this instance is likewise asymmetrical. Even if the boundary constraints that preserve the trawl form have been altered because of the failure and fracture of two symmetrical lines, the new boundary restrictions are still symmetrical. Consequently, in this instance, the trawl is symmetrical and flat after final deformation.
By analyzing the shape changes in the trawl following the failure of two asymmetrical lines during the startup stage, it is discovered that, while the trawl’s net clothing has been distorted, the square frame constructed from four rigid edges has not been altered. In contrast, the square frame made of four hard edges is distorted upon the failure of one line or two symmetrical lines. The two damaged lines act on both ends of the same stiff frame edge; therefore, no deformation load is applied to the other three frame edges, and the square frame does not deform in the end. The entire square frame rotates slightly around the rigid frame connected by the remaining two wires due to gravity, and the mesh is compressed during the sweeping and rotation processes. The square frame will not alter after it has reached a specific inclination and posture, since the net garments, which have some ability to resist deformation as well, will support it once it has been compressed to a given level. To put it another way, the form of the square frame made up of four hard frame edges will likewise alter once two lines distributed symmetrically and one line break, and the entire trawl will be forced into a flat shape. The entire trawl will be compressed when the two asymmetrical lines are severed; however, at this point, the trawl is not compressed into a flat form, and the square frame, which is made up of four inflexible frame edges, will not alter in shape. There are several permutations of fracture failure mechanisms for two asymmetrical lines, but when they totally sink into the water, the overall line and the overall square frame differ in the direction of the x-z plane corner and the y-z plane corner.
The trawl swiftly starts to collapse inward when the three wires break, and the square frame also deforms quickly. This can be seen by watching how the trawl changes shape. The trawl is ultimately not compressed into a flat shape because in this scenario, the boundary constraints to maintain the trawl’s stability become asymmetric, and when the only line is intact, the final towing point of the initial square frame is subject to the bending effect of the unbroken streamer on the frame edge, causing the square frame that was initially in the plane to become a spatial quadrilateral. Therefore, the trawl will not entirely flatten out under the support of the spatial quadrilateral.

3.5. Dynamic Response of Line Fracture Failure During Straight-Line Towing

Figure 43 and Figure 44 depict the trawl shape variations caused by the fracture failure of Line Lower and Line Upper during straight-line towing, respectively. The trawl’s form alterations during straight-line towing are vastly different from those seen during the startup phase. During straight-line towing, the fracture of one line results in a lack of restraints to maintain the rigid frame’s edge center. The period between the start of the trawl’s deformation and its total collapse into a flat shape significantly decreases because of the high-speed direct navigation movement of the tug, which also changes the degree of restriction and restraint ability of the remaining three lines to the deformation of the rigid frame edge. Due to the tug’s towing action, when the entire trawl becomes level after stabilization, it will also have a slight inclination in the vertical direction.
Although the rigid trawl frame is defined with infinite stiffness in simulations, under extreme cable fracture scenarios, the asymmetric load distribution from the remaining cables may induce local elastic deformations due to external bending moments. For instance, single-cable failure (e.g., Line Lower) creates a moment around the opposite frame edge, with the deformation magnitude Δ estimated as follows:
Δ = F · L 3 3 E e q I
where F is the resultant force from the remaining cables, L is the frame edge length, Eeq is the equivalent elastic modulus (accounting for weld joints and material nonlinearity), and I is the moment of inertia.
Some simulation results reveal that for single-cable fracture during straight-line towing, maximum edge displacement reaches 0.8–1.2 m (5~7% deformation ratio), reducing the effective fishing area by 15–20%. For asymmetric dual-cable fracture, frame distortion forms a spatial quadrilateral with diagonal stretch differences of 2.5–3.5 m, increasing the net overlap and entanglement risks.
It can be predicted that if one line breaks, the tension on the other lines will be redistributed. If the total drag force borne by the lines remains unchanged, the tension borne by the remaining lines will increase after stabilization due to the loss of the traction of one line. The entire area of the trawl will decrease when a line breaks, which will also result in a reduction in the amount of drag that is applied to the trawl. The tension of the remaining lines might alter because of the decreased number of lines, with some lines seeing an increase in tension and others experiencing a drop. The results of the tension calculation in Figure 45 demonstrate the accuracy of this reasoning. The tension of the Line Upper remains essentially intact when the Line Lower breaks, whereas the tension of the Line Port and Line Stbd decreases.

4. Conclusions

Using computational techniques, this research investigates how towing speeds impact the dynamic performance of beam trawl systems during both straight-line and rotational movements. Additionally, it assesses the system’s dynamic response concerning line failure at the onset of towing. The findings of this research are outlined as follows:
(1)
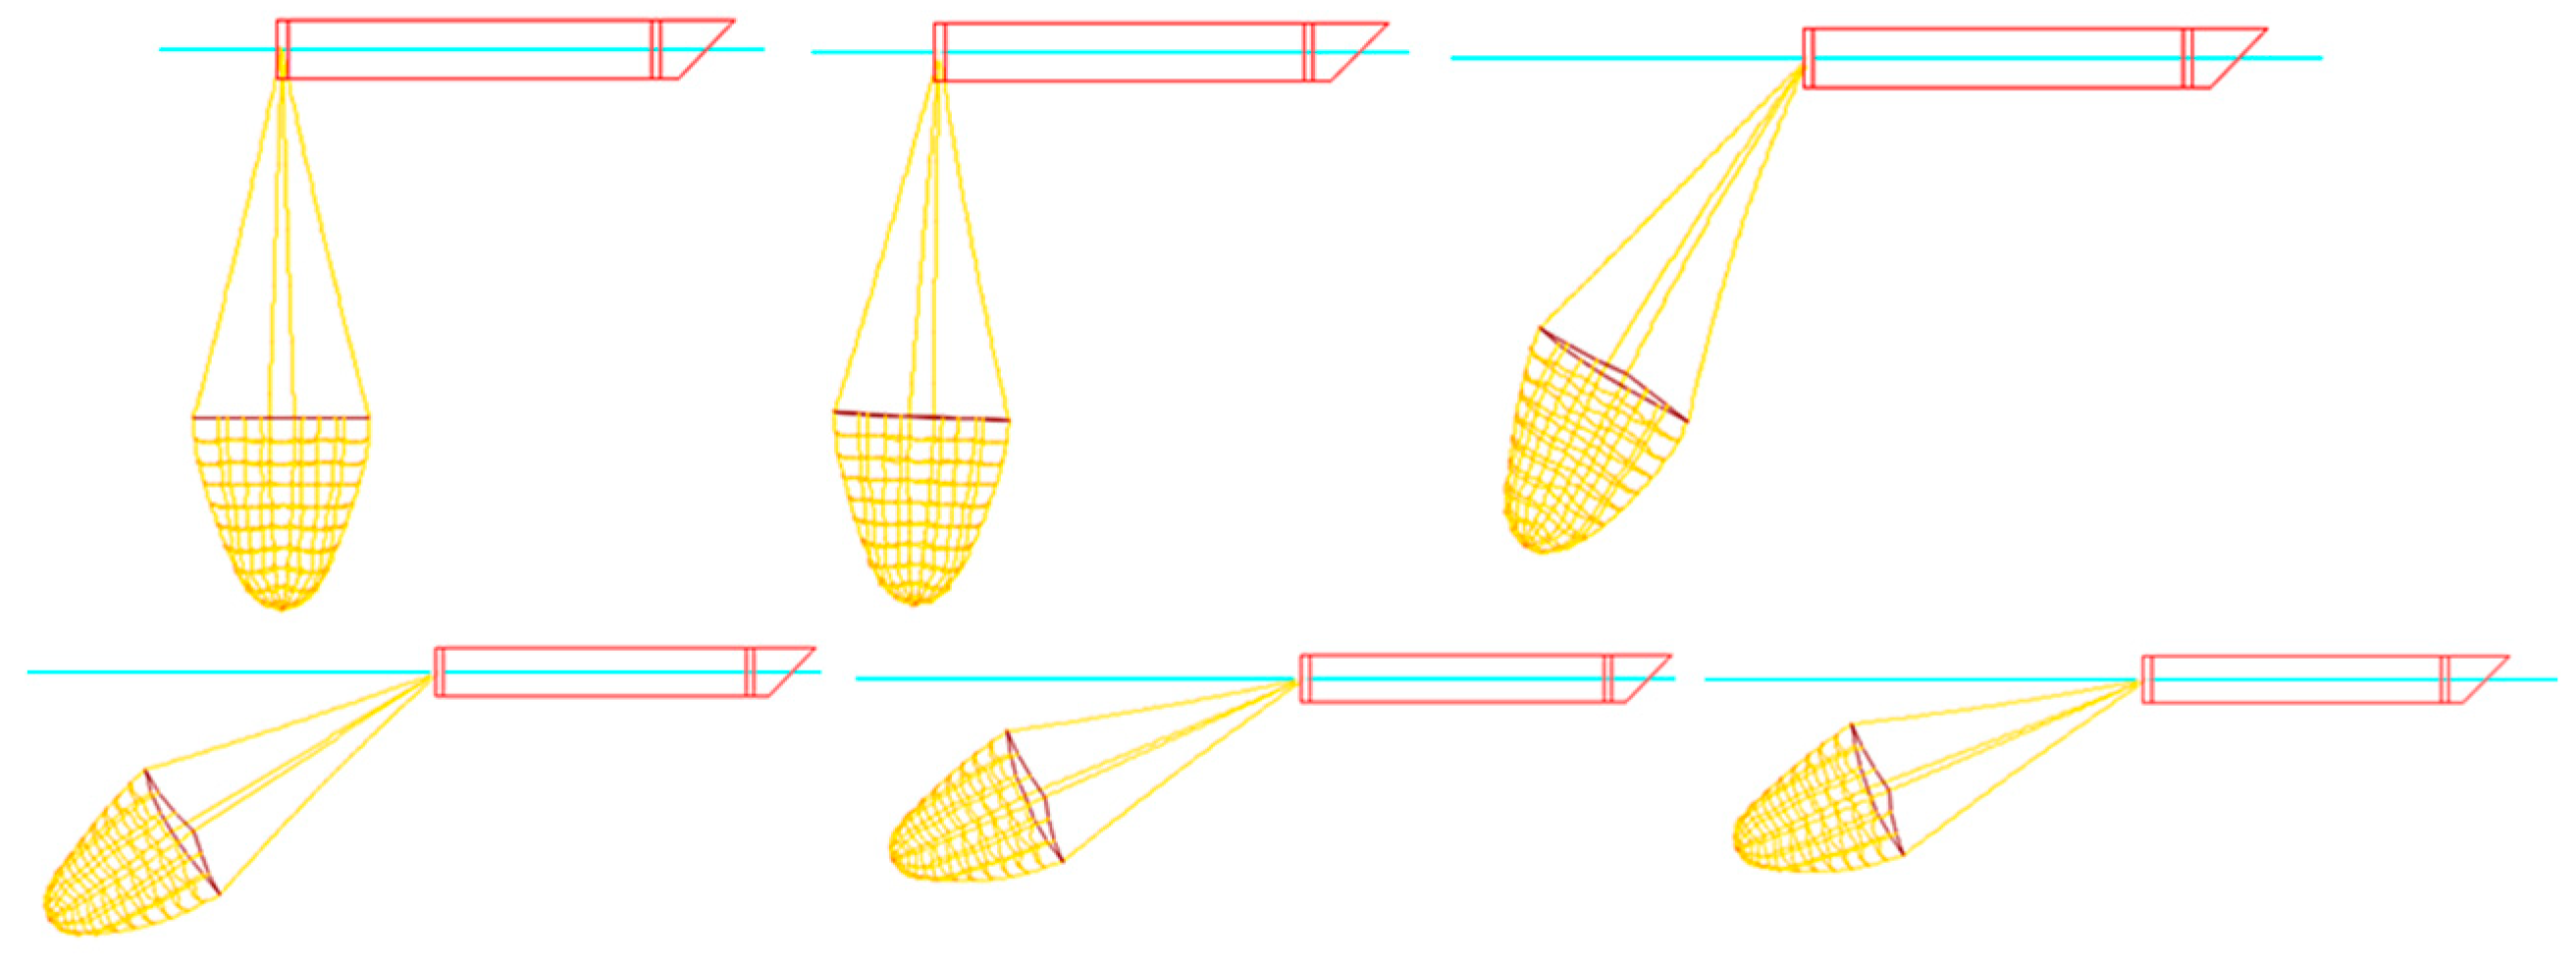
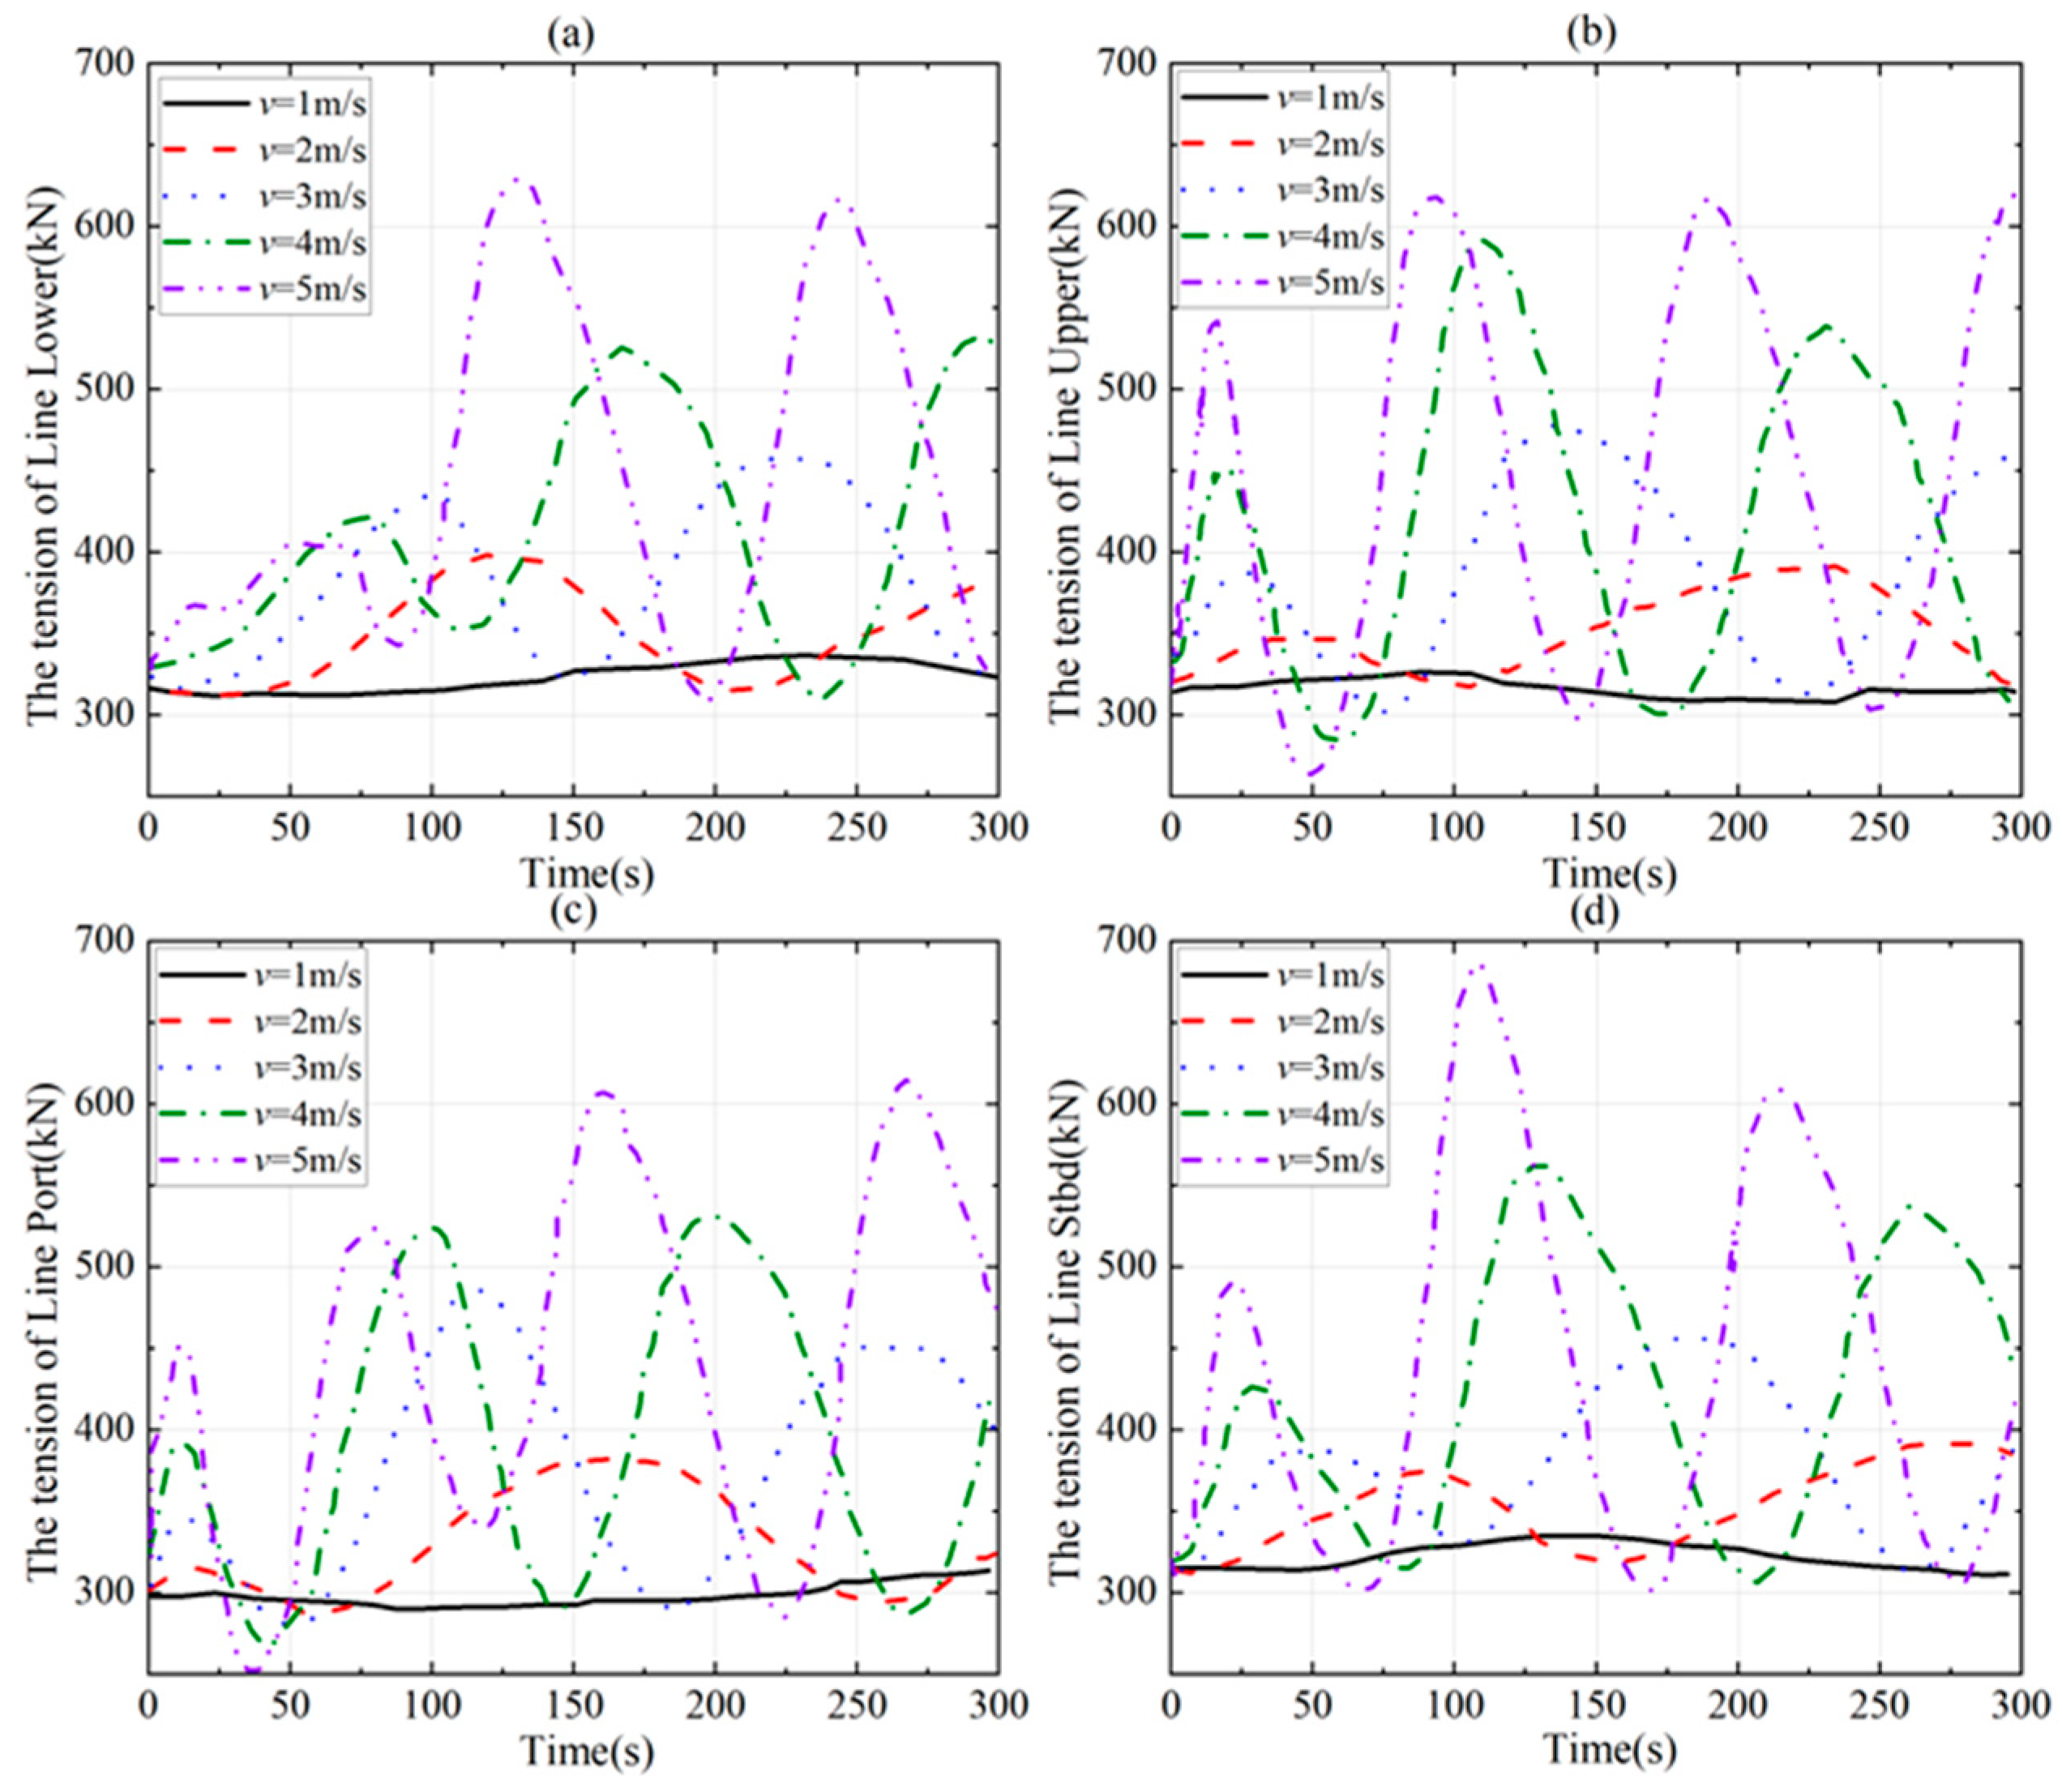
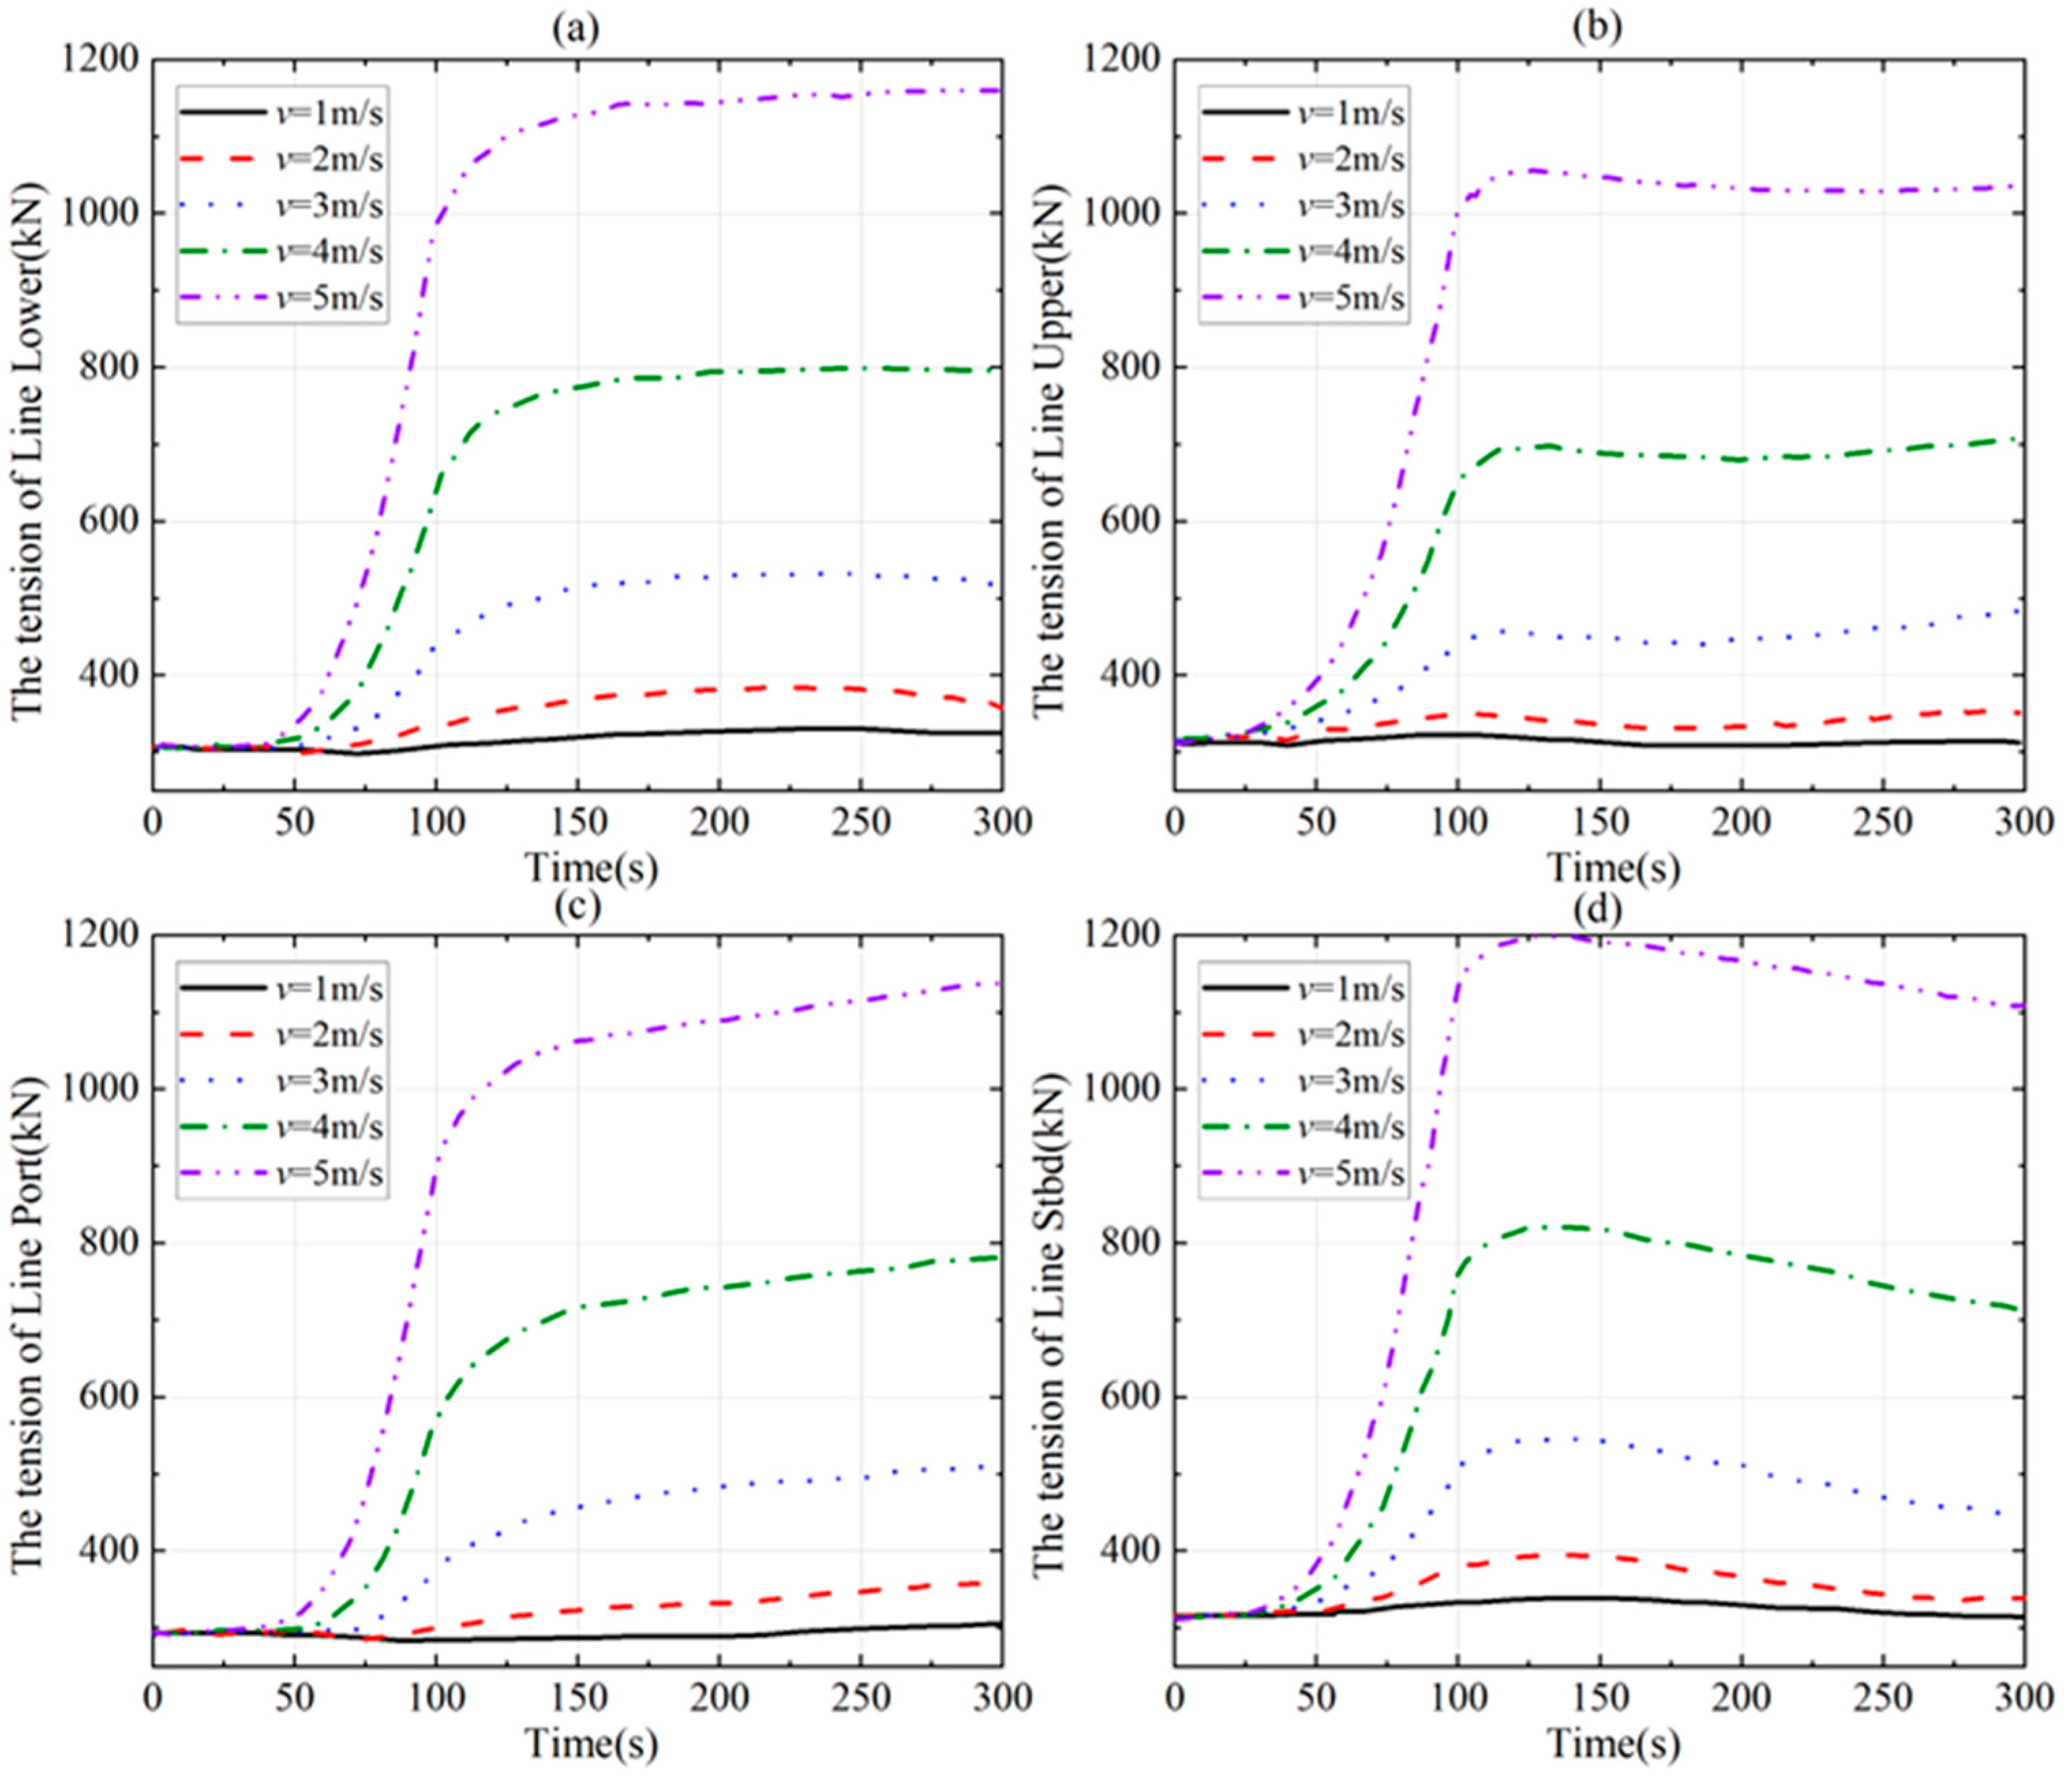
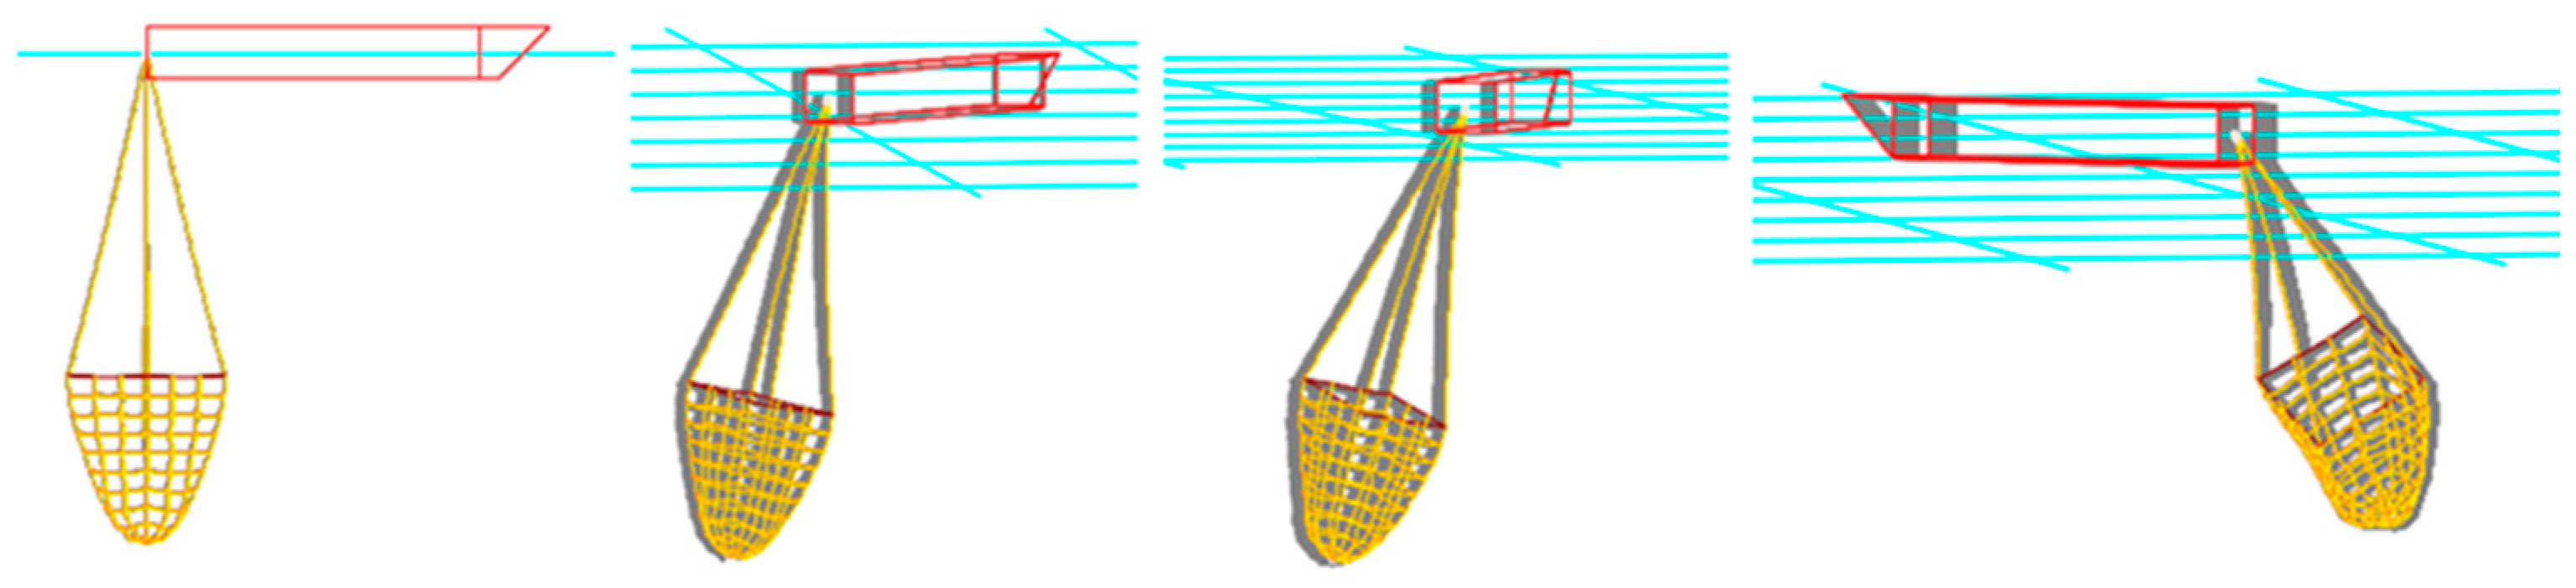
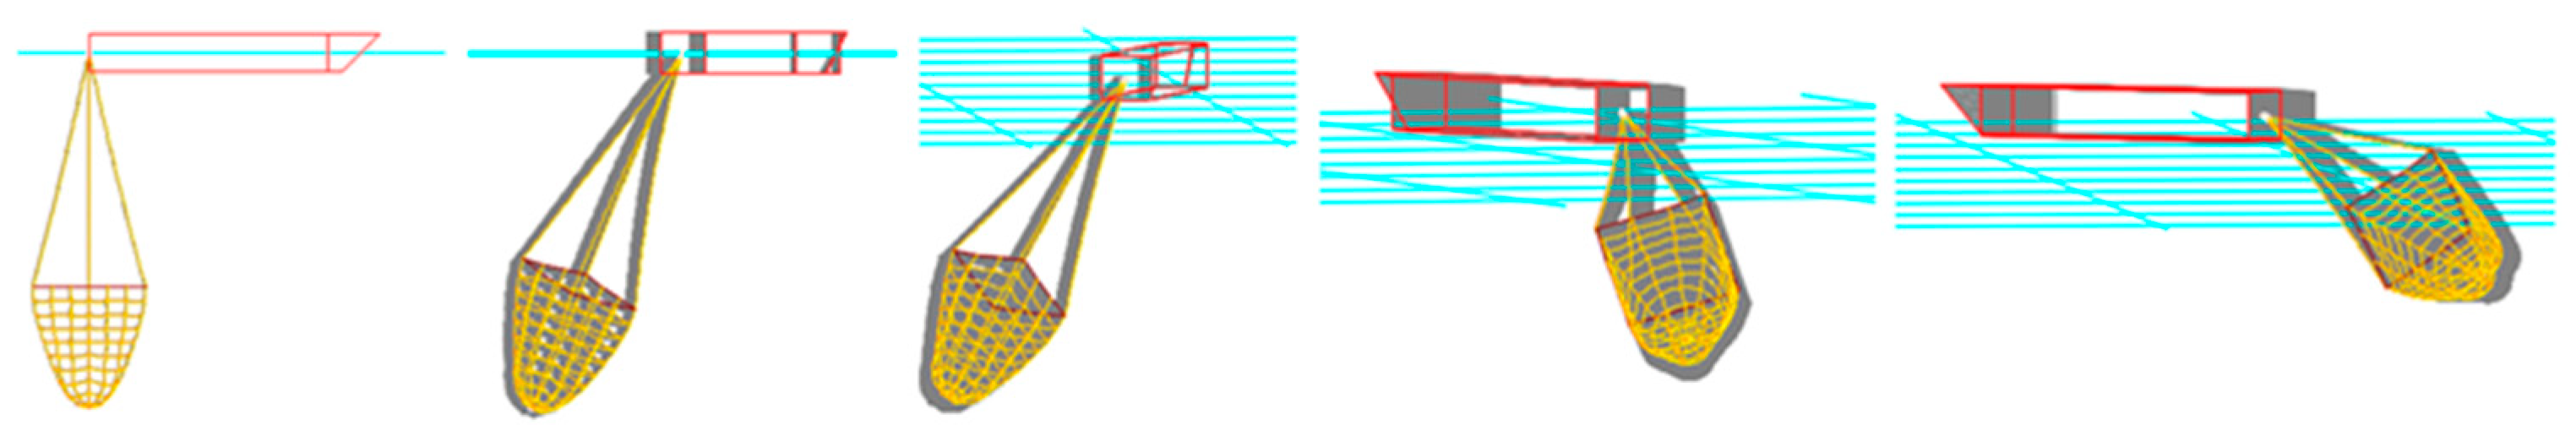
As the linear towing speed increases, so does the line tension. This increased tension causes the line to stretch along its length, leading to minimal bending deformation during straight-line towing. Thanks to its strong truss structure, changes in towing speed have little impact on the trawl’s shape. At a towing speed of 5 m/s, the maximum axial tension in the four cables reaches 1280 kN (Line Upper). Under a fixed turning radius (57.32 m), angular velocities exceeding 20°/s induce centrifugal overload, driving line tensions to exceed 1200 kN;
(2)
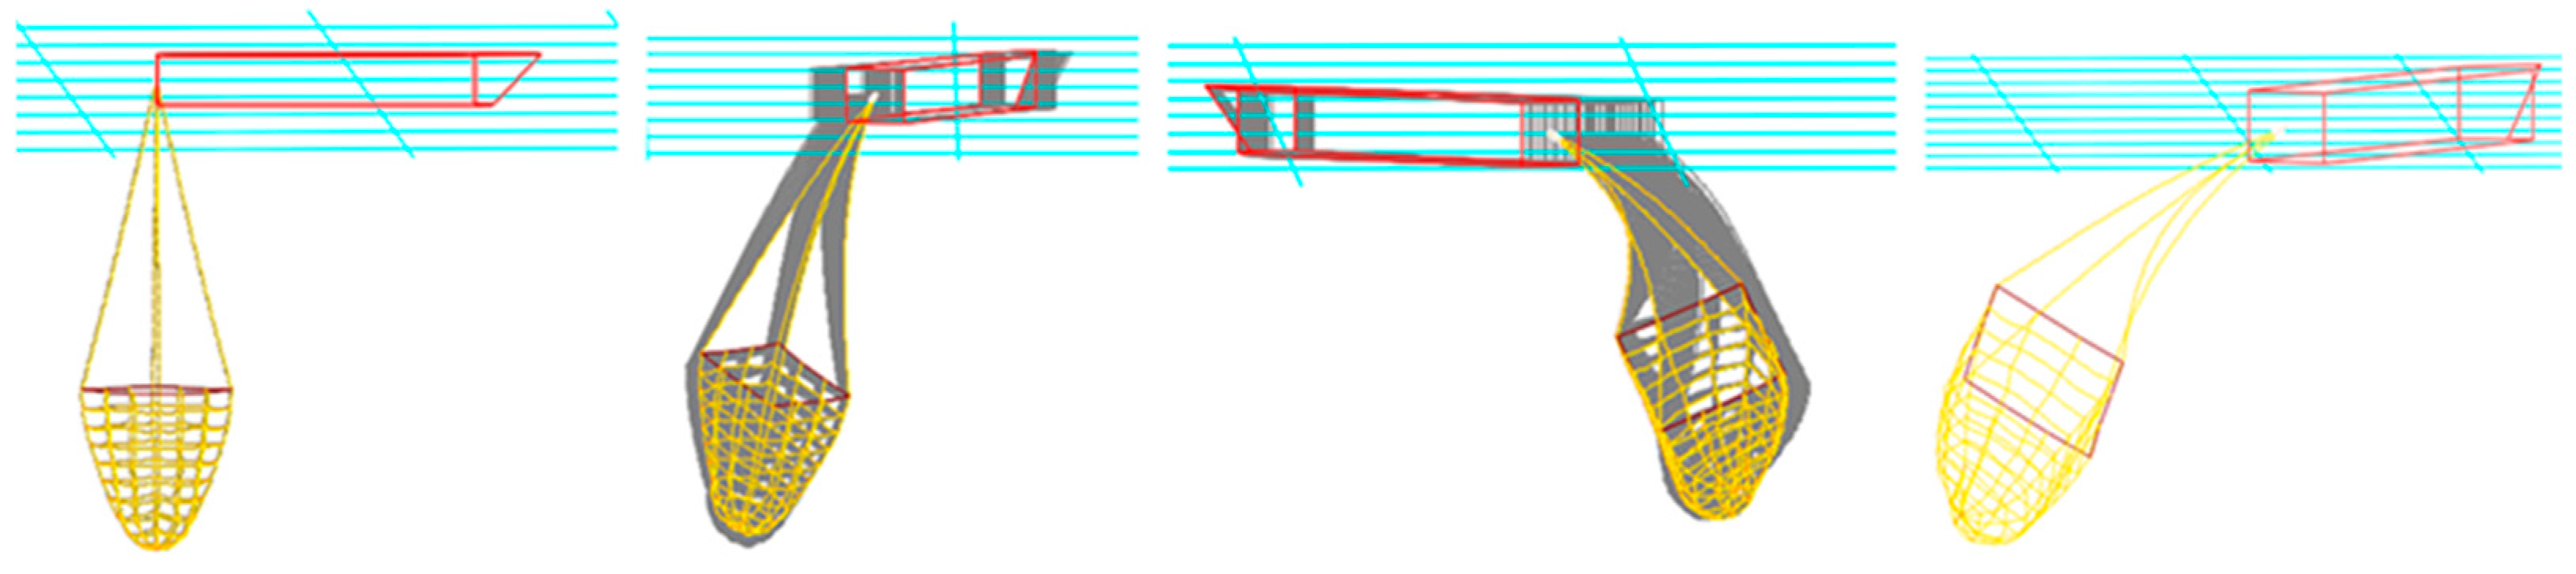
During the initial phase of rotational towing, the line tension experiences significant changes, followed by frequent fluctuations over time. As the towing speed increases, the trawl’s overall horizontal floating distance progressively expands. Concurrently, the rate of change in the horizontal turning angle escalates, which in turn amplifies the trawl’s outward floating distance;
(3)
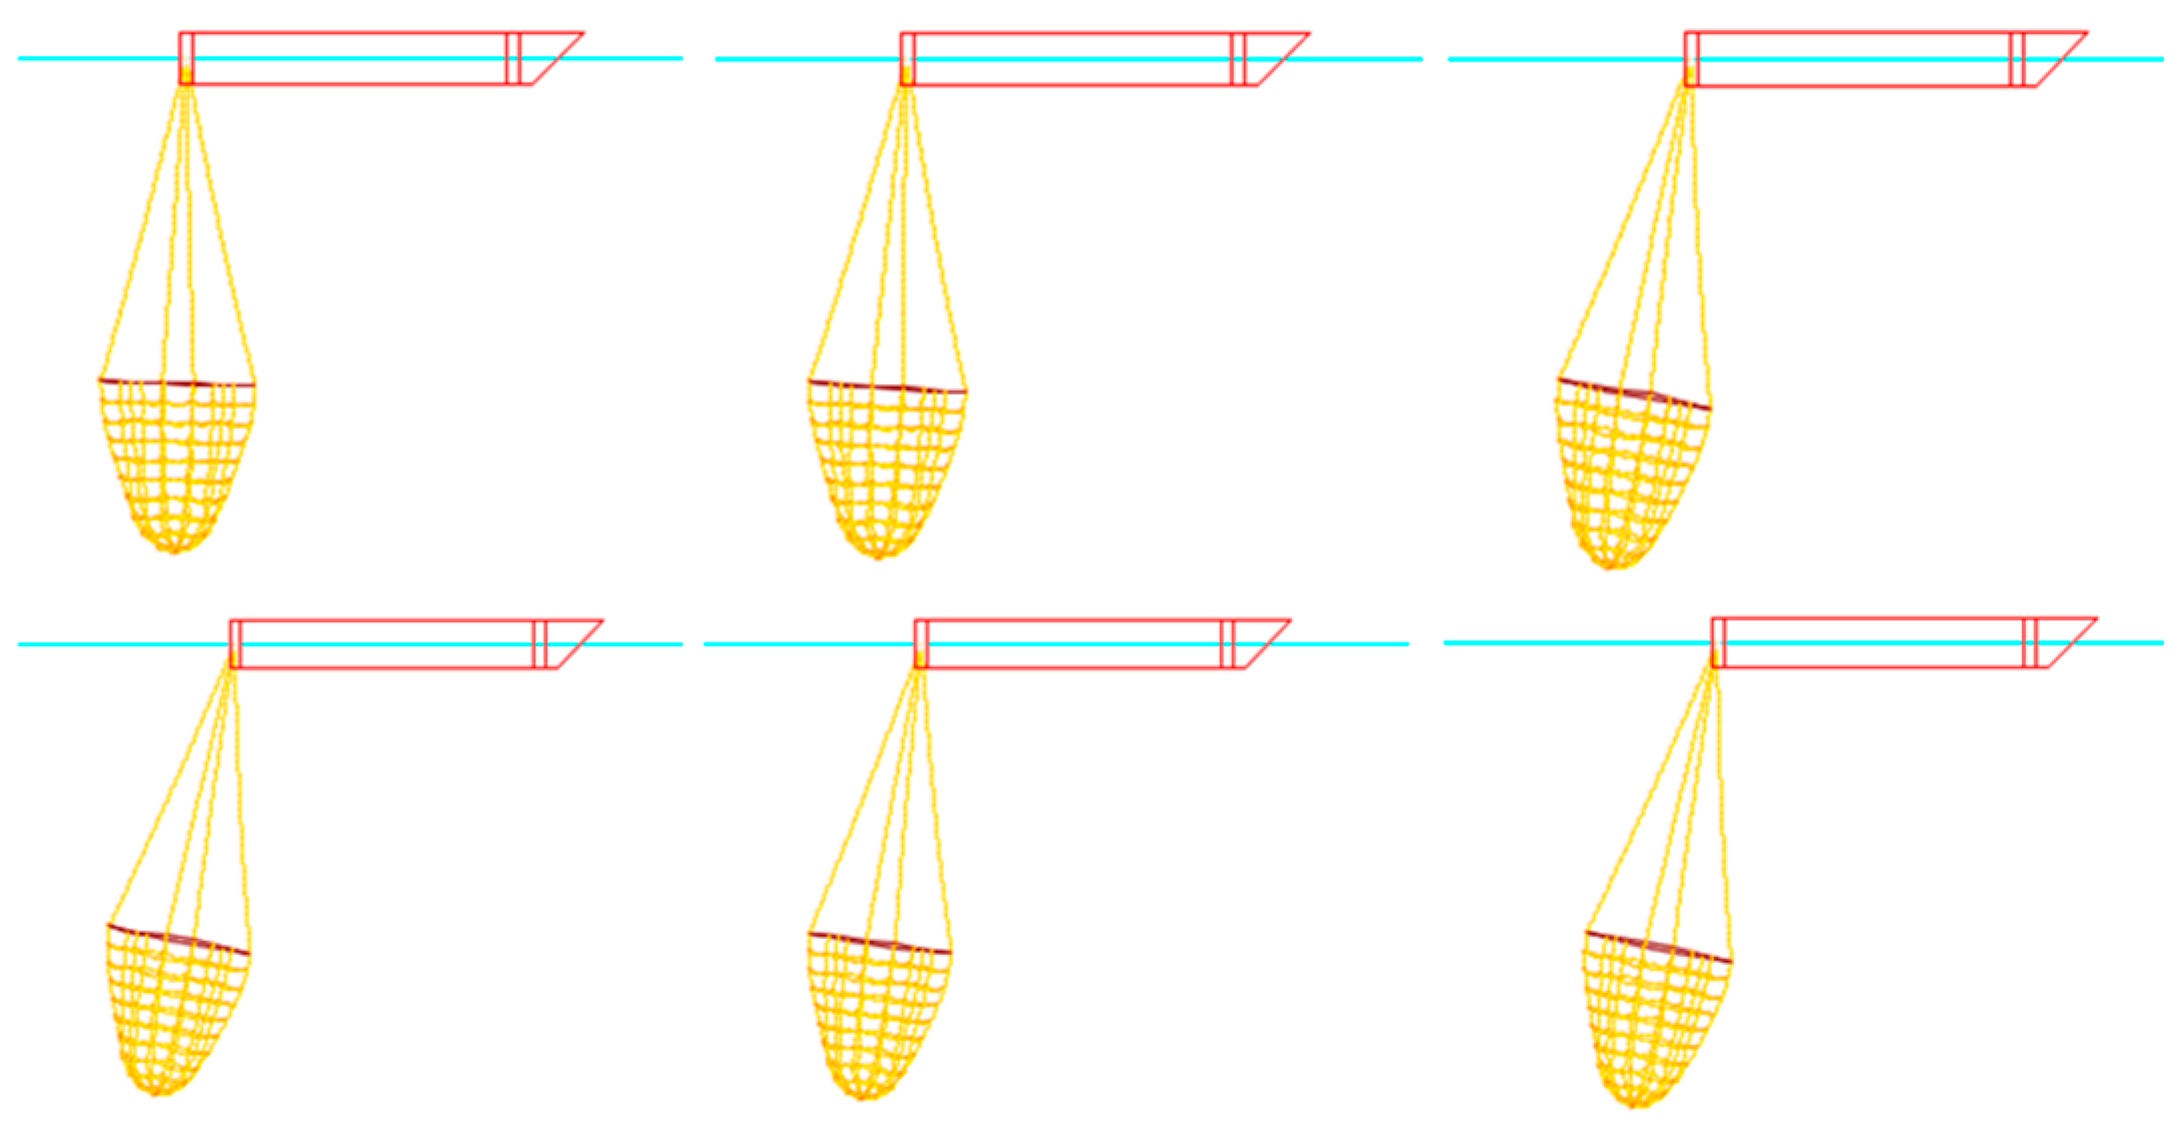
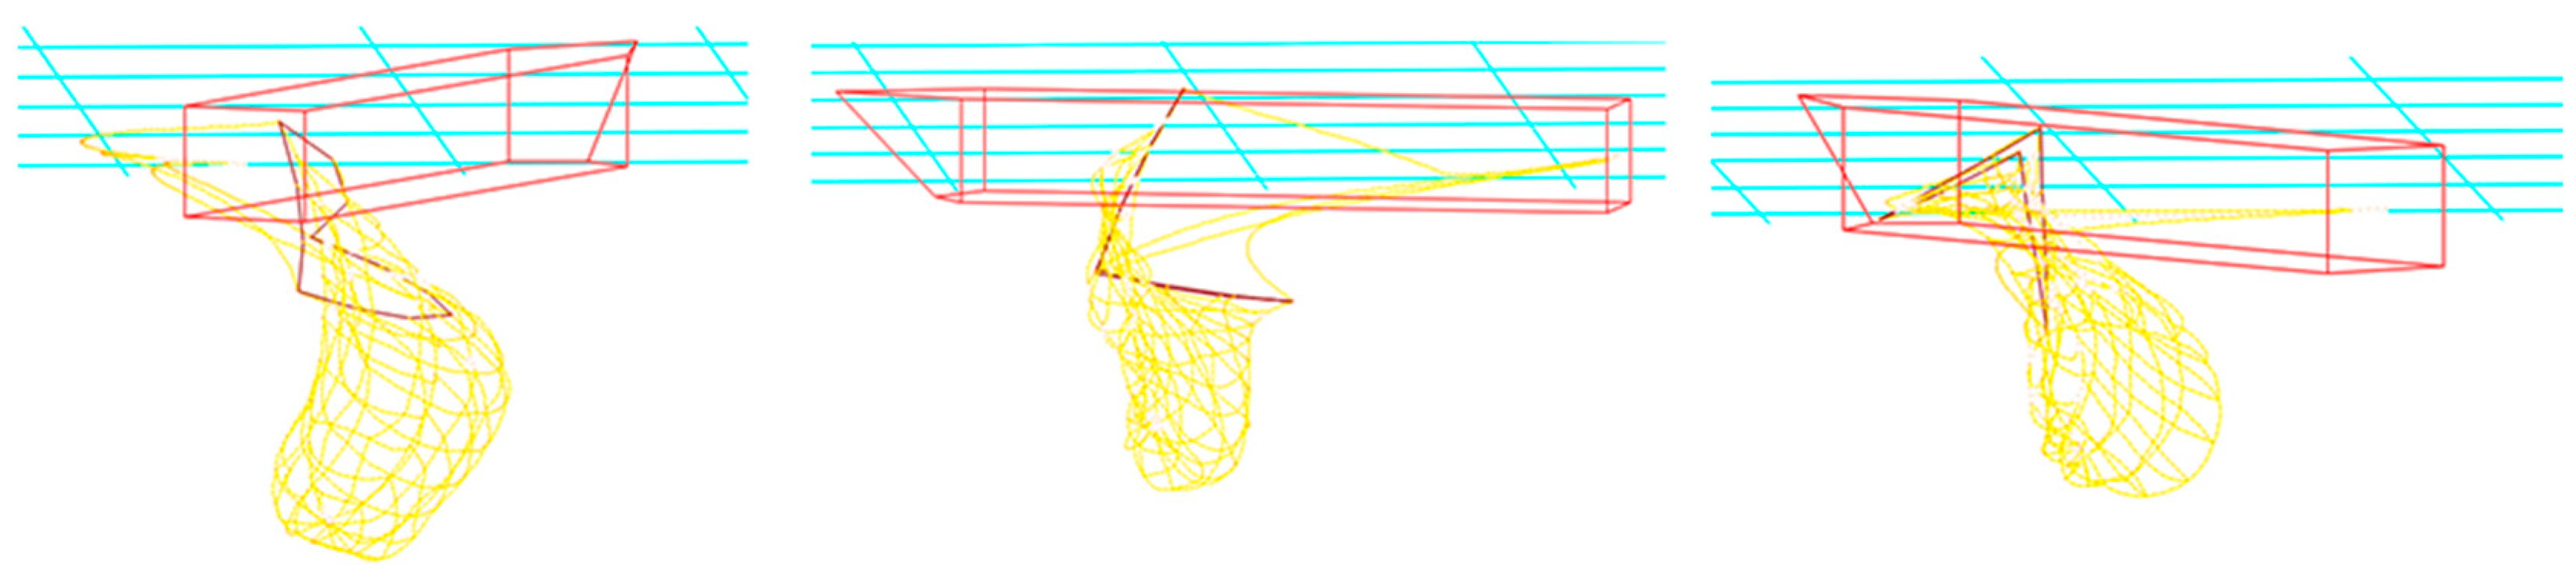
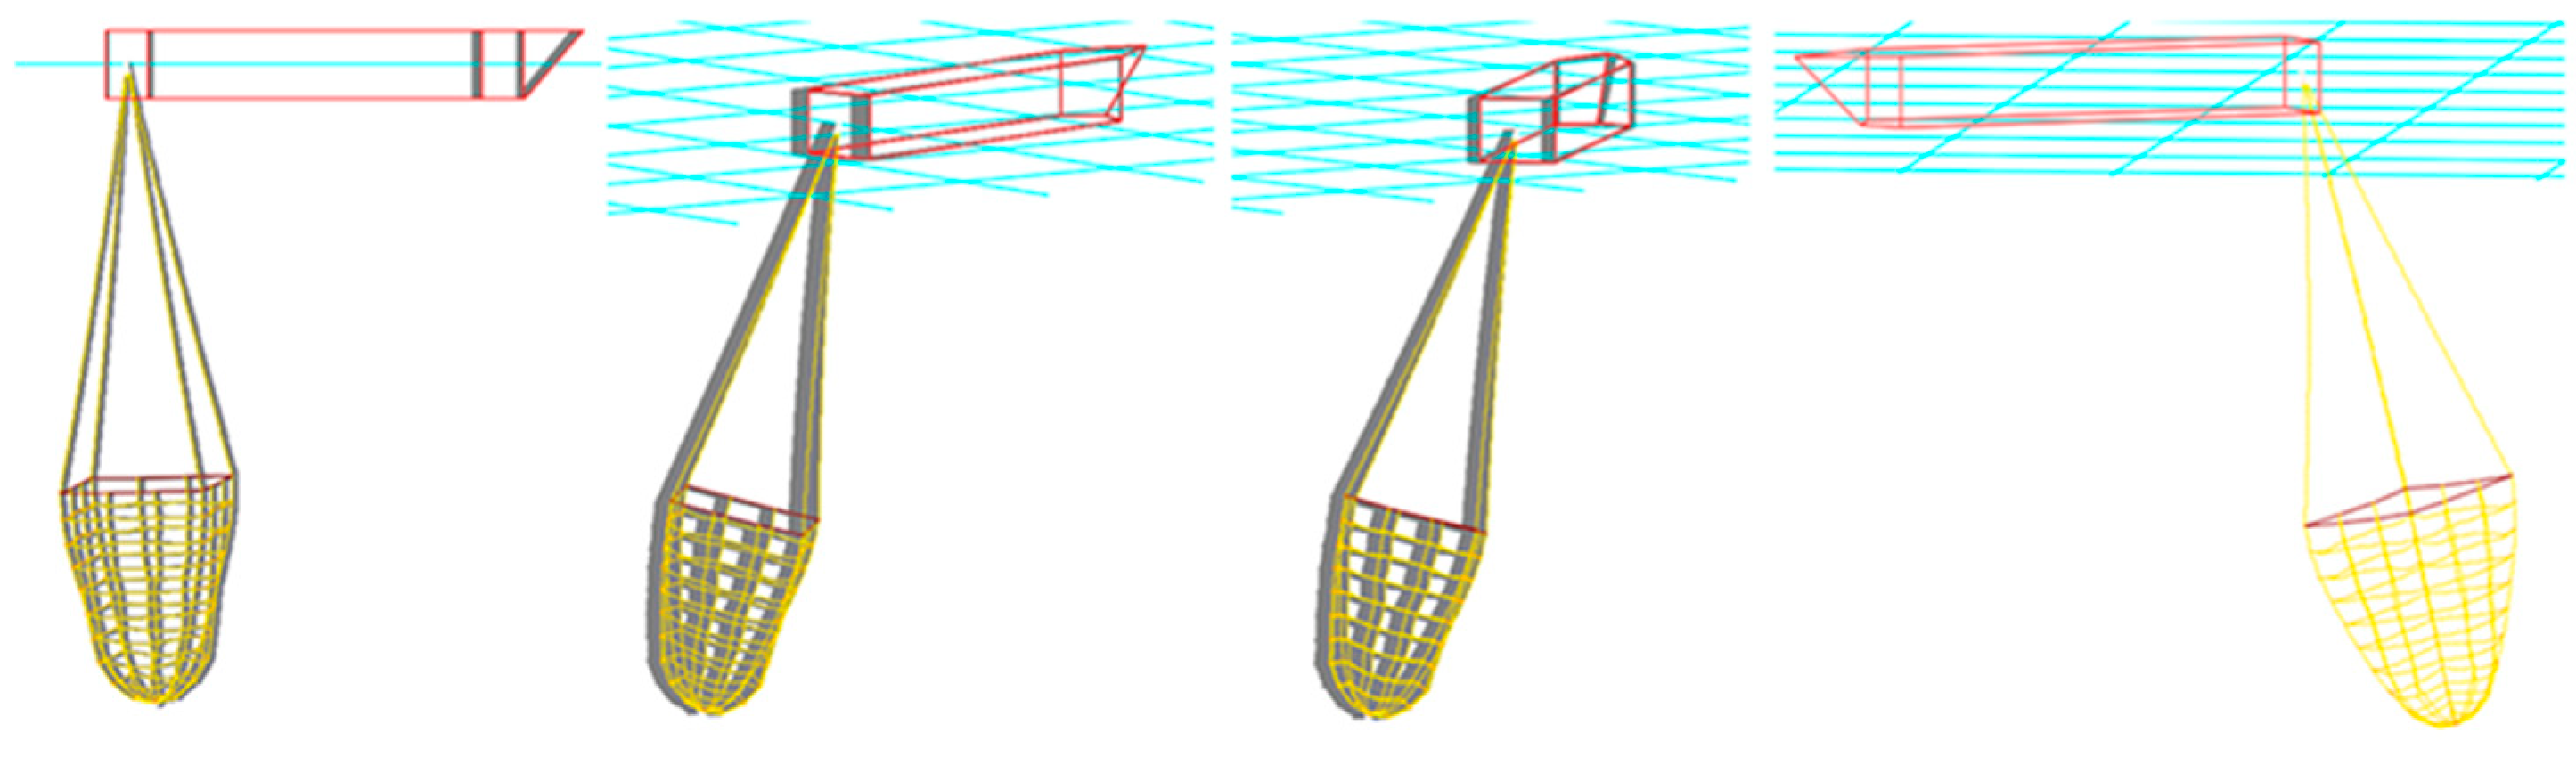
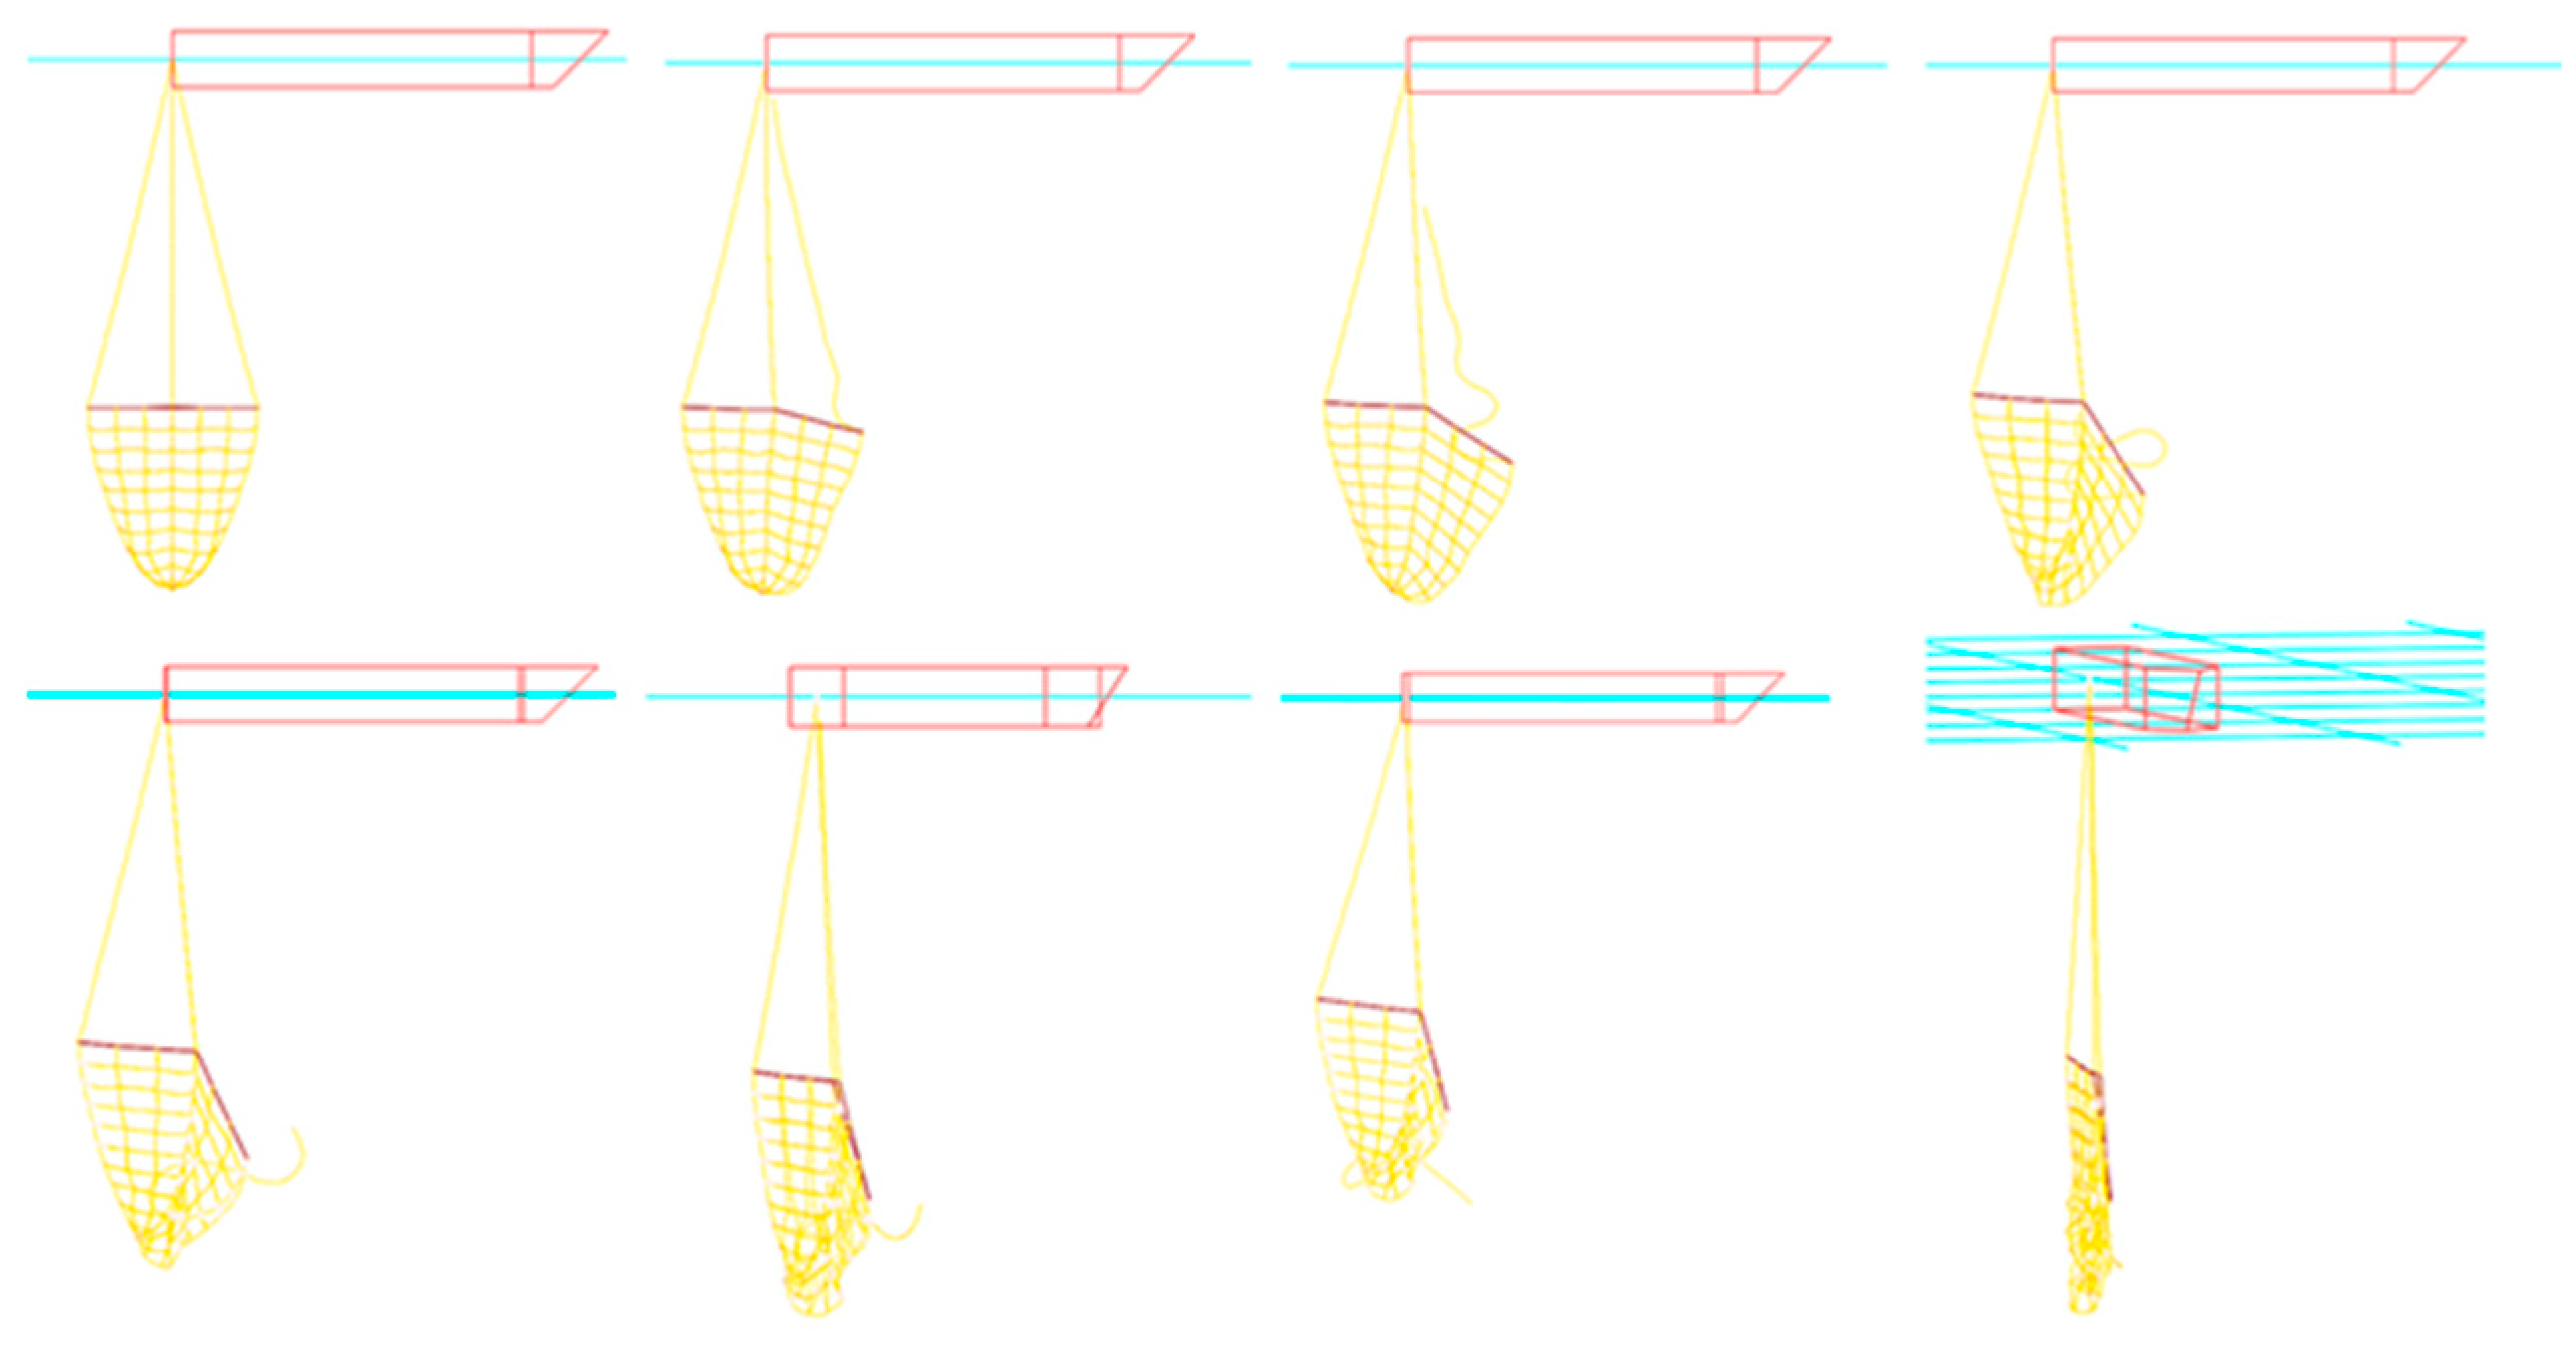
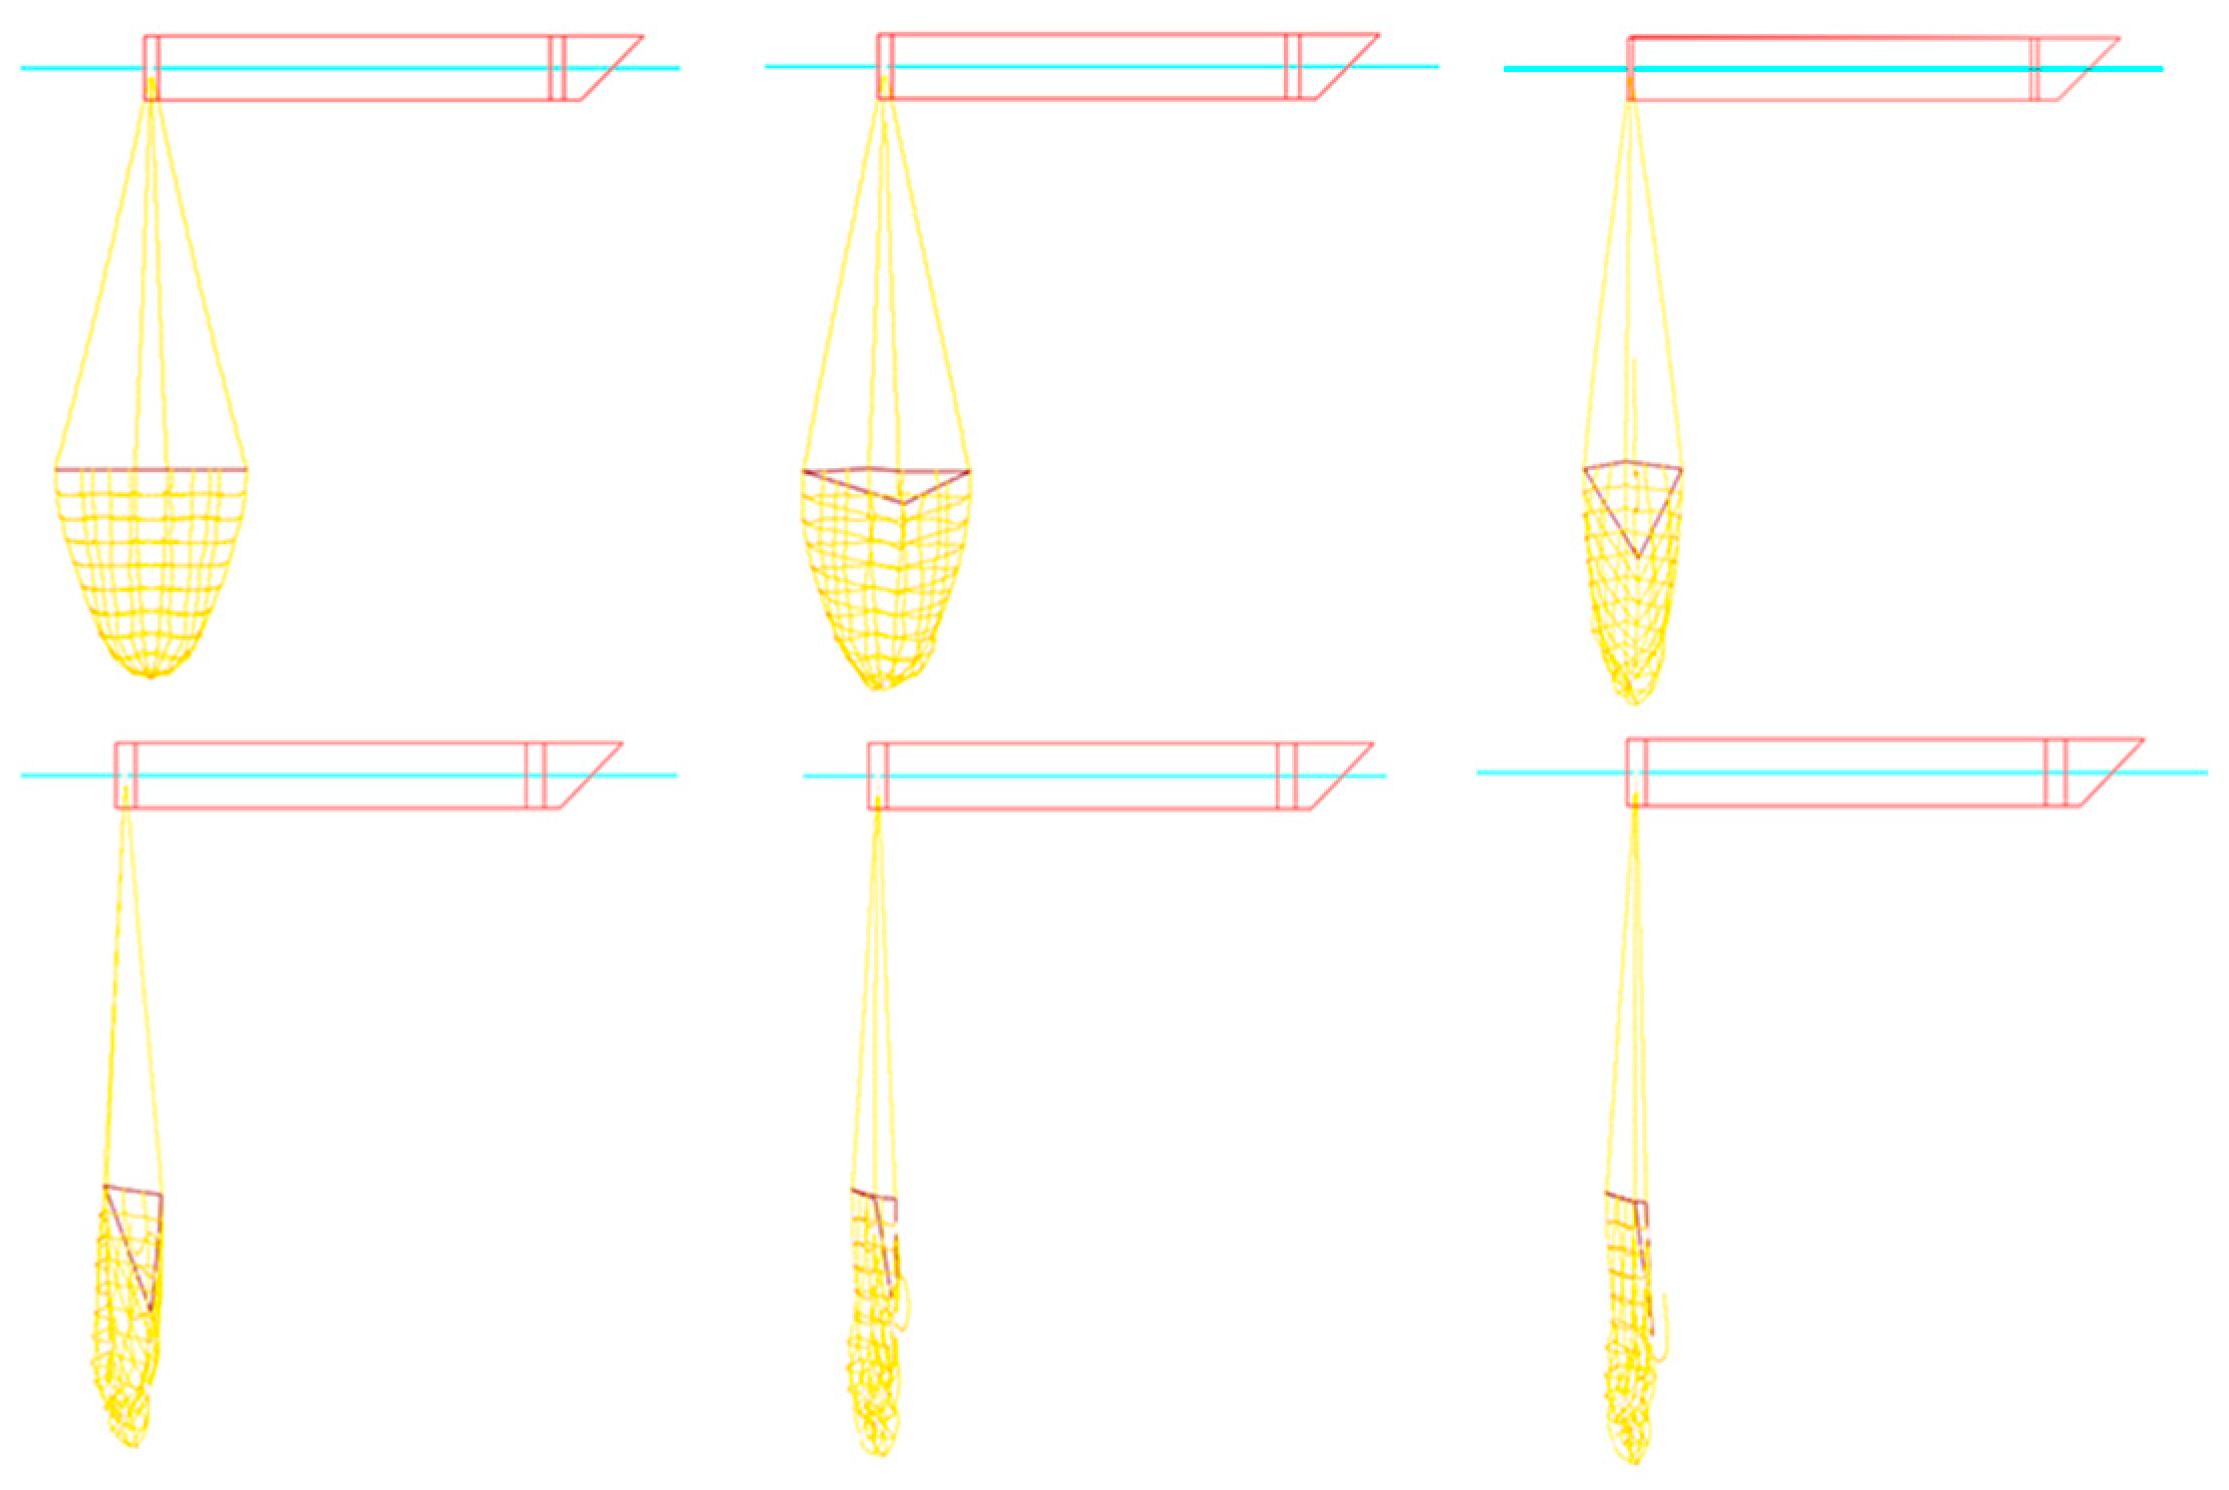
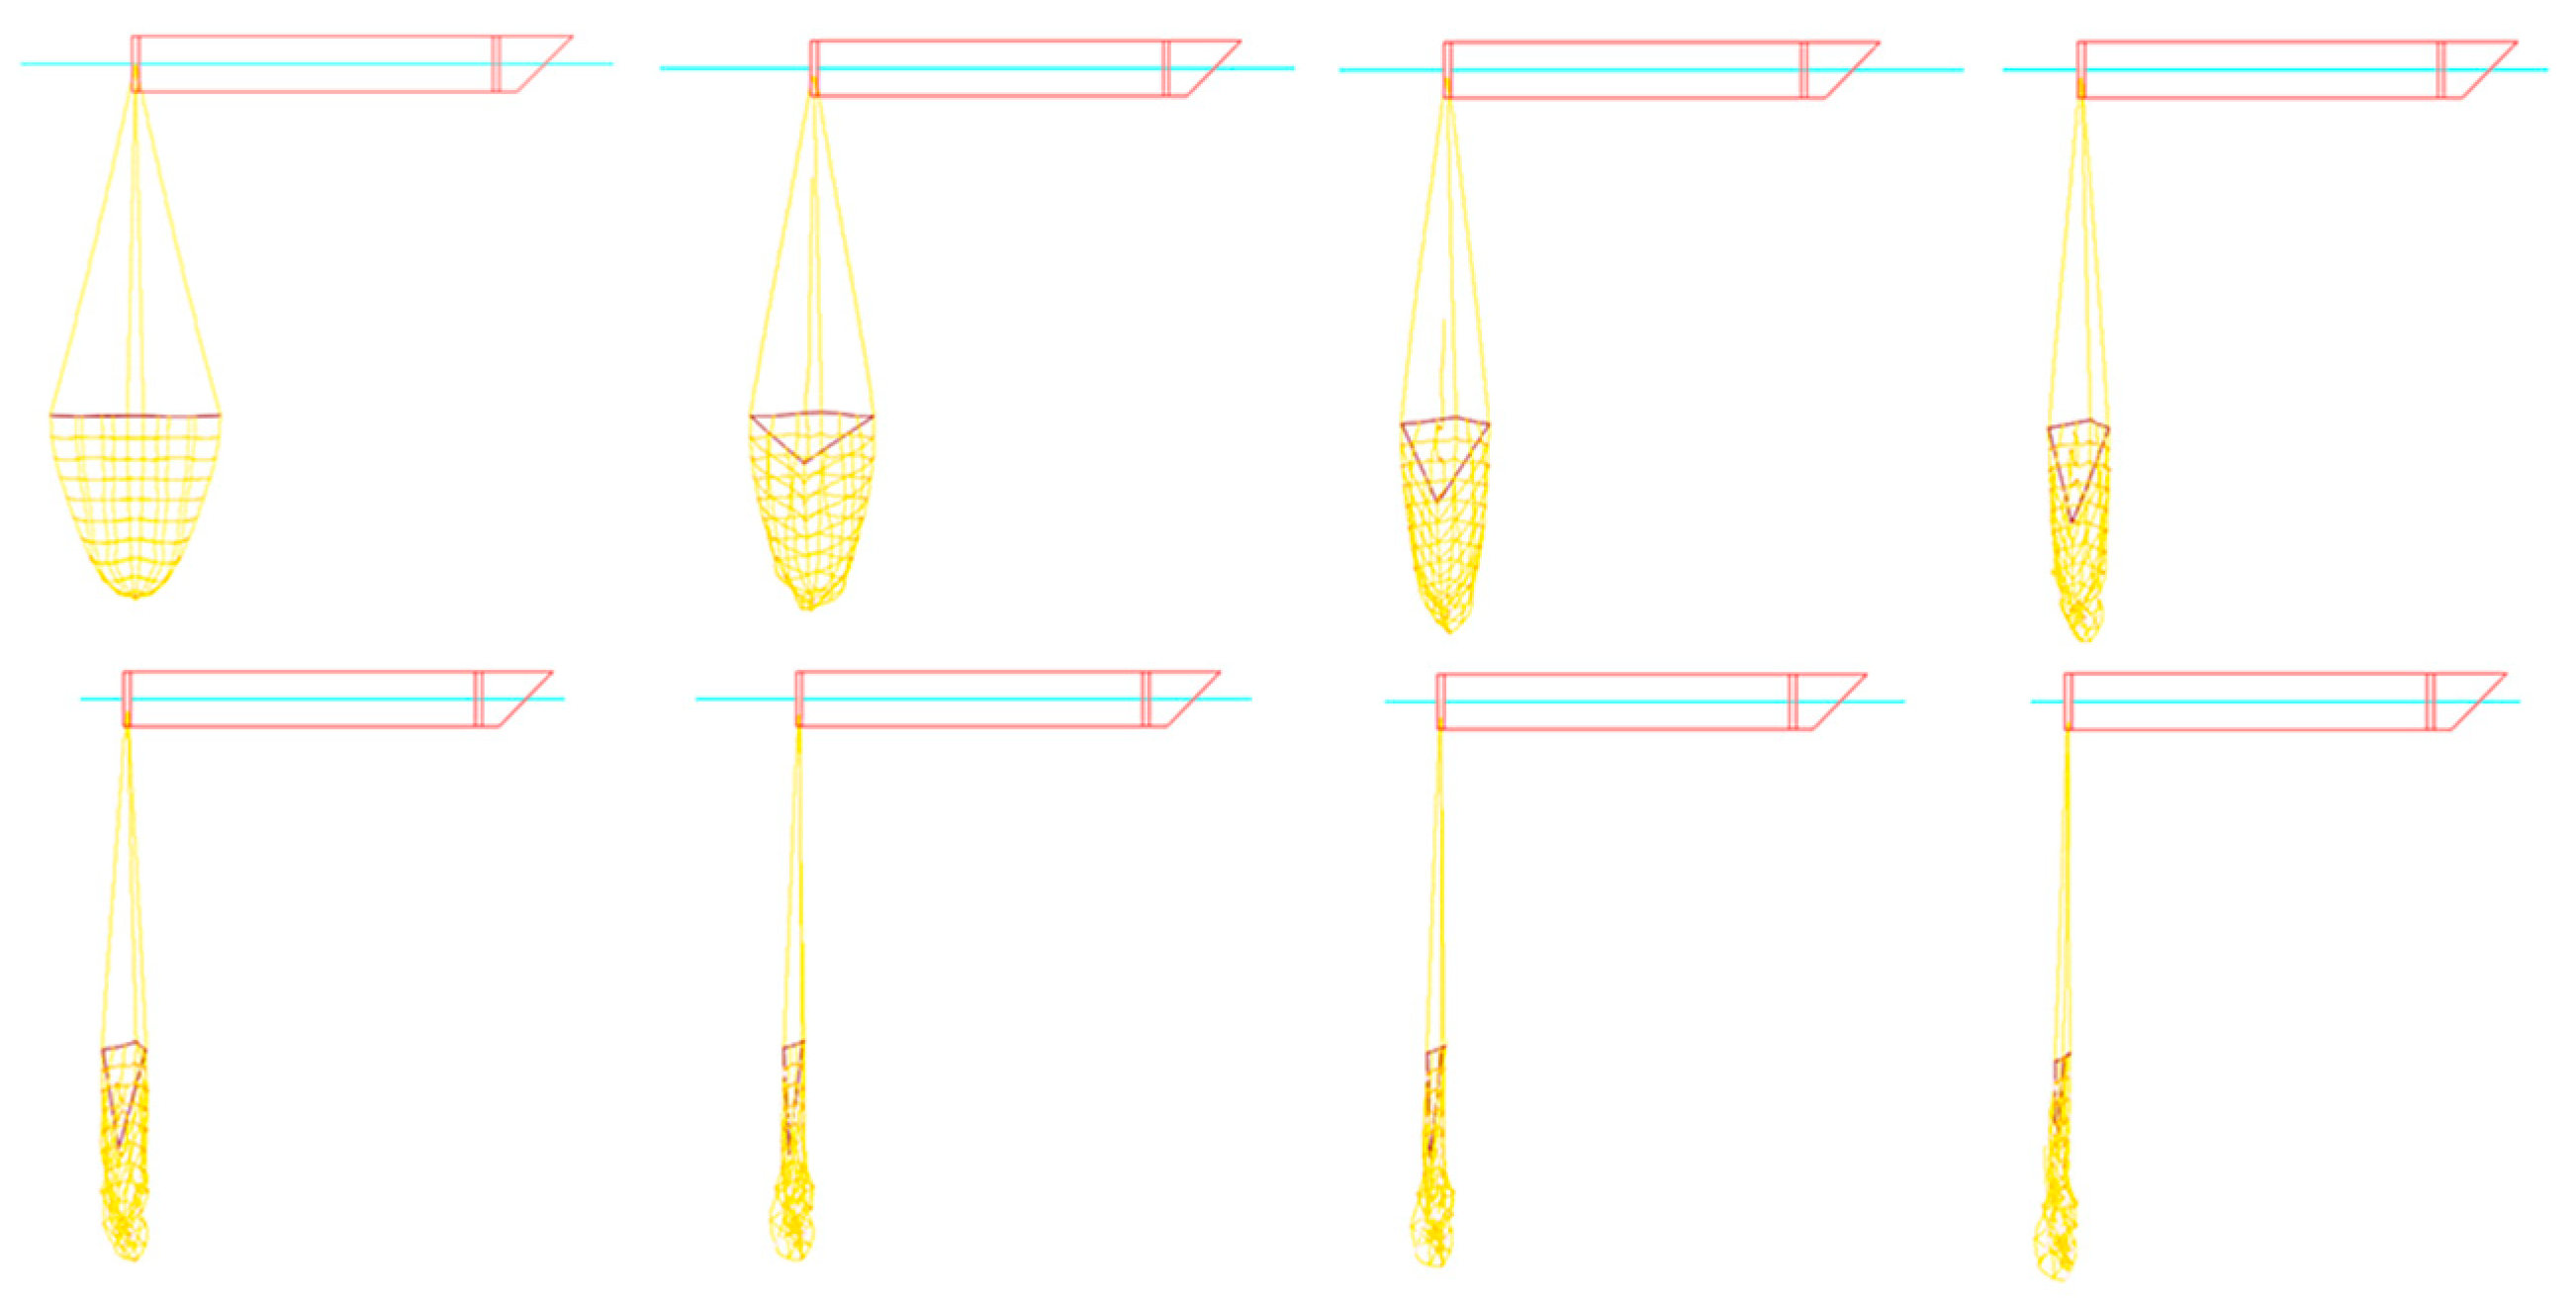
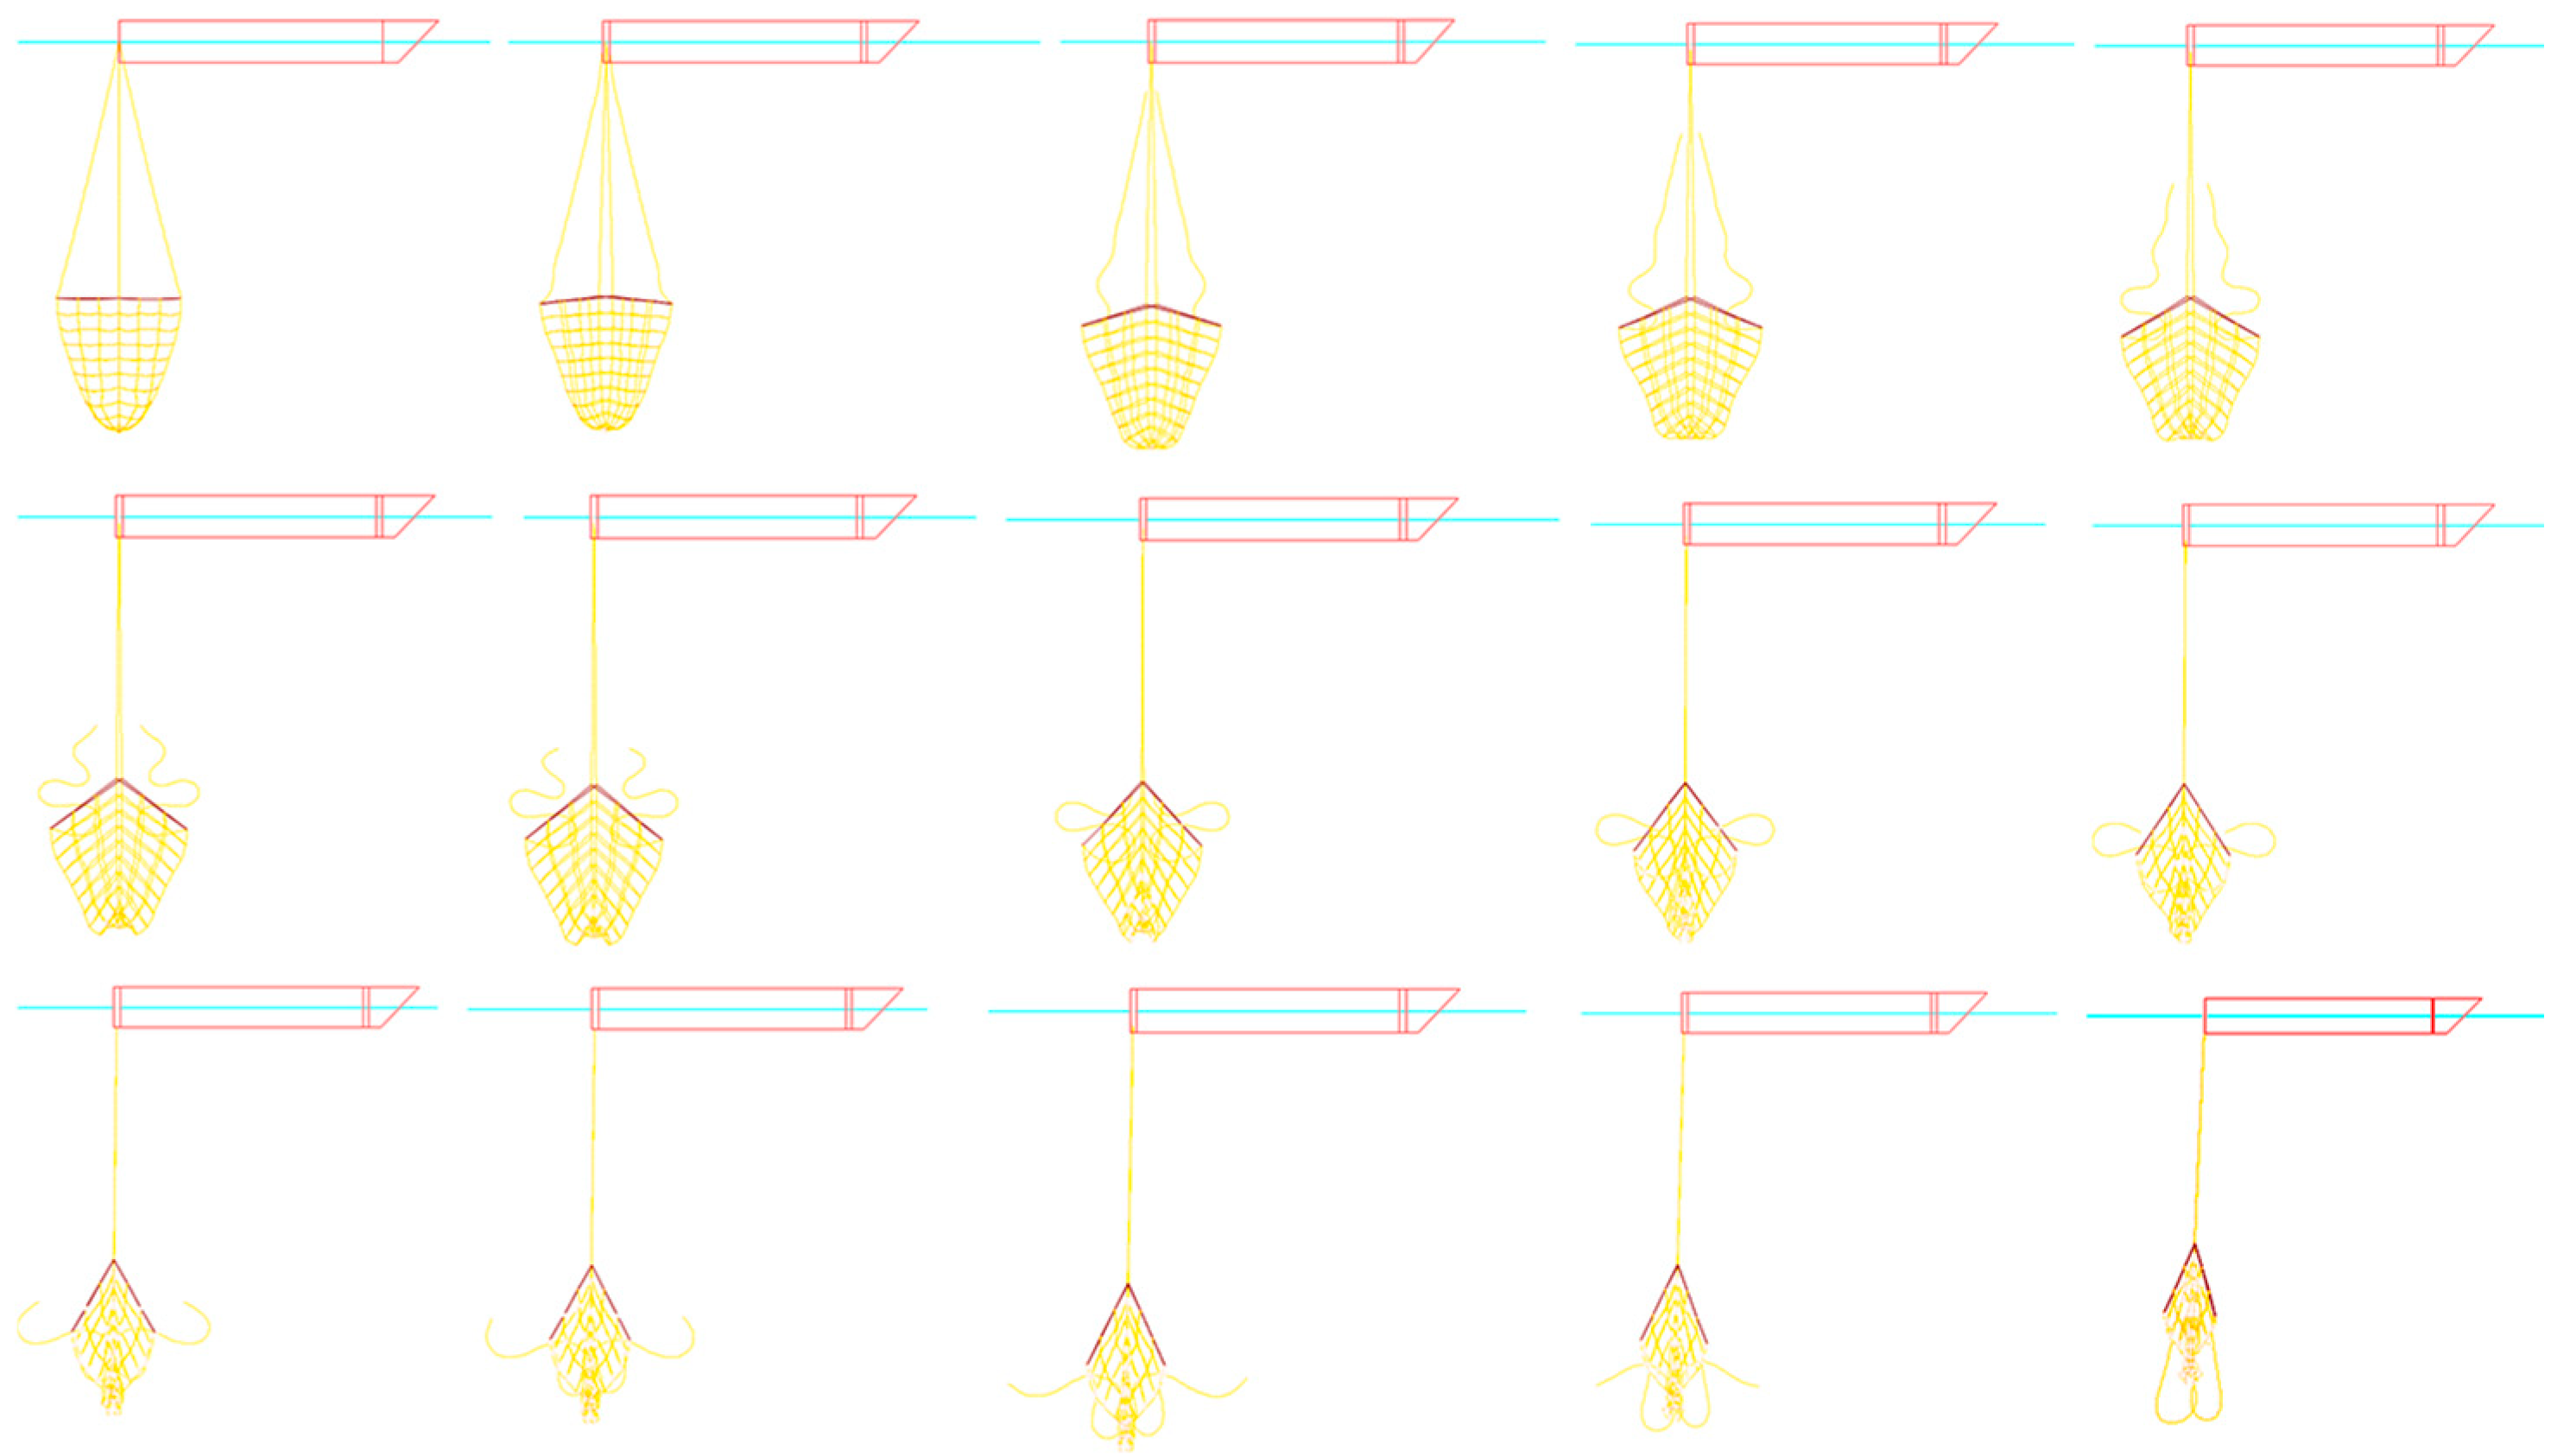
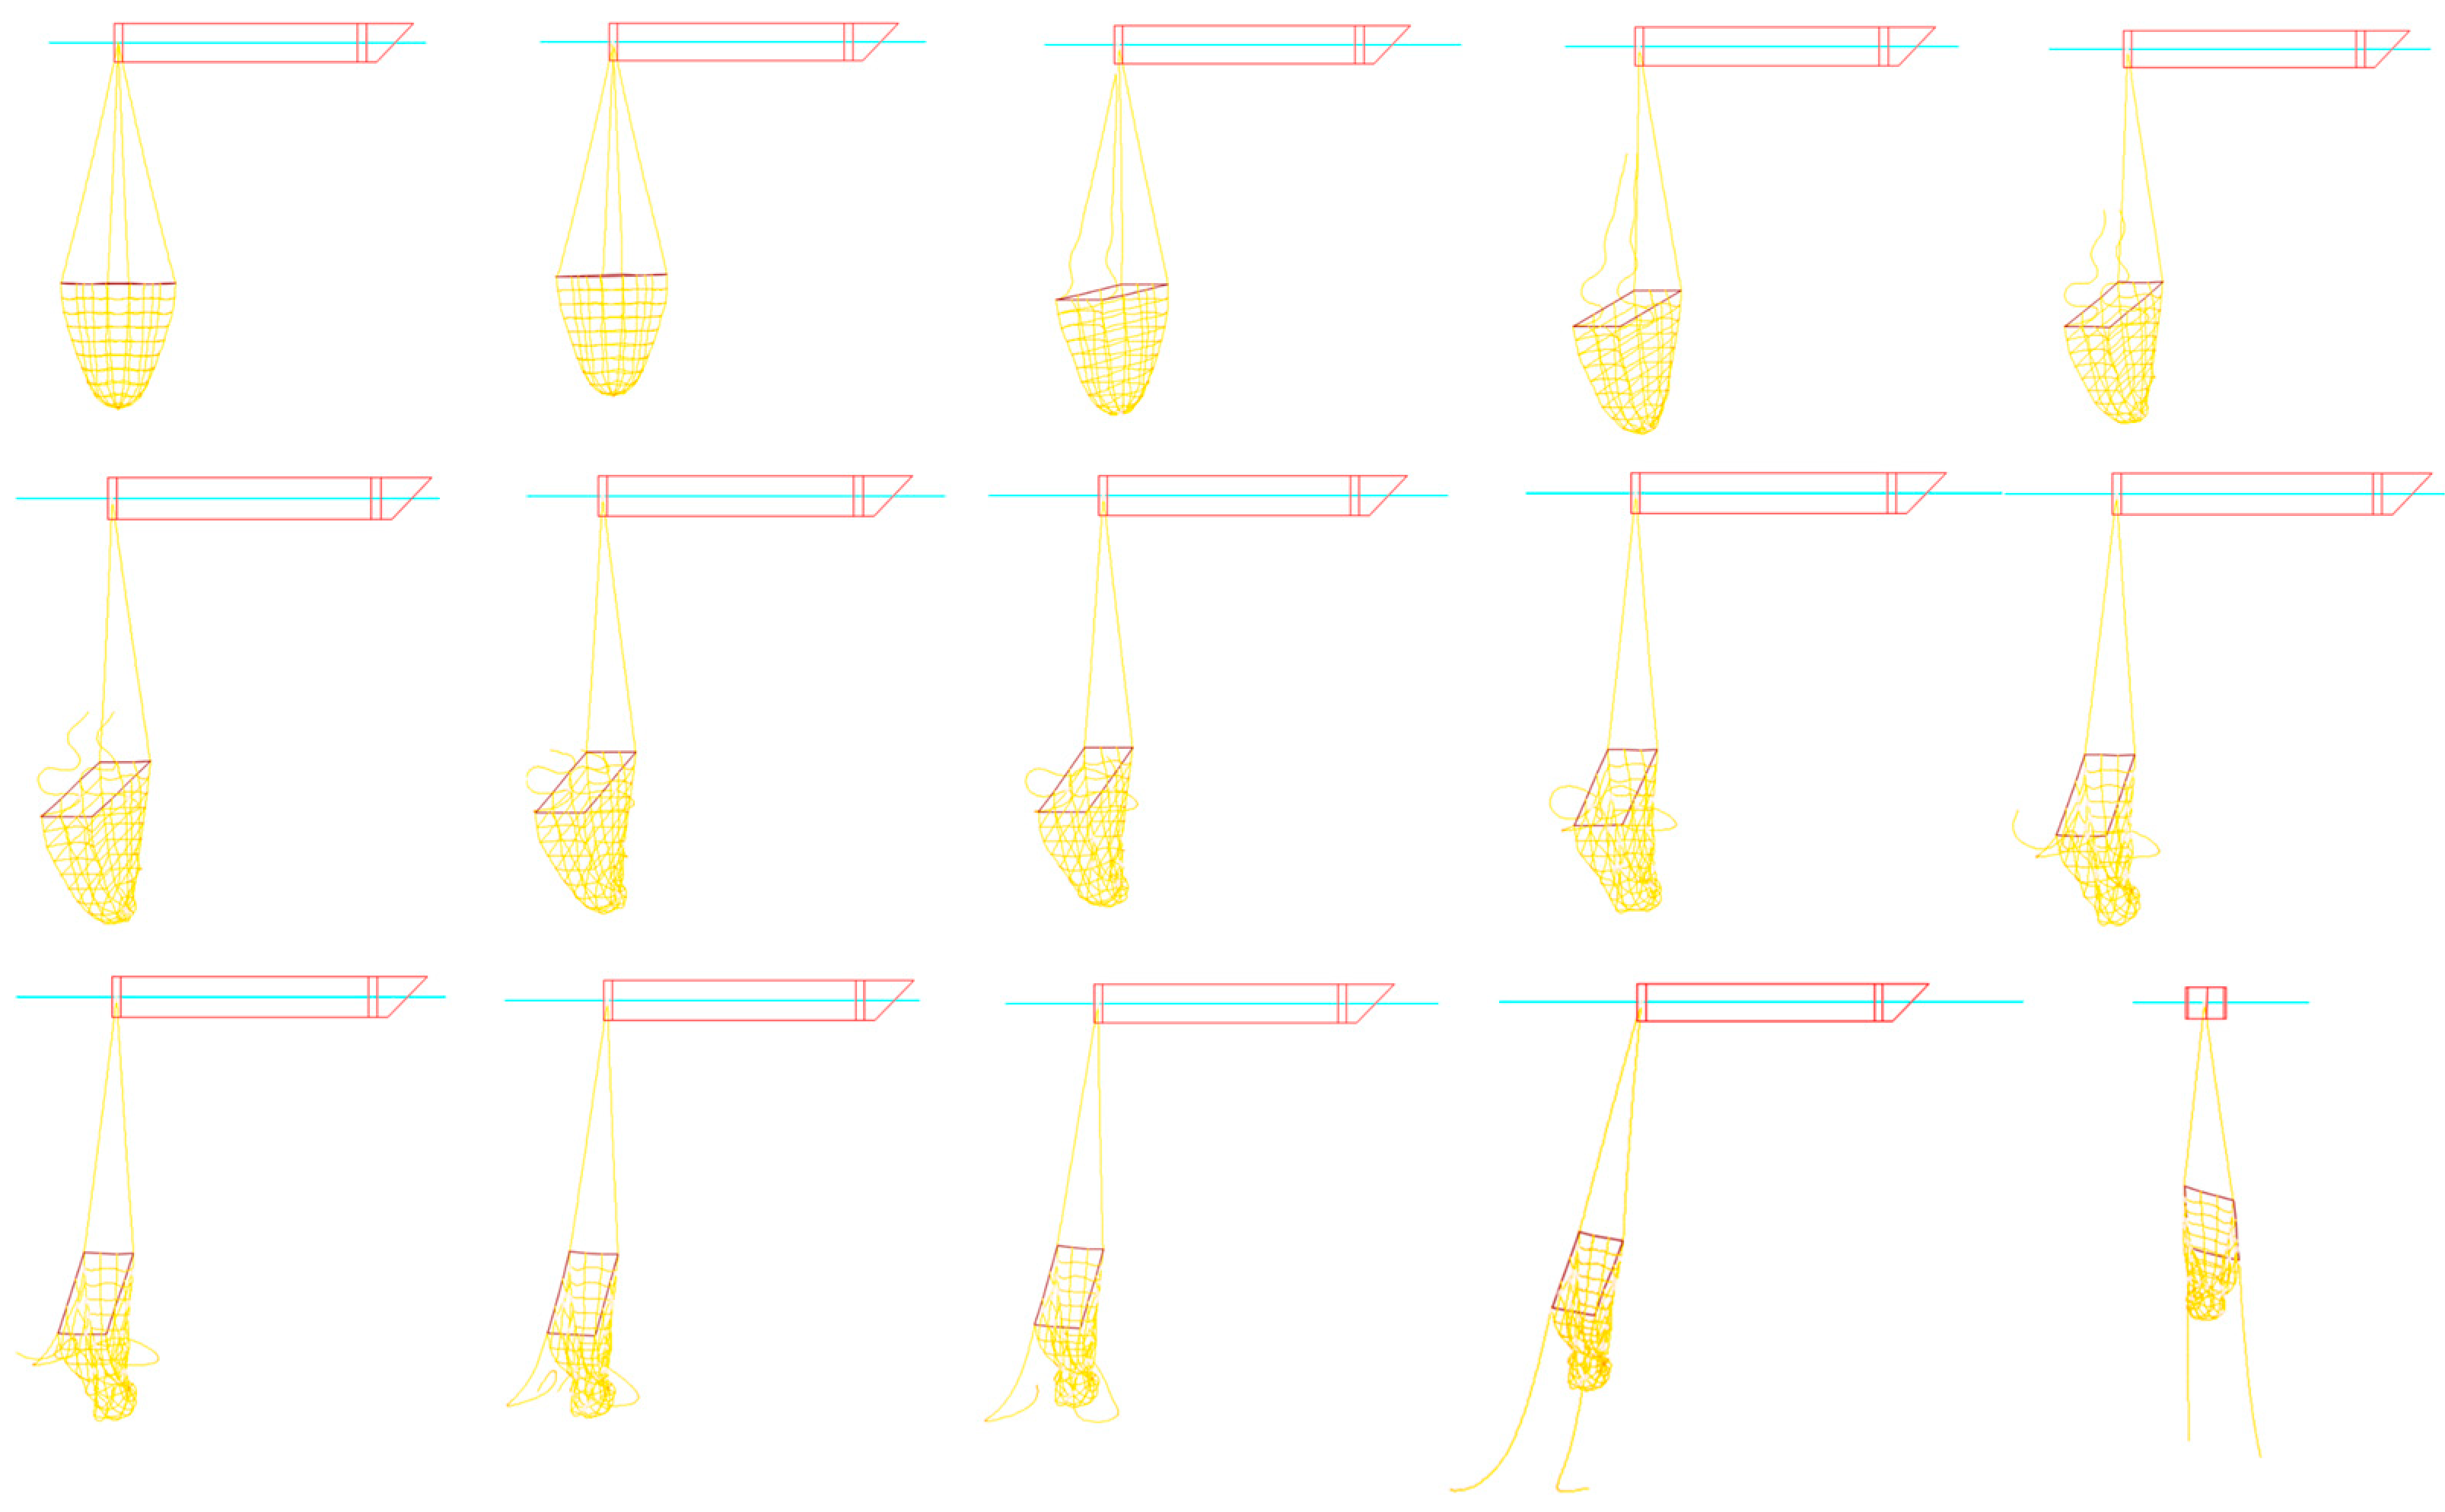
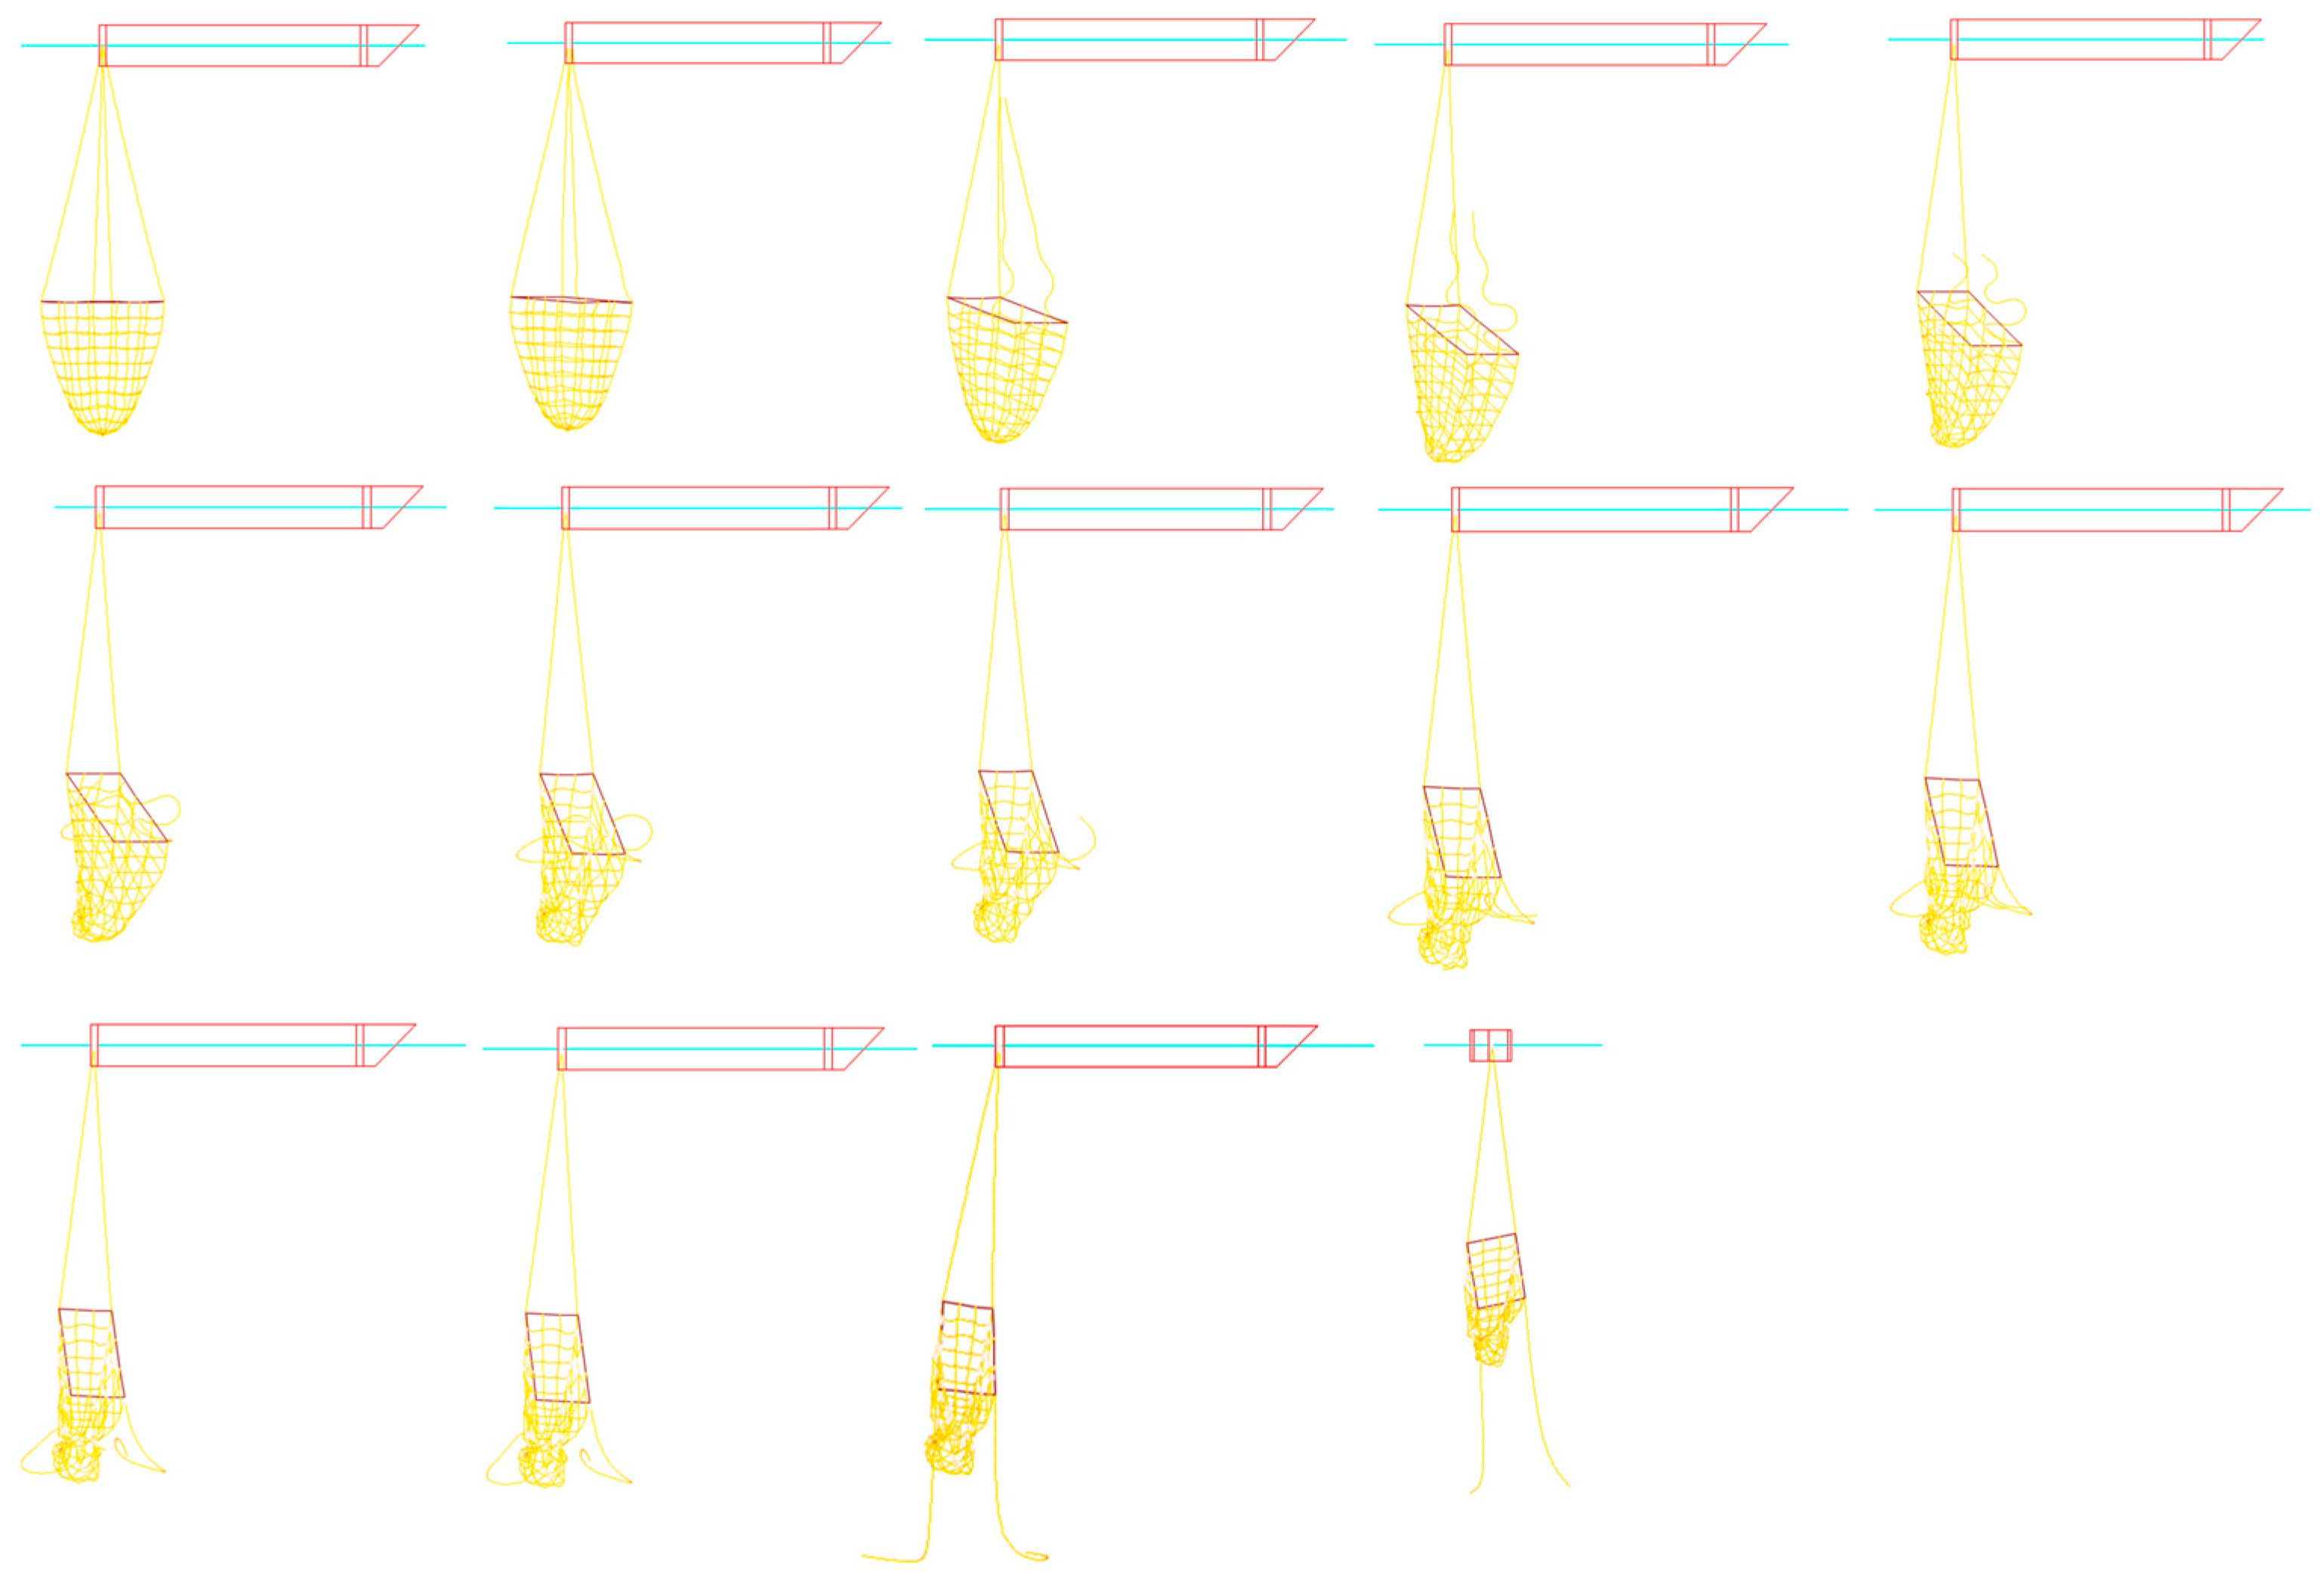
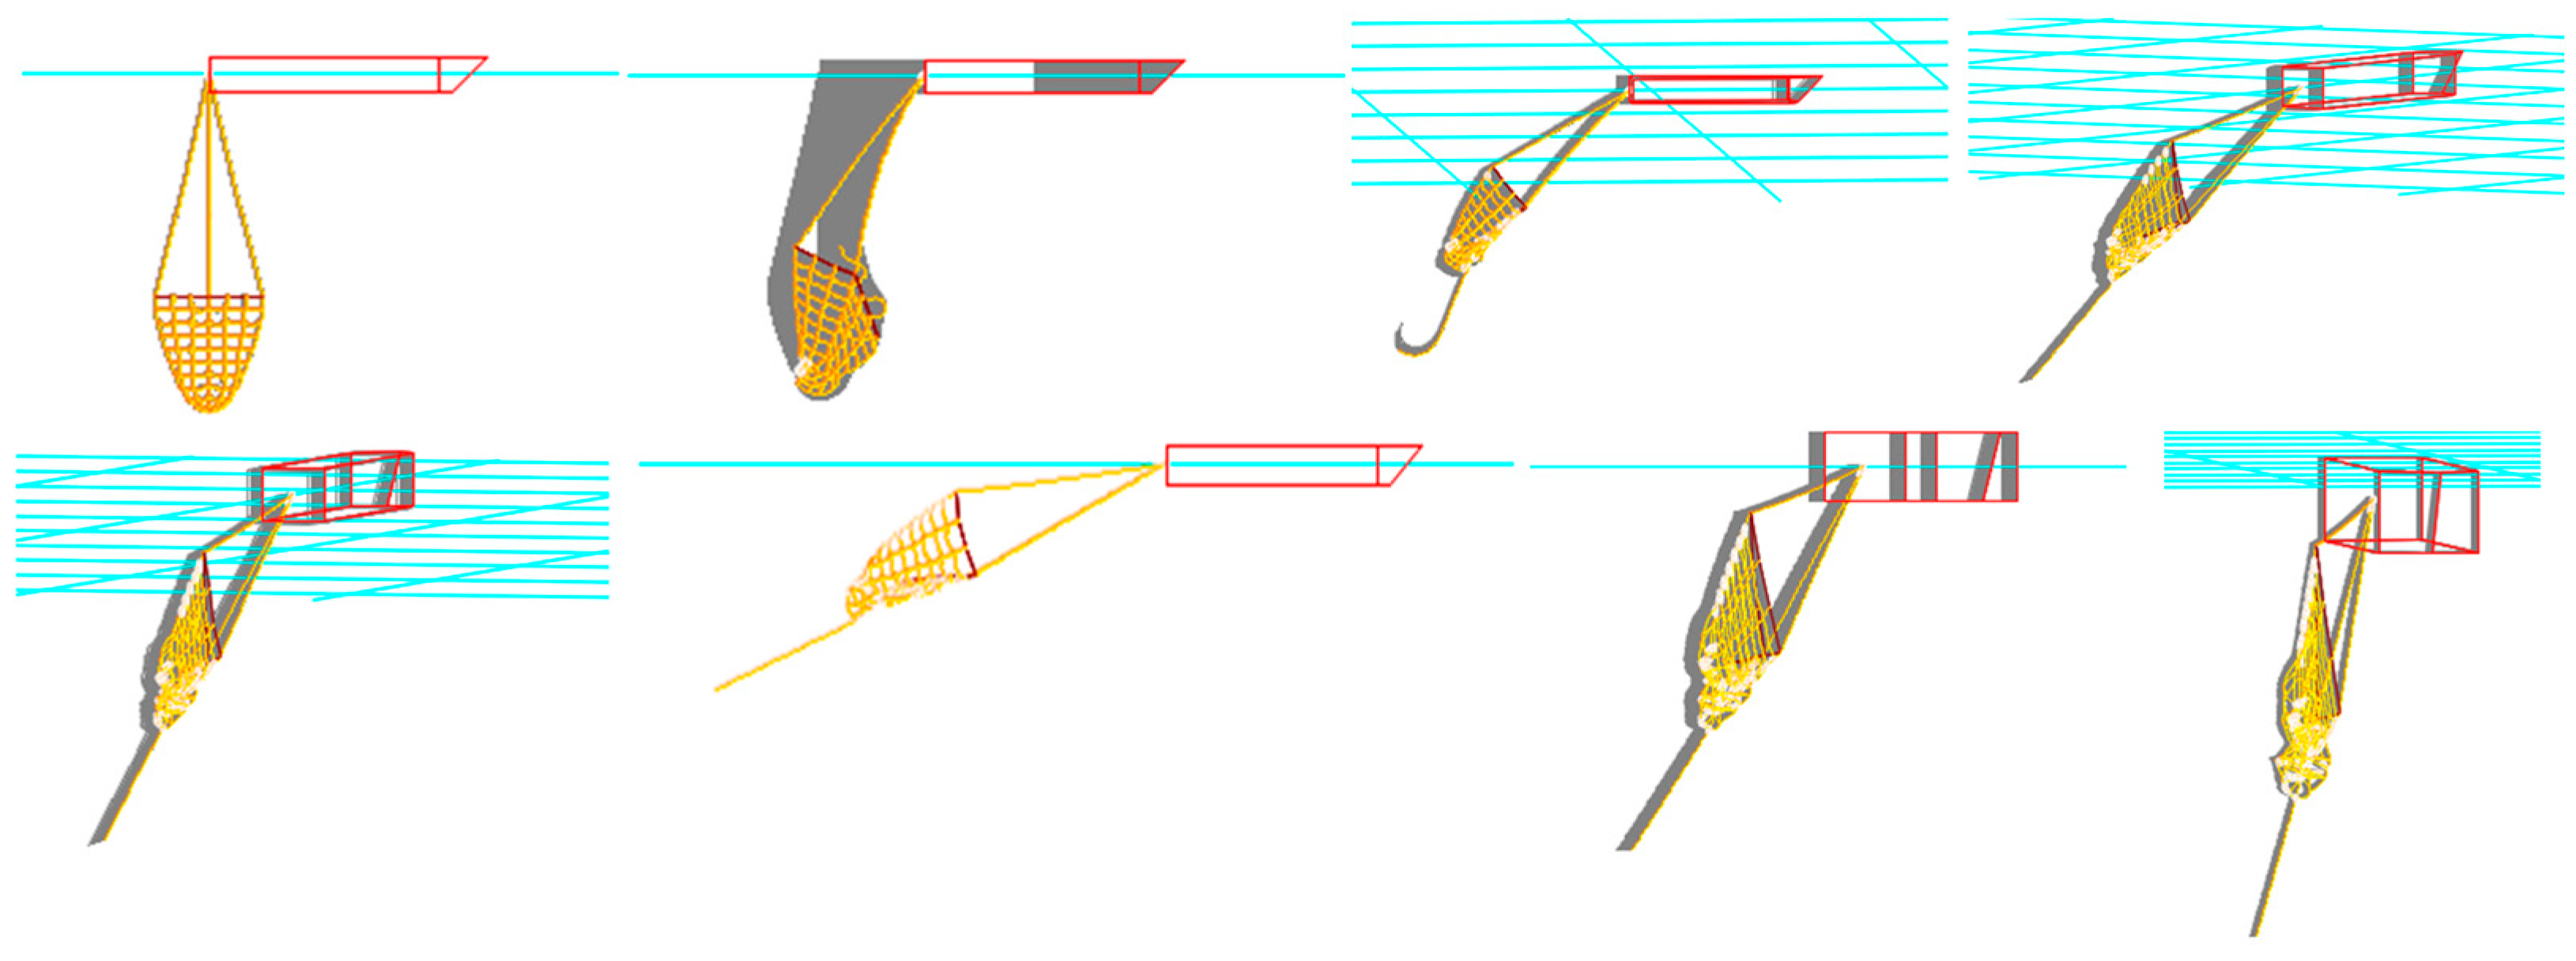
The integrity and operational safety of the trawl system are significantly compromised when the line breaks. No matter which line fails at commencement, the towing box starts to distort quickly as the tensile impact of the line is gone. If two symmetrical lines fail, the trawl quickly collapses from the outside into the interior before flattening out. The square frame of the trawl, which is made up of four stiff frame edges, remains unchanged if two asymmetrical lines break;
(4)
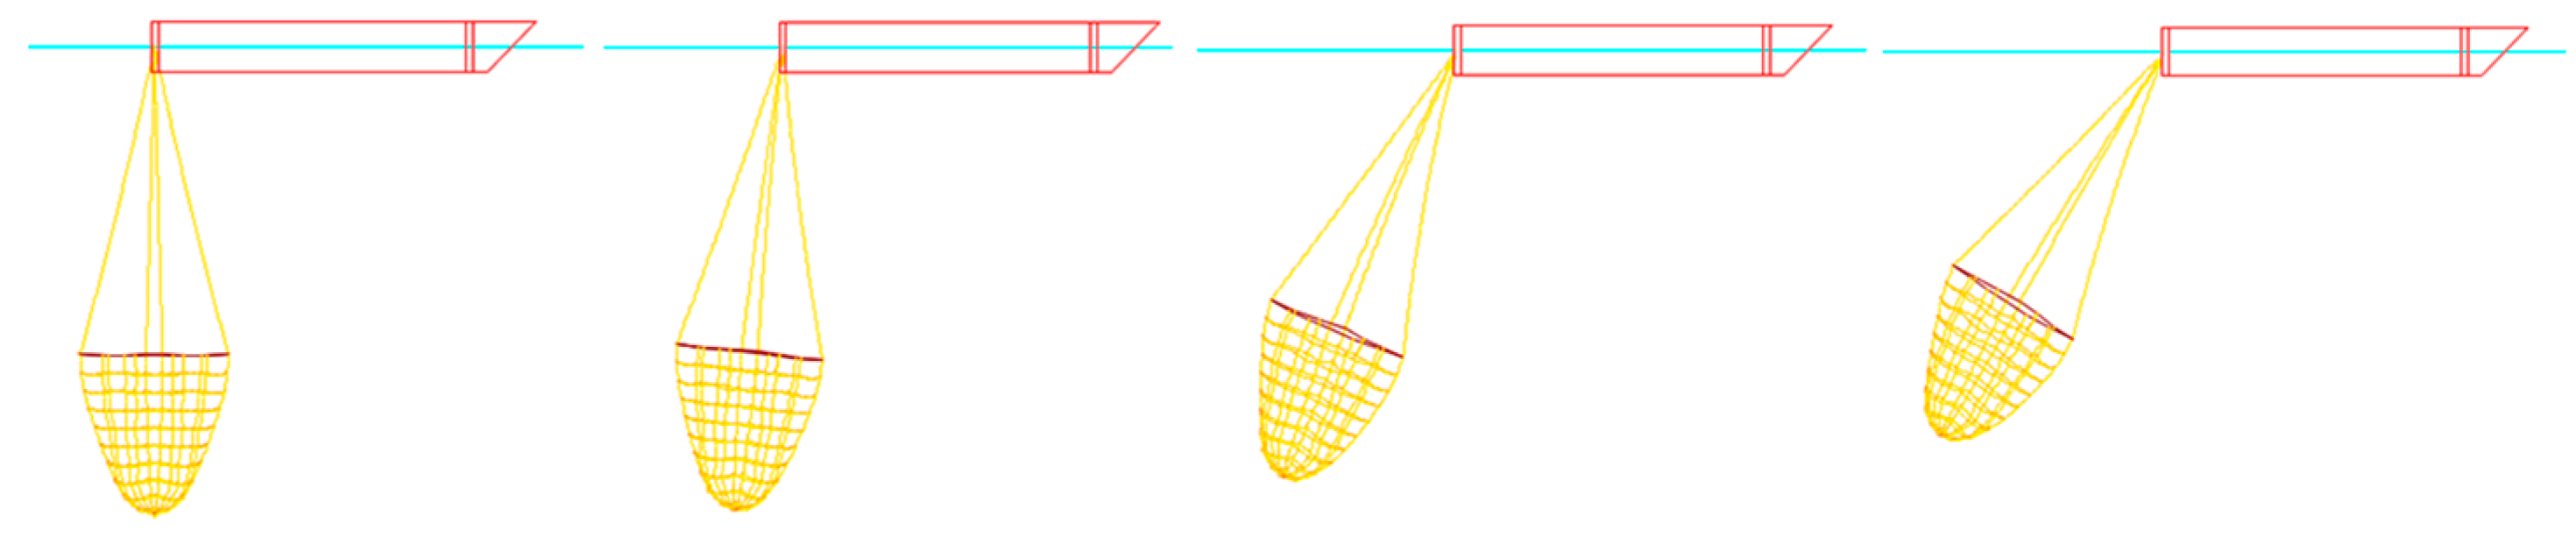
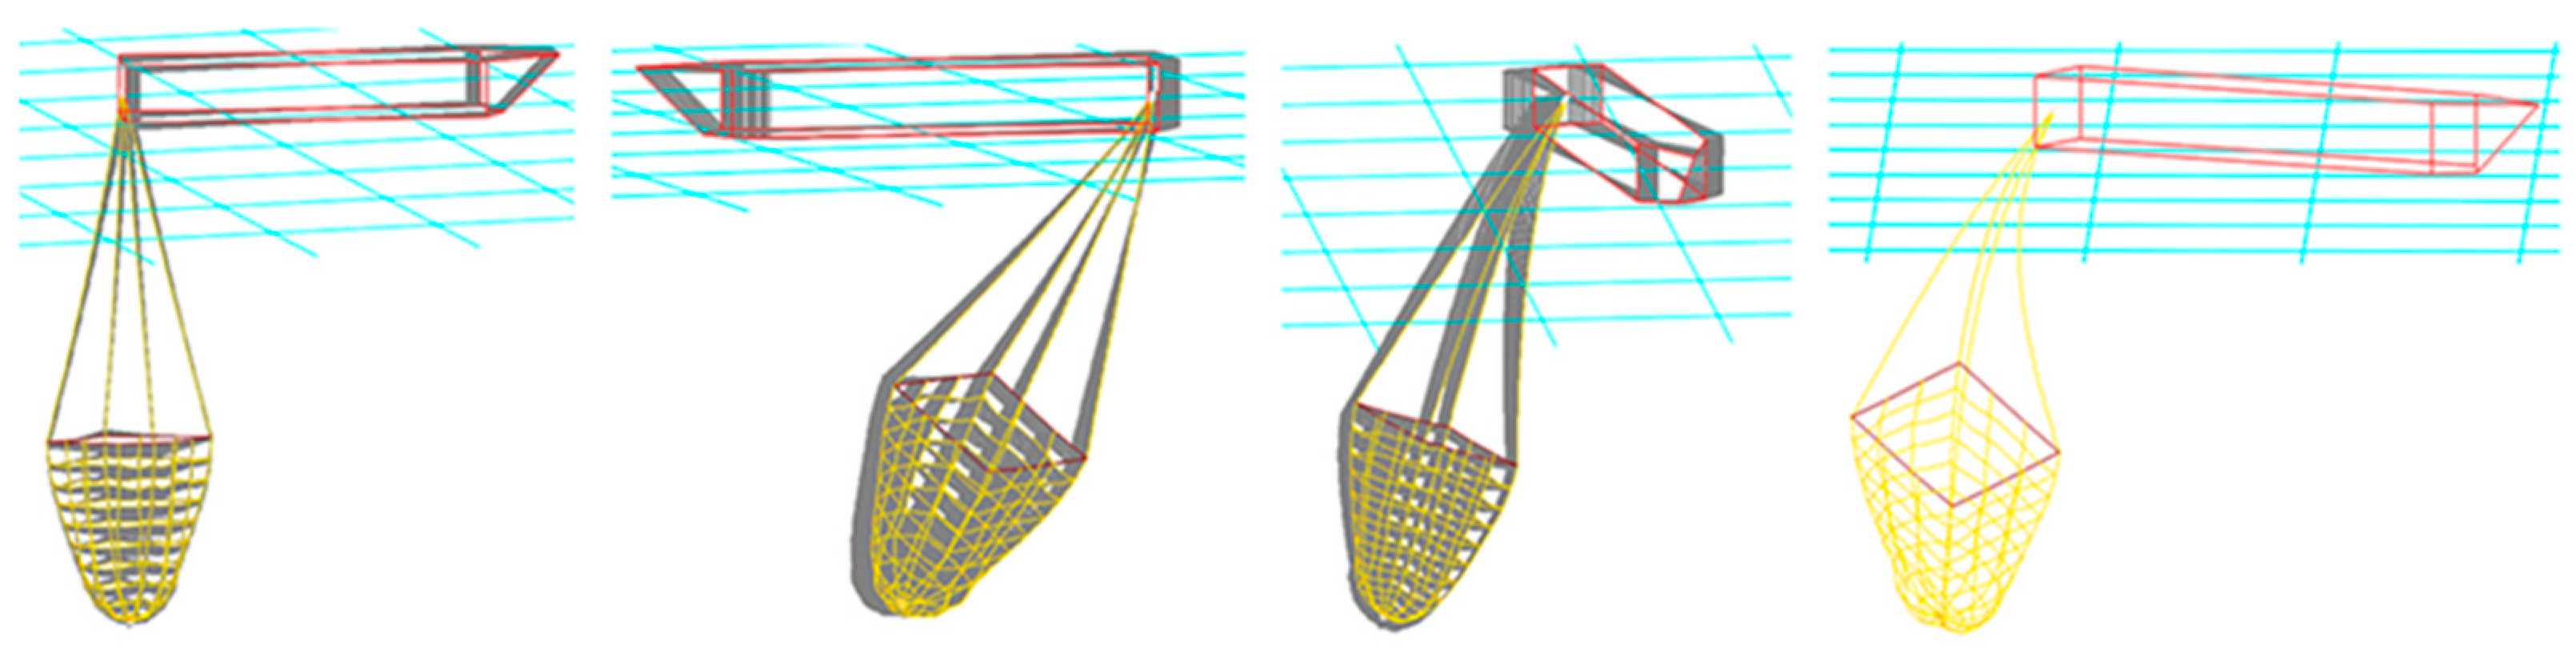
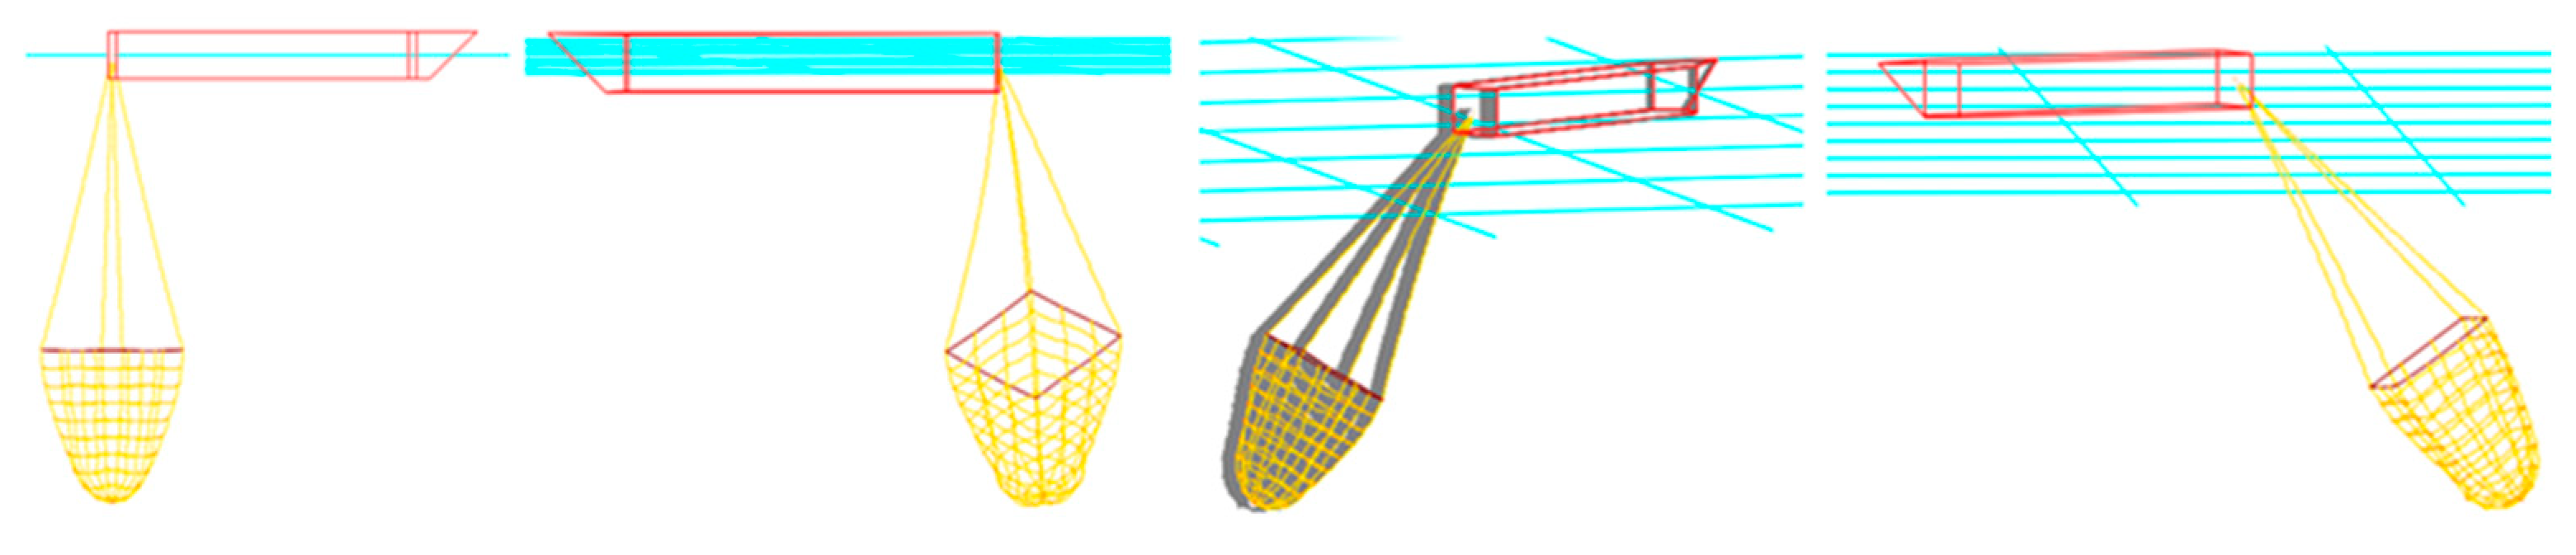
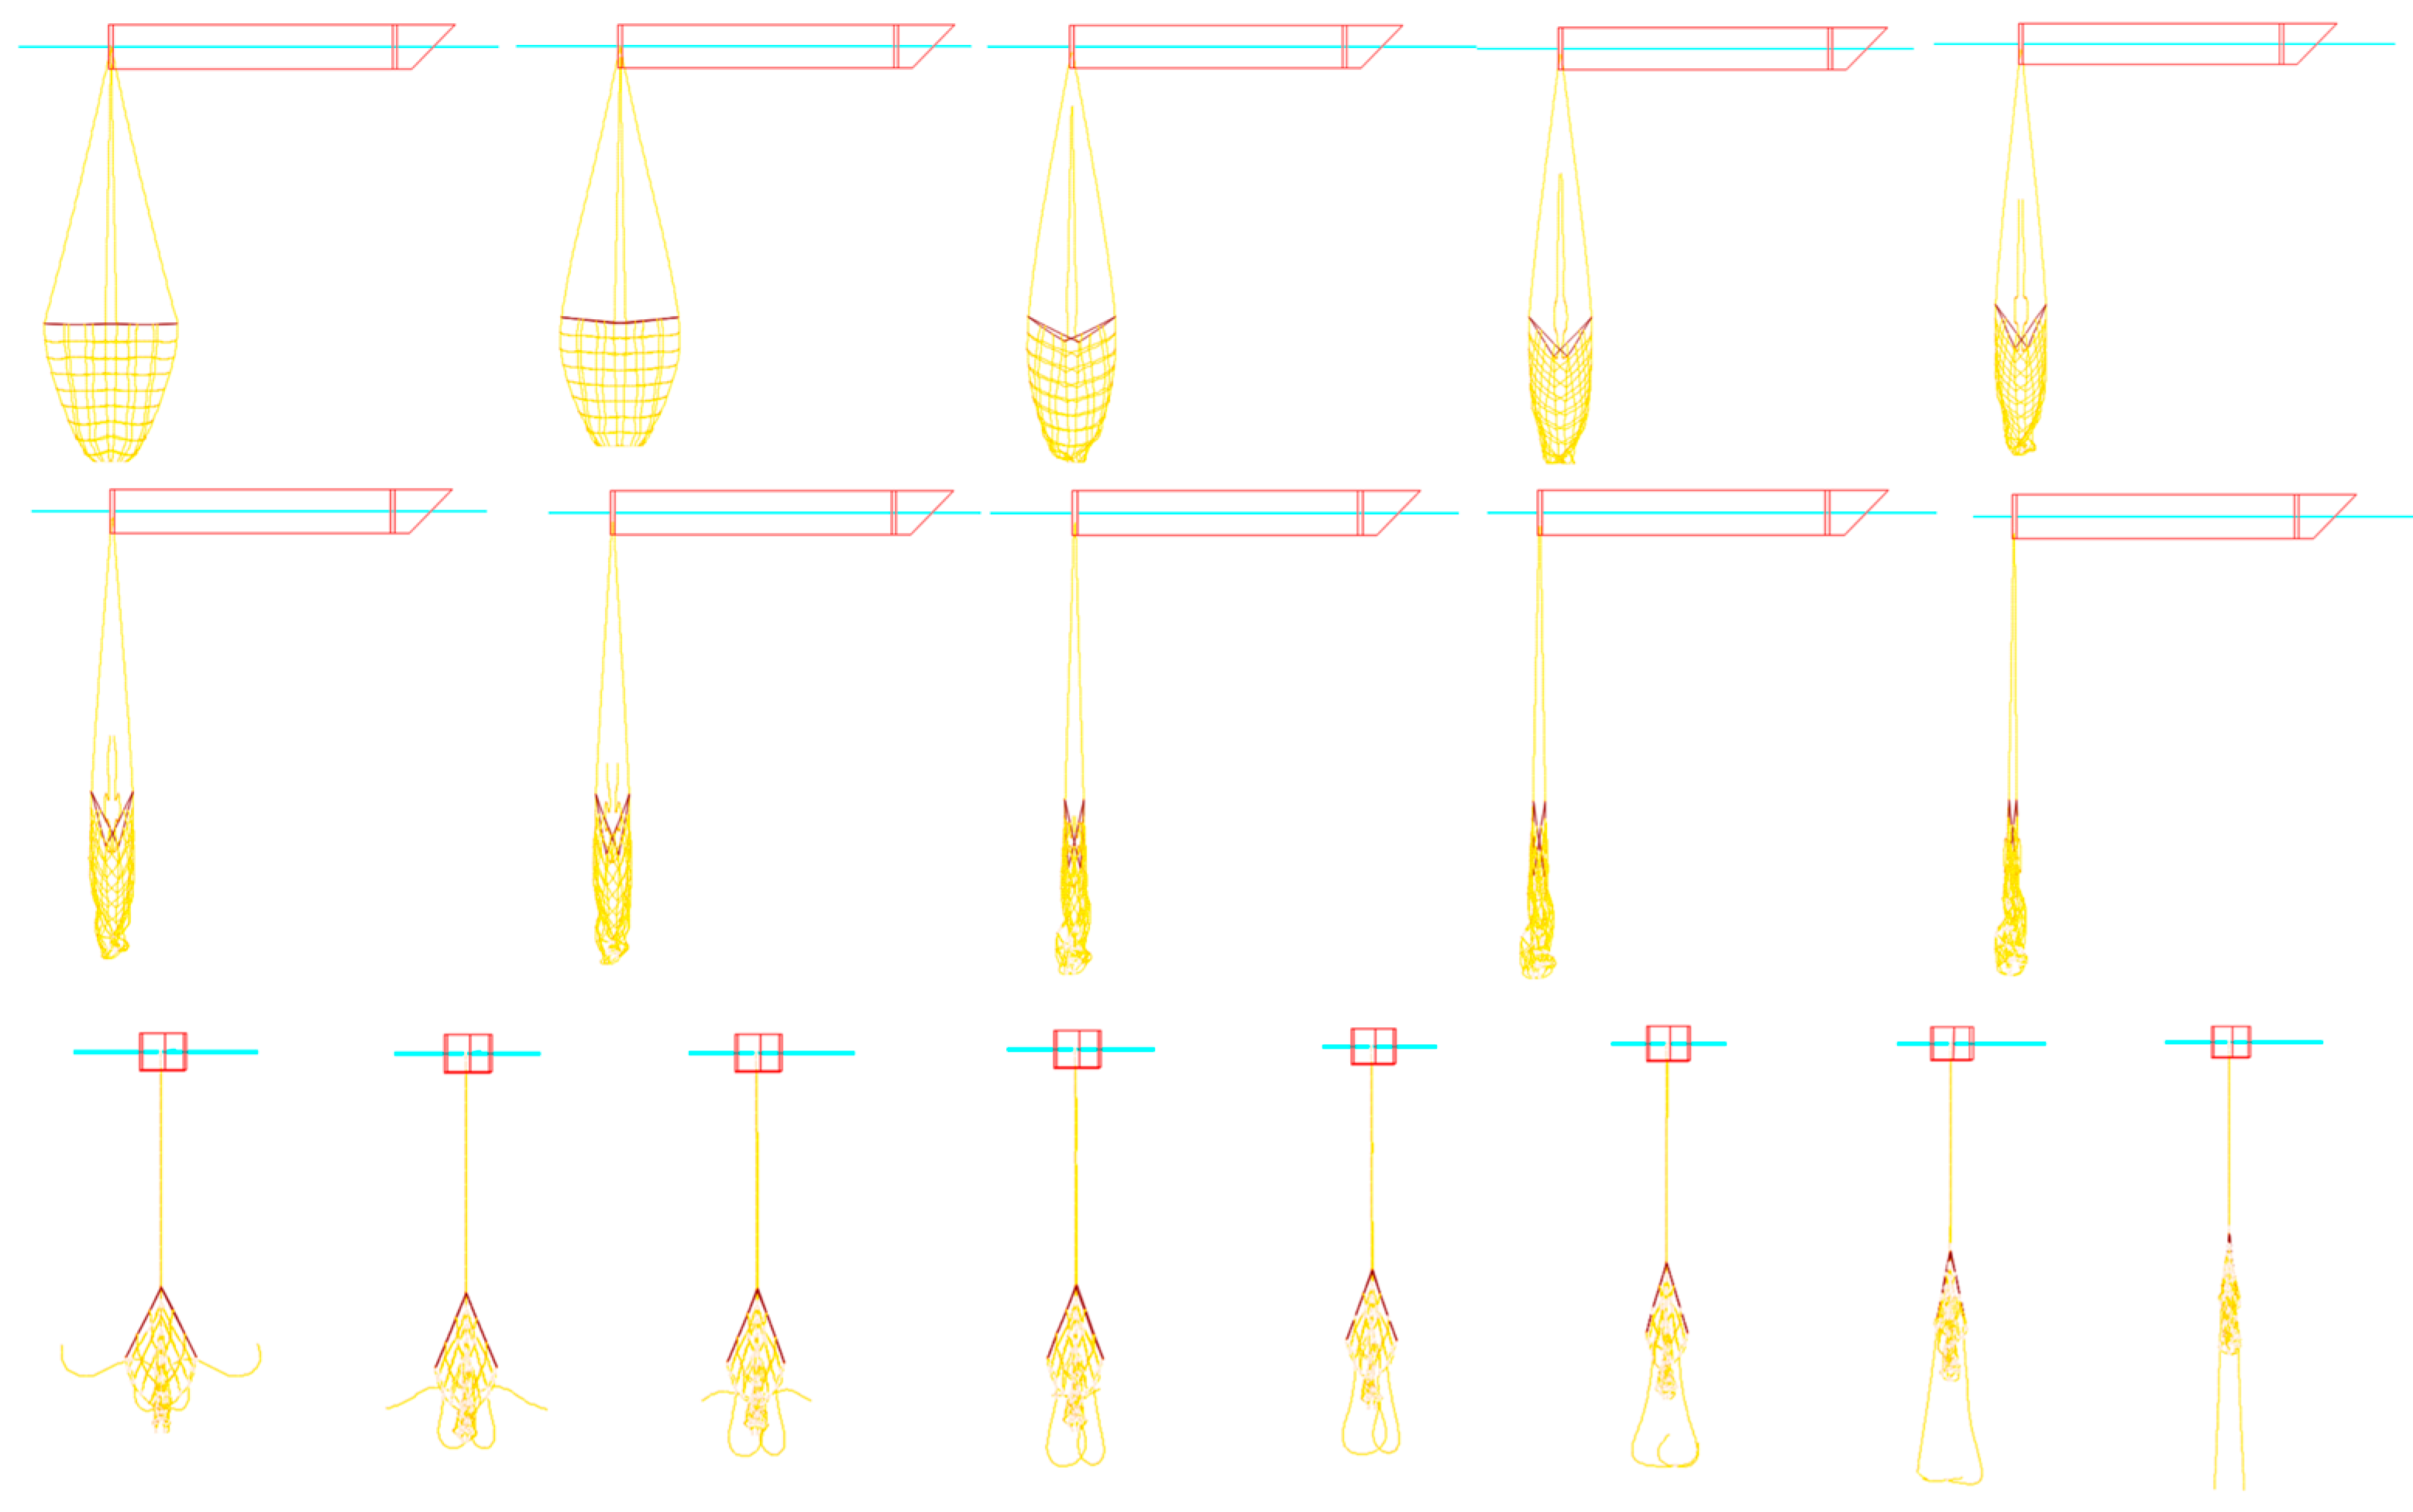
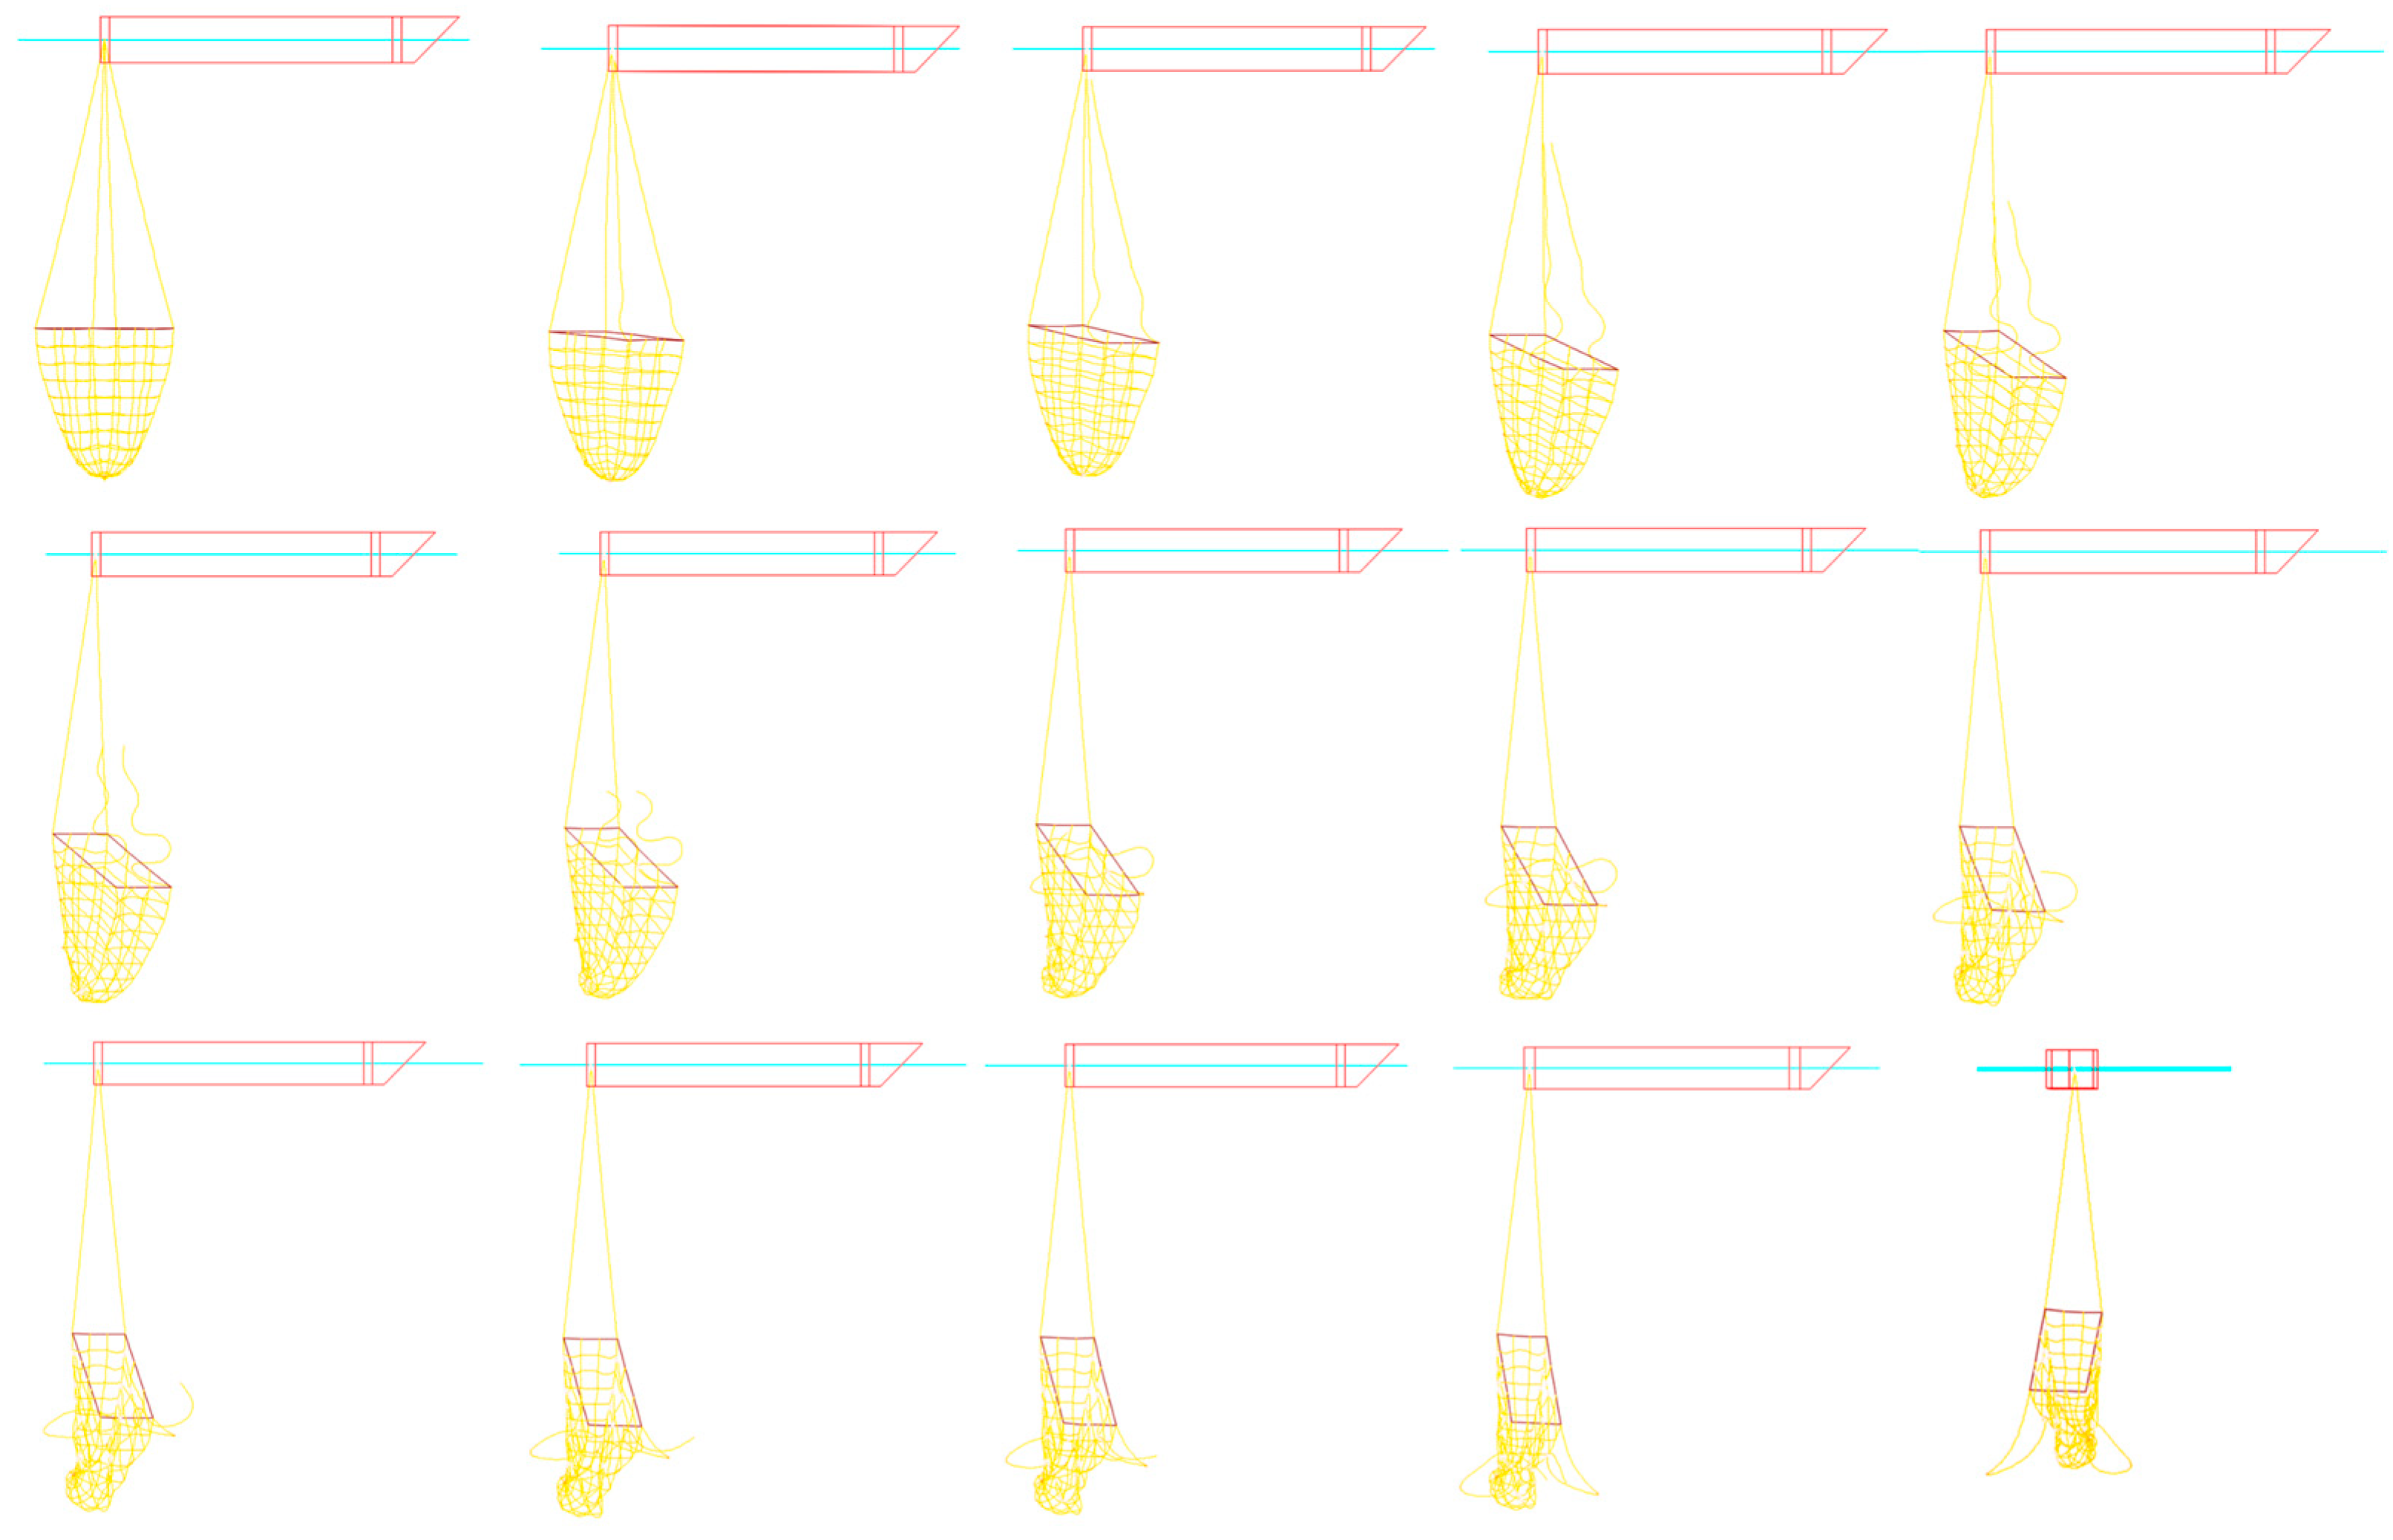
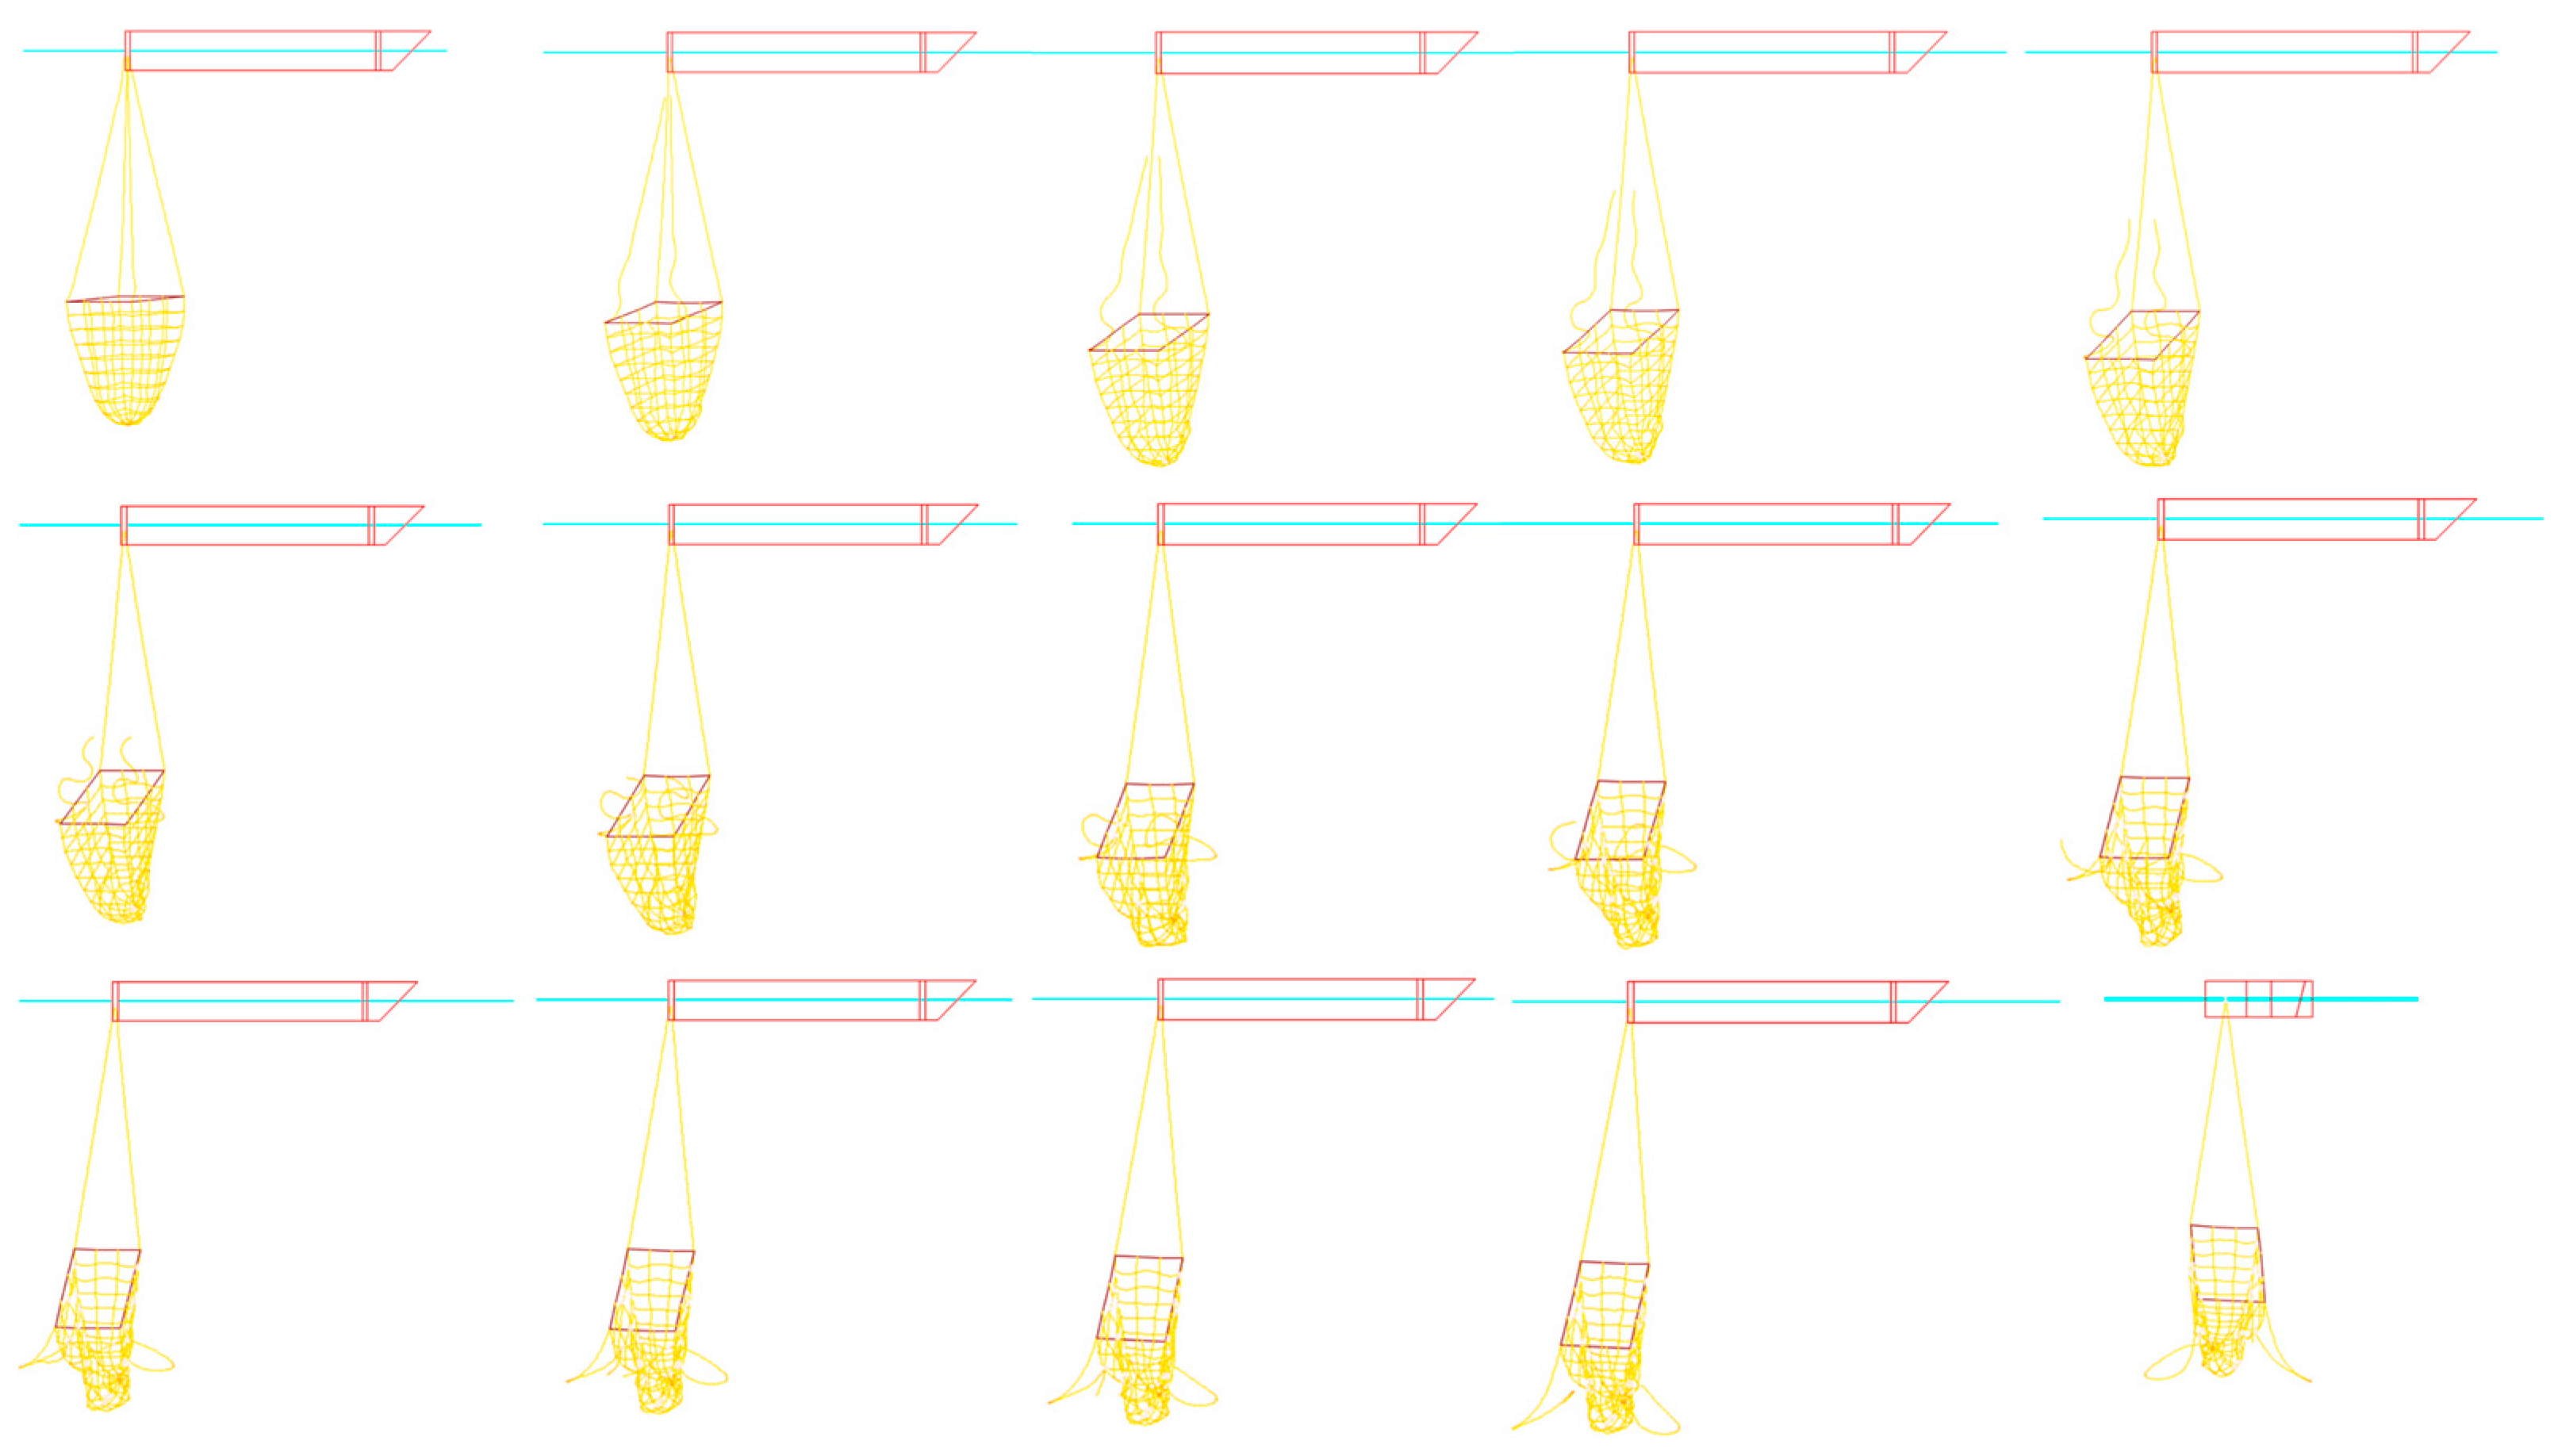
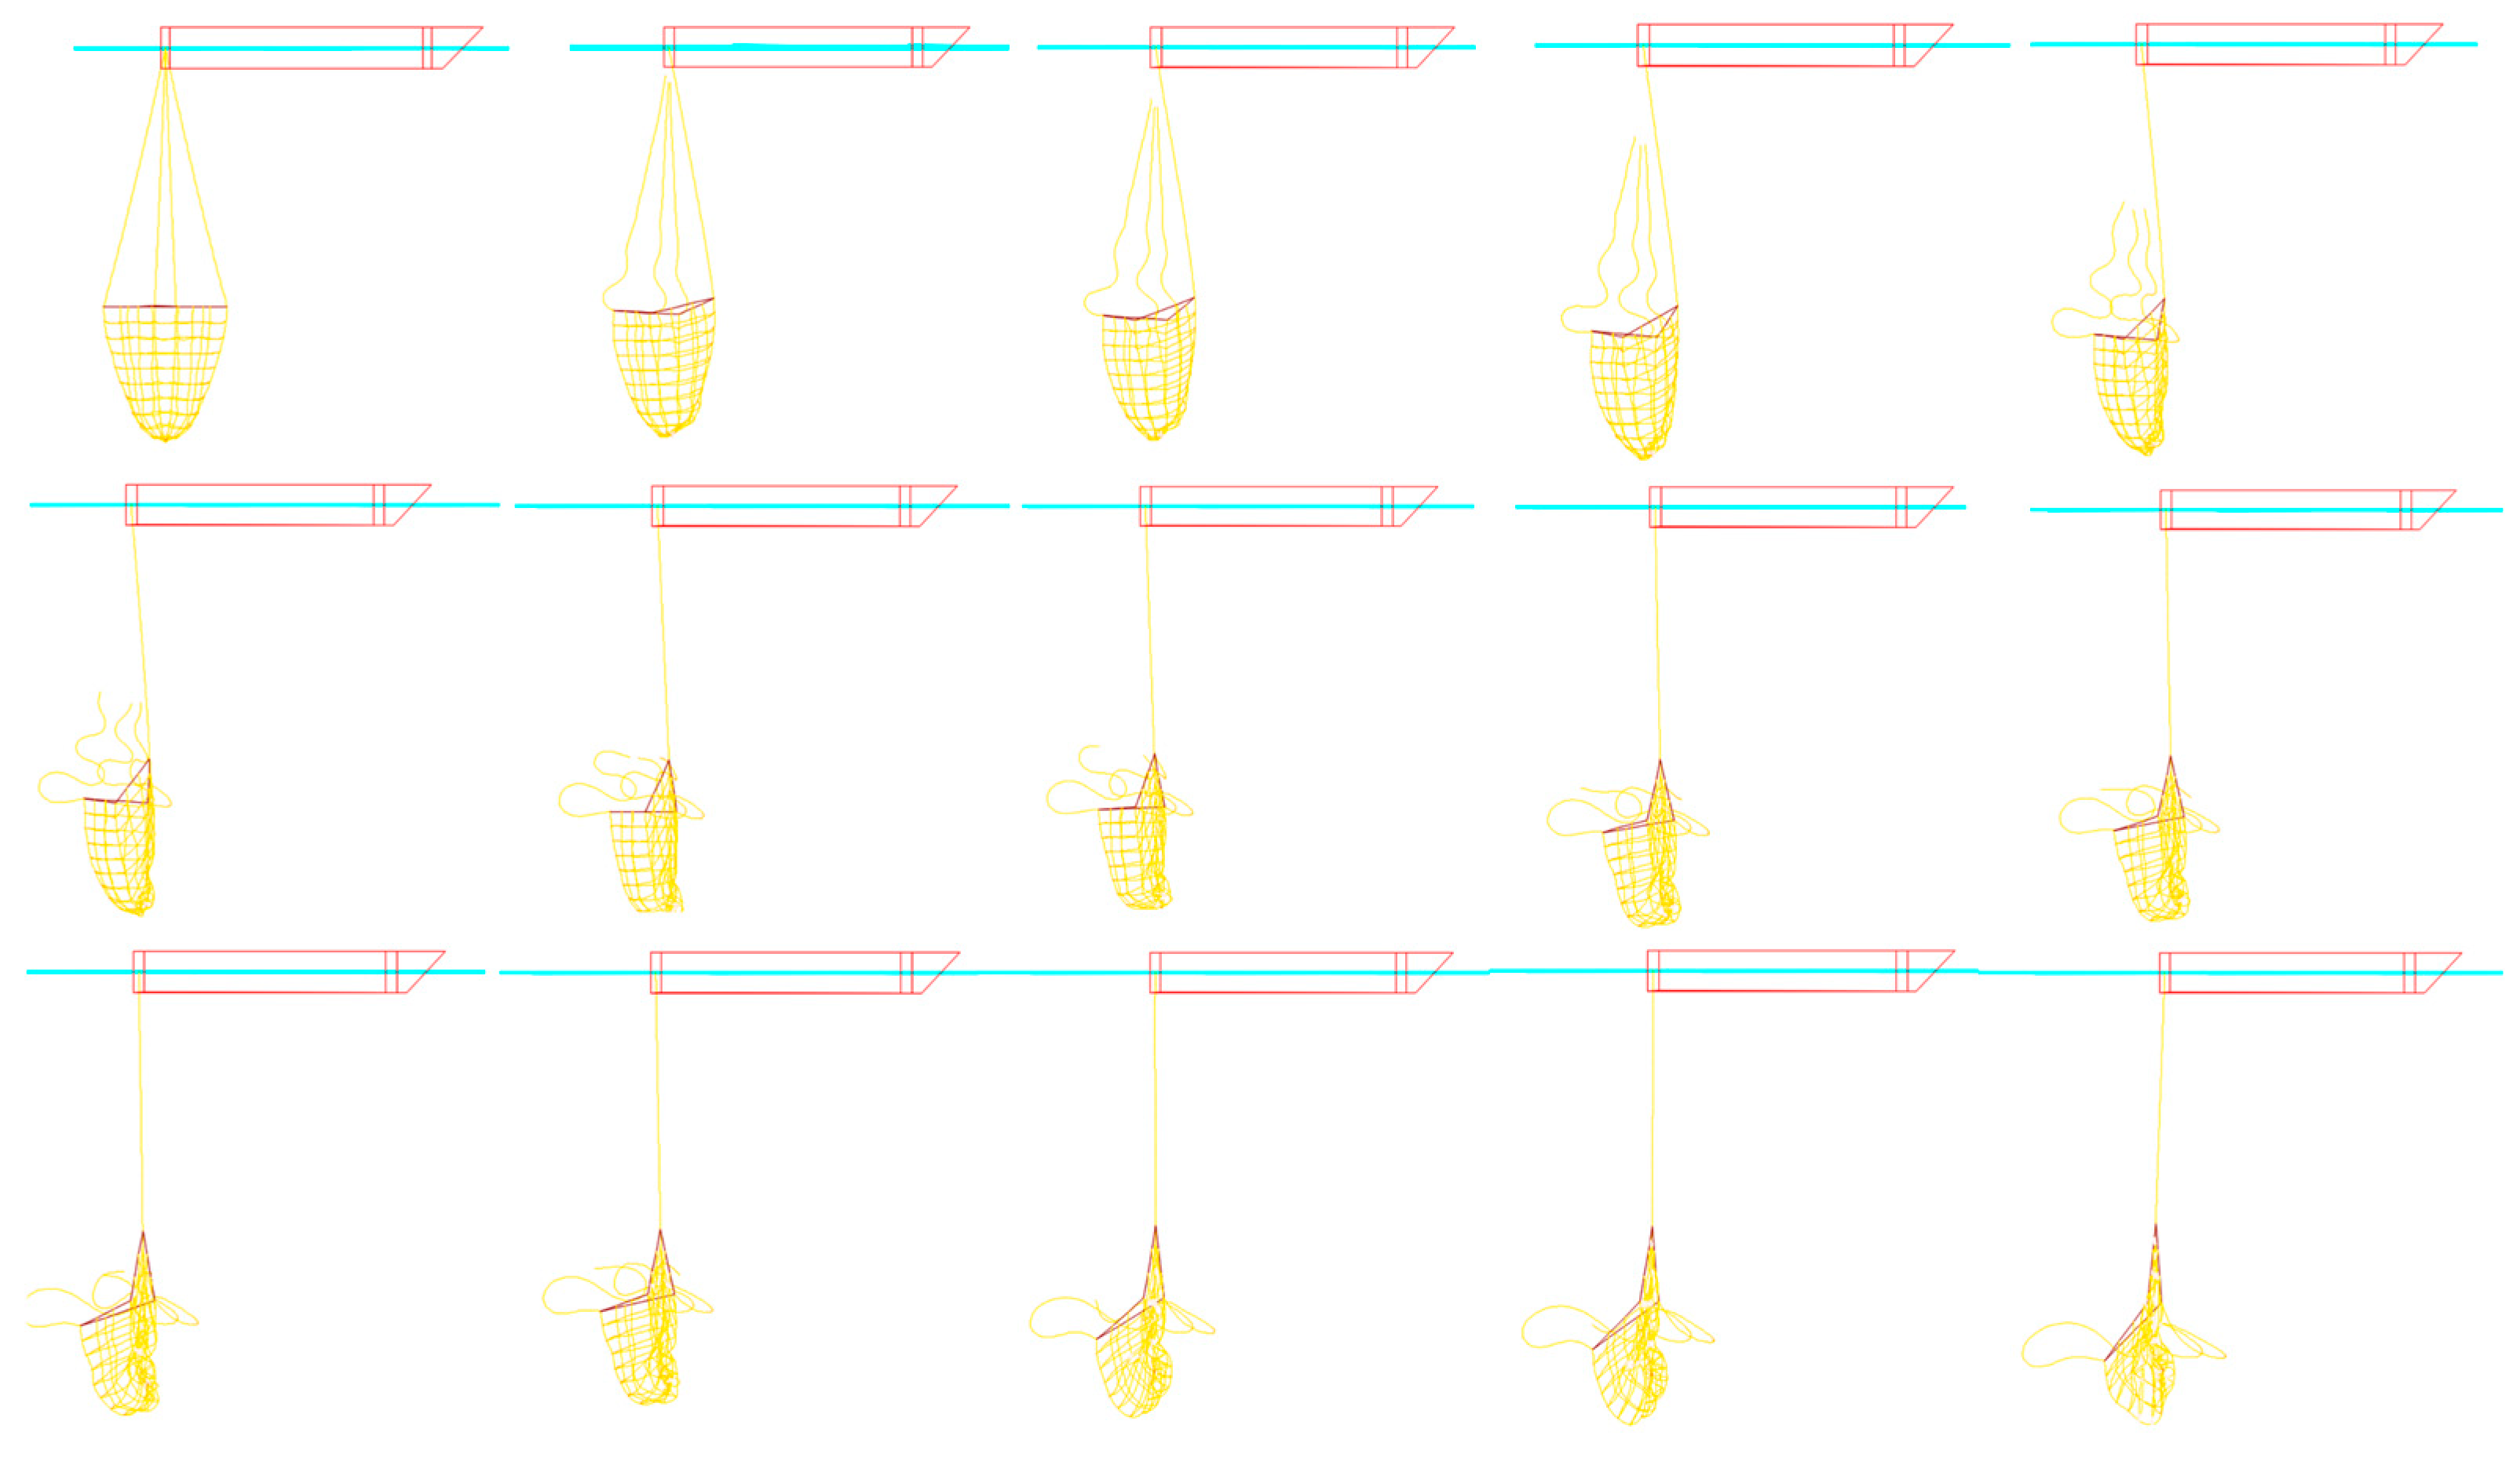
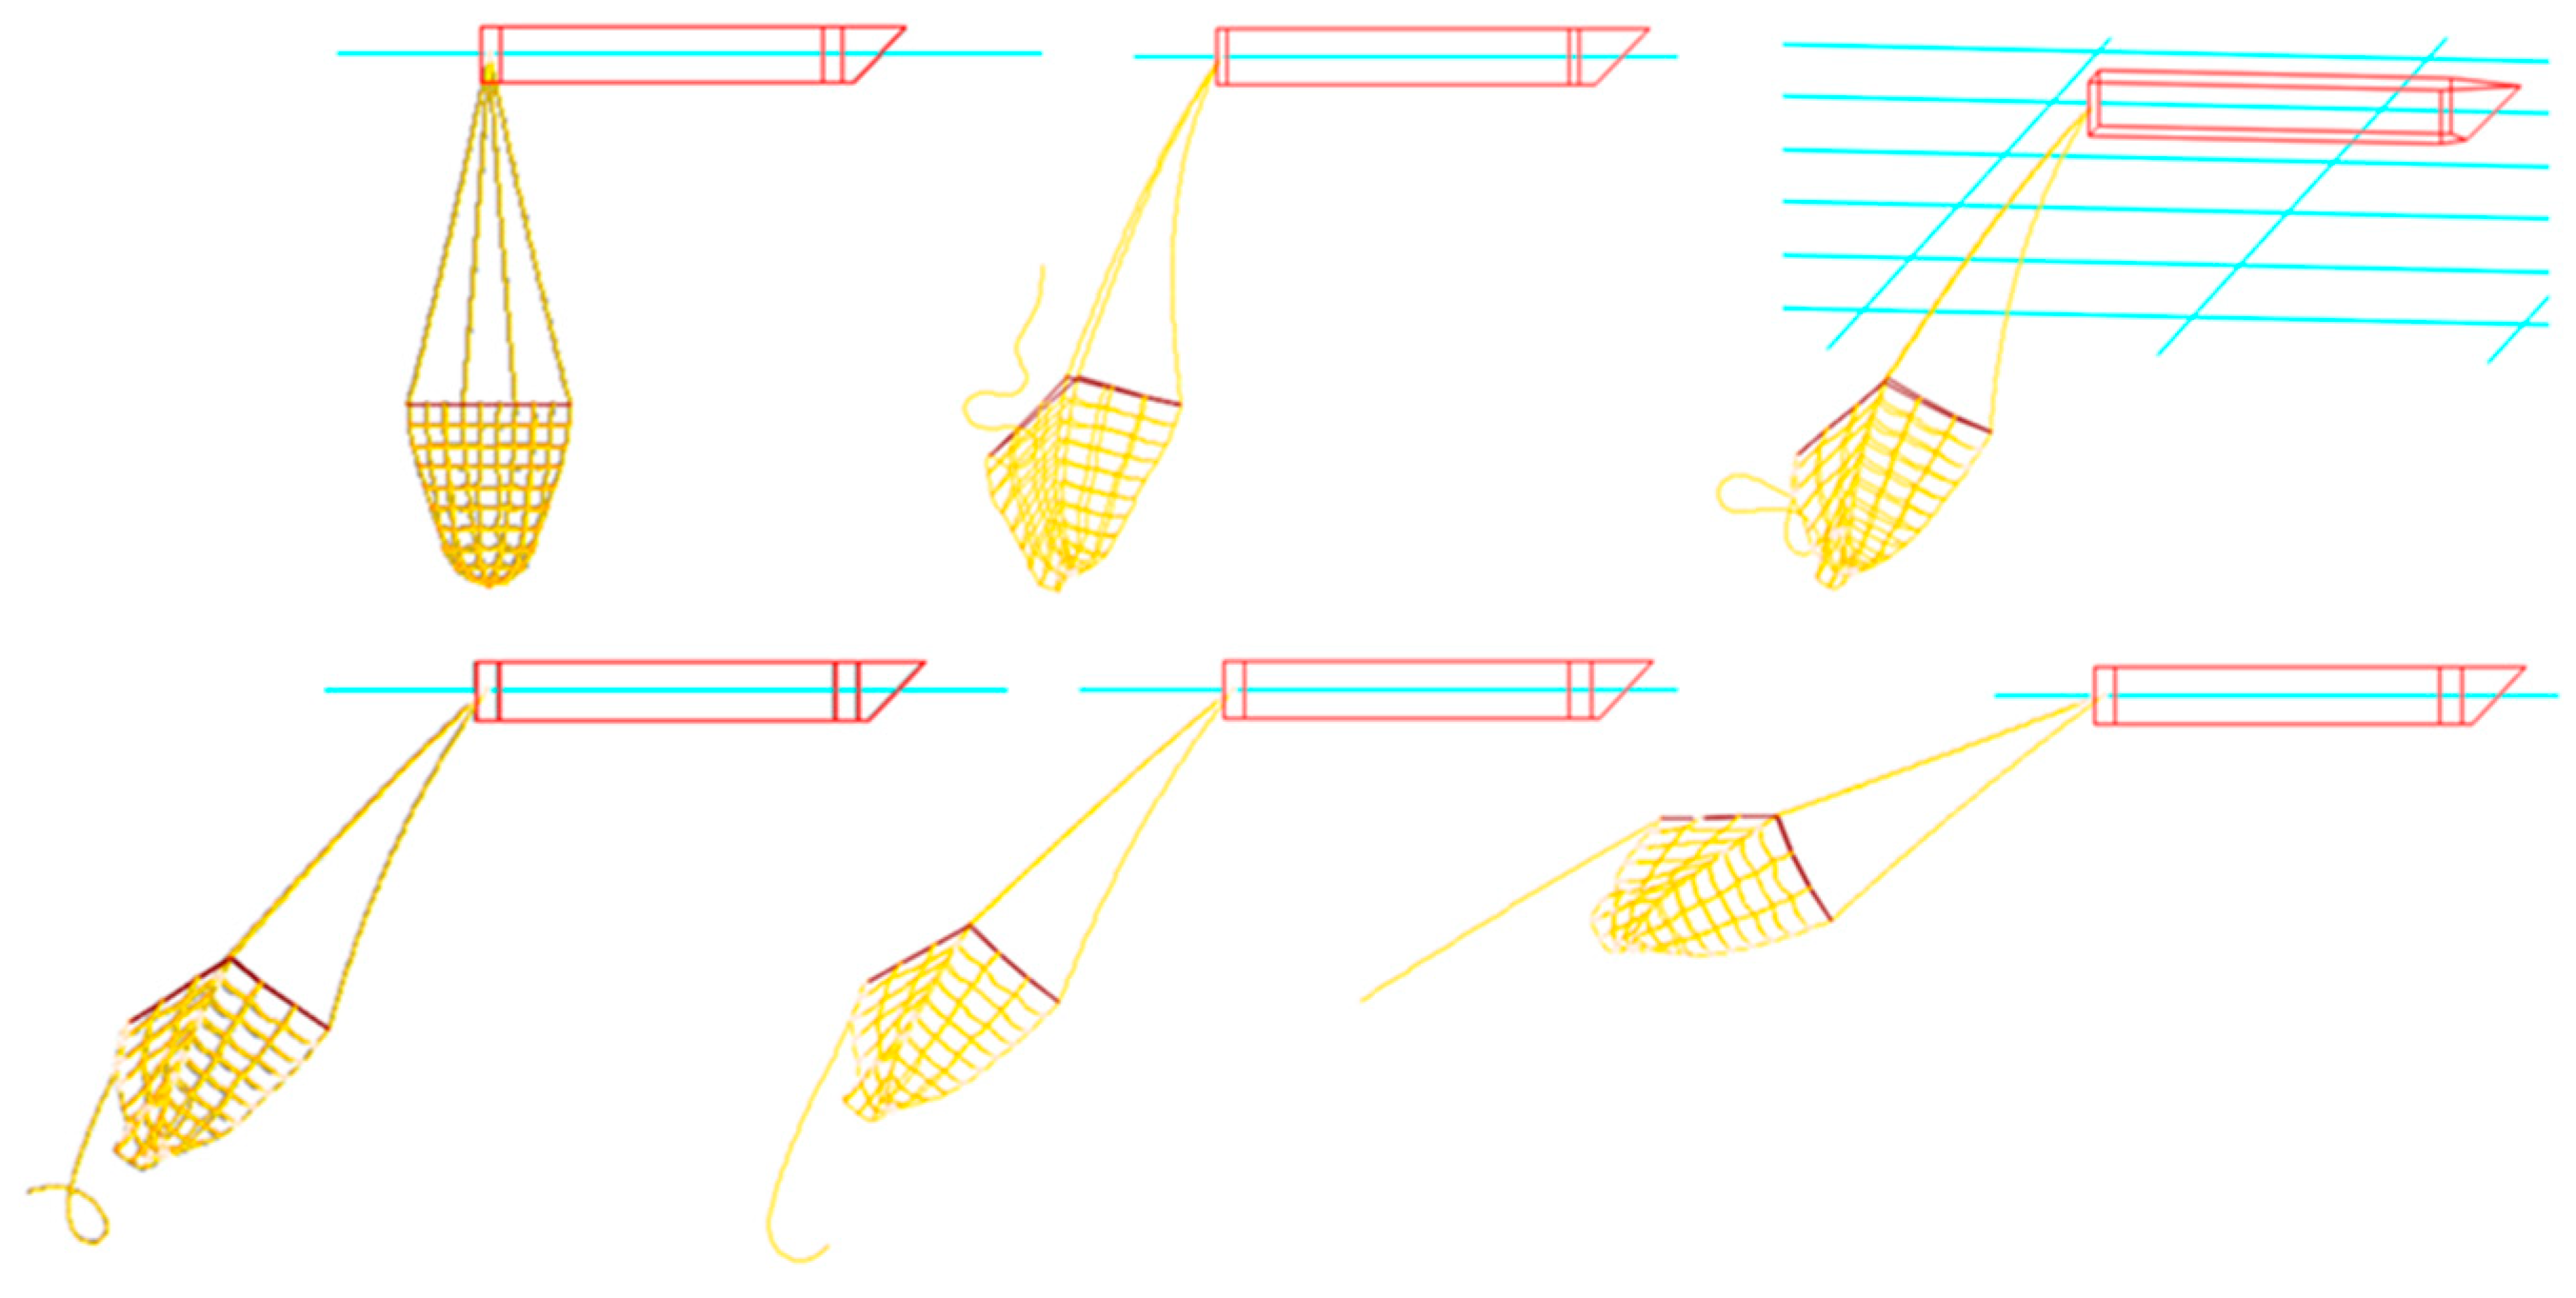
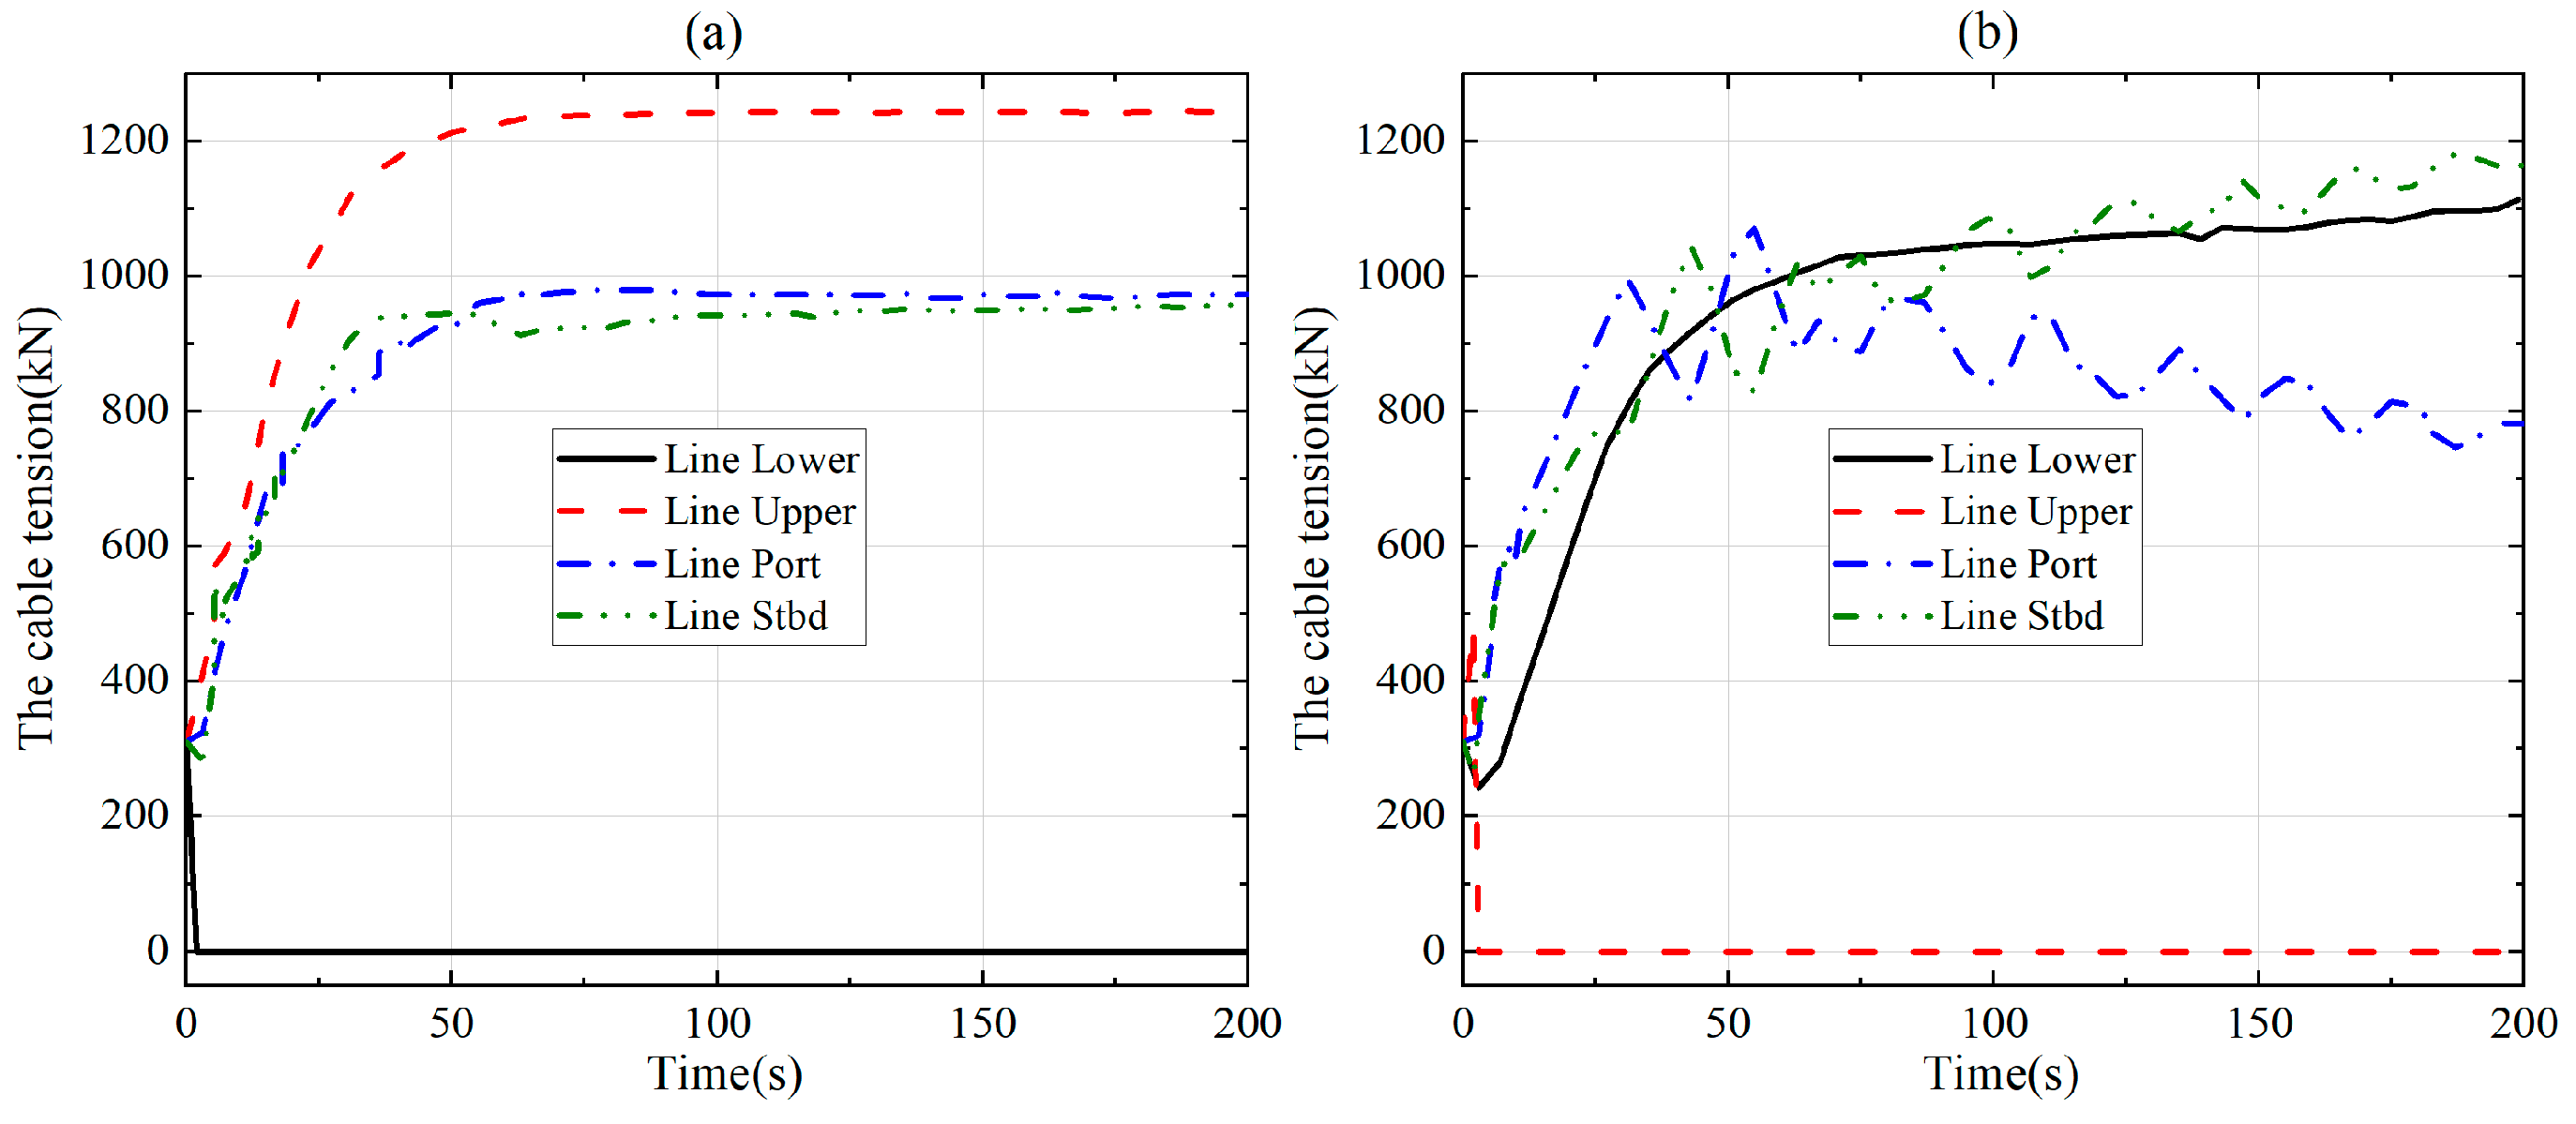
During straight-line towing, the fracture of one line leads to a lack of constraints to maintain the edge center of the rigid frame. If one line breaks, the tension on the other lines will be redistributed. These results provide quantitative guidelines for operational parameter optimization: recommended towing speeds ≤ 4 m/s, angular velocities ≤ 20°/s, and redundant cable designs to mitigate abrupt failures.
Future research could expand on this study through multidimensional approaches. First, dynamic coupled models integrating waves, stratified currents, and seabed topography could systematically analyze trawl stability under complex oceanic conditions (e.g., typhoons or cold surges), particularly focusing on cumulative fatigue damage to cables from extreme weather. Second, machine learning algorithms combined with real-time sensor data could enable adaptive control systems for fracture prediction and the dynamic optimization of towing speed/angular velocity thresholds, enhancing operational safety.

Author Contributions

Conceptualization, D.Z. and B.Z.; methodology, D.Z. and J.Y.; software, B.Z.; validation, D.Z., B.Z. and Y.Z.; formal analysis, D.Z.; investigation, D.Z.; resources, J.Y. and K.Z.; data curation, B.Z.; writing—original draft preparation, D.Z. and B.Z.; writing—review and editing, D.Z., Y.Z. and J.Y.; visualization, Y.Z.; supervision, K.Z. and J.Y.; project administration, D.Z. and J.Y.; funding acquisition, J.Y. All authors have read and agreed to the published version of the manuscript.

Funding

This study was financially supported by the Natural Science Foundation of Guangdong Province (2022A1515011562), Guangdong Provincial Special Fund for promoting high-quality economic development (GDNRC [2021]56, Yuerong Office Letter [2020]161), the Program for Scientific Research Start-up Funds of Guangdong Ocean University (060302072101), the Comparative Study and Optimization of Horizontal Lifting of Subsea Pipeline (2021E05011), and the China Scholarship Council (CSC202306320084).

Institutional Review Board Statement

Not applicable.

Informed Consent Statement

Not applicable.

Data Availability Statement

All data generated and analyzed during this study are included in this published article. The datasets used and analyzed during the current study are available from the corresponding author upon reasonable request.

Conflicts of Interest

The authors declare no conflicts of interest.

References

  1. Clarke, T.M.; Wabnitz, C.C.; Striegel, S.; Frölicher, T.L.; Reygondeau, G.; Cheung, W.W. Aerobic growth index (AGI): An index to understand the impacts of ocean warming and deoxygenation on global marine fisheries resources. Prog. Oceanogr. 2021, 195, 102588. [Google Scholar] [CrossRef]
  2. Bax, N.; Novaglio, C.; Maxwell, K.H.; Meyers, K.; McCann, J.; Jennings, S.; Frusher, S.; Fulton, E.A.; Nursey-Bray, M.; Fischer, M.; et al. Ocean resource use: Building the coastal blue economy. Rev. Fish Biol. Fish. 2021, 32, 189–207. [Google Scholar] [CrossRef]
  3. Zhang, Y.-Z.; Xue, C.; Wang, N.; Chen, G. A comparative study on the measurement of sustainable development of marine fisheries in China. Ocean Coast. Manag. 2023, 247, 106911. [Google Scholar] [CrossRef]
  4. Konar, M.; Ding, H. A sustainable ocean economy for 2050: Approximating its benefits and costs. In The Blue Compendium: From Knowledge to Action for a Sustainable Ocean Economy; Springer International Publishing: Cham, Switzerland, 2023; pp. 681–714. [Google Scholar]
  5. Zhuang, X.; You, X.; Kumazawa, T.; Ito, S.; Shiode, D.; Hu, F. Dynamic performance of strategy for transitioning from conventional bottom otter trawling to semi-pelagic trawling through towing tank experiments and numerical simulations. Ocean Eng. 2024, 300, 117436. [Google Scholar] [CrossRef]
  6. Chu, W.; Cui, S.; Zhai, M.; Cao, Y.; Zhang, X. The influence of flow field bottom effect and sand cloud effect on the hydrodynamic performance and stability of bottom trawling otter board under tilted attitudes. Appl. Ocean Res. 2024, 152, 104176. [Google Scholar] [CrossRef]
  7. Zhang, D.; Bai, Y.; Soares, C.G. Dynamic analysis of an array of semi-rigid “sea station” fish cages subjected to waves. Aquac. Eng. 2021, 94, 102172. [Google Scholar] [CrossRef]
  8. Tang, M.F.; Dong, G.H.; Xu, T.J.; Zhao, Y.P.; Bi, C.W. Numerical simulation of the drag force on the trawl net. Turk. J. Fish. Aquat. Sci. 2017, 17, 1219–1230. [Google Scholar]
  9. Thierry, N.N.B.; Tang, H.; Achille, N.P.; Xu, L.; Hu, F. Unsteady turbulent flow developing inside and around different parts of fluttering trawl net in flume tank. J. Fluids Struct. 2021, 108, 103451. [Google Scholar] [CrossRef]
  10. Nyatchouba Nsangue, B.T.; Tang, H.; Liu, W.; Xu, L.; Hu, F. Turbulent flow interacting with flexible trawl net structure including simulation catch in flume tank. Sci. Rep. 2023, 13, 6249. [Google Scholar] [CrossRef]
  11. Thierry, N.N.; Tang, H.; Liuxiong, X.; You, X.; Hu, F.; Achile, N.P.; Kindong, R. Hydrodynamic performance of bottom trawls with different materials, mesh sizes, and twine thicknesses. Fish. Res. 2020, 221, 105403. [Google Scholar] [CrossRef]
  12. Dealteris, J.T.; Recksiek, C.W.; Fahfouhi, A.; Liuxiong, X. Comparison of the Performance of Two Bottom-Sampling Trawls. Trans. Am. Fish. Soc. 1989, 118, 119–130. [Google Scholar] [CrossRef]
  13. Buxton, N.; DeAlteris, J. Quantification of water flow and net drag in midwater trawls. Fish. Res. 1993, 16, 165–178. [Google Scholar] [CrossRef]
  14. Fuxiang, H.; Matuda, K.; Tokai, T.; Kanehiro, H. Dynamic Analysi of Midwater Trawl System by a Two-Dimensional Lumped Mass Method. Fish. Sci. 1995, 61, 229–233. [Google Scholar] [CrossRef]
  15. Sangster, G.I.; Breen, M. Gear performance and catch comparison trials between a single trawl and a twin rigged gear. Fisheries Research 1998, 36, 15–26. [Google Scholar] [CrossRef]
  16. Reite, K.-J.; Sorensen, A. Mathematical Modeling of the Hydrodynamic Forces on a Trawl Door. IEEE J. Ocean. Eng. 2006, 31, 432–453. [Google Scholar] [CrossRef]
  17. Sala, A.; Farran, J.D.P.; Antonijuan, J.; Lucchetti, A. Performance and impact on the seabed of an existing- and an experimental-otterboard: Comparison between model testing and full-scale sea trials. Fish. Res. 2009, 100, 156–166. [Google Scholar] [CrossRef]
  18. Sun, X.; Yin, Y.; Jin, Y.; Zhang, X.; Zhang, X. The modeling of single-boat, mid-water trawl systems for fishing simulation. Fish. Res. 2011, 109, 7–15. [Google Scholar] [CrossRef]
  19. Zhao, Y.-P.; Gui, F.-K.; Xu, T.-J.; Chen, X.-F.; Cui, Y. Numerical analysis of dynamic behavior of a box-shaped net cage in pure waves and current. Appl. Ocean Res. 2013, 39, 158–167. [Google Scholar] [CrossRef]
  20. Zhang, D.; Zhang, Y.; Zhao, B.; Ma, Y.; Si, K. Exploring subsea dynamics: A comprehensive review of underwater pipelines and cables. Phys. Fluids 2024, 36, 101304. [Google Scholar] [CrossRef]
  21. Zhang, D.; Yan, J.; Zhu, K. Hydrodynamic characteristics of deep sea station cage under different failure modes of mooring cables. J. G. Ocean U. 2022, 42, 107–116. (In Chinese) [Google Scholar]
  22. Li, F.; Song, L.; Hua, C.; Zhu, Q. Numerical and experimental investigation on hydrodynamic performance of the stick-held dip net in Pacific saury fishery. Front. Mar. Sci. 2022, 9, 985086. [Google Scholar] [CrossRef]
  23. Liu, Z.; Hu, F.; Wan, R.; Wang, Y.; Guo, S.; Yan, H.; Zhou, C. Hydrodynamic characteristics of frustum-type depressor for sampling midwater trawl. Ocean Eng. 2024, 295, 117009. [Google Scholar] [CrossRef]
  24. Guan, Q.; Zhu, W.; Feng, C.; Chen, F.; Tang, W.; Liu, L.; Chen, J. Hydrodynamic interactions between a sorting grid and a demersal trawl. Ocean Eng. 2024, 304, 117837. [Google Scholar] [CrossRef]
  25. Xiong, Z.; Wu, X.; Guo, Y.; Fu, Z. Study on ice resistance of Antarctic krill ship with trawl under floating ice sea conditions. Front. Mar. Sci. 2024, 11, 1357331. [Google Scholar] [CrossRef]
  26. O’Neill, F.; Breddermann, K. The contribution of mesh opening angle to the drag of netting panels. Ocean Eng. 2024, 305, 117959. [Google Scholar] [CrossRef]
  27. Tang, H.; Thierry, N.N.B.; Pandong, A.N.; Sun, Q.; Xu, L.; Hu, F.; Zou, B. Hydrodynamic and turbulence flow characteristics of fishing nettings made of three twine materials at small attack angles and low Reynolds numbers. Ocean Eng. 2022, 249, 110964. [Google Scholar] [CrossRef]
  28. Nsangue, B.T.N.; Tang, H. Flow field and nonlinear dynamics of the gillnet structures under steady flow using a one-way coupling model. Ocean Eng. 2024, 309, 118380. [Google Scholar] [CrossRef]
  29. Li, Y.; Liu, Z.; Wang, Z.; Zhang, X.; Wang, L.; Zhang, Y.; Ma, S.; Qi, G.; Wang, Y. Study on the Hydrodynamic Performance of the Beam Used in the Antarctic Krill Beam Trawl. Fishes 2023, 9, 17. [Google Scholar] [CrossRef]
  30. Rijnsdorp, A.D.; Depestele, J.; Molenaar, P.; Eigaard, O.R.; Ivanović, A.; O’neill, F.G. Sediment mobilization by bottom trawls: A model approach applied to the Dutch North Sea beam trawl fishery. ICES J. Mar. Sci. 2021, 78, 1574–1586. [Google Scholar] [CrossRef]
  31. He, R.; Zheng, H.; Ma, S.; Wu, Y.; Yang, S.; Dai, Y.; Wang, Y. Hydrodynamic simulation and experiment of depth adjustable beam trawl for Antarctic krill. J. Mar. Sci. Technol. 2023, 28, 399–409. [Google Scholar] [CrossRef]
  32. Sen, D. A Study on Sensitivity of Maneuverability Performance on the Hydrodynamic Coefficients for Submerged Bodies. J. Ship Res. 2000, 44, 186–196. [Google Scholar] [CrossRef]
  33. Kristiansen, D.; Faltinsen, O.M. Non-linear wave-induced motions of cylindrical-shaped floaters of fish farms. Proc. Inst. Mech. Eng. Part M J. Eng. Marit. Environ. 2009, 223, 361–375. [Google Scholar] [CrossRef]
  34. Orcina. OrcaFlex Manual 2015. Available online: http://www.orcina.com/SoftwareProducts/OrcaFlex/Validation/index/.pdf (accessed on 25 December 2024).
  35. Suzuki, K.; Takagi, T.; Shimizu, T.; Hiraishi, T.; Yamamoto, K.; Nashimoto, K. Validity and visualization of a numerical model used to determine dynamic configurations of fishing nets. Fish. Sci. 2003, 69, 695–705. [Google Scholar] [CrossRef]
Figure 1. A typical beam trawl held open by a steel bar, with shoes on each end.
Jmse 13 00586 g001
Figure 2. Structure of the article.
Jmse 13 00586 g002
Figure 3. The model with aggregated mass.
Jmse 13 00586 g003
Figure 4. The equivalent model of the net.
Jmse 13 00586 g004
Figure 5. The load on the net.
Jmse 13 00586 g005
Figure 6. The beam trawl.
Jmse 13 00586 g006
Figure 7. The tug and beam trawl in OrcaFlex.
Jmse 13 00586 g007
Figure 8. The representation of the validation model.
Jmse 13 00586 g008
Figure 9. The analysis examines the flow components influencing the loads on the steel rod: (a) type A; (b) type B; and (c) type C [35].
Jmse 13 00586 g009
Figure 10. The study investigates the tension forces specific to net type A [35].
Jmse 13 00586 g010
Figure 11. The study investigates the tension forces specific to net type B [35].
Jmse 13 00586 g011
Figure 12. The study investigates the tension forces specific to net type C [35].
Jmse 13 00586 g012
Figure 13. The time-domain representation of line tension in straight-line towing includes the following: (a) Line Lower; (b) Line Upper; (c) Line Port; and (d) Line Stbd.
Jmse 13 00586 g013
Figure 14. The trawl’s shape evolution during straight-line towing at a velocity of 1 m/s.
Jmse 13 00586 g014
Figure 15. The trawl’s shape evolution during straight-line towing at a velocity of 2 m/s.
Jmse 13 00586 g015
Figure 16. The trawl’s shape evolution during straight-line towing at a velocity of 3 m/s.
Jmse 13 00586 g016
Figure 17. The trawl’s shape evolution during straight-line towing at a velocity of 4 m/s.
Jmse 13 00586 g017
Figure 18. The trawl’s shape evolution during straight-line towing at a velocity of 5 m/s.
Jmse 13 00586 g018
Figure 19. The temporal dynamics of line tension during rotational towing with a constant turning radius: (a) Line Lower; (b) Line Upper; (c) Line Port; and (d) Line Stbd.
Jmse 13 00586 g019
Figure 20. Large deformation of trawl when the angular velocity is 57.3°/s.
Jmse 13 00586 g020
Figure 21. Morphological alterations in the trawl during rotational towing with a constant turning radius at a velocity of 1 m/s.
Jmse 13 00586 g021
Figure 22. Morphological alterations in the trawl during rotational towing with a constant turning radius at a velocity of 2 m/s.
Jmse 13 00586 g022
Figure 23. Morphological alterations in the trawl during rotational towing with a constant turning radius at a velocity of 3 m/s.
Jmse 13 00586 g023
Figure 24. Morphological alterations in the trawl during rotational towing with a constant turning radius at a velocity of 4 m/s.
Jmse 13 00586 g024
Figure 25. Morphological alterations in the trawl during rotational towing with a constant turning radius at a velocity of 5 m/s.
Jmse 13 00586 g025
Figure 26. The graphical representation of line tension over time during rotational towing at a steady angular velocity: (a) Line Lower; (b) Line Upper; (c) Line Port; and (d) Line Stbd.
Jmse 13 00586 g026
Figure 27. Morphological alterations in the trawl with a constant angular velocity at v = 1 m/s.
Jmse 13 00586 g027
Figure 28. Morphological alterations in the trawl with a constant angular velocity at v = 2 m/s.
Jmse 13 00586 g028
Figure 29. Morphological alterations in the trawl with a constant angular velocity at v = 3 m/s.
Jmse 13 00586 g029
Figure 30. Morphological alterations in the trawl with a constant angular velocity at v = 4 m/s.
Jmse 13 00586 g030
Figure 31. Morphological alterations in the trawl with a constant angular velocity at v = 5 m/s.
Jmse 13 00586 g031
Figure 32. Shape changes in the trawl in case of fracture failure of Line Lower.
Jmse 13 00586 g032
Figure 33. Shape changes in the trawl in case of fracture failure of Line Upper.
Jmse 13 00586 g033
Figure 34. Shape changes in the trawl in case of fracture failure of Line Port.
Jmse 13 00586 g034
Figure 35. Shape changes in the trawl in case of fracture failure of Line Stbd.
Jmse 13 00586 g035
Figure 36. Shape changes in the trawl in case of fracture failure of Line Lower and Line Upper.
Jmse 13 00586 g036
Figure 37. Shape changes in the trawl in case of fracture failure of Line Port and Line Stbd.
Jmse 13 00586 g037
Figure 38. Shape changes in the trawl in case of fracture failure of Line Port and Line Lower.
Jmse 13 00586 g038
Figure 39. Shape changes in the trawl in case of fracture failure of Line Port and Line Upper.
Jmse 13 00586 g039
Figure 40. Shape changes in the trawl in case of fracture failure of Line Stbd and Line Lower.
Jmse 13 00586 g040
Figure 41. Shape changes in the trawl in case of fracture failure of Line Stbd and Line Upper.
Jmse 13 00586 g041
Figure 42. Shape changes in the trawl in case of fracture failure of Line Upper, Line Port, and Line Stbd.
Jmse 13 00586 g042
Figure 43. Shape changes in the trawl in case of fracture failure of Line Lower during straight-line towing.
Jmse 13 00586 g043
Figure 44. Shape changes in the trawl in case of fracture failure of Line Upper during straight-line towing.
Jmse 13 00586 g044
Figure 45. The tension calculation results after one line breaks: (a) Line Lower; (b) Line Upper.
Jmse 13 00586 g045
Table 1. Three types of nylon nets.
Net TypeTwine Diameter (mm)Mesh Size (mm)Total Mass (g)
A0.348759.91
B0.3485014.68
C0.3484022.31
Table 2. Validation results and errors [32].
Loads on the Steel Rod/(gw)
VelocityType AType BType C
SimulationExperimentErrorSimulationExperimentErrorSimulationExperimentError
16.1034.5531.639.23%49.8547.953.95%72.9267.218.49%
19.5047.6243.2710.07%61.2856.228.99%91.0086.115.68%
23.7064.3459.987.27%93.1587.416.57%127.98123.903.29%
28.0072.7069.784.19%121.81112.228.55%157.62148.586.08%
32.4091.9389.732.45%143.47135.835.62%186.38178.974.14%
36.90122.79119.872.44%183.56170.867.43%229.06218.394.89%
40.90164.58160.222.72%215.43208.433.36%288.20261.9710.01%
Loads at position 1/(gw)
16.108.638.550.98%16.8715.0612.04%8.56 9.13 −6.28%
19.5010.8311.93−9.22%20.9925.11−16.39%10.96 9.96 10.04%
23.7012.8712.284.79%24.6227.08−9.11%13.03 12.03 8.31%
28.0016.0017.53−8.72%30.0534.82−13.70%20.07 22.14 −9.33%
32.4019.7317.7810.96%34.6635.33−1.89%28.28 29.02 −2.57%
36.9025.5026.01−1.97%44.2244.72−1.13%29.76 27.44 8.45%
40.9031.5131.86−10.8%59.3758.072.25%32.09 31.34 2.38%
Loads at position 2/(gw)
16.103.864.69−17.61%3.954.94−19.98%3.17 2.27 39.78%
19.505.856.58−11.03%6.346.92−8.38%6.62 10.85 −38.97%
23.704.936.92−28.73%7.8011.92−34.57%8.55 16.37 −47.74%
28.005.757.74−25.63%9.308.795.82%10.73 10.09 6.30%
32.406.048.03−24.75%10.669.4712.58%22.01 21.10 4.27%
36.907.749.68−20.04%13.3211.9911.07%29.06 29.06 0.00%
40.9013.9415.83−11.95%16.6913.3824.67%36.87 34.82 5.87%
Loads at position 3/(gw)
16.104.414.99−11.66%8.7914.51−39.40%8.49 9.90 −14.28%
19.503.693.0122.57%9.099.98−8.97%10.02 10.26 −2.38%
23.705.533.2072.80%9.779.96−1.89%13.56 12.15 11.64%
28.003.883.2519.41%10.099.525.93%19.33 18.27 5.82%
32.406.316.014.88%10.3012.30−16.28%26.28 24.99 5.19%
36.908.499.03−5.92%10.4610.153.08%33.35 31.94 4.43%
40.9015.7714.0312.45%11.3610.904.21%38.89 38.66 0.60%
Disclaimer/Publisher’s Note: The statements, opinions and data contained in all publications are solely those of the individual author(s) and contributor(s) and not of MDPI and/or the editor(s). MDPI and/or the editor(s) disclaim responsibility for any injury to people or property resulting from any ideas, methods, instructions or products referred to in the content.

