1. Introduction
The ocean is a vital environment for human activities and sustenance, and the exploration and development of the ocean have always attracted significant attention. The seafloor constitutes a crucial part of the ocean [
1]. As the foundation of the ocean, the seafloor is a core area for key processes such as global plate tectonics, ocean current movement, and sediment deposition. The seafloor environment records important geological history, such as the trajectory of crustal movements, long-term trends in climate change, and the evolution of deep-sea ecosystems. In addition, the seafloor harbors a vast amount of untapped resources that have significant economic and strategic value [
2]. Studying the seafloor is not only key to understanding the overall ocean system but also an essential requirement for promoting resource development, disaster early warning, and environmental protection [
3]. In seafloor research, the study of seafloor topography and geomorphology is particularly important. Seafloor topography and geomorphology directly influence the distribution of seafloor ecosystems, ocean current paths, and sediment movement patterns. Classifying geomorphological units such as mid-ocean ridges, ocean trenches, deep-sea plains, and seamounts can reveal the seafloor’s structure and resource distribution characteristics.
Before the emergence of modern surveying technologies, the study of seafloor topography and geomorphology relied on manual detection and hand-drawn mapping. Scholars classified seafloor topography and geomorphology based on limited acoustic survey data and submersible observations. These methods were unsystematic, characterized by scarce and low-precision data, and primarily suited for describing localized topographic features. Classical classification methods are based on expert experience, relying on visual inspection and known geomorphological features [
4]. Advancements in science and technology have led to the emergence of modern surveying techniques. Multi-beam echo sounders and side-scan sonars [
5,
6,
7,
8] were applied to underwater detection, and scholars started researching rule-based segmentation methods. At this time, classification mainly relied on simple topographic features such as depth, elevation, slope, and curvature. Different geomorphological units could be categorized by setting thresholds. Harris et al. [
9] proposed a global seafloor geomorphology classification framework using slope, elevation, and curvature as the main classification features. Luiceer et al. [
10] used the object-based image analysis method, combining multi-beam data and echo intensity data, to perform automated segmentation by setting thresholds and rules. While these methods are straightforward, they lack the capability to analyze complex terrains. Automated segmentation methods based on statistical analysis have also been introduced for seafloor topography classification [
11] to improve accuracy. Such methods achieve automatic classification of geomorphology by analyzing the data distribution patterns of multi-dimensional topographic features. Common methods include cluster analysis (such as K-means clustering), principal component analysis, and Gaussian mixture models. Jung et al. [
12] proposed a clustering method based on inverse histograms that detects peaks and optimizes segmentation parameters to achieve segmentation of topographic point clouds. Cutter et al. [
13] successfully divided the seafloor into multiple classes by extracting texture features from different regions and using fuzzy K-means clustering. These methods improve the accuracy and automation of geomorphological classification via statistical analyses of large datasets but still have limitations when dealing with complex terrains. With the improvement in computational power, machine-learning methods such as support vector machines, decision trees, and random forests have been introduced into seafloor topography and geomorphology classifications [
14,
15,
16,
17,
18]. Machine-learning methods can automatically recognize topographic features by training models, improving classification accuracy. Researchers can label topographic data based on multi-dimensional feature data and then train models to learn the relationships between features and geomorphology, enabling automated classification. Masetti et al. [
19] combined the use of deep-sea detection digital elevation models (DEMs) and acoustic backscatter mosaics to segment the seafloor. Although machine-learning methods have demonstrated potential and application value in seafloor topography and geomorphology, they have drawbacks, such as a dependence on high-quality data and a limited generalization ability.
In recent years, with its rapid development and widespread application, deep learning has shown tremendous advantages in image recognition and segmentation, especially convolutional neural networks, which have performed exceptionally well in processing imagery and point cloud data [
20,
21,
22,
23]. Deep-learning models can undergo end-to-end training with large datasets, automatically learning complex features without relying on manual feature engineering. They have the advantages of good adaptability to complex nonlinear data, a strong generalization ability, and compatibility with multi-source data. However, current research on the automatic recognition and segmentation of seafloor topography and geomorphology using deep-learning methods is relatively limited, with most studies focusing on sediment classification. Therefore, the application of deep learning to seafloor topography and geomorphology segmentation is still immature, facing several prominent issues, such as the lack of mature models, the scarcity of available datasets, and the segmentation scale being too large to effectively apply to secondary or smaller geomorphological units.
YOLO (you only look once: unified, real-time object detection) is an object detection system based on a single neural network proposed by Joseph Redmon, Ali Farhadi, and others in 2015. In 2017, at CVPR, Joseph Redmon and Ali Farhadi published YOLOv2, which further improved detection accuracy and speed [
24]. YOLOv8 builds upon historical versions of the YOLO series and introduces new features and improvements to further enhance its performance and flexibility, making it the best choice for tasks such as object detection, image segmentation, and pose estimation. Its simplicity, speed, and efficiency make it one of the most popular algorithms in computer vision. YOLO-Segment is an extension of the YOLO detection framework designed to handle instance segmentation tasks [
25]. Standard YOLO focuses on detecting and classifying objects using bounding boxes, while YOLO-Segment provides pixel-level masks for individual objects.
To address the challenges faced by deep-learning methods in seafloor topography and geomorphology recognition and segmentation, this paper uses YOLOv8l-Segment as the baseline network [
26] and proposes a seafloor topography and geomorphology image segmentation algorithm based on lightweight upsampling and attention mechanisms (YOLO-SG). Additionally, a dataset called SG-MKD is created. This method optimizes and improves the YOLOv8l-Segment network, enabling automatic recognition and segmentation of geomorphological units, such as seamounts, sea knolls, and submarine depressions. Compared with the baseline network YOLOv8l-Segment, YOLO-SG achieves a 14.7% improvement in the mean average precision, demonstrating superior detection performance and a stronger ability to capture small targets.
2. Methods
To achieve automatic segmentation of seafloor geomorphological units, this study improves on the YOLOv8l-Segment, resulting in a network, YOLO-SG, that performs better in the topography and geomorphology segmentation task. As shown in
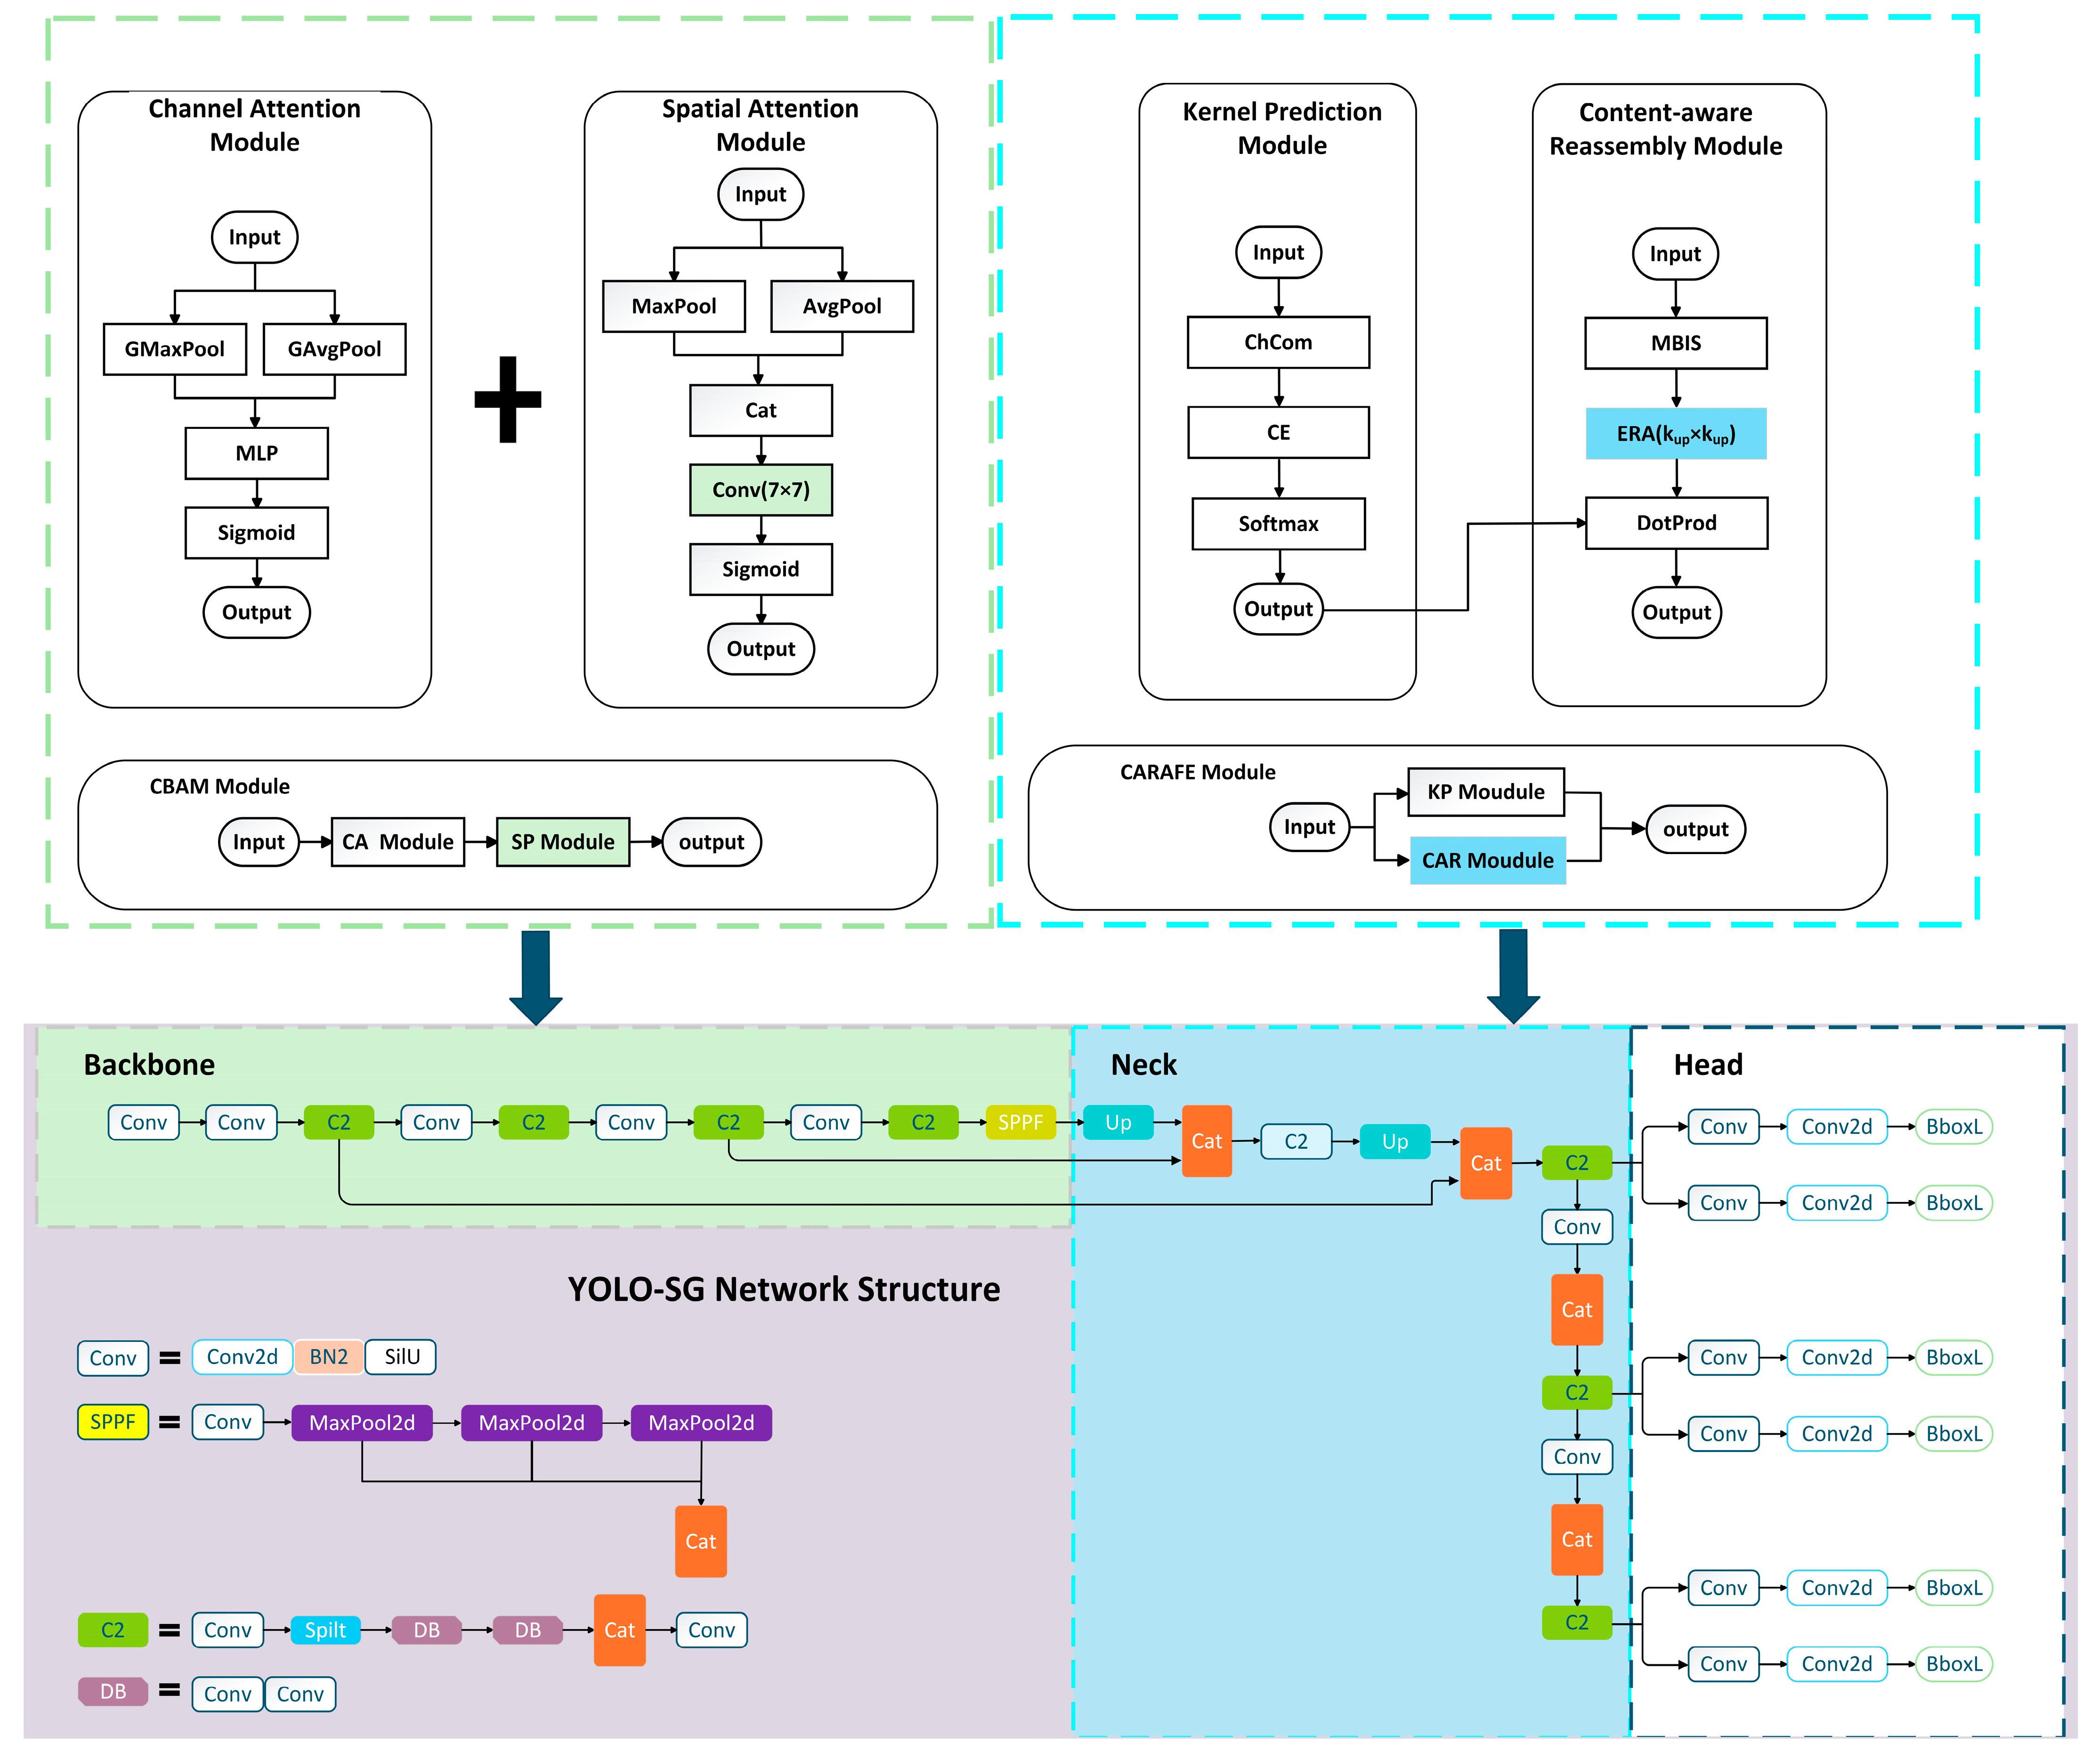
Figure 1, the original YOLOv8l-Segment network consists of three parts: the backbone (main network); the head (output layer); and the neck (intermediate layer). The backbone, the foundation of the model, is responsible for extracting features from the input image. These features serve as the foundation for the subsequent network layers to perform object detection and segmentation. The neck, responsible for multi-scale feature fusion, enhances feature representation by combining feature maps from different stages of the backbone. The head, responsible for the final object detection and classification tasks, includes a detection head and a classification head. YOLO-SG introduces the convolutional block attention module (CBAM) in the backbone network, enhancing the model’s feature extraction capabilities. CBAM improves model performance via adaptive feature recalibration and a dual attention mechanism that includes both channel attention and spatial attention. YOLO-SG introduces the CARAFE operator in the neck network, improving the structure and forming a new network architecture. The CARAFE operator has characteristics such as a large receptive field, sampling kernels that are semantically related to the feature maps, and a lightweight design. It enhances the feature fusion effect of the network without introducing excessive computational overhead.
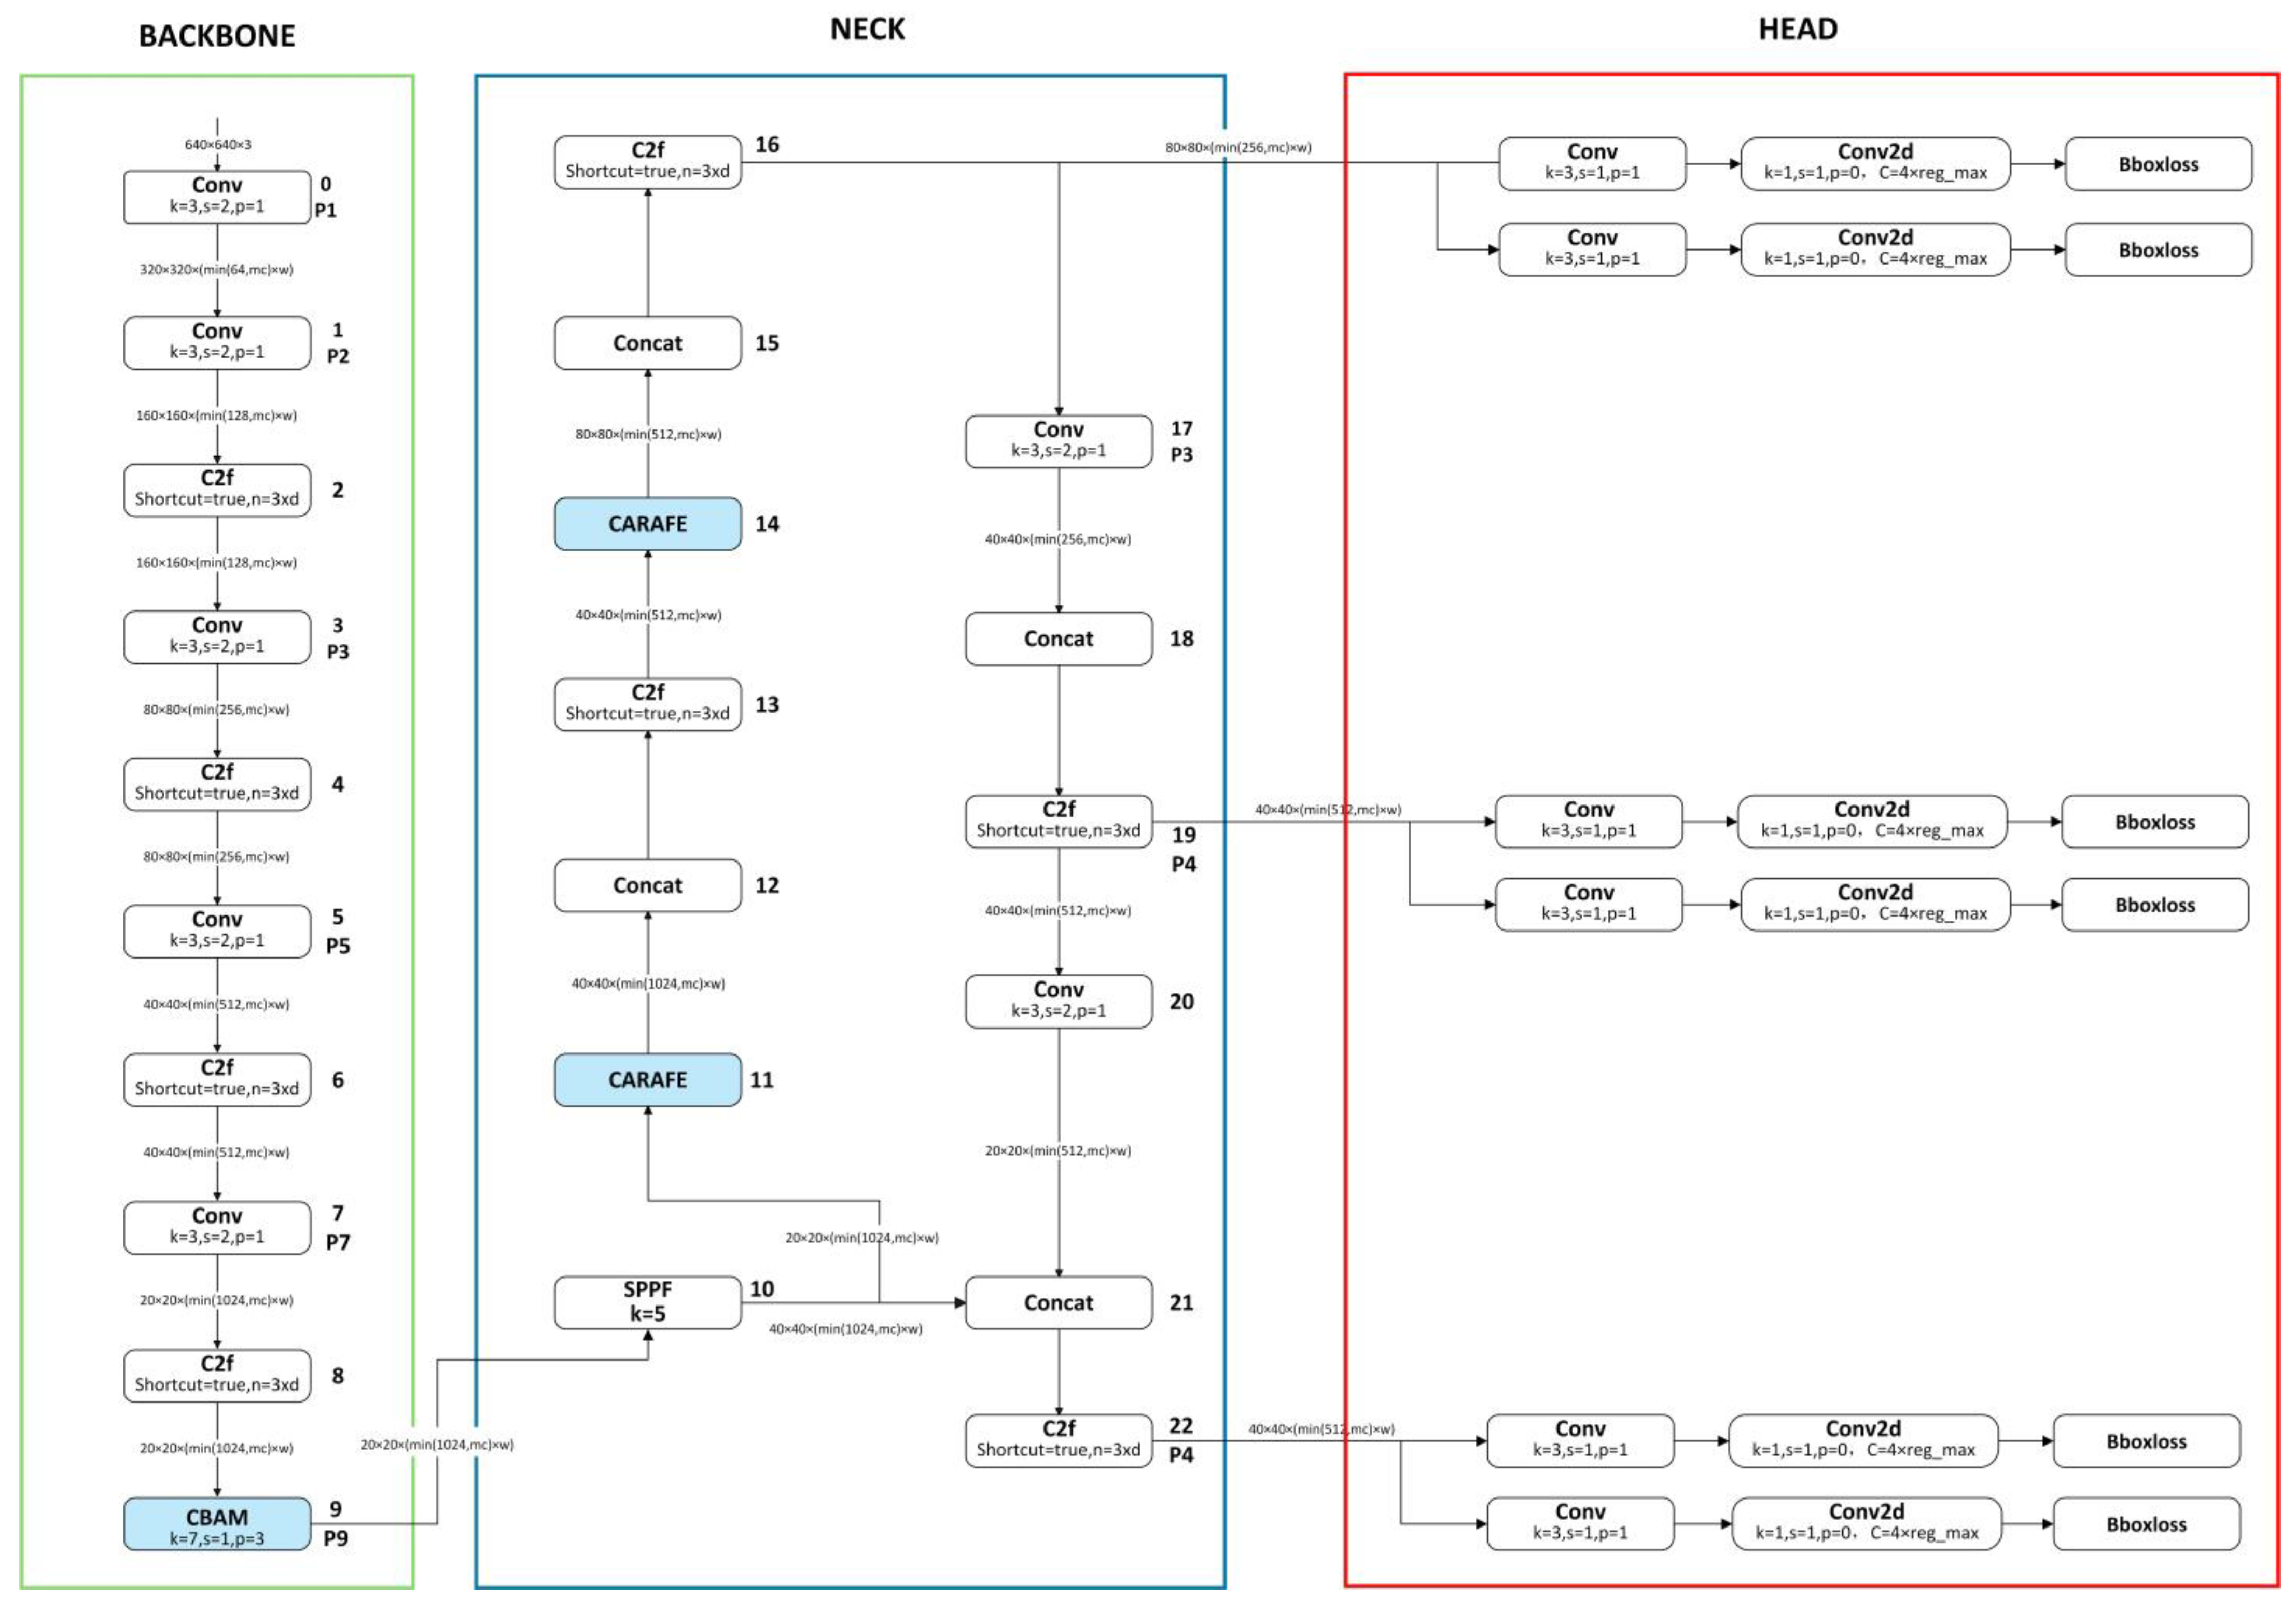
Figure 2 shows the network structure of YOLO-SG.
2.1. Feature Extraction Module Integrated with CBAM
YOLOv8l-Segment was selected as the baseline model for this experiment to achieve the most accurate identification and segmentation of the topography and geomorphology. This model has a significant advantage in accuracy; however, because of its large size, it also consumes considerable computational resources compared with lightweight models. Given the limited number of seafloor topography and geomorphology image samples and their sparse features, the model needs to fully exploit the valuable information within these limited samples to improve the recognition performance as much as possible. Therefore, improvements to the model need to consider two aspects simultaneously: (1) maximizing the feature extraction capability of the backbone network and (2) minimizing computational consumption while achieving a certain level of performance improvement to achieve a high computational efficiency ratio. Accordingly, this study introduces the CBAM attention mechanism into the backbone network and proposes a new backbone network structure. This backbone network structure can effectively enhance the network’s feature extraction capability with a minimal increase in computational consumption.
CBAM was proposed by Woo et al. [
27] in 2018. The design of CBAM introduces an attention mechanism that allows the network to focus more effectively on important channel and spatial location information, thereby enhancing performance in tasks such as object detection, image recognition, and semantic segmentation.
CBAM consists of two main sub-modules, the channel attention module (CAM) [
28] and the spatial attention module [
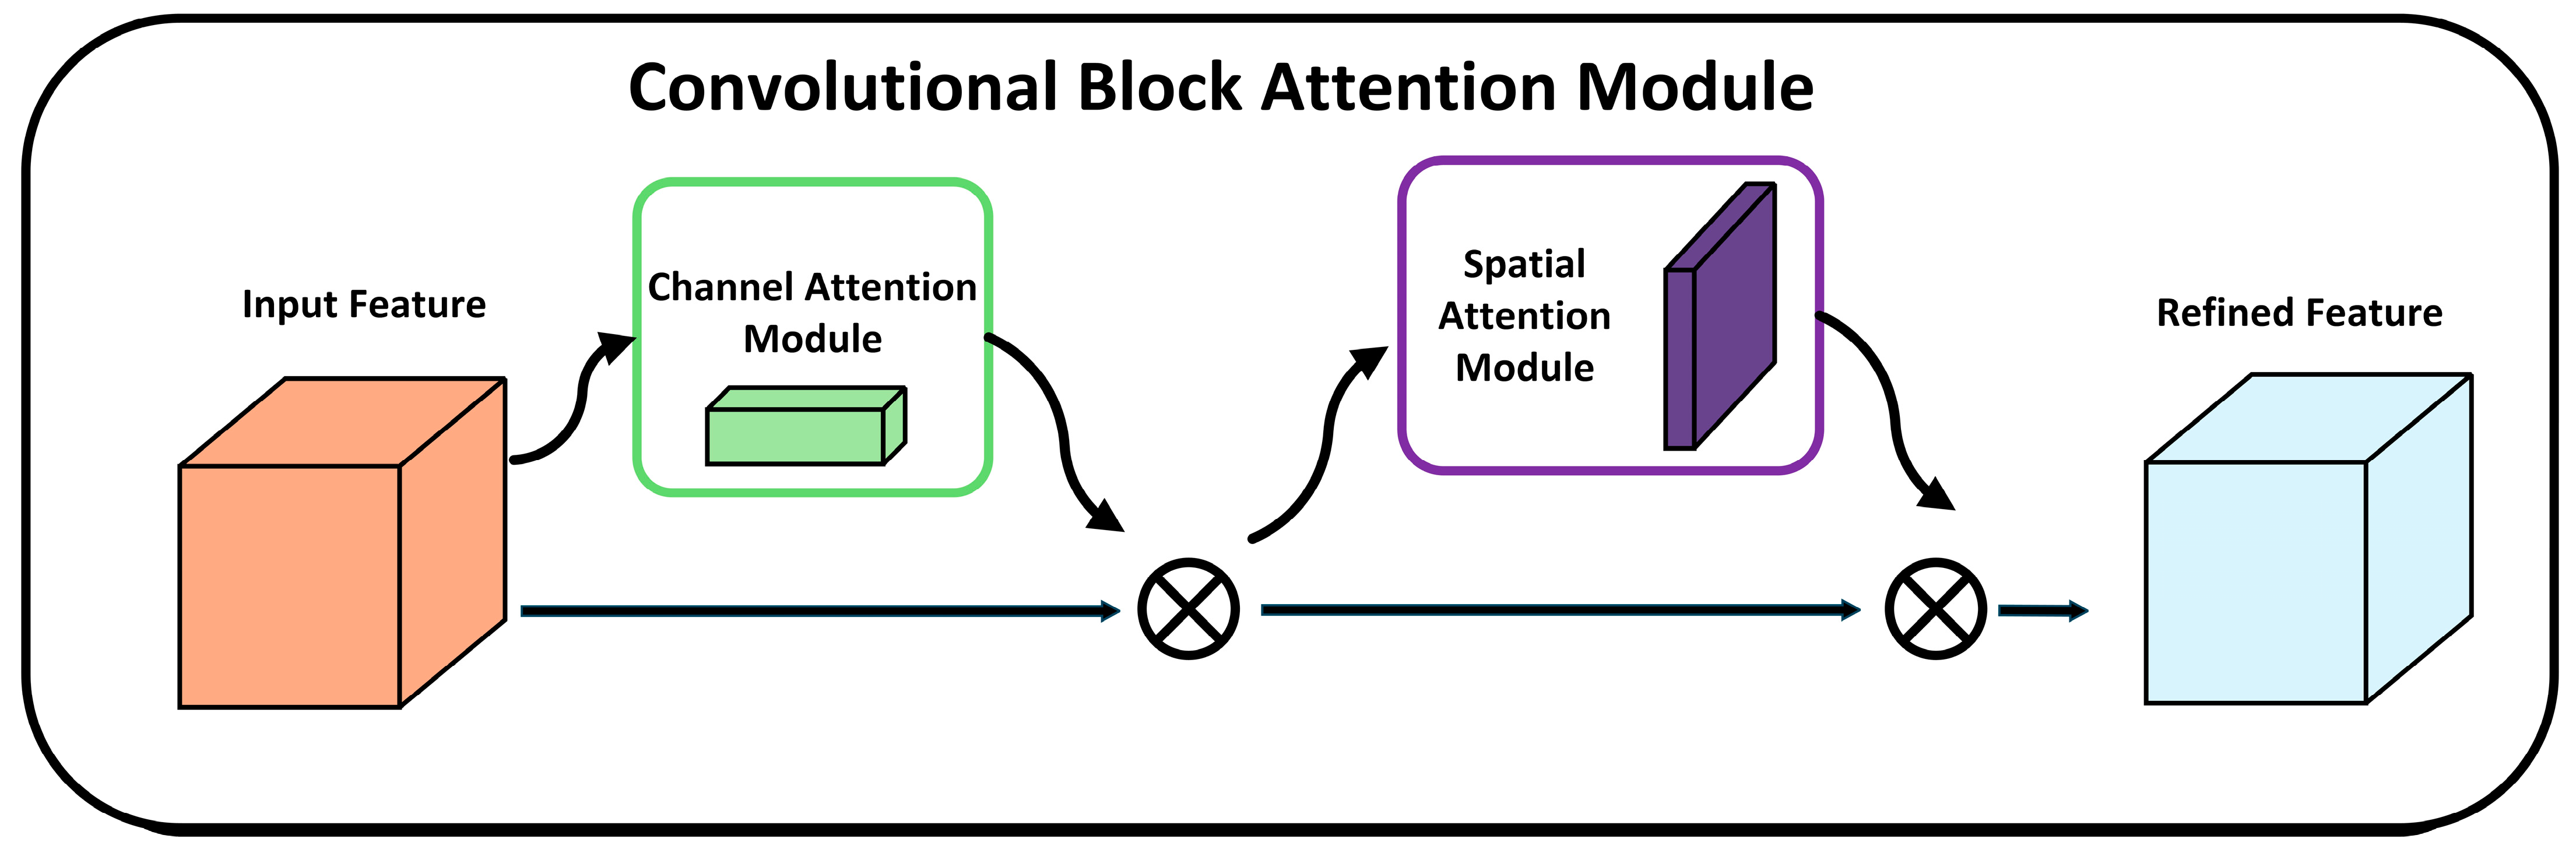
29], that sequentially enhance the input features. The overall structure of CBAM is shown in
Figure 3. The input feature
represents a tensor with
channels,
height, and
width, where each element belongs to the real number domain
. This input first passes through the Channel Attention Module (CAM), where a one-dimensional convolution kernel
is applied. The convolution result of
is multiplied by the original input
, and the resulting feature is then passed as input to the spatial attention module. In the spatial attention module, a two-dimensional convolution
is applied, and the output of this operation is also multiplied by the original input
.
- (1)
Channel attention module (CAM)
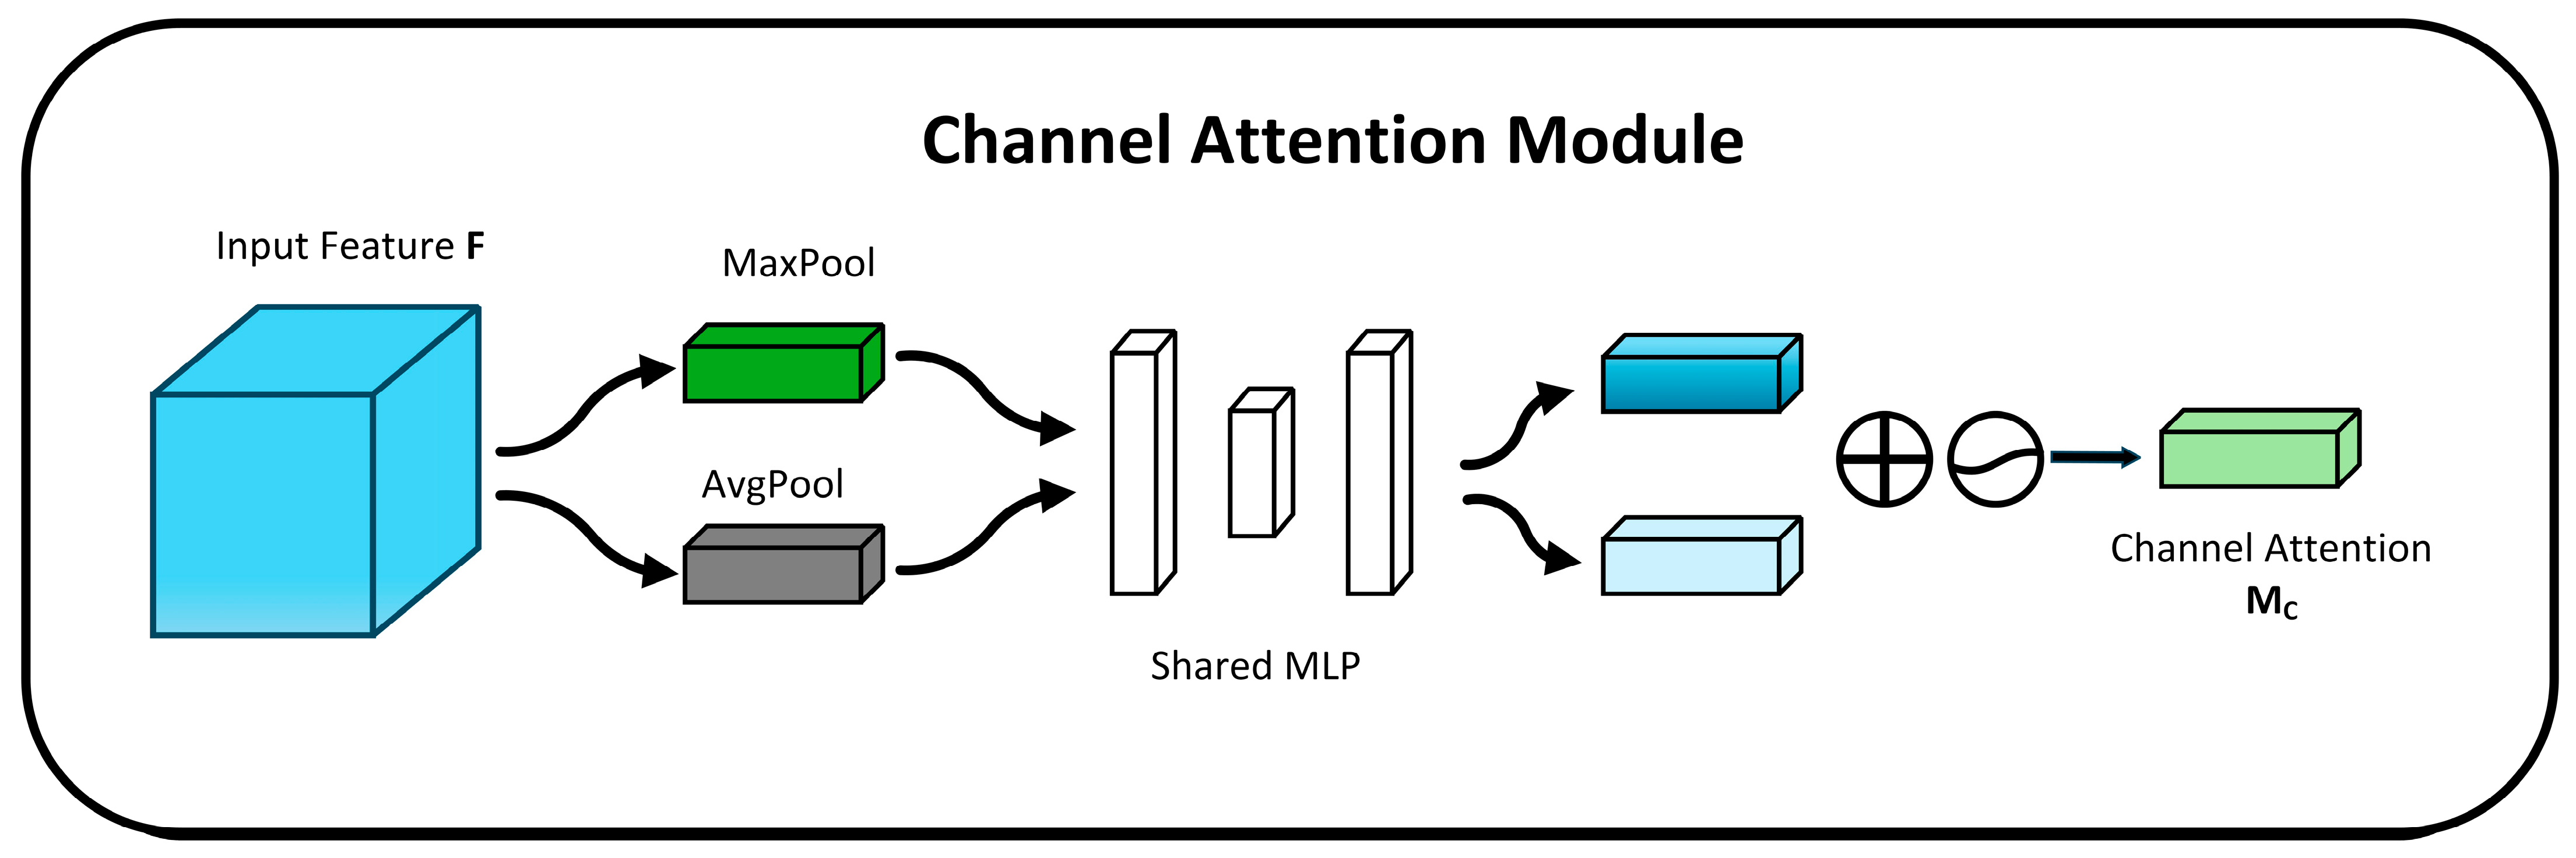
In CAM, the channel dimension remains unchanged, while the spatial dimension is compressed. This module focuses on the meaningful information in the image.
As shown in
Figure 4, the input feature map is passed through two parallel MaxPool and AvgPool layers, reducing the spatial dimensions from C × H × W to C × 1 × 1. Then, it goes through the shared multi-layer perception module. In this module, the channel number is first compressed to 1/
r (where
r is the reduction factor) of the original value and then expanded back to the original channel number. The outputs are activated using the rectified linear unit (ReLU) activation function, resulting in two activated outputs. These two outputs are then element-wise added together, followed by a sigmoid activation function to obtain the channel attention output. Finally, this output is multiplied by the original feature map to restore the dimensions back to C × H × W [
28].
Channel attention mechanism calculation formula:
- (2)
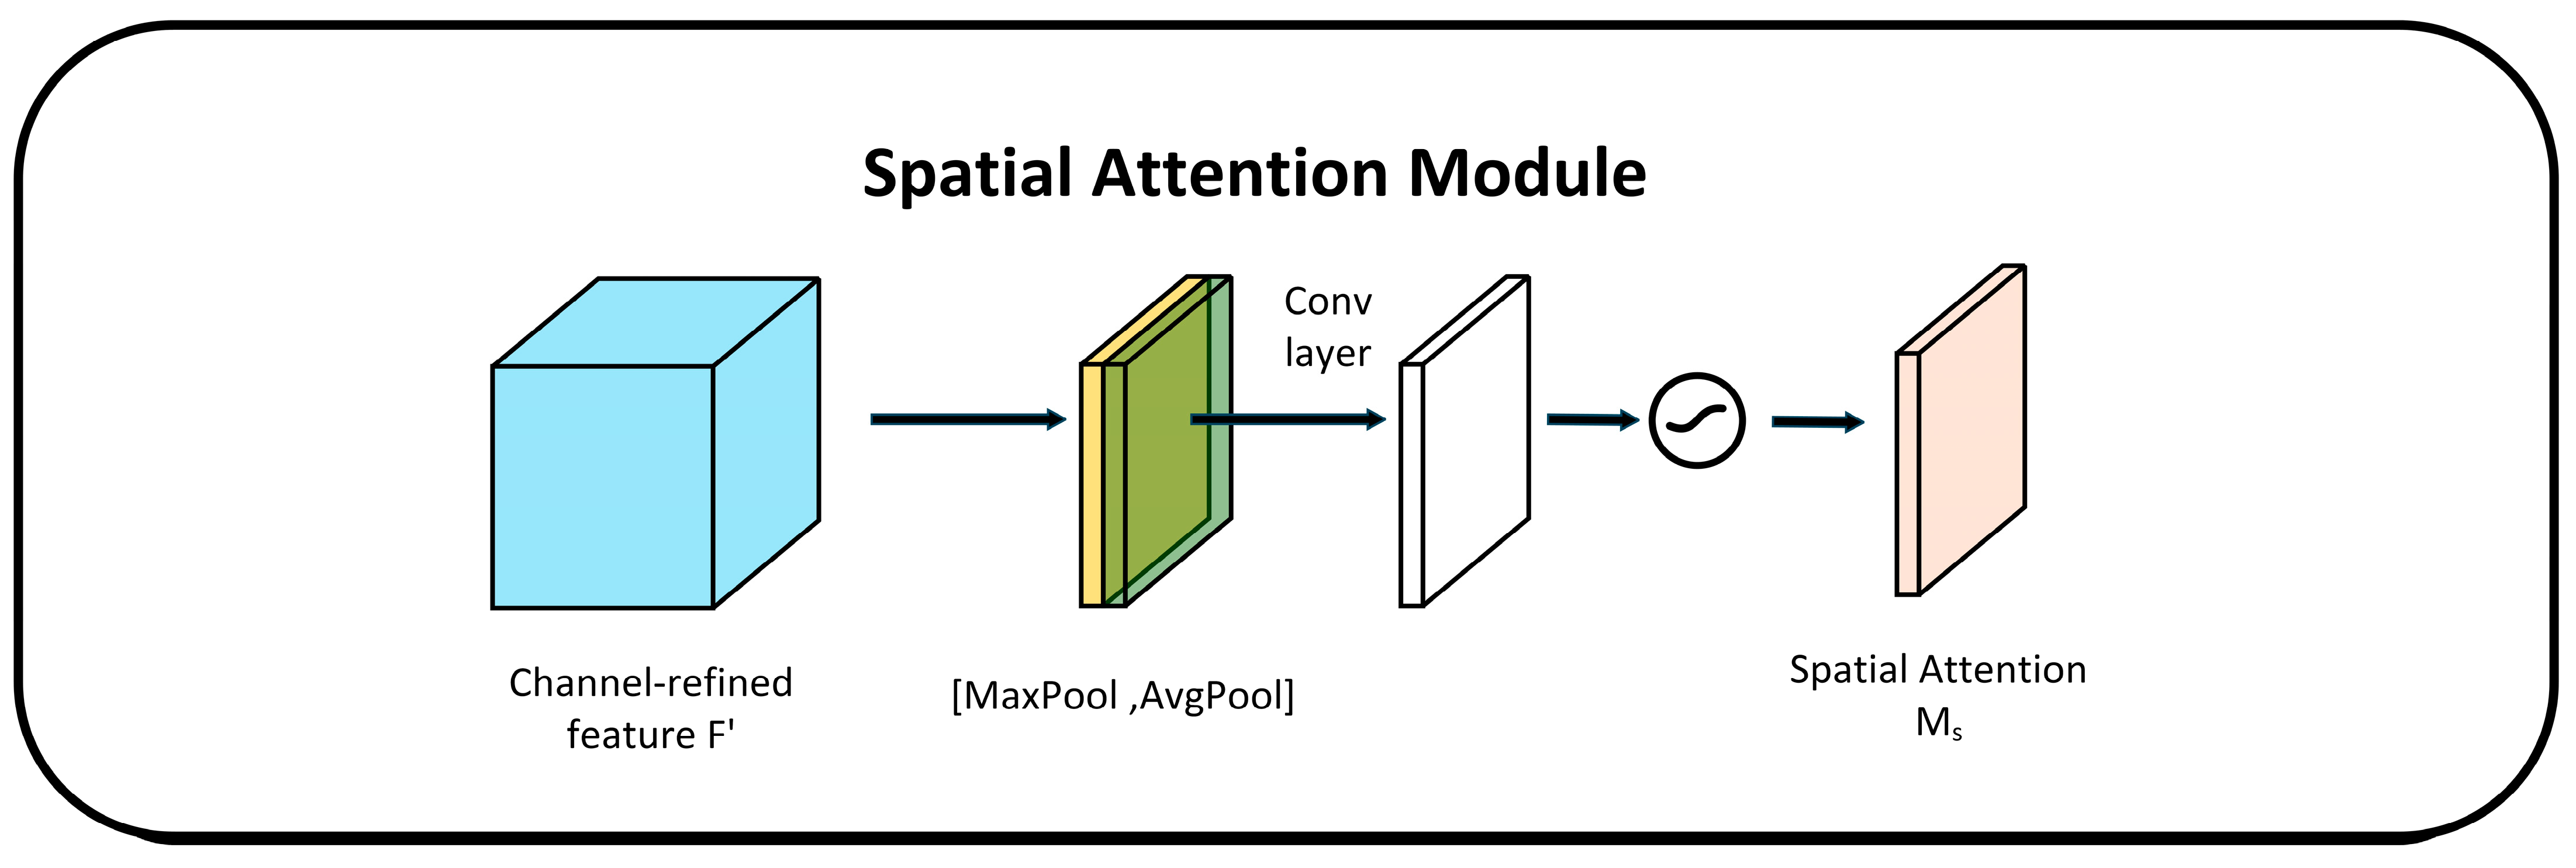
Spatial attention module
In the spatial attention module, the spatial dimension remains unchanged while the channel dimension is compressed. This module focuses on the positional information of the object in the image. As shown in
Figure 5, the output of the channel attention is passed through MaxPooling and AveragePooling to obtain two feature maps of size 1 × H × W. Then, the two feature maps are concatenated using the concat operation, and finally, the output is multiplied by the original feature map to restore its dimensions back to C × H × W [
29].
Spatial attention mechanism calculation formula:
2.2. Feature Fusion Network Integrated with the CARAFE Operator
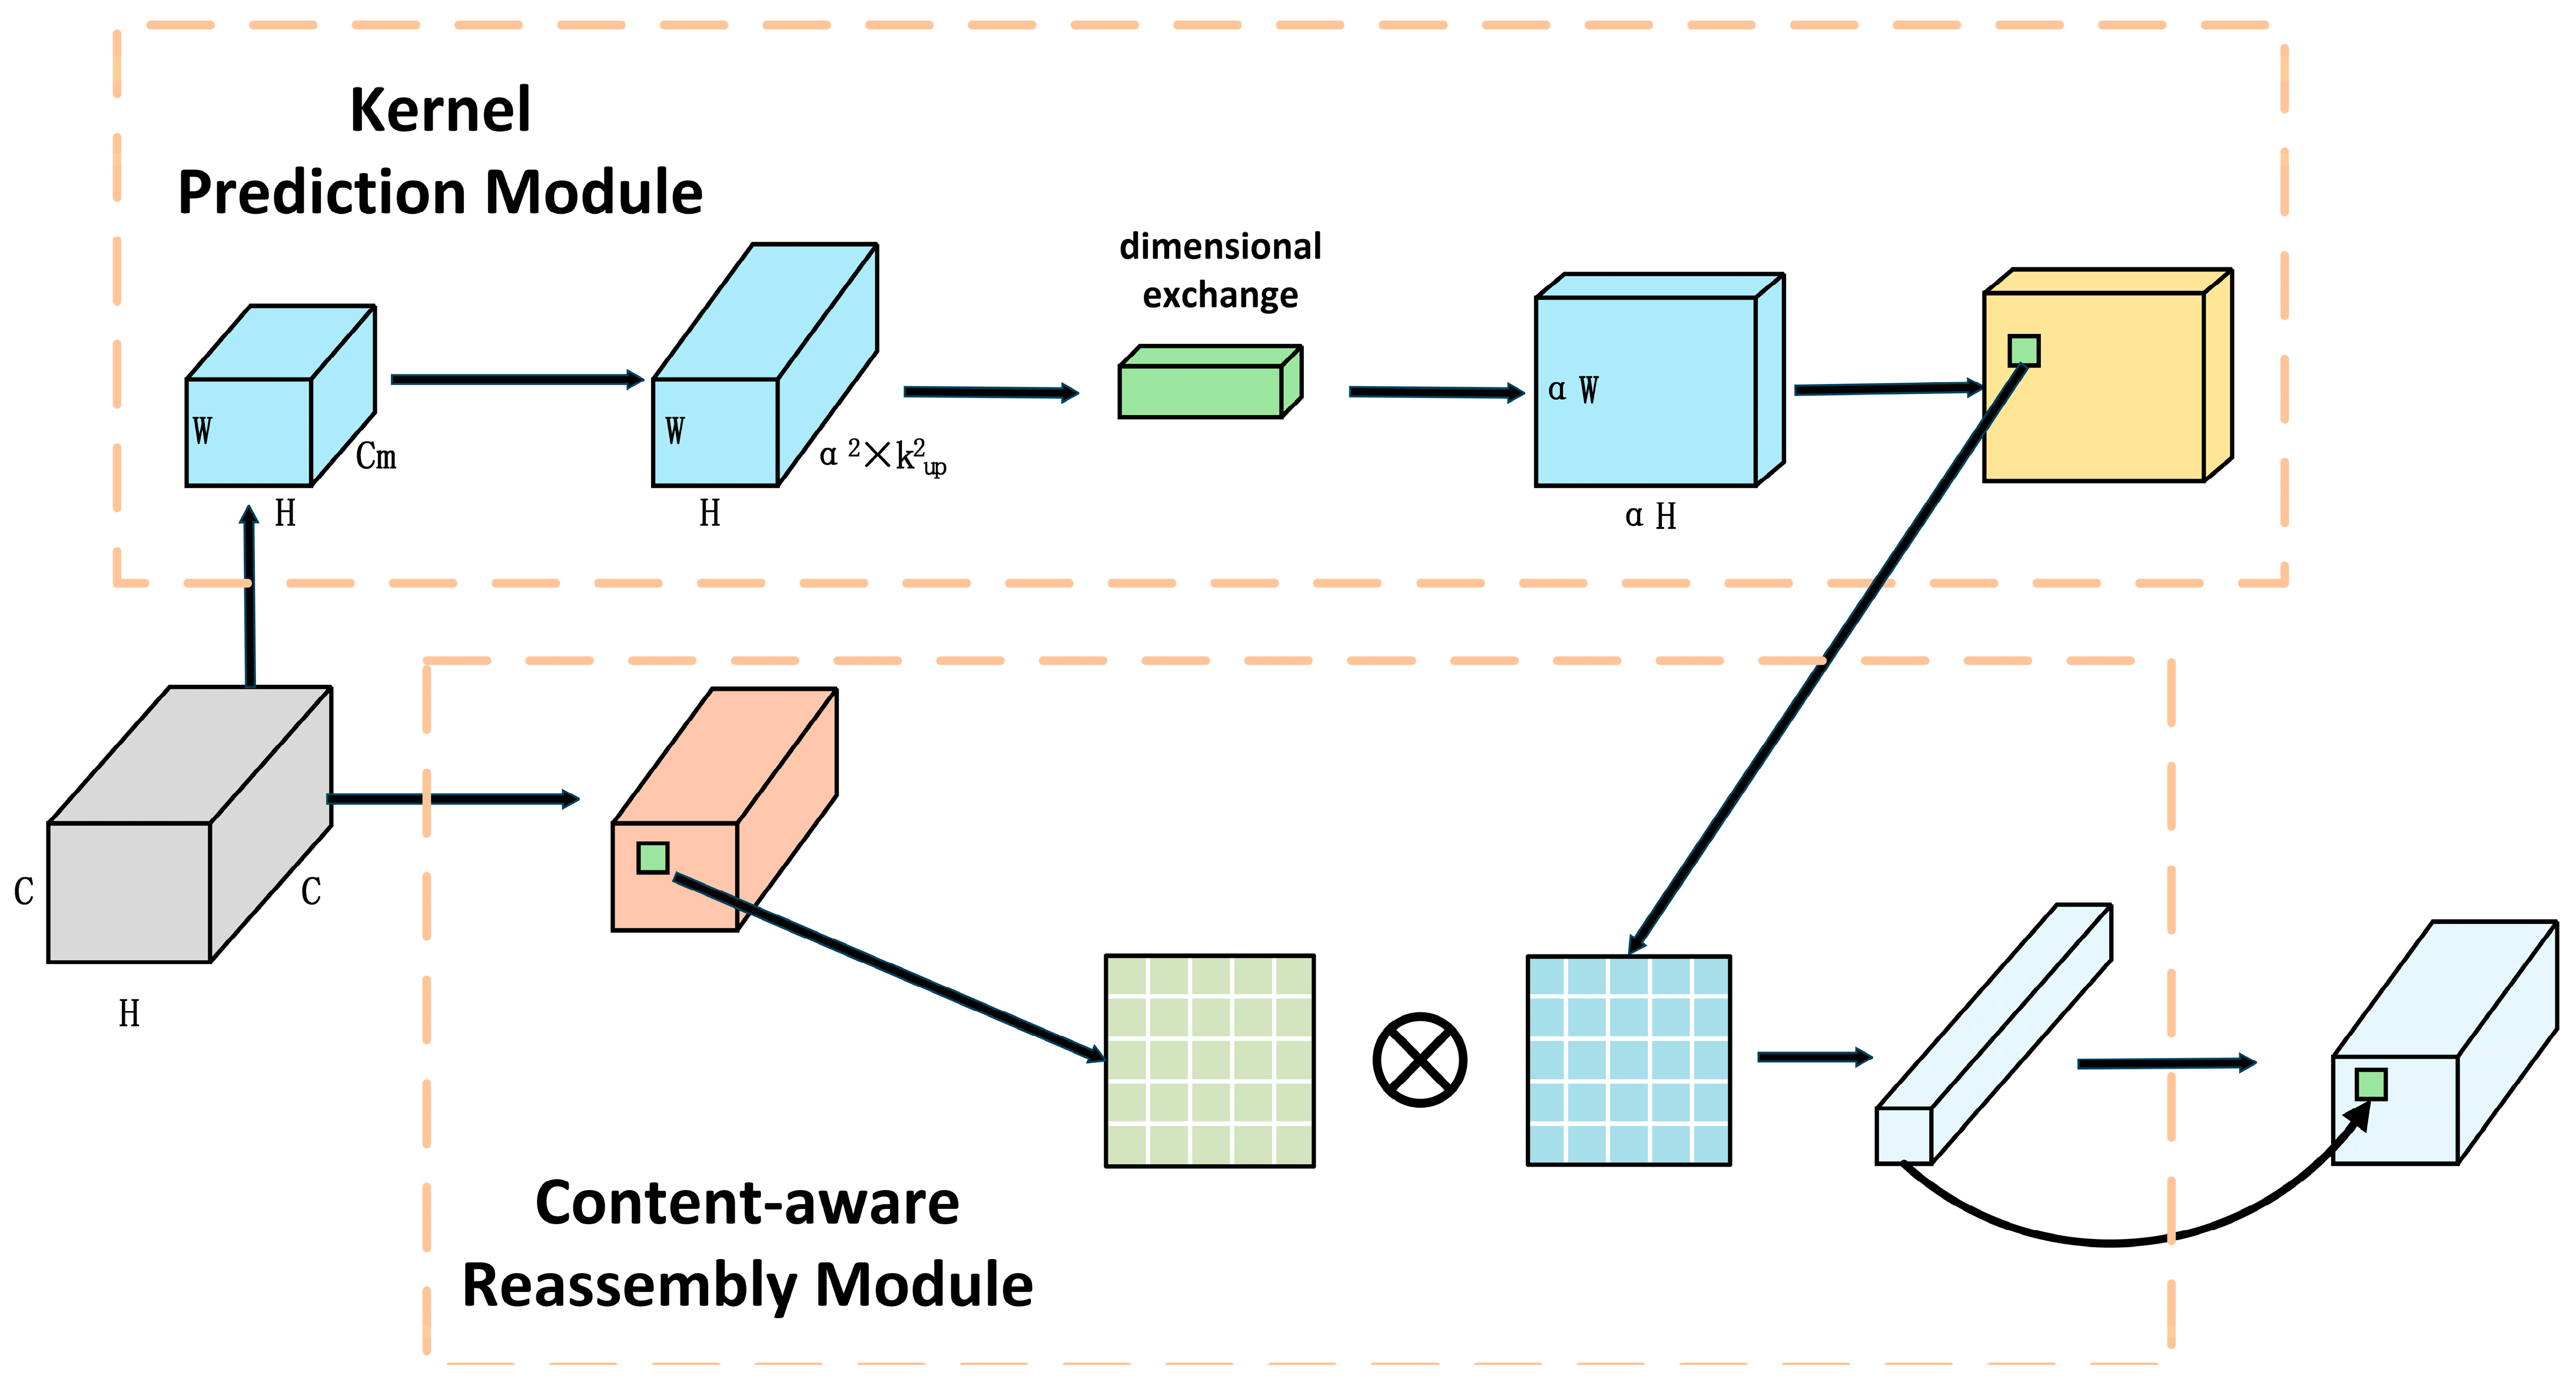
The contours of seabed geomorphic units are complex. Although incorporating CBAM in the backbone network improves the model’s feature extraction capability for seabed topographic images to some extent, the simplicity of the network structure may prevent it from fully leveraging the feature information in seabed topographic images. Additionally, seabed geomorphic units are characterized by their complex contours. During the process of converting DEMs into seabed topographic maps, significant scale differences between various seabed geomorphic units inevitably result in the presence of small targets. Accordingly, this study introduces the CARAFE module to construct a new feature fusion network, enhancing YOLO-SG’s ability to segment small targets and complex shapes. CARAFE generates dynamic reassembly kernels for each pixel via learning rather than using fixed upsampling operations, as illustrated in the kernel prediction module in
Figure 6. For small and complex targets, this dynamic kernel generation approach can capture finer features, avoiding issues in traditional methods where small targets are easily overlooked, or the edges of complex shapes appear blurred [
30]. In addition, CARAFE performs feature-weighted summation within a local region, effectively aggregating local information, as illustrated in the content-aware reassembly module in
Figure 6. This approach enables better preservation of boundary features for complex shapes while assigning higher weights to critical feature points of small targets, thereby improving the segmentation performance. Especially in complex backgrounds, information concerning small targets is easily overshadowed by background features. However, CARAFE enhances the feature contrast of small targets via content-aware reassembly.
3. Dataset
Most current studies on submarine geomorphology recognition and segmentation are rule-based, with limited research in deep learning and a lack of available datasets. For this study, the authors created a dataset called SG-MKD.
Existing terrain models can be categorized into DEM (Digital Elevation Model), DSM (Digital Surface Model), DTM (Digital Terrain Model), TIN (Triangulated Irregular Network), LiDAR (Light Detection and Ranging) point cloud data, and VTM (Vector Terrain Model). In seabed terrain research and applications, DEM is the most widely used model [
31,
32,
33,
34]. This model records seabed elevation values in a regular grid format, allowing for precise representations of continuous seabed terrain features, such as trenches, seamounts, abyssal plains, and rift valleys. It has many advantages, such as being easy to analyze and process, supporting multi-source data, having abundant data resources, and offering a wide range of application scenarios [
35]. The seafloor terrain grids used to generate the DEM in this study were Topo_27.1 and GEBCO 2023 Grid. The Topo model was developed by Professor Sandwell’s team at the Scripps Institution of Oceanography (SIO) and has been continuously updated since the 1990s, with a new version released annually. The model has been continuously optimized via improved editing, updated gravity models, and the addition of data, with the Topo_27.1 version released in 2023 [
36,
37]. This version has an average resolution of 1′ and a latitude range of ±80.738°, allowing clear visibility of seamounts with a size of 1–2 km. The General Bathymetric Chart of the Oceans (GEBCO) is an ocean depth mapping project jointly led by the International Hydrographic Organization and the Intergovernmental Oceanographic Commission. GEBCO_2023 was released in April 2023 with a spatial resolution of 15″. It covers the region from 89°59′52.5″ N to 89°59′52.5″ S and from 179°59′52.5″ W to 179°59′52.5″ E. The model is based on SRTM15+ v2.5.5, integrating seafloor topography information inverted from the SIO Gravity Model V32 and gridded bathymetric datasets developed by the four Seabed2023 regional centers. Both of the above-mentioned topographic grids can be downloaded from their respective official websites.
Seamounts are isolated mountains or peaks on the ocean floor, typically formed by volcanic activity, with significant protrusions beneath the sea surface. The base diameter of seamounts typically ranges from 10 km to 100 km, with some large seamounts having diameters that can reach several hundreds of kilometers [
38,
39]. Sea knolls are relatively smaller underwater mountains, typically resulting from the degradation of larger seamounts or small-scale tectonic features. They are often found in continental slopes or abyssal plain areas. The base diameters of these seamounts are usually several kilometers to tens of kilometers, smaller than typical seamounts. In this study, the grid is divided into dimensions of 2° × 2°, which ensures that a single image can fully accommodate large geomorphic units while avoiding the blurriness of smaller geomorphic units, which could affect recognition and segmentation.
LabelMe is an open-source tool created by the Computer Science and Artificial Intelligence Laboratory at the Massachusetts Institute of Technology in 2008, specifically for image annotation and semantic segmentation. It provides a platform that allows users to manually annotate images and create label data for training machine-learning models or conducting computer vision research [
40]. The SG-MKD dataset was annotated using LabelMe for the labeling.
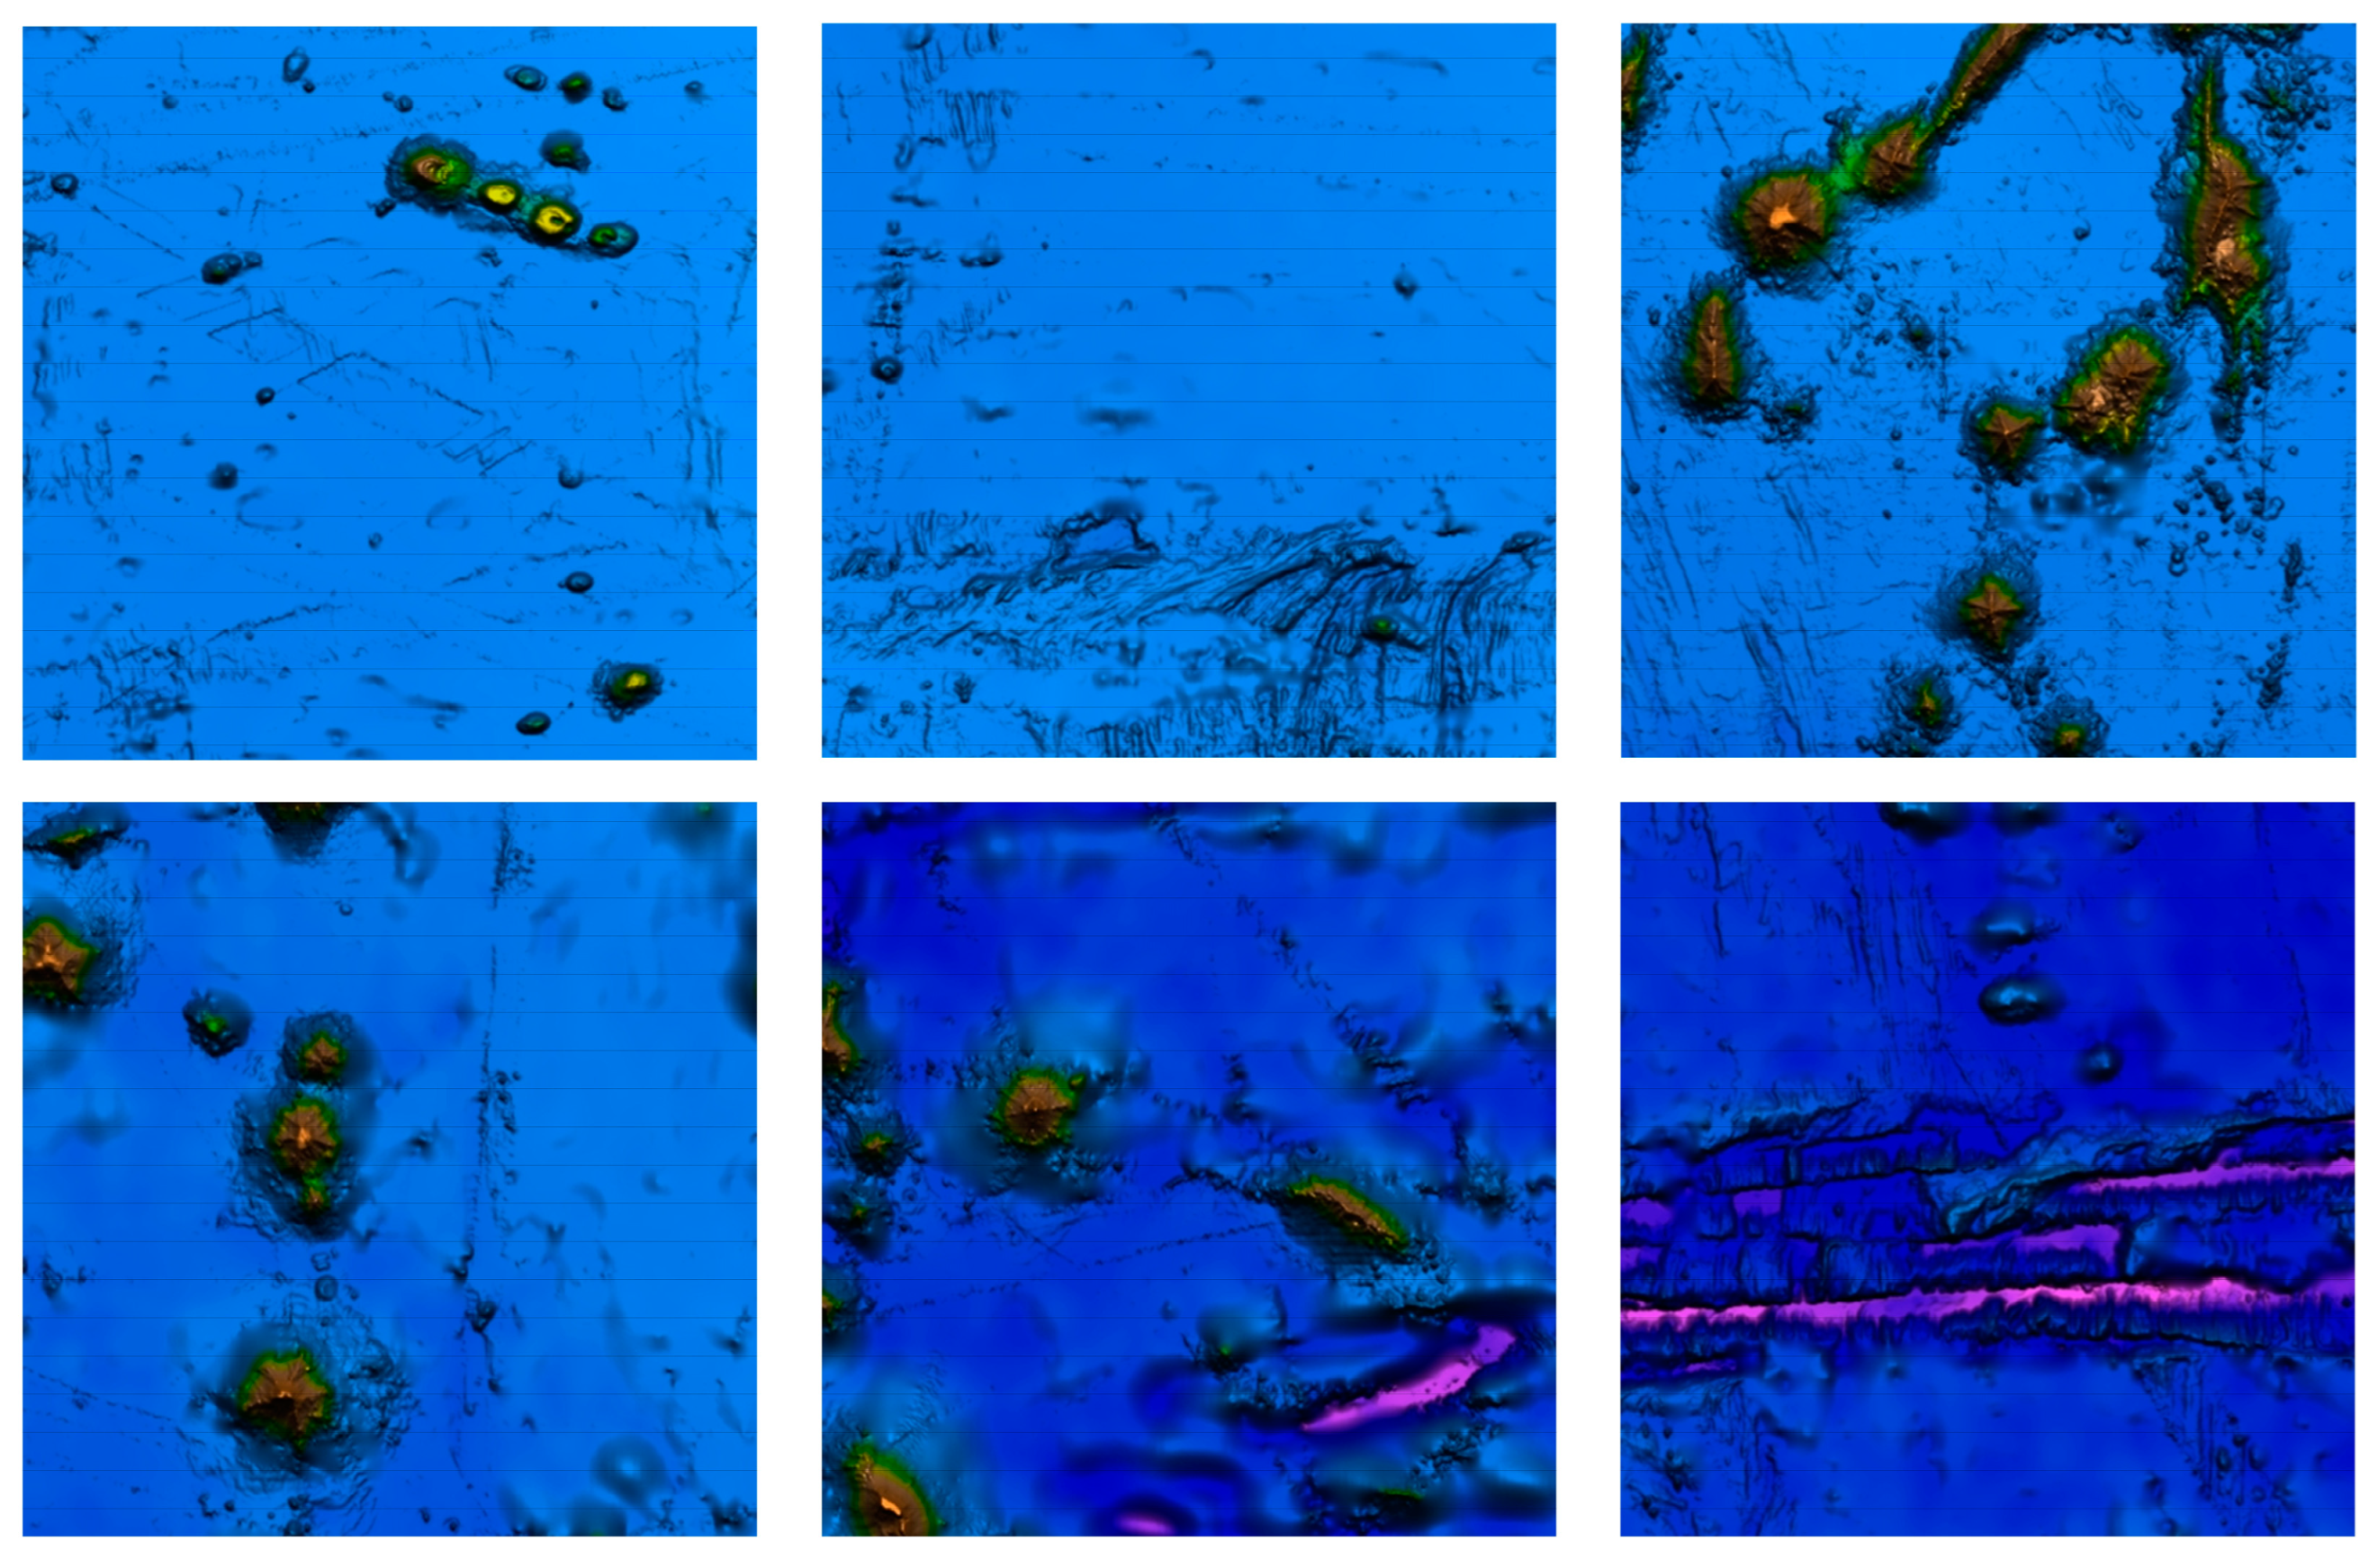
The dataset contains 419 images with recognized and segmented objects, including three types of seabed features: seamounts; sea knolls; and submarine depressions. Each image contains at least one type of seabed feature, and the image resolution is uniform at 120 × 120 pixels. Several sample images from the dataset are shown in
Figure 7.
Instance segmentation of seabed geomorphic units is a challenging task. During the annotation process, it is necessary to rely on expert knowledge to determine the type of seabed feature and, at the same time, accurately mark the boundaries of each seabed geomorphology type. This makes the creation of a dataset extremely labor-intensive. Consequently, this study performed data augmentation on the SG-MKD dataset. Data augmentation [
41] plays a crucial role in improving the performance and robustness of a model. Introducing various variants into a dataset helps the model better understand the complex task of image detection and instance segmentation. The key roles of data augmentation in instance segmentation are as follows.
Enhancing Generalization: Introducing variability through augmentation helps prevent the model from overfitting to specific features of the training set. It improves the model’s ability to segment objects under different conditions, increasing the feature richness of the dataset [
42] and ensuring that the model performs well on unseen data.
Increasing Dataset Size [
43]: Instance segmentation tasks require pixel-level annotations, which are time-consuming and expensive to generate. Augmentation can effectively expand the training data without the need for additional labeling work.
Improving Mask Prediction Accuracy: Augmented examples with different shapes, rotations, or scales can help the model learn the accurate mask boundaries of objects under different orientations or distortions [
44].
Improved Detection of Small and Occluded Objects [
45]: Techniques such as enlarging smaller objects or introducing partial occlusion during training can help the model address challenging problems, such as detecting small objects in real-world scenarios.
To increase the target quantity and characteristics of the SG-MKD dataset, data augmentation was performed using techniques such as adding noise, adjusting brightness, randomly changing pixel values, translating, and flipping. The total number of augmented images in the dataset is 1670. The dataset was divided into training sets and validation sets according to a ratio of 8:2. Note that the dataset partitioning was performed prior to data augmentation.
4. Experimental Results
All experiments in this study were conducted on a computer equipped with an Intel(R) Core(TM) i9-10900X CPU, NVIDIA GeForce RTX 3090 GPU, and 64 GB RAM.
The experiments were conducted on a Windows 10 64-bit system using the PyTorch framework, with Python version 3.8, PyTorch version 1.12.0, and CUDA version 11.6. The model training parameters were set as follows: the initial learning rate was set to 0.01; the weight decay was set to 0.0005; the momentum was set to 0.937; the batch size was set to 16; the image size was set to 120 × 120; and the total number of epochs for training was 200.
4.1. Evaluation Indicators
In instance segmentation, evaluation metrics are designed to assess the model’s ability to detect objects and accurately predict their segmentation masks. These metrics combine aspects of both object detection and semantic segmentation evaluation. The detection is considered a positive sample by calculating the intersection over union (IoU) between the predicted mask and the ground truth mask in the image. The corresponding detection results are defined as follows: true positive (
TP)—the number of correctly detected positive samples; false positive (
FP)—the number of negative samples incorrectly detected as positive; and false negative (
FN)—the number of positive samples incorrectly detected as negative. In this instance segmentation task, which involves three categories, the IoU threshold was set to 0.5. To objectively evaluate the accuracy of the model, the average precision (
AP) for each category and the mean average precision (
mAP) across all categories were used as evaluation metrics. Their formulas are as follows:
In this context, precision (
P) refers to the probability of correctly detecting positive samples among all detected positive samples, while recall (
R) represents the probability of correctly identifying positive samples among all actual positive samples. Their formulas are as follows:
To assess the computational complexity of the model, this paper uses the floating-point operations (FLOPs), number of parameters (Params), model file size (Size), and detection speed (Speed) as evaluation metrics.
4.2. Results
4.2.1. Improvement Experiments
To demonstrate the effectiveness of the proposed method, improvement experiments were conducted on the basis of the research method presented in
Section 2 using the SG-MKD dataset, the experimental results of which are presented here. First, the YOLOv8l-Segment was used as the baseline model to train and validate the experimental dataset. Then, the proposed YOLO-SG was experimentally validated. The detection and segmentation results of the two networks were compared, and the experimental results are shown in
Table 1.
In
Table 1, it can be observed that YOLOv8l-Segment exhibits a significant imbalance in detection accuracy across the three categories. The accuracy for seamounts is relatively high; however, the detection accuracies for sea knolls and submarine depressions are lower, with submarine depressions having an average precision of only 64.4%. This phenomenon is primarily attributed to the variation in the target scales and the relatively small number of original samples for these two categories, which significantly impacted the target detection accuracy.
From
Table 1, it is evident that compared with the YOLOv8l-Segment, the proposed YOLO-SG demonstrates a significant improvement in detection accuracy. Specifically, the
mAP value increased by 14.7%, and the
AP values for seamounts, sea knolls, and seabed depressions improved by 14.9%, 14.6%, and 18.4%, respectively. At the same time, YOLO-SG’s parameter count increased by only 0.97 M, and its FLOPs grew by 1.8 G. This demonstrates that the model achieved a significant improvement in accuracy while incurring only a slight increase in computational costs.
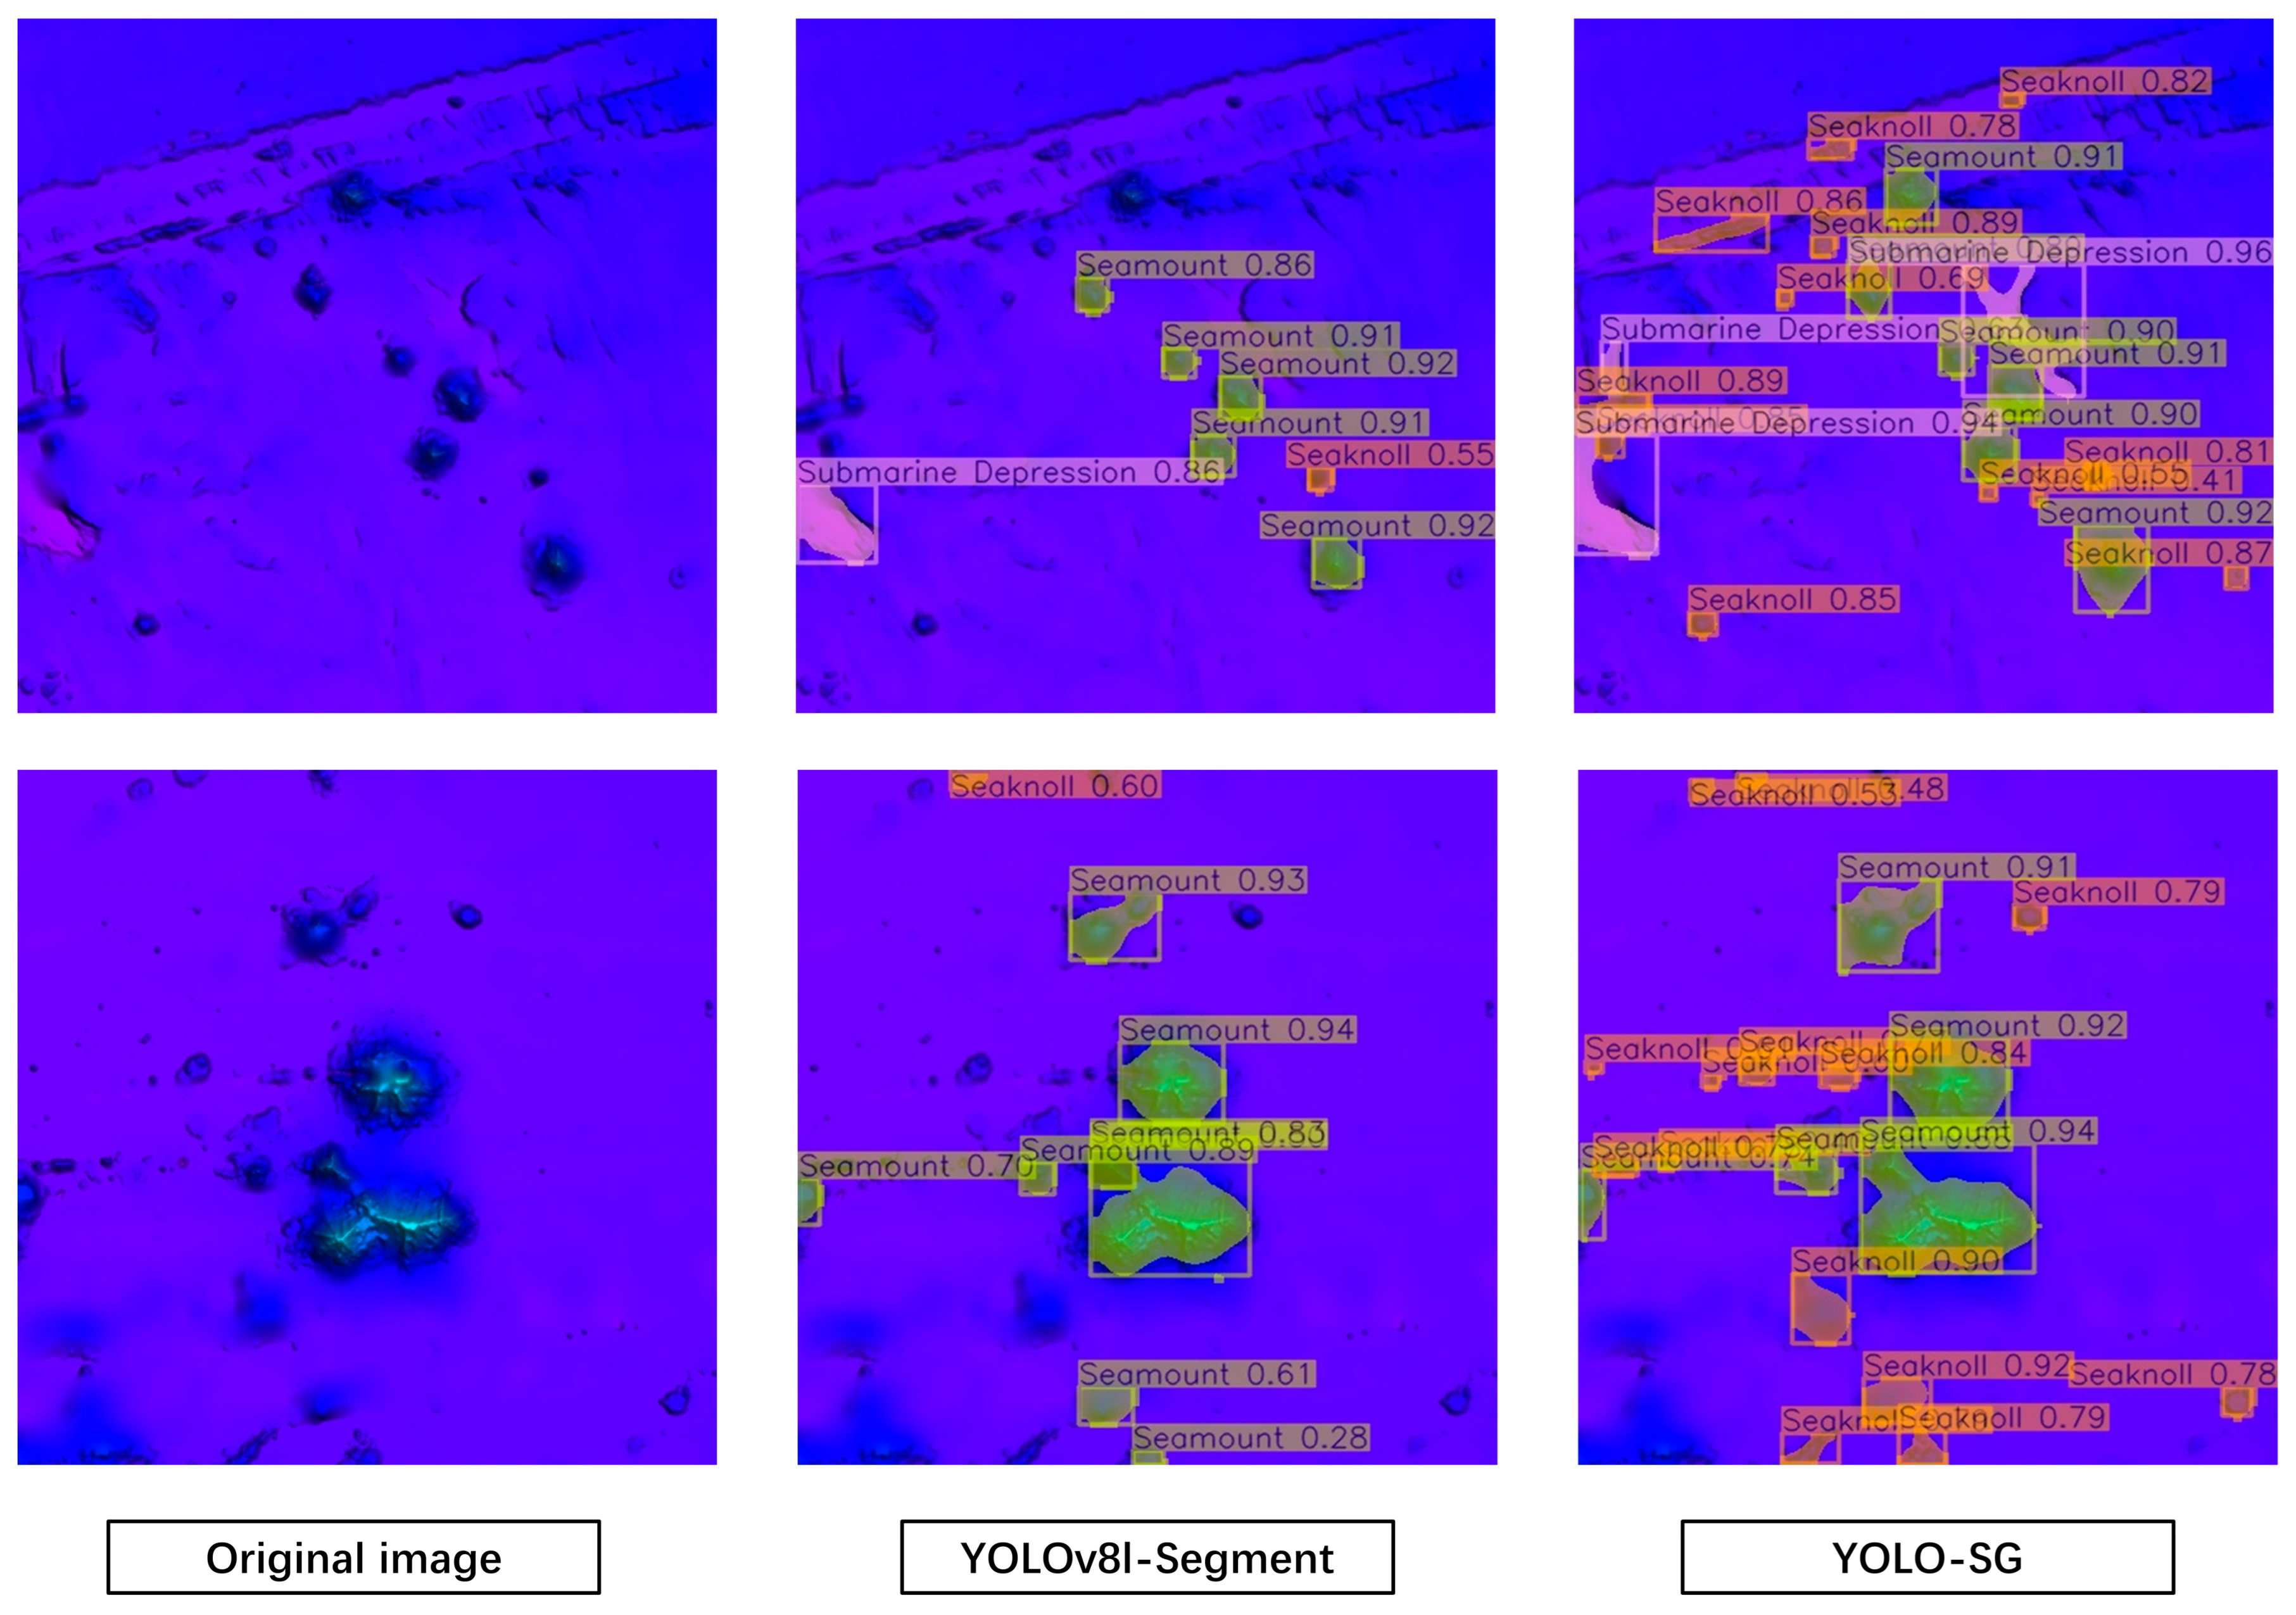
Figure 8 shows the original images and the detection results of YOLOv8l-Segment and YOLO-SG on two seafloor topographic images. Compared with YOLOv8l-Segment, YOLO-SG demonstrates more accurate boundary delineation and effectively reduces the occurrence of missed detections in the same side-scan sonar images. In the feature map comparison shown in
Figure 9, YOLO-SG demonstrates better attention to both local and global features during feature extraction, with a stronger capability for capturing small targets. In terms of feature fusion and representation, YOLO-SG better focuses its attention on the regions of positive samples while reducing attention to irrelevant information such as blurred backgrounds and shadows.
4.2.2. Generalization Experiments
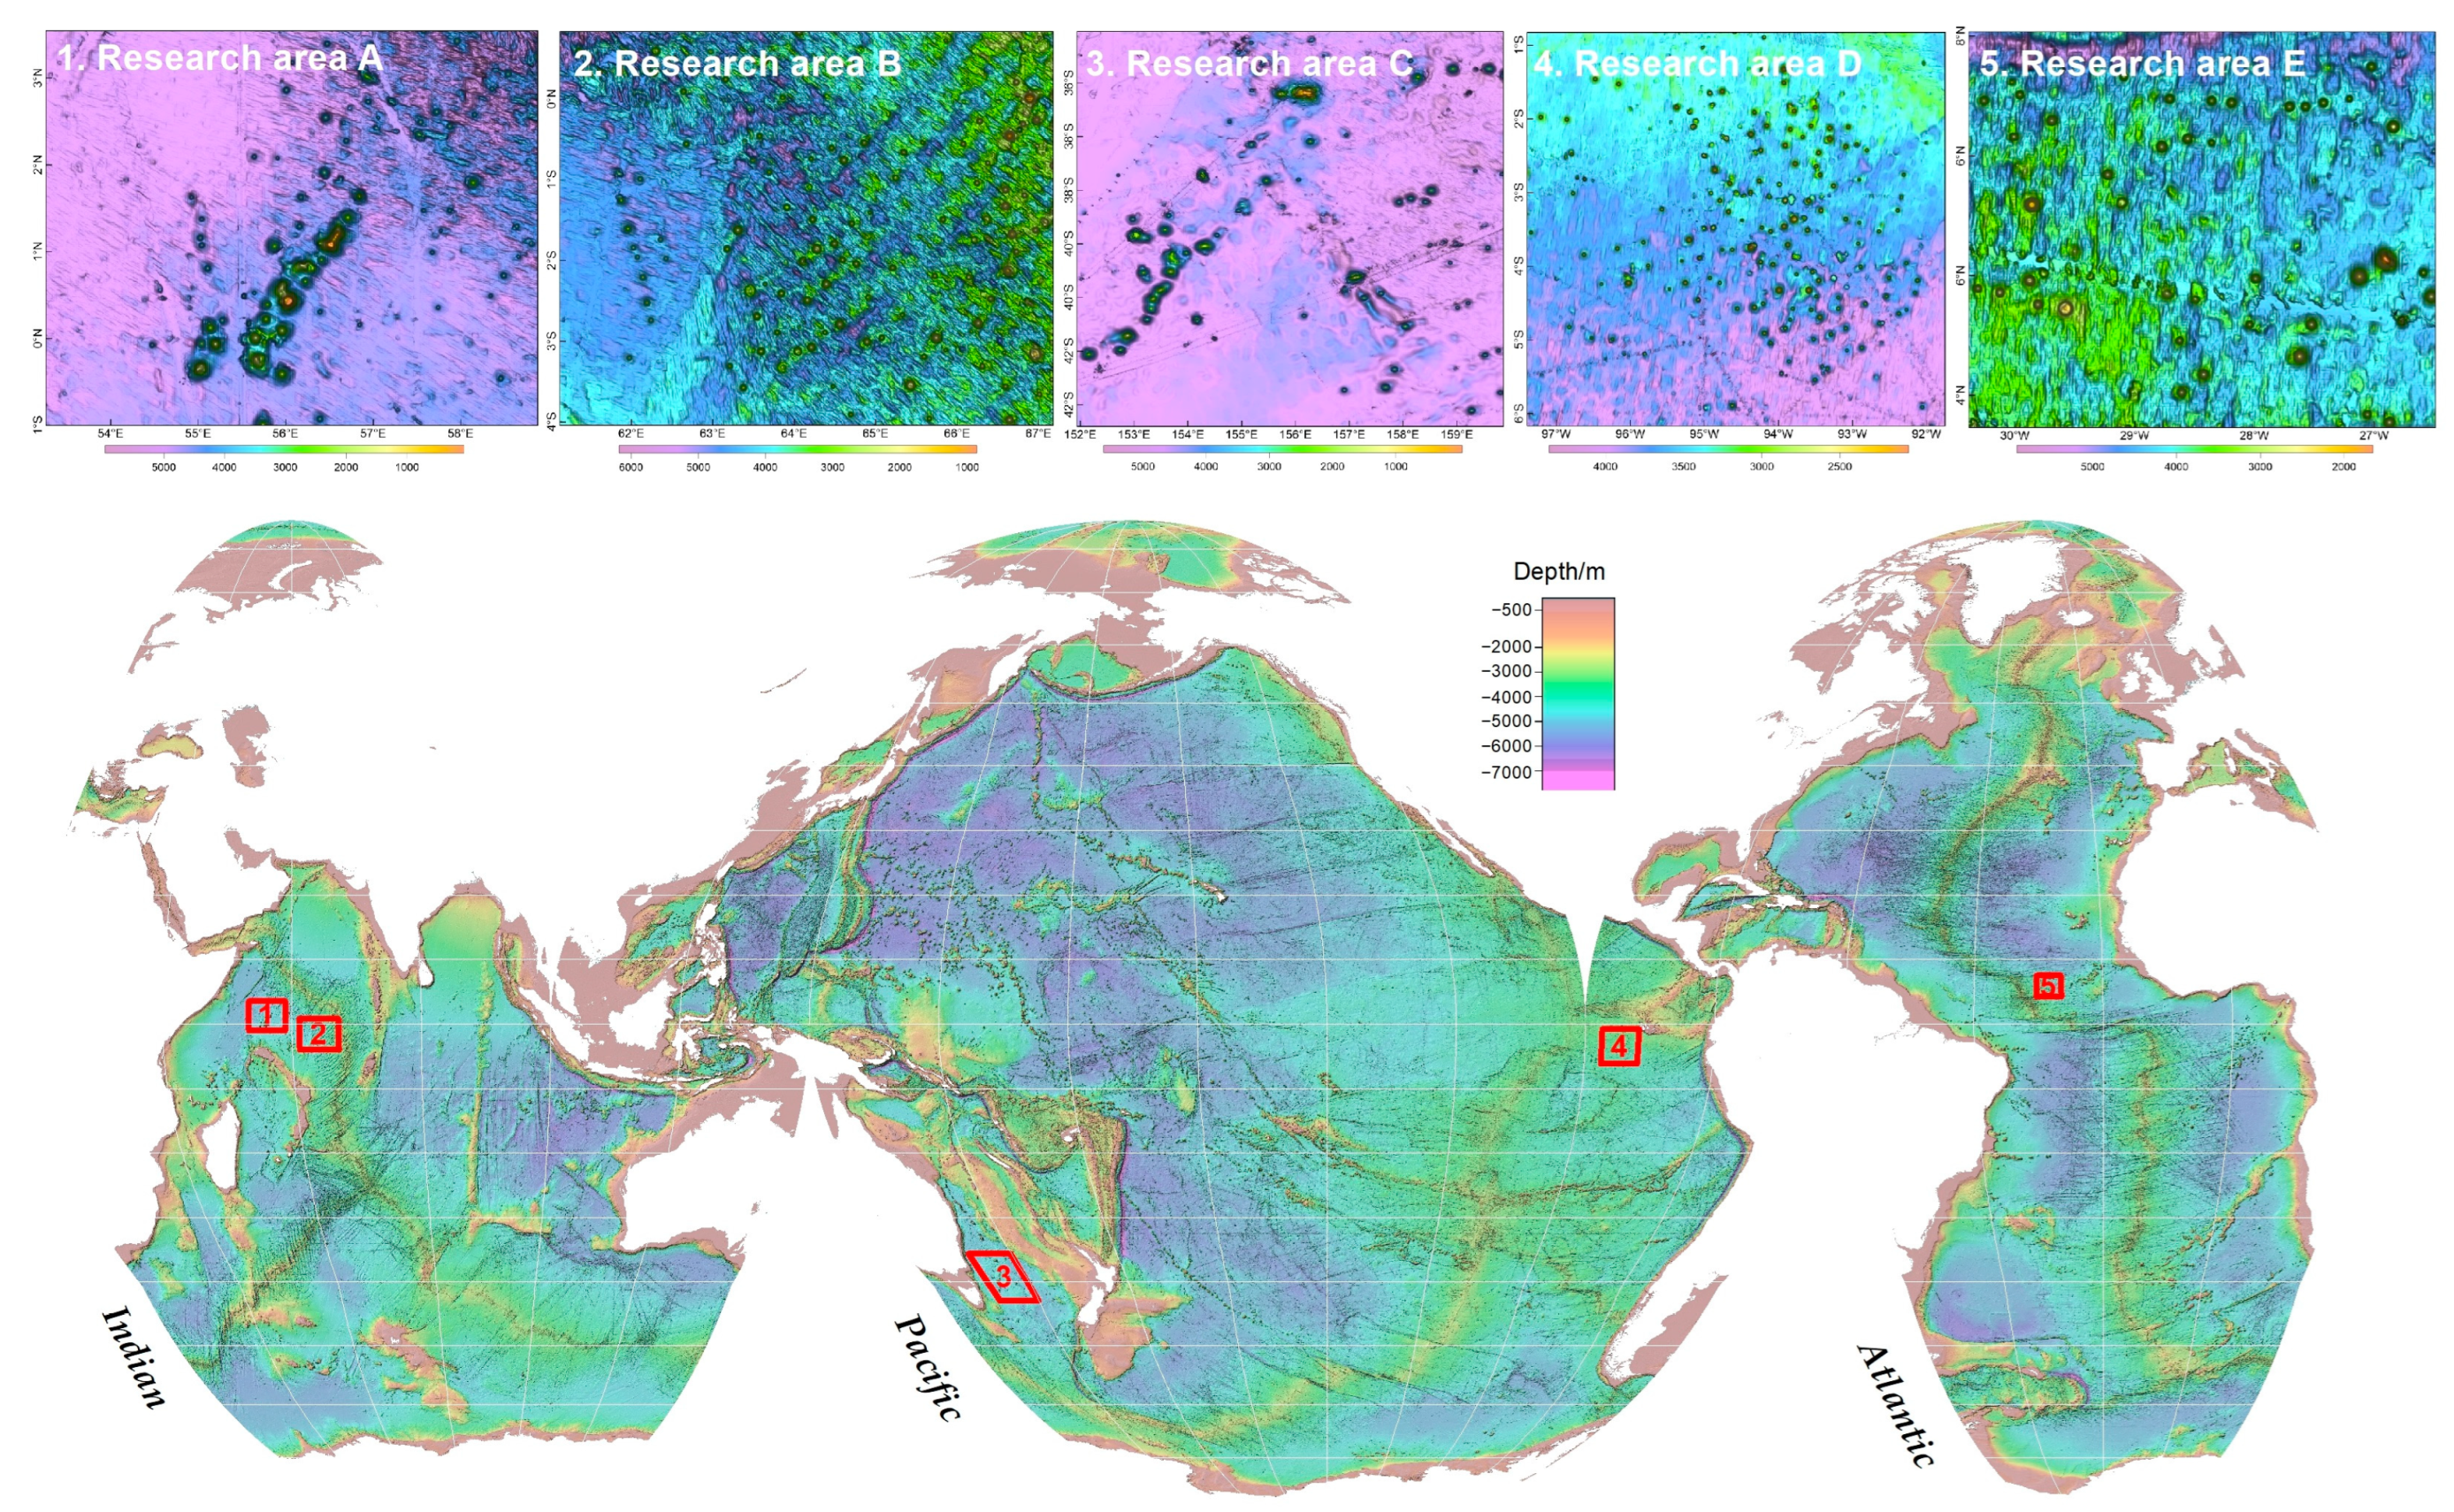
Section 3 outlined the numerous challenges encountered during the creation of instance segmentation datasets. As a seafloor geomorphological unit instance segmentation dataset, SG-MKD is similarly constrained by these issues and exhibits certain limitations. The main issues include the uneven distribution of the dataset, primarily concentrated in the North Atlantic, and an insufficient number of samples. These issues limit the reliability of experimental results in other regions. In addition, the fixed input size of 120 × 120 for the training set raises concerns about the algorithm’s segmentation and detection performance when handling inputs of different sizes. To demonstrate the good generalization capability of YOLO-SG and its ability to perform seabed geomorphological unit segmentation and detection tasks with different input sizes, we conducted experiments on five randomly selected regions worldwide based on the research methodology proposed in
Section 2; the experimental results are presented here.
Research area A is located in the central South Pacific region and is characterized by a dense distribution of seamounts and sea knolls with significant topographic variation. The water depth ranges between 2500 m and 4500 m, and the input size is 1354 × 1283. Research area B is located near the equator in the Mid-Atlantic Ridge region, exhibiting distinct features of linear rift valleys and spreading centers. The water depth ranges between 2500 m and 4500 m, and the input size is 935 × 793. Research area C is located near the equatorial region of Africa, adjacent to the deep-sea area off the west coast of Africa. This region features relatively moderate topographical variations, greater water depths, and isolated underwater mountains and hills. The input size is 906 × 769. Research area D is located in the central Indian Ocean region and is characterized by complex topography, including underwater mountain ranges, hills, and rift valleys. The input size is 1454 × 1171. Research area E is located in the Pacific waters east of Australia, featuring deep-sea basins and underwater mountains. The input size is 1902 × 1768.
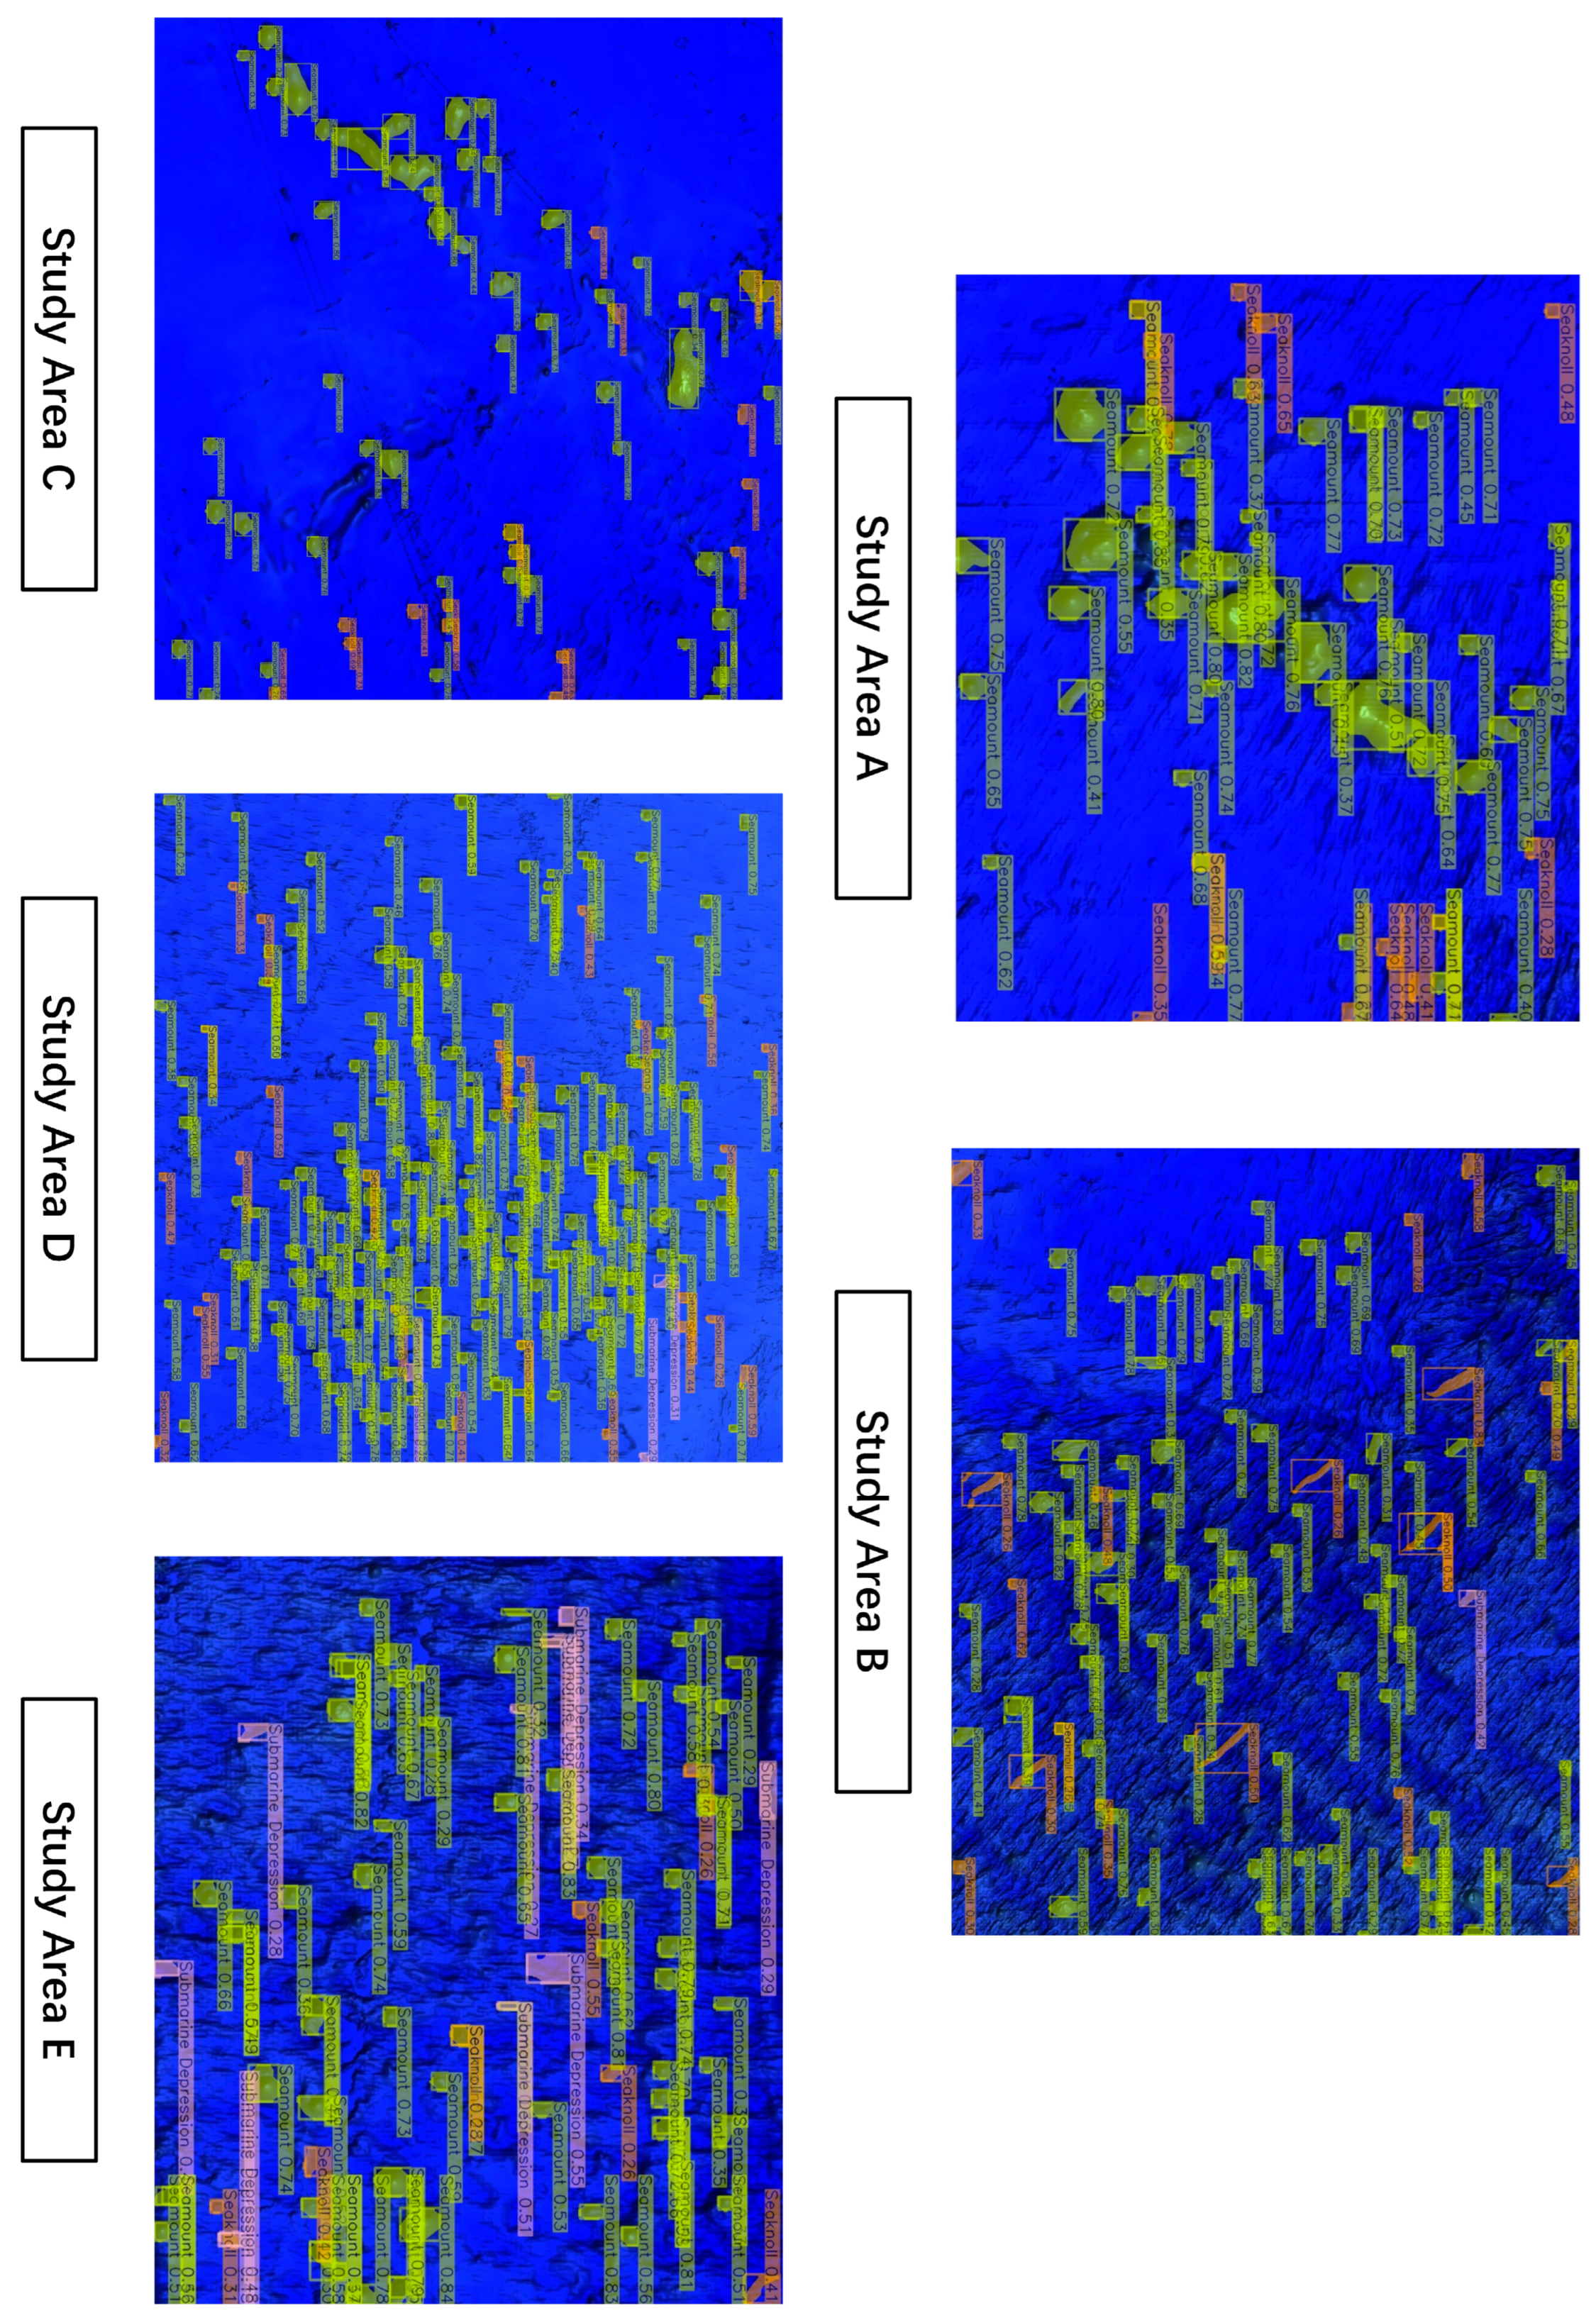
Figure 10 shows a distribution map of the research areas, and
Figure 11 shows the segmentation results of the research areas.
As shown in
Figure 10, the research areas are relatively evenly distributed across the world’s oceans, and the surface area of each research area varies. In area A, the basic terrain is relatively flat, with a large number of seamounts and sea knolls, and the seabed geomorphic units are relatively independent. The basic terrain in area B is relatively rugged, with seamounts and guyots as the main geomorphic units, and each unit is relatively independent. The basic terrain in area C is relatively flat; however, the distribution of the geomorphic units is more concentrated. The lower-left part of the basic terrain in area D is flat, while the rest of the area is more rugged, containing numerous geomorphic units. The basic terrain in area E is flat, with the geomorphic units concentrated in the lower left. These five research areas, therefore, cover a variety of terrain features.
As shown in
Figure 11, YOLO-SG shows excellent performance in detecting and segmenting seabed geomorphological units under various terrain conditions, which fully demonstrates its strong generalization ability.
4.2.3. Ablation Experiments
To visually demonstrate the impact of each improvement made by the YOLO-SG algorithm on its performance, we conducted ablation experiments on the SG-MKD dataset. The experiment used YOLOv8l-Segment as the baseline model, sequentially adding the CBAM attention mechanism and the CARAFE lightweight upsampling operator as improvement modules. The results are shown in
Table 2. The addition of CBAM in Method 1 improved
mAP by 8.1%, with only a slight increase in the number of parameters and FLOPs. Method 2, which introduces CARAFE to the baseline network, improved
mAP by 9.3% and increased the parameters by 0.4 M. Finally, YOLO-SG, which incorporates both CBAM and CARAFE, achieved a 14.7% increase in
mAP compared with the baseline network, with an increase of 1.0 M in the parameters.
4.2.4. Comparative Experiments
To better demonstrate the improvements of the proposed instance segmentation method, this section compares it with several State-of-the-Art instance segmentation models on the SG-MKD dataset. The algorithms for comparison include YOLOv5 [
46], ASF-YOLO [
47] (an improvement based on YOLOv5), Mask R-CNN [
46], and Cascade Mask R-CNN [
48].
Table 3 presents a comparison of YOLO-SG with other algorithms in terms of the number of parameters, FLOPs, accuracy, and model size. As shown in the table, ASF-YOLO is more lightweight compared to YOLOv5l-Segment, with a notable improvement in accuracy, although it is still not ideal. Cascade Mask R-CNN shows a significant improvement in accuracy compared to Mask R-CNN, achieving a mAP of 86.4%. However, it suffers from high computational complexity. In comparison, YOLO-SG exhibits a significantly lower computational complexity while achieving a mAP of 88.4%, which is notably higher than those of the State-of-the-Art algorithms. Moreover, under comparable conditions in terms of the number of parameters, FLOPs, and model size, YOLOv8l-Segment demonstrates superior detection accuracy compared to YOLOv5l-Segment, indicating that YOLOv8l-Segment serves as a more effective baseline network for the current task.
5. Discussion
Although deep-learning methods have shown great potential in the recognition and segmentation of seafloor topography and geomorphology, research in this field is still relatively limited. This study constructed a seafloor topography and geomorphology dataset, SG-MKD, and proposed the YOLO-SG algorithm, achieving efficient recognition and segmentation of geomorphological units such as seamounts, sea knolls, and submarine depressions, advancing the application of deep learning in the recognition and delineation of small seafloor geomorphological units. The YOLO-SG algorithm proposed in this paper is based on a design concept of multi-scale and strong generalization ability, effectively addressing many challenges in seafloor topography recognition and segmentation. In the experimental results, YOLO-SG significantly improved target detection and segmentation accuracy compared with the YOLOv8l-Segment baseline network while also addressing the issue of imbalance in multi-scale object detection accuracy.
However, because of challenges in the instance segmentation dataset creation process, such as time-consuming labeling, complex annotations, and difficulty in maintaining consistent quality, the sample size and quality of the SG-MKD dataset still have significant room for improvement. In the future, it is hoped that more researchers with experience in underwater terrain and landform segmentation will participate in the expansion of the dataset, making its sample size and variety more diverse. In addition, we plan to introduce multi-source data and combine simulation sample generation techniques to address the issue of class imbalance in the dataset. This will help form a dataset with more diverse categories and a more balanced sample distribution, supporting the continuous optimization and broad application of this research.
6. Conclusions
In response to the practical needs of seabed terrain and landform recognition and segmentation, this study constructed a seabed terrain and landform instance segmentation dataset, SG-MKD, and proposed a seabed landform unit recognition and segmentation algorithm, YOLO-SG, based on lightweight upsampling operator and attention mechanisms.
The SG-MKD dataset contains 419 images with a resolution of 120 × 120, covering terrain and landform units such as seamounts, sea knolls, and submarine basins, providing important data support for seabed terrain and landform instance segmentation. YOLO-SG was designed with significant innovations, incorporating a feature extraction network that integrates the CBAM attention mechanism and a feature fusion network that introduces the CARAFE operator.
The feature extraction network, which integrates the CBAM attention mechanism, enhances the ability of the model to capture spatial information while focusing on key channel information. This allows the network to perform more balanced feature extraction of both local and global features, with a notable advantage in extracting the features of small targets. The feature fusion network, which incorporates the CARAFE operator, enhances the model’s ability to focus on multi-scale targets via efficient multi-scale feature fusion and rich feature expression. This not only improves the model’s attention to multi-scale objects but also effectively reduces interference from background noise.
The experimental results show that YOLO-SG demonstrates significant advantages in detecting and segmenting seabed topography features, with an average detection accuracy of 88.4%. Compared with the baseline network algorithm, the accuracy improved by 14.7% with a minimal increase in the computational complexity. In addition, the algorithm exhibits strong generalization capabilities, making it suitable for multiple regions and capable of performing seabed topography segmentation tasks across various input sizes.
In conclusion, by constructing the SG-MKD dataset and improving the YOLOv8l-Segment network, this study provides an efficient and reliable method for seabed topography instance segmentation.


 ,
, 

