1. Introduction
Laser acoustic communication is currently one of the hot research topics. Studying the relationship between water color and the directionality of laser acoustic signals is important for laser acoustic communication. Laser-induced sound was first proposed in the late last century [
1,
2], where sound signals undergo nonlinear attenuation in the form of ultrasound and eventually attenuate to the speed of sound [
3], with a relatively wide spectrum [
4]. Buday studied the statistical distribution characteristics of laser acoustic signals [
5]. The sound pressure level of laser acoustic signals is influenced by the medium’s laser absorption rate [
6], but communication-related technologies are still not mature [
7]. Liquids have different absorption rates for lasers of varying wavelengths, resulting in significant differences in the directionality and signal strength of the generated sound signals [
8]. Wang demonstrated the relationship between medium color and absorption rate in laser interactions [
9], and laser color is closely related to plasma resonance [
10]. The color of the medium can affect laser interactions [
11], and different colored media have varying absorption rates for lasers [
12]. There are certain differences in the rates of the absorption of lasers and the generated sound signals among different colored media [
13]. Changing the color of the medium can alter the intensity of solid laser acoustic signals [
14]. Except for black, the 1064 nm laser is more effective than the 532 nm laser for every color [
15]. Additionally, laser-induced sound has also been applied in the determination of ethanol [
16] and in non-destructive testing [
17].
Current research on the relationship between laser and medium colors primarily focuses on solid media, with no studies examining the impact of water color on laser acoustic signals. This paper proposes a conical acoustic source model, simulating and experimentally validating the model’s theoretical directivity. It also investigates the influence of different water colors on the directivity of laser acoustic signals. Based on the intensity and peak frequency results of the laser acoustic signals, the optimal water color corresponding to the highest detection threshold at various distances is calculated.
2. Research on the Conical Sound Source Model
2.1. Structure and Directivity of the Sound Source Model
The currently widely accepted laser acoustic signal source model is a linear source model, where several point sources are uniformly distributed along the line of laser incidence. However, there are great differences between the simulation results and the experimental results; this study only focused on the strength of the model in relation to the sound response signal but did not study the directivity problem and did not explain the length of the line source or draw the corresponding waveform according to the model. To further investigate the directivity of laser acoustic signals, a conical source model has been proposed. The cone is composed of a laser spot on the water surface and the focal point, with several point sources distributed within the area.
Figure 1 shows the top view and vertical cross-section of the laser source model.
As shown in
Figure 1,
r is the radius of the cone model, and
d is the length of the perpendicular line from the apex of the cone. The point source is uniformly distributed within the conical region. A three-dimensional coordinate system is established at the center of the cone, with the center as the origin
O. A straight line in the horizontal plane that passes through the origin
O is designated as the
x-axis, while a straight line in the horizontal plane that is perpendicular to the
x-axis is designated as the
y-axis. A straight line that passes through the origin
O and is perpendicular to the
xOy plane is designated as the
z-axis. According to the model, when the r or d of the model is constant, a change in
r/
d will change the structure of the conical sound source model, which will lead to a change in the position of the uniformly distributed point sound source in the model and then lead to a change in the directivity of the sound signal.
In conical coordinates, the coordinates of the sound source can be expressed as (
ri,
θi,
zi), where z
i is the height of the sound source,
ri is the radius of the sound source on the bottom surface of the cone, and
θi is the angle of the sound source. For a cone, the relationship between the height z of the sound source and the radius r can be defined by the geometric properties of the cone:
Assuming that the oscillation phase of each point sound source is the same, the phase difference in a sound source
ϵj can be calculated by the following formula:
where
dij is the distance from source j to the observation point, and
c is the speed of sound. The sound pressure
p(
t) can be calculated by the following formula:
where
Aj is the amplitude of the sound pressure of source
j,
rj is the distance from the observation point to source
j, and
ϵj is the phase difference from source
j to the observation point.
For the superposition of multiple sound sources, the superposition principle can be used. Assuming there are N sound sources, the sound pressure can be expressed as follows:
The sound source model is affected by water and laser parameters. The model is composed of several-point sound sources and regarded as a whole. In our hypothesis, the water color affects the directivity of the model by affecting the values of r and d of the whole model. In this paper, water color is related to the absorption rate and the liquid correlation coefficient, and these affect the model and change the size of the model, that is, the values of r and d, rather than changing the attributes of a single-point sound source. The correlation coefficient of laser absorptivity and liquid is introduced into the formula to make theoretical results closer to the experimental results. The ratio of the horizontal directivity to the vertical directivity of the signal can be expressed as follows:
where α is the liquid correlation coefficient and T is the absorption rate of water to laser As can be seen from Equation (5), when the value of d is constant, the value of D is affected by the model parameter r/d. Calculations show that when the value of r/d is 0.4, D is equal to 0.9752 αT, and when the value of r/d is 10, D is equal to 0.9989 αT.
2.2. Directional Results Corresponding to Different r/d Values
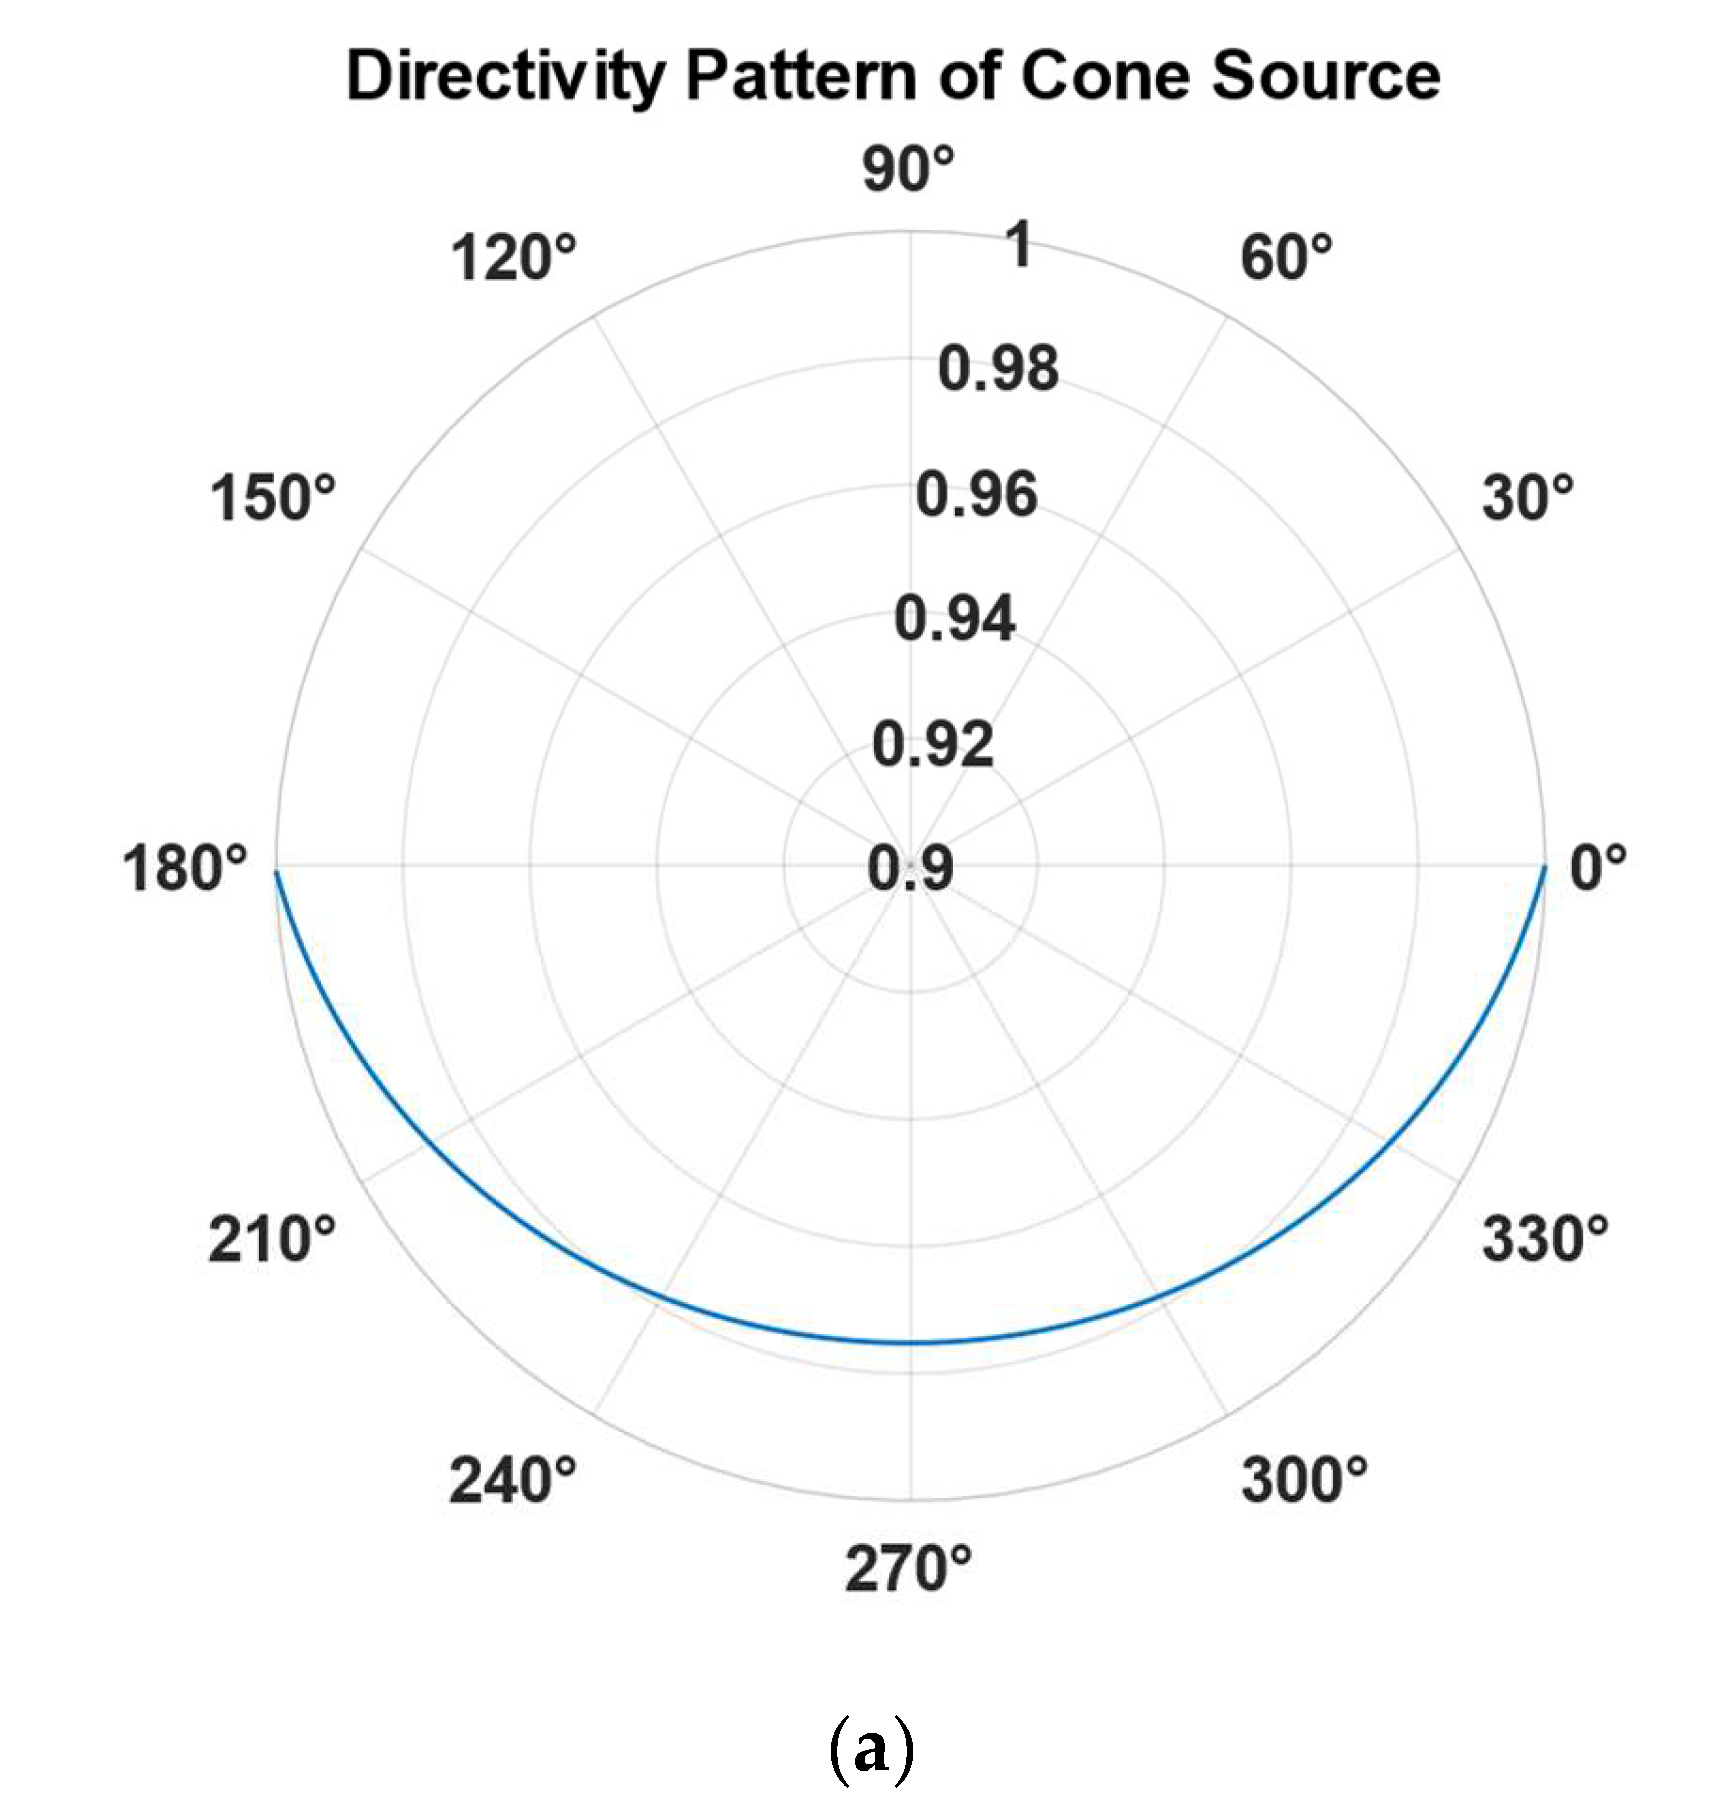
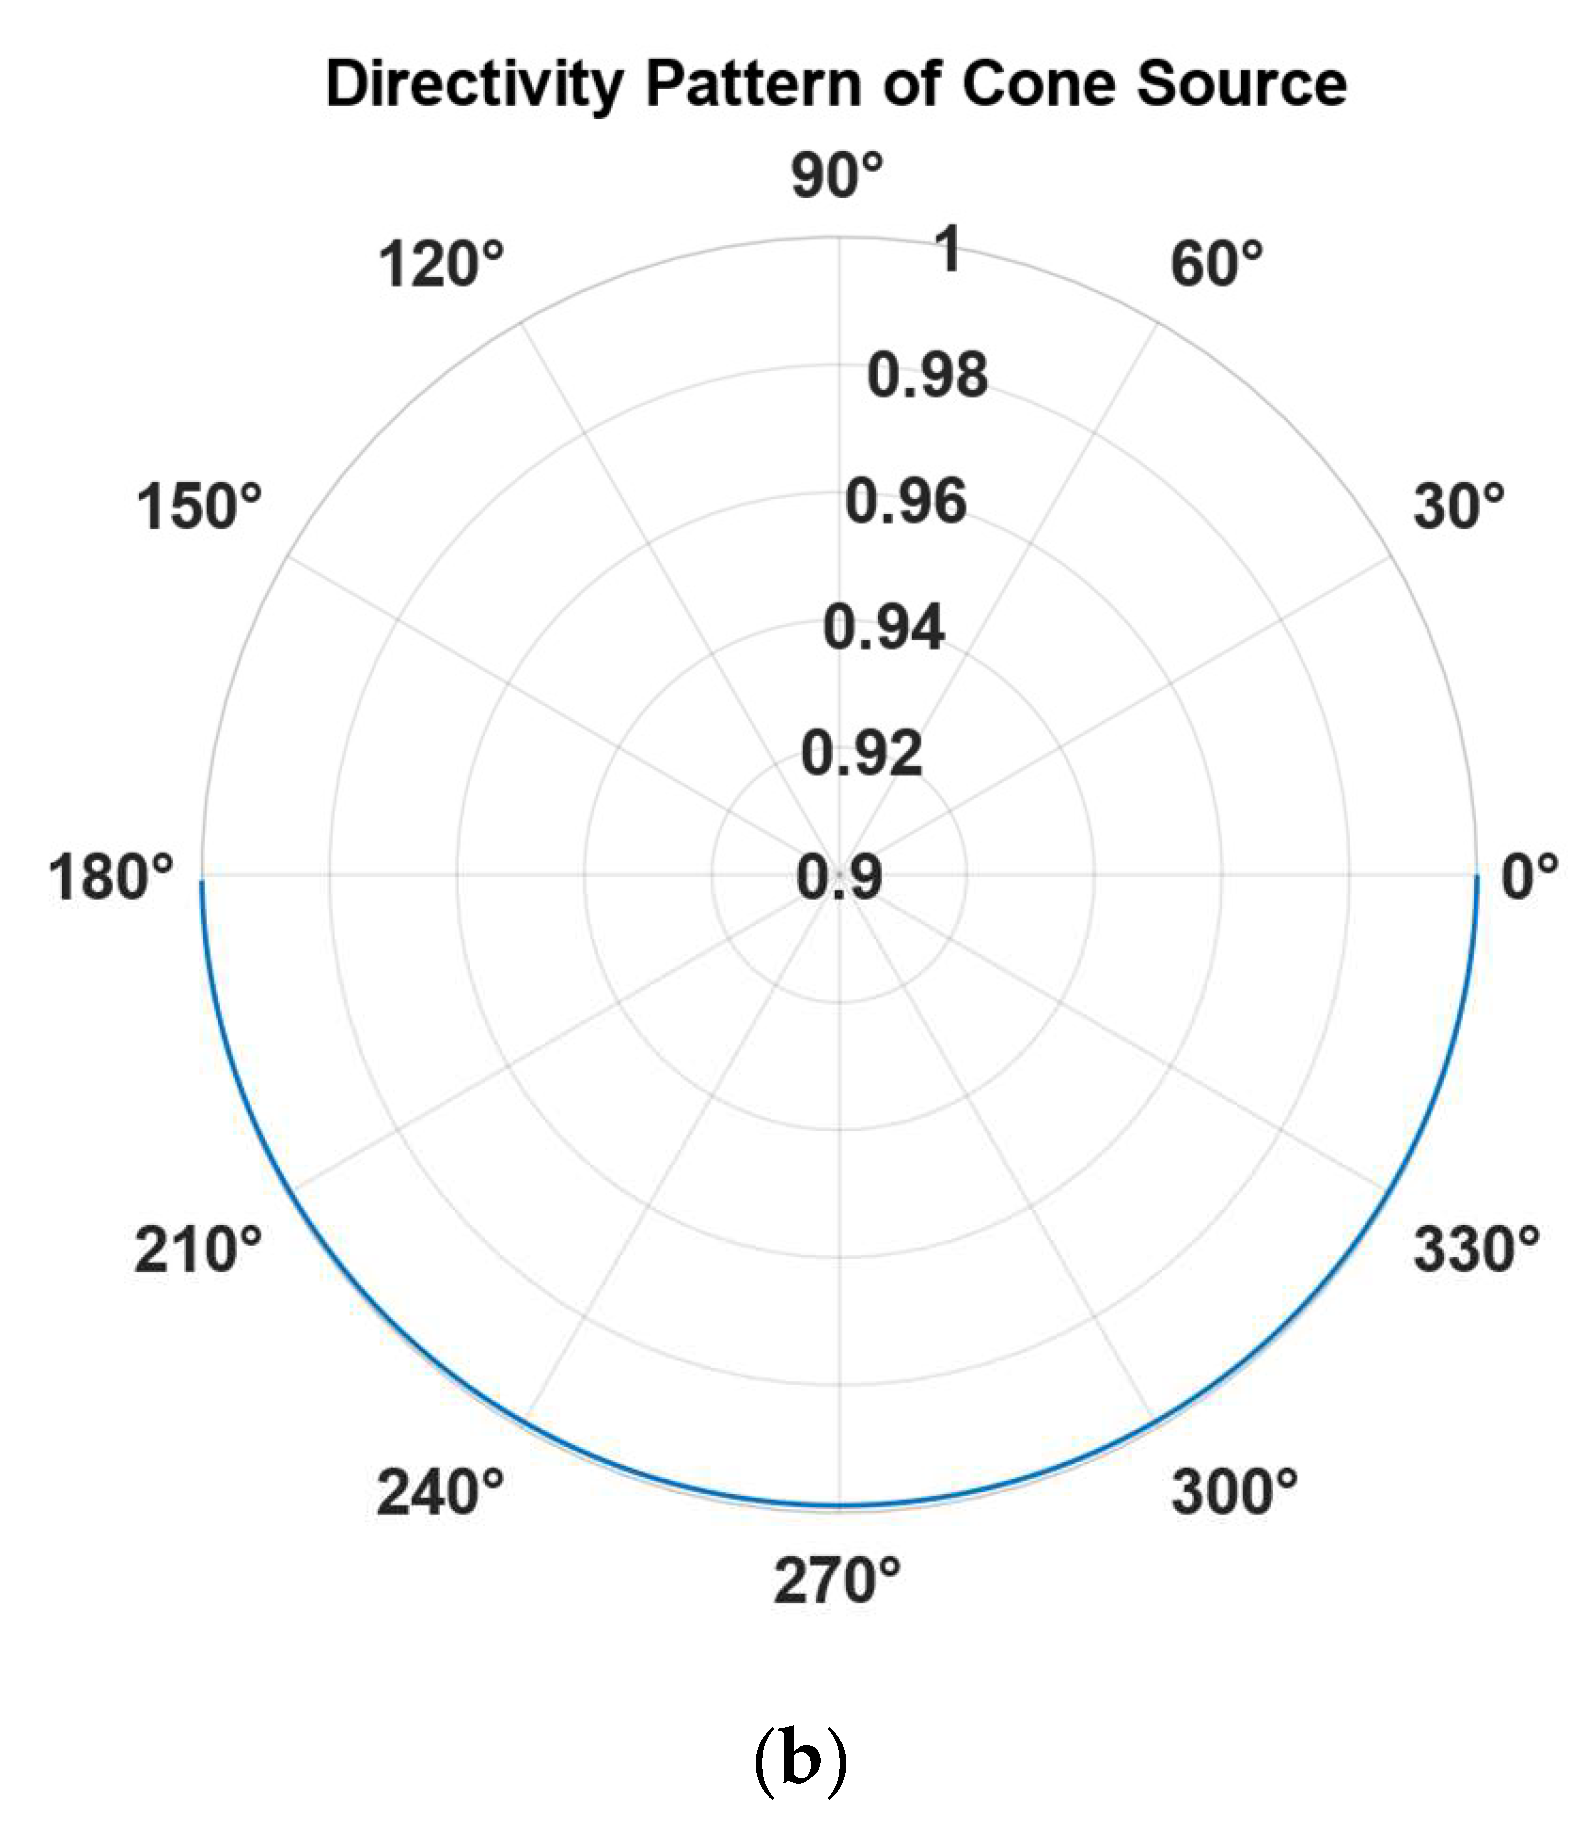
To study the directivity of sound signal models, a simulation environment was established, and a conical sound source model was constructed to calculate its theoretical directivity. According to the theoretical simulation research on this conical model, its horizontal directivity for sound signals was isotropic, while the vertical directivity was influenced by the value of r/d. The following figure shows the directivity results of the model when r/d is 0.4 and r/d is 10:
Figure 2 shows the theoretical directivity of the conical sound source model. The horizontal axis serves as a dividing line, with the upper half representing the air environment and the lower half representing the water environment. Therefore, the angles from 180° to 0° indicate the sound field distribution of the model underwater, where the angle size shown in the figure corresponds to the angle between that position and the horizontal line, and the curve value represents the directivity D. When
r/
d = 0.4, the signal strength of the sound source in the horizontal direction is higher. When
r/
d = 10, the results obtained from the model simulation show no significant directivity. The directivity result D of the sound signal is influenced by the
r/
d value; as the
r/
d value changes, the directivity of the sound source model also changes. Therefore, based on the functions of laser sound signals in communication and detection, the
r/
d value should be selected to give the laser sound signal a certain modulating capability. Research on the conical sound source model indicates that when different colored dyes are added to the water, their absorption rates for light change, thereby altering their directivity. The theoretical minimum ratio of horizontal to vertical signal strength produced by a sound signal in water is 1. However, in practical situations, due to interference from
α and
T, there can be cases where the vertical signal strength exceeds the horizontal signal strength. Water has different absorption rates for lasers of different wavelengths, resulting in varying directivities. For instance, transparent water has a very low absorption rate for 532 nm wavelength lasers, which almost never leads to breakdown, while water has a high absorption rate for 2940 nm wavelength lasers, causing rapid breakdown at the water surface, thus affecting the actual shape of the model. Consequently, the higher, the absorption rate of water to laser, the stronger the directivity in the vertical direction, concentrating energy more in that direction.
3. Laser-Induced Acoustic Directionality Experiment
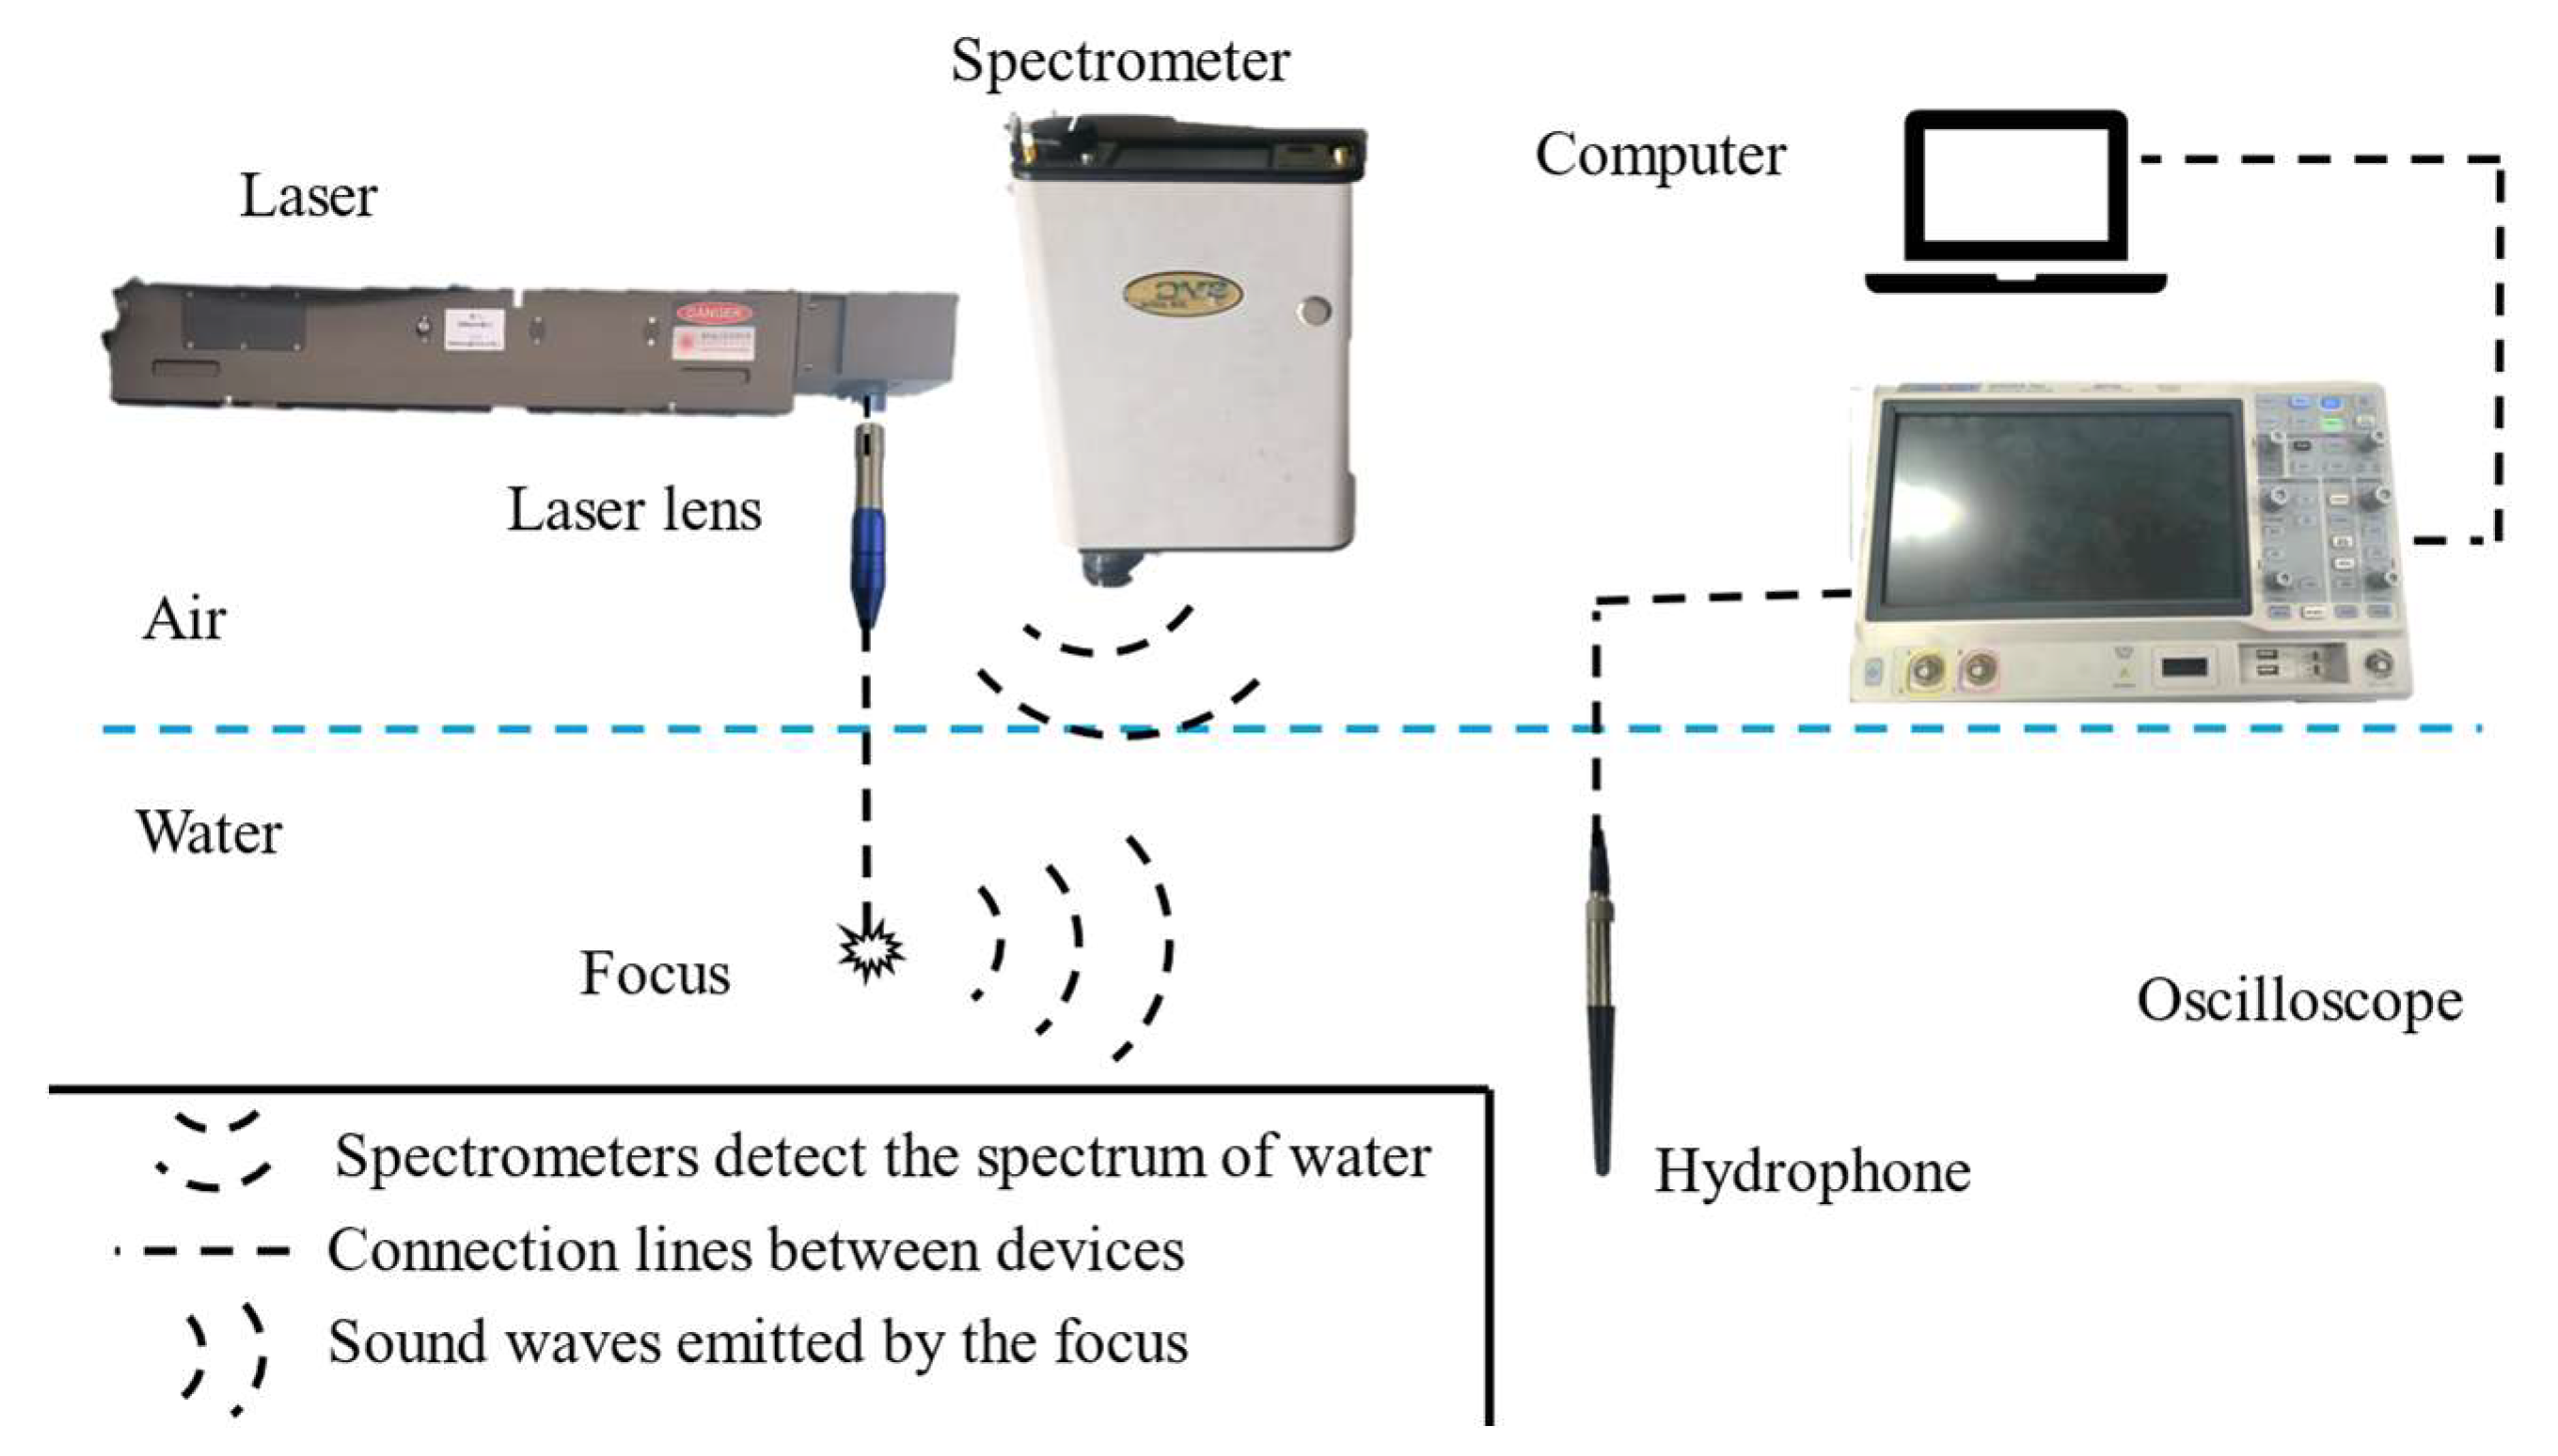
To investigate the actual directionality of laser-induced acoustic signals and the relationship between the frequency characteristics of laser acoustic signals and the color of water, a laser-induced acoustic experimental platform was established. A schematic diagram of the experimental apparatus used in this study is shown in
Figure 3:
A Nd:YAG pulsed laser (purchased from Zhuo Lei Laser Technology Co., LTD., Beijing, China, wavelength of 1064 nm, pulse duration of 8 ns, maximum pulse energy of 0.4 J, adjustable repetition frequency of 1–60 Hz) was used as the laser source, and a laser lens with adjustable focal length focuses the laser on water to generate acoustic signals. The laser-induced acoustic signals were received by an RHSA-5 underwater hydrophone located 1 m from the sound source, with a sampling frequency of 2 × 10⁶ Hz and a sensitivity of −218 dB re 1 V/μ Pa. A spectrometer was positioned vertically 0.5 m above the water surface to measure the rate of laser signal absorption by water through analyzing the intensity of different frequency band signals reflected from the water surface.
3.1. The Relationship Between the Directionality of Laser Acoustic Signals and Color
To study the directional characteristics of laser acoustic signals, experiments were conducted on the directionality of laser breakdown in water of different colors. Water was used as the breakdown medium, and red, blue, yellow, and black colorants were added to change the color of the water. A control group without any colorants was also established. The experiment site was a pool 10 m long, 5 m wide, and 7 m deep. Muffler cotton was arranged around the wall of the pool to minimize rebound interference. The laser emits 1064 nm pulsed laser energy at a frequency of 1 Hz. The ratio of the laser spot radius to the distance from the focal point to the water surface was
r/
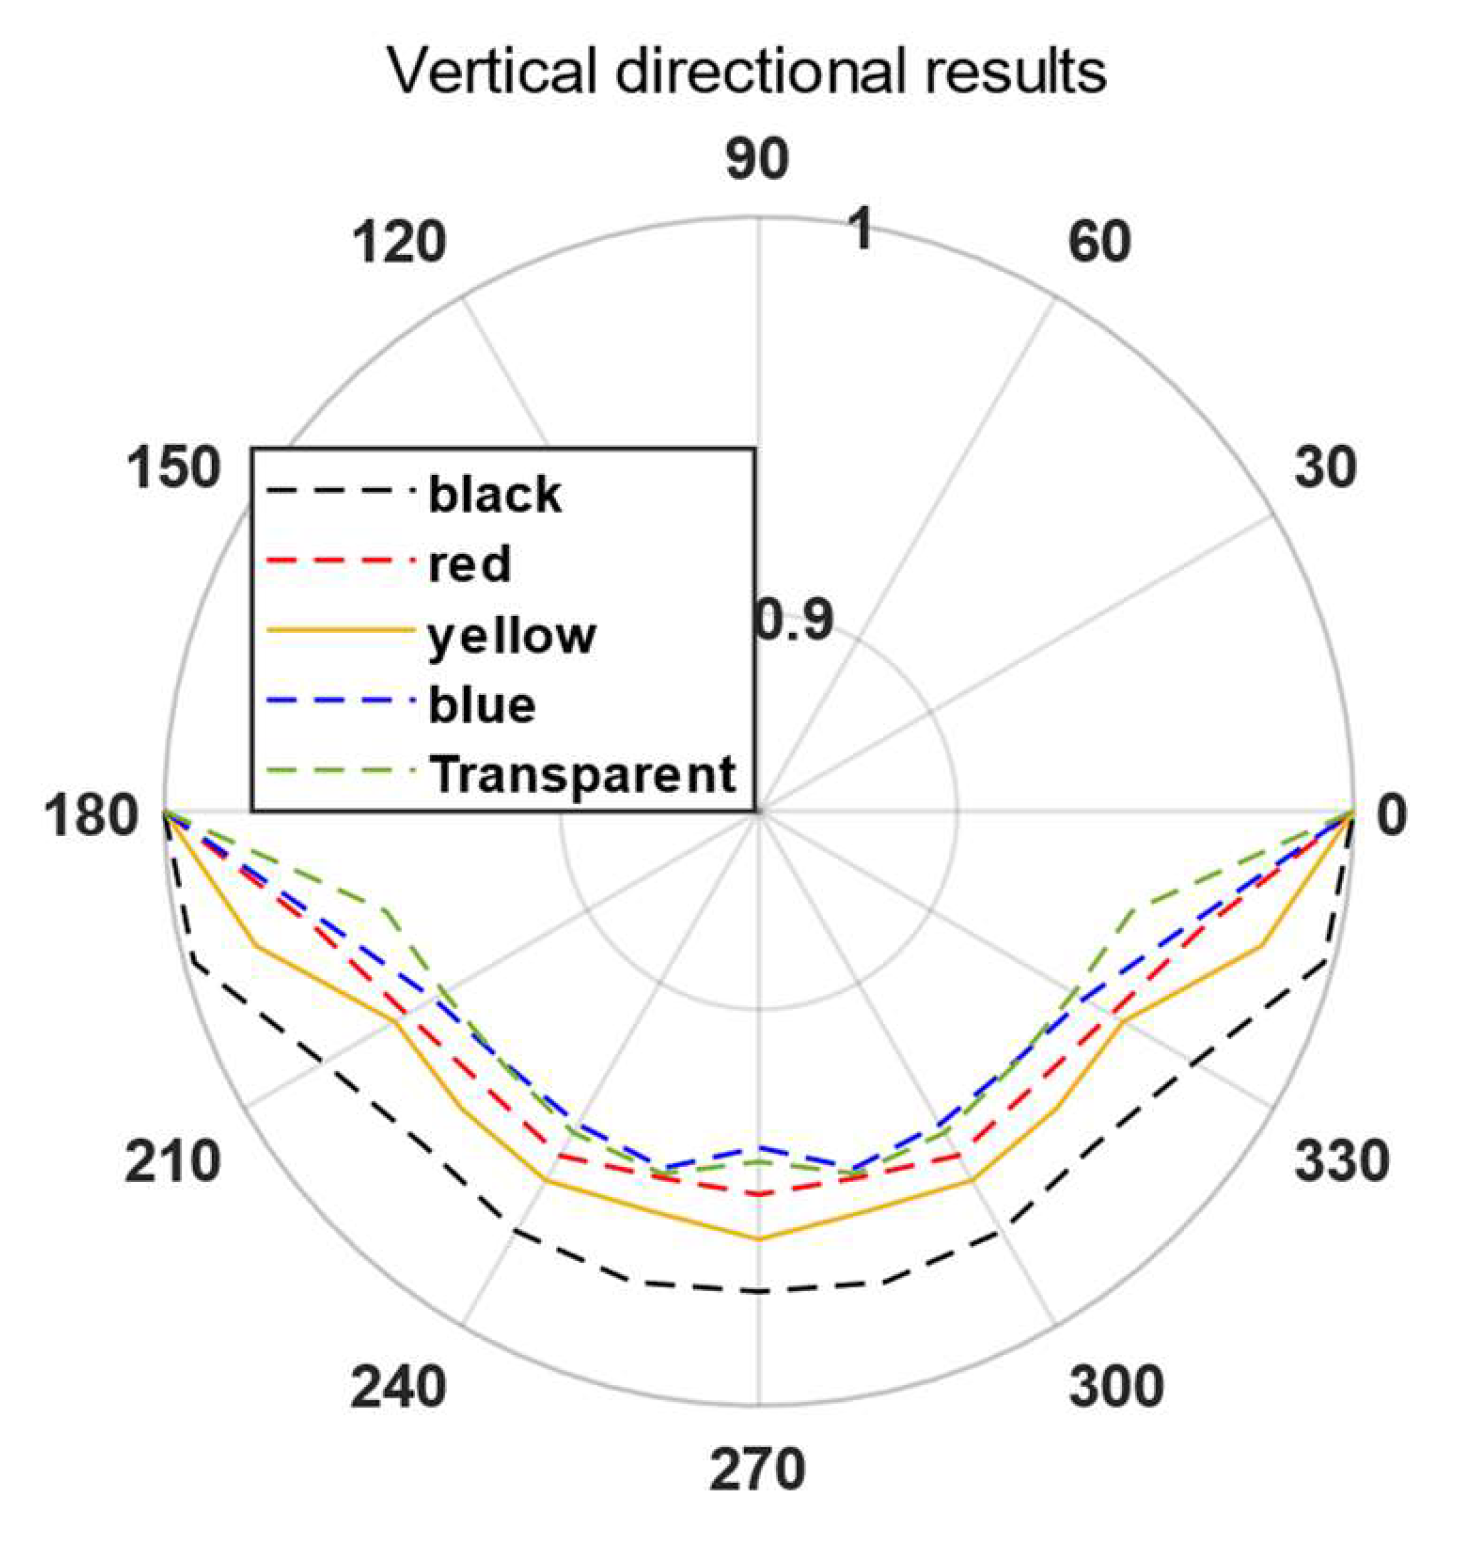
d = 0.4. Taking the center of the laser spot on the water surface as the origin, with a radius of 1 m, a circle was drawn on the vertical plane perpendicular to the water surface, maintaining a constant distance of 1 m. The angle between the center of the circle and the water surface on the right side, at 1 m from the center, was set at 0°. The underwater area was then divided into a range from 180° to 0°. Within this range, sampling was conducted every 15° using a hydrophone, with each position measured 50 times to obtain an average value as the actual measurement result for that position. The sound pressure level and directionality were calculated. The directionality results obtained from the experiments are shown in
Figure 4, where the legend indicates the different colorants added to the water, while the water without any colorant is represented separately.
From
Figure 4, it can be observed that changing the color of the water can alter the directionality of the laser-generated acoustic signals, but the energy of the acoustic signals is still concentrated in the horizontal direction. When the water color changes, significant differences in the directionality of the acoustic signals produced by the same laser are observed. The proportion of energy distributed in the vertical direction corresponding to different water colors, ranked from highest to lowest, is as follows: black, yellow, red, clear, and blue. The ratio of the intensity of the acoustic signal in the vertical direction to that in the horizontal direction is highest for black water, with a value of 0.97, and lowest for blue water, with a value of 0.93. The addition of blue dye to the water had little effect on the directionality, while other dyes caused noticeable changes. Suitable dyes can be selected based on different application needs to color the water and meet specific directionality requirements. Although adding dyes to the water changed the directionality of the laser acoustic signals and increased the energy distribution in the vertical direction, it did not alter the advantage of horizontal directionality. When the water color was yellow, the generated acoustic signal strength was at its maximum, measuring 193 dB, while the minimum signal strength was observed with black water, measuring 187 dB. Therefore, the color of the water not only changes the directionality of the signals but also affects the intensity of the laser acoustic signals.
3.2. Laser Absorption Rates of Different Colored Water and Their Correlation with Liquid Properties
Significant differences exist in the absorption rates of different colored media for 1064 nm laser [
14]. To study the relationship between the absorption rate
T in the directional formula of the sound source model and the liquid-related coefficient
α, a spectrometer measured water of different colors. The spectrometer was positioned 0.5 m above the water surface for detection, receiving the reflected signals from the water surface. Through calculations, the absorption rate
T of the water for the laser was obtained, while
α was derived from the calculations of the directional experiment. The obtained absorption rates and the liquid-related coefficients in relation to the color of the water are shown in
Table 1.
As shown in
Table 1, the color of the water affects the absorption rate and the liquid correlation coefficient, thereby influencing directivity. Specific directivity values can be obtained and signal modulation achieved by changing the color of the water. It can be concluded from
Table 1 that the water color changes the intensity of the laser acoustic signal by affecting the laser absorption rate. In general, the higher the laser absorption rate, the higher the intensity of the generated laser acoustic signal.
3.3. Study of the Frequency Domain Characteristics of Water of Different Colors
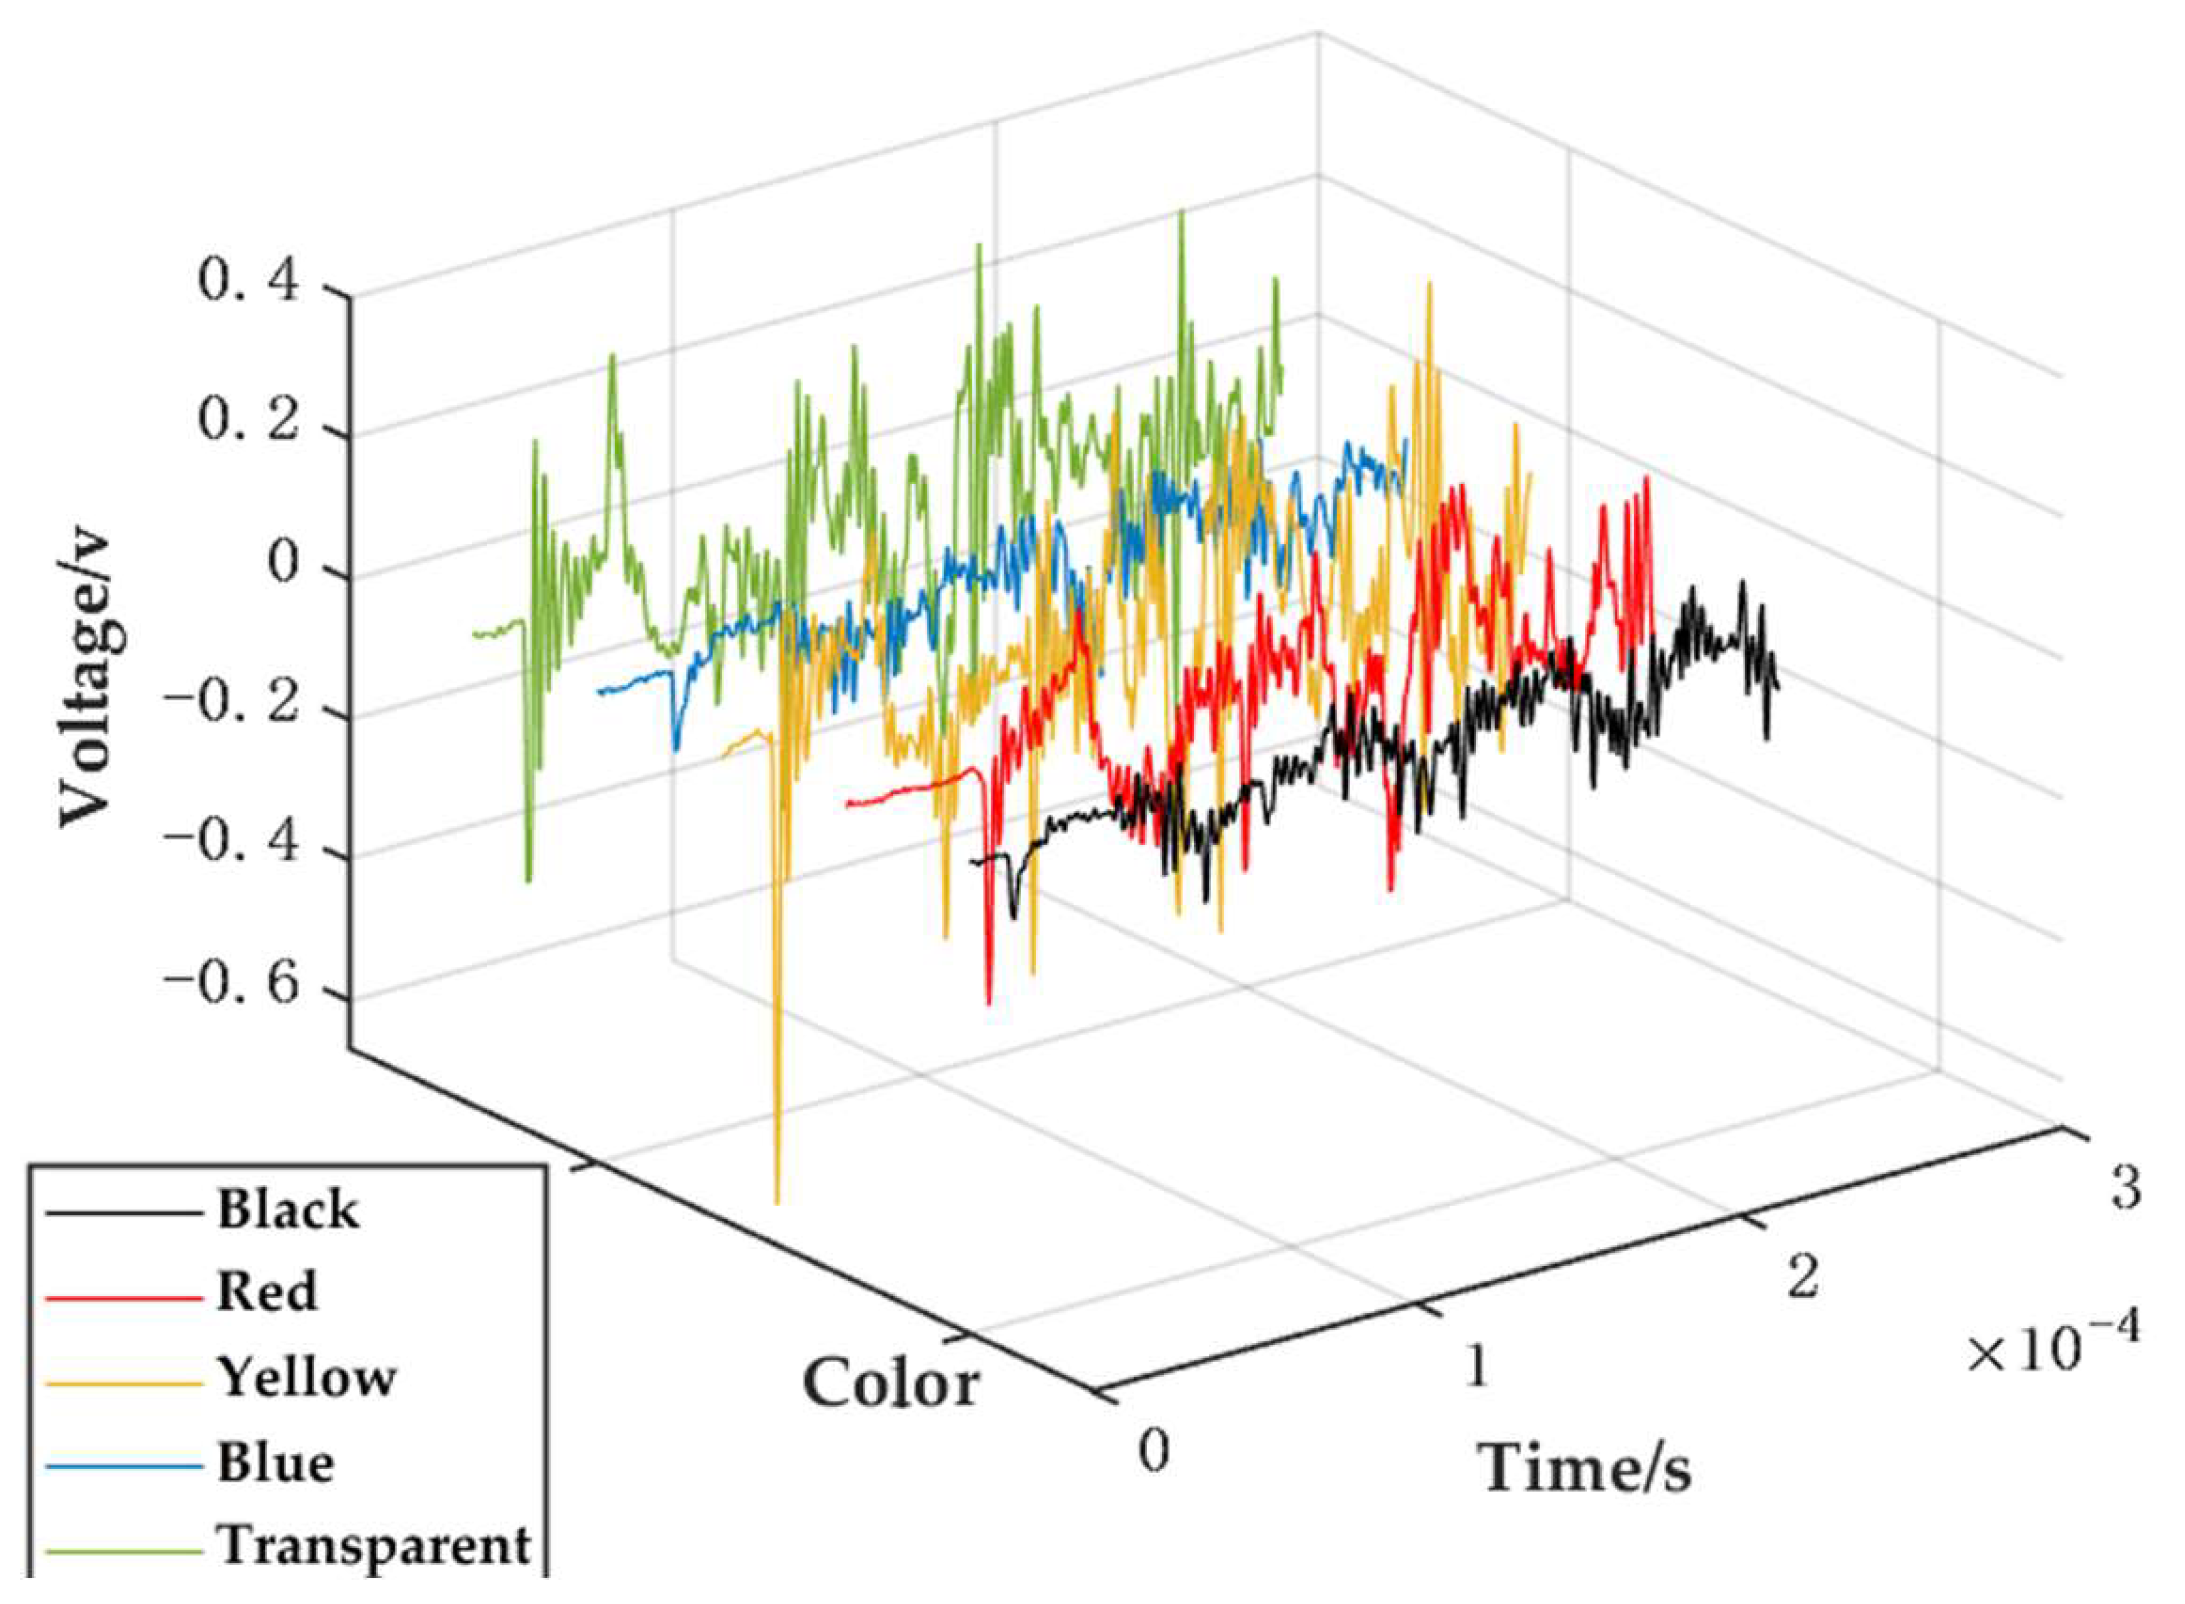
In order to verify the influence of water color on laser-induced acoustic signals, an experimental study on the time–frequency domain characteristics of laser-induced sound was conducted. The liquid selected for the experiment was water, into which colorants of the same concentration were added, resulting in red, blue, yellow, and black coloration. This altered the color of the water, while a control group was established without any added colorants. A Nd:YAG laser with a wavelength of 1064 nm, pulse width of 6–8 ns, energy of 0.15 J, and repetition frequency of 1 Hz was used to emit pulsed laser light. The laser was directed vertically onto the water surface through a lens, inducing sound, while a hydrophone was used for data collection at a horizontal distance of 1 m from the sound source. Each position was measured 50 times. To reduce errors caused by signal randomness, the average value of the peak laser-induced acoustic signals from the 50 repeated measurements was taken as the actual measurement result for that position, and the sound pressure level was calculated. The signals were also filtered and denoised, and frequency domain spectra were plotted. The pulse duration of the laser-induced acoustic signals generated in the experiment was generally about 1 × 10
−4 s; therefore, the time domain waveform within 2 × 10
−4 s was extracted for time domain analysis, and the results are shown in
Figure 5 below.
In
Figure 5, the
x-axis represents time, the color of the line segments corresponds to the water color as shown in
Figure 5, and the
z-axis indicates the voltage values generated by the sound signals in the hydrophone, which can be converted to sound pressure levels after calculation. The different water colors do not cause significant changes in the duration of sound signal pulses, but there are notable differences in the intensity of sound signals generated by the laser when interacting with different dyes. The average peak voltage from 50 measurements of the hydrophone was calculated to determine the sound pressure levels, resulting in sound signal intensities of 180.13 dB, 176.99 dB, 176.33 dB, 168.35 dB, and 168.31 dB for yellow, red, clear, blue, and black water, respectively. When the laser energy was reduced to 0.05 J, the yellow water produced two distinct laser sound signals within 50 s, while no significant sound signals were generated in the other colored waters. Thus, yellow water has a clear positive effect on laser-induced sound, whereas black water reduces the intensity of the laser sound signals.
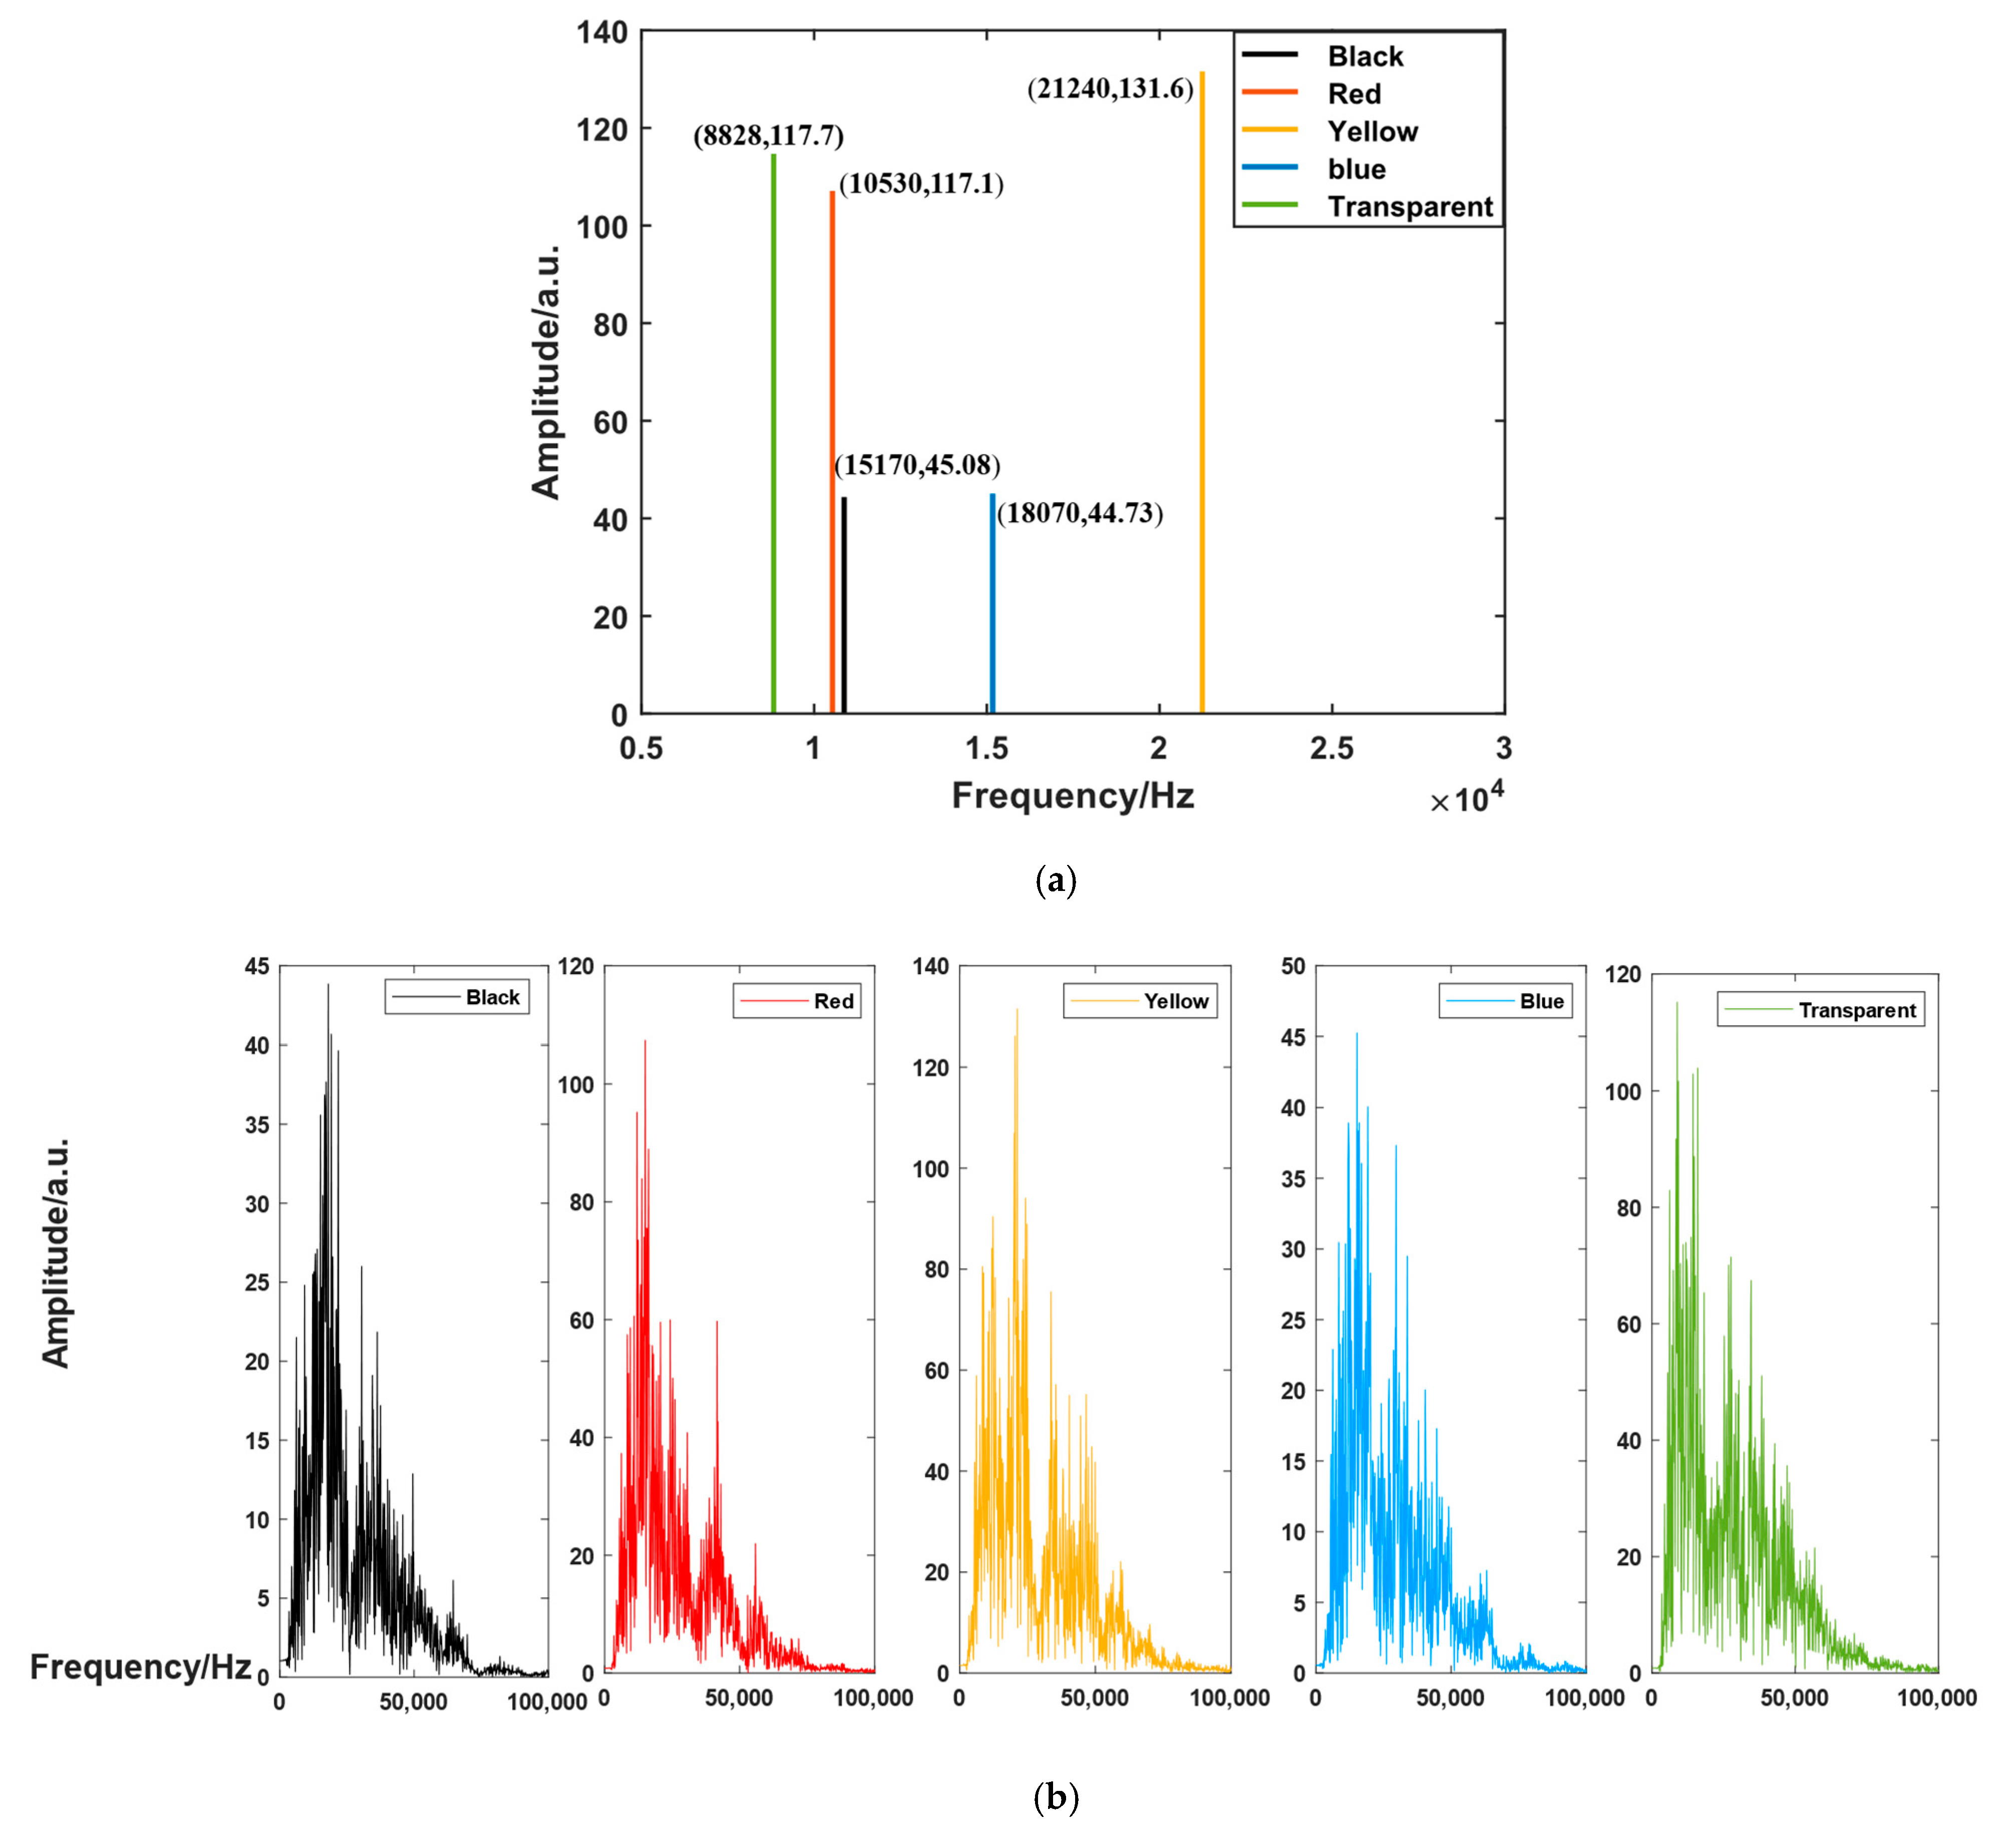
The frequency domain analysis of laser acoustic signals examines their peak frequencies. The peak frequencies of the acoustic signals generated by the different colored water are shown in
Figure 6 below.
In
Figure 6, the horizontal axis represents the peak frequency of the laser acoustic signal, while the vertical axis represents the amplitude of the peak frequency. The color of the line segments corresponds to the color of the water, as shown in the upper-right corner of the figure. The results indicate that the addition of dye can significantly alter the peak frequency of the laser acoustic signal, with distinct differences in the peak frequencies produced by different dyes. Among them, the peak frequency of the acoustic signal generated by laser breakdown in clear water is the lowest at 8828 Hz, while the peak frequency of the acoustic signal generated by laser breakdown in yellow water is the highest at 21,240 Hz. The peak frequency is positively correlated with the propagation loss of the acoustic signal: the higher the peak frequency, the greater the propagation loss during transmission. Therefore, calculations are necessary in practical signal transmission to select the optimal dye. To study the impact of water color on signal transmission, a theoretical investigation of acoustic signal transmission was conducted. The relationship between the signal detection threshold, transmission distance, and signal frequency can be expressed as follows:
where SL represents the sound source level,
x is the propagation distance of the sound signal, and f is the frequency of the signal. By substituting the peak frequency of the sound signal obtained from the experiment and the sound source level into Equation (6), it can be observed that, when the signal transmission distance is less than 1 km, selecting yellow water can achieve a higher detection threshold. When the transmission distance exceeds 1 km, the detection threshold is higher without adding dye to the water. When the transmission distance is 1 km, the detection threshold is 114.3 dB.
4. Discussion
To study the effect of water color on laser acoustic signals, a conical sound source model was proposed, indicating that the ratio of the model’s radius (r) to the model’s vertical line (d) is a decisive factor affecting the directionality of laser acoustic signals. Simulations and experimental validations showed that the laser acoustic signal exhibited no significant directionality (r/d = 10) and that the energy distribution of the acoustic signal in the vertical direction significantly decreased (r/d = 0.4). Water color and laser wavelength influence the directionality of laser acoustic signals by affecting the liquid’s correlation coefficient and the rate of laser absorption by water. Research and analysis on acoustic signal directionality and absorption rates were conducted in environments with five different water colors: red, blue, yellow, and others. There were significant differences in the directionality, sound intensity, and peak frequency of the acoustic signals generated by laser breakdown in different colored waters: the ratio of horizontal to vertical sound signal intensity ranged from 0.93 to 0.97, the peak frequency ranged from 8 × 10³ Hz to 2.2 × 10⁴ Hz, and the signal sound intensity ranged from 168.31 dB to 180.13 dB. Based on the peak frequency and signal intensity corresponding to different water colors, it was calculated that, when the signal transmission distance is less than 1 km, yellow water can be selected as the breakdown medium to achieve a higher detection threshold. When the transmission distance is 1 km, the detection threshold is 114.3 dB, which has significance in guiding laser acoustic communication applications.
5. Conclusions
In this paper, we propose a conical sound source model, conduct theoretical and experimental research on signal directivity, and point out that the ratio of the model’s radius (r) to the model’s vertical line (d) is a decisive factor affecting directionality. We calculated the time–frequency characteristics and directivity of laser-induced sound waves in red, blue, green, and other colors of water and calculated the optimal water color corresponding to the highest detection threshold at different distances. Changing the color of the water can change the laser absorption coefficient and liquid correlation coefficient, thus changing the directivity and frequency characteristics of the laser acoustic signal. Laser-induced sound is a hot research topic at present, but it has been limited to theoretical research at present, because The modulation methods for laser-induced acoustic signals are quite limited. and can only be modulated in the time domain. It has been proven that the color of liquid has an obvious influence on the time–frequency characteristics and directivity of laser acoustic signals. Therefore, in practical applications, the time–frequency characteristics and directivity of the acoustic signal can be modulated by changing the color of the water at the sound location, so that signal transmission and longer-distance transmission can be achieved, or by placing dyesin a specific area, so as to obtain the precise location. In the future, it will be possible to achieve arbitrary modulation of signals by transmitting liquid flow and removing the original color of the liquid, enabling laser acoustics to be truly applied in the fields of signal transmission, communication, and detection.
Author Contributions
Conceptualization, T.Z. and X.C.; methodology, T.Z. and X.C.; software, T.Z. and Q.T.; validation, T.Z., X.C. and Y.Y.; formal analysis, T.Z. and Y.Y.; investigation, T.Z. and T.C.; resources, Y.D.; data curation, T.Z. and X.C.; writing—original draft preparation, T.Z.; writing—review and editing, T.Z., X.C. and J.Y. (Jianquan Yao); visualization, J.Y. (Jiaqi Yuan); supervision, J.Y. (Jianquan Yao); project administration, X.C.; funding acquisition, Y.Y. and J.Y. (Jianquan Yao). All authors have read and agreed to the published version of the manuscript.
Funding
This work was supported by the Opening Funding of National Key Laboratory of Electromagnetic Space Security and Laoshan Laboratory Science and Technology Innovation Project (No. LSKJ202200801).
Institutional Review Board Statement
Not applicable.
Informed Consent Statement
Not applicable.
Data Availability Statement
Data are contained within this article.
Conflicts of Interest
The authors declare no conflicts of interest.
References
- White, R.M. Elastic wave generation by electron bombardment or electromagnetic wave absorption. J. Appl. Phys. 1963, 34, 3559–3567. [Google Scholar] [CrossRef]
- Askaryan, G.A.; Prokhorov, A.M.; Chanturiya, G.F.; Shipulo, G.P. The effects of a laser beam in a liquid. Soviet physics. J. Exp. Theor. Phys. 1963, 17, 1463–1465. [Google Scholar]
- Fujimoto, J.G.; Lin, W.Z.; Ippen, E.P.; Puliafito, C.A.; Sternert, R.F. Time-resolved studies of Nd: YAG laser-induced breakdown. Plasma formation, acoustic wave generation, and cavitation. Invest Ophthalmol. Vis. Sci. 1985, 26, 1771–1777. [Google Scholar] [CrossRef] [PubMed]
- Brelet, Y.; Jarnac, A.; Carbonnel, J.; André, Y.B.; Mysyrowicz, A.; Houard, A.; Fattaccioli, D.; Guillermin, R.; Sessarego, J.P. Underwater acoustic signals induced by intense ultrashort laser pulse. Acoust. Soc. Am. 2015, 137, 288–292. [Google Scholar] [CrossRef] [PubMed]
- Buday, J.; Holub, D.; Pořízka, P.; Kaiser, J. Statistical behaviour of laser-induced plasma and its complementary characteristic signals. J. Anal. At. Spectrom. 2024, 39, 2461. [Google Scholar] [CrossRef]
- Fitzpatrick, A.; Singhvi, A.; Arbabian, A. An airborne sonar system for underwater remote sensing and imaging. IEEE Access 2020, 8, 189945–189959. [Google Scholar] [CrossRef]
- Luo, H.; Wang, J.; Bu, F.; Ruby, R.; Wu, K.; Guo, Z. Recent progress of air/water cross-boundary communications for underwater sensor networks: A review. IEEE Sens. J. 2020, 22, 8360–8382. [Google Scholar] [CrossRef]
- Jang, H.; Song, H.; Koh, H.S.; Yoon, T.; Know, Y.J. Shock wave generation in water by nanosecond pulse irradiation with 1064 and 2940 nm wavelengths. Opt. Laser Technol. 2023, 167, 109670. [Google Scholar] [CrossRef]
- Wang, X.; Huang, Z.; Shi, X. Laser-Induced Iridescent Steel Surfaces with Moderate Reflectance. Metals 2023, 13, 545. [Google Scholar] [CrossRef]
- Guay, J.; Lesina, A.C.; Côté, G.; Charron, M.; Poitras, D.; Ramunno, L.; Berini, P.; Weck, A. Laser-induced plasmonic colours on metals. Nat. Commun. 2017, 8, 16095. [Google Scholar] [CrossRef] [PubMed]
- Shi, X.; Huang, Z.; Laakso, M.; Niklaus, F.; Sliz, R.; Fabritius, T.; Somani, M.; Nyo, T.; Wang, X.; Zhang, M.; et al. Quantitative assessment of structural and compositional colors induced by femtosecond laser: A case study on 301LN stainless steel surface. Appl. Surf. Sci. 2019, 484, 655–662. [Google Scholar] [CrossRef]
- Khafaji, N.Y.; Demir, A.G.; Vitali, L.; Fustinoni, D.; Taha, Z.A. Optical characterization of laser coloured titanium under different processing atmospheres. Surf. Coat. Technol. 2017, 321, 156–163. [Google Scholar] [CrossRef]
- Choi, M.S.; Seo, H.S.; Kim, J.G.; Choe, S.J.; Park, B.C.; Kim, M.H.; Hong, S.P. Effects of picosecond laser on the multi-colored tattoo removal using Hartley guinea pig: A preliminary study. PLoS ONE 2018, 13, e0203370. [Google Scholar] [CrossRef] [PubMed]
- Bosáková, M.; Purohit, P.; Alvarez-Llamas, C.; Moros, J.; Novotný, K.; Laserna, J. A systematic evaluation on the impact of sample-related and environmental factors in the analytical performance of acoustic emission from laser-induced plasmas. Anal. Chim. Acta 2022, 1225, 340224. [Google Scholar] [CrossRef] [PubMed]
- Afifi, H.A.; Abdel-Ghani, M.; Mahmoud, R.; Alkallas, F.H.; Trabelsi, A.B.; Mostafa, A.M. Comparative Study between First and Second Harmonics of a Nd: YAG Laser for Cleaning Manifestation Damages That Appeared in Pigments Used on Archaeological Cartonnage. Micromachines 2023, 14, 1415. [Google Scholar] [CrossRef] [PubMed]
- Tsubouchi, M.; Endo, T.; Itakura, R. Mid-infrared light-induced photoacoustic wave in water and its application. Appl. Phys. Express 2023, 16, 012007. [Google Scholar] [CrossRef]
- Yao, Z.; Li, Y.; Lv, G.; Chen, D.; Yang, J.; Guo, S. Structural optimization of photoacoustic transducer with PDMS/CSNPs nanocomposite for fatigue crack detection using laser-induced nonlinear surface waves. Mater. Des. 2024, 238, 112635. [Google Scholar] [CrossRef]
| Disclaimer/Publisher’s Note: The statements, opinions and data contained in all publications are solely those of the individual author(s) and contributor(s) and not of MDPI and/or the editor(s). MDPI and/or the editor(s) disclaim responsibility for any injury to people or property resulting from any ideas, methods, instructions or products referred to in the content. |
© 2025 by the authors. Licensee MDPI, Basel, Switzerland. This article is an open access article distributed under the terms and conditions of the Creative Commons Attribution (CC BY) license (https://creativecommons.org/licenses/by/4.0/).


 ,
, 

