1. Introduction
The Doppler effect, resulting from relative motion between the transmitter and receiver, leads to signal distortion and significant frequency shifts. This phenomenon poses a critical challenge in both active and passive sonar detection, as well as in underwater communication systems. Active and passive sonar systems are essential tools for underwater target localization. Traditional target parameter estimation methods, such as beamforming for azimuth estimation [
1] and matched field processing for range and depth estimation [
2,
3], are notably influenced by Doppler-induced distortions. The time-delay Doppler filtering method [
4] can be used to estimate the target range and radial velocity. The Doppler effect not only affects localization accuracy but also provides insights into target motion parameters. In underwater communication, the relatively slow speed of sound compared to that of electromagnetic wave propagation renders acoustic channels highly susceptible to Doppler effects arising from transmitter or receiver motion [
5]. Doppler frequency shifts can severely disrupt carrier frequency tracking and phase synchronization in communication systems.
Currently, research methods for studying the Doppler effect in the ocean waveguide sound field, caused by the relative motion of the transmitter and receiver, primarily rely on normal mode theory and ray theory. Since the 1970s, researchers such as Guthrie et al. [
6] have investigated the Doppler effect induced by the motion of the sound source in studies on the propagation of low-frequency continuous-wave (CW) signals over long distances in the SOFAR channel. Their theoretical derivation demonstrated that Doppler frequency shifts corresponding to different horizontal wave numbers in the moving source waveguide sound field vary, and that the motion of the sound source causes the measured signal to exhibit multiple discrete spectral lines in the frequency domain. Building on this, Hawker [
7] computed the Doppler frequency shifts and mode function corrections for different normal mode modes by calculating stationary points. Subsequently, Schmidt and Chapman [
8] proposed a more refined wave number integration- and normal mode theory-based waveguide sound field model which incorporates the Doppler effect under conditions of motion for both the source and receiver. Since each mode in normal mode theory corresponds to a specific Doppler frequency shift, and the normal mode order is influenced by the sound source frequency and the ocean environment of the waveguide, the number of modes is large at mid-to-high frequencies. Consequently, normal mode theory is typically applied to the Doppler effect calculations for low-frequency moving sound source fields and waveguide environments, while it has limitations for the calculation of high-frequency moving sound source fields.
When subjected to certain constraints, ray theory can serve as an approximate solution to wave acoustics. Clark et al. [
9] simulated the frequency spreading caused by multipath effects in the SOFAR channel in 1976, calculating the average Doppler frequency shift and phase shift through the delay differences in various sound ray paths induced by the motion of the sound source. Jacyna and Jacobson [
10] applied ray theory to explain the geometric path, propagation loss, boundary loss, and phase shift caused by the motion of the source. Subsequently, they simulated the sound field of a moving sound source emitting narrowband and broadband signals in the SOFAR channel [
11,
12], based on a bilinear sound speed profile, focusing on the changes in propagation loss induced by the source motion. Byun et al. [
13] introduced random scattering paths into multipath rays, considering both the motion of the sound source and the receiver, and established a time-varying underwater acoustic channel influenced by the motion of both the source and the receiver.
It can be concluded that most existing research on the characteristics of sound fields from moving sound sources focuses on areas such as underwater acoustic channel modeling for moving sound sources, propagation loss changes induced by sound source motion, and Doppler frequency shift prediction and compensation. However, research on the distribution characteristics of Doppler frequency shift differences corresponding to multipath rays in the depth direction within the SOFAR channel is relatively scarce. Given the complexity of normal mode theory calculations when the source emission frequency lies in the mid-to-high frequency range (above 1 kilohertz) within SOFAR channel environments, ray theory is chosen, as it offers a more practical approach for the real-time prediction of Doppler effects in the sound field of moving sound sources in the SOFAR channel.
Over the past decade, the Doppler effect of moving sound sources has been widely acknowledged to play a role in underwater acoustic measurements, noise source localization, underwater acoustic communication, and ocean current mapping. Tanaka et al. [
14] investigated the application of the Doppler effect in underwater ultrasonic systems, deriving and validating the influence of sound speed variations and ocean currents on the accuracy of Doppler frequency shift measurements. Deguchi et al. [
15] conducted numerical simulations to examine the impact of non-uniform Doppler frequency shifts on underwater acoustic communication between surface and submerged vehicles, demonstrating that Orthogonal Frequency Division Multiplexing (OFDM) exhibits greater sensitivity to Doppler frequency shifts in multipath environments compared to Single Carrier Modulation (SCM). Huang et al. [
16] applied Doppler frequency shift compensation to mitigate the effects of towing sound source motion on propagation time, thereby facilitating the effective estimation of the spatial distribution of ocean currents. Sun et al. [
17] proposed a joint estimation framework for time delay-Doppler parameters based on sparse representation, significantly enhancing parameter resolution in shallow water environments.
When the sound source is in motion, the Doppler effect in the waveguide environment manifests as multipath spectral splitting in the measured signal spectrum. In this study, time–frequency spectrum analysis of 1 s pulse width CW signals from sea trial data was initially conducted, revealing significant frequency shifts for the D&S and B&SB ray paths. Fourier transform and Wigner–Ville distribution time–frequency analysis methods were then employed to extract the frequencies of the sound signals arriving along these two ray paths. Additionally, by analyzing the sound field spectrum of 15 s pulse width signals from the sea trial data, stable vertical distribution characteristics of the frequency shifts corresponding to the D&S and B&SB ray paths were observed. Based on ray theory, this study presents a method for calculating Doppler frequency shifts in propagating sound signals in vertically stratified marine environments and establishes a model for calculating multipath frequency shifts in the SOFAR channel environment. This study reveals that the vertical distribution pattern of the sound source’s frequency spectrum in the frequency domain is similar to the that of the multipath delay structure in the time domain. This is primarily due to the frequency shift differences of multipath rays induced by waveguide effects, which lead to spectral splitting and the emergence of characteristic patterns in the sound field of the moving sound source. By comparing the measured frequency shifts in the sound signals from the D&S and B&SB ray paths with model predictions during the motion of the transmitting vessel along three measurement lines, the model’s effectiveness was verified. Furthermore, the dependency of the frequency shifts for these two ray paths on the horizontal distance and horizontal azimuthal angle between the transmitter and receiver was examined.
2. Towed Sound Source Experiment in SOFAR Channel
An experiment on the propagation of sound from a moving source was conducted in the South China Sea, where the water depth is approximately 3780 m, and the depth variation within the experimental area was minimal, allowing the seafloor to be approximated as flat. The experiment was carried out during the spring season, and the measured ocean sound speed profile is representative of an incomplete SOFAR channel, with a surface waveguide thickness of approximately 5 m. The sound speed profile of the experimental area is shown in
Figure 1.
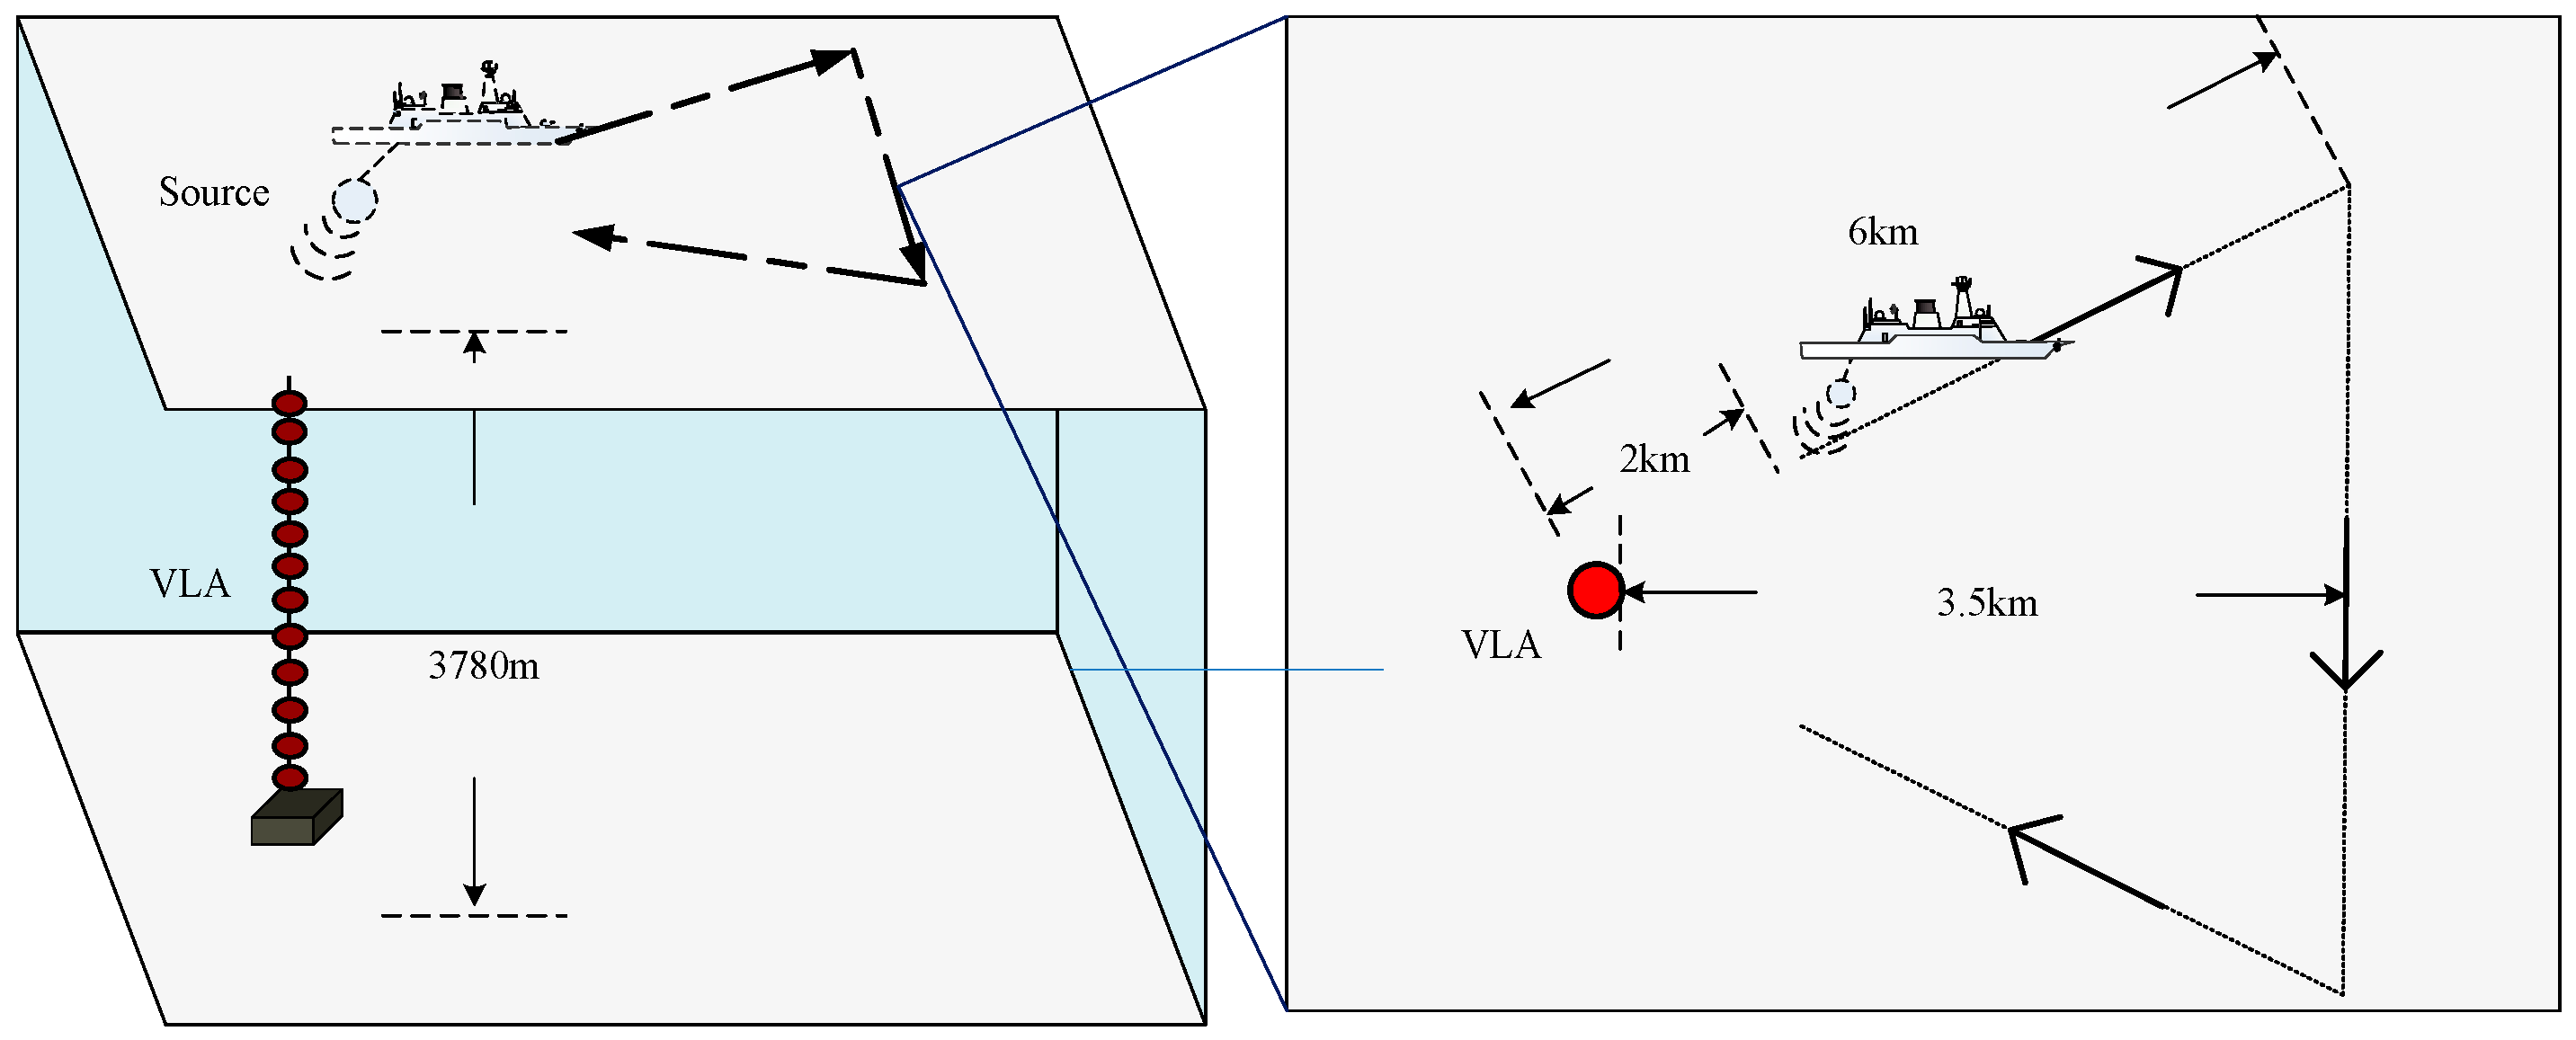
As shown in
Figure 2, during the experiment, the transmitting vessel performed a course around the full-depth vertical receiver array. The source movement speed was approximately 7.4 km/h, transmitting a single-frequency signal with a central frequency of 3200 Hz and pulse widths of 1 s and 15 s. The source level of the sound source emitting a single-frequency signal was 183 dB. During the towing process, the sound source was positioned at a depth of 30 m, while the receiving equipment consisted of a 47-element vertical hydrophone array, which covered the entire depth range. The 47 hydrophone elements were deployed in a non-equidistant configuration, where the shallowest element was positioned at a depth of 36 m and the deepest one at 3748 m. The sensitivity of the hydrophone was −170 dB. The transmitting vessel followed a triangular course, starting with the source located approximately 2 km from the receiver array and moving radially away from it (Line 1). The vessel then turned, and the source moved in a straight path, maintaining a vertical distance of 3.5 km from the receiver array. The vessel continued until the distance between the source and the receiver array reached 6 km, at which point it turned again (Line 2). Finally, the transmitting vessel moved toward the receiver array, stopping when the horizontal distance between the source and the receiver array reached 2 km (Line 3).
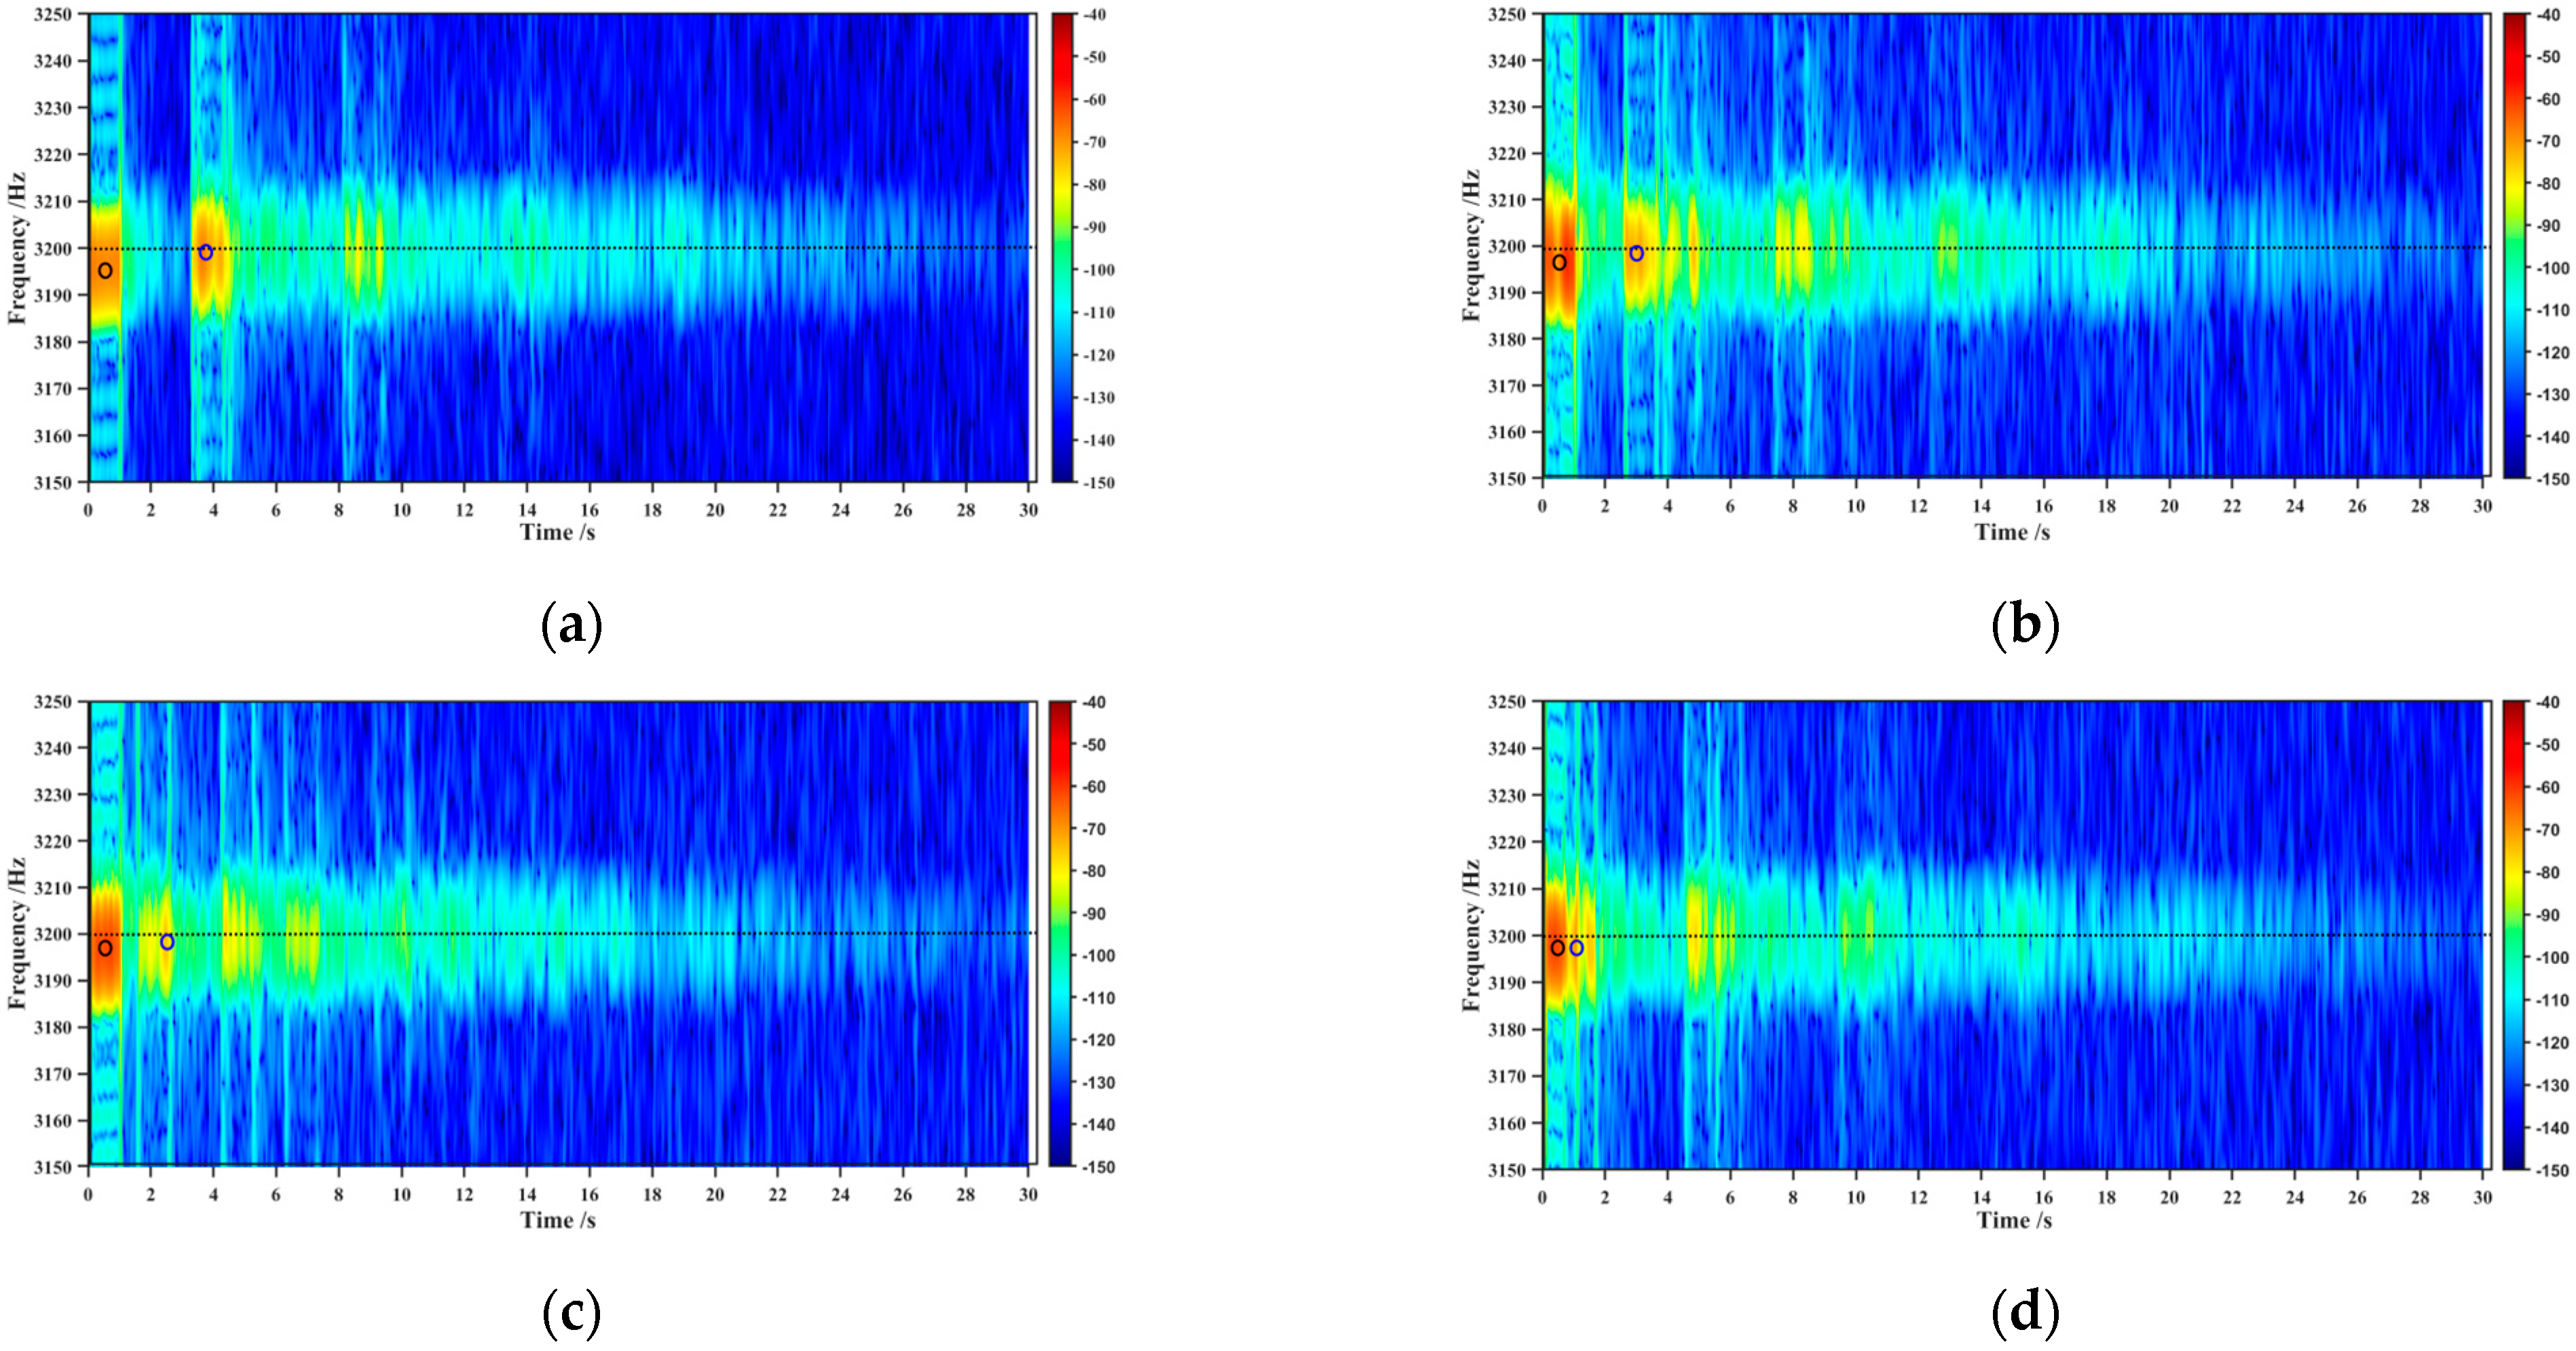
Due to the clearer multipath ray paths in the SOFAR channel when the transmitted signal had a pulse width of 1 s, the frequency shifts corresponding to these ray paths were determined through time–frequency analysis.
Figure 3 shows the time–frequency spectrum of the measured signal from hydrophone array elements at different receiver depths as the transmitting vessel towed the sound source away from the receiver. It can be observed from
Figure 3 that noticeable frequency shifts occurred for the first two groups of arriving sound waves. By considering the multipath arrival delays in the SOFAR channel, it is evident that the first group of arriving sound wave signals in
Figure 3 corresponds to the direct sound (D) and the first surface-reflected sound (S), labeled as D&S. The second group of arriving sound wave signals corresponds to the first seabed-reflected sound (B) and the first surface- and seabed-reflected sound (SB), labeled as B&SB. Based on the identification of ray paths, a comparison of the central frequencies of the two groups of arriving sound signals in
Figure 3 with the original transmitted signal frequency reveals that both groups exhibit a certain degree of frequency shift due to the motion of the sound source. Moreover, the frequency shifts for D&S and B&SB at the same receiver depth are found to differ in magnitude. As the source depth increases, the frequency shift corresponding to D&S gradually decreases, while the frequency shift corresponding to B&SB gradually increases.
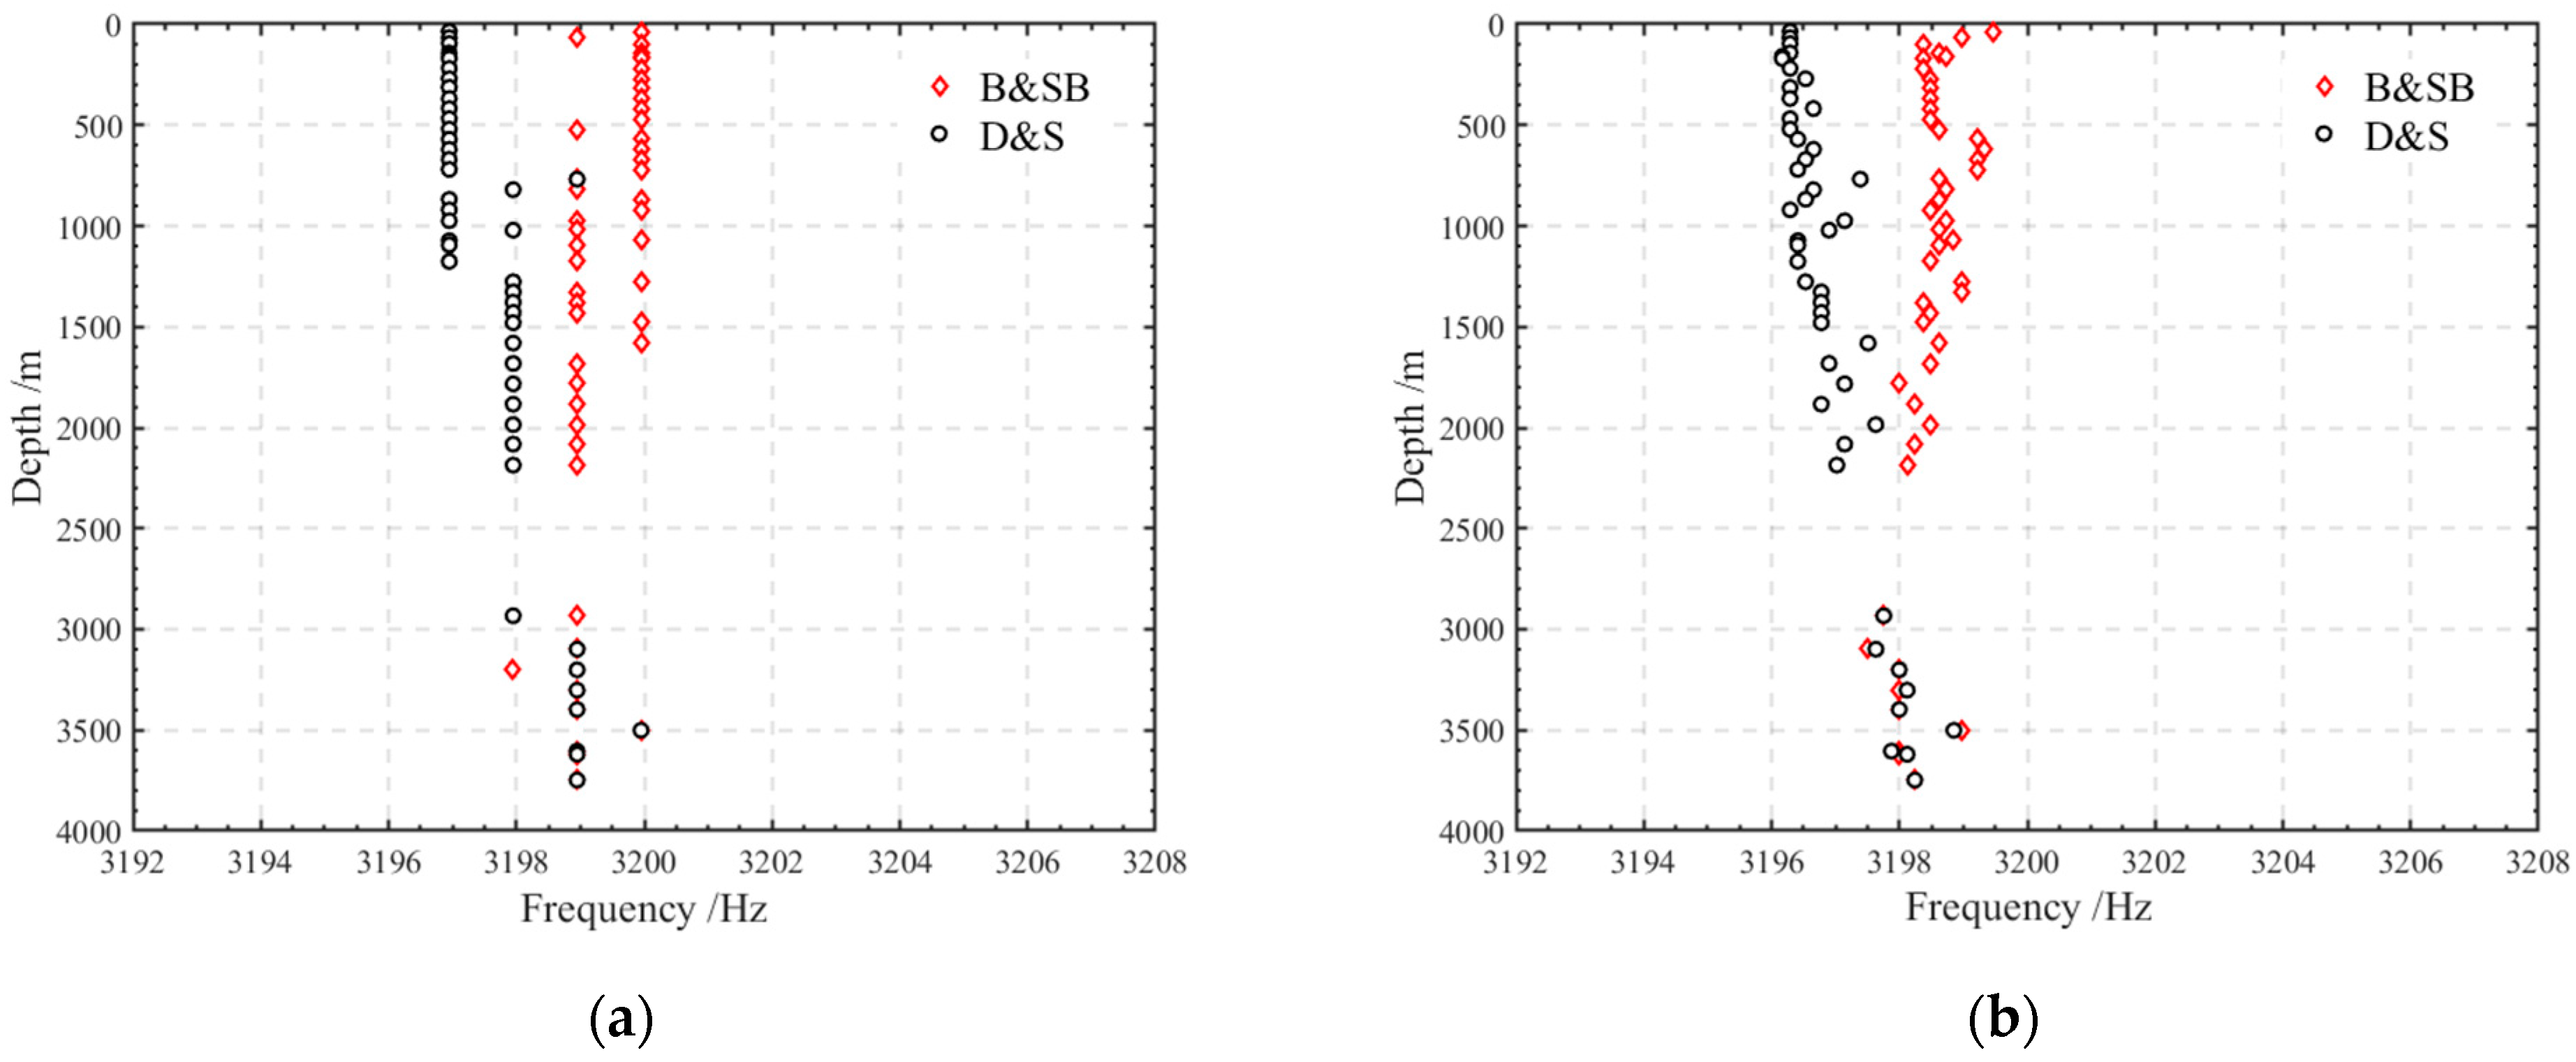
The peak frequencies of the spectra of signals received at the vertical array along the D&S and B&SB ray paths are extracted using both Fourier transform and Wigner–Ville distribution time–frequency analysis methods, as shown in
Figure 4. Due to the frequency domain resolution of Fourier transform being limited to 1 Hz with a pulse width of 1 s, only varying degrees of frequency shifts in the vertical distribution of D&S and B&SB are observable in
Figure 4a. Accurate estimation of the peak frequency of the vertical array received signal is not achievable with this method. As shown in
Figure 4b, the Wigner–Ville distribution time–frequency analysis, which enhances frequency domain resolution, preliminarily characterizes the distribution pattern of frequency shifts corresponding to D&S and B&SB in the depth direction under the source movement conditions. However, the peak frequency extraction results show fluctuations at certain receiving depths. Therefore, in the following analysis, the vertical distribution characteristics of the moving source sound field’s spectral splitting are studied using signals with a 15 s pulse width to ensure sufficient frequency domain resolution while maintaining the stability of the moving source sound field spectrum.
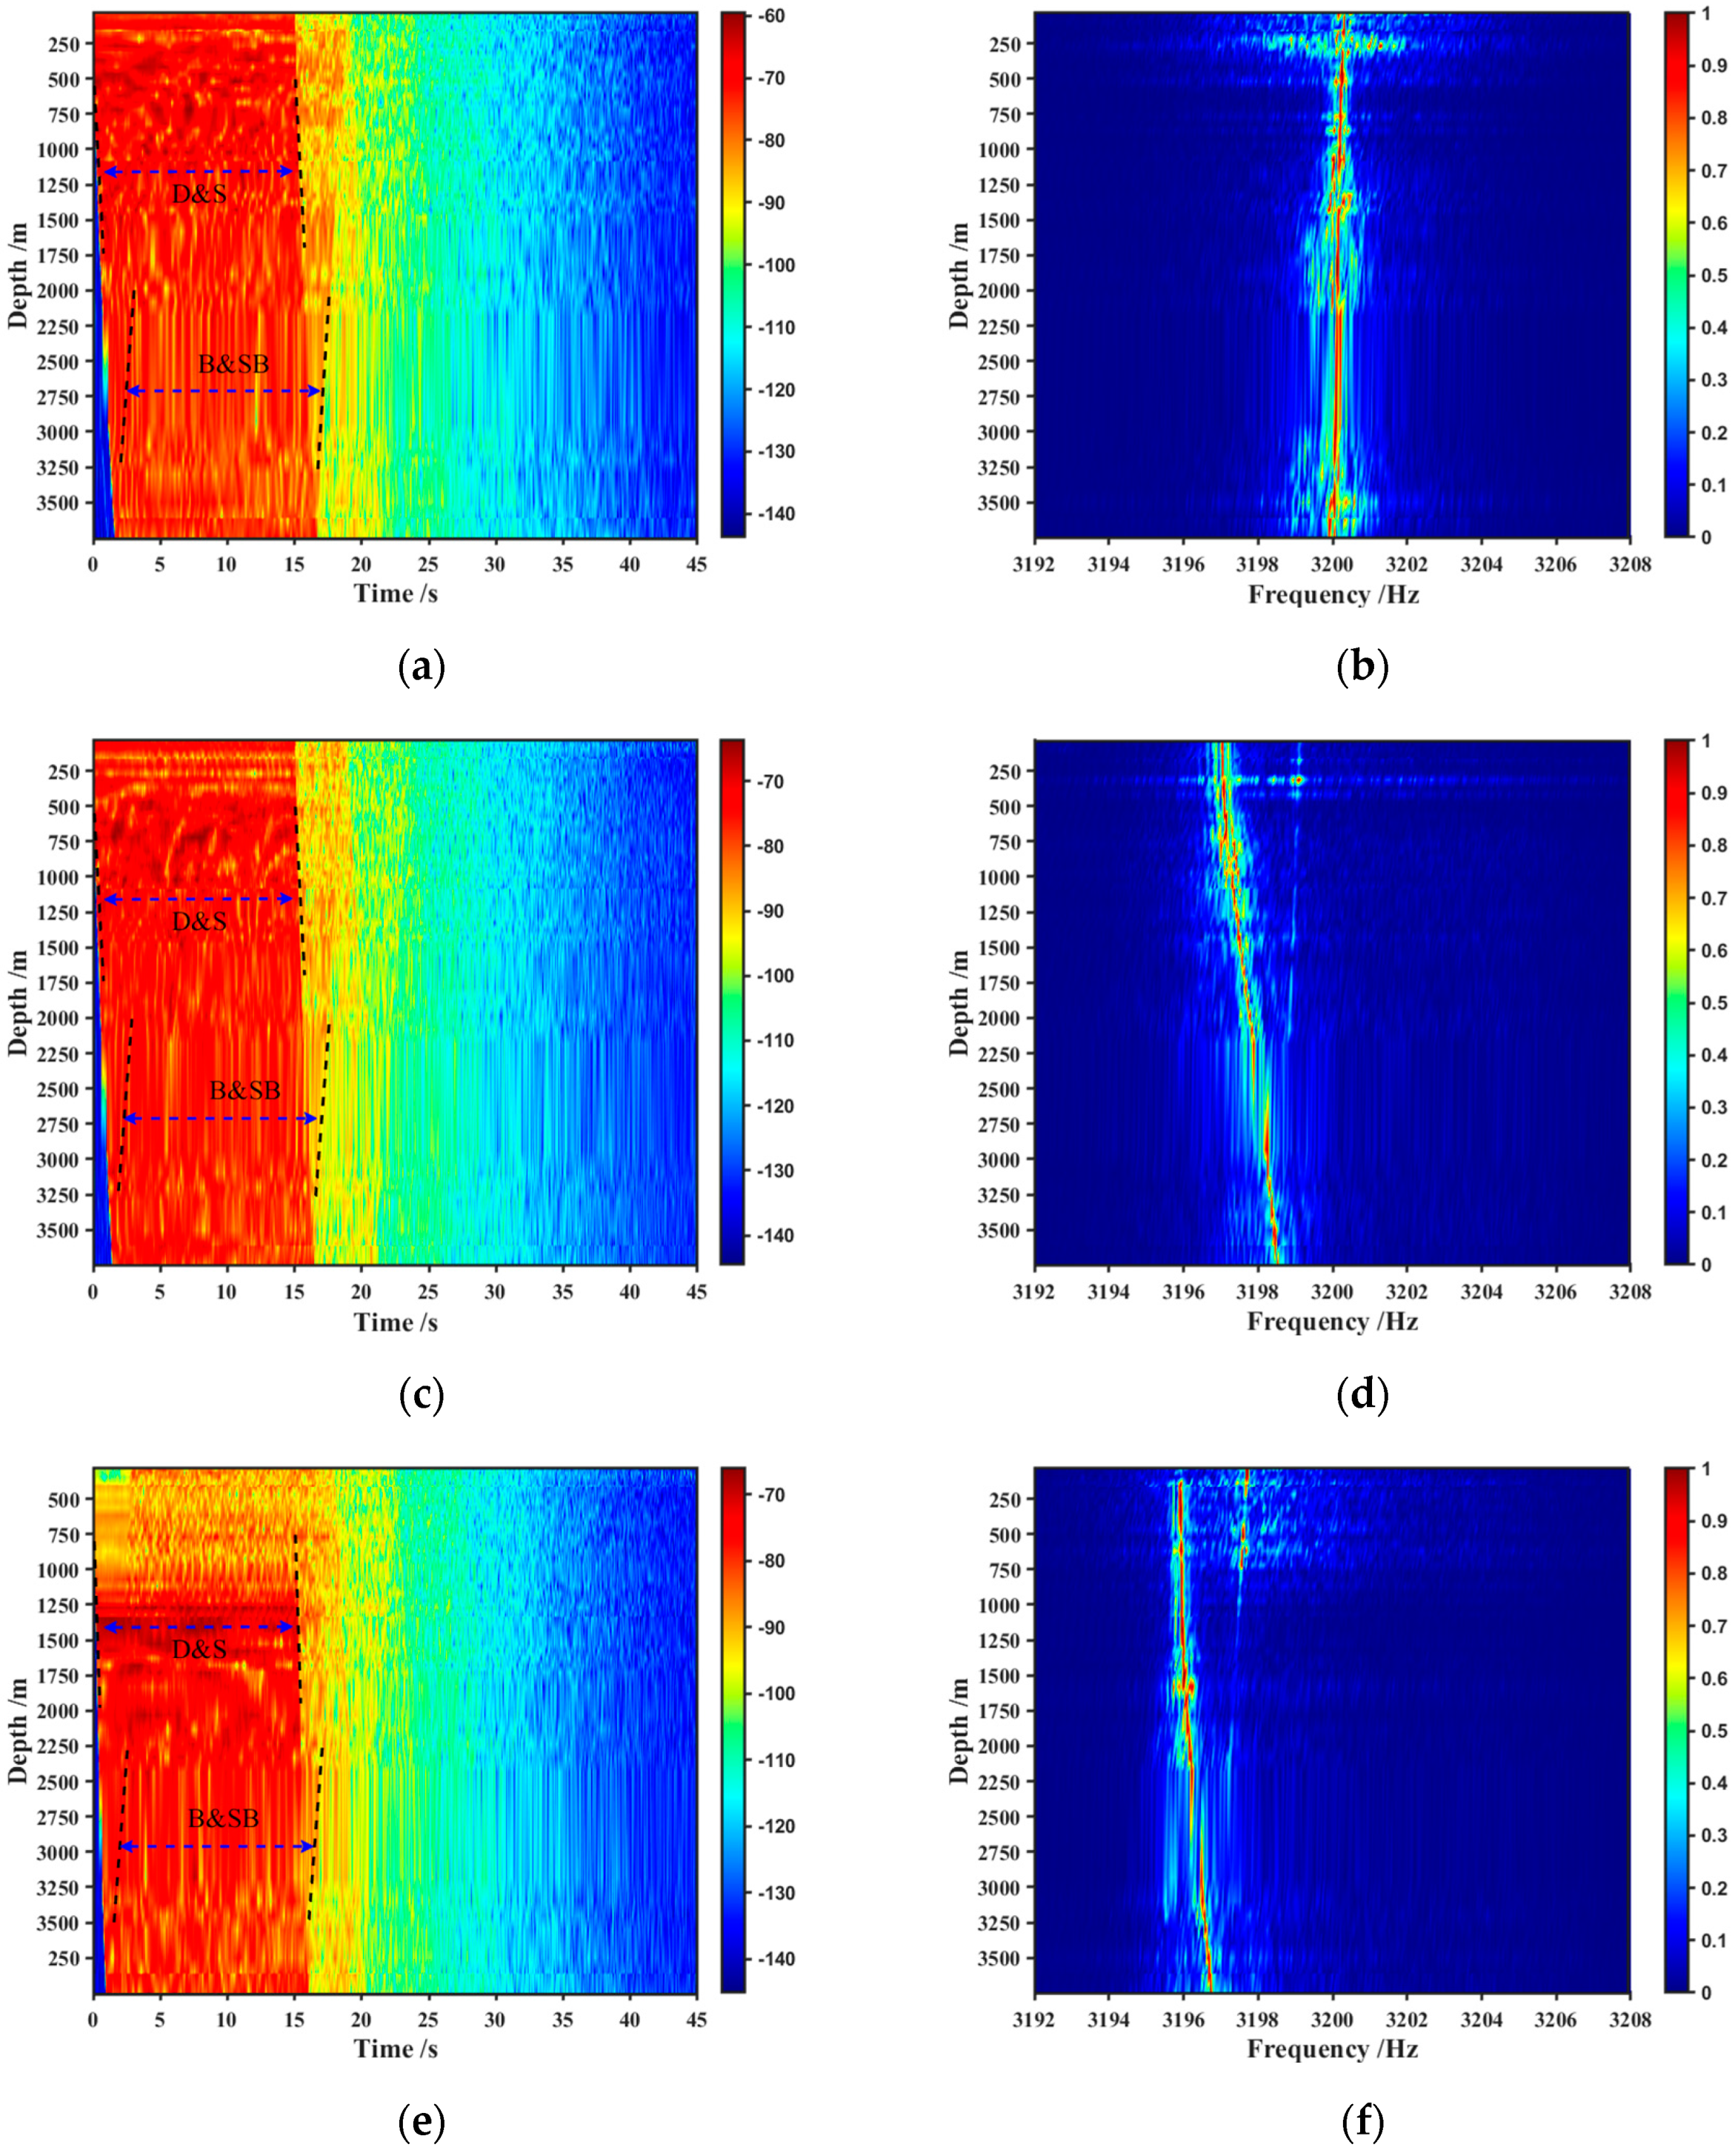
In the left column of
Figure 5, the multipath delay structure of the vertical array’s measured signal is presented for a transmitted signal with a 15 s pulse width. Although multipath sound ray paths overlap in the SOFAR channel, the arrival time ranges corresponding to D&S and B&SB can be distinguished through variations in time-domain signal intensity. Spectral analysis is performed on the received signal within the 0–20 s range. To minimize the impact of propagation loss differences at various receiver depths, the frequency spectrum of the signal received by each hydrophone element is normalized after Fourier transformation, as depicted in the right column of
Figure 5.
Figure 5b indicates that when the sound source is nearly stationary, minimal frequency shifts are observed for D&S and B&SB, with the measured signal’s center frequency at different vertical array depths closely matching the original transmitted signal frequency. However,
Figure 5d,f display two bright lines that vary with depth in the frequency domain that when the sound source is in motion. Combined with
Figure 4b, the left bright line corresponds to the vertical distribution of the D&S arrival signal frequency, while the right bright line corresponds to that of the B&SB arrival signal frequency.
When the sound source is in motion and the transmission–reception distance is 2 km, as shown in
Figure 5c,d, the D&S signals are able to consistently reach the vertical array. Due to the lower propagation loss of D&S compared to that of B&SB, the peak frequency of the received signal spectrum at the vertical array is primarily determined by D&S. However, when the transmission–reception distance increases to 4.7 km, as shown in
Figure 5e,f, the refraction of sound rays, induced by the SOFAR channel sound speed profile, causes D&S ray path failing to reach the shallow receiver depth elements. In this case, the peak frequency of the received signal spectrum at shallow depths is instead determined by the B&SB ray path.
Based on the analysis of the previous results, it is concluded that when the source is stationary, the multipath ray paths move into the SOFAR channel, caused by source motion, resulting in their overlap in the frequency domain. In contrast, when the source is in motion, due to the Doppler frequency offset differences between the multipath rays, there is a distinct separation of the D&S and B&SB ray paths in the frequency domain, as observed in the experimental results.
3. The Multiple-Path Ray Frequency Shift Calculation Model
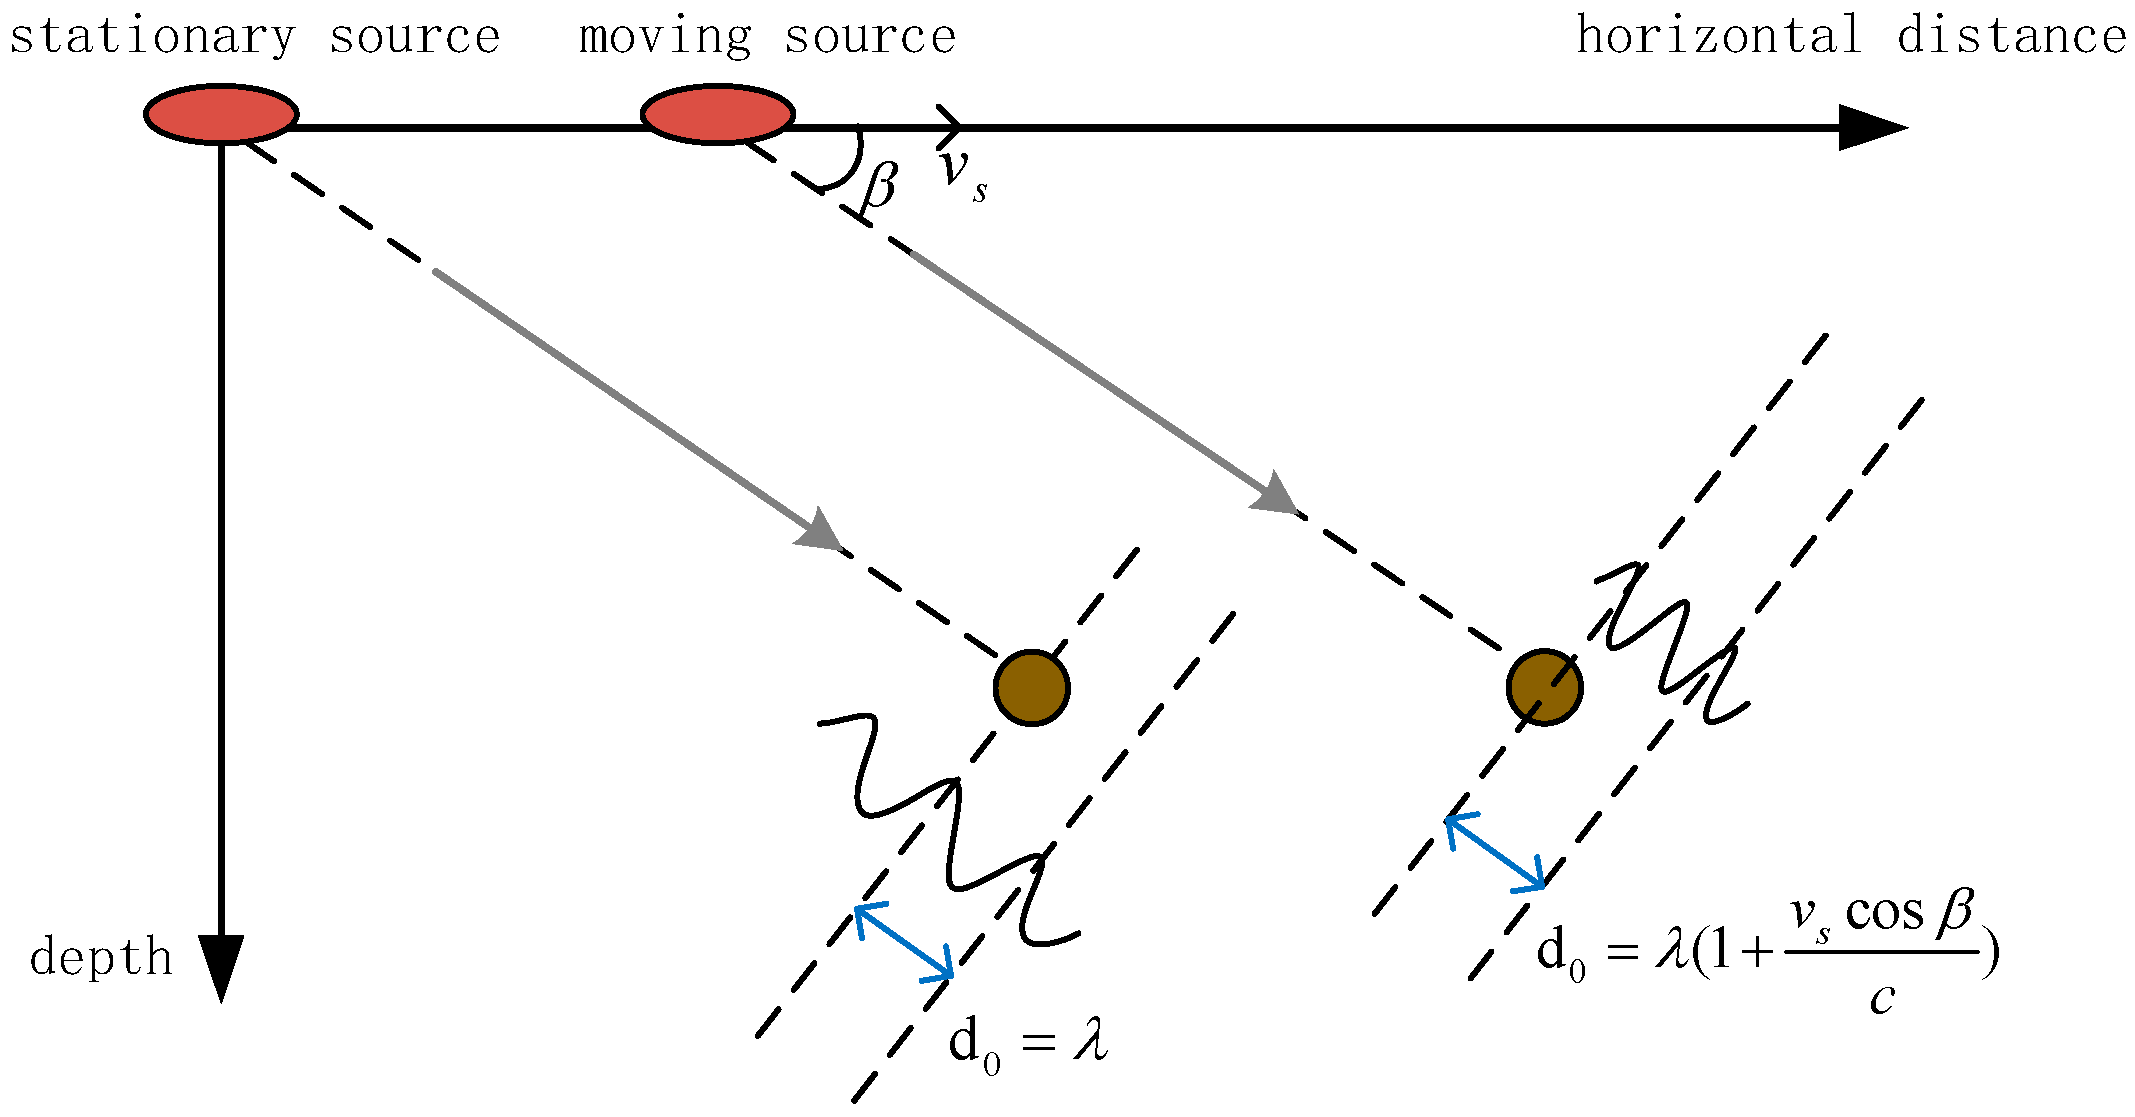
3.1. Doppler Frequency Shift Caused by the Moving Sound Source
Assuming the ocean medium is immobile with a constant sound speed, denoted as
, and considering a sound source moving horizontally, as depicted in
Figure 6, when the hydrophone is stationary, the sound source is moving at a speed of
, emitting a sound wave of frequency
, and the angle between the sound source and the hydrophone is
, the motion of the sound source induces a change in the wavefront of the sound waves received by the hydrophone. Specifically, the additional velocity component of the sound source along the line connecting the transmitter and receiver will alter the wavelength of the sound wave. It should be noted that the sound speed in the medium does not change. The wavelength of the received sound wave at the hydrophone can be expressed by the following formula:
Therefore, the frequency of the sound wave received by the hydrophone is as follows:
The maximum frequency shift in the ray during the source motion is expressed as follows:
At this point, the wavenumber of the sound field is changed to the following:
When calculating the moving sound field, the wavenumber needs to be corrected as described above.
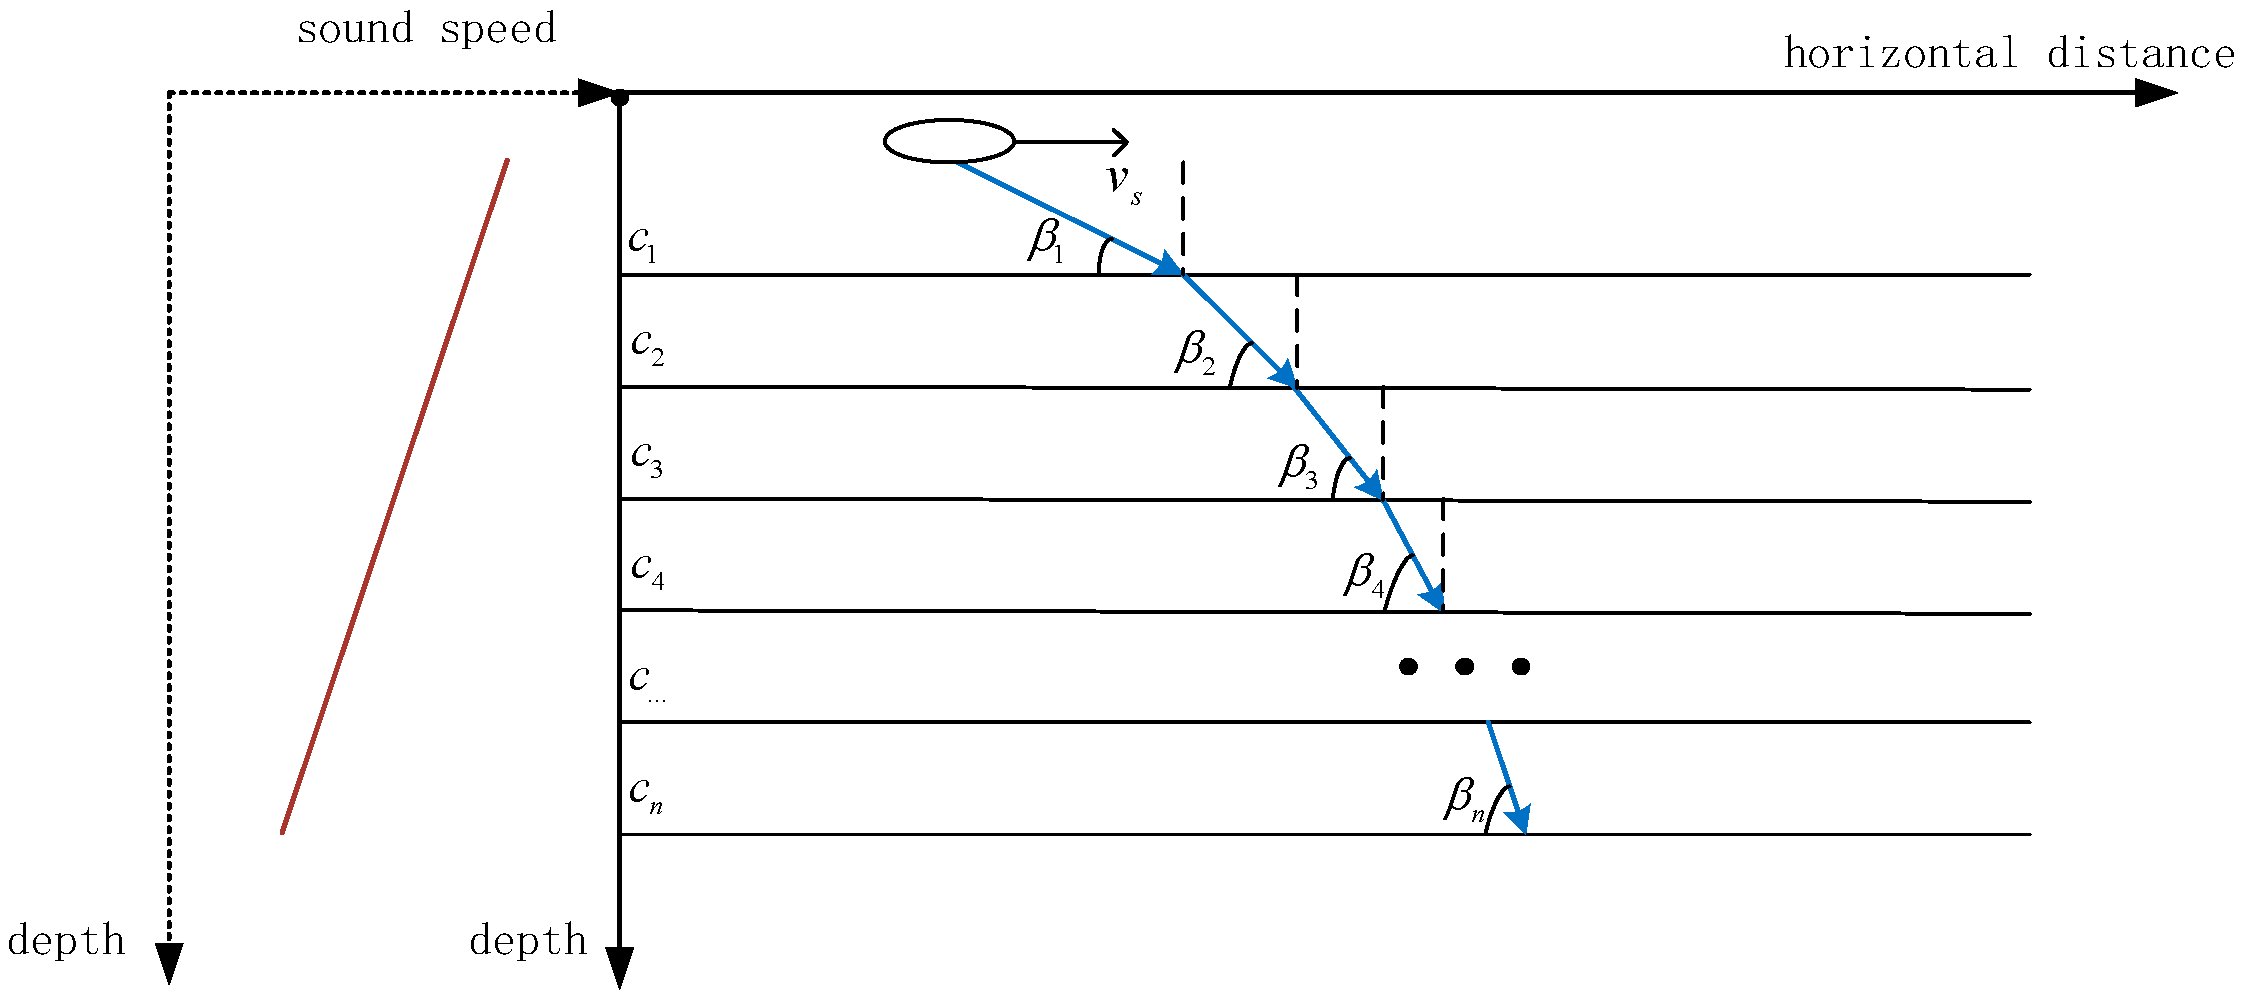
In practical ocean environments, sound speed varies with depth. When the seawater is considered as an ideal vertically stratified medium, as shown in
Figure 7, refraction of the sound rays occurs during the sound wave propagation.
When the angle between the direction of the sound ray and the moving source at the emission point is denoted as
, the Doppler frequency shift of the ray at the emission point is expressed as follows:
The grazing angle of the sound wave propagation in a stratified medium satisfies Snell’s law:
The Doppler frequency shift of a sound signal propagating along the same ray in a stratified medium is found to satisfy the following:
In an ideal stratified medium, the Doppler frequency shift of a ray remains constant during propagation. The Doppler frequency shift of the incident ray at the receiver is equal to the Doppler frequency shift of the ray at the source emission point. By calculating the initial grazing angle of the ray, the Doppler frequency shift induced by the source motion in the propagation of the acoustic signal along the ray can be estimated.
When the source moves laterally relative to the line connecting the transmitter and receiver, i.e., when there is a horizontal azimuth angle
, the Doppler frequency shift associated with the propagating acoustic signal along the ray path is given by the following:
3.2. Calculation of the Emission Angle of the Eigenray Using the Geometric Ray Method
From Equation (8), it is evident that the Doppler frequency shift of the propagating sound signal is directly related to the emission angle of the ray. Under the assumption of a uniform sound speed profile in the horizontal direction, and accounting for the variation in the sound speed gradient in the vertical direction within the SOFAR channel, the initial grazing angle of the intrinsic ray at the point of emission is calculated in this section using the geometric ray method.
Assuming the sound source is positioned at coordinates
and the receiver at
, with the sound speed in the SOFAR channel denoted as
, and the ocean depth as
, according to Snell’s law, the arrival angle
at each position along the ray path is related to the initial grazing angle
at the emission point as follows:
where
When the ray path is a direct path ray (D), the relationship between the horizontal distance to the receiver and the initial exit grazing angle can be expressed as follows:
If the sound wave is emitted upward and undergoes only one surface reflection (S) during propagation, the relationship between the horizontal distance to the receiver point and the initial exit grazing of the corresponding ray can be expressed as follows:
where
is the grazing angle of the sound wave when the sound wave is incident on the sea surface, and it satisfies
Similarly, if the sound wave is emitted downward and undergoes only one seabed reflection (B) during propagation, the relationship between the horizontal distance of the receiving point for the seabed-reflected ray and the initial exit grazing angle can be expressed as follows:
When the sound wave incident on the seabed, , is the grazing angle of the sound wave, and it satisfies
Based on the sound ray propagation trajectory in the ocean waveguide, if the sound wave is emitted upward and first undergoes one sea surface reflection followed by one seabed reflection before reaching the receiver (SB), the relationship between the horizontal distance of the receiving point for this ray path and the initial exit grazing angle can be expressed as follows:
By discretizing the exit grazing angles of the sound rays, the horizontal distances at the receiver point depth for the four path types (D, S, B, or SB) are calculated. If the result of is less than a certain critical value, it is determined that the sound ray can reach the receiver point, thus obtaining its corresponding exit angle. With the known values of the source’s motion speed, source depth, hydrophone depth, and sound speed profile, and the original frequency of the emitted signal, the initial exit angles of the multipath ray paths are first calculated. Subsequently, the frequency shift caused by the source’s motion in the SOFAR channel multipath sound rays is then determined according to Equation (8).
3.3. Numerical Calculation Results of the Vertical Distribution of Multipath Sound Ray Frequency Shifts
The multipath effect in the SOFAR channel is manifested as a multipath delay structure in the time domain, and similar characteristic patterns also exist in the frequency domain. When the source is stationary, the center frequency of the received signal at the vertical array remains relatively consistent. However, the motion of the source within the waveguide environment induces frequency shifts in the propagating sound signals along different multipath ray paths. As a result, the multipath arrival paths become separated in the frequency domain, and the frequency spectrum of the received signal at the vertical array displays distribution characteristics similar to those of the multipath delay structure.
Assuming a calm sea surface, the source moves radially away from the receiver at ground speeds of 5 km/h and 7 km/h, respectively, emitting a single-frequency signal centered at 3200 Hz. The source is positioned at a depth of 30 m, and the ocean’s sound speed profile is set as the measured incomplete SOFAR channel speed profile depicted in
Figure 1.
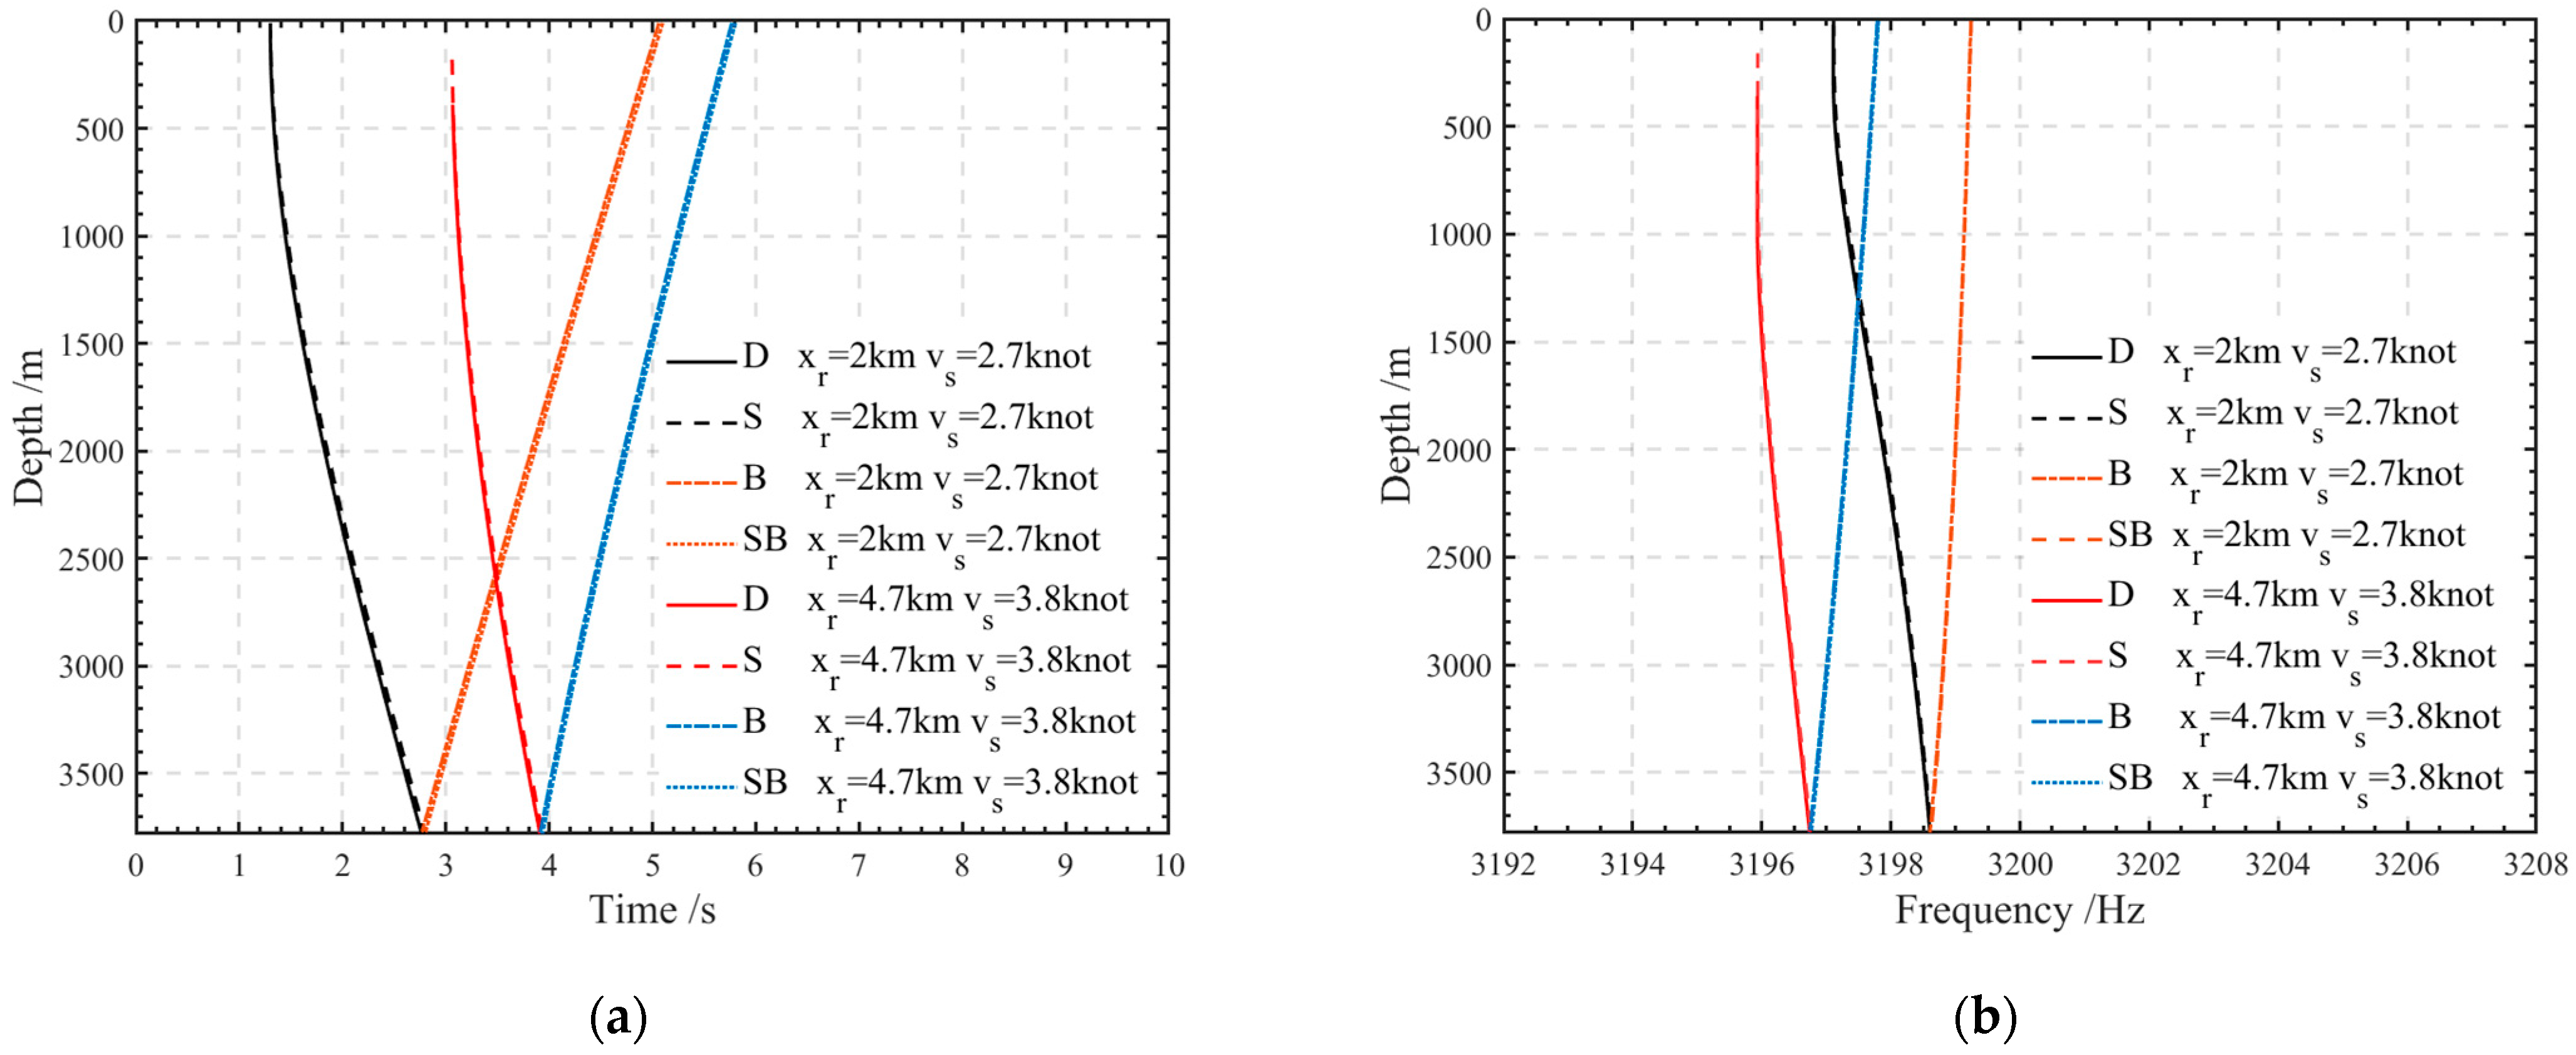
Figure 8 illustrates the multipath delay structure and the frequency shift for the D&S and B&SB ray paths at horizontal distances of 2 km and 4.7 km between the source and receiver. As shown in
Figure 8a, it can be observed that the delay of the D&S path progressively increases with the receiver depth, whereas the B&SB path exhibits an inverse relationship. Moreover, variations in the horizontal distance between the source and receiver lead to changes in the relative arrival delay differences in the D&S and B&SB ray paths.
When the source is located near the sea surface, the arrival time delays of the direct (D) and surface-reflected (S) paths are not only very closely aligned in the time domain, but also exhibit nearly identical frequency shifts. This phenomenon in the time domain arises because the relative distance between the source and the sea surface is much smaller than both the horizontal and vertical distances between the source and the receiver. In the frequency domain, it occurs due to the similar initial grazing angles of the D and S paths at the source. Therefore, when the source moves at a relatively low speed and the emitted signal frequency is within the mid-to-low frequency range, the frequency shifts of both paths are essentially the same. As indicated by Equations (10) and (11), since the horizontal distance between the transmission and reception points remains constant for different receiver elements of the vertical array, and because the term
increases monotonically with
, the hydrophone depth
is negatively correlated with
. Thus, based on Equation (7), it can be concluded that as the depth increases, the frequency shift of the D&S arrival signal gradually decreases. Similarly, for the rightmost terms in Equations (12) and (13), the depth
of the hydrophone is positively correlated with
. Consequently, as the depth increases, the frequency shift of the B&SB arrival signal gradually increases. Furthermore, as shown in
Figure 8b, when the source depth, the original emission frequency, the horizontal azimuth, and the sound speed profile are fixed, the frequency shift and the frequency shift difference of the two paths (D&S and B&SB) are directly related to the horizontal distance between the source and receiver, as well as the speed of the source’s movement.
4. The Analysis of Sea Trial Data and Theoretical Validation
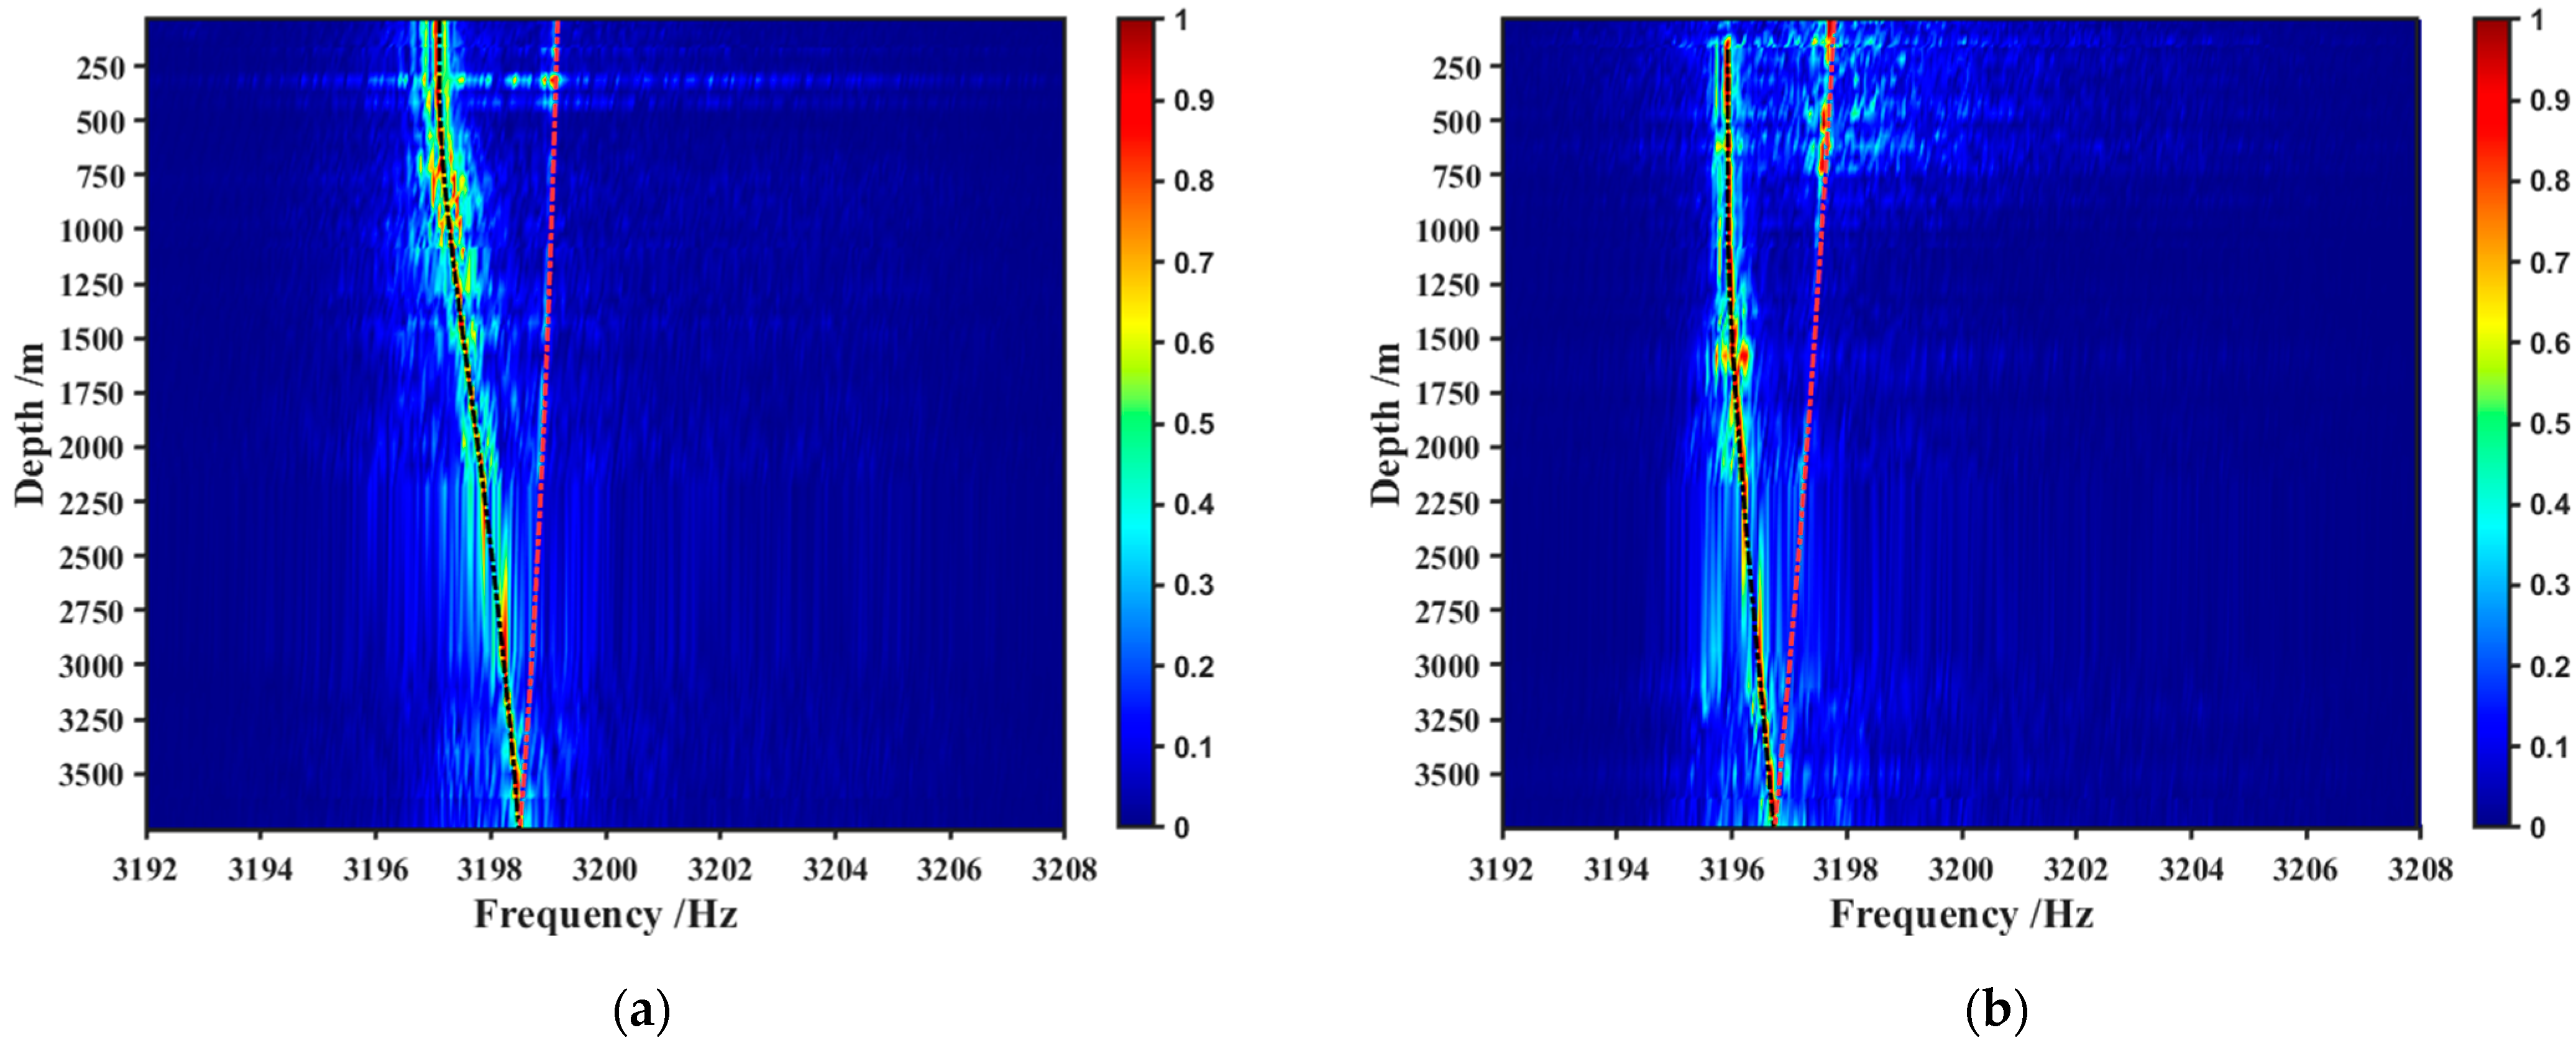
As shown in
Figure 9, the frequency calculation results for the D&S and B&SB paths from
Section 3.3 are compared with the measured spectrum splitting results. The model prediction results are consistent with the measured signal frequency shifts, and the frequency shift variation in the vertical direction matches the experimental data. When the hydrophone is at a shallow depth, the initial emission angles corresponding to D&S rays can be approximated as
. At this point, the frequency shift of the D&S arrival signal in
Figure 9a approaches the maximum Doppler shift. In
Figure 9b, the SOFAR channel sound speed profile prevents D&S acoustic signals from reaching shallow receiving depths. As the horizontal distance between the source and receiver increases, rays that satisfy
will stably reach vertical array elements at greater depths.
The dependence of frequency shifts for the D&S and B&SB ray paths on both distance and horizontal azimuth is compared between the measured data and model predictions in the following analysis.
In
Figure 10a, the ship’s speed is shown as the source moves radially away from (Line 1) and toward (Line 3) the receiver. The horizontal axis represents the average horizontal distance between the transmitting ship and the receiver during the 15 s pulse signal emission, while the vertical axis represents the local average speed of the ship. The dependence of multipath frequency shifts on distance is investigated through Line 1 and 3. During the ship’s motion along Line 2, both the horizontal azimuth and the horizontal distance between the transmitter and receiver change. In
Figure 10b, the changes in the ship’s speed are presented as it moves laterally along Line 2, either approaching or moving away from the receiver. The horizontal axis represents the horizontal azimuth between the transmitting ship and the receiver during the 15 s pulse emission, while the vertical axis represents the local average speed of the ship. The focus of this analysis is on the influence of the horizontal azimuth on the multipath frequency shift along Line 2.
Figure 11 presents a comparison between the model prediction results and the measured frequencies of the D&S and B&SB ray paths at a receiver depth of 1176 m. As shown in
Figure 11a, when the transmitting vessel moves radially, the overall trend can be summarized as follows: with the increase in horizontal distance between the transmitter and receiver, the frequency shift of both the D&S and B&SB ray paths gradually increases, while the rate of increase in the frequency shift decreases and approaches the maximum Doppler shift. The comparison between the model and measured data results in
Figure 11a confirms that, in the ocean waveguide environment, during the radial motion of the source, the frequency shift of the D&S and B&SB ray paths satisfies Equation (7).
When the transmitting vessel moves along measurement Line 2, the frequency shift of the two ray paths is simultaneously influenced by the horizontal transmission distance and the horizontal azimuth angle, with the range of azimuth angle variation being
. From the measured results in
Figure 11b, it can be observed that when the source moves laterally towards the receiver, the Doppler shift is positive, and the frequency shift gradually decreases with increasing azimuth angle. Conversely, when the source moves laterally away from the receiver, the Doppler shift is negative, and the frequency shift gradually increases with increasing azimuth angle. A comparison between the model prediction and measured results in
Figure 11b shows that the frequency shift of the D&S and B&SB ray paths is directly proportional to the cosine of the horizontal azimuth angle. When the influence of the azimuth angle is non-negligible, the frequency shifts of both ray paths closely match the results calculated using Equation (8).


