Abstract
The purse seine is a fishing method in which a net is used to encircle a fish school, capturing isolated fish by tightening a purse line at the bottom of the net. Tuna purse seine operations are technically complex, requiring the evaluation of fish movements, vessel dynamics, and their interactions, with success largely dependent on the expertise of the crew. In particular, efficiency in terms of highly complex tasks, such as calculating the shooting trajectory during fishing operations, varies significantly based on the fisher’s skill level. To address this challenge, developing techniques to support less experienced fishers is necessary, particularly for operations targeting free-swimming fish schools, which are more difficult to capture compared to those utilizing Fish Aggregating Devices (FADs). This study proposes a method for predicting shooting trajectories using the Double Deep Q-Network (DDQN) algorithm. Observation states, actions, and reward functions were designed to identify optimal scenarios for shooting, and the catchability of the predicted trajectories was evaluated through gear behavior analysis. The findings of this study are expected to aid in the development of a trajectory prediction system for inexperienced fishers and serve as foundational data for automating purse seine fishing systems.
1. Introduction
Purse seining is a fishing method in which a net encircles a school of fish, isolating them before capturing the fish by tightening a purse line at the bottom of the net. Tuna purse seine fishing is particularly efficient and is characterized by relatively low fuel consumption per unit of tuna catch. This efficiency can be largely attributed to recent technological advancements, with artificial Fish Aggregating Devices (FADs) playing a significant role [1]. However, FAD-based fishing has a higher bycatch rate compared to fishing targeting free-swimming schools (FSCs) and, when accounting for travel distances between operations, is less energy-efficient [2]. In response to these challenges, the Western and Central Pacific Fisheries Commission (WCPFC) has implemented restrictions on FAD operations in specific areas during designated periods [3]. Currently, the use of FADs in purse seine fisheries operating in the Pacific is regulated under the Conservation and Management Measures (CMMs) established by both the WCPFC and the Inter-American Tropical Tuna Commission (IATTC). In the future, more stringent FAD regulations are expected, varying based on the target species and fishing locations [4]. Therefore, it is necessary to reduce the use of FADs and enhance the success rate of FSC-based fishing operations to address these challenges. However, the success rate of purse seine operations targeting FSCs is heavily influenced by the skill level of the crew. This is because such operations require accurately identifying the location and movement of the target fish school and deploying the net at the optimal position, considering the vessel’s speed. In particular, complex tasks such as calculating the shooting trajectory significantly impact fishing performance, with outcomes largely dependent on the crew’s expertise. Therefore, developing fishing techniques to support inexperienced fishers is of critical importance. However, research on shooting trajectories remains limited. One notable study that summarized the technical principles and practical precedents of purse seine fishing [5] was conducted. Additionally, ref. [6] introduced the first mathematical approach to purse seine positioning and trajectory as a function of vessel and fish speeds. Another study compared circular and elliptical purse seine trajectories to determine the optimal eccentricity [7]. However, these studies rely solely on mathematical equations, which neither account for the actual movements of vessels nor provide sufficient flexibility to adapt to various real-world situations. To address this limitation, this study employs the Double Deep Q-Network (DDQN) algorithm, a machine learning approach, to derive shooting trajectories for various eccentricities, building upon the findings of previous studies. This study introduces the design of observational states, actions, and reward functions to generate shooting trajectories that reflect vessel movements and flexibly respond to different scenarios. As this is an initial attempt to apply reinforcement learning to purse seine shooting trajectories, this study focuses on learning fundamental shooting trajectories based on scenarios derived from previous research, rather than training for a wide range of complex situations. Consequently, the learned shooting trajectories for each eccentricity were evaluated by comparing them with the required towline lengths. Furthermore, when the fish school exhibited escape behavior, the sinking depths of the gear at each vertex were calculated using numerical methods. These calculations were based on the time required for the fish school to reach specific measurement points, enabling an assessment of catchability. The primary objective of this study is to enhance the accuracy and efficiency of FSC-based purse seine operations by employing reinforcement learning to optimize shooting trajectories. By developing a data-driven approach that accounts for vessel movement and environmental variability, this study aims to support inexperienced fishers and contribute to the advancement of automated fishing techniques.
2. Materials and Methods
2.1. Target Shooting Trajectory
In tuna purse seine fishing, two types of ideal shooting trajectories have been proposed [6]. These include Case 1, in which the fish school reaches the midpoint of the floatline () upon completion of the shooting operation, and Case 2, in which the fish school reaches one-third of the floatline () at the end of the shooting operation (Figure 1). Case 1 is generally applicable to typical scenarios, whereas Case 2 is better suited to situations in which the speed of the fish school differs significantly from the speed of the vessel. Furthermore, in actual fishing operations, shooting trajectories are predominantly elliptical rather than circular [7]. When the shooting trajectory is elliptical, the sinking depth of the lead line is greater when the fish encounter the gear compared to a circular trajectory. In this study, reinforcement learning was performed with eccentricities ranging from 0.4 to 0.9 for Case 1 of the reticulated trajectory to ensure comprehensive applicability.
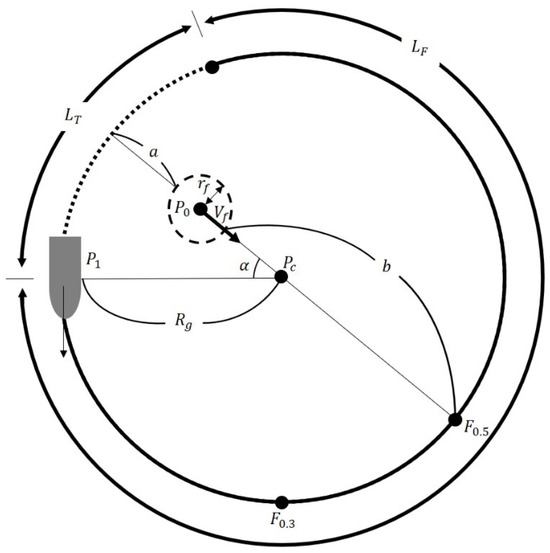
Figure 1.
A schematic representation of the shooting trajectory of a purse seine based on the speed vector of the fish school, adapted from a previous study (: towline length, : floatline length, : distance between the fish school and the shooting circle, : distance to be traveled by the fish school, : radius of the shooting trajectory, : radius of the fish school, : angle between the fish school’s direction and the line abeam of the ship, : speed vector of the fish school, : position of the fish school, : initial shooting position, and : center of the shooting circle).
2.2. DDQN (Double Deep Q-Network) Algorithm
Reinforcement learning is a system control method that optimizes sequential decision-making problems by enabling the learning object, referred to as the agent, to interact with the system environment (state) and learn through rewards defined by a reward function [8]. Reinforcement learning is primarily modeled as a Markov Decision Process (MDP), which has been further developed into Q-learning theory through the Bellman expectation equation and the Bellman optimality equation.
Q-learning is a value-based reinforcement learning method, in which the Q-function is expressed as shown in Equation (1). It iteratively applies the Bellman expectation equation to approximate the Bellman optimality equation, enabling the agent to learn a process that maximizes cumulative rewards.
where represents the state; denotes the action; is the reward; is the next state; is the next action; is the discount factor, which determines the importance of future rewards; is the expected reward for taking action in state ; is the maximum Q-value in ; and is the learning rate, with a value between 0 and 1.
A Deep Q-Network (DQN) implements Equation (1) by utilizing the parameters of an artificial neural network to approximate the Q-function through deep learning [9]. A DQN is distinguished by two key features, experience replay and a target network, that enhance the stability of the learning process. When both the Q-value and the target Q-value are calculated using the same neural network, frequent updates to the target values during the network training process can induce instability. To address this issue, DQN separates the main network from the target network. Experience replay involves storing the results of each time step, represented as , in a dataset, from which mini-batches are randomly sampled to update the weights of the neural network. This random sampling improves data utilization efficiency by reusing past experiences. The objective of the learning process is to minimize the difference between the Q-value predicted by the main network and the target Q-value computed using the target network. The mean squared error (MSE) between these two values is used as the loss function, as shown in Equation (2):
where and represent the parameters of the Q-network and target network, respectively. denotes the expected value obtained by randomly sampling from the experience buffer. Accordingly, when updating the network weights, DQN selects the target Q-value by estimating the maximum Q-value for the next state, as shown in Equation (3):
DQN is prone to overestimating Q-values due to a positive bias in the difference between the Q-value and the target Q-value, which can result in an overestimation [10]. To mitigate this issue, DDQN (Figure 2) defines the target Q-value as shown in Equation (4):
where represents the action with the highest Q-value for , as determined by the main network. The estimation of the maximum target Q-value is performed as follows: First, the main network, using weights , selects the action that maximizes the Q-value. Then, the target network, with weights , calculates the target Q-value for the selected . By employing , the issue of overestimation is effectively mitigated. Furthermore, DDQN demonstrates improved performance in environments with large state-action spaces, enhancing the efficiency of the learning process. Therefore, DDQN was applied in this study to derive the shooting trajectory and achieve superior results.
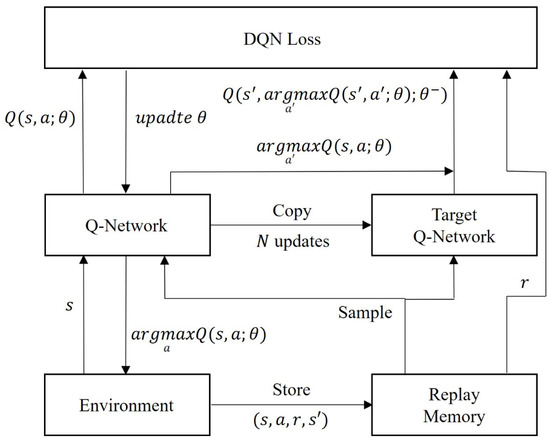
Figure 2.
A data flow diagram of a DDQN with a replay buffer and two neural networks.
As this study aims to configure relatively simple pre-existing shooting trajectories based on vessel movements rather than training for complex scenarios, the fundamental DQN-based algorithm, DDQN, was selected over more advanced algorithms such as PPO or A3C. Accordingly, DDQN was applied to derive the shooting trajectory and achieve superior results.
2.3. Problem Definition for Learning-Based Shooting Trajectory
The training environment was implemented in a two-dimensional space using Pygame 2.5.2 with Python 3.11.5, and reinforcement learning was conducted with PyTorch 2.1.2. The environment, based on previous studies, consists of a vessel, the initial shooting position, the center of the shooting circle, and a fish school. The map dimensions were set to 1000 m × 1000 m.
The vessel’s speed was fixed at 10 knots, while the center of the shooting circle and the initial shooting position were determined according to the predefined target trajectory, as described in Equations (5) and (6):
where is the position vector, and represents the magnitude of the position vector.
The swimming speed of the fish school was set at 4 knots, based on the average speed of tuna [11]. The fish school was modeled with a radius of 50 m and a maximum detection range of 40 m. This study did not account for the behavioral response of the fish school to vessel noise. However, in scenarios where the fish school detected the fishing gear and exhibited escape behavior, swimming speed data from previous research [12] were utilized (Figure 3). The size of each fish object was assumed to be either 0.5 m or 1.0 m, and both scenarios were considered during the analysis.
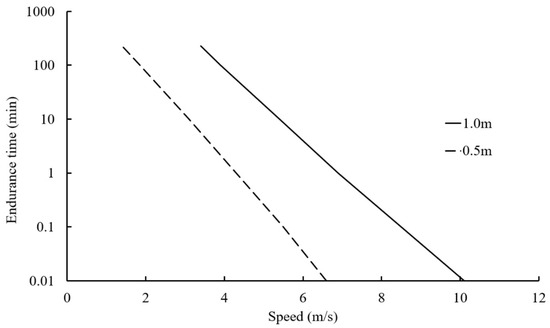
Figure 3.
The swimming speeds of bluefin tuna in relation to endurance time, shown for two body lengths: 0.5 m and 1.0 m.
2.3.1. Hyperparameters
The number of episodes was set to 10,000, with a learning rate of 0.0003, a batch size of 64, and a replay memory size of 1,000,000. The maximum number of steps per episode was limited to cases in which the towline length was 500 m. The hidden layers consisted of three layers with 256 units each. This configuration was selected as maintaining a greater number of hidden layers is advantageous for addressing complex problems. The action policy adopted was the ε-greedy policy. The initial value of ε was set to 1.0, with a decay rate of 0.999 per episode, and a minimum ε value of 0.001. This setup ensured that the agent performed extensive exploration during the initial stages of training, gradually converging toward an optimal solution as the ε value decreased over time.
2.3.2. Observation States
The observation state equations and the schematic utilized by the agent in deep reinforcement learning are presented in Equation (7) and Figure 4.
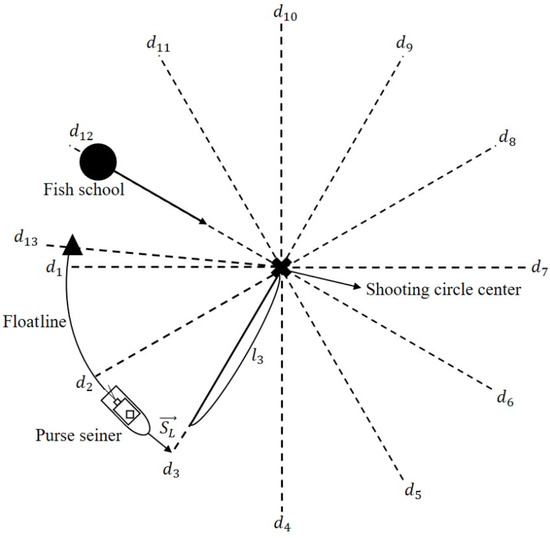
Figure 4.
A schematic of the observation states used by the agent in deep reinforcement learning.
Using the ship’s heading vector , the agent identifies the direction and distance between the ship’s current position and the shooting distance vectors . Additionally, the remaining length of the floatline and the length of the towline () are utilized to perceive the floatline’s residual length and the towline’s length. Notably, based on private communication with the first officer of Dongwon Industries, a shooting attempt is considered unsuccessful if the towline length exceeds 500 m. The actual shooting distance vector () enables the agent to recognize the size of the shooting circle relative to its center, and collision detection () between the ship and each shooting distance vector helps the agent understand the shooting sequence and progress. The actual shooting distance vector () was designed to observe distances of up to 2000 m at 30° intervals within a 360° radius. The collision detection () is set to 0 if the ship has passed the respective distance vector and 1 otherwise. The target shooting distance vector ( represents the desired value of the actual shooting distance vector () and is calculated based on the goal length of the ellipse’s major axis, corresponding to . This calculation was performed using Equation (8), depending on the eccentricity.
where is the length of the floatline, is the ship’s velocity, is the time required for the fishing gear to reach the target sinking depth, is the fish swimming velocity, is the distance from the fish school’s center to the shooting circle’s center. In this study, the target sinking depth of the fishing gear was set at 100 m, considering that the average swimming depth of tuna ranges between 50 m and 70 m. Finally, the value for was set to , ensuring a return to the origin.
2.3.3. Action
The agent’s actions were designed to include six options in total (Figure 5). In the Republic of Korea, fishing operations typically involve using rudders within a range of 7° to 10° to port during actual fishing activities. As corks are loaded on the starboard side and chains on the port side during shooting operations, turning the rudder to the starboard side during shooting poses a risk of the net becoming entangled with the propeller. Therefore, the actions were defined as = 0° for straight motion, and to as port turns ranging from 1° to 9° in intervals of 2°. The ε-greedy policy was employed to facilitate the agent’s exploration by maintaining a high epsilon value during the initial stages of learning. As the number of episodes increased, the epsilon value was gradually reduced to minimize exploratory moves.
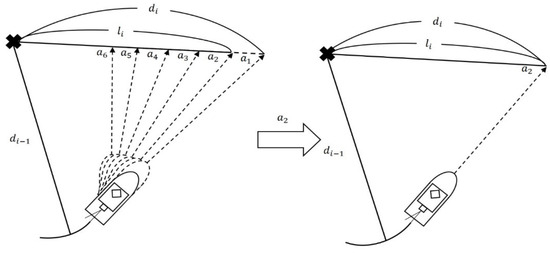
Figure 5.
A schematic representation of a single-step action for controlling the purse seiner.
2.3.4. Reward
The reward function was designed to account for the ship’s situation, enabling rewards or penalties to be applied at each step. When the ship approached the actual shooting distance vector (), a reward was assigned based on the distance and direction between the ship and , which were calculated using the ship’s progression vector (). Through this process, the vessel was guided to approach the actual shooting distance vectors (). If the vessel approached or instead of , no reward was assigned. The reward function is expressed in Equation (9):
If the remaining length of the floatline () was greater than zero, the actual shooting distance vector () was defined as the distance from the intersection of and , calculated relative to the center of the shooting circle. When the vessel approached the actual shooting distance vector (), a reward or penalty was assigned based on the difference between the actual shooting distance vector (), and the target shooting distance vector (). As a reduction in the size of the shooting circle may induce reactive behavior in the fish school, a reward was assigned when the actual shooting distance vector () was greater than the target shooting distance vector (), whereas a penalty was applied in the opposite case. Through this process, the size of the shooting circle was adjusted, and the corresponding equations are as follows:
If remained above zero and the ship reached , a reward or penalty was assigned based on the difference between and , as defined in Equation (11):
When = 0, the towline length () increased, and if the ship approached , the reward was calculated as shown in Equation (12):
When = 0 and the ship reached the target reward , the base reward was calculated as per Equation (13). Additionally, achieving a position within 5 m of the target yielded an additional reward, as outlined in Equation (14):
As described in Equation (14), additional rewards were allocated based on the towline length () upon reaching , incentivizing the use of shorter towline lengths.
If the vessel’s shooting sequence was incorrect or the towline length () exceeded 500 m, the shooting attempt was considered a failure, and a penalty was assigned based on the progress of the shooting process. The corresponding equation is as follows:
2.4. Fishing Gear Specifications Used for Analysis
In this study, the standard specifications of tuna purse seine gear used in the Republic of Korea were selected to simulate the sinking speed and depth of the lead line (Figure 6). The floatline measured 1928 m in length, with a total buoyancy of 48,712 kgf and a total sinking force of 11,342 kgf. In purse seine operations, insufficient sinking of the gear can result in fish escaping beneath it, leading to operation failure [4]. Consequently, the depth at each measurement point of the fishing gear under various fish schooling conditions was analyzed.
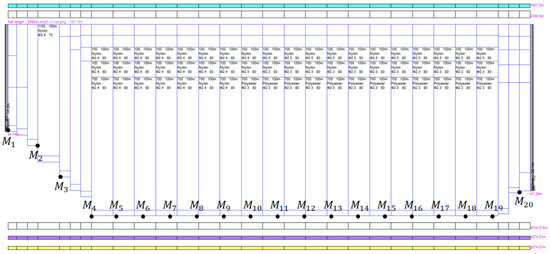
Figure 6.
The measurement positions for the sinking speed and sinking depth from to on the purse seine net.
2.5. Numerical Analysis Method
To mathematically model the tuna purse seine gear (Figure 6), a mass–spring system was employed. The mathematical framework used for the simulation was based on prior research [13,14]. This model divides the gear system into finite elements, assigning mass points to each element and connecting them with massless springs.
The fundamental motion equation for each mass point is expressed in Equation (16):
where is the total mass of the point, is the added mass, is the acceleration vector, represents the internal force between the mass points, and denotes the external forces acting on the mass points.
The added mass is defined as follows:
where is the density of seawater (, is the volume of the mass point, and is the added mass coefficient, which was set at 1.5 because the structural connections were assumed to be spheres [14,15].
Cylindrical structures, such as ropes, were determined as follows [16]:
where is the angle of attack.
Internal force is generated by the tension and compression of the springs connecting the mass points, as described in Equation (19):
where is the stiffness of the spring, is the unit vector in the direction of the spring, is the initial length of the spring, and is the magnitude of the position vector of the spring.
External forces acting on each mass point include drag force (), lift force (), and buoyancy and sinking force (). The sum of these forces is expressed in Equation (20):
Drag and lift forces are defined as follows in Equations (21) and (22):
where is the drag force coefficient, is the lift force coefficient, is the projected area of the mass point (, is the magnitude of the resultant velocity vector, is the unit vector in the direction of the drag force, and is the unit vector in the direction of the lift force.
The buoyancy and sinking force are expressed in Equation (23):
where is the density of the material, is the density of seawater, is the volume of the mass, and is the acceleration due to gravity.
Considering both external and internal forces, the equation of motion is transformed into the following non-linear second-order differential equation in the time domain, as expressed in Equation (24).
Using the fourth-order Runge–Kutta method, the motion described by Equation (24) is converted into first-order differential equations, as shown in Equations (25) and (26).
3. Results
3.1. Simulation Results
The simulation results, based on conditions including a ship speed of 10 knots and a floatline length of 1928 m, are presented in Figure 7. The simulation provided a comprehensive representation of the three-dimensional configuration of the fishing gear from the start of the shooting process, along with data on the line tension, as well as the depth and sinking speeds of various parts of the gear.
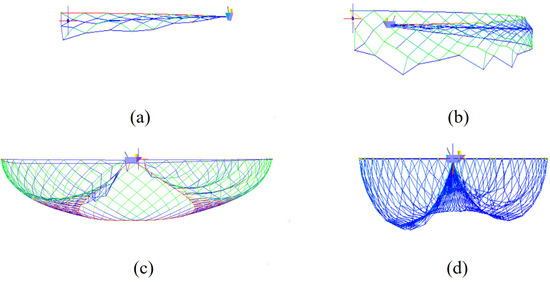
Figure 7.
Simulation results of purse seine operations during shooting and pursing under conditions including a ship speed of 10 knots and a floatline length of 1928 m. (a) represents the starting point of the floatline shooting, (b) represents the midpoint of the floatline shooting, (c) represents the completion of the shooting and the beginning of the pursing operation, and (d) represents the completion of the pursing operation.
3.1.1. Sinking Speed at Measurement Points
The sinking speeds at each measurement point were recorded at 30 s intervals (Figure 8). The rate of descent decreased sharply at the beginning of the shooting process and subsequently stabilized. A subsequent decline was observed during the pursing operation. For the central measurement points of the net ( to ), the initial sinking speeds ranged from 0.4 to 0.7 m/s, eventually converging to 0.2 to 0.4 m/s. During the pursing operation, the sinking speed decreased gradually. In contrast, the outer measurement points of the net ( to to exhibited initial sinking speeds ranging from 0.6 to 1.1 m/s, which rapidly declined to approximately 0.01 m/s. During the pursing process, these outer sections of the net experienced negative speeds as they were hauled back onto the ship. This behavior reflects the operational characteristics of purse seining, by which the edges of the net are retrieved first.
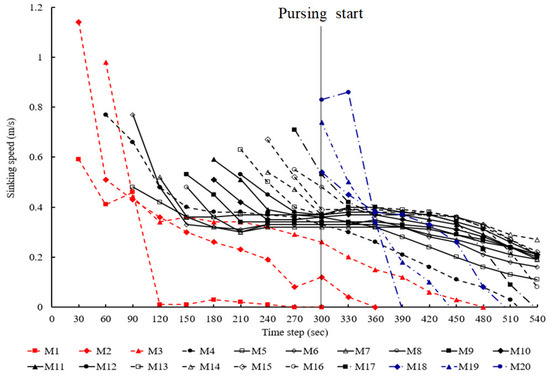
Figure 8.
The sinking speed of the purse seine recorded at measurement points to at 30 s intervals.
3.1.2. Sinking Depth at Measurement Points
The sinking depths at each measurement point were recorded at 30 s intervals (Figure 9). The depth of the lead line increased continuously over time; however, the rate of increase gradually diminished. This trend can be attributed to the initially high sinking speed, which decreased over time due to the increasing resistance from the net. When the pursing operation commenced, the sinking depth of the net began to decrease, starting from the edges of the net. This phenomenon occurs because, in purse seine operations, the edges of the net are relatively closer to the vessel, enabling the gear to respond more quickly to the pursing action.
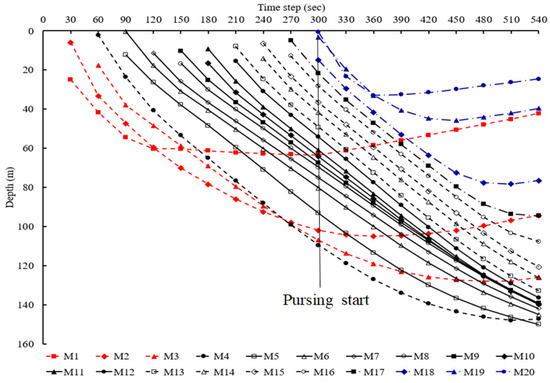
Figure 9.
The sinking depth of the purse seine recorded at measurement points to at 30 s intervals.
In this study, Case 1 was applied, with , corresponding to , being deployed at . Consequently, in Equation (8), the time required for the fishing gear to reach the target sinking depth was determined based on , as shown in Figure 9. The simulation results indicated that it took approximately 240 s for to reach a depth of 100 m after the shooting operation commenced. Therefore, in Equation (8) was set to 240.
3.2. Results of Reinforcement Learning
The rewards per episode during the learning process are shown in Figure 10. The results of the shooting trajectory learning demonstrated a consistent increase in reward values as the episodes progressed. After 10,000 episodes, the reward value reached approximately 550.
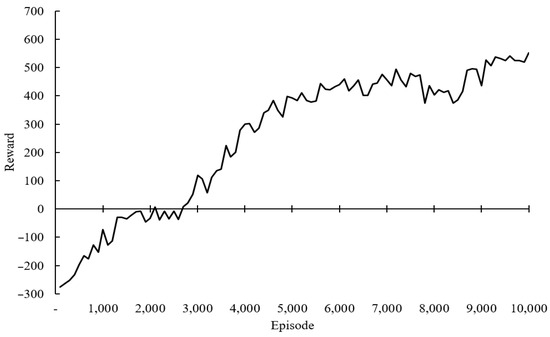
Figure 10.
The cumulative reward results of the Double Deep Q-Network (DDQN) algorithm throughout the learning process.
3.2.1. Shooting Trajectories Based on Eccentricity
The shooting trajectories of purse seine fishing nets for each eccentricity, derived from the trained model after 10,000 episodes of learning, are illustrated in Figure 11. The numbers associated with the fish school represent its positions when each measurement point of the gear was deployed. The vessel successfully returned to its starting point after completing the shooting operation in accordance with the specified eccentricity. At the 22nd position, the fish school, based on the predetermined maximum detection range, identified the closest segment of the net and initiated reactive behavior. If the fish school detected the net and moved to the right in response, the net’s sinking depth exceeded 100 m, ensuring the success of the operation. However, if the fish school reacted by moving to the left, where the net’s sinking depth might be insufficient, the fish could escape beneath the purse seine, resulting in an unsuccessful operation.
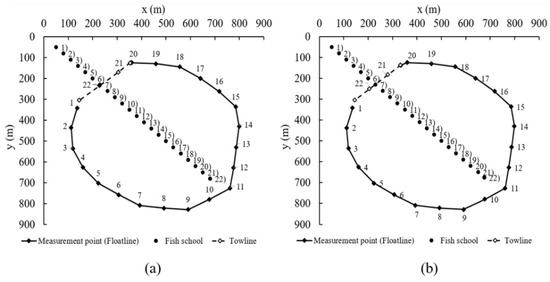
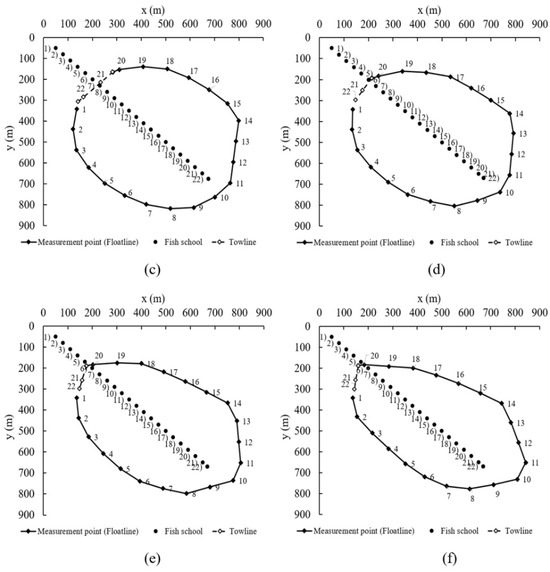
Figure 11.
Results of shooting trajectory learning by eccentricities (a) 0.4, (b) 0.5, (c) 0.6, (d) 0.7, (e) 0.8, and (f) 0.9.
3.2.2. Shooting Area Based on Eccentricity
The shooting area of the purse seine varied according to eccentricity (Table 1). The shooting area decreased by up to 24.6% as the eccentricity increased. The size of the shooting circle was determined based on the major axis corresponding to the eccentricity, leading to a reduction in the shooting area with higher eccentricity values. Consequently, at eccentricities of 0.4 and 0.5, the larger size of the shooting circle caused the fish school to approach . For eccentricities of 0.6 and 0.7, the fish school successfully reached . However, at eccentricities of 0.8 and 0.9, the smaller shooting circle caused the fish school to approach closer to .

Table 1.
Shooting area according to each eccentricity.
3.2.3. Towline Length Based on Eccentricity
When the target depth is 100 m, the required towline lengths vary according to eccentricity. For an eccentricity of 0.4, the required towline length is 275 m; for 0.5, it is 255 m; for 0.6, it is 200 m; for 0.7, it is 125 m; for 0.8, it is 115 m; and for 0.9, it is 115 m. As eccentricity increases, the size of the shooting area decreases, resulting in a corresponding reduction in the required towline length. According to private communications, the maximum allowable towline length used in successful actual operations is approximately 300 m. This indicates that the model employed in this study operates within an appropriate range of towline length.
3.2.4. Comparison of Trajectories Derived from DDQN and Traditional Methods
To evaluate the effectiveness of the shooting trajectory derived using DDQN, a comparison was conducted with the traditional shooting trajectory calculated based on mathematical principles and the empirical knowledge of skilled skippers [12] (Figure 12). The area of the ellipse formed by the DDQN-derived trajectory was approximately 352,757 m², whereas the shooting area obtained using the traditional method was 339,324 m². This result indicates that the DDQN-derived trajectory encompasses a slightly larger area than the conventional mathematical approach. The difference in area can be attributed to the design of the reinforcement learning model, by which a penalty is applied when the actual shooting distance vector () is smaller than the target shooting distance vector (). Consequently, the agent learns to generate a relatively larger shooting trajectory. This distinction highlights that DDQN can dynamically adjust the shooting trajectory based on its reward structure. Unlike traditional methods, which follow a predefined structure based on mathematical models and empirical knowledge, reinforcement learning enables flexible shooting pattern adaptation through observation states, actions, and rewards, allowing for greater responsiveness to varying fishing conditions.
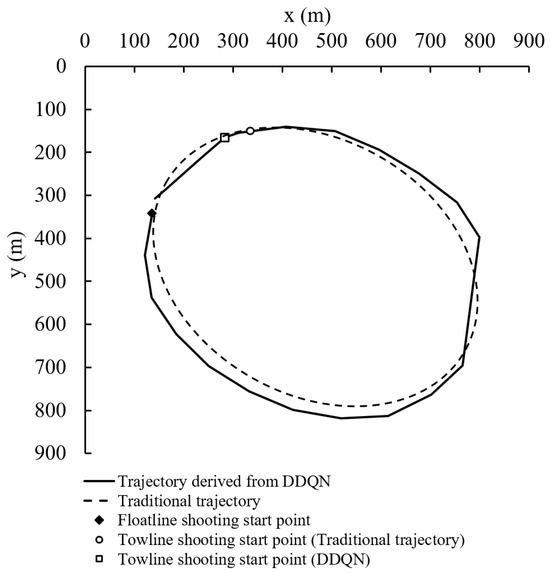
Figure 12.
A comparison of trajectories derived from DDQN and traditional methods with an eccentricity of 0.7.
3.3. The Sinking Depth of the Fishing Gear Based on Fish Reactive Behavior
Scenarios in which the likelihood of fishing failure is high due to fish exhibiting reactive behavior are illustrated in Figure 13. The calculated sinking depths of the fishing gear at each measurement point, where the fish school exhibited reactive behavior, are presented in Figure 14 and Figure 15, derived from Figure 9. For both tuna object sizes, the sinking depths up to M₁₇ ranged from 70 m to 100 m, which is sufficient considering the average swimming depth of tuna, typically 50 m to 70 m. However, beyond , the sinking depth decreased sharply, ranging from 20 m to 50 m. This rapid decrease is attributed to the proximity of these measurement points to the vessel, which causes faster gear responses during the pursing operation. Nevertheless, in actual operations, the reactive behavior of fish schools generally follows the net walls [17], making a direct movement from to highly unlikely.
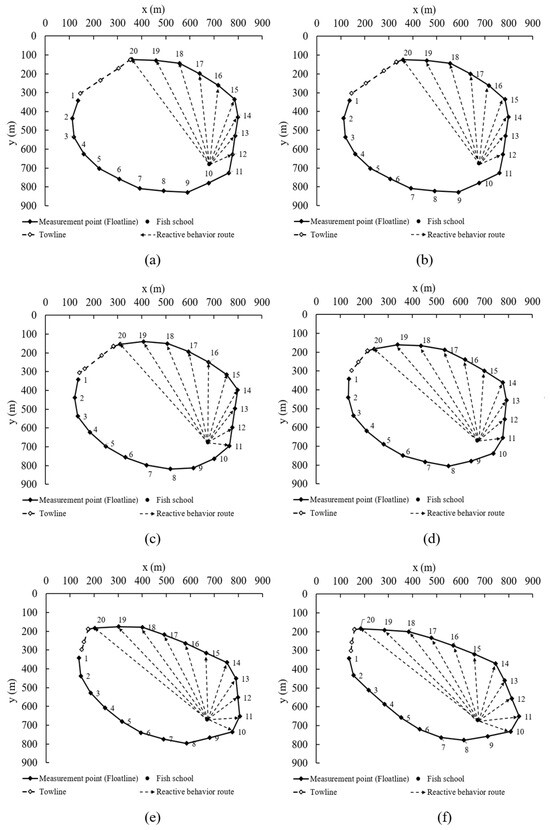
Figure 13.
The reactive behavior routes of fish with a high escape risk by eccentricities (a) 0.4, (b) 0.5, (c) 0.6, (d) 0.7, (e) 0.8, and (f) 0.9.
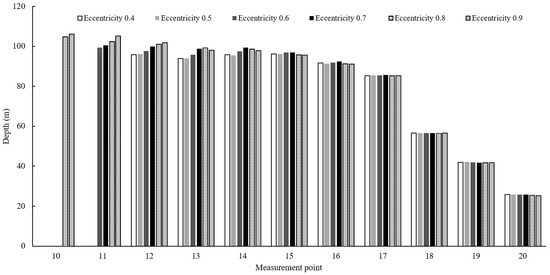
Figure 14.
The sinking depth at each measurement point by eccentricities for a school of fish with a body length of 0.5 m, observed during reactive behavior.
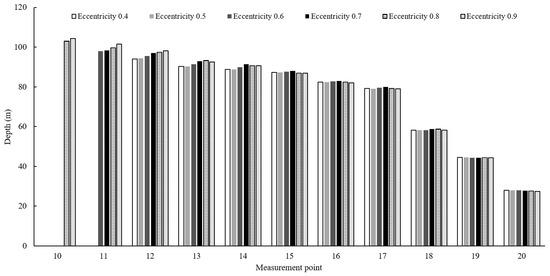
Figure 15.
The sinking depth at each measurement point by eccentricities for a fish school with a body length of 1.0 m, observed during reactive behavior.
When comparing tuna objects with average body lengths of 0.5 m and 1.0 m, the sinking depths of the fishing gear were greater for the former between and , whereas they were greater for the latter between and . This difference can be attributed to the fact that larger tuna tend to have higher average swimming speeds. Consequently, for smaller tuna with lower swimming speeds, a greater number of pursing operations occurred in the range from to .
4. Discussion
In purse seine fishing, the calculation of shooting trajectories has traditionally relied on the experience and intuition of skilled fishers. This process is influenced by various dynamic factors, such as vessel speed, fish school movement, and environmental conditions, making it challenging for inexperienced fishers to achieve optimal results. This study applied deep reinforcement learning (DDQN) to learn purse seine shooting trajectories, focusing not on exploring a wide range of possible trajectories but on training the model based on predefined trajectories derived from mathematical models and expert knowledge.
The results demonstrate that DDQN enables dynamic adjustments to shooting trajectories based on real-time conditions, unlike traditional static models. By leveraging reinforcement learning, inexperienced fishers can adopt optimized shooting strategies, potentially narrowing the skill gap in the fishing industry. This advancement suggests that AI-driven trajectory planning could address labor shortages and contribute to the development of AI-based automation systems in fisheries. Furthermore, the data accumulated during DDQN training can be utilized for the long-term optimization of fishing strategies, facilitating a shift from experience-based decision-making to data-driven operational improvements.
While reinforcement learning-based shooting trajectory prediction requires substantial resources during the initial training phase, the trained model can be operated efficiently using existing onboard equipment. Specifically, once deployed, it does not require additional high-performance computing devices for practical use on vessels.
Compared to existing AI-based fishing optimization methods, which primarily focus on indirect support systems such as optimizing Fish Aggregating Device (FAD) fishing routes [1], this study directly optimizes the core fishing operation by actively adjusting shooting trajectories. This highlights the potential for AI to transcend its traditional role of assisting fishers and instead play a direct role in fishing operations.
The study findings indicate that DDQN generates shooting trajectories with a larger coverage area than traditional methods, attributed to the observation states, action, and reward structure employed in the model. However, a decline in precision was observed in the later stages of training, likely due to the discrete action space of DDQN, which limits precise trajectory adjustments. Future research should explore continuous action space reinforcement learning methods, such as Proximal Policy Optimization (PPO) or Soft Actor-Critic (SAC), to improve trajectory precision.
Moreover, as reinforcement learning primarily occurs in a simulation environment, its applicability to real-world fishing operations must be validated through empirical experiments. Incorporating real fishing data into reinforcement learning models could enhance their adaptability, enabling them to respond more effectively to dynamic fishing conditions. By integrating such approaches, reinforcement learning-based trajectory optimization could be further generalized for application across diverse operational environments.
Additionally, this study did not incorporate fish school responses to vessel noise or the influence of ocean currents, both of which are critical factors in actual fishing operations. Future models should integrate these factors to improve accuracy. Moreover, the swimming speed of the fish school was modeled based on Atlantic bluefin tuna, whereas skipjack tuna is the primary target species in purse seine fishing. Future studies should incorporate species-specific movement patterns to enhance the realism of the simulation.
5. Conclusions
This study demonstrated that DDQN can effectively optimize shooting trajectories by incorporating vessel movements rather than relying solely on pre-established empirical knowledge and mathematical principles. The reinforcement learning model dynamically adjusts trajectories based on observation states, actions, and reward. This flexibility enables the model to adapt to various conditions rather than strictly following predefined mathematical patterns, thereby optimizing shooting strategies in response to real-time environmental changes. In particular, the findings suggest that utilizing DDQN could enable inexperienced fishers to operate purse seine fishing with efficiency comparable to that of experienced fishers. Furthermore, the results indicate that reinforcement learning-based approaches offer a more flexible and data-driven alternative to conventional trajectory planning methods, potentially reducing uncertainties in the fishing process. Future research should focus on incorporating additional environmental variables and real-world vessel dynamics to enhance the practical applicability of this approach in commercial fishing operations.
Author Contributions
Conceptualization, J.L.; Methodology, D.C. and J.L.; Software, D.C.; Validation, D.C. and J.L.; Formal Analysis, D.C.; Investigation, J.L.; Resources, J.L.; Writing—Original Draft Preparation, D.C.; Writing—Review and Editing, J.L.; Visualization, D.C.; Supervision, J.L.; Project Administration, J.L. All authors have read and agreed to the published version of the manuscript.
Funding
This research did not receive any specific grant from funding agencies in the public, commercial, or not-for-profit sectors.
Institutional Review Board Statement
Not applicable.
Informed Consent Statement
Not applicable.
Data Availability Statement
The code employed in this study is integral to ongoing and future research efforts. To ensure the integrity and originality of subsequent studies, the code is currently kept confidential. Upon the completion of these follow-up studies, we will carefully assess the feasibility of sharing the code publicly, in accordance with data-sharing policies and research transparency standards.
Conflicts of Interest
The authors declare no conflicts of interest.
References
- Igor, G.; Leticia, H.; Zigor, U.; Jose, A.F. A fishing route optimization decision support system: The case of the tuna purse seiner. Eur. J. Oper. Res. 2024, 312, 718–732. [Google Scholar] [CrossRef]
- Oihane, C.B.; Gorka, G.; Jon, L.; Igor, G.; Hilario, M.; Jose, A.F.; Inigo, K.; Jon, R.; Zigor, U. Fuel consumption of free-swimming school versus FAD strategies in tropical tuna purse seine fishing. Fish. Res. 2022, 245, 106139. [Google Scholar] [CrossRef]
- WCPFC. Conservation and management measure for bigeye, yellowfin and skipjack tuna in the Western and Central Pacific Ocean. CMM 2023, 1, 1–17. [Google Scholar]
- Lee, M.K.; Lee, S.I.; Lee, C.W.; Kim, D.N.; Ku, J.E. Study on fishing characteristics and strategies of Korean tuna purse seine fishery in the Western and Central Pacific Ocean Fisheries Commission. Korean Soc. Fish. Ocean Technol. 2016, 52, 197–208. [Google Scholar] [CrossRef]
- Ben-Yami, M. Purse Seine Manual; FAO, Fishing News Book; Wiley: Hoboken, NJ, USA, 1994. [Google Scholar]
- Lee, C.W.; Lee, J.H.; Park, S.B. Prediction of shooting trajectory of tuna purse seine fishing. Fish. Res. 2018, 208, 189–201. [Google Scholar] [CrossRef]
- Lee, D.Y.; Lee, C.W.; Choi, K.S.; Jang, Y.S. Analysis of the elliptical shooting trajectory for tuna purse seine. Korean Soc. Fish. Ocean Technol. 2020, 56, 1–10. [Google Scholar] [CrossRef]
- Sutton, R.S.; Barto, A.G. Reinforcement Learning: An Introduction; MIT Press: Cambridge, MA, USA, 2018. [Google Scholar]
- Mnih, V.; Kavukcuoglu, K.; Silver, D.; Graves, A.; Antonoglou, I.; Wierstra, D.; Riedmiller, M. Playing Atari with deep reinforcement learning. arXiv 2013, arXiv:1312.5602. [Google Scholar] [CrossRef]
- Van Hasselt, H.; Guez, A.; Silver, D. Deep reinforcement learning with double Q-learning. AAAI Conf. Artif. Intell. 2016, 30, 2094–2100. [Google Scholar] [CrossRef]
- Yuen, H.S.H. Swimming speeds of yellowfin and skipjack tuna. Trans. Am. Fish. Soc. 2011, 95, 203–209. [Google Scholar] [CrossRef]
- Guinet, C.; Domenici, P.; De Stephanis, R.; Barrett-Lennard, L.; Ford, J.K.B.; Verborgh, P. Killer whale predation on bluefin tuna: Exploring the hypothesis of the endurance-exhaustion technique. Mar. Ecol. Prog. Ser. 2007, 347, 111–119. [Google Scholar] [CrossRef]
- Hosseini, S.A.; Lee, C.W.; Kim, H.S.; Lee, J.; Lee, G.H. The sinking performance of the tuna purse seine gear with large-meshed panels using numerical method. Fish. Sci. 2011, 77, 503–520. [Google Scholar] [CrossRef]
- Lee, C.W.; Kim, Y.B.; Lee, G.H.; Choi, M.Y.; Lee, M.K.; Koo, K.Y. Dynamic simulation of a fish cage system subjected to currents and waves. Ocean Eng. 2008, 35, 1521–1532. [Google Scholar] [CrossRef]
- Wakaba, L.; Balanchandar, S. On the added mass force at finite Reynolds and acceleration numbers. Theor. Comput. Fluid Dyn. 2007, 21, 147–153. [Google Scholar] [CrossRef]
- Takaki, T.; Shimizu, T.; Suzuki, K.; Hirashi, T.; Yamamoto, K. Validity and layout of “NaLA”: A net configuration and loading analysis system. Fish. Res. 2004, 66, 235–243. [Google Scholar] [CrossRef]
- Hosseini, S.A.; Ehsani, J. An investigation of reactive behavior of yellowfin tuna schools to the purse seining process. Iran. J. Fish. Sci. 2014, 13, 330–340. [Google Scholar] [CrossRef]
Disclaimer/Publisher’s Note: The statements, opinions and data contained in all publications are solely those of the individual author(s) and contributor(s) and not of MDPI and/or the editor(s). MDPI and/or the editor(s) disclaim responsibility for any injury to people or property resulting from any ideas, methods, instructions or products referred to in the content. |
© 2025 by the authors. Licensee MDPI, Basel, Switzerland. This article is an open access article distributed under the terms and conditions of the Creative Commons Attribution (CC BY) license (https://creativecommons.org/licenses/by/4.0/).