Article

Loss Function Optimization Method and Unsupervised Extraction Approach D-DBSCAN for Improving the Moving Target Perception of 3D Imaging Sonar

1
Ganjiang Innovation Academy, Chinese Academy of Sciences, Ganzhou 341000, China
2
Department of Automation, Tsinghua University, Beijing 100190, China
*
Author to whom correspondence should be addressed.
J. Mar. Sci. Eng. 2025, 13(3), 529; https://doi.org/10.3390/jmse13030529
Submission received: 12 February 2025 / Revised: 28 February 2025 / Accepted: 6 March 2025 / Published: 10 March 2025
(This article belongs to the Section Ocean Engineering)

Abstract

:
Imaging sonar is a crucial tool for underwater visual perception. Compared to 2D sonar images, 3D sonar images offer superior spatial positioning capabilities, although the data acquisition cost is higher and lacks open source references for data annotation, target detection, and semantic segmentation. This paper utilizes 3D imaging sonar to collect underwater data from three types of targets with 1534 effective frames, including a tire, mannequin, and table, in Liquan Lake, Shanxi Province, China. Based on these data, this study focuses on three innovative aspects as follows: rapid underwater data annotation, loss function optimization, and unsupervised moving target extraction in water. For rapid data annotation, a batch annotation method combining human expertise and multi-frame superposition is proposed. This method automatically generates single-frame target detection boxes based on multi-frame joint segmentation, offering advantages in speed, cost, and accuracy. For loss function optimization, a density-based loss function is introduced to address the issue of overfitting in dense regions due to the uneven distribution of point cloud data. By assigning different weights to data points in different density regions, the model pays more attention to accurate predictions in a sparse area, resulting in a 6.939 improvement in mIOU for semantic segmentation tasks, while lakebed mIOU achieved a high score of 99.28. For unsupervised moving target extraction, a multi-frame joint unsupervised moving target association extraction method called the Double DBSCAN, D-DBSCAN, is proposed. This method simulates human visual sensitivity to moving targets in water and uses a joint D-DBSCAN spatial clustering approach with single-frame and inter-frame superposition, achieving an improvement of 21.3 points in mAP. Finally, the paper summarizes the three proposed innovations and provides directions for further research.

1. Introduction

Imaging sonar is a vital tool for underwater visual perception tasks such as target detection and semantic segmentation [1]. The primary sensors used are 2D and 3D imaging sonars [2], which are successively analogous to visual cameras and LiDAR in autonomous driving [3]. 2D sonar includes forward-looking sonar, side-scan sonar, and synthetic aperture sonar, with images representing the projection of sonar echo intensity on a 2D plane. 3D imaging sonars, such as the 3D forward-looking sonar and multi-beam bathymetric sonar, generate 3D point clouds, with each point corresponding to an echo intensity. The multi-beam bathymetric sonar relies on platform movement to generate point cloud images that reflect seabed topography, while the 3D forward-looking sonar can directly image the scene in front of the sonar array without platform movement.
2D sonar arrays are typically linear, forming beams only in the horizontal direction, which results in the loss of vertical precision during imaging [4]. As a result, most sonar image target detection and segmentation tasks focus on 2D images, relying on the distribution of acoustic echo intensity in 2D images [5]. In contrast, 3D imaging sonar uses planar arrays that can form beams in both vertical and horizontal directions, providing more precise spatial information for underwater targets, as shown in Figure 1. This allows for the use of both echo intensity differences and spatial distribution features to determine the state of underwater targets.
The data characteristics of 3D imaging sonar significantly enhance the perception of moving targets in water, effectively compensating for the shortcomings of the 2D imaging sonar, which relies on a single feature for target detection and often inaccurately regresses target positions. However, due to industry limitations, publicly available imaging sonar datasets are scarce, with most being 2D datasets [6]. 3D sonar point cloud datasets are even rarer, and there is limited research in this field.
There is no industry standard for annotating 3D imaging sonar data. Existing 3D annotation methods are primarily designed for LiDAR or depth camera point cloud data. For underwater point cloud annotation, the typical method involves manually drawing a 3D bounding box around the target, which is labor intensive, inefficient, and prone to errors. Existing 3D target detection methods can be broadly categorized into three types based on point cloud representation. The first is voxel-based methods, such as VoxelNet [7] and PointPillars [8], which grid irregular point clouds into standard voxel units and learn high-dimensional features through sparse 3D convolution. While these methods perform well in feature extraction, they must balance accuracy and efficiency. Smaller voxels yield higher precision but require more computational resources, while larger voxels can lead to information loss. The second category is point-based methods, such as PointNet [9], PointNet++ [10], PointRCNN [11], and 3DSSD [12], which directly use raw 3D point cloud data to minimize information loss during data conversion. These methods avoid voxelization-induced information loss and leverage the sparsity of point clouds for efficient computation. However, due to the irregularity of point cloud data, point-based methods must satisfy permutation invariance and dynamically adapt to input size. The third category is multi-modal methods, such as PointPainting [13], which combine point clouds, images, and depth maps for 3D detection, generally outperforming single- modal methods.
Common loss functions in computer vision tasks include MSE, MAE, and cross-entropy loss [14]. In underwater sonar point cloud processing, the spatial distribution of point clouds is denser near the sensor and sparser farther away. Using a uniform loss function may cause the model to overfit dense regions while neglecting sparse regions. Therefore, adjusting loss weights to focus on different regions is key in improving segmentation performance.
3D sonar point cloud data are highly sparse and disordered, with uneven spatial and echo intensity distributions. Due to the combined effects of the seabed, water, targets, and noise, the reflected echoes exhibit high disorder, with some areas being densely reflective and others being sparse or blank. The reflection intensity depends on the distance, position, and acoustic impedance of the reflector, which is the product of material density and sound speed. Current research on 3D imaging sonar target detection and segmentation is limited and primarily focuses on point cloud target detection networks.

2. Data Collection and Annotation Method

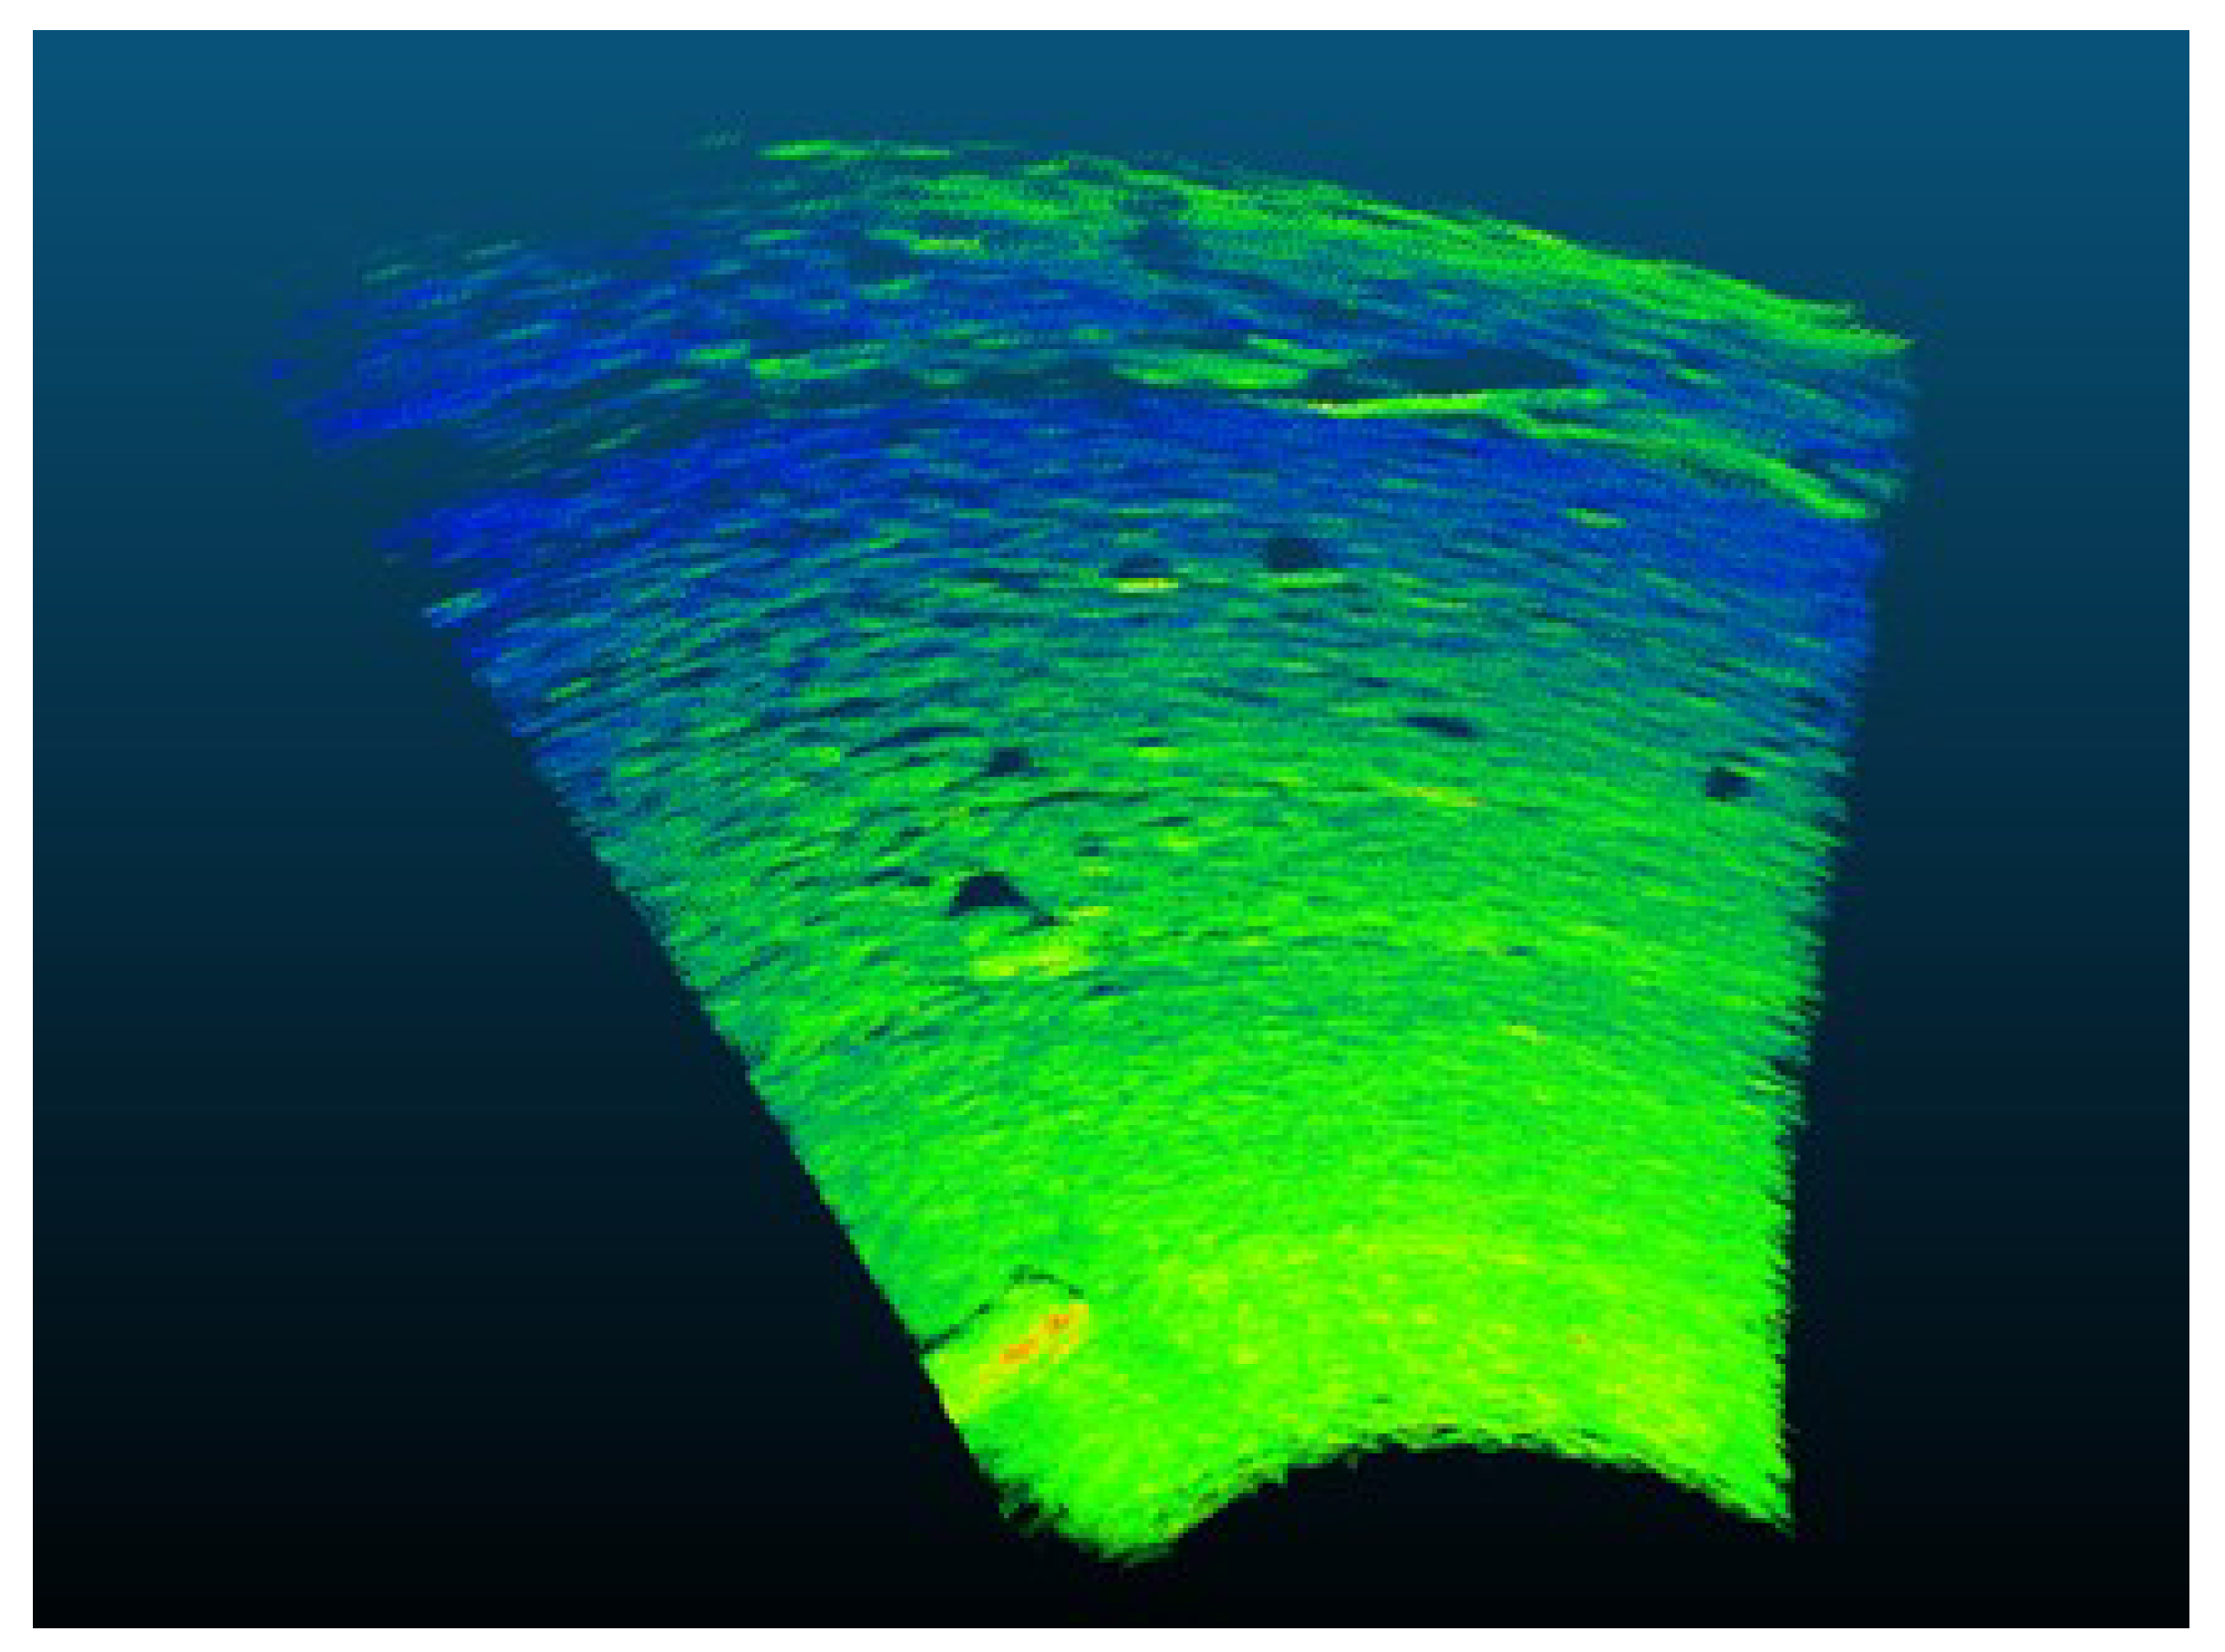
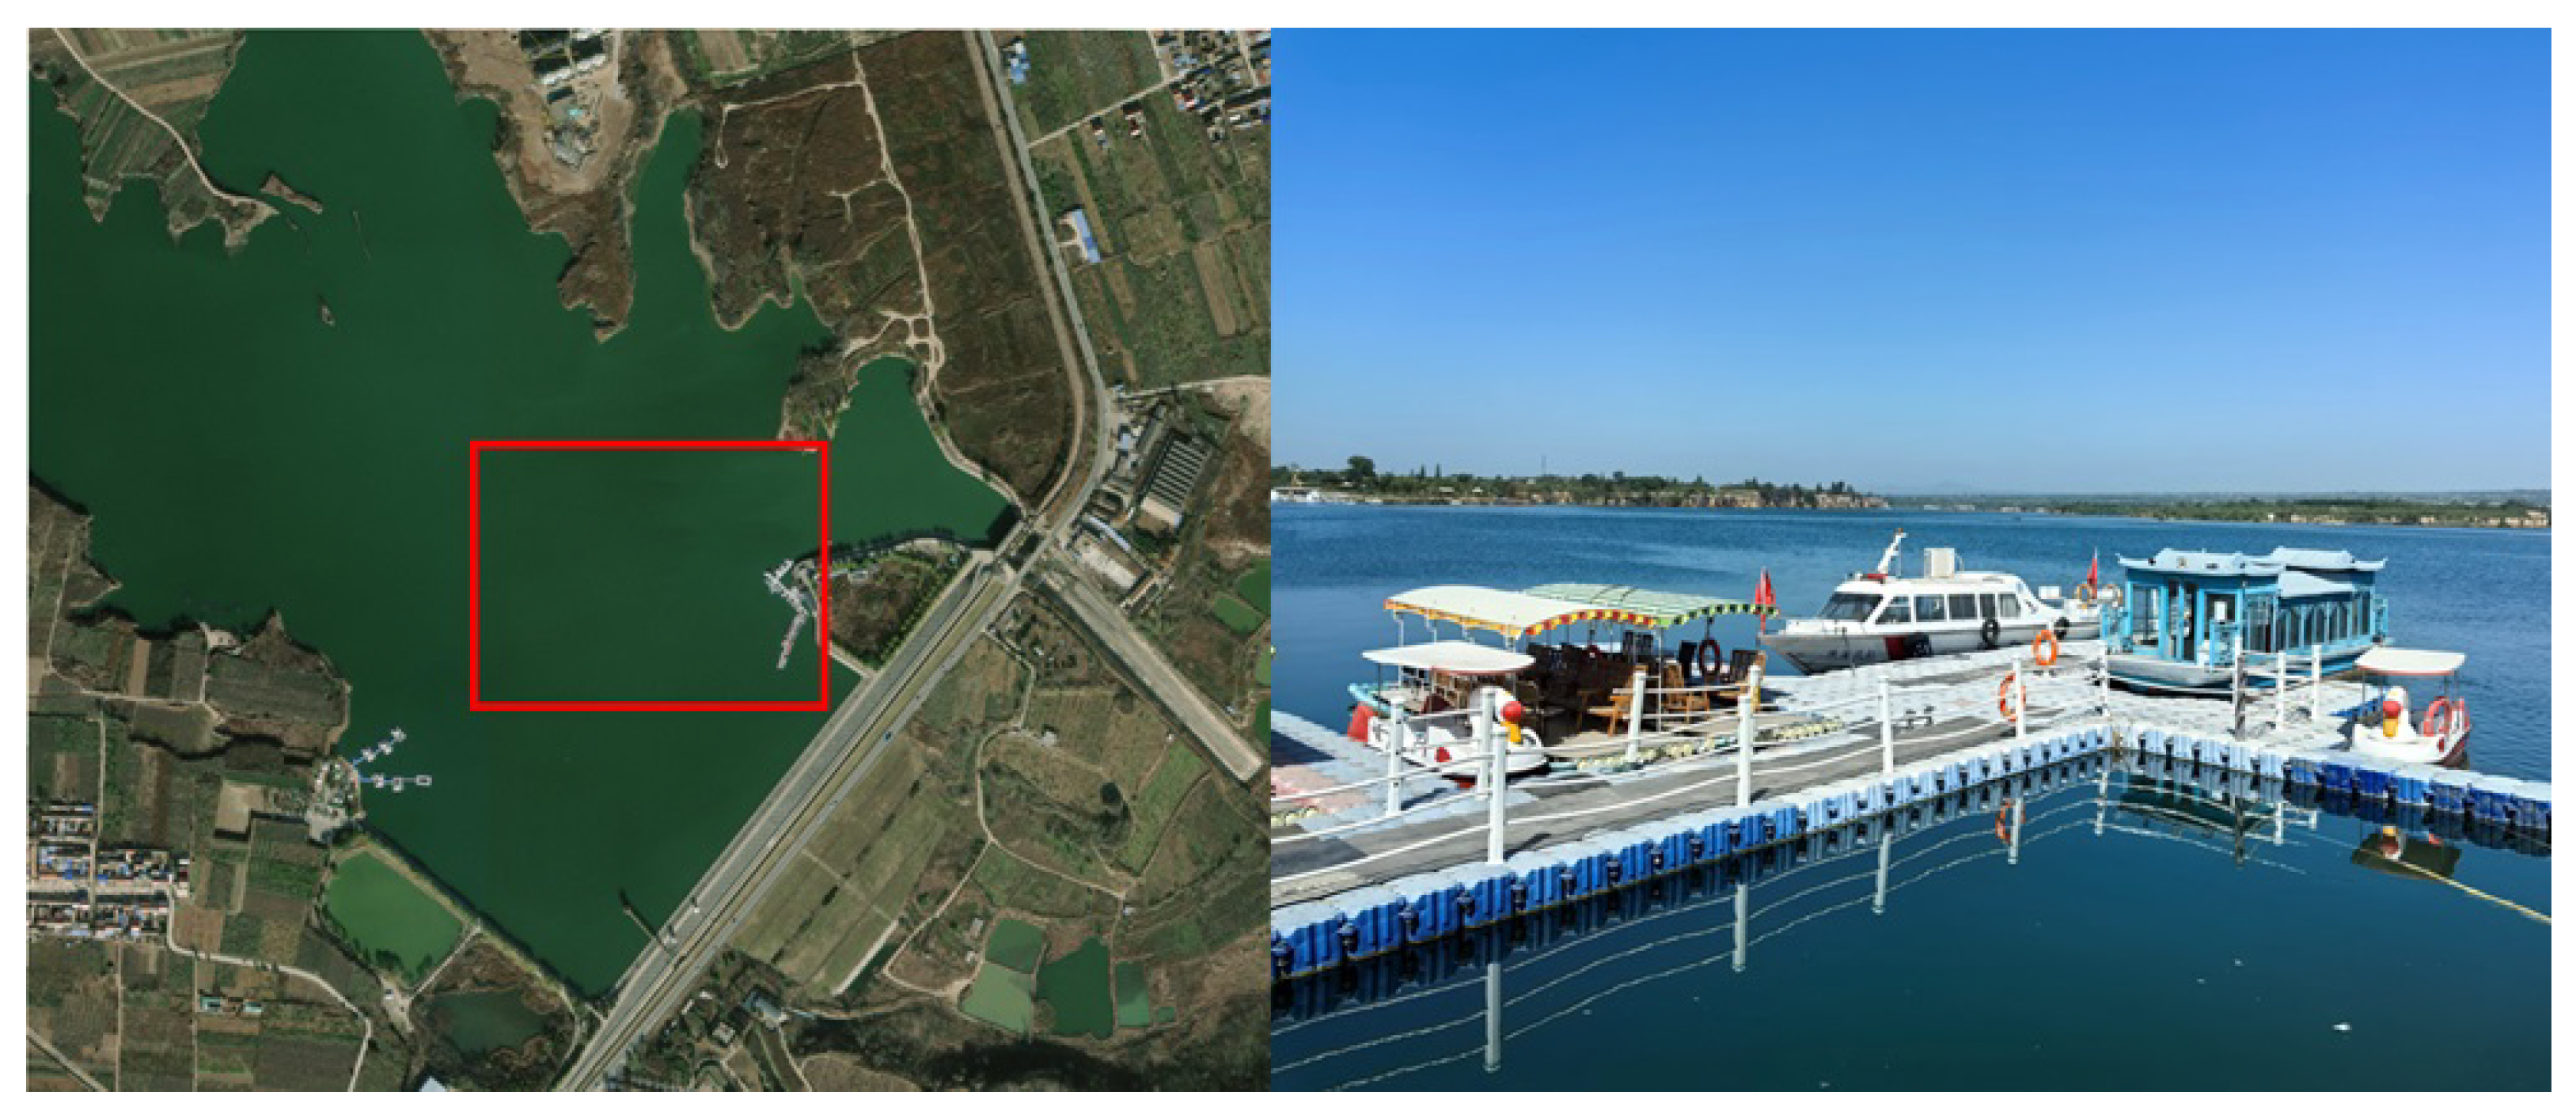
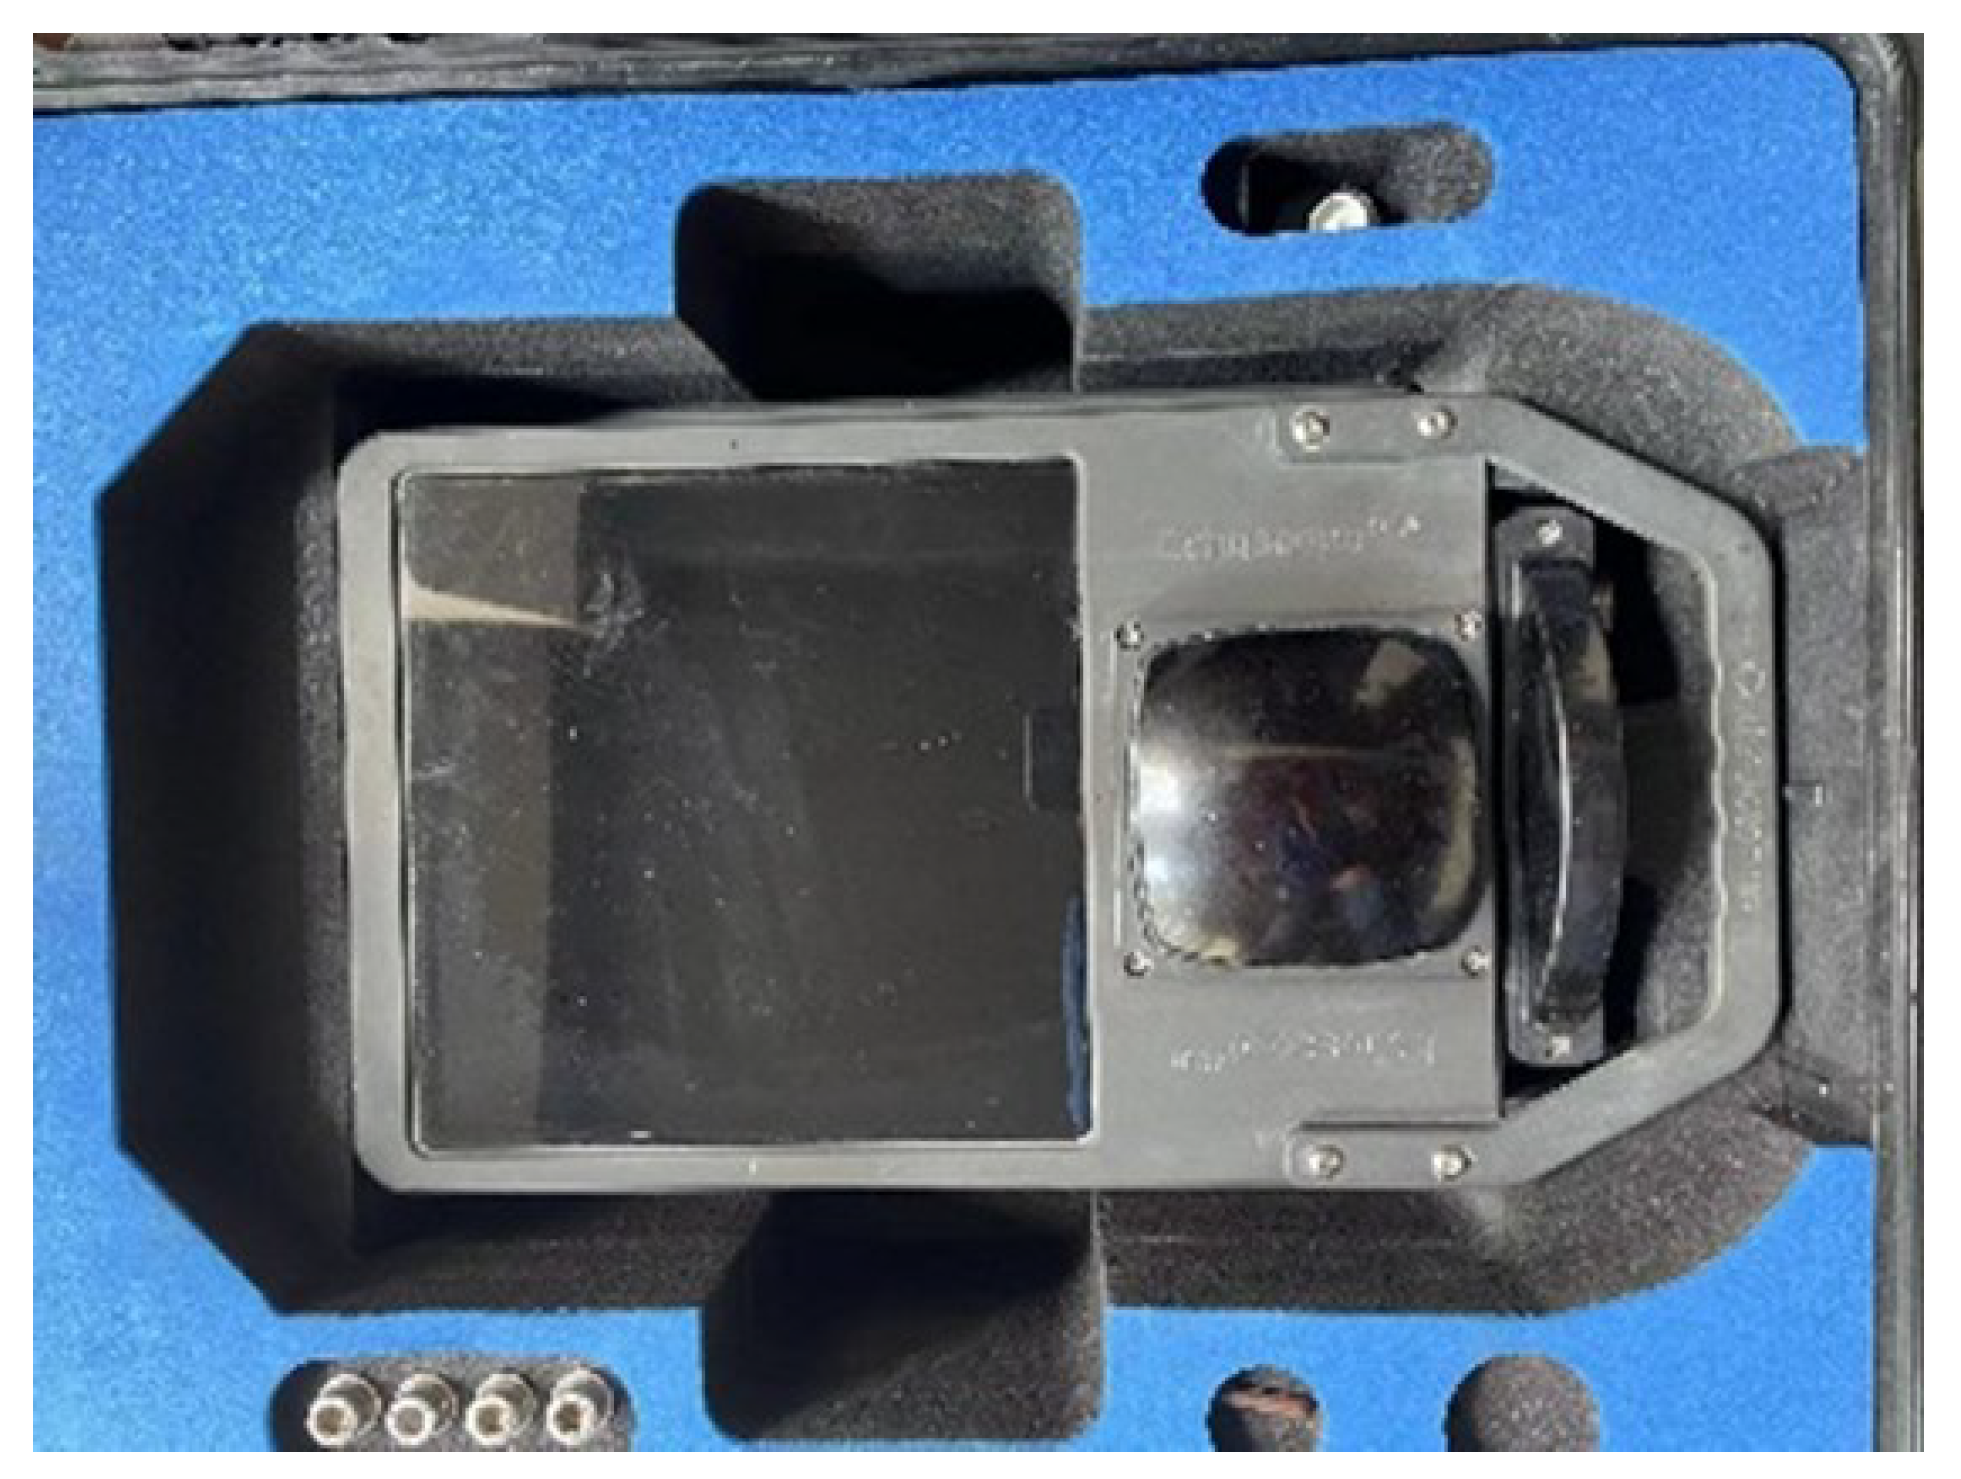
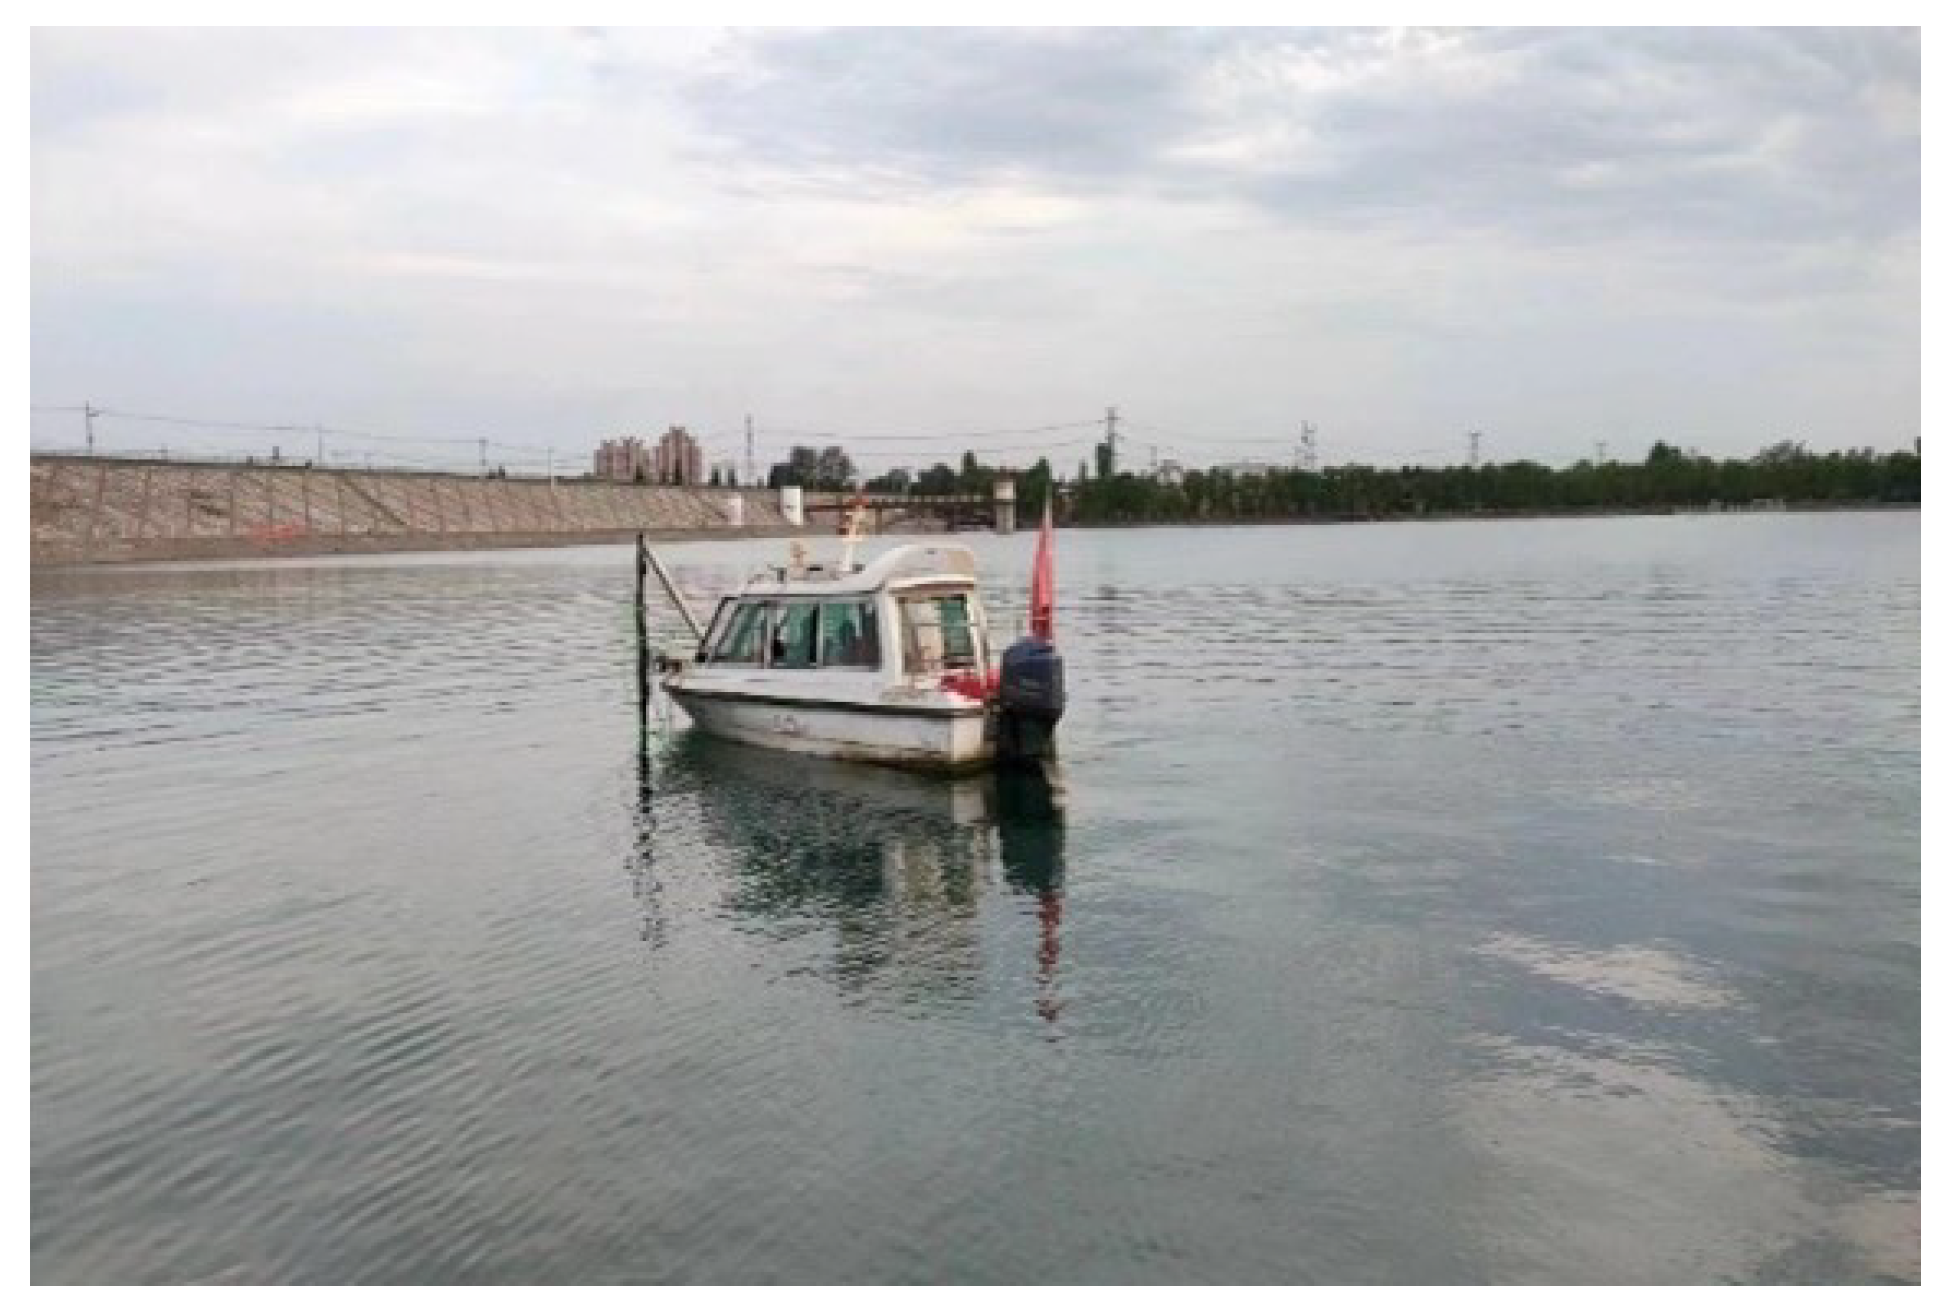
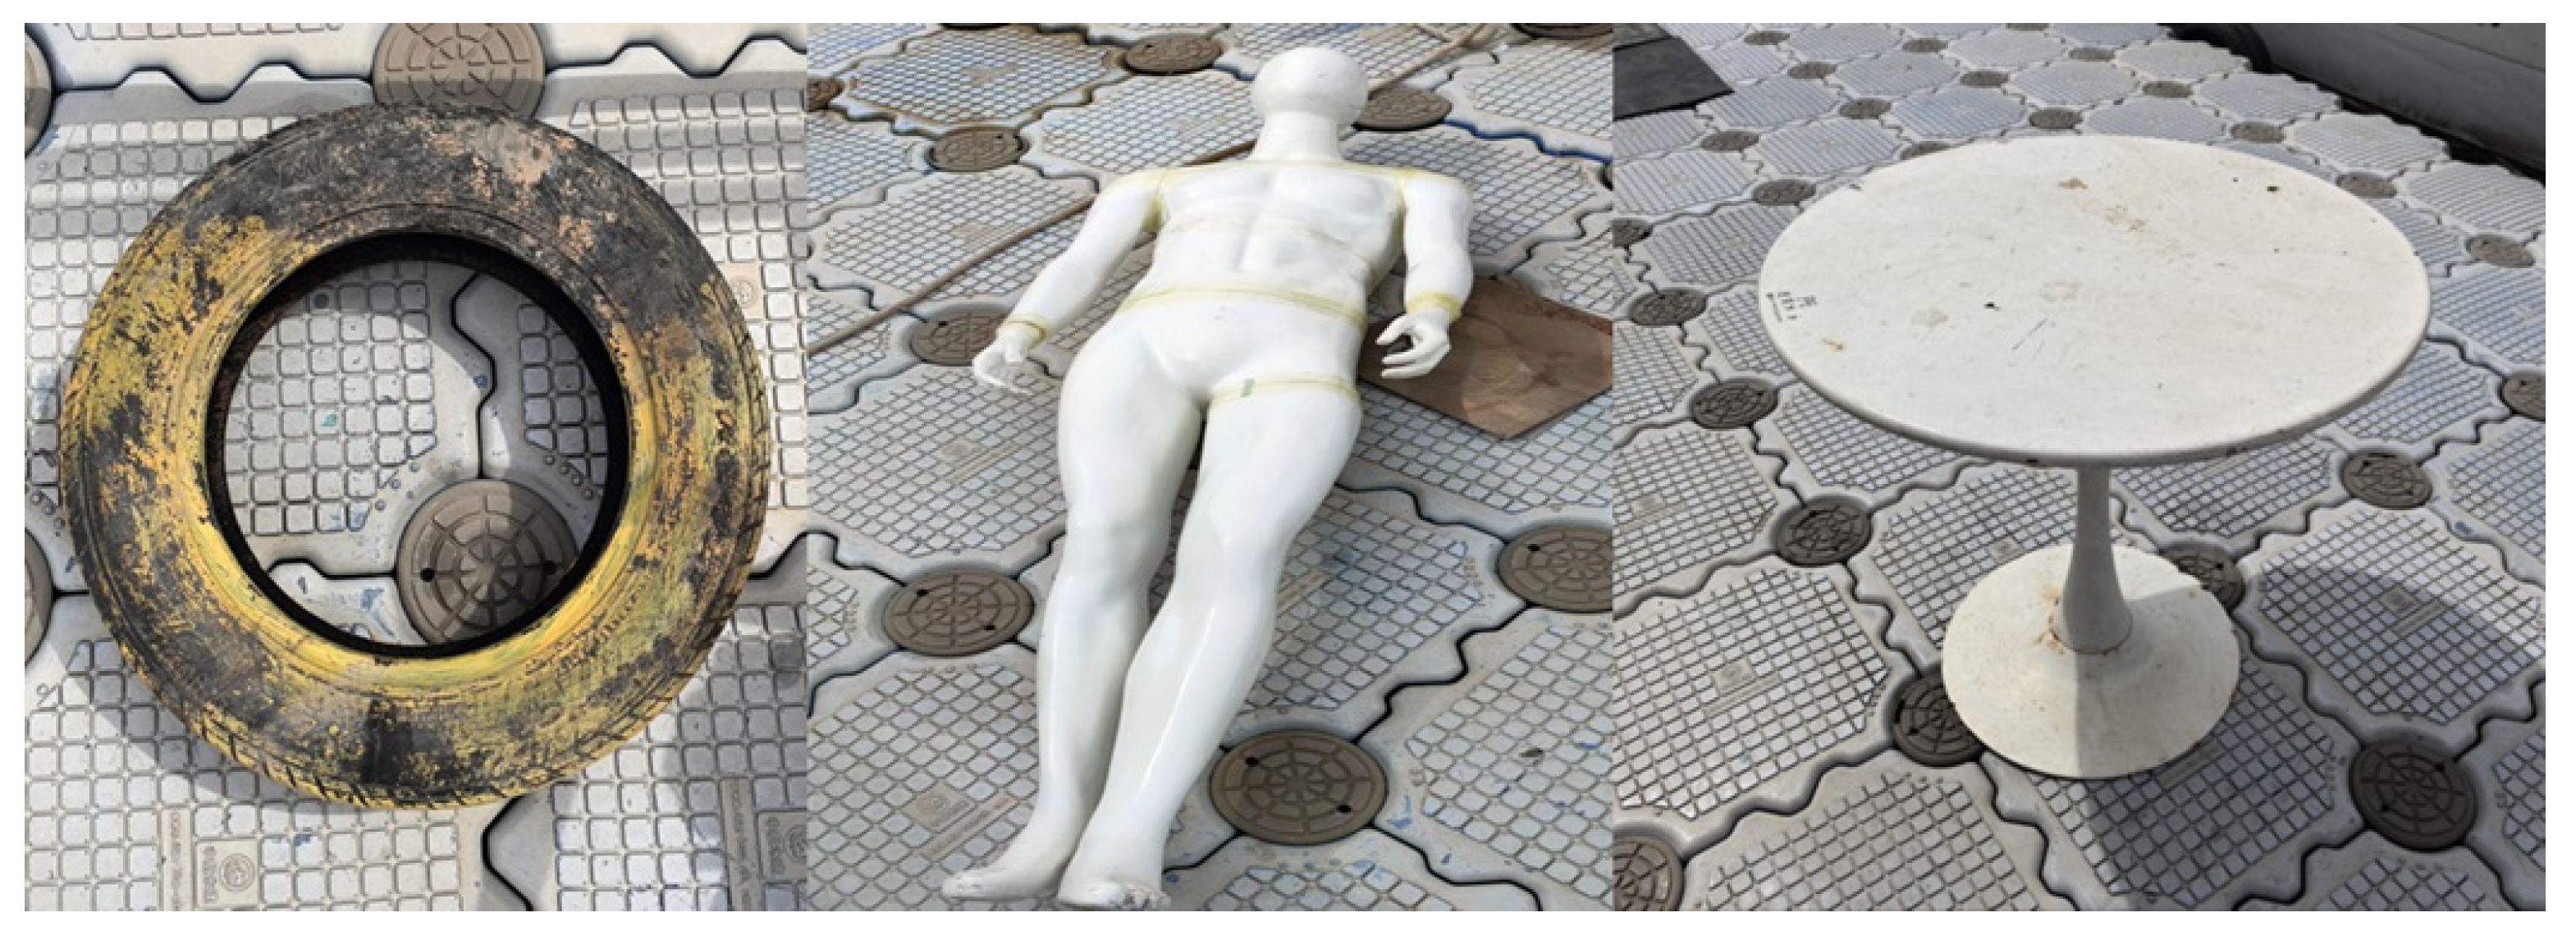
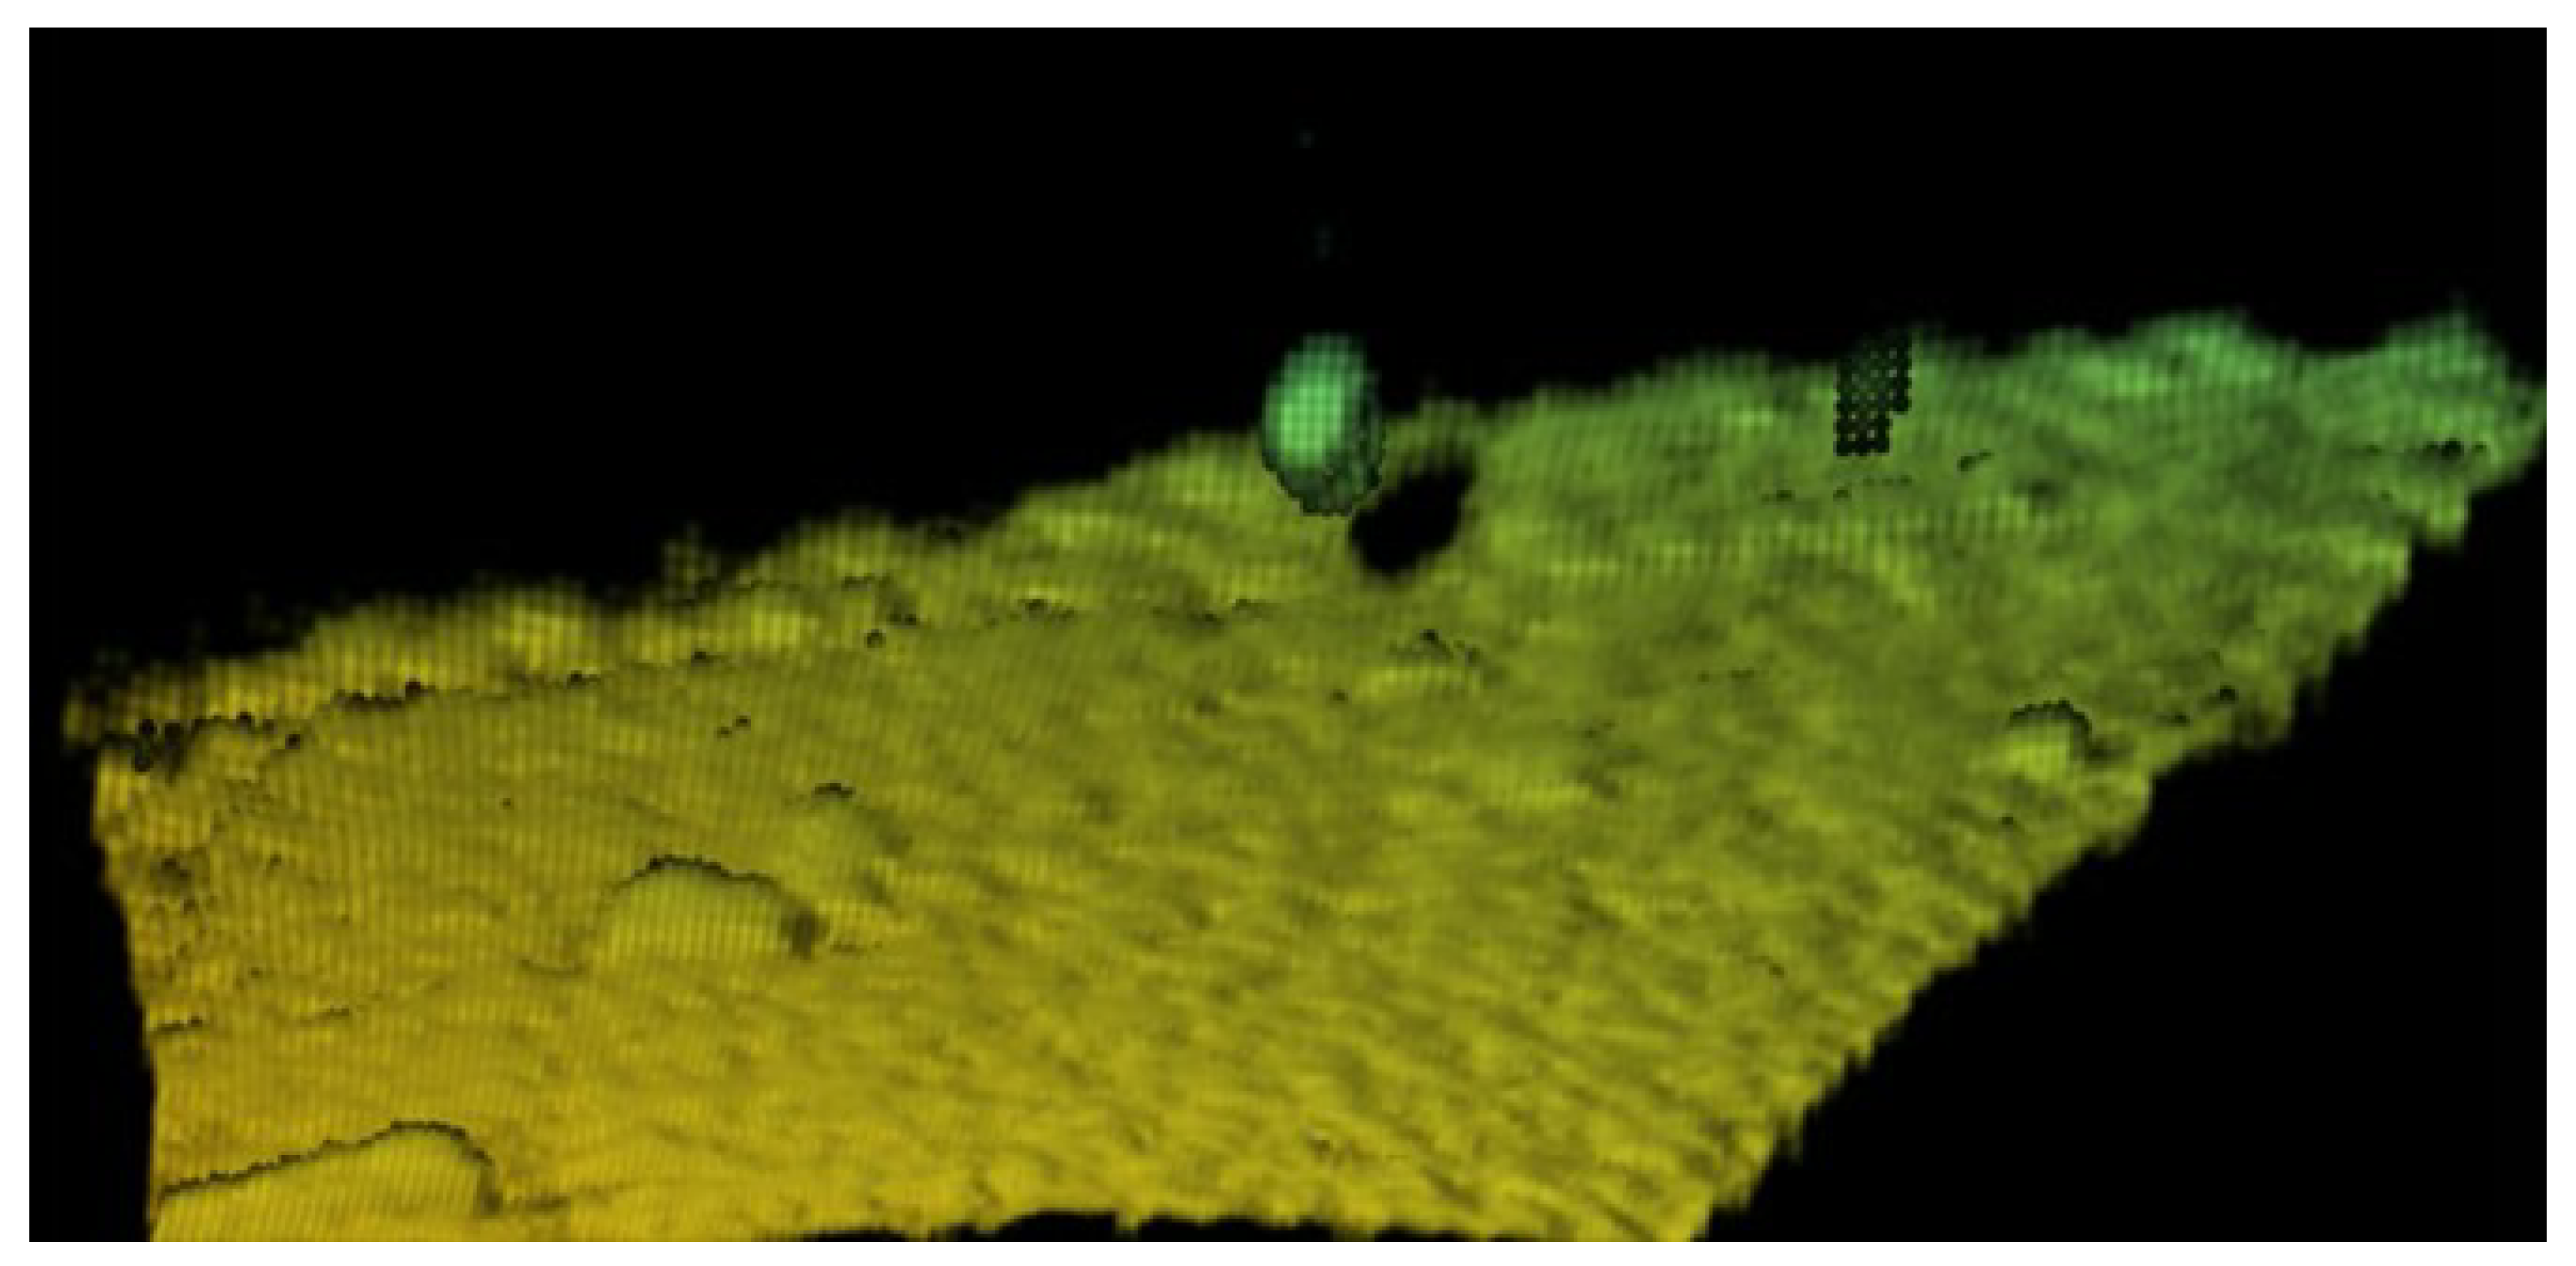
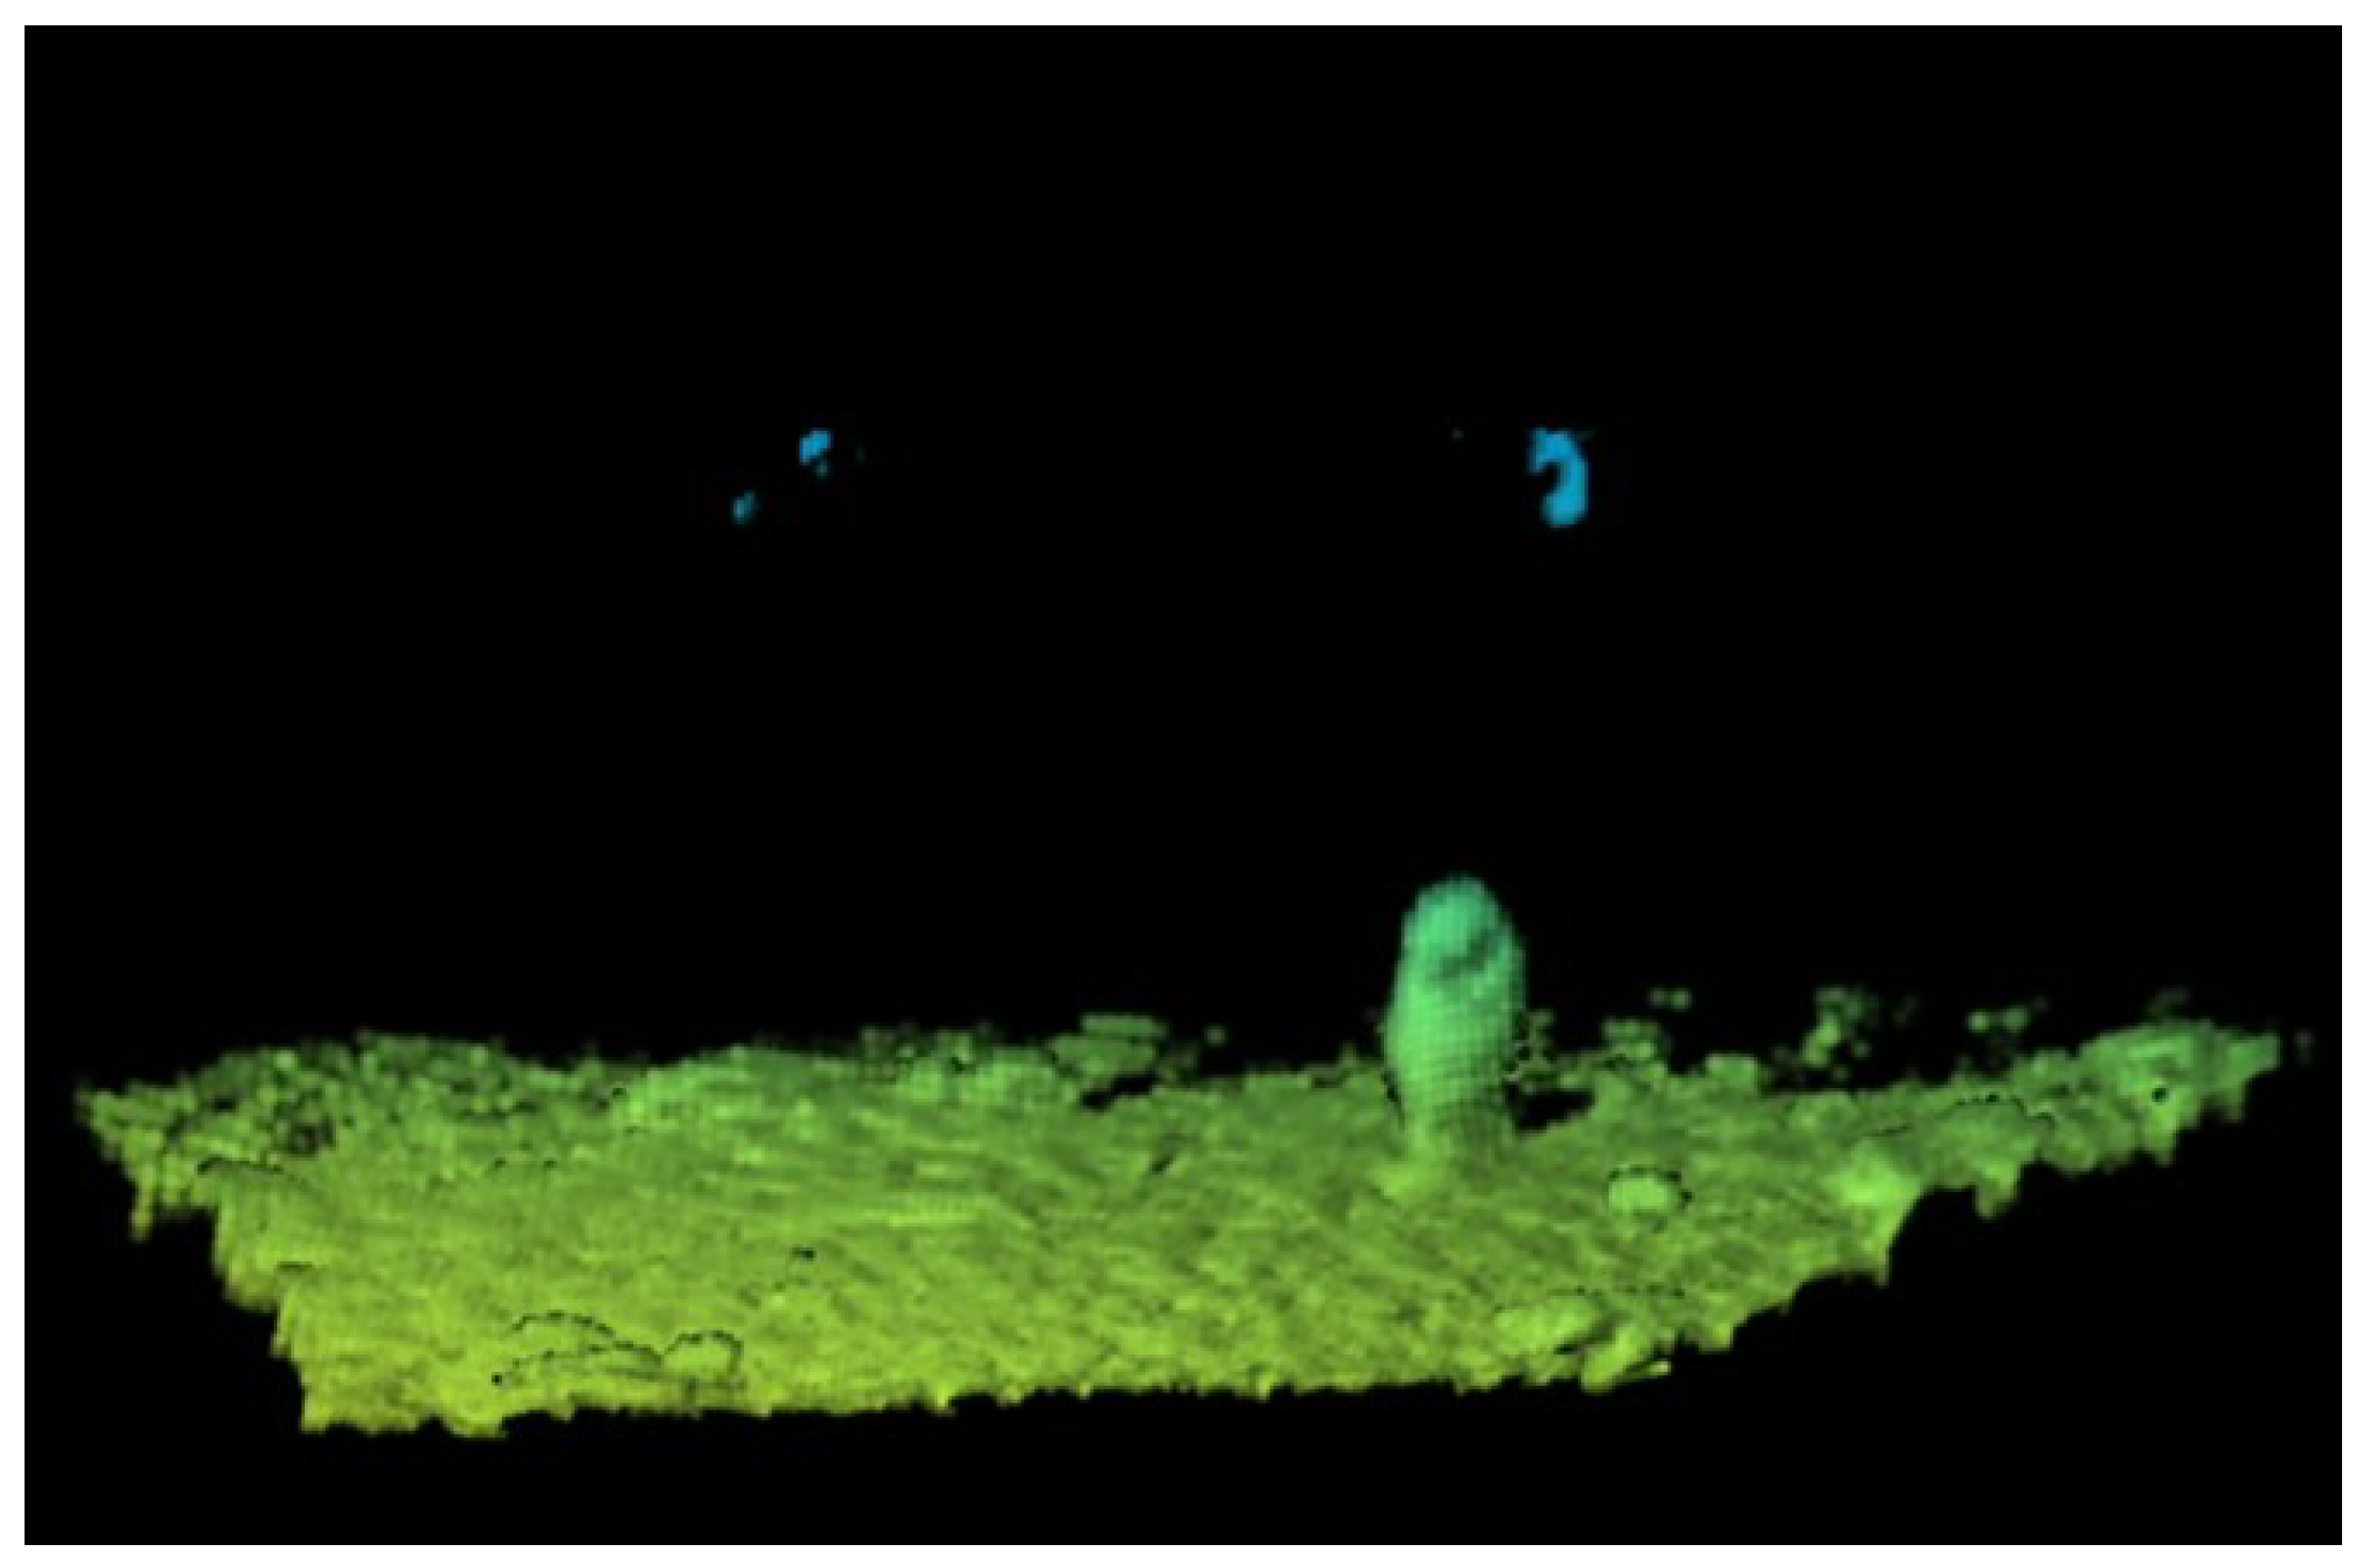
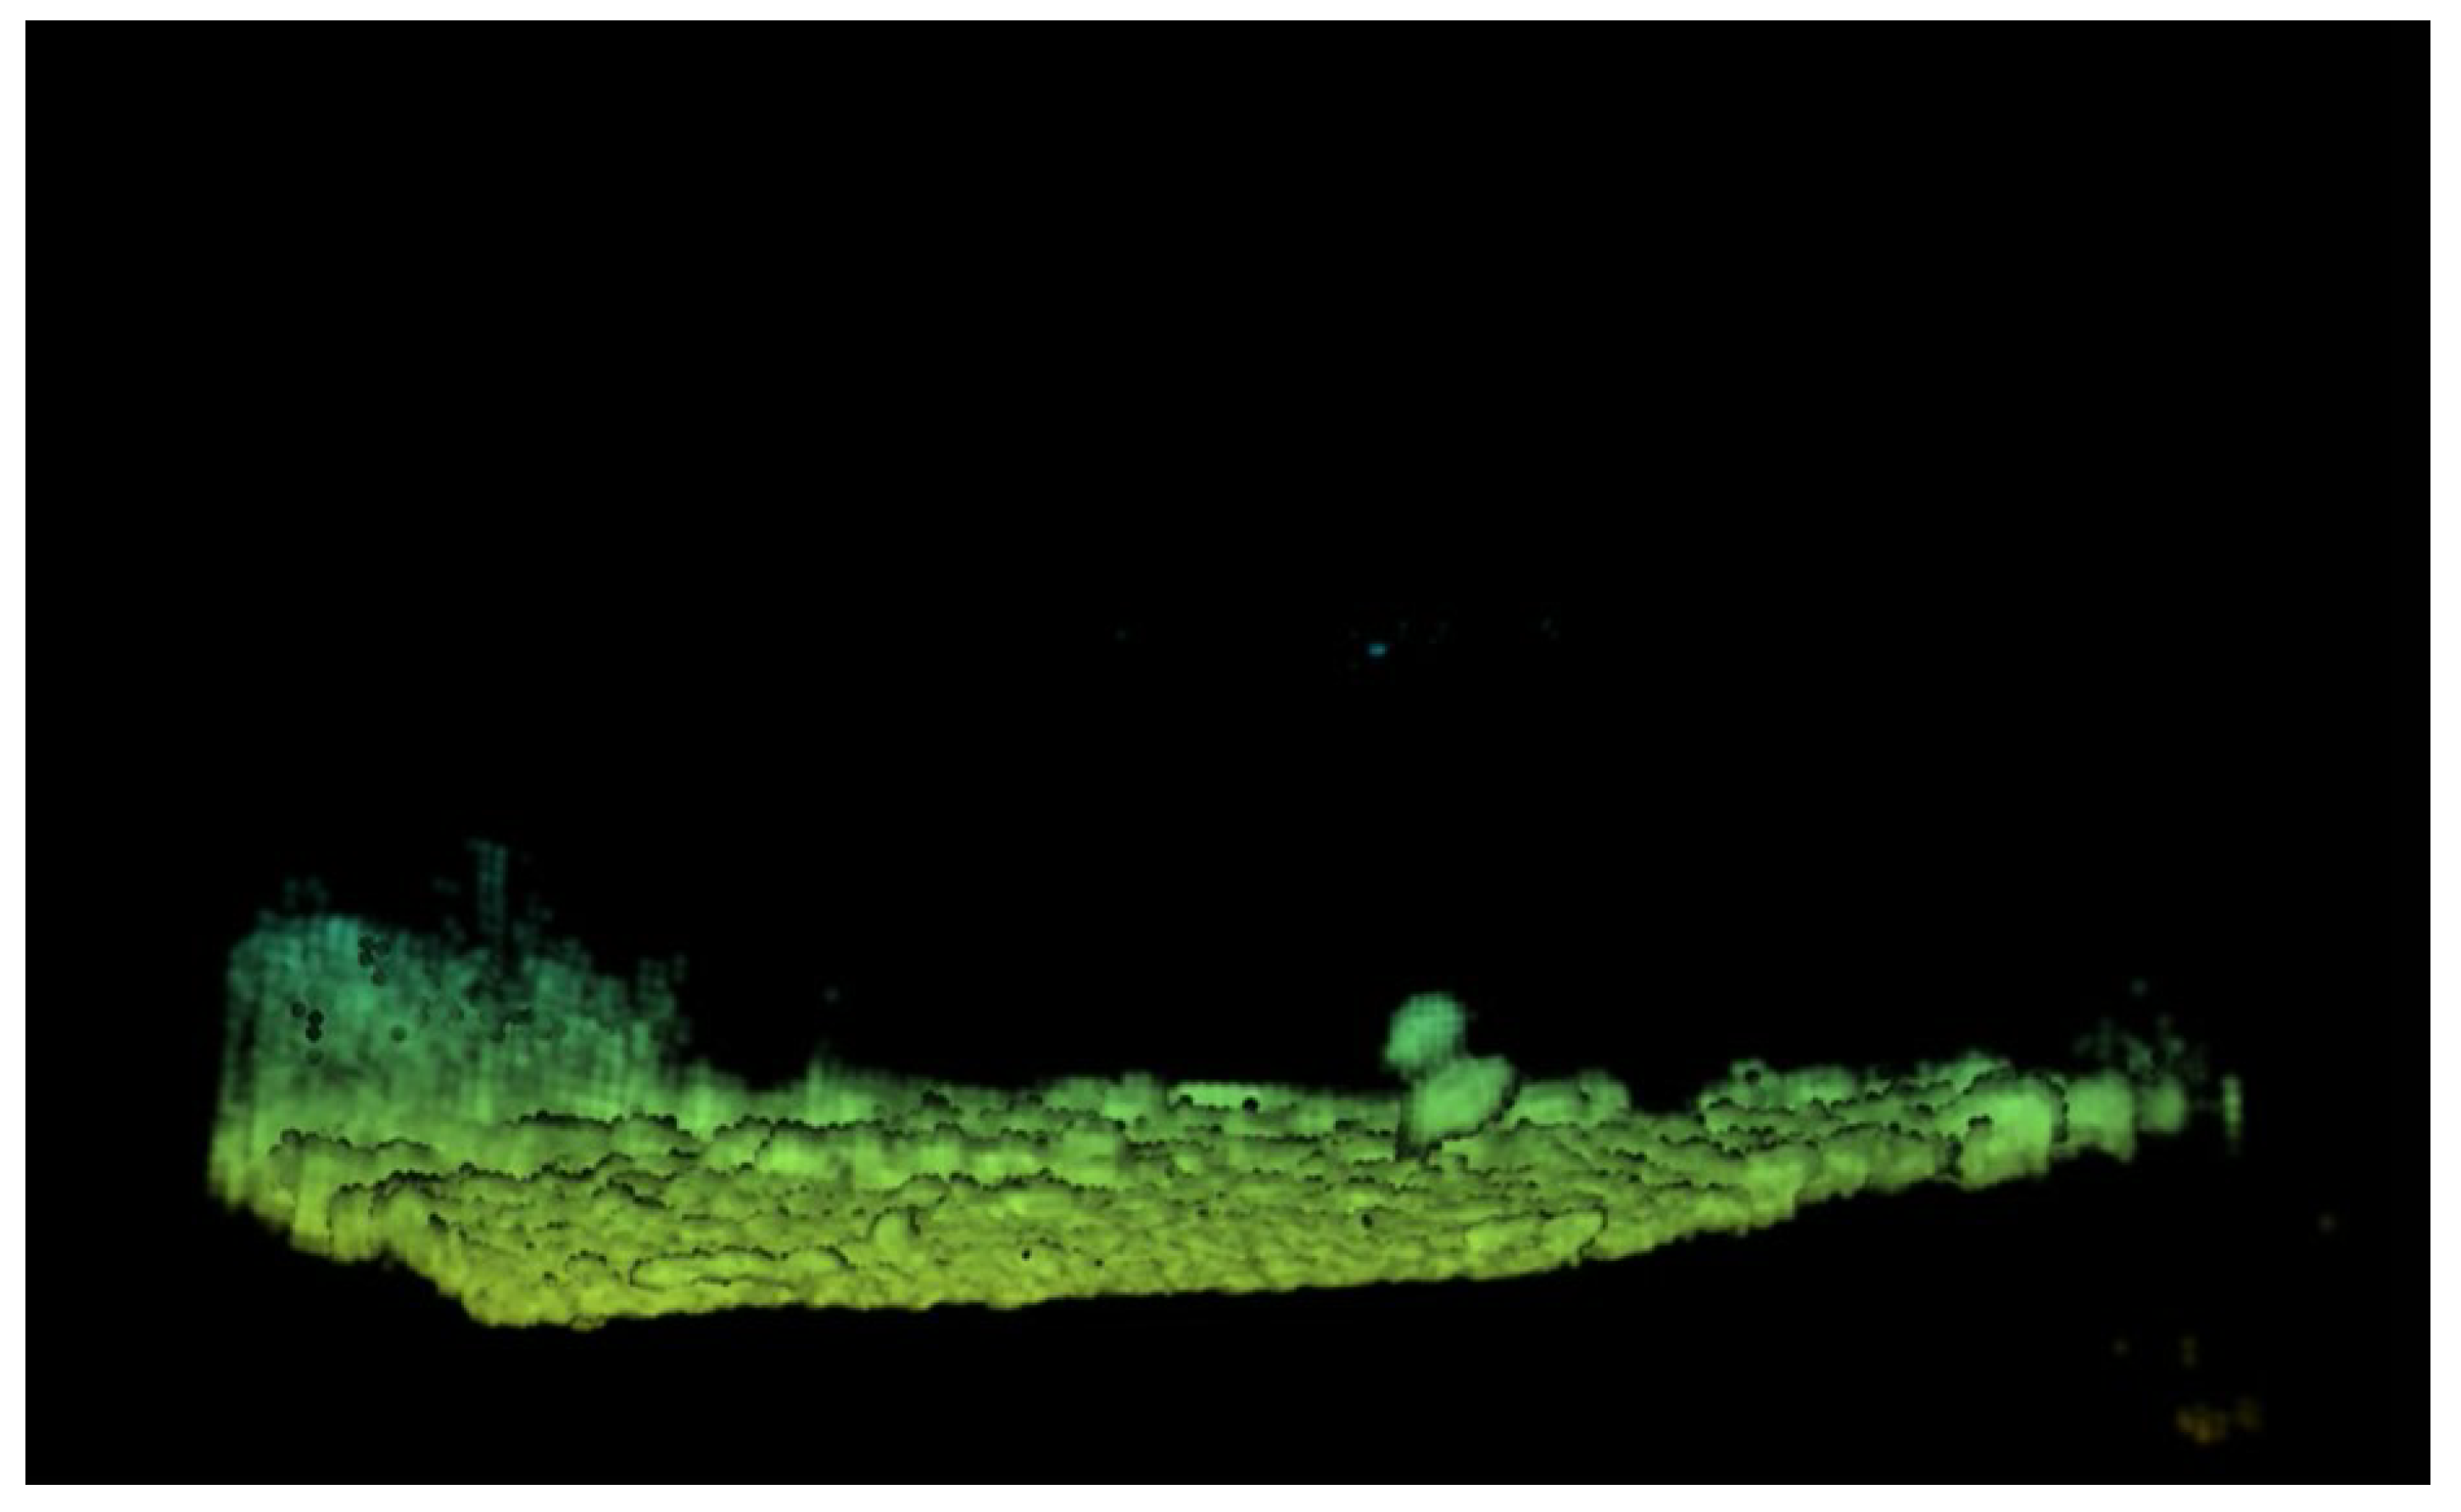
2.1. Data Collection

The data used in this study were collected during experiments conducted in Liquan Lake, Shaanxi Province, in April 2024. The lake’s depth ranges from 6 to 20 m, with the test area being from 6 to 9 m, located near a fishing area, as shown in Figure 2. During the three-day experiment, the lake conditions were favorable, with no wind, no waves, and no boat interference. The imaging sonar equipment, which is the fourth-generation real-time 3D imaging sonar developed by Coda Octopus in the Edinburgh, UK, is shown in Figure 3, with its performance parameters shown in Table 1. CODA 3D imaging sonar was mounted on a metal bracket and hard-connected to the boat, with the sensor submerged at 2 m. As shown in Figure 4, the underwater holder allowed for the real-time adjustment of the transducer’s field of view. While fixed to the boat’s bottom, the CODA’s gyroscope provided real-time platform pose calibration, and onboard software recorded the trajectory.
The lake experiment focused on collecting the 3D imaging data of preset cooperative moving targets in the water, including a tire, mannequin, and metal table, as shown in Figure 5. The tire dimensions were 580 mm outer diameter, 350 mm inner diameter, and 170 mm height; the mannequin was 1.85 m tall; and the metal table was 740 mm in height, with an upper surface diameter of 800 mm and a lower surface diameter of 500 mm.
The dynamic sonar data collection of these targets captured the imaging characteristics of different reflective surfaces, providing a rich dataset for subsequent algorithm research, which helps improve the generalization and robustness of the algorithms. The 3D sonar images of the tire, mannequin, and metal table are shown in Figure 6, Figure 7, Figure 8 and Figure 9. A total of 1534 frames of valid data were used in the study, including 554 frames for the tire, 644 frames for the mannequin, and 336 frames for the metal table.

2.2. Data Annotation

3D imaging sonar data, like LiDAR and depth camera data, take the form of point clouds. Annotation is typically done manually, similar to 2D image annotation, by drawing 3D bounding boxes around targets. This paper proposes a more efficient annotation method.
By replaying historical data frame by frame, the movement of underwater targets can be visually observed, while environmental noise and seabed background remain relatively unchanged. Dynamic target frames are identified and saved as a stack. Using the open source software Cloud Compare, the stacked data are opened, and based on human expertise, the dynamic target point clouds are segmented and labeled. The target category is assigned based on prior knowledge recorded during data collection, and the labels are added as numerical codes to the point cloud data.
Using frame number information, the stacked data are split back into individual frames, each containing the target annotation information. This completes the batch processing of target data, adding segmentation information for dynamic targets. For each frame, the maximum and minimum X , Y , Z coordinates of the segmented target point clouds are calculated to generate a 2 × 3 matrix as follows:
X m a x Y m a x Z m a x X m i n Y m i n Z m i n
A 3D bounding box is automatically generated based on these coordinates, representing the target’s location.
Finally, following the annotation format of the open source KITTI dataset [16], the bounding box dimensions ( X m a x X m i n , Y m a x Y m i n , Z m a x Z m i n ) are calculated. To uniquely identify the target bounding box, the center point coordinates ( ( X m a x X m i n ) / 2 , ( Y m a x Y m i n ) / 2 , ( Z m a x x Z m i n ) / 2 ) are also calculated and added to the annotation file. Additional information, such as the distance from the center to the origin, the center point’s direction angle, and the target’s average reflection intensity, can also be calculated and automatically annotated.

3. Loss Function Optimization and Semantic Segmentation Task

3.1. Loss Function

In underwater sonar point cloud processing, the spatial distribution of point clouds is denser near the sensor and sparser farther away. Using a uniform loss function may cause the model to overfit dense regions while neglecting sparse regions. To address this, we propose a density-based loss function that assigns different weights to data points in different density regions, ensuring the model pays more attention to accurate predictions in sparse regions.
To enhance the model’s segmentation performance in sparse regions, we propose a density-weighted loss function. For each point p i , a weight is assigned based on its local density d i . The weight is calculated as follows:
w i = 1 d i α
where
  • w i is the loss weight for point p i ;
  • d i is the local density of point p i , estimated using the nearest neighbor distance;
  • α is a hyperparameter controlling the weight variation, typically α > 0 , to emphasize sparse regions.
The overall loss function is defined as follows:
L = 1 N i = 1 N w i L ( c i , c i ^ )
where
  • N is the total number of points in the point cloud;
  • L ( c i , c i ^ ) is the basic loss function (e.g., cross-entropy or mean squared error) for the true class c i and predicted class c i ^ of point p i ;
  • w i is the weight for point p i , emphasizing sparse regions. This density-weighted loss function reduces the risk of overfitting in dense regions by assigning lower weights while improving segmentation accuracy in sparse regions by assigning higher weights.

3.2. Semantic Segmentation Experiment

To address the challenges of high-dimensional perception, this project employs sparse tensors and generalized sparse convolution. Sparse convolution [17] is efficient and fast, saving memory and computation. For 3D scans or high-dimensional data, where most of the space is empty, it only computes outputs at predefined coordinates and stores them as compact sparse tensors. This work uses the Minkowski network [15], which is based on sparse representation. Generalized sparse convolution allows the arbitrary definition of the stride and kernel shape, making it easier to create high-dimensional networks. For segmentation tasks, a U-Net structure effectively integrates multi-level features for efficient segmentation.
Based on the optimized loss function, the Minkowski baseline network was used to compare the IOU of the seabed, water noise, tire, mannequin, and table. The proposed density-based loss function optimization method improved segmentation accuracy across all five categories, with an overall mIOU increase of 6.939, as shown in Table 2 below.

4. Unsupervised Inter-Frame Association Extraction Method D-DBSCAN and Target Detection Task

4.1. D-DBSCAN

When conducting experiments on object detection tasks using the collected data, we found that directly applying networks such as PointNet [9] and VoxelNet [7] for classification and regression tasks yielded poor results and consumed significant computational time. During the data collection process, for continuously moving targets in water, the collectors could distinguish between moving objects in the point cloud by leveraging inter-frame correlation. Although the category of the object is difficult to identify, attention can be focused on the moving target regions [18], thereby improving the accuracy and speed of object detection. The following question then arises: how can we use an unsupervised algorithm to focus on and extract moving targets before feeding the data into the object detection network? This is the starting point of our method.
Through extensive comparative experiments, we first applied DBSCAN [19,20,21] to cluster each single frame of data. The parameters for the first clustering were set as follows: the neighborhood radius was set to 2, and the minimum number of points in a neighborhood minimum sampling number was set to 5. The first clustering achieved a preliminary separation of the point cloud into moving targets, seabed background, and noise. Next, we extracted the center coordinates P 1 , P 2 , P n of each clustered point cloud group in a single frame [22,23]. By projecting the center coordinates of each adjacent frame within the same stack onto the same coordinate system, we obtained a multi-frame superimposed cluster center point cloud map [24], as shown in Figure 10. The superimposed center point cloud map aggregates the positional relationships of the clustering results from adjacent frames in the same coordinate system, establishing associations between the same clusters in adjacent frames, simulating the self-attention mechanism of human eyes for moving targets in the point cloud field of view.
Further, we applied a second spatial clustering Double-DBSCAN, D-DBSCAN, with the neighborhood radius set to 2 and the minimum sampling number of points set to 3 [25]. The second clustering grouped center points with strong correlations together. Finally, we extracted the variance α of the positional changes of the same class center points across multiple frames and the mean reflection intensity I [26]. The cluster with the smallest variance α was identified as the seabed background, while the cluster with the highest reflection intensity I was identified as the moving target in the water. Through this unsupervised approach, we first extracted the data of moving targets in water, and we then fed the extracted data into the object detection network to solve the classification problem, thereby addressing the object detection task.

4.2. Object Detection Task

We first employed a two-stage object detection network, PointRCNN, as the baseline network. PointRCNN directly generates high-quality 3D object proposals from raw point clouds. Through its two-stage network structure, it performs 3D proposal generation and proposal refinement. Unlike traditional methods, PointRCNN does not rely on a large number of 3D anchor boxes but improves detection accuracy and efficiency through foreground and background segmentation, as shown in Figure 11.
The network architecture of PointRCNN consists of the following two main stages: the first stage is 3D proposal generation, and the second stage is proposal refinement and classification. The input of the network is point cloud data, and the specific workflow is as follows.
The first stage of the network is based on PointNet++ [10] and employs a multi-scale grouping strategy. The main task of this stage is to extract features from the point cloud and generate 3D proposals. (1) Point cloud grouping: The point cloud is grouped through four set-abstraction layers, generating groups of 4096, 1024, 256, and 64 points, respectively. The features of each group are processed through feature propagation layers to obtain the feature vectors for each point. (2) Foreground point segmentation: During training, all points within the 3D ground truth box are considered foreground points, while other points are considered background points. To improve the robustness of segmentation, the 3D ground truth box is expanded by 0.2 m on each side to ignore background points near the object boundaries. (3) Proposal generation: A grid-based proposal generation method is used, with a search range S of 3 m, a grid size δ of 0.5 m, and with the number of orientation grids n set to 12. This method avoids the use of a large number of predefined 3D boxes, significantly reducing the search space for 3D proposal generation.
In the second stage, the network refines and classifies the proposals generated in the first stage. (1) Proposal augmentation: To increase the diversity of proposals, random augmentations are applied to the 3D proposals, introducing small variations. (2) Feature extraction: For each proposal, 64 points are randomly sampled from the corresponding points as input. A feature vector is generated through three set-abstraction layers, which are used for object confidence classification and proposal location refinement. (3) Feature fusion: Local spatial features are concatenated with global semantic features and fed into multiple fully connected layers to encode local features while maintaining consistency with the global feature dimensions.
During data preprocessing, an unsupervised inter-frame correlation extraction method D-DBSCAN was employed to accomplish the extraction of moving underwater targets in object detection tasks, formulated as a regression problem. The training set was augmented with data enhanced by the correlation extraction method, thereby improving the network’s robustness for both preprocessed and raw data. Subsequently, the classification task was completed using the PointNet++ classification network. For testing, the dataset was first preprocessed via the correlation extraction method and then input into the trained model. With the removal of underwater background noise, the mAP value for moving target recognition and the inference speed can be further improved. Extensive experimental results have demonstrated that mAP showed a significant 21.3 improvement across all three target categories.
The precision of object detection obtained through the baseline network and OURS preprocessing method is shown in Table 3.

5. Conclusions and Discussion

This research belongs to the interdisciplinary field of hydroacoustics and 3D vision. Underwater 3D vision work is limited by data and industry barriers, with few academic references available. This paper focuses on 3D imaging sonar data for underwater environments, reviews the data collection of three typical targets, and conducts research on perception tasks such as semantic segmentation and object detection. The main innovations are as follows: firstly, a batch annotation method that combines human expertise and multi-frame superposition is proposed; secondly, a density-based loss function is introduced, which achieved a 9.939 improvement in mIOU for semantic segmentation tasks; thirdly, a multi-frame joint unsupervised method for extracting moving targets in water, D-DBSCAN, is proposed, achieving an improvement of 21.3 points in mAP.
For long-range 3D imaging sonar data, semantic segmentation and object detection have shown remarkable performance in identifying the seafloor. This could be attributed to factors such as the relatively large amount of seafloor data and the more stable distribution variance. The advantage of D-DBSCAN lies in its ability to quickly separate moving targets from the seafloor and noise in a continuous frame, and it accomplishes this in an unsupervised manner. However, the disadvantage is that it requires that data is complete and continuous. The mAP value in this study does not reach 90, or above, as is common in other visual detection tasks too. This is due to factors such as the long data acquisition distance, the small amount of data, the sparsity of the point cloud, and the size and material of the target being measured.
Additionally, this article leaves much to be desired. The proposed loss function can be further explored in the field of object detection. The multi-frame joint unsupervised method, D-DBSCAN, for extracting moving targets in water can be further improved for the recognition of stationary seabed targets.
The perception evaluation result of 3D imaging sonar seems to perform worse when compared to the detection accuracy of LiDAR and 2D RGB vision tasks. This is mainly due to factors such as the 3D sonar physical peculiarity itself, underwater data acquisition, shallow water bottom, target material, and distance. Because of these, there is room for future research.

Author Contributions

Methodology, J.Y. and R.H.; Validation, Z.S.; Investigation, G.H. and Q.Z.; Resources, A.H. All authors have read and agreed to the published version of the manuscript.

Funding

This research received no external funding.

Institutional Review Board Statement

Not applicable.

Informed Consent Statement

Not applicable.

Data Availability Statement

Restrictions apply to the availability of these data. Data were obtained from Ganjiang Institute and are available with the permission of Ganjiang Institute.

Conflicts of Interest

The authors declare no conflicts of interest.

References

  1. Steiniger, Y.; Kraus, D.; Meisen, T. Survey on deep learning based computer vision for sonar imagery. Eng. Appl. Artif. Intell. 2022, 114, 105157. [Google Scholar] [CrossRef]
  2. Davis, A.; Lugsdin, A. High speed underwater inspection for port and harbour security using Coda Echoscope 3D sonar. In Proceedings of the OCEANS 2005 MTS/IEEE, Washington, DC, USA, 17–23 September 2005; pp. 2006–2011. [Google Scholar]
  3. Hożyń, S. A review of underwater mine detection and classification in sonar imagery. Electronics 2021, 10, 2943. [Google Scholar] [CrossRef]
  4. Ferreira, F.; Djapic, V.; Micheli, M.; Caccia, M. Forward looking sonar mosaicing for mine countermeasures. Ann. Rev. Control 2015, 40, 212–226. [Google Scholar] [CrossRef]
  5. Zhang, H.; Tian, M.; Shao, G.; Cheng, J.; Liu, J. Target detection of forward-looking sonar image based on improved YOLOv5. IEEE Access 2022, 10, 18023–18034. [Google Scholar] [CrossRef]
  6. Xie, K.; Yang, J.; Qiu, K. A dataset with multibeam forward-looking sonar for underwater object detection. Sci. Data 2022, 9, 739. [Google Scholar] [CrossRef] [PubMed]
  7. Zhou, Y.; Tuzel, O. Voxelnet: End-to-end learning for point cloud based 3D object detection. In Proceedings of the IEEE Conference on Computer Vision and Pattern Recognition, Salt Lake City, UT, USA, 18–22 June 2018; Volume 4490, p. 4499. [Google Scholar]
  8. Lang, A.H.; Vora, S.; Caesar, H.; Zhou, L.; Yang, J.; Beijbom, O. Pointpillars: Fast encoders for object detection from point clouds. In Proceedings of the IEEE/CVF Conference on Computer Vision and Pattern Recognition, Long Beach, CA, USA, 15–20 June 2019; Volume 12697, p. 12705. [Google Scholar]
  9. Qi, C.R.; Su, H.; Mo, K.; Guibas, L.J. Pointnet: Deep learning on point sets for 3D classification and segmentation. In Proceedings of the IEEE Conference on Computer Vision and Pattern Recognition, Honolulu, HI, USA, 21–26 July 2017; Volume 652, p. 660. [Google Scholar]
  10. Qi, C.R.; Yi, L.; Su, H.; Guibas, L.J. Pointnet++: Deep hierarchical feature learning on point sets in a metric space. In Proceedings of the Advances in Neural Information Processing Systems 30 (NIPS 2017), Long Beach, CA, USA, 4–9 December 2017; Volume 30. [Google Scholar]
  11. Shi, S.; Wang, X.; Li, H. Pointrcnn: 3D object proposal generation and detection from point cloud. In Proceedings of the IEEE/CVF Conference on Computer Vision and Pattern Recognition, Long Beach, CA, USA, 15–20 June 2019; Volume 770, p. 779. [Google Scholar]
  12. Yang, Z.; Sun, Y.; Liu, S.; Jia, J. 3DSSD: Point-based 3D single stage object detector. In Proceedings of the IEEE/CVF Conference on Computer Vision and Pattern Recognition, Seattle, WA, USA, 14–19 June 2020; Volume 11040, p. 11048. [Google Scholar]
  13. Vora, S.; Lang, A.H.; Helou, B.; Beijbom, O. Pointpainting: Sequential fusion for 3D object detection. In Proceedings of the IEEE Conference on Computer Vision and Pattern Recognition, Boston, MA, USA, 7–12 June 2015; Volume 806, p. 814. [Google Scholar]
  14. Mao, A.; Mohri, M.; Zhong, Y. Cross-entropy loss functions: Theoretical analysis and applications. Int. Conf. Mach. Learn. 2023, 23803, 23828. [Google Scholar]
  15. Choy, C.; Gwak, J.Y.; Savarese, S. 4D spatio-temporal convnets: Minkowski convolutional neural networks. In Proceedings of the IEEE/CVF Conference on Computer Vision and Pattern Recognition, Long Beach, CA, USA, 15–20 June 2019; Volume 3075, p. 3084. [Google Scholar]
  16. Geiger, A.; Lenz, P.; Urtasun, R. Are we ready for autonomous driving? the kitti vision benchmark suite. In Proceedings of the 2012 IEEE Conference on Computer Vision and Pattern Recognition, Providence, RI, USA, 16–21 June 2012; Volume 3354, p. 3361. [Google Scholar]
  17. Liu, B.; Wang, M.; Foroosh, H.; Tappen, M.; Pensky, M. Sparse convolutional neural networks. In Proceedings of the 2012 IEEE Conference on Computer Vision and Pattern Recognition, Providence, RI, USA, 16–21 June 2012; Volume 806, p. 814. [Google Scholar]
  18. Wang, Y.; Lv, K.; Huang, R.; Song, S.; Yang, L.; Huang, G. Glance and focus: A dynamic approach to reducing spatial redundancy in image classification. Adv. Neural Inf. Process. Syst. 2020, 33, 2432–2444. [Google Scholar]
  19. Hahsler, M.; Piekenbrock, M.; Doran, D. dbscan: Fast density-based clustering with R. J. Stat. Softw. 2019, 91, 1–30. [Google Scholar] [CrossRef]
  20. Schubert, E.; Sander, J.; Ester, M.; Kriegel, H.P.; Xu, X. DBSCAN revisited, revisited: Why and how you should (still) use DBSCAN. ACM Tran. Database Syst. (TODS) 2017, 42, 1–21. [Google Scholar] [CrossRef]
  21. Khan, K.; Rehman, S.U.; Aziz, K.; Fong, S.; Sarasvady, S. DBSCAN: Past, present and future. In Proceedings of the Fifth International Conference on the Applications Of Digital Information and Web Technologies (ICADIWT 2014), Chennai, India, 17–19 February 2014; Volume 232, p. 238. [Google Scholar]
  22. Xie, H.; Yuan, B.; Xie, W. Moving target detection algorithm based on LK optical flow and three-frame difference method. Appl. Sci. Technol. 2016, 3, 23–27. [Google Scholar]
  23. Lei, L.; Guo, D. Multitarget detection and tracking method in remote sensing satellite video. Comput. Intell. Neurosci. 2021, 2021, 7381909. [Google Scholar] [CrossRef] [PubMed]
  24. Sun, X.; Ma, H.; Sun, Y.; Liu, M. A novel point cloud compression algorithm based on clustering. IEEE Robot. Autom. Lett. 2019, 4, 2132–2139. [Google Scholar] [CrossRef]
  25. Kremers, B.J.; Citrin, J.; Ho, A.; van de Plassche, K.L. Two-step clustering for data reduction combining DBSCAN and k-means clustering. Contrib. Plasma Phys. 2023, 63, e202200177. [Google Scholar] [CrossRef]
  26. Cervenka, P.; De Moustier, C. Sidescan sonar image processing techniques. IEEE J. Ocean. Eng. 2002, 18, 108–122. [Google Scholar] [CrossRef]
Figure 1. 3D sonar image.
Jmse 13 00529 g001
Figure 2. The red box test area in Liquan lake.
Jmse 13 00529 g002
Figure 3. CODA testing equipment.
Jmse 13 00529 g003
Figure 4. Testing boat.
Jmse 13 00529 g004
Figure 5. Tire, mannequin, and table test targets.
Jmse 13 00529 g005
Figure 6. Tire 3D sonar image.
Jmse 13 00529 g006
Figure 7. Mannequin 3D sonar image.
Jmse 13 00529 g007
Figure 8. Metal table 3D sonar image.
Jmse 13 00529 g008
Figure 9. Structure of MinkowskiUNet32 [15].
Jmse 13 00529 g009
Figure 10. D-DBSCAN clustering effect.
Jmse 13 00529 g010
Figure 11. Structure of PointRCNN [4].
Jmse 13 00529 g011
Table 1. CODA parameters.
FeatureCODA Specification
Frequency375, 610 kHz
Beam Count128 × 128 (16,384 total)
Field of View Coverage50° × 24°, 24° × 50° (standard)
Pressure Depth600–3000 m (1968–9842 ft)
Sonar Dimensions380 × 300 × 160 mm (15 × 12 × 6 in)
Sonar Weight24.6 kg/54.2 lb
Table 2. Comparison of segmentation effects.
MethodLakebedNoiseTireMannequinTablemIOU
Baseline98.52027.9130.00070.92410.94841.661
OURS99.28030.0520.28378.73534.69848.6 (+6.939)
Table 3. Comparison of detection effects.
CategoryPointRCNNOURS
Tire25.16548.210
Mannequin81.81093.431
Table10.21439.525
mAP39.06360.389 (+21.3)
Disclaimer/Publisher’s Note: The statements, opinions and data contained in all publications are solely those of the individual author(s) and contributor(s) and not of MDPI and/or the editor(s). MDPI and/or the editor(s) disclaim responsibility for any injury to people or property resulting from any ideas, methods, instructions or products referred to in the content.

