Article

Study on the Effects of Internal Building Layouts on Tsunami-Driven Single-Container Motion

Department of Civil and Environmental Engineering, Nagoya University, Nagoya 464-8603, Japan
*
Author to whom correspondence should be addressed.
J. Mar. Sci. Eng. 2025, 13(3), 513; https://doi.org/10.3390/jmse13030513
Submission received: 12 February 2025 / Revised: 27 February 2025 / Accepted: 3 March 2025 / Published: 6 March 2025
(This article belongs to the Special Issue Advanced Studies in Marine Geomechanics and Geotechnics)

Abstract

:
This study investigated the complex interactions among tsunamis, debris, and coastal building structures under extreme hydrodynamic conditions. We performed numerical simulations to explore the influence of varying wave conditions, debris, and building designs to identify the most vulnerable parts of a building structure. The three-dimensional coupled fluid–structure–sediment–seabed interaction model (FS3M) was employed to simulate these interactions and validated against physical experimental data to ensure accuracy. The results revealed that debris significantly altered the wave impact dynamics, increasing the force exerted on buildings regardless of their structural features. This study provides relevant insights into the effectiveness of different building layouts in mitigating damage, highlighting the critical role of buildings with internal walls perpendicular to the wave direction, which significantly mitigated the tsunami’s impact at specific regions.

1. Introduction

Coastal communities in low-lying areas are particularly vulnerable to the devastating impacts of extreme tsunami events, often experiencing the onslaught of towering waves just minutes after an earthquake strikes [1]. One notable strategy for reducing damage and saving lives involves evacuating coastal residents to sufficiently high and robust tsunami vertical shelters to reduce loss of life [2]. These shelters have become widely adopted adaptation measures in numerous coastal communities, offering stable safety amidst the chaos of tsunamis. However, despite meticulous preparedness efforts in Japan’s Tohoku region, including the deployment of nearshore and onshore tsunami barriers, planted tree barriers, reinforced concrete vertical evacuation buildings, and regular evacuation training, the region still suffered catastrophic destruction [3,4,5]. Thus, understanding the dynamics of tsunami forces on coastal buildings and how these structures respond is crucial for mitigating potential devastation under such extreme circumstances.
Previous investigations [6,7,8,9,10] have highlighted the significant influence of factors such as distance from the coast and elevation above ground level on the stability of buildings in coastal areas. Mizutani et al. [11] discovered that openings in coastal structures effectively alleviate high-pressure zones during tsunami events. Shafiei et al. [12] and Wüthrich et al. [13] performed large-scale experiments to closely replicate the damage inflicted by tsunamis on coastal buildings. Some researchers [14,15,16] revealed that gabled roofs endure pressures up to 80% higher than flat roofs.
However, the existing body of research on the cascading effects of tsunamis and tsunami-driven debris on the internal layouts of buildings remains limited. Prior studies on simplified building models have predominantly focused on the opening ratio of buildings, neglecting the nuanced impacts of structural features, such as staircases, interior walls, ceilings, and floors, on tsunami dynamics. Consequently, these simplified investigations offer limited guidance for designing pragmatic tsunami shelters. Water flowing through openings, such as doors and windows, exacerbates the internal impact of waves on buildings [17]. This necessitates more intricate experiments to provide robust data supporting future coastal structure design.
In addition, extreme coastal events such as tsunamis often generate debris transport, inflicting damage on infrastructure and impeding community resilience [18]. Although large-scale tsunamis exert substantial hydrodynamic forces on buildings, the additional impact of debris, ranging from containers and vehicles to vessels and wooden logs, further exacerbates structural instability through collisions [19]. Despite the development of formulas for estimating the impact force of extreme coastal events and their entrained debris on buildings [20], current numerical models for tracking tsunami-generated debris movements remain largely untested under real-world conditions. These models have only been validated under simple conditions (e.g., single-wave conditions), failing to account for real-world tsunami processes. Thus, a comprehensive investigation into the complex interactions between debris and internal building layouts under realistic tsunami conditions is imperative.
This study primarily aims to investigate the intricate interactions among tsunamis, debris, and buildings under extreme hydrodynamic conditions. It seeks to evaluate the influence of varying wave conditions, single-container, and five internal building layouts on structural damage. Ultimately, this study aims to enhance the practical applicability of numerical simulations in accurately depicting the motion of tsunami-driven single container within buildings.
The remainder of this paper is structured as follows: Section 2 provides a succinct overview of the hydraulic experiments conducted by Lee et al. [21]; Section 3 describes the methodology employed in the numerical simulations; Section 4 presents time-series data on water surface elevation, flow velocities, and pressures across diverse wave scenarios; Section 5 discusses the factors influencing building damage; and, Section 6 presents the overarching findings of this study and suggests potential avenues for future research.

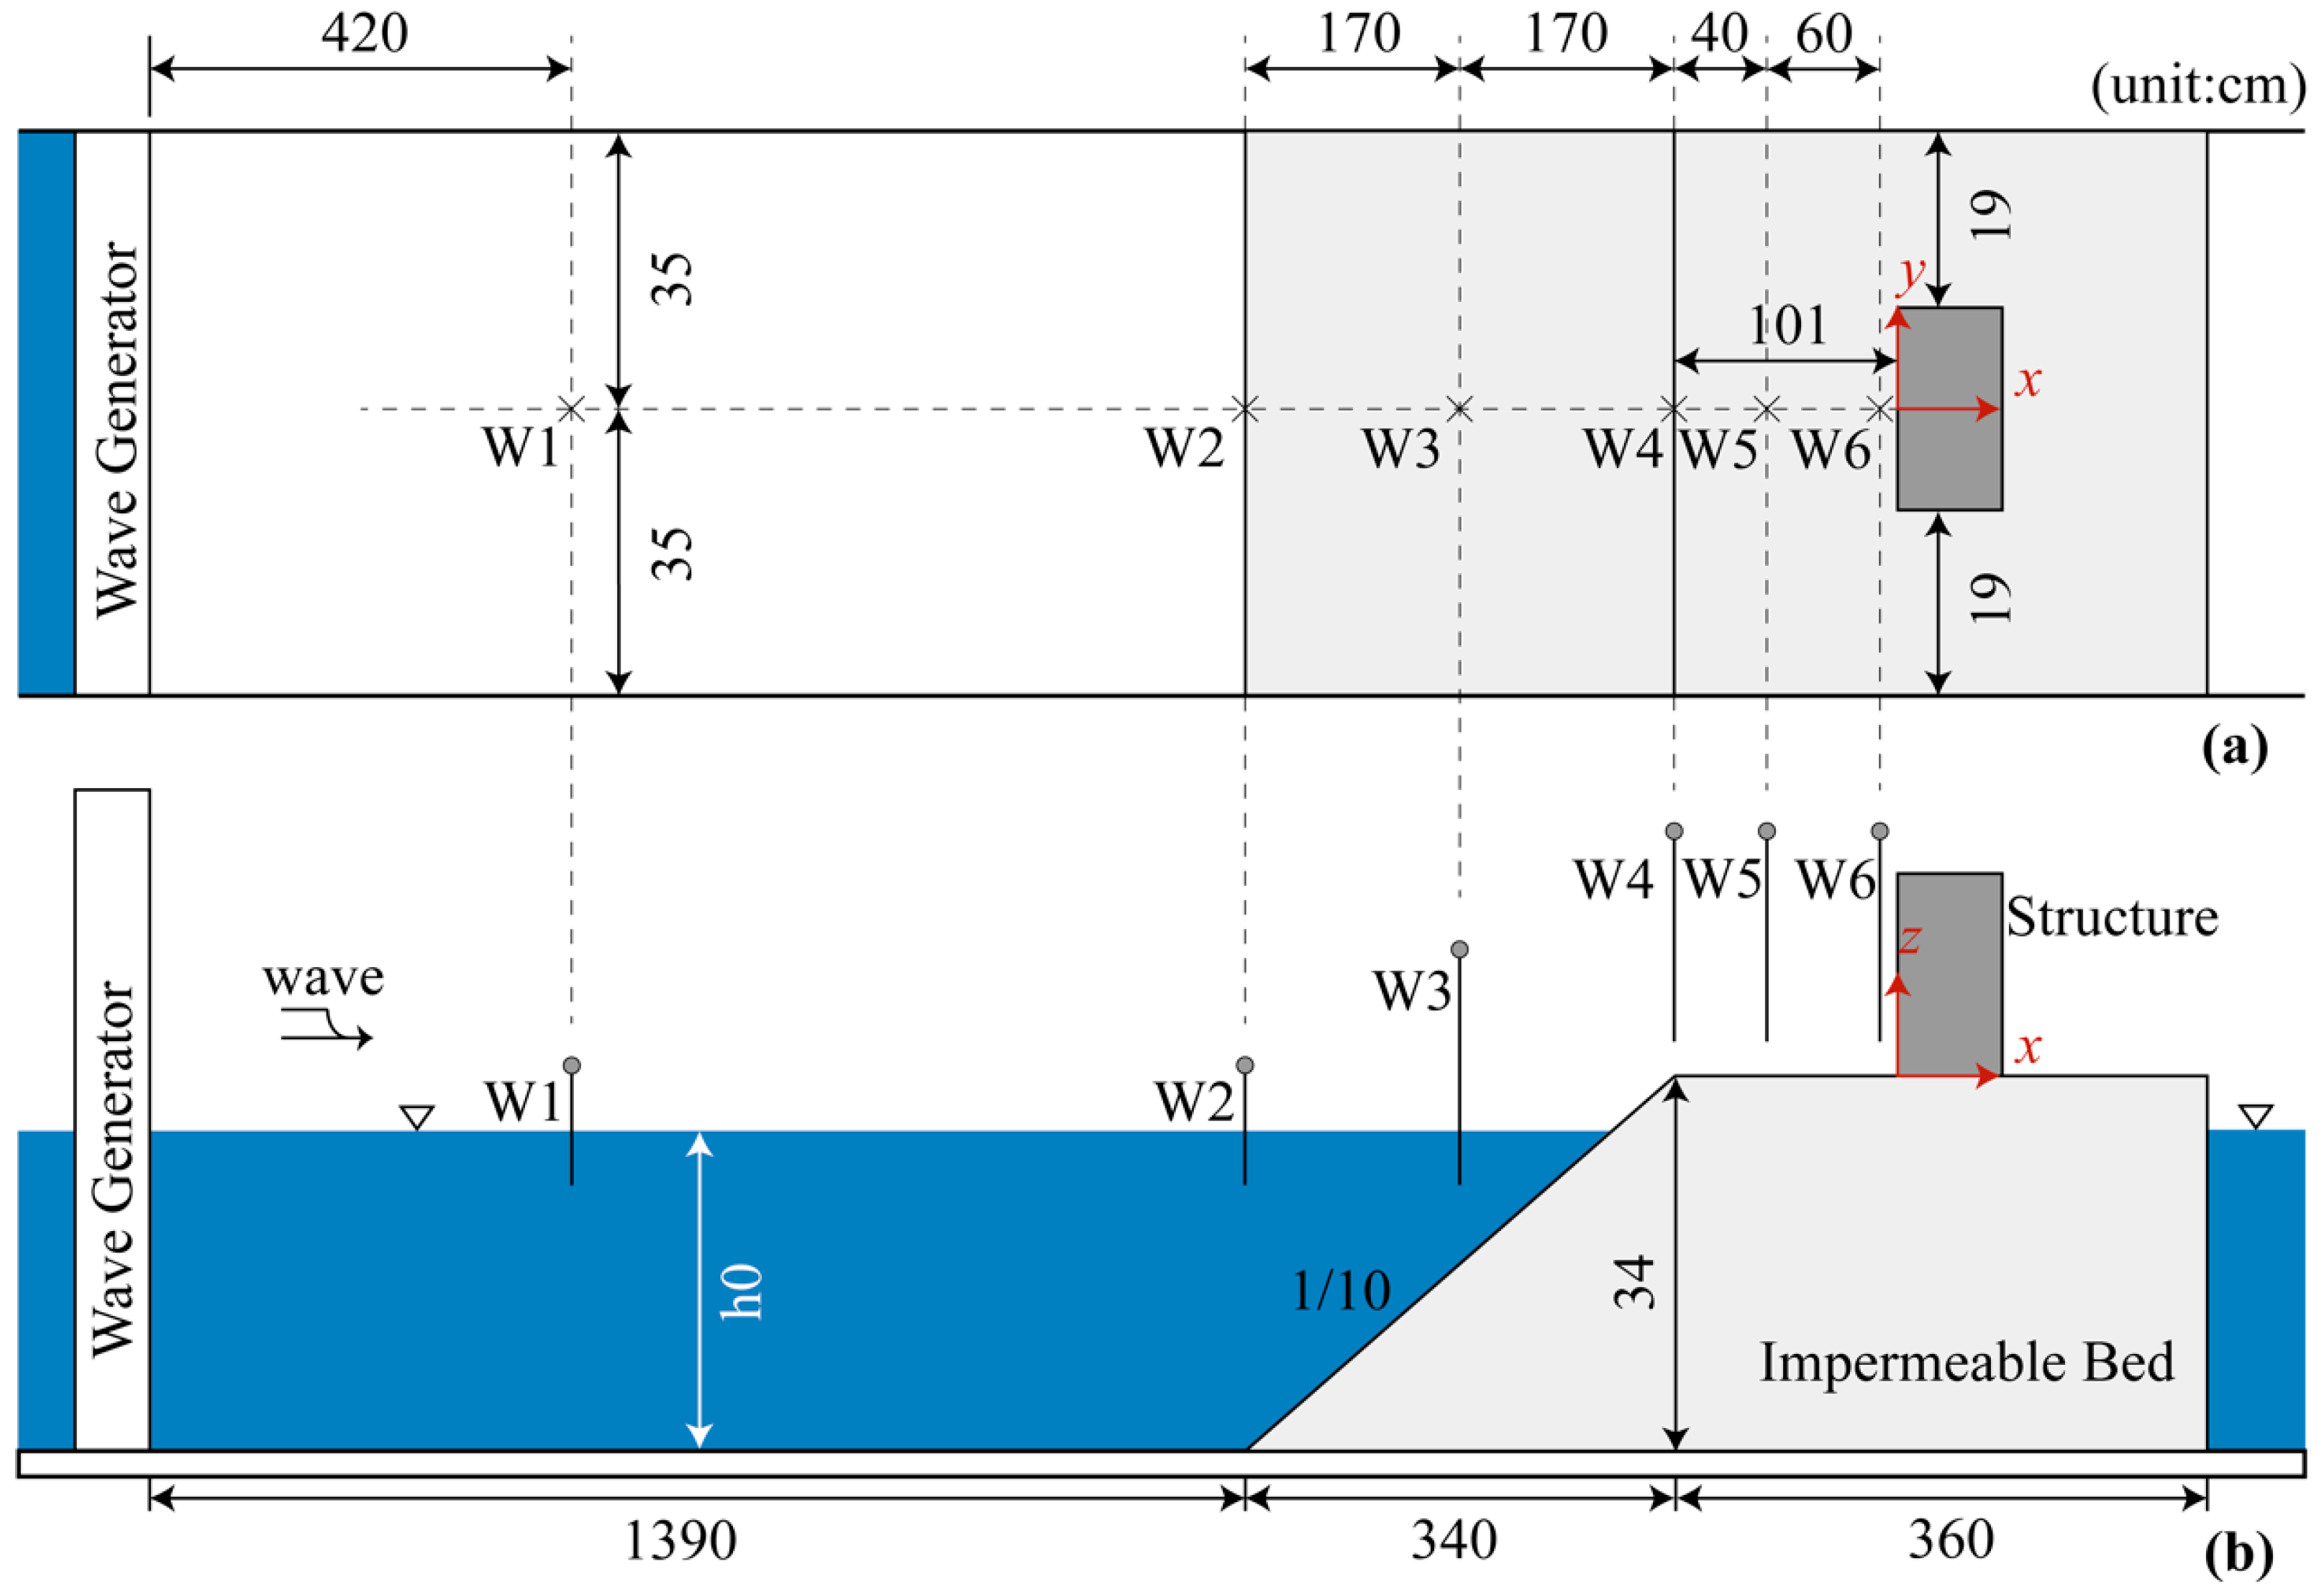
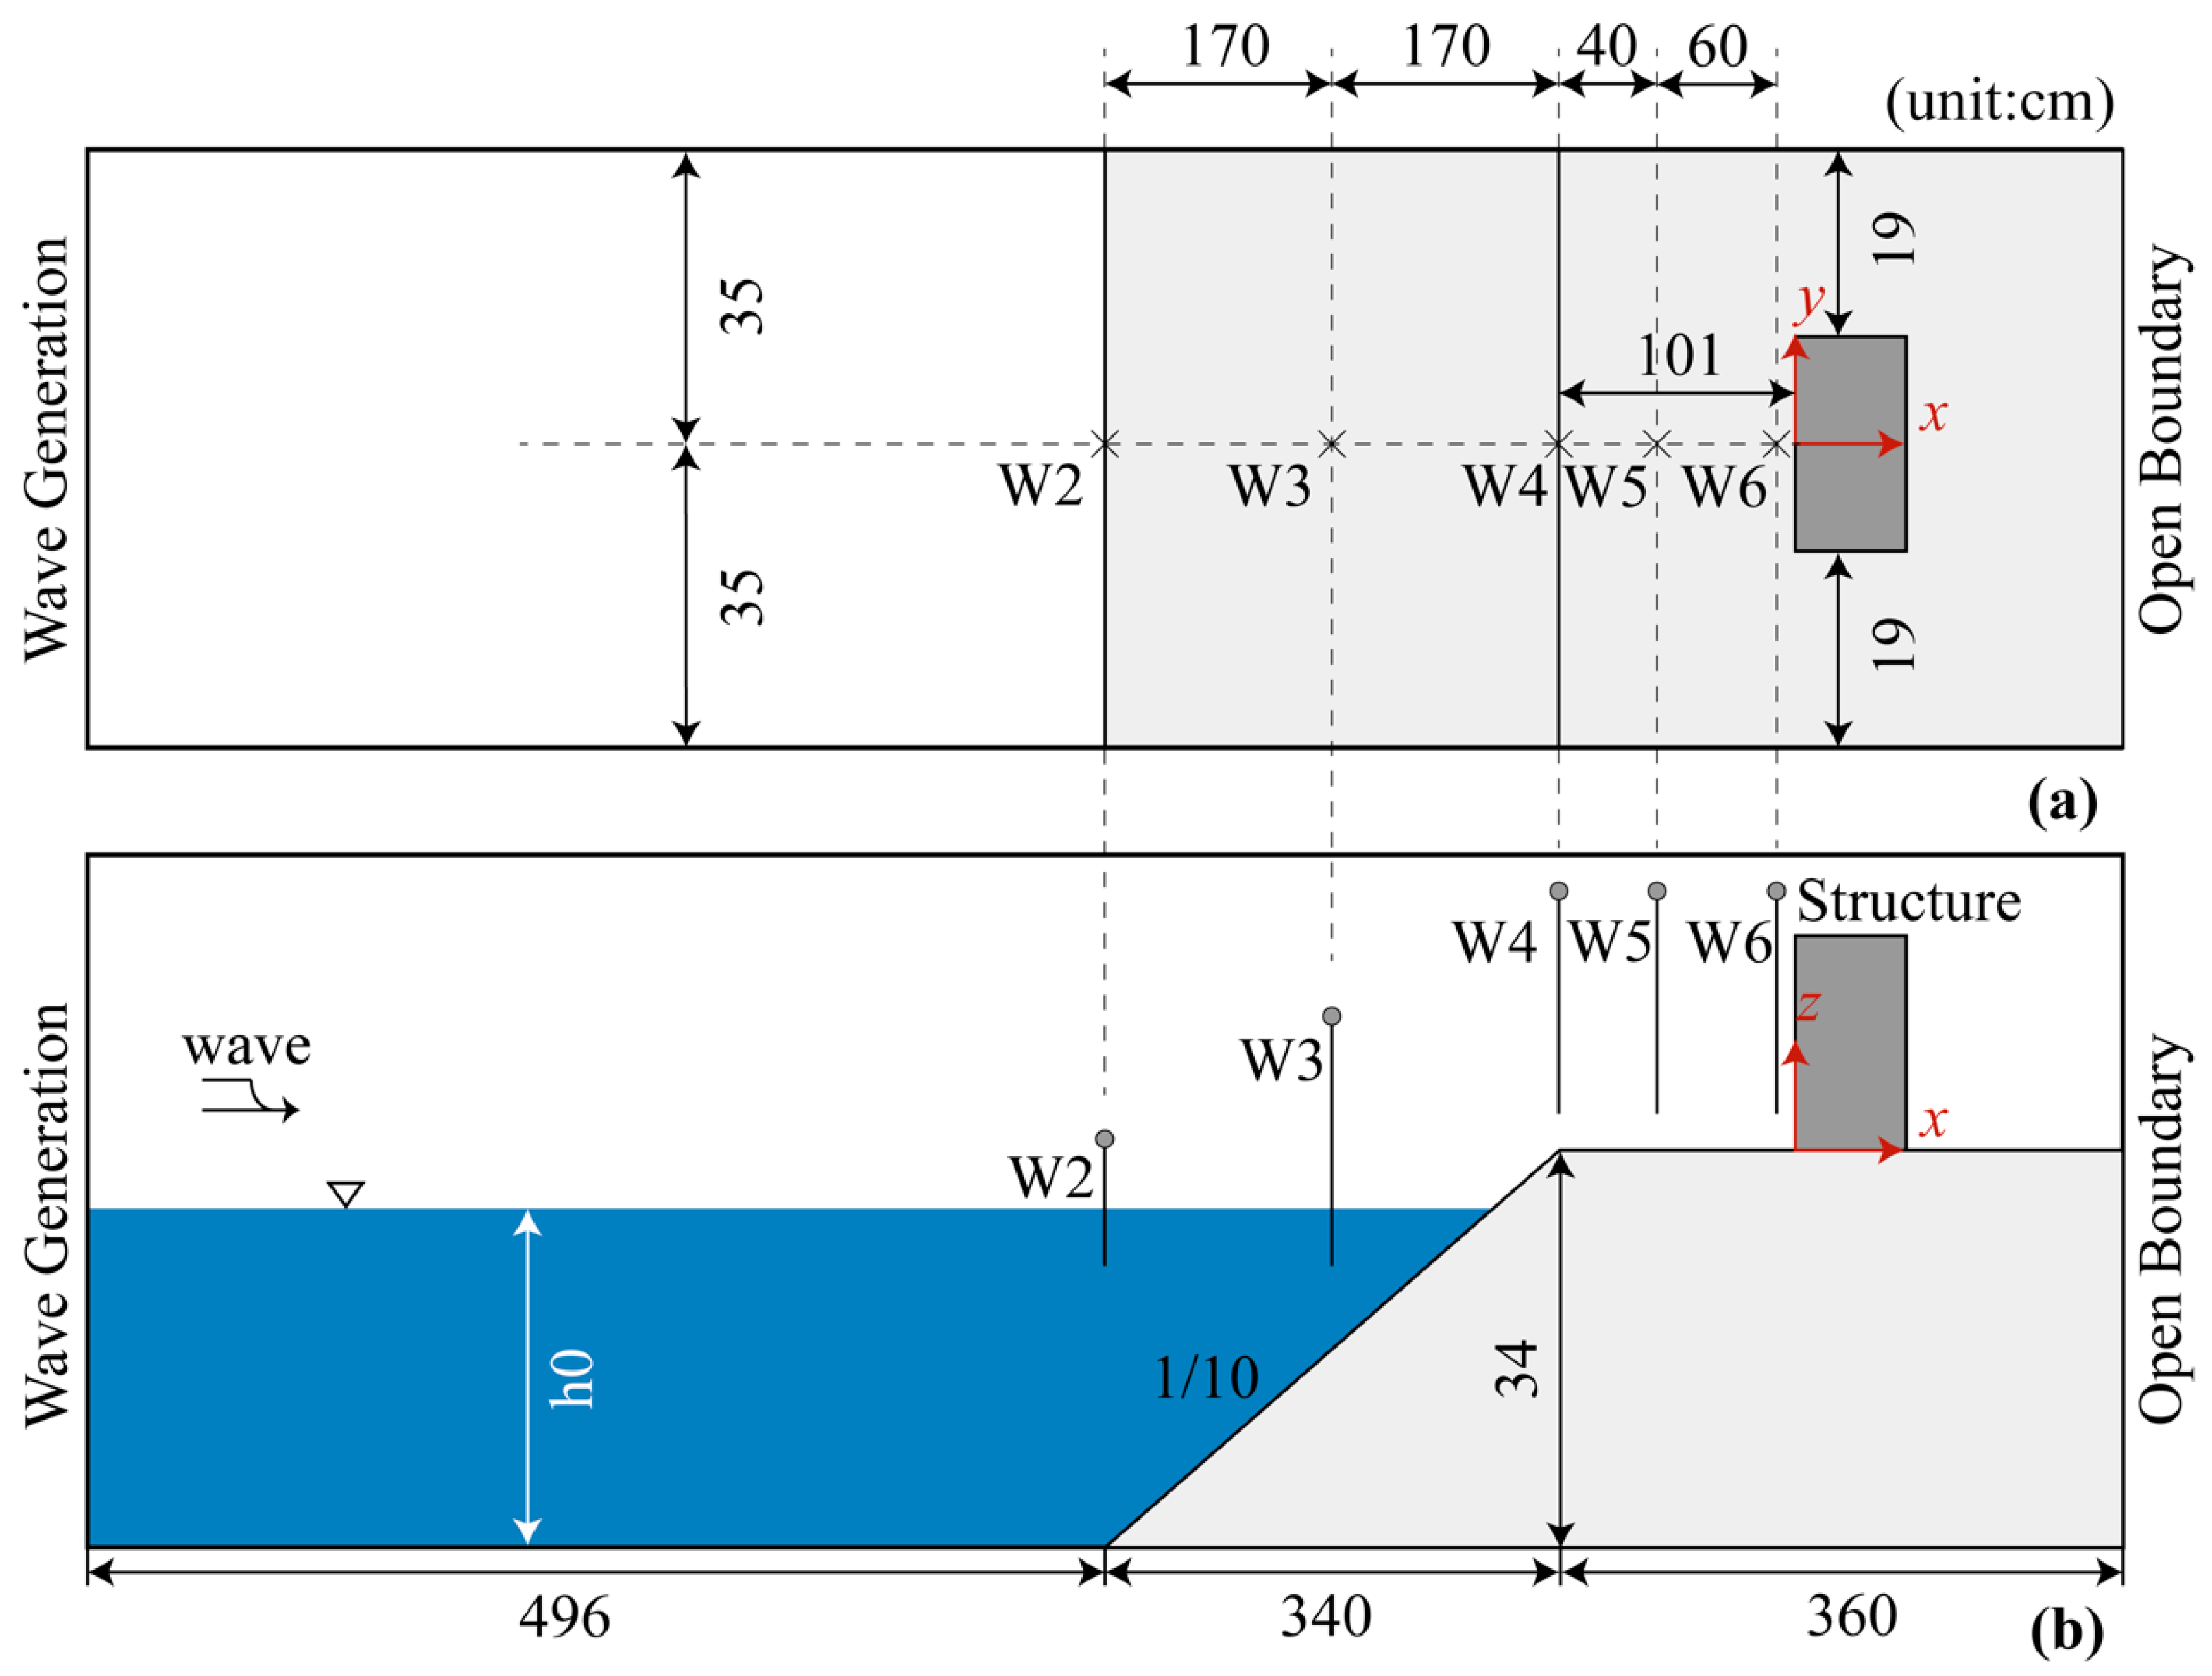
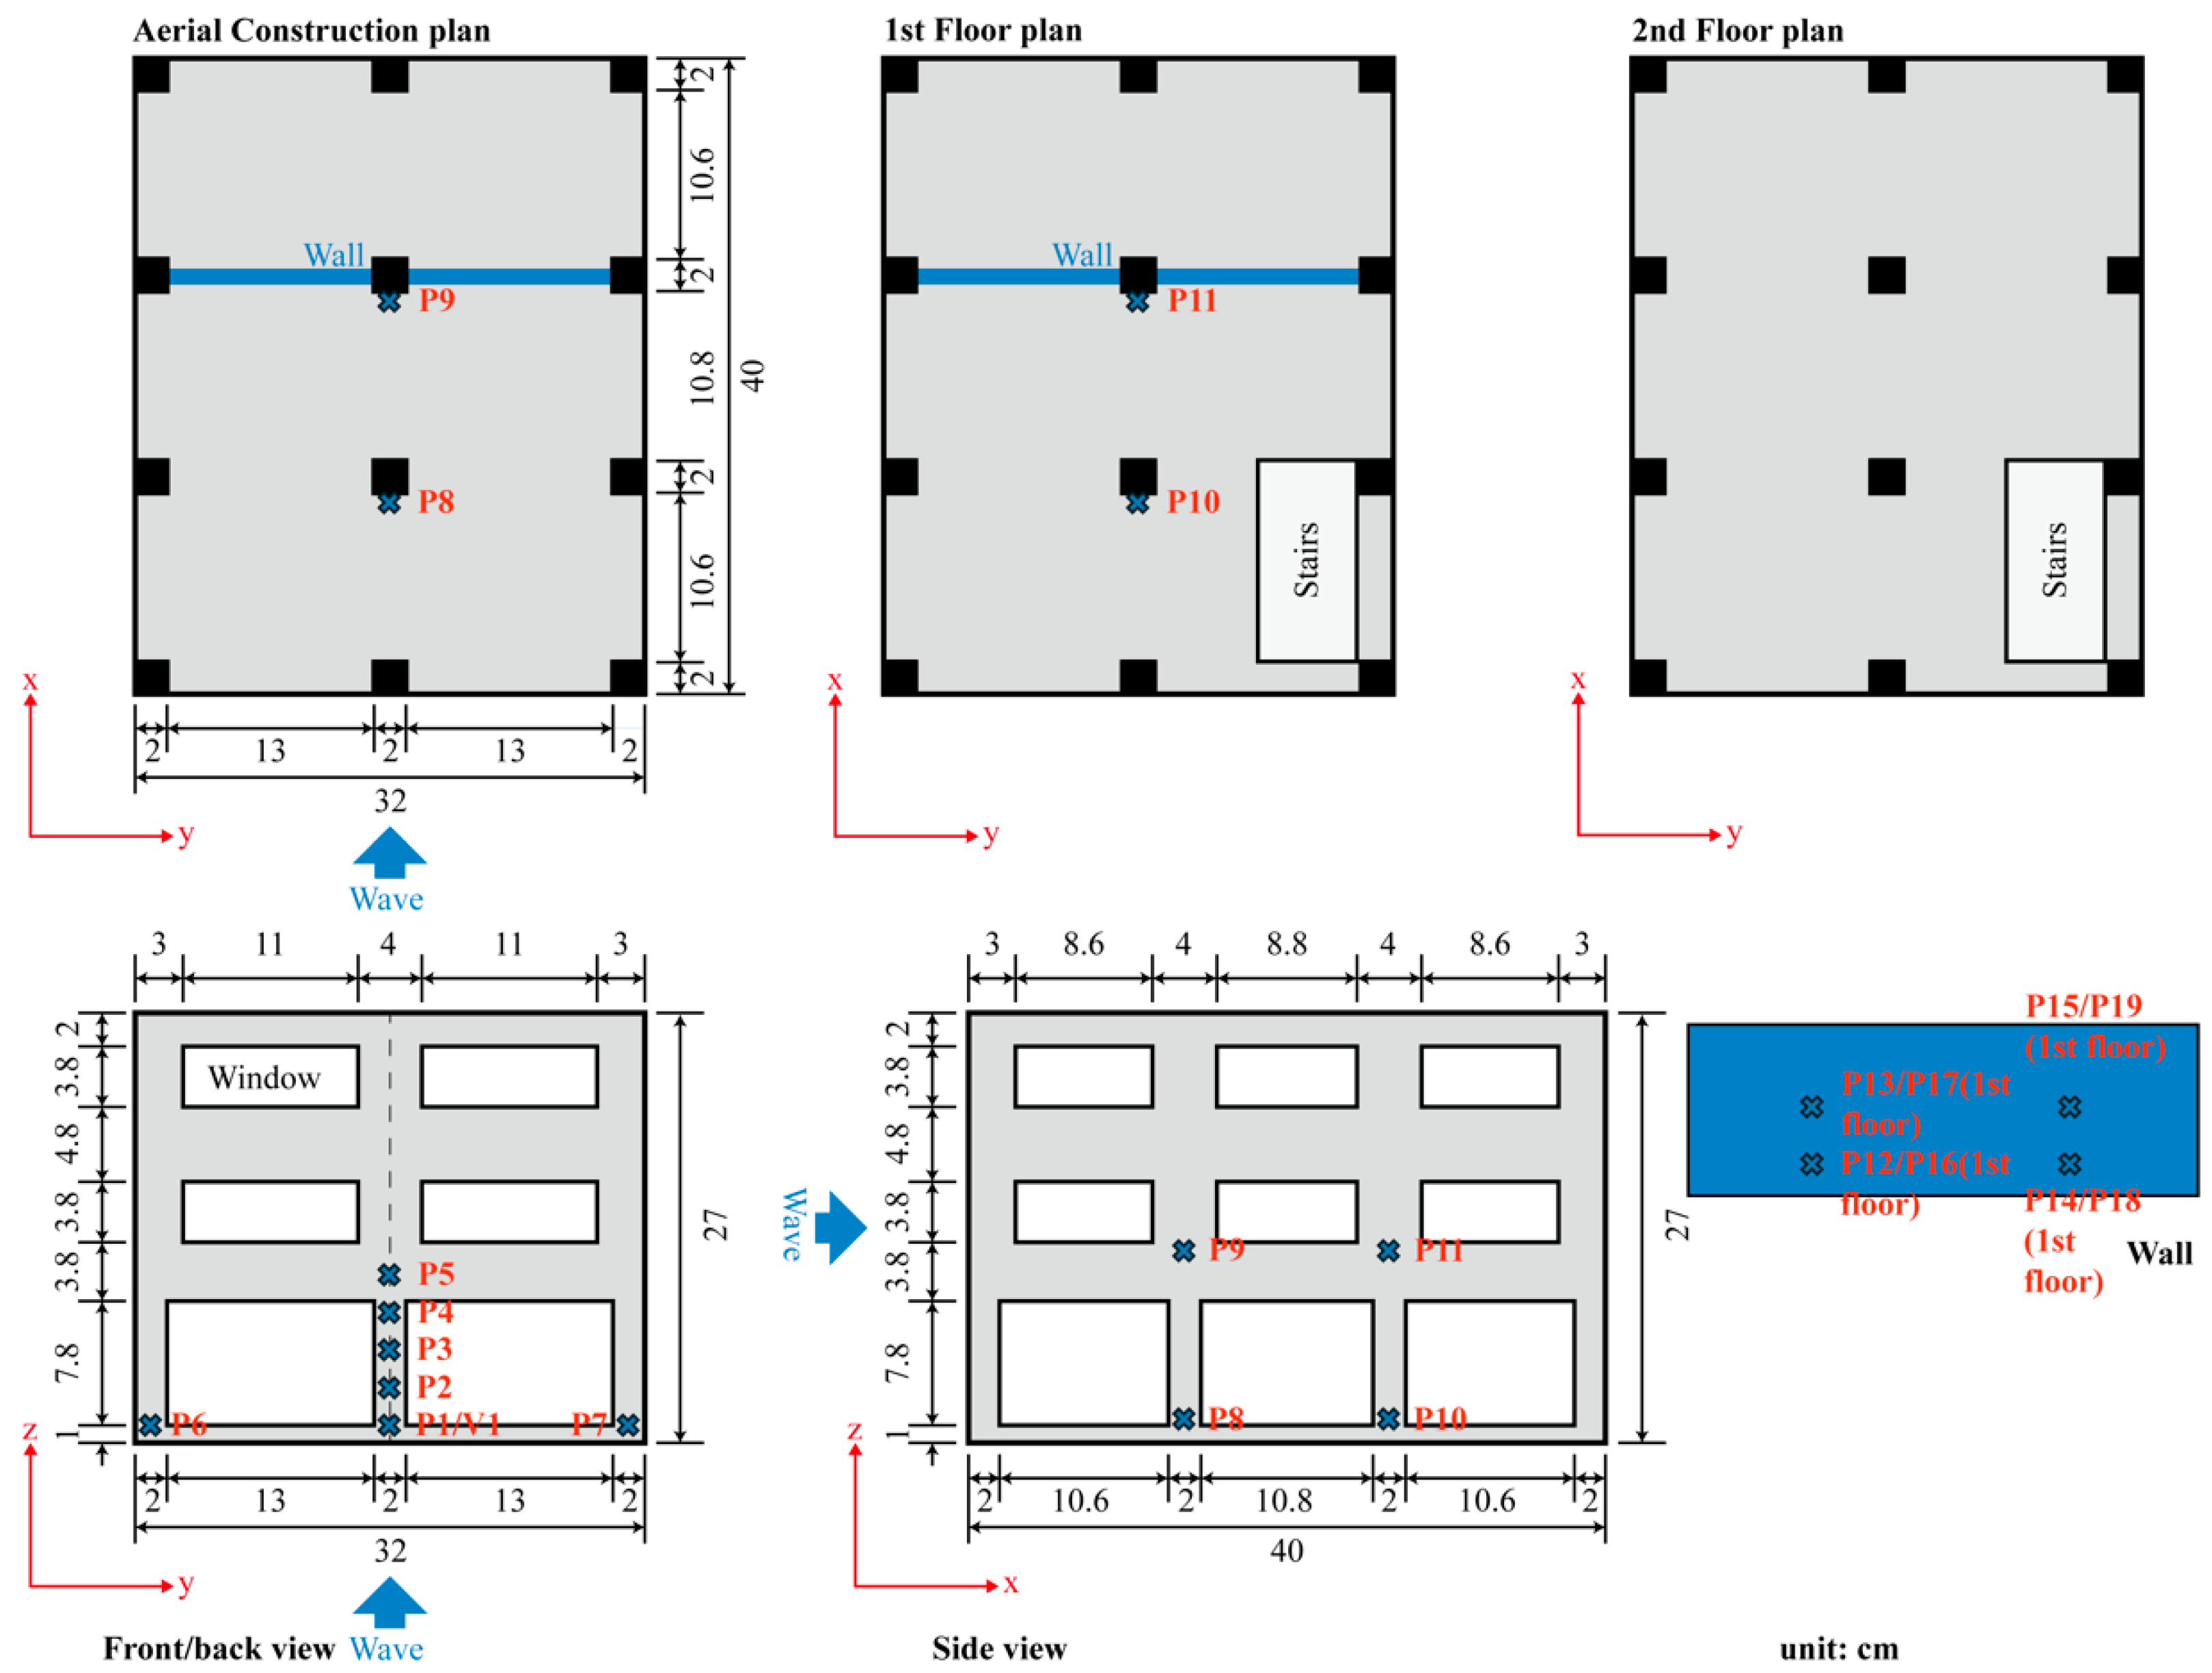
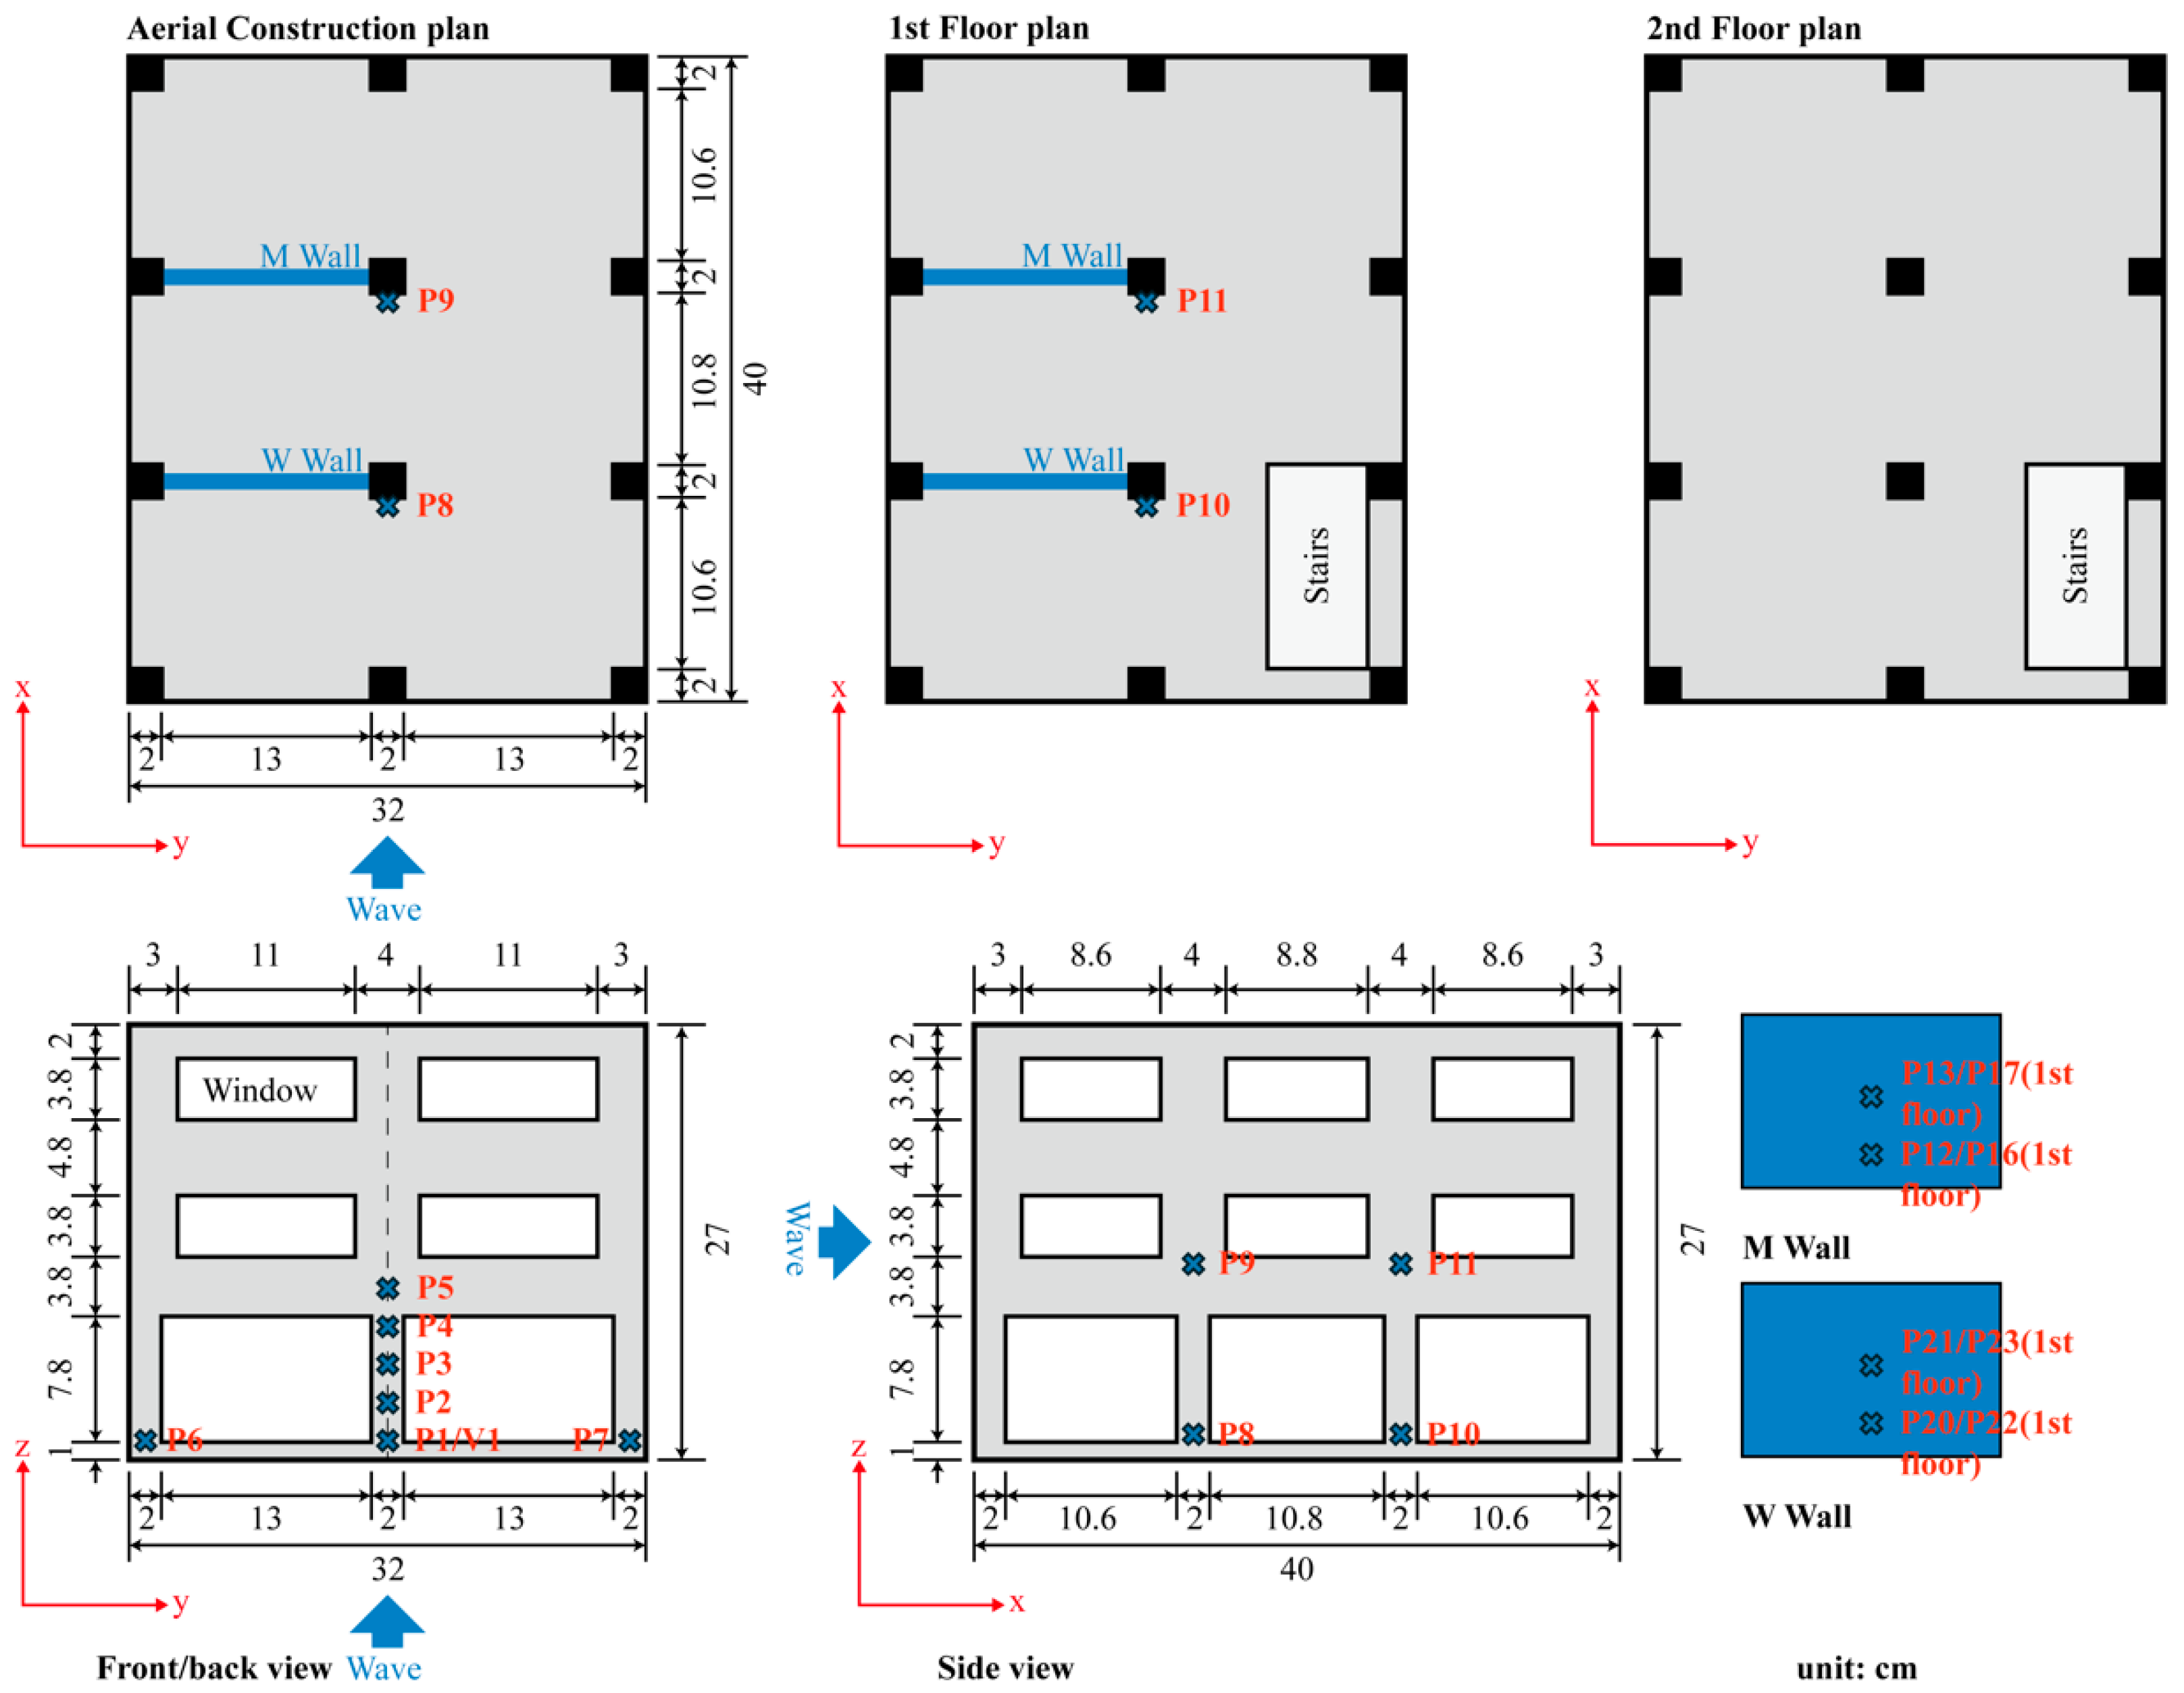
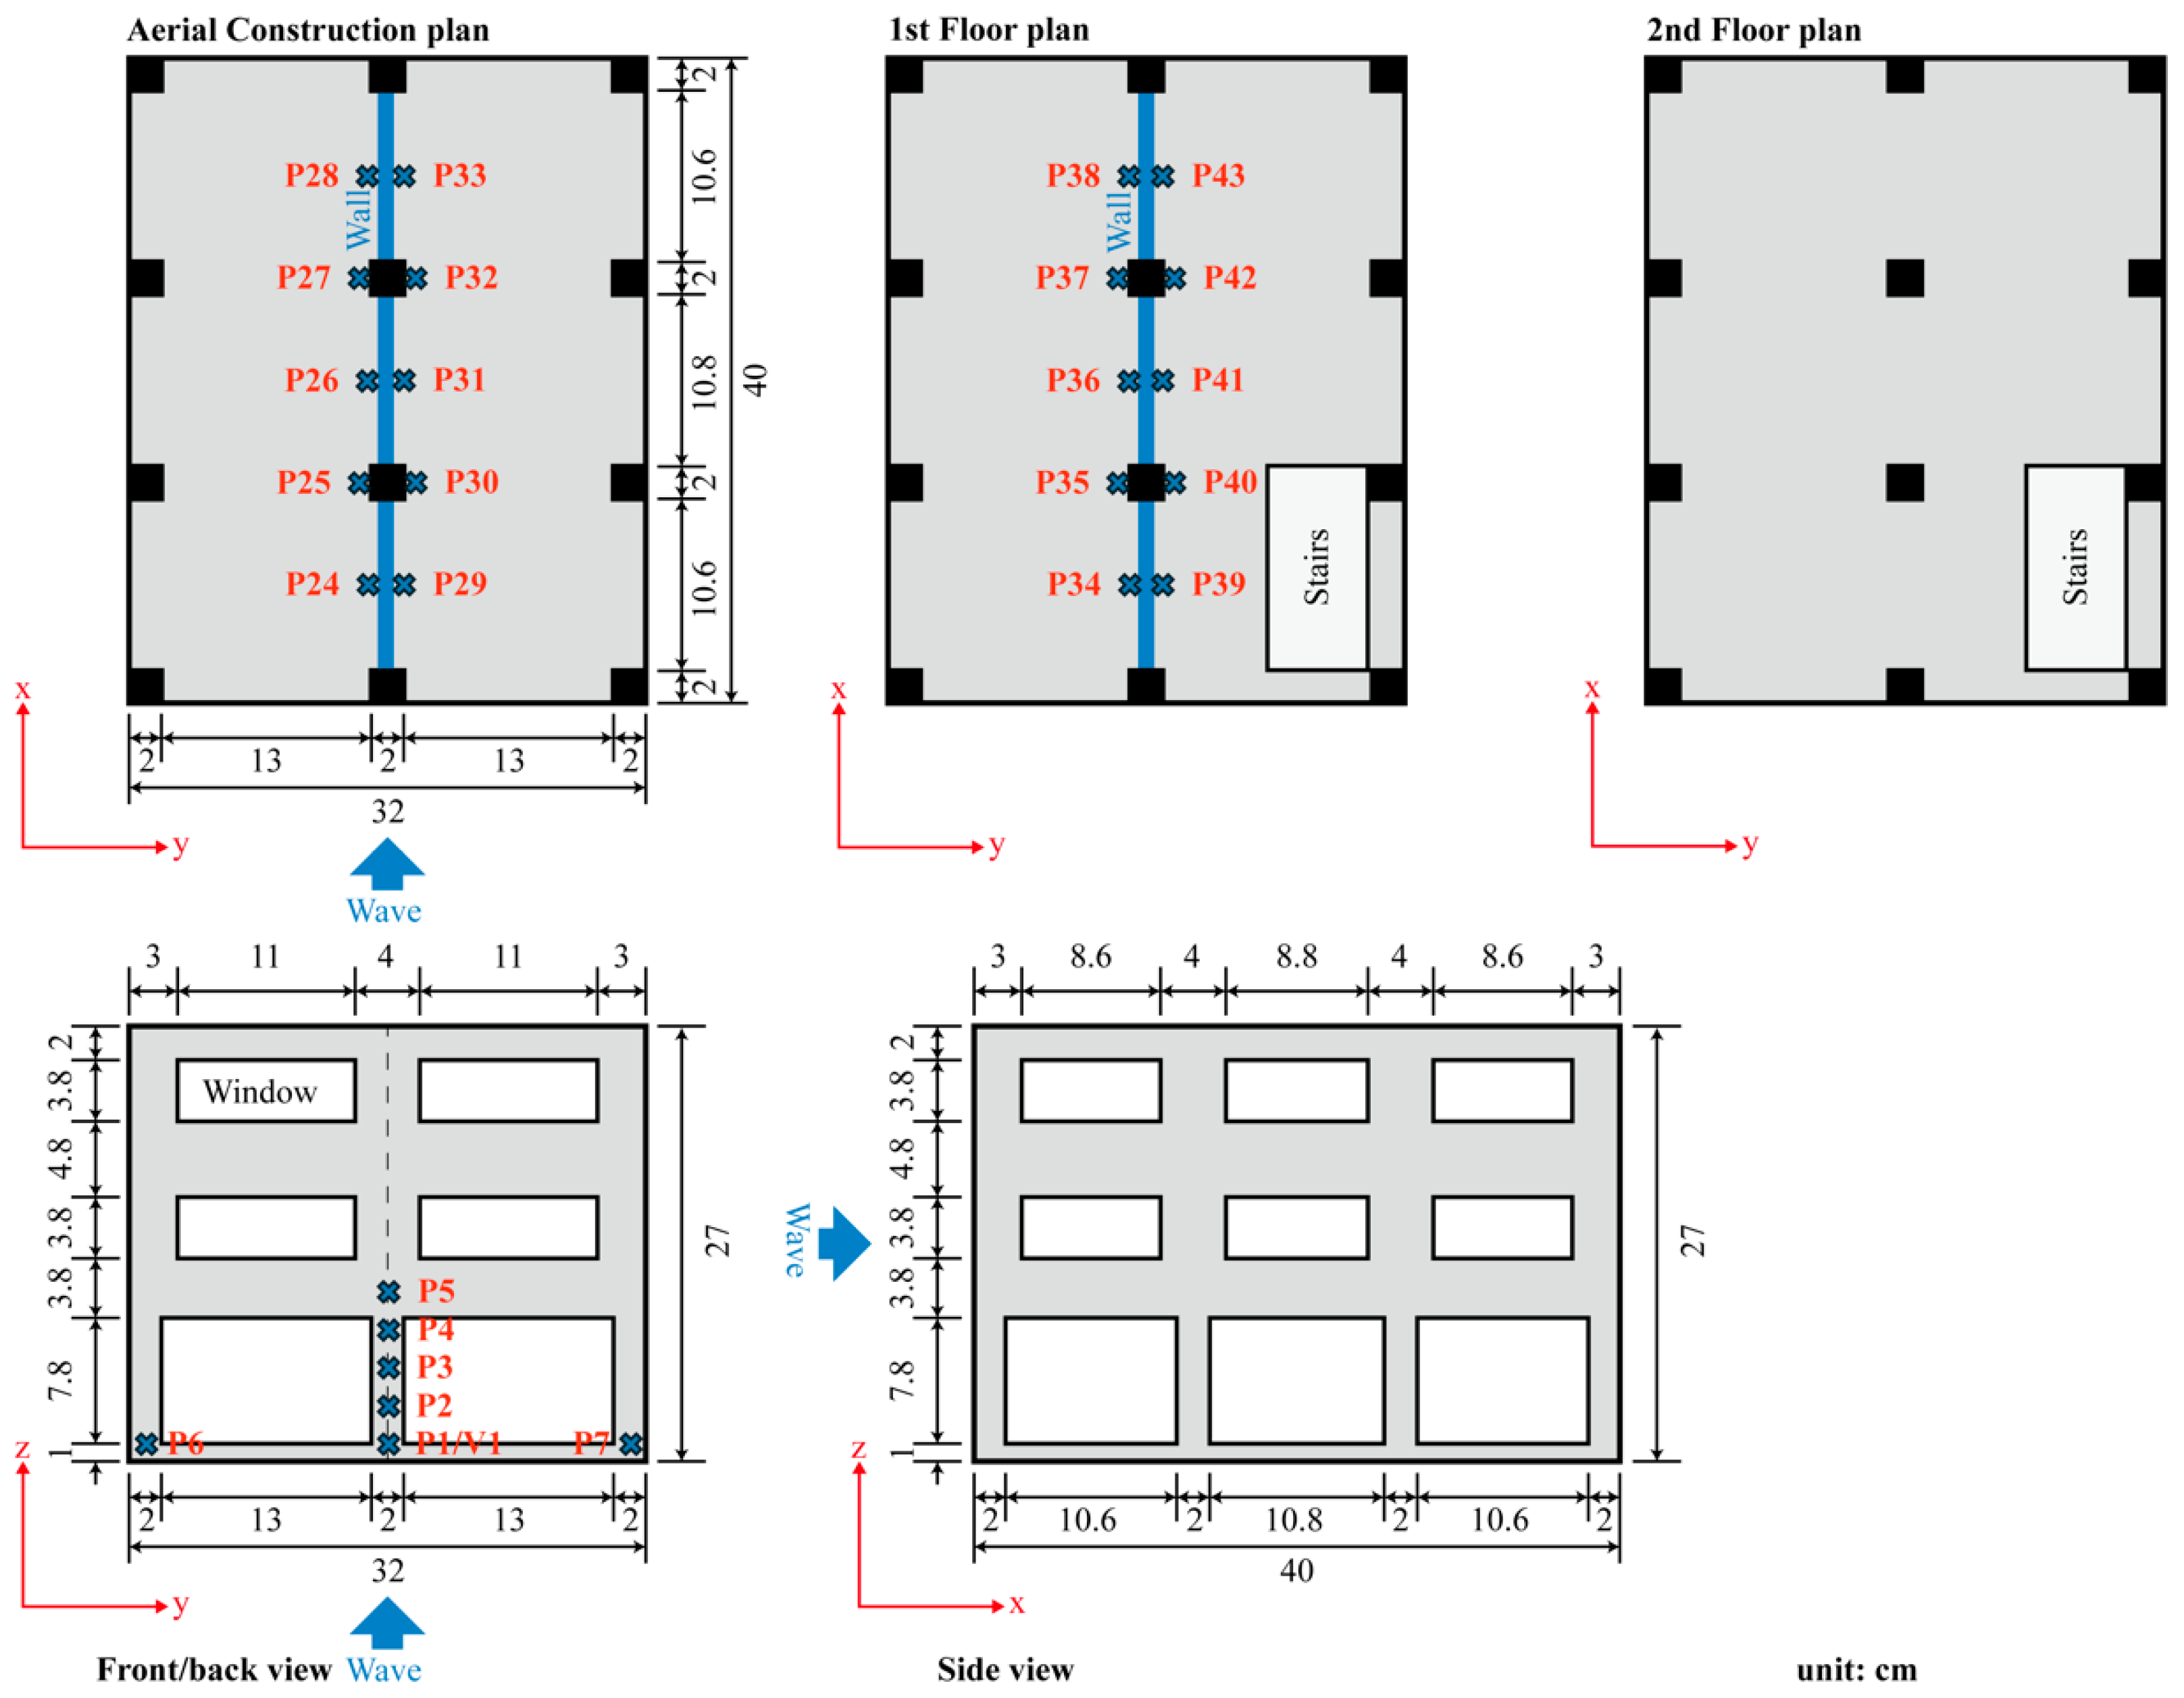
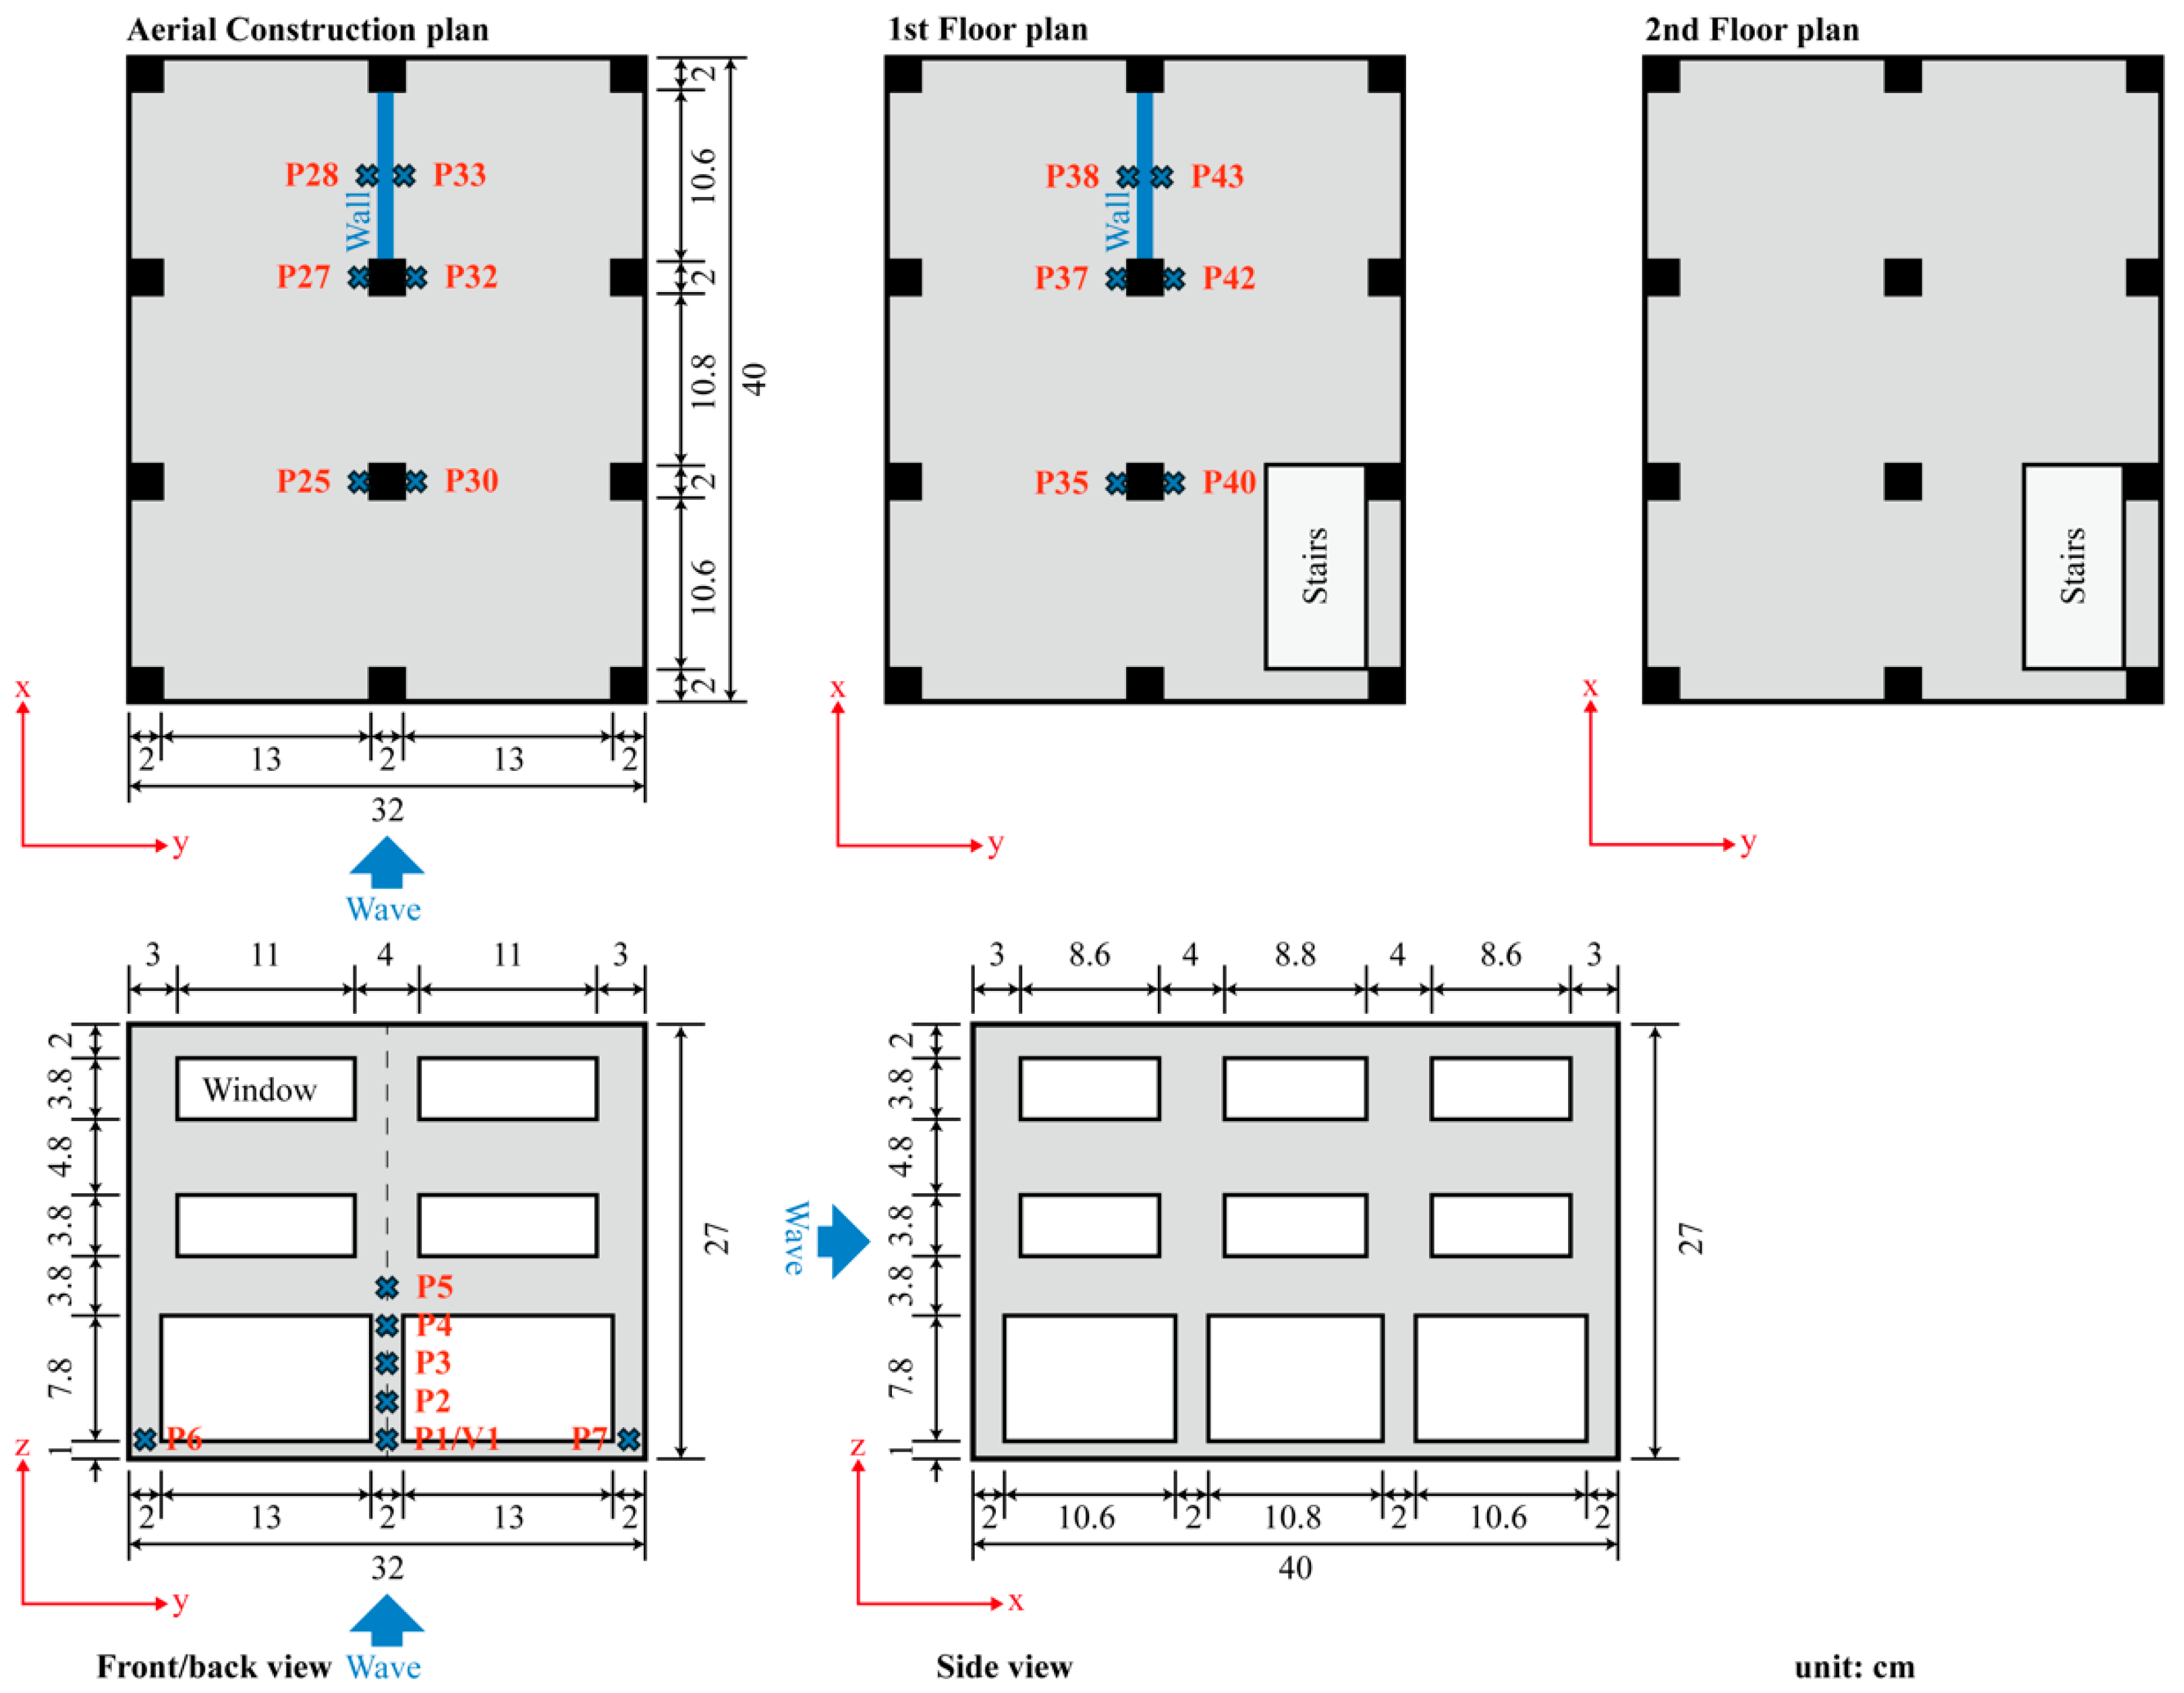
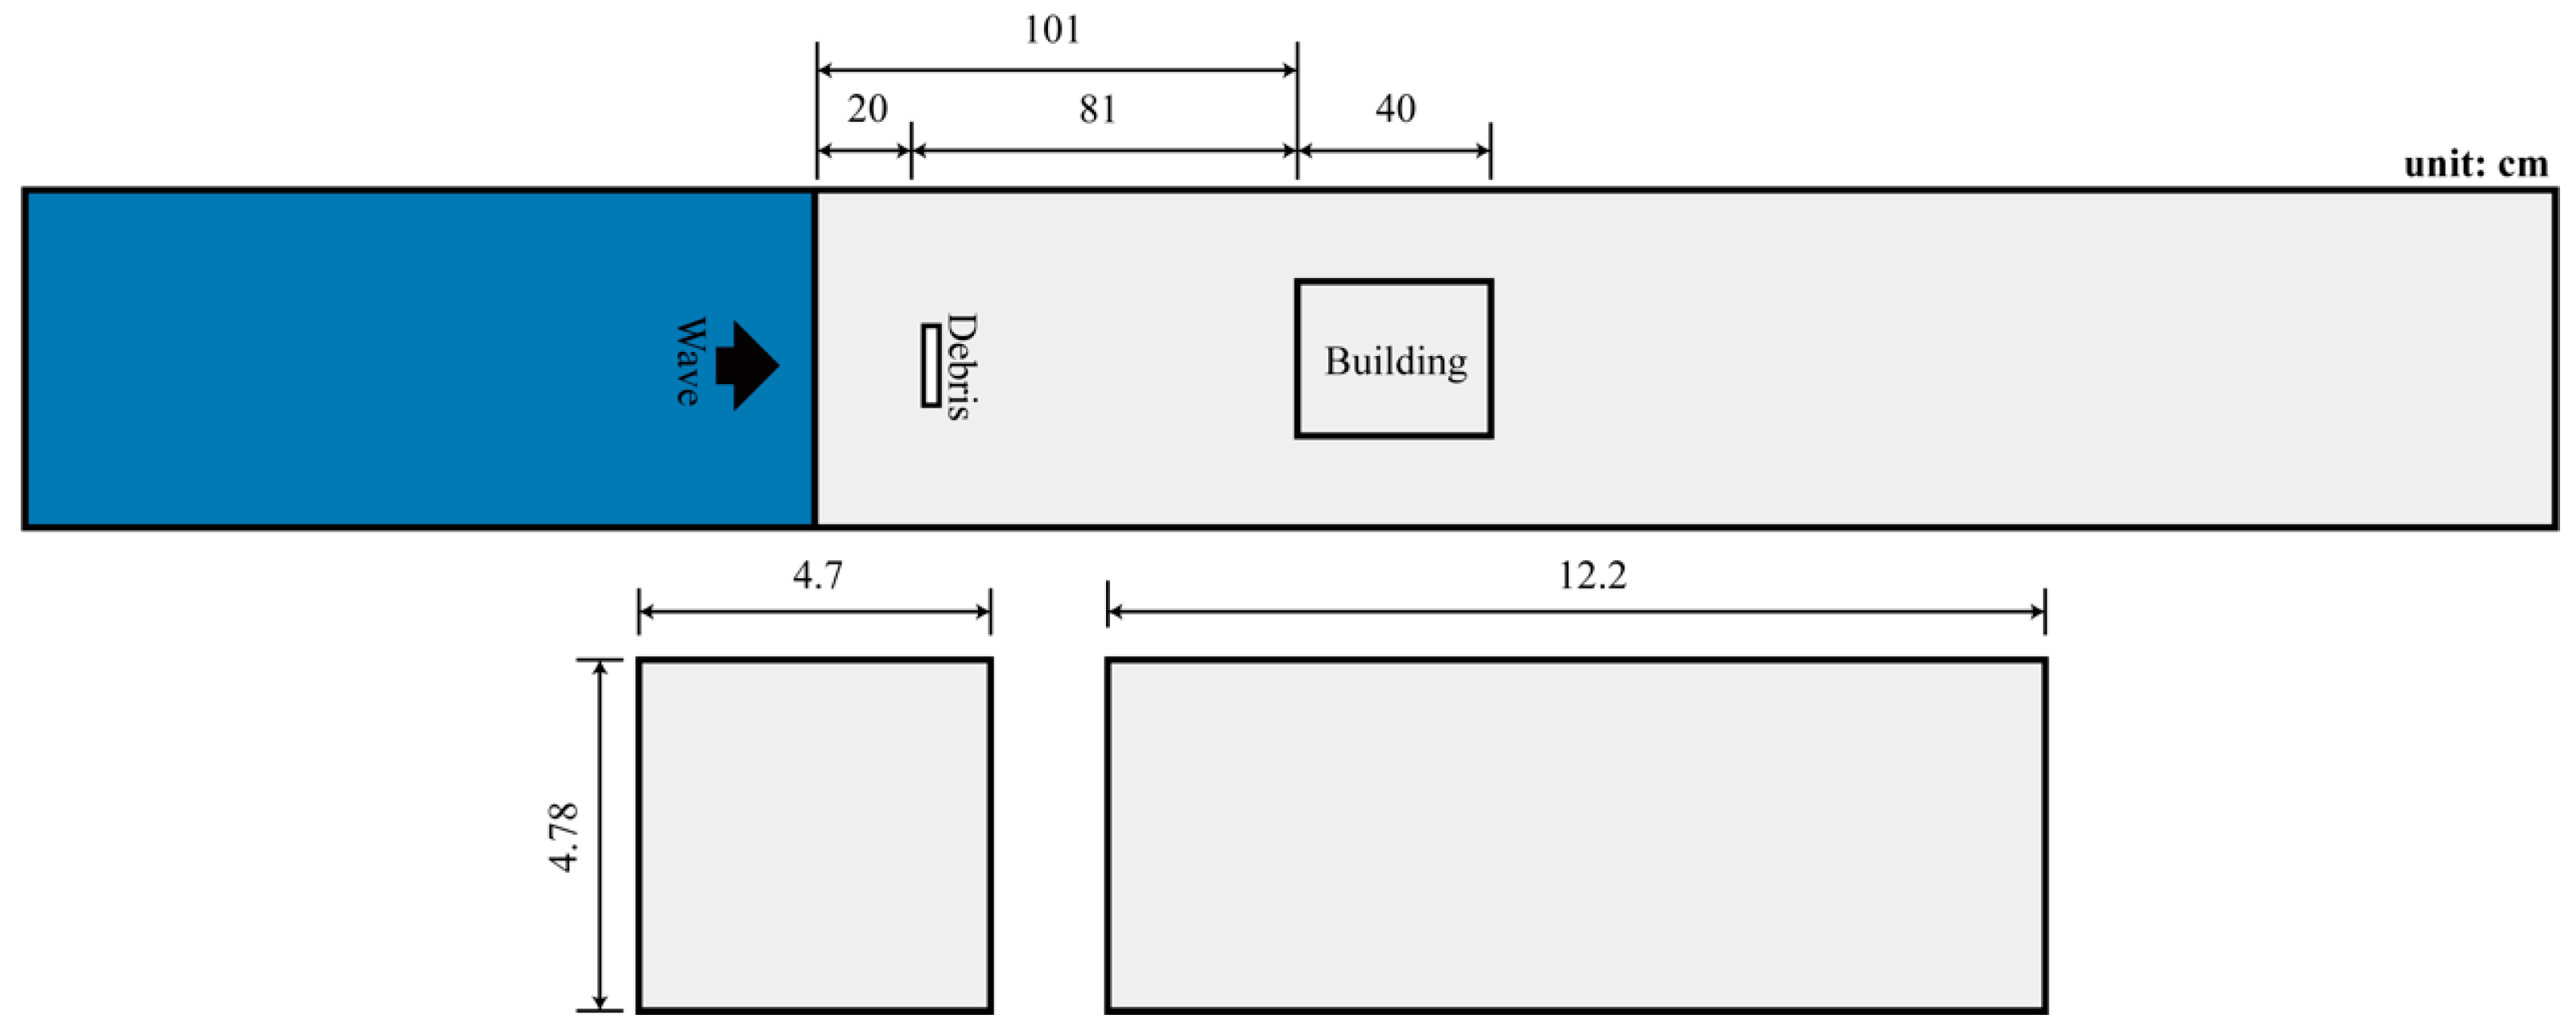
2. Experimental Setup

Figure 1 shows a schematic of the experimental wave flume. The aim of this study was to replicate the hydraulic experiments performed by Lee et al. [21] in a wave flume measuring 30 m long, 0.7 m wide, and 0.9 m deep at the Coastal and Ocean Laboratory in the Engineering Department of Nagoya University, Japan. A piston-type wavemaker with a maximum stroke of 1.50 m, capable of generating a 1/4 segment of a sine-wave-type wave, was installed at one end of the wave flume and used in the experiment. To address the limitations of the wave flume size, experiments were performed at a model scale of 1/50, following the Froude number similitude law. In addition, to simulate the wave-breaking process, a 3.6 m long horizontal flat step with a height of 0.34 m and a sloping bed of 1:10 were positioned at the other end of the wave flume. The building structure was installed at a horizontal distance of 1.01 m from the offshore edge of the horizontal step. The free-water surface elevation of the offshore slope was measured using six capacitance-type wave gauges (W1–W6). Furthermore, factors such as sediment transport and topography interact with flow regimes [22]. However, considering these interactions at the model scale is challenging and tends to be site-specific. To minimize the impact of these complexities, the experimental setup was intentionally simplified.
This study involved five structural models. The numerical test was performed on physical experimental Building A as the fundamental deformation structure. Thus, this section focuses solely on introducing Building A. Figure 2 shows a detailed diagram of Building A, representing a multistory tsunami vertical shelter commonly found in coastal areas. Burke [23] observed that buildings in elevated (tsunami vertical shelter) coastal regions tended to be safer than those at ground level. Similarly, Lee et al. [21] used the guidelines outlined in the Coastal Construction Manual [24] to construct the elevated specimens. Their study simplified a typical tsunami vertical shelter with a planned area of 0.32 m × 0.4 m and a floor height of 0.27 m. This model featured an aerial construction with a superstructure. The front and back walls of the first and second floors each contained two windows measuring 0.11 m × 0.038 m (length in the long-shore direction × height from the floor), while the side walls each included three windows measuring 0.086 m × 0.038 m (length in the cross-shore direction × height from the floor). All structural models were constructed from 5 mm thick acrylic plates to facilitate observation of the flow field within the structure. In addition, the stairs were assumed to correspond to the structure, allowing water to pass vertically by setting the structural space. Further details regarding the incorporation of interior wall structures are provided in Section 3.2.

3. Numerical Model: FS3M

The FS3M [25] employs a main solver and four modules coded in the C++ programming language to simulate the dynamic interactions among fluid flows, object motion, seabed profile evolution, and seabed response under ocean waves. The main solver uses a large-eddy simulation (LES) model based on the continuity and the Navier–Stokes (NS) equations. This enables calculating an incompressible viscous air–water two-phase flow while considering the motion of movable objects. A volume-of-fluid (VOF) module based on the multi-interface advection and reconstruction solver (MARS) [26] was used to simulate hydrodynamic and aerodynamic flows. The immersed boundary (IB) module, which relies on the body–force type IB method [27], facilitates fluid–structure interaction (FSI) analysis of movable objects. Although two additional modules exist, they are not elaborated in this study because they are not relevant.
The governing equations used in FS3M include the following continuity equation, NS equation, and VOF advection equation. The continuity equation is:
m t + m v j ¯ x j = q
where v i ¯ represents the grid-scale (GS) component of the velocity vector, p indicates the GS component of pressure, m denotes the porosity of permeable materials, and x i represents the position vector x , y , z . The NS equation is:
m + C A 1 m v i ¯ t + m v i ¯ v j ¯ x j = m ρ ^ p ¯ x i + m g i + m ρ ^ f i s + R i + f i o b + 1 ρ ^ x j 2 m μ ^ D i j ¯ + x j m τ i j a + Q i m β v i ¯
where g i is the gravitational acceleration vector g i = 0,0 , g . ρ ^ is the fluid density, defined as ρ ^ = F ρ w + 1 F ρ a , with ρ w as water density and ρ a as air density. μ ^ represents the viscosity of the fluid, expressed as = F μ w + 1 F μ a , where μ w is the viscosity of water and μ a is the viscosity of air. C A is the added mass coefficient of permeable materials [28]. f i s is the surface tension force vector modeled by the continuum surface force (CSF) method [29]. R i indicates the linear and nonlinear resistance forces caused by permeable materials, while f i o b is the interaction force vector between fluid and structures. D i j ¯ refers to the GS strain rate tensor = v j ¯ x i + v i ¯ x j / 2 . τ i j is the turbulence stress tensor modeled using the coherent structure model (CSM) [30]. FS3M incorporates wave source terms Q i and damping functions β in damping zones to better simulate wave generation and dissipation [31]. The VOF advection equation is as follows:
m F t + m v j ¯ F x j = F q
where F represents the VOF function 0 F 1 , with F = 0 for air, 0 < F < 1 for the air–water interface, and F = 1 for water.
According to a detailed description of the FS3M by Hou et al. [32], the results demonstrate its ability to achieve a representative experimental state. A comparison with hydraulic experimental data demonstrated the effectiveness of the numerical simulation and an improvement in calculation accuracy.

3.1. Numerical Model Setup

Figure 3 shows that the numerical model successfully replicated the 1:50 scaled physical experimental setup, capturing the full complexity of the building architecture, including the exterior surfaces and internal structural elements, such as doors, windows, stairs, interior walls, ceilings, and floors. To enhance cost-effectiveness without compromising the integrity of the simulation, three-dimensional modeling was constrained to a partial-length flume domain. The numerical domain in the x-direction was truncated from the original 20.8 m in the hydraulic experiments to a condensed 11.96 m, while the width in the y-direction remained the same as in the hydraulic experiments. The numerical simulation employed the inlet boundary condition (left boundary) to generate tsunami-like waves. The outlet boundary condition (right boundary) established open boundary conditions to emulate the fluid behavior of a physical experiment and mitigate any reflection effects.
A variable mesh system was strategically implemented to balance computational cost with the accuracy of the simulation outcomes. Specifically, the model used a coarse mesh with a 4 cm resolution within the wave-generation area, an intermediate 2 cm mesh beyond the immediate vicinity of the building, and a fine 1 cm mesh in proximity to the building to capture detailed pressure and flow variations. This tiered grid approach, combined with a variable timestep with a maximum Courant number of 0.4, maintained numerical stability and precision. The simulation duration was standardized at 10 s for all scenarios to ensure consistency in the comparison of the results, requiring approximately 18 h of wall-clock time per scenario to complete.

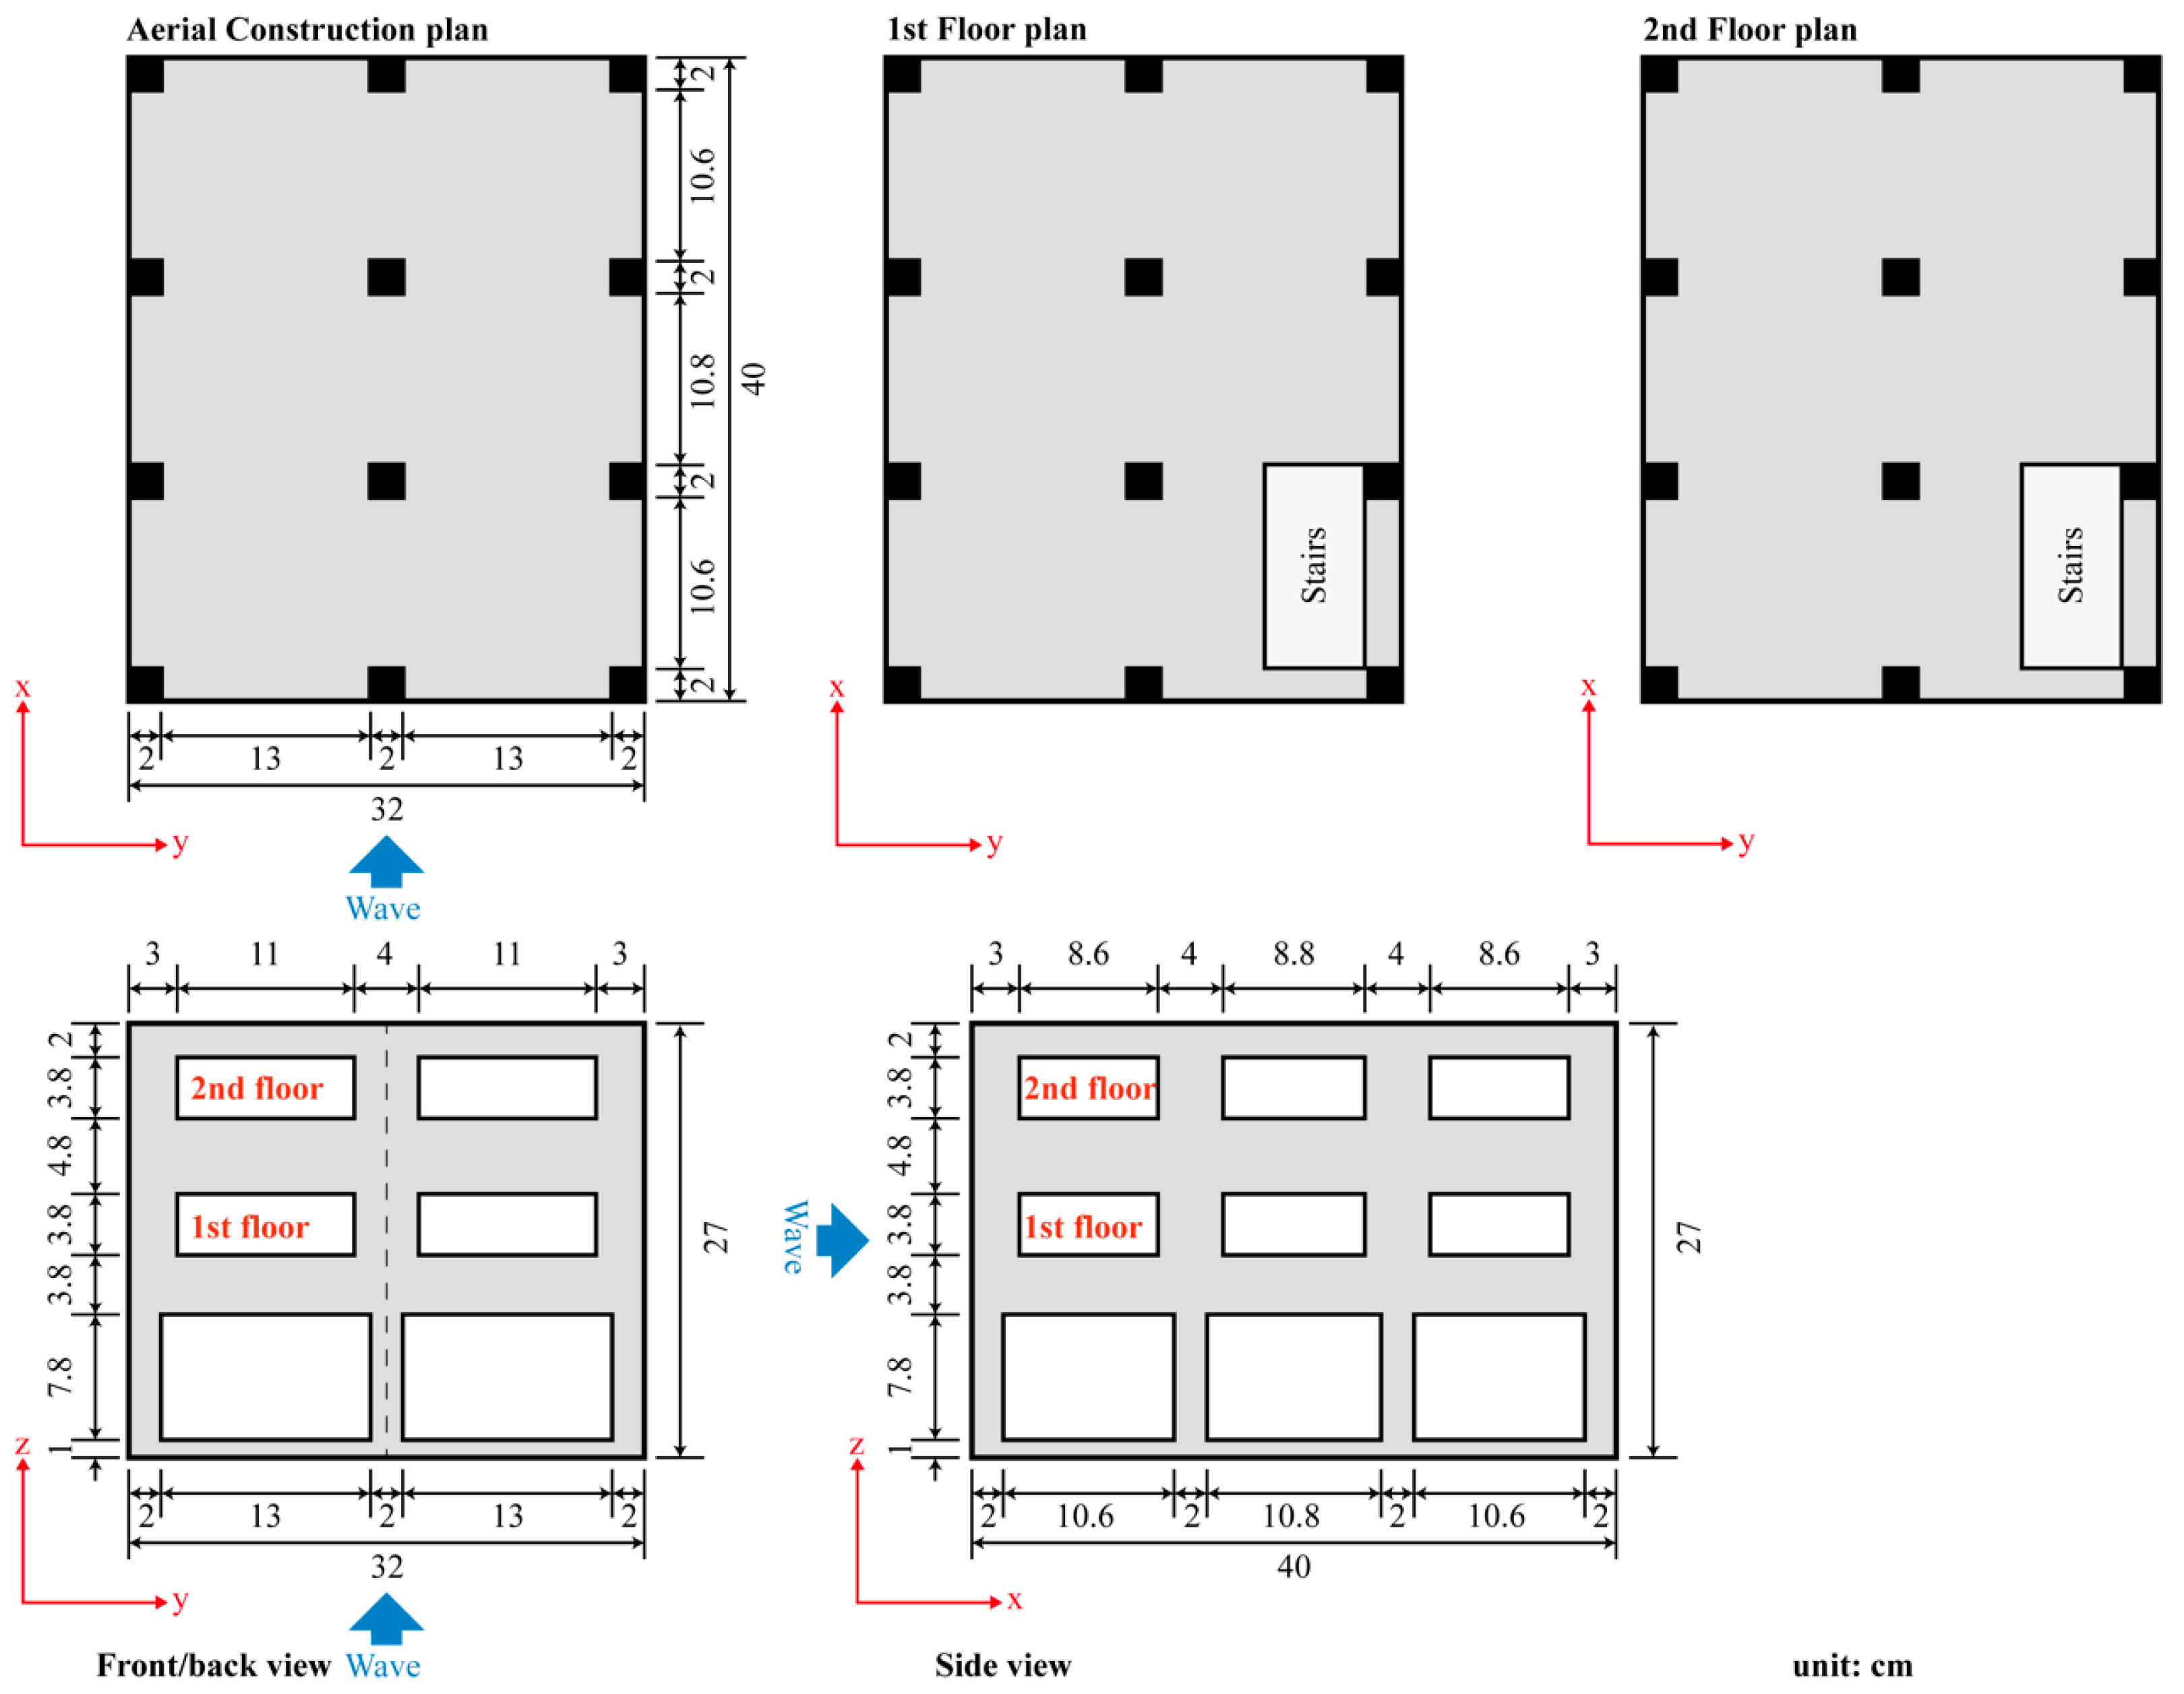
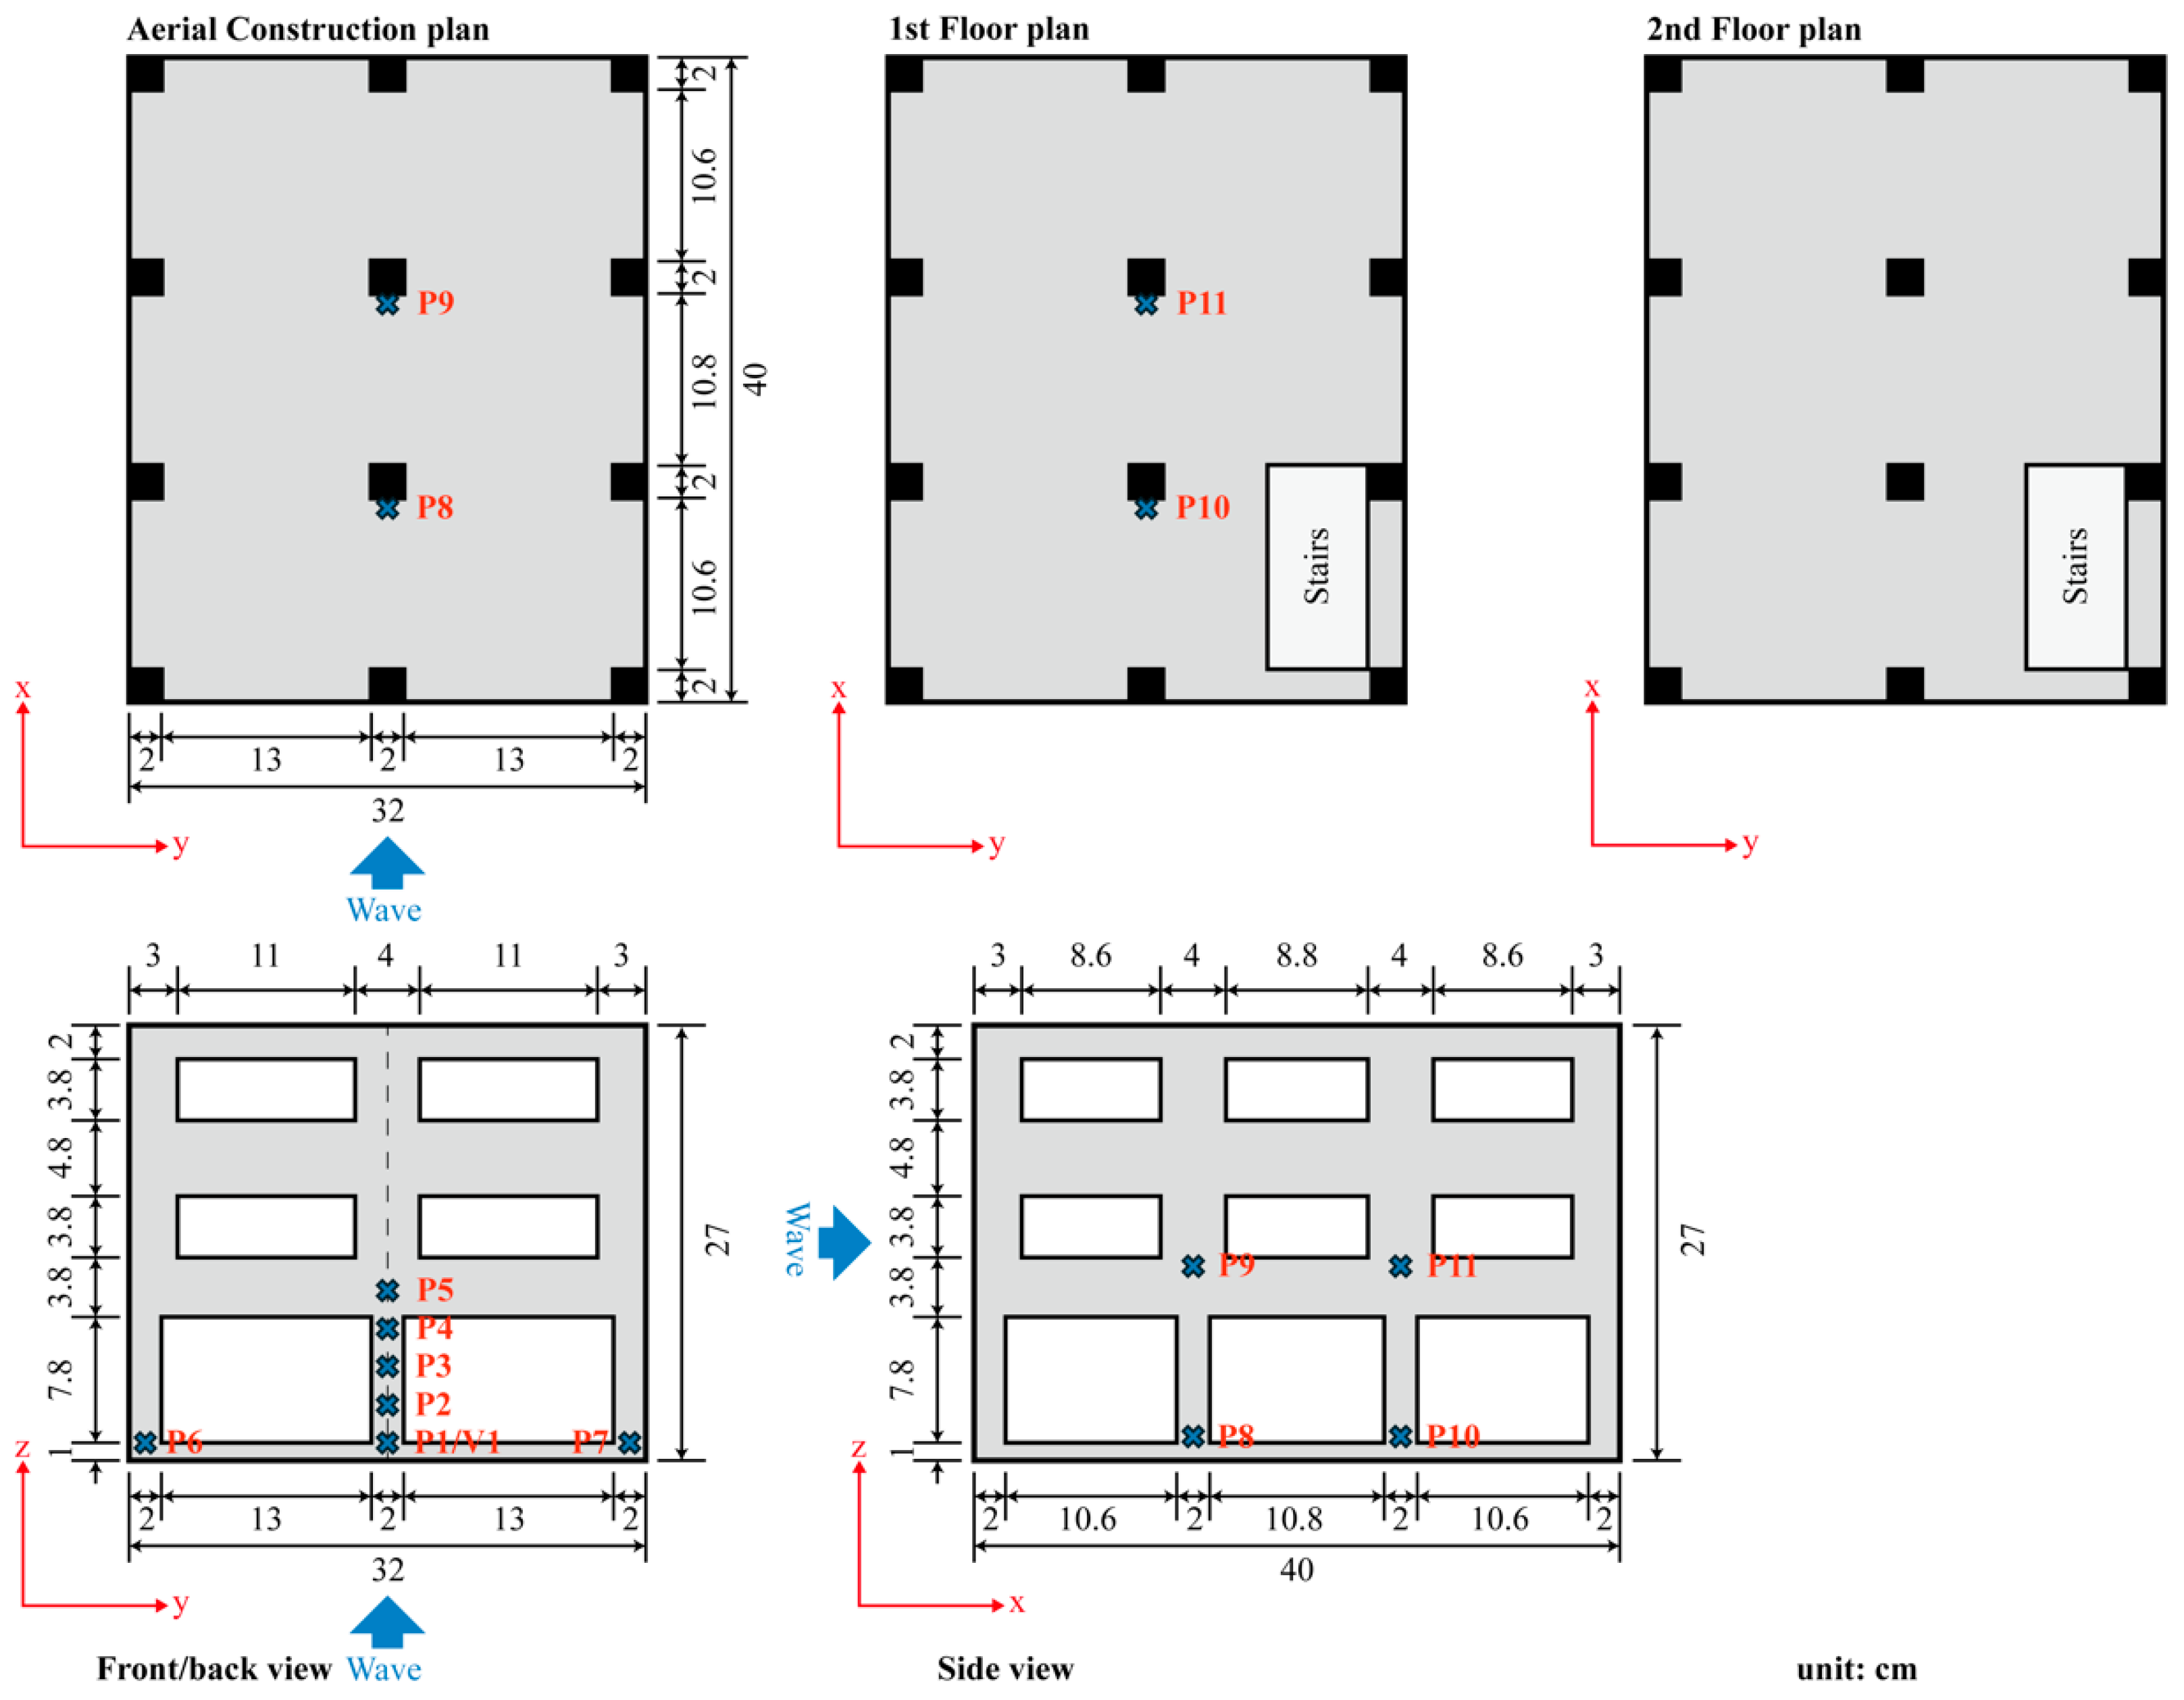
3.2. Building Model and Debris

In this investigation, the building prototype for the numerical simulation was designed to reflect typical coastal shelter structures, specifically the configuration of openings, such as doors and windows, commonly observed in tsunami vertical evacuation shelters [33]. The numerical model, referred to as Building A, was based on the structural parameters established in the physical experiments. The numerical simulation assumed that Building A remained stationary throughout the tsunami run-up process.
Buildings B, C, D, and E, derived from Building A, represent more detailed coastal shelter structures, incorporating variations in wall orientation and open space configuration. We systematically examined the impact of varying interior wall orientations on the load distribution by simulating four distinct interior wall positions, with schematics provided in Figure 4, Figure 5, Figure 6, Figure 7 and Figure 8. These orientations, arrayed perpendicular and parallel to the wave propagation axis, were modeled to understand their influence on the structural loading patterns. For instance, Building B had an interior wall position perpendicular to the incident wave direction, spanning a length of 0.32 m across the entire building. Notably, the absence of interior walls on the second floor of the superstructure was based on the assessment that the force exerted by the incident tsunami wave on the second-floor internal walls is minimal, effectively preventing misinterpretation of the results.
To evaluate the structural loads, an array of pressure gauges was positioned across various locations on the building to record the impact pressure time history at each point of interest. Seven sensors (P1–P7) were specifically aligned on the front side of the building to record the pressures along the x-axis, facing the oncoming wave, as shown in Figure 4, Figure 5, Figure 6, Figure 7 and Figure 8. Notably, the front side corresponds to the building facade facing the direction of the incident wave. This strategic sensor placement aimed to capture the dynamic pressure profile at the wave–structure interface. The numerical model did not include sensor placement on the back side of the building under the assumption that the backflow-induced pressure was insignificant for this study. Although such pressures are considered insignificant for direct force calculations, their potential influence on overturning moments in irregular geometries warrants further exploration. Within the interior, additional sensors were arranged to observe pressure fluctuations, crucial for understanding the load dynamics as debris moved through the building during the simulation. In addition, V1 was positioned 2 cm offshore from the front wall surface (P1) to accurately measure the flow velocity near the building model.
Figure 9 presents a scaled model of a 6.1 m (20 foot) intermodal shipping container, conforming to a geometric scaling ratio of approximately 1:50. This scaling is consistent with Froude’s law of similarity to ensure dynamic similitude. A real-world standard shipping container is 6.1 m long, 2.35 m wide, and 2.39 m high. The corresponding dimensions for the scaled-down numerical model are 12.2 cm long, 4.7 cm wide, and 4.78 cm high. The model has a specified density of 920 kg/m3 [34], resulting in a scaled mass of 0.25 kg. This equates to a prototype mass of 31.250 kg, reflective of the weight of an actual full container (a container filled with maximum weight of cargo).
In the numerical simulations, this debris model was placed 0.2 m onshore from the offshore edge of the horizontal step to study its dynamics under tsunami-like conditions. The complexities introduced by debris within the numerical domain necessitated a nonuniform grid capable of accurately capturing the interaction between the tsunami and debris while considering computational efficiency. The grid size was meticulously selected to maintain a sufficient resolution to capture the essential experimental phenomena without incurring prohibitive computational costs. Subsequent verification steps confirmed that the incident waveforms observed in the simulations closely matched those from the physical experiments. This confirmed that the selected grid size met the requisite resolution criteria for the preliminary numerical simulations.

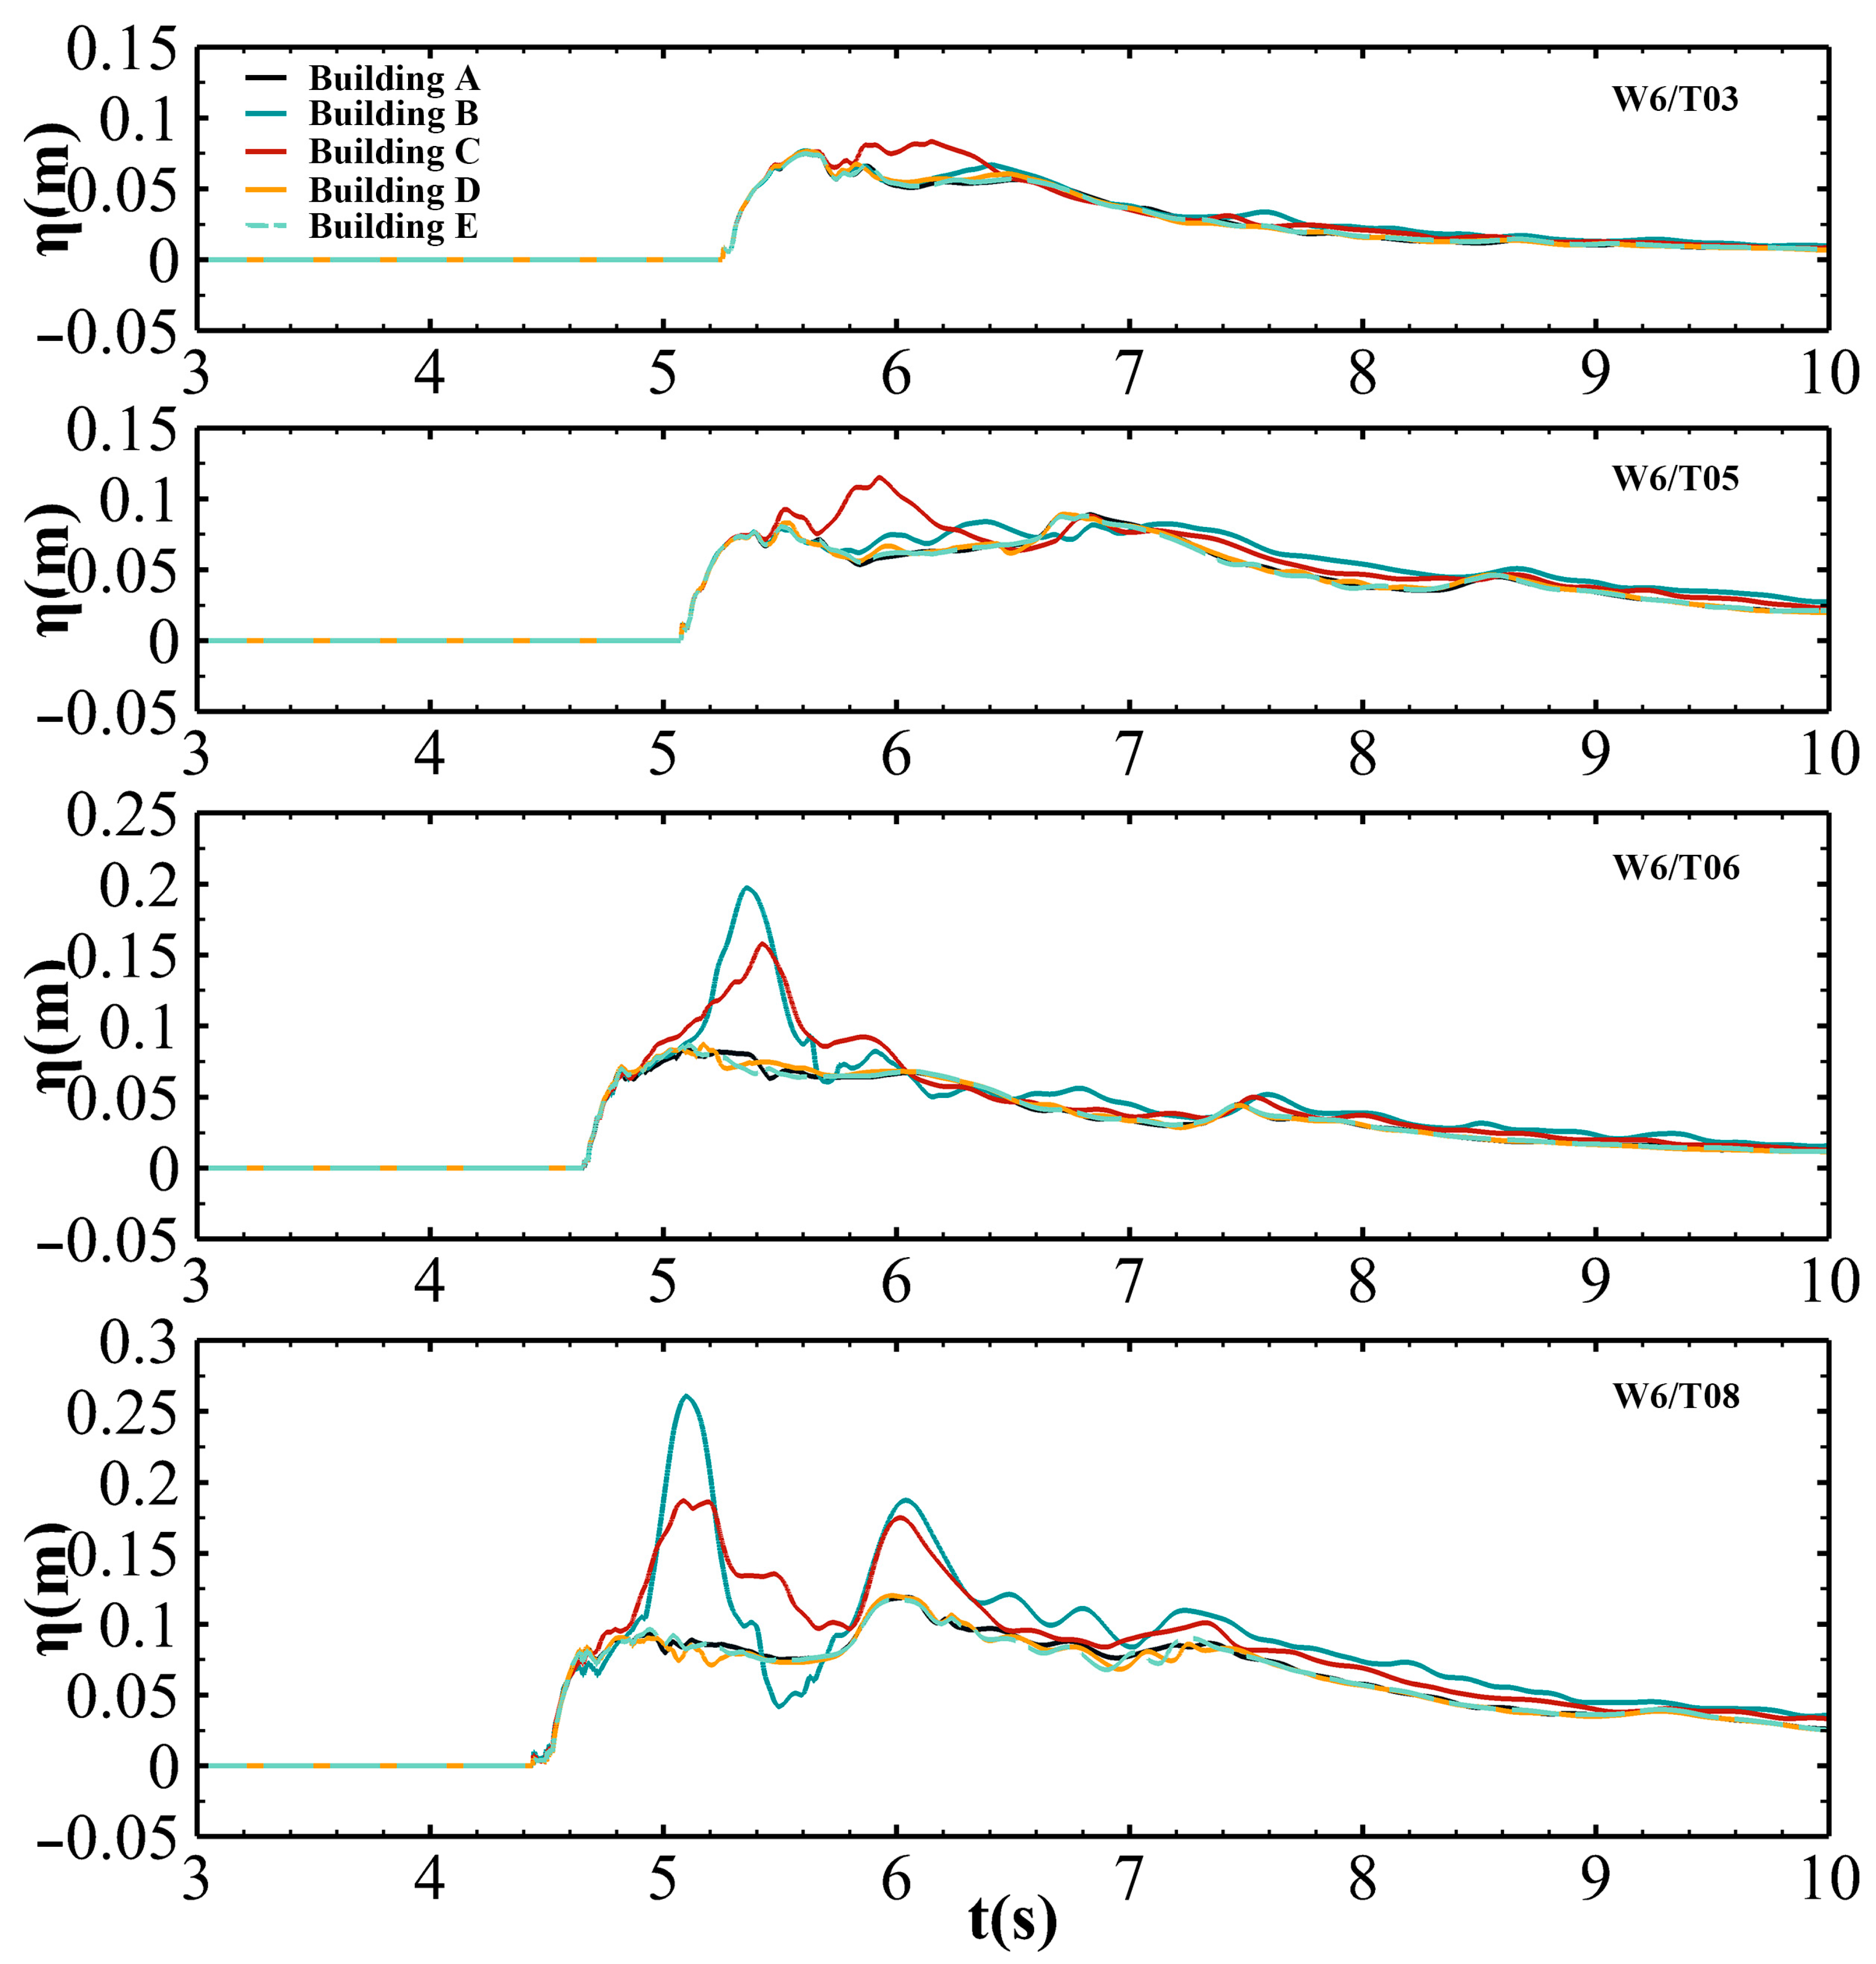
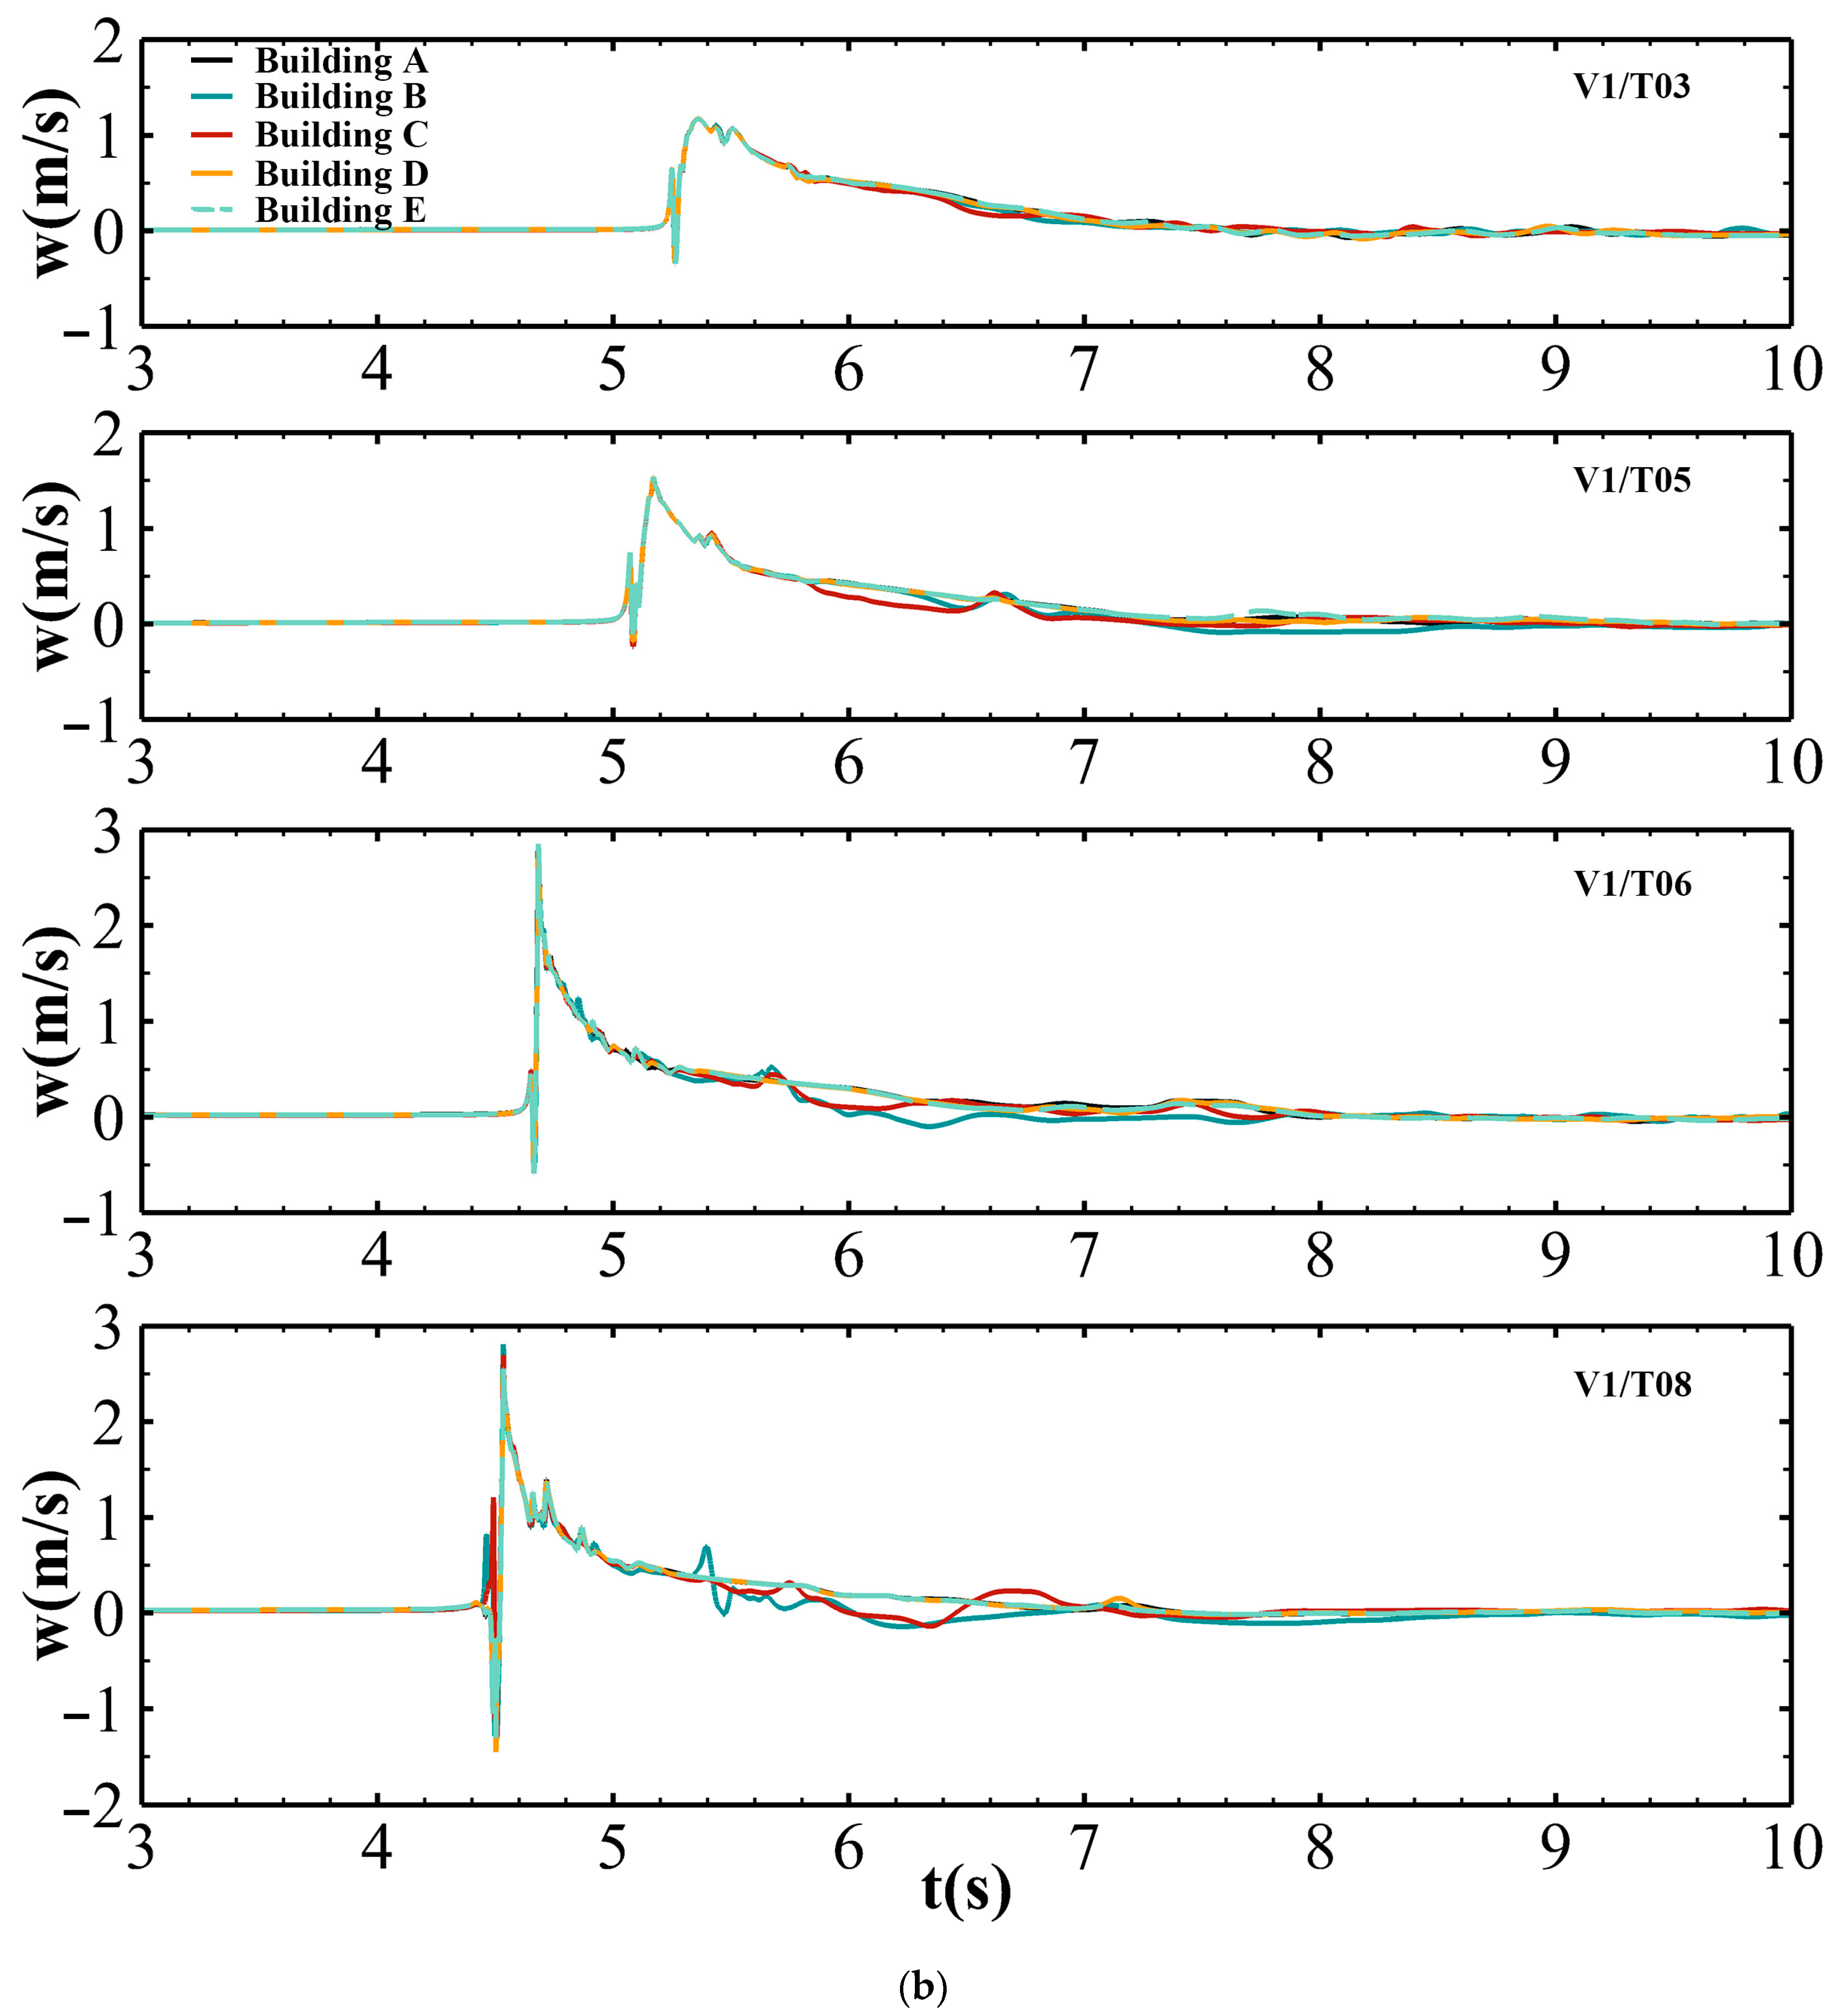
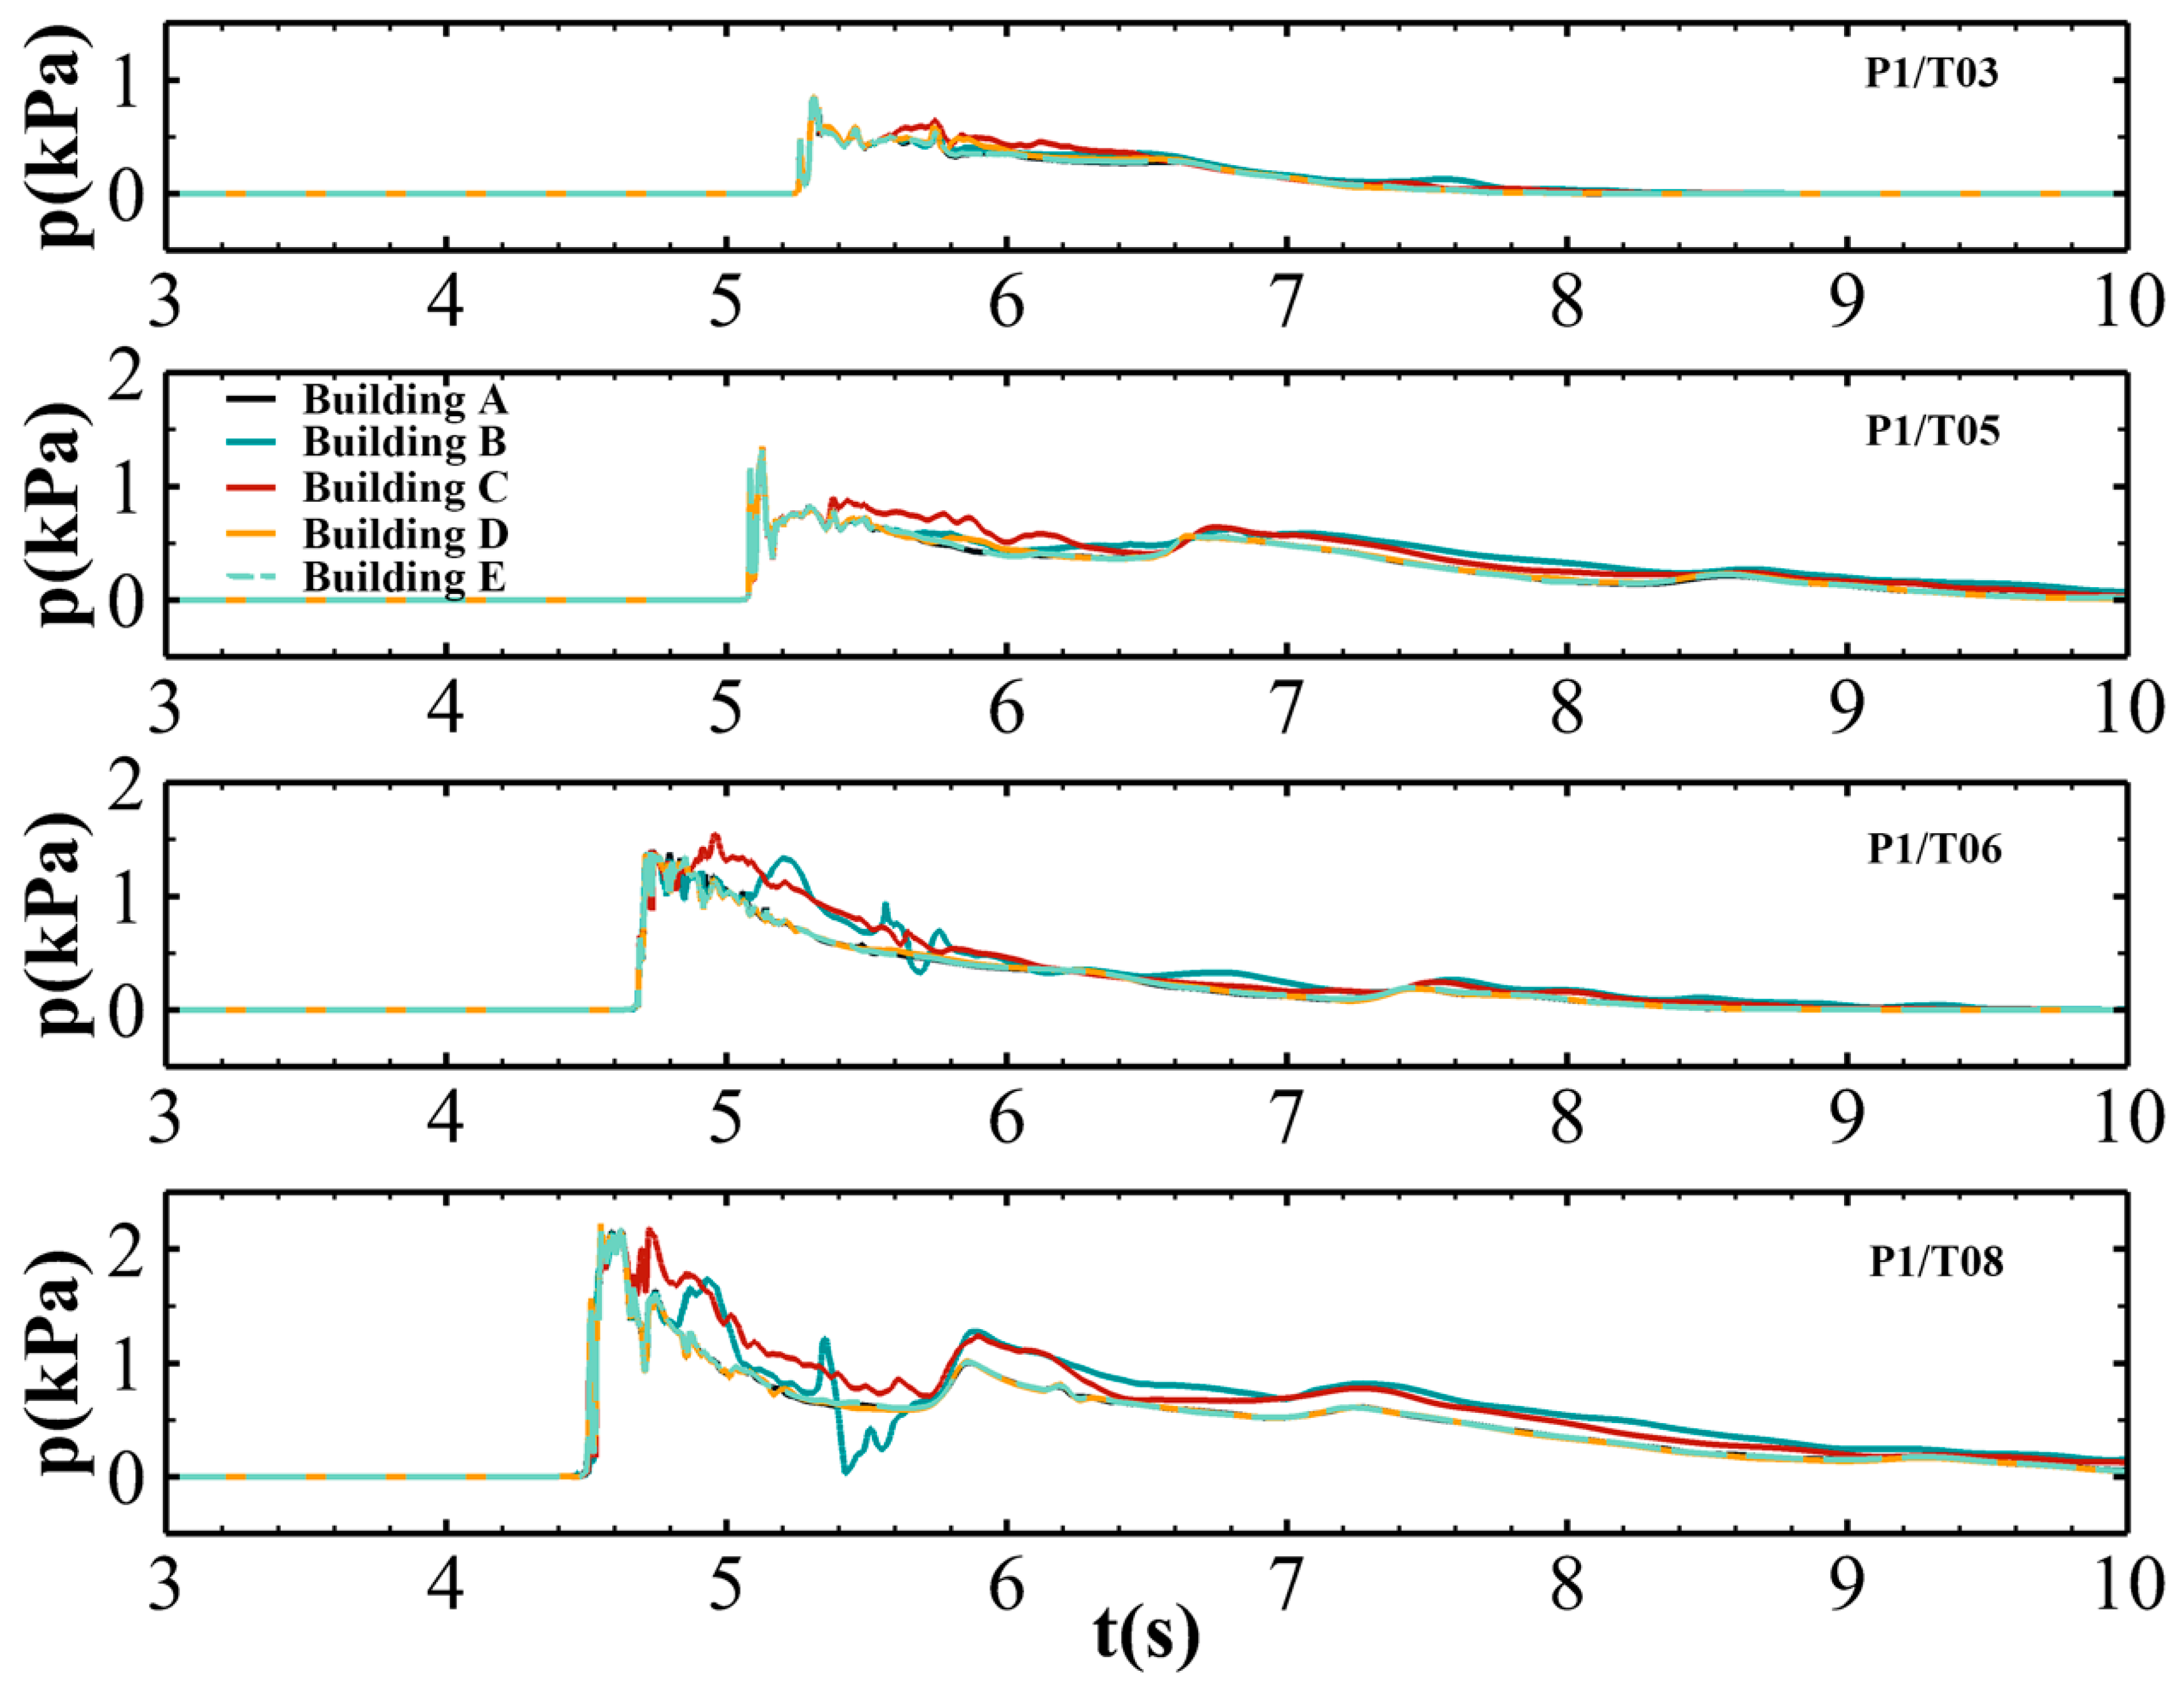
3.3. Validation of Numerical Models

To validate the reproducibility of the numerical simulations, this study conducted a validation exercise for the FS3M through quantitative analysis, contrasting the computational numerical simulation results derived from Lee et al. [21]. Figure 10 shows a time-series representation of the water surface elevation (h) of the incident waves in the absence of building-constructed obstacles. Before the numerical simulation, a preliminary study was conducted to identify and calibrate the incident wave conditions of the numerical simulation to align them with those of the physical experiment. The wave height and period were adjusted in FS3M, resulting in a series of numerical simulation outputs. These were subsequently compared with physical experimental data to determine the most accurate wave parameter settings.
The comparisons, particularly at gauging points W2, W3, and W4, shown in Figure 10, demonstrated a high degree of concordance between the FS3M simulated results and experimental data presented by Lee et al. [21]. The highest agreement occurs at W2 (83.3%), while W6 exhibits the largest deviation (57.4%). Any minor discrepancies observed can be attributed to the boundary conditions set in the numerical simulation, resulting in slight deviations in the simulation values. However, at points W5 and W6, the FS3M results exhibited partial fragmentation. This slight deviation from the expected results can be attributed to the splitting of the incident wave caused by soliton fission, leading to partial rather than complete wave fragmentation, as reported by Lee et al. [21].
In ref. [21], the numerical approach was based on a NS solver combined with the VOF method, similar to the FS3M used in this study. However, there are key differences in the implementation. Firstly, the incident wave conditions in ref. [21] may not have been sufficiently calibrated, which could have impacted the accuracy of the results. Secondly, Lee et al.’s model did not employ any turbulence modeling, which might have limited its ability to capture the detailed flow dynamics. In contrast, the FS3M utilized in this study incorporates a LES approach for turbulence modeling, allowing it to better represent the complex interactions typical of tsunami-like wave events. The advanced methodologies in FS3M, including more precise wave calibration and interface tracking, resulted in superior agreement with experimental data compared to the results reported by Lee et al. [21].
Figure 11 shows a time-series plot of pressure (p) distribution in a scenario devoid of debris. The distribution of the locations of P1–P5 is shown in Figure 4, Figure 5, Figure 6, Figure 7 and Figure 8. The FS3M predicted p loads higher than the physical experimental data, but the RMSE values are within an acceptable range, and the percentage agreement remains reasonable across all pressure measurement points. Specifically, p loads were recorded at locations P1–P4 during the physical experiments, whereas in the numerical simulation, the p load occurred at P1–P4 with slightly higher magnitudes. This discrepancy can be attributed to the slightly higher simulated flow rate, resulting in elevated p predictions.
Although instances of instability were observed within the FS3M results, the overall trends in the predicted p loads were reasonably consistent with the physical experimental findings. Therefore, the numerical model FS3M demonstrated a commendable ability to replicate incident wave characteristics and their interactions with a nonstructured environment, substantiating its credibility and utility for such analyses. The corroborative results from the model confirmed its application as a reliable tool for understanding wave dynamics in the context of coastal engineering challenges.

3.4. Numerical Simulation Wave Conditions

The numerical simulation parameters—water depth, wave height, and wave period—were calibrated through comparative analysis with data derived from physical experiments. The calibration process explored a spectrum of wave conditions, including long-period and solitary waves, allowing for adjustments of the aforementioned parameters. Although previous hydrodynamic studies have used solitary and long-period waves to model tsunami dynamics [35], these idealized single-wave scenarios do not capture the full complexity of tsunami waves in realistic settings and offer limited practical applicability. Therefore, in this study, the simulations were expanded by integrating eight distinct hydrodynamic conditions, as listed in Table 1.
In these simulations, a constant water depth of 0.32 m was adopted for all wave conditions. This depth was maintained to align with the conditions of the physical experiments and facilitate the identification of the causes of simulation failure. This water depth condition closely resembles the inundation levels observed over land during significant tsunami events [36,37]. For solitary waves, two wave heights, 0.064 and 0.16 m, were tested. Furthermore, long-period waves were analyzed using wave heights of 0.128 and 0.192 m and periods of T = 6.0, T = 8.0, and T = 14.0 s. Each test duration was 10 s.
Before including building models or debris in the simulations, initial runs were executed under building-only conditions for the eight wave scenarios to characterize the flow properties of tsunami-like waves. This preparatory step was crucial for establishing the subsequent numerical simulations involving buildings and debris. The comprehensive testing phase involved 80 individual simulations, factoring in five different building configurations and the presence or absence of wave-borne debris. Various tests have been designed to rigorously evaluate the impact of varying hydrodynamic forces and debris interactions on structural integrity.

4. Simulation Results

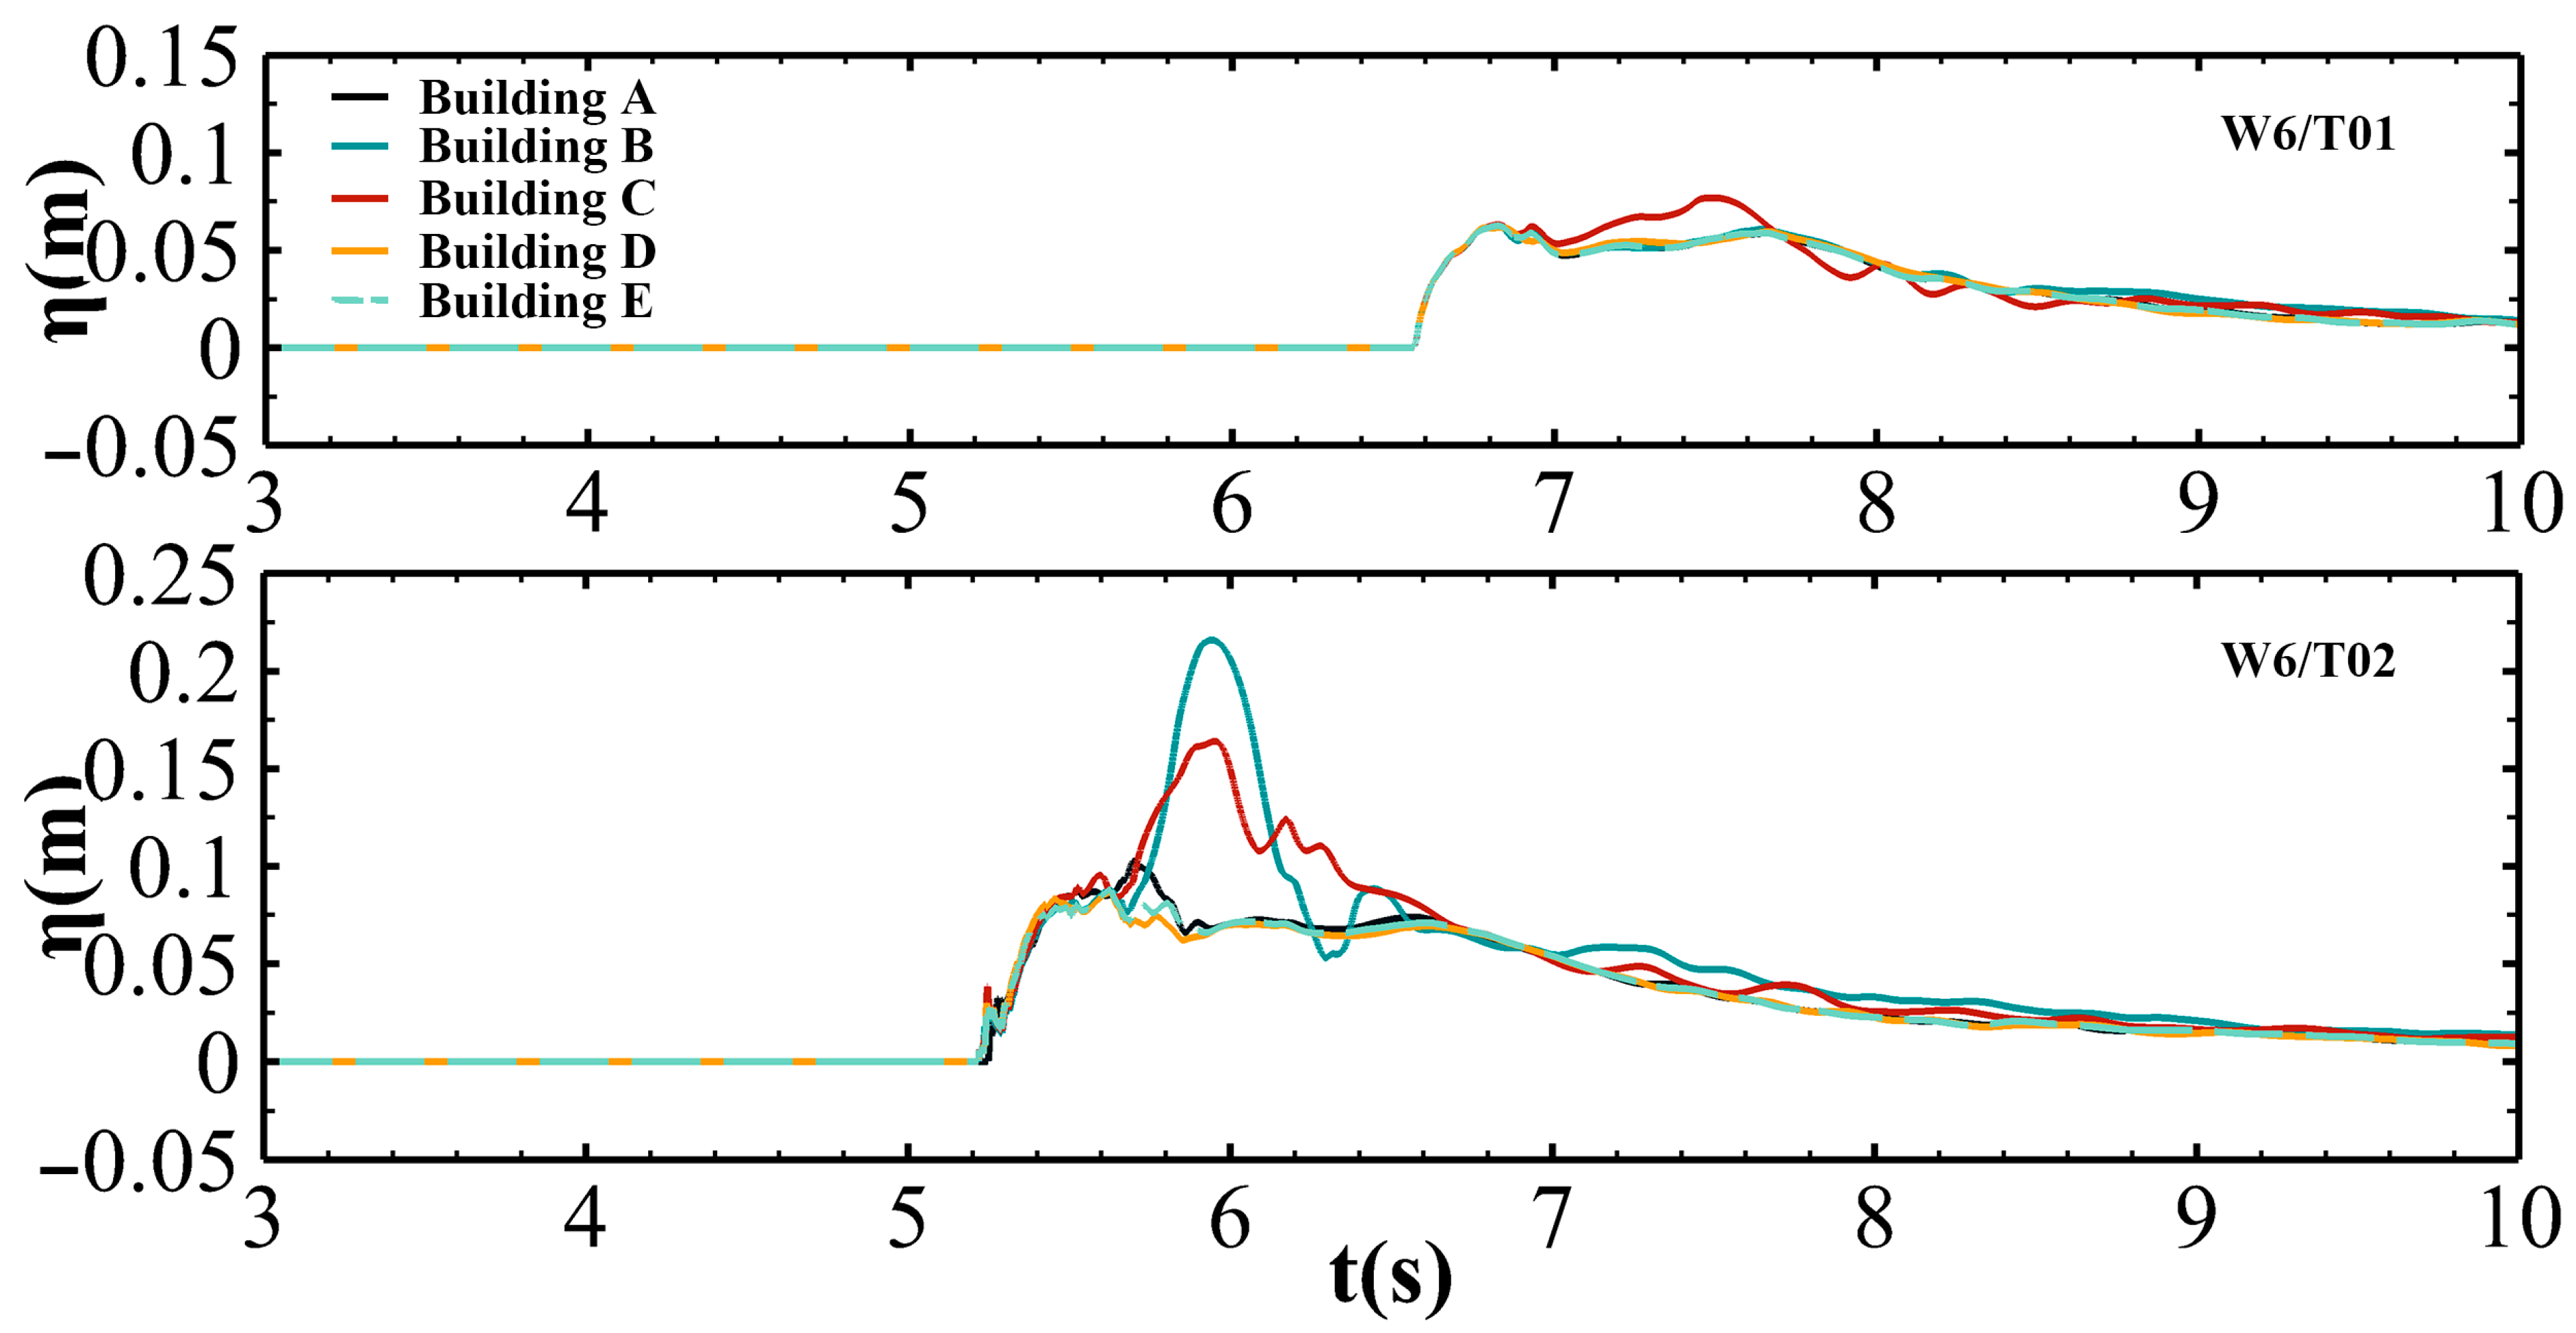
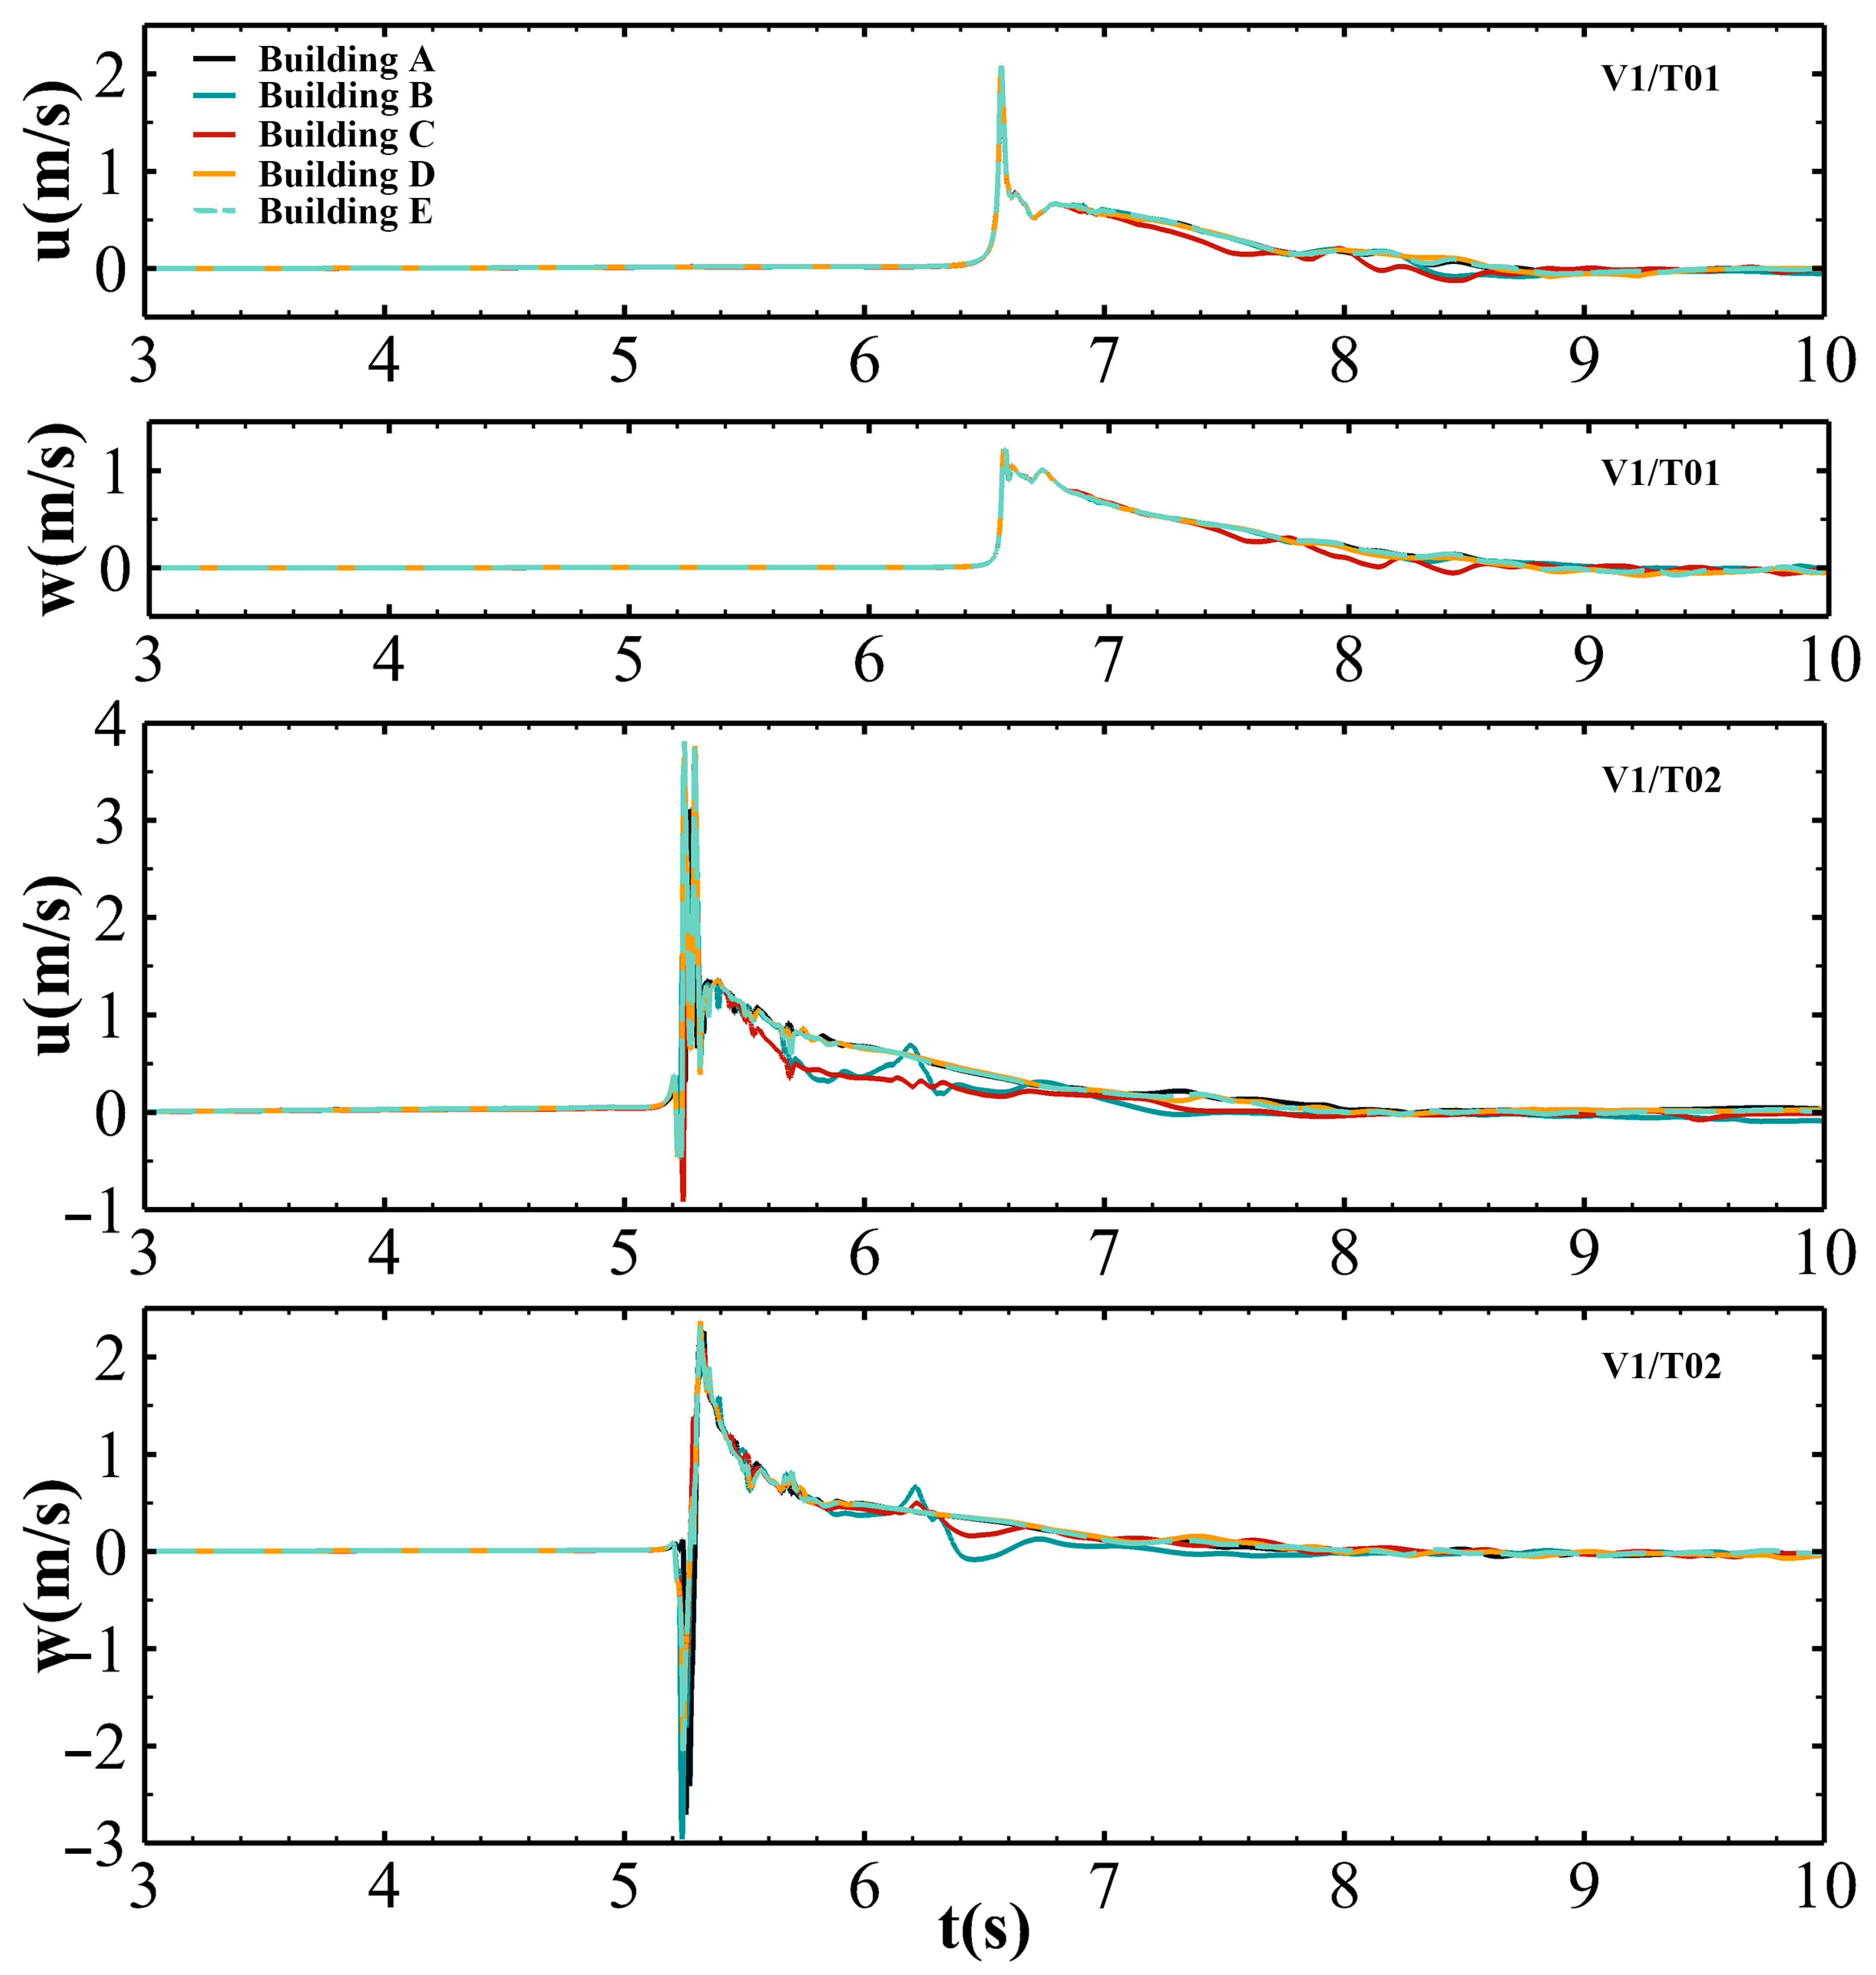
4.1. Solitary Wave (T01 and T02)

Figure 12 shows the water surface elevation response h to the solitary wave conditions (T01 and T02) in W6. Wave T01 arrived at 6.58 s without exhibiting any breaking waves, thus classified as a nonbreaking wave state. During the time frame from 6.60 s to 8.00 s, T01 exhibited a quasi-steady condition, persistently applying horizontal impingement on the building. The water surface gradually receded to a shallower flow depth as it passed through different buildings, with Building Model C exhibiting a marginally higher elevation during T01. In contrast, wave T02, arriving at 5.22 s, was marked by wave breaking immediately in front of the building. The crest of T02 reached its maximum elevation at 5.90 s specifically at Building Model B, surpassing the elevation at Building Model C. This internal wall configuration of Building Model B disrupts and redirects the incoming wave energy, causing localized amplification of the wave crest. During the T02 condition, Buildings B and C registered increased water surface elevations h at the building front.
Figure 13 shows velocity measurements in V1, capturing the horizontal (x-component) u and vertical (z-component) w components near the building model under solitary wave conditions (T01 and T02). The time history profile of the flow velocity indicated that the maximum flow velocity (velocity peak) simultaneously occurred with the formation of the water surface elevation h because the incident wave surged freely along the front building wall without any obstruction. For the corresponding h conditions, the flow velocity peaked at the shallower surge front. The initial impact of a wave on the building model produced large accelerations; however, these accelerations gradually weakened and became relatively smooth before the subsequent waves arrived, accompanied by a nearly zero flow velocity near the building model. However, wave T02 demonstrated significant negative velocity spikes, correlating with wave reflections observed near the front of the building during wave impact. This indicated that portions of the flow moved downward, as evidenced by the negative z-velocity values. These reflections contributed to the instability of the wave peak velocity, resulting in different flow velocities through Building Models B and C compared with other structures.
Figure 14 shows the temporal pressure measurements p in P1 on the front face of the building model under wave conditions T01 and T02. These p fluctuations exhibited a similar trend, characterized by an initial rapid increase in p as the h rose, followed by a gradual decrease. A comparative analysis of T01 and T02 indicated that larger wave conditions more significantly influenced the p magnitude. Although the peak pressures of T01 may not significantly differ, the p measurements under the T02 conditions were consistently higher and more sustained than those under T01. Building Models B and C experienced maximum p measurements later than the other models. This effect is attributable to wave interactions with their internal walls, propagating sustained p generation. In addition, waves splashed against the front face of the building, while some entered the building model through the front openings, further complicating the p dynamics.
Figure 15 shows the validation results of h for the long-period wave scenarios (T03, T05, T06, and T08) in W6. The arrival times of waves T03 and T05 were recorded at 5.22 and 5.12 s, respectively. These waves gradually generated a progressive rise in h, followed by a subsidence to a shallower flow depth. The h values were generally consistent across the different building configurations. An exception was observed in Building Model C, which registered higher values. Specifically, during the period of 5.80 s to 6.60 s for wave T05, the h of Model C slightly exceeded that of Building Models A, D, and E. Waves T06 and T08 arrived at 4.62 and 4.42 s, respectively. These interactions were marked by initial impacts producing high splashes against the building models. This was followed by wave splitting and propagation to the building’s cross-shore direction on both sides, gradually transitioning to a stable hydrodynamic flow state downstream of the building. Notably, for T06 and T08, the h values observed after interacting with Building Models B and C were higher, with Model B exhibiting the highest water surface elevation. In particular, T08 demonstrated a series of multiple wave surges, a behavior not prevalent in other tested conditions. This highlighted the impact of larger wave conditions on the h dynamics.
Figure 16a,b show the velocity profiles in V1, showing the horizontal (x-component) u and vertical (z-component) w velocities recorded near the building model under long-period wave conditions (T03, T05, T06, and T08). Consistent with the patterns observed for solitary waves, the maximum flow velocity (velocity peak) of long-period waves simultaneously occurred with the formation of h. As the h value decreased and transitioned to a shallower flow depth, the flow velocity near the building model attenuated and approached a near-zero state. Notably, the peak flow velocities for waves T06 and T08 exhibited significant fluctuations, indicative of unstable flow conditions. Furthermore, the velocity profiles obtained for Building Models B and C diverged from those observed for the other building types. The overall trends suggested that larger solitary waves were correlated with increased flow velocities, whereas larger long-period waves were associated with enhanced flow instability.
Figure 17 shows the representative time histories of the wave-induced p values measured at P1 on the front face of the building model under long-period wave conditions (T03, T05, T06, and T08). Similar to solitary waves, the p time histories for these conditions exhibited a consistent pattern characterized by an initial rapid increase in p followed by a gradual decrease as the h value increased. Nonetheless, a distinct fluctuating decrease in p was evident in the latter stages for waves T06 and T08, attributable to the dynamic interference from the incident waves inside the building model. For Building Models B and C, the peak pressures manifested later than those for the other models. This delay resulted from the sustained p caused by the interactions of the wave with the internal walls of these specific building configurations.

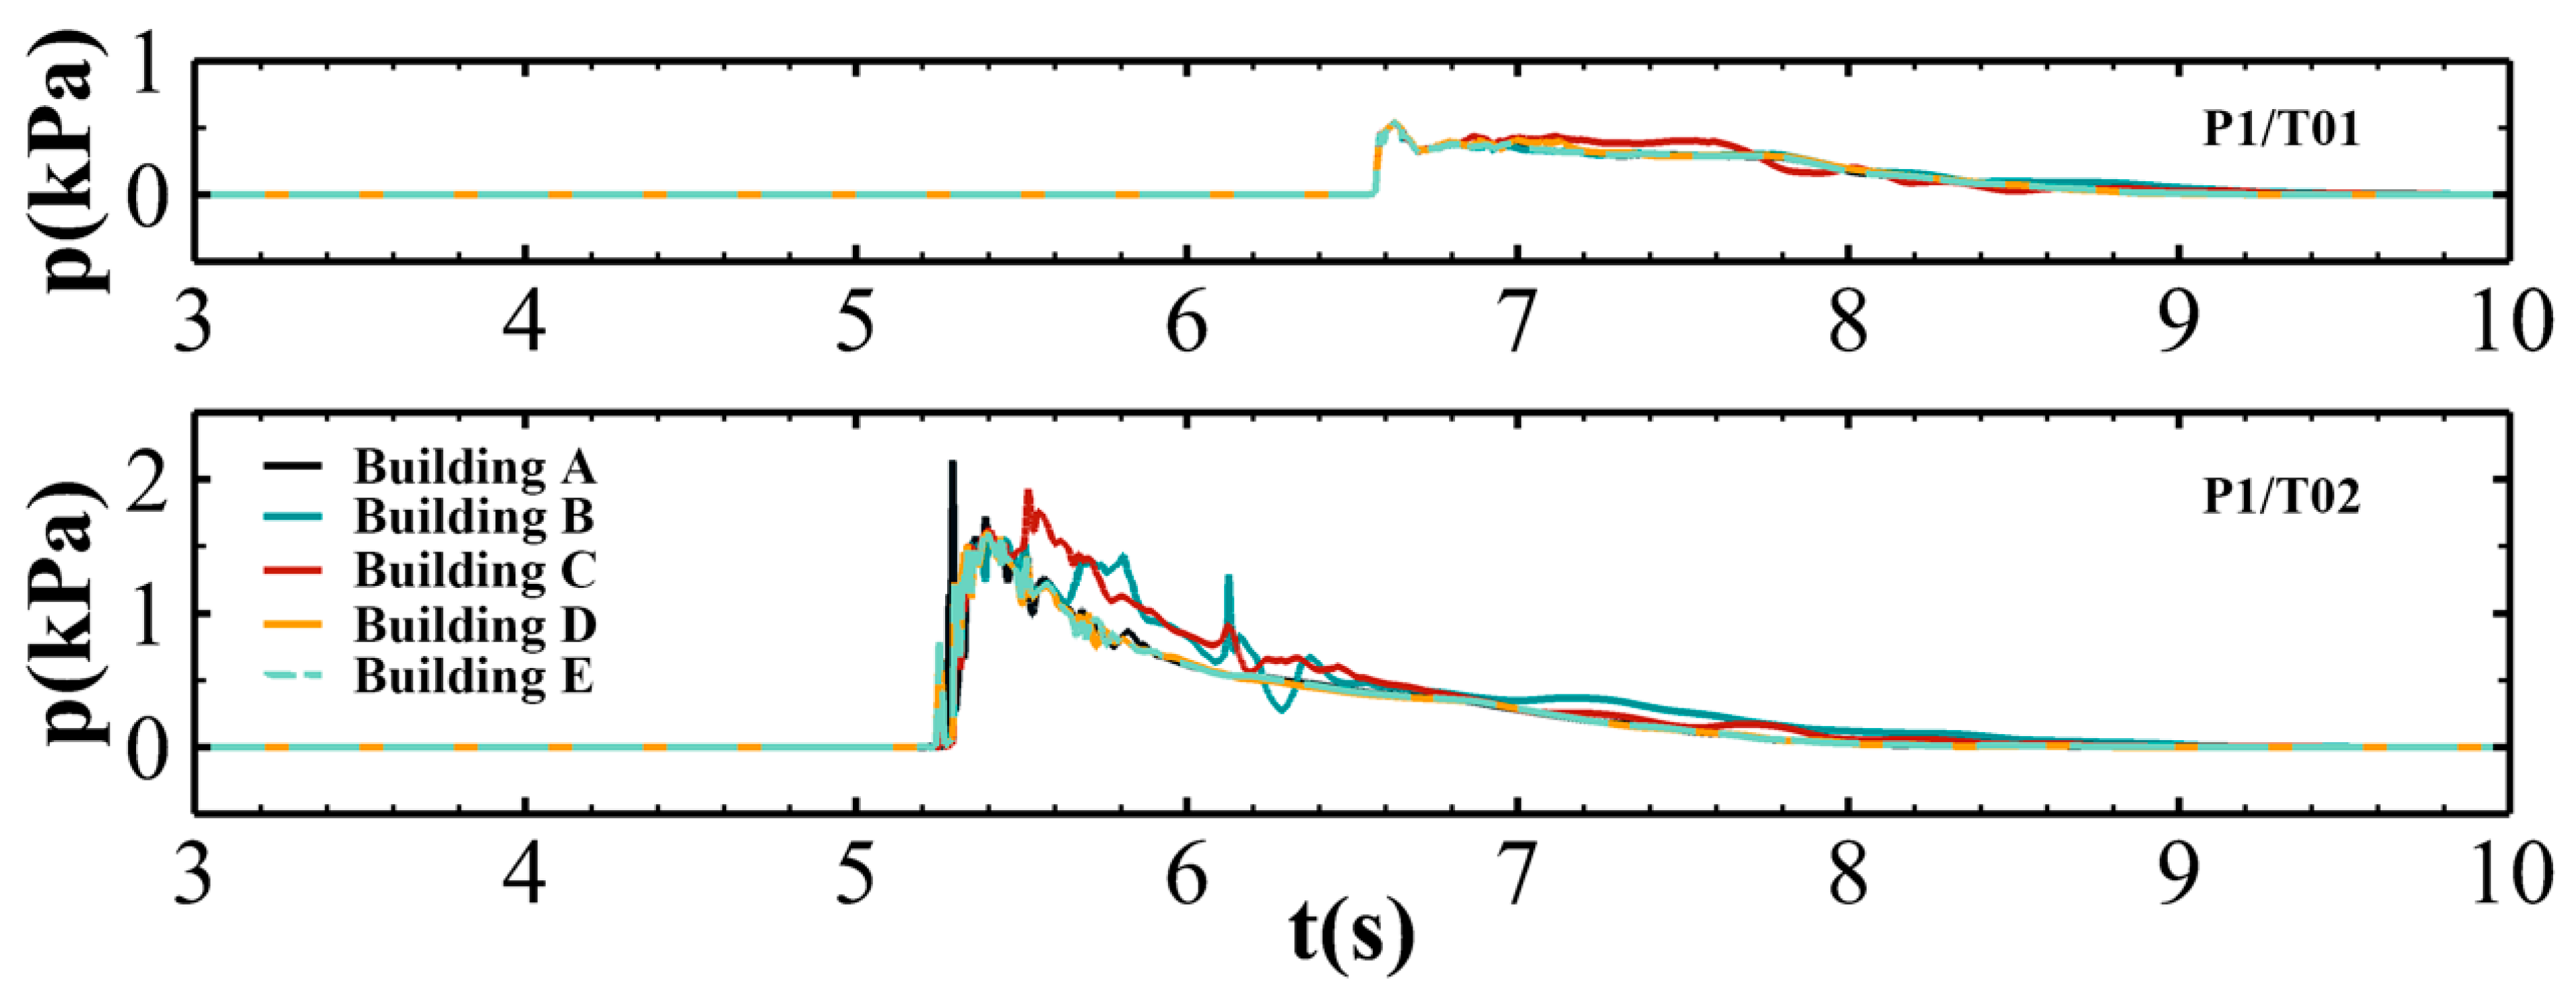
4.2. Instantaneous Pressure Distribution

Figure 18 shows the normalized pressure distributions under various wave scenarios for both the with-debris and without-debris conditions. Specifically, the pressure distribution corresponding to the peak horizontal force (Fx) of the structure was analyzed. Datapoints for pressure (red circles) were obtained from the FS3M simulation output along the vertical (z-axis) at specified elevations above ground level, as illustrated in the inset of Figure 18a. These points ranged from a lower elevation of z = 0.01 m to an upper elevation of z = 0.20 m. The pressure values were normalized using the water density (ρ = 1000 kg/m3), gravitational acceleration (g = 9.81 m/s2), and wave height H in Table 1. The study encompassed a comparison across three structural configurations (Buildings A, B, and E) and two debris scenarios, focusing on the influence of wave height on the normalized pressure distribution. Since the results for Buildings B and C, as well as Buildings D and E, were similar, only Buildings A, B, and E were compared. Buildings B and C, as well as Buildings D and E, used internal walls with the same orientation but different lengths, suggesting that the direction and angle of the internal walls have a greater influence on the pressure distribution.
For smaller incident waves (H = 0.064 m/T01, Figure 18a), the highest normalized pressure was observed at the base of the buildings. Introducing debris in the simulations resulted in a noticeable increase in the normalized pressure in the base area. A detailed analysis of three-dimensional animations revealed that direct interactions between debris and buildings, particularly with debris entrapment at the frontal section, induced additional structural loads. These effects are consistent with empirical observations from past tsunami incidents, as documented in field surveys [28,38,39]. Among the building models, B displayed a unique response by exhibiting a higher normalized pressure. This was attributable to the effects of internal walls perpendicular to the wave direction, acting as barriers to debris movement. This effect was pronounced under low-wave conditions, which lacked the driving force to mobilize the debris. Notably, Model B maintained elevated pressure levels, even without debris. This indicated that the internal wall configuration promoted waves to splash freely within the structure.
Under larger wave scenarios (H = 0.16 m/T02, Figure 18b), the normalized pressure increase at the building base was substantially higher. The middle to lower regions of the buildings experienced normalized pressures higher than those recorded under smaller wave conditions. The normalized pressure profiles for Models A, B, and E were comparable across the specified wave conditions. Nevertheless, the disparity in the peak normalized pressure for Model B was less significant under higher wave conditions owing to the augmented driving force of the waves, facilitating debris displacement from the front face of the building. Overall, the larger incident wave T02 generated higher normalized pressures than the smaller incident wave T01. Higher wave conditions also resulted in water ingress into the first floors of the buildings, where the internal wall layout contributed to an upward surge in the normalized pressure from splashing effects.

5. Discussion

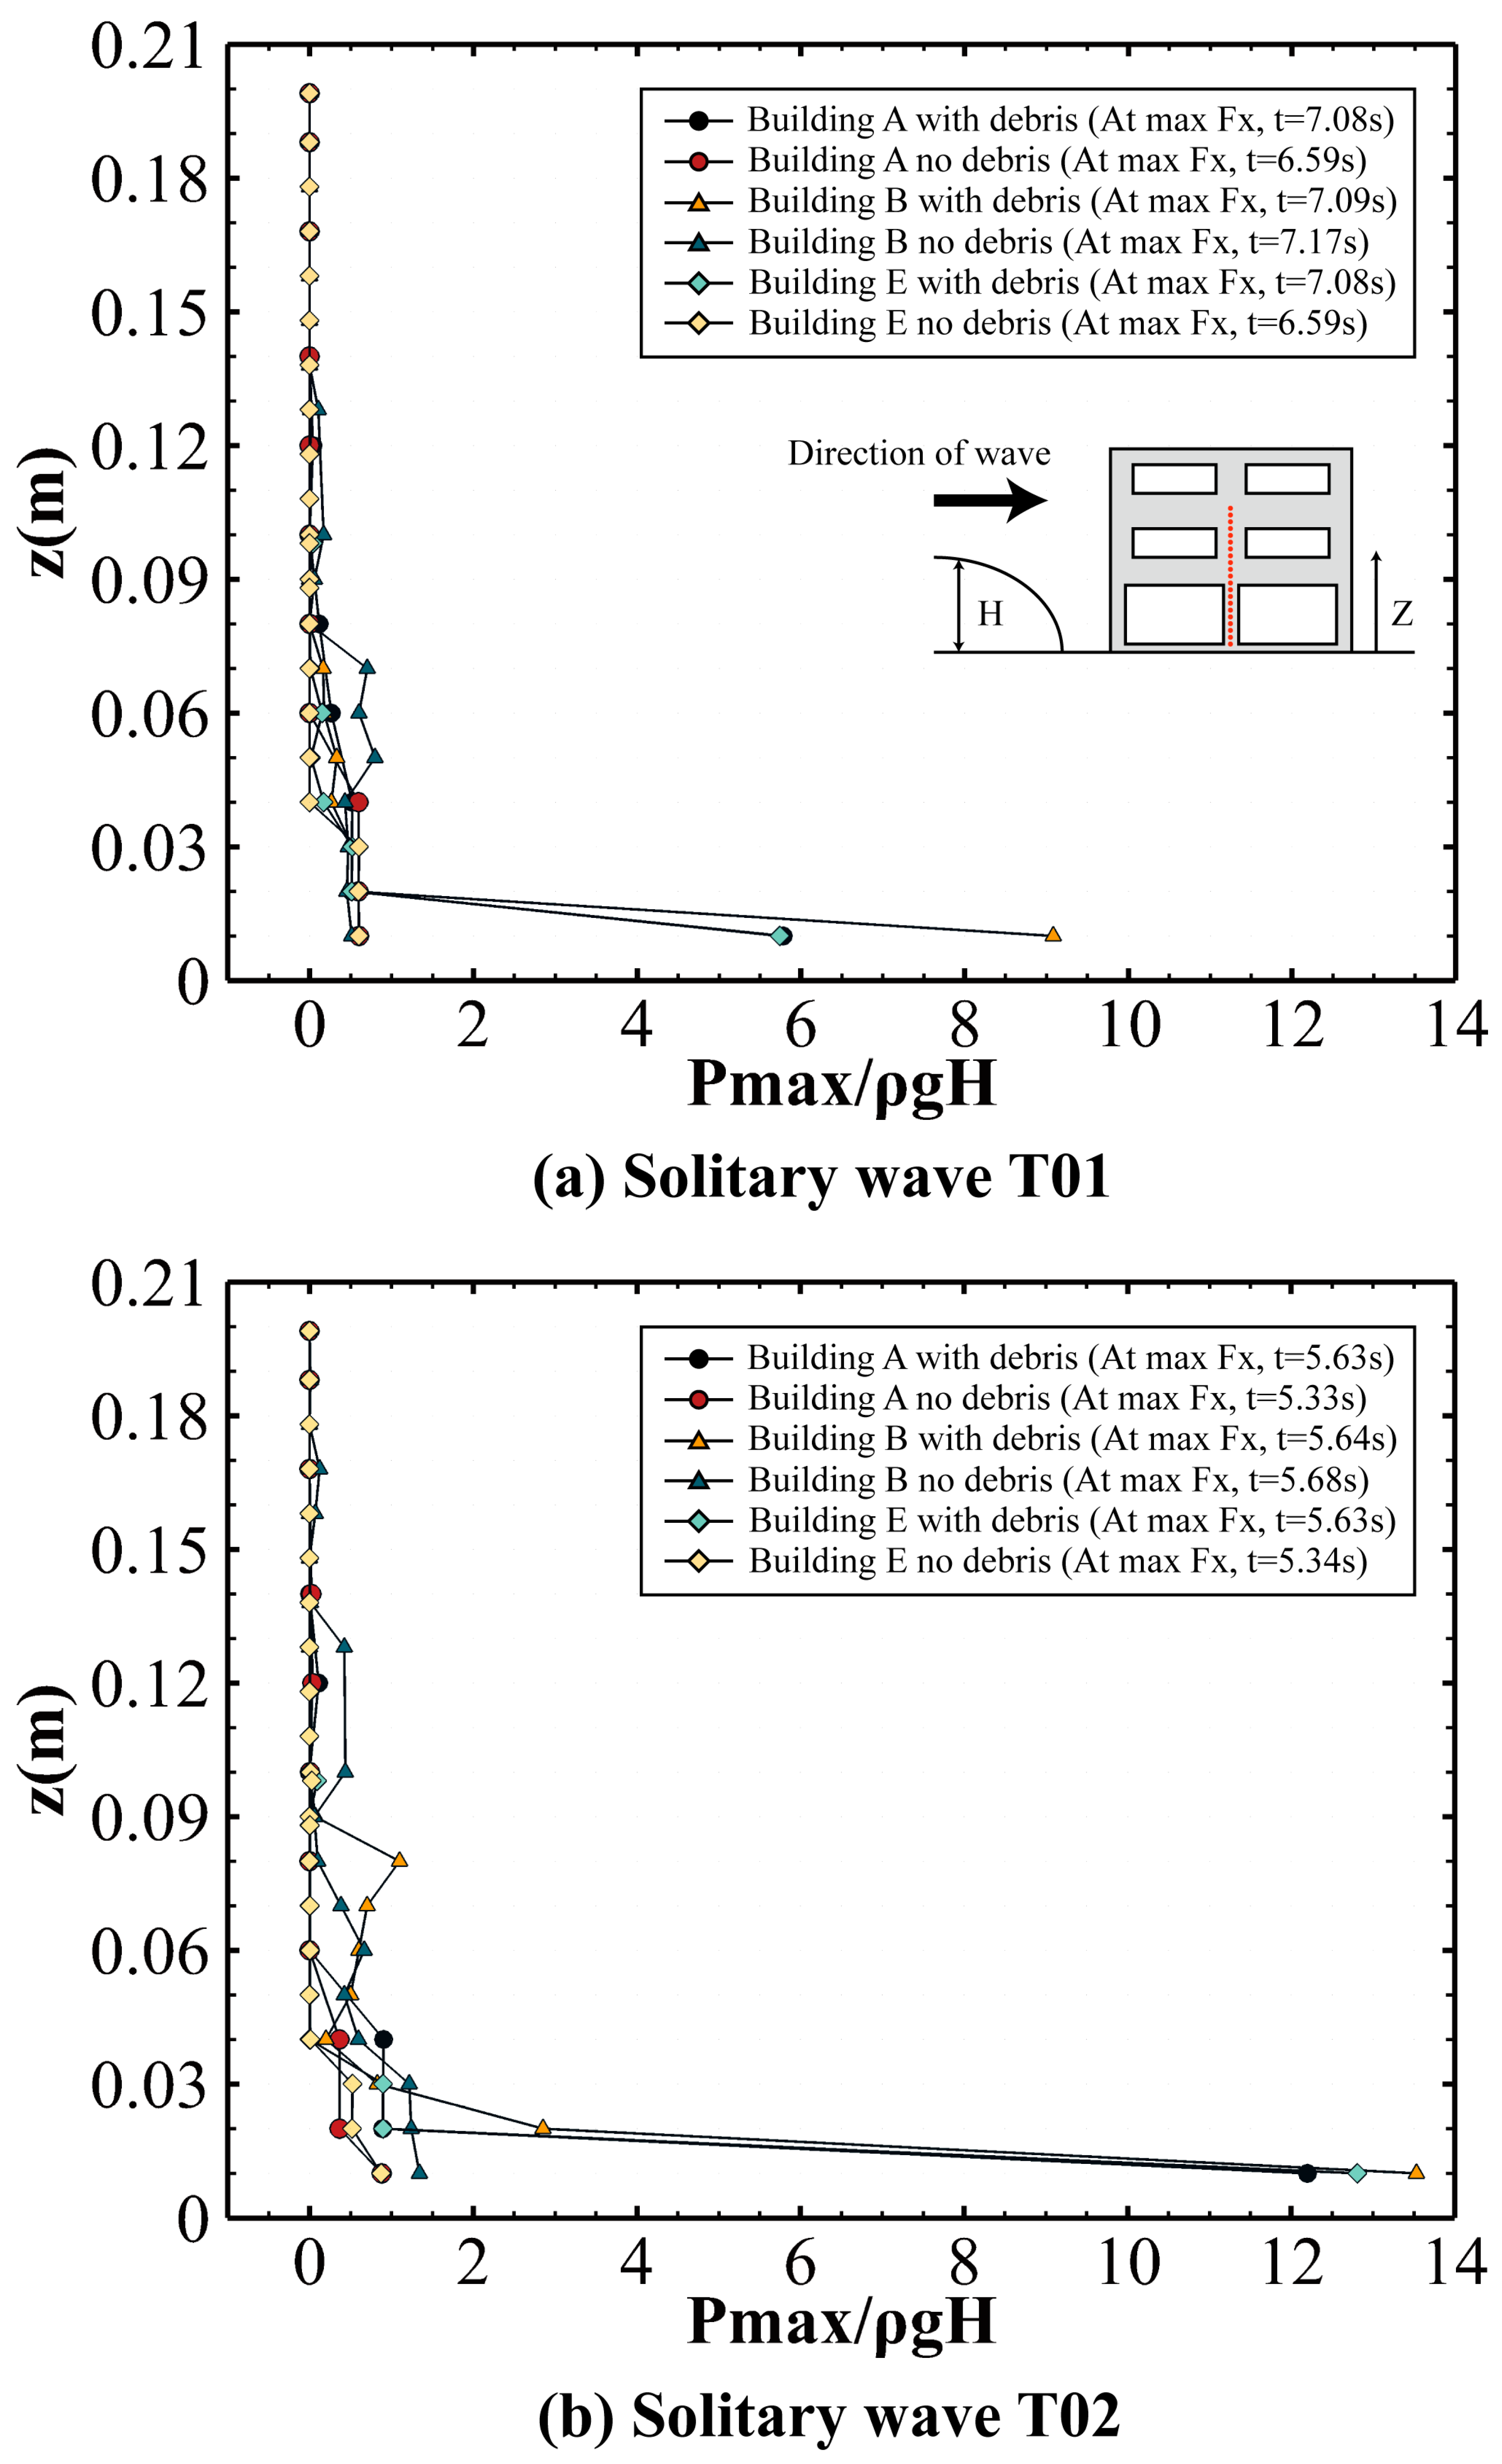
5.1. Maximum Normalized Pressure Distribution on Building

This section investigates the impact of tsunami loads on buildings, differentiating scenarios with and without debris, to identify the key factors influencing the maximum normalized pressure experienced by structures during such events. Figure 19a,b graphically represent the maximum pressure distribution at the normalized vertical (z-axis) heights for buildings under different wave types in both scenarios. The pressure points (red circles) are shown in the inset of Figure 19a.
In scenarios without debris, the correlation between the wave type and maximum normalized pressure was more pronounced. For example, solitary wave T02, characterized by a higher wave height, exerted a higher normalized pressure than long-period wave T08. This indicated that the wave height and physical characteristics influence the intensity of the normalized pressure. This was evident when considering waves with lower heights, such as T03 and T05, where the wave period appeared to have a negligible effect on the resultant normalized pressure. Conversely, for wave types T02 and T08, associated with higher wave heights, the maximum normalized pressure was concentrated in the middle section of the building. This distribution likely resulted from the waves entering the building and the wave slamming that developed on the internal walls. Such interactions caused the waves to deflect upwards, intensifying the normalized pressure in the impact regions. Furthermore, a higher wave height enabled the wave to reach the first floor of the building, where its interaction with the internal structures further amplified the normalized pressure. These observations highlight the complex interplay between the wave characteristics and architectural features influencing the maximum normalized pressure.
In contrast, when debris was present, the analysis revealed a more significant correlation between the wave period and maximum normalized pressure. For instance, long-period wave T05, despite its lower height but extended period, induced a higher normalized pressure than T06, which had a higher wave height but a shorter period. This indicated that longer wave periods, typically resulting in longer-duration wave impacts, could amplify the force exerted on structural elements, particularly when compounded by the presence of debris. In addition, T08, which combined a higher wave height with a longer period, surpassed T05 in terms of the normalized pressure amplitude. Notably, the wave type appeared to have less influence on the changes in the normalized pressure amplitude, as evidenced by the comparative analysis of the solitary wave T02 and long-period wave T08. Generally, the presence of debris enhanced the peak normalized pressure and altered its distribution, with the most significant increase observed at the base of the building. While structural characteristics and wave parameters, such as height and type, predominantly influenced the normalized pressure in debris-free environments, introducing debris shifted the impact dynamics, emphasizing the role of the wave period and debris interaction. These findings are instrumental in developing refined tsunami mitigation strategies.

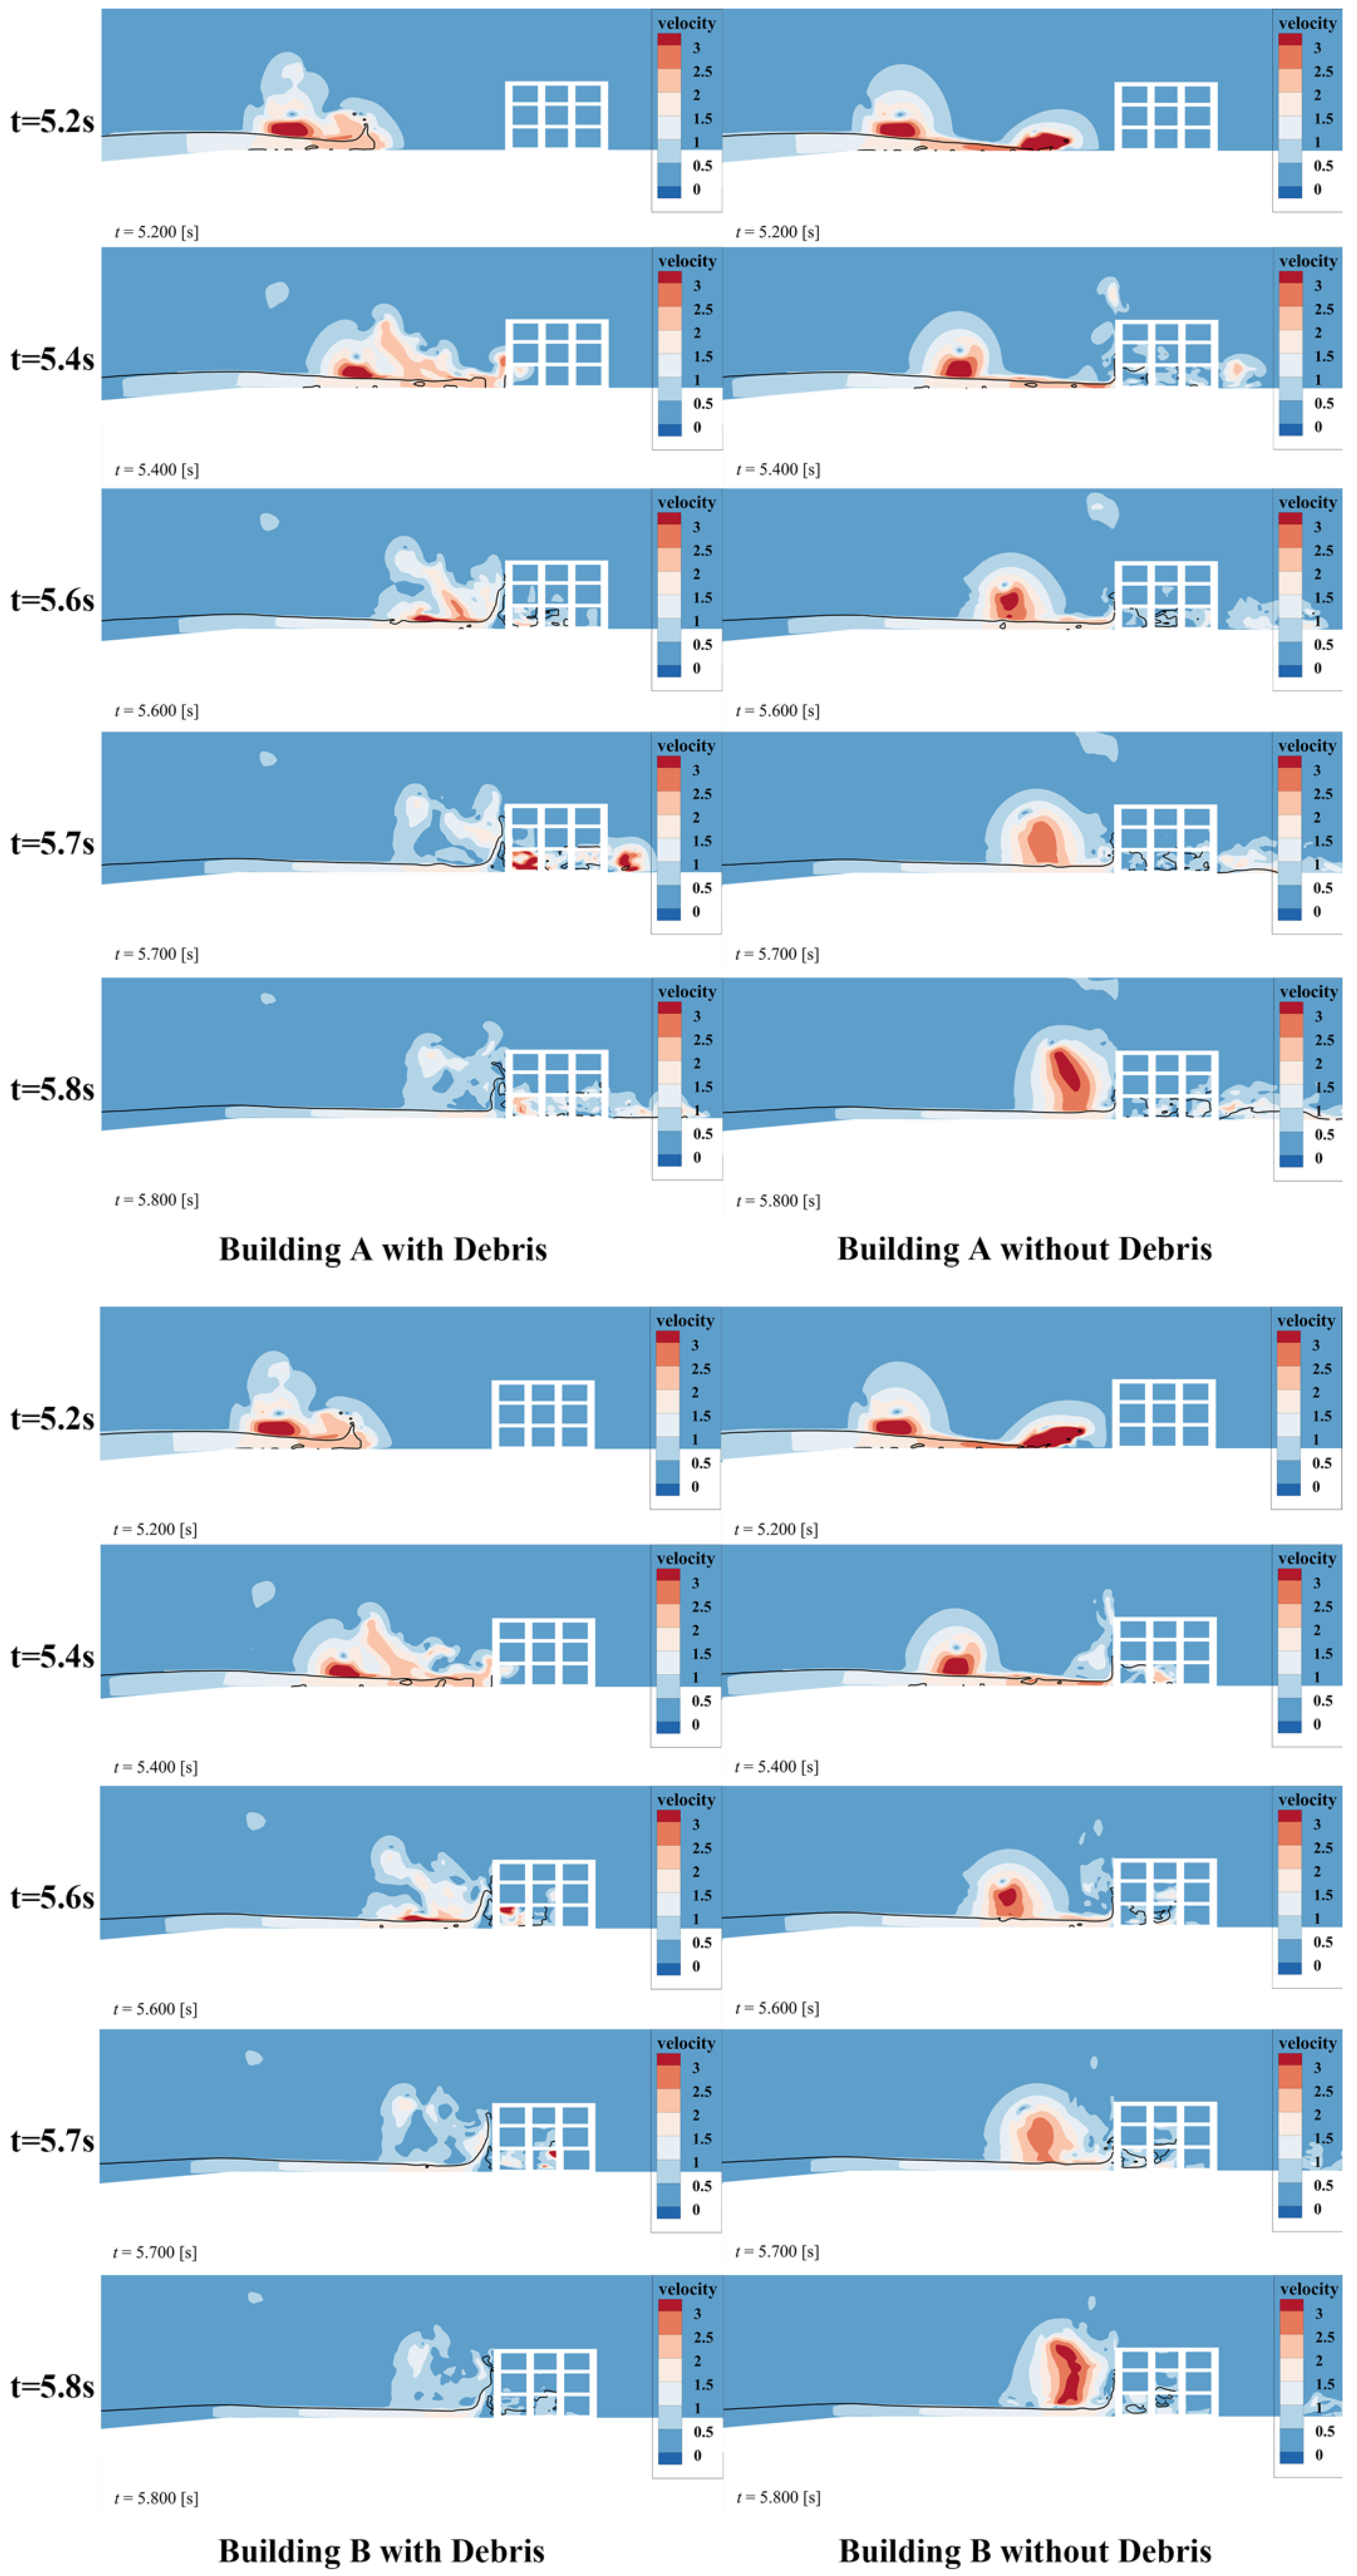
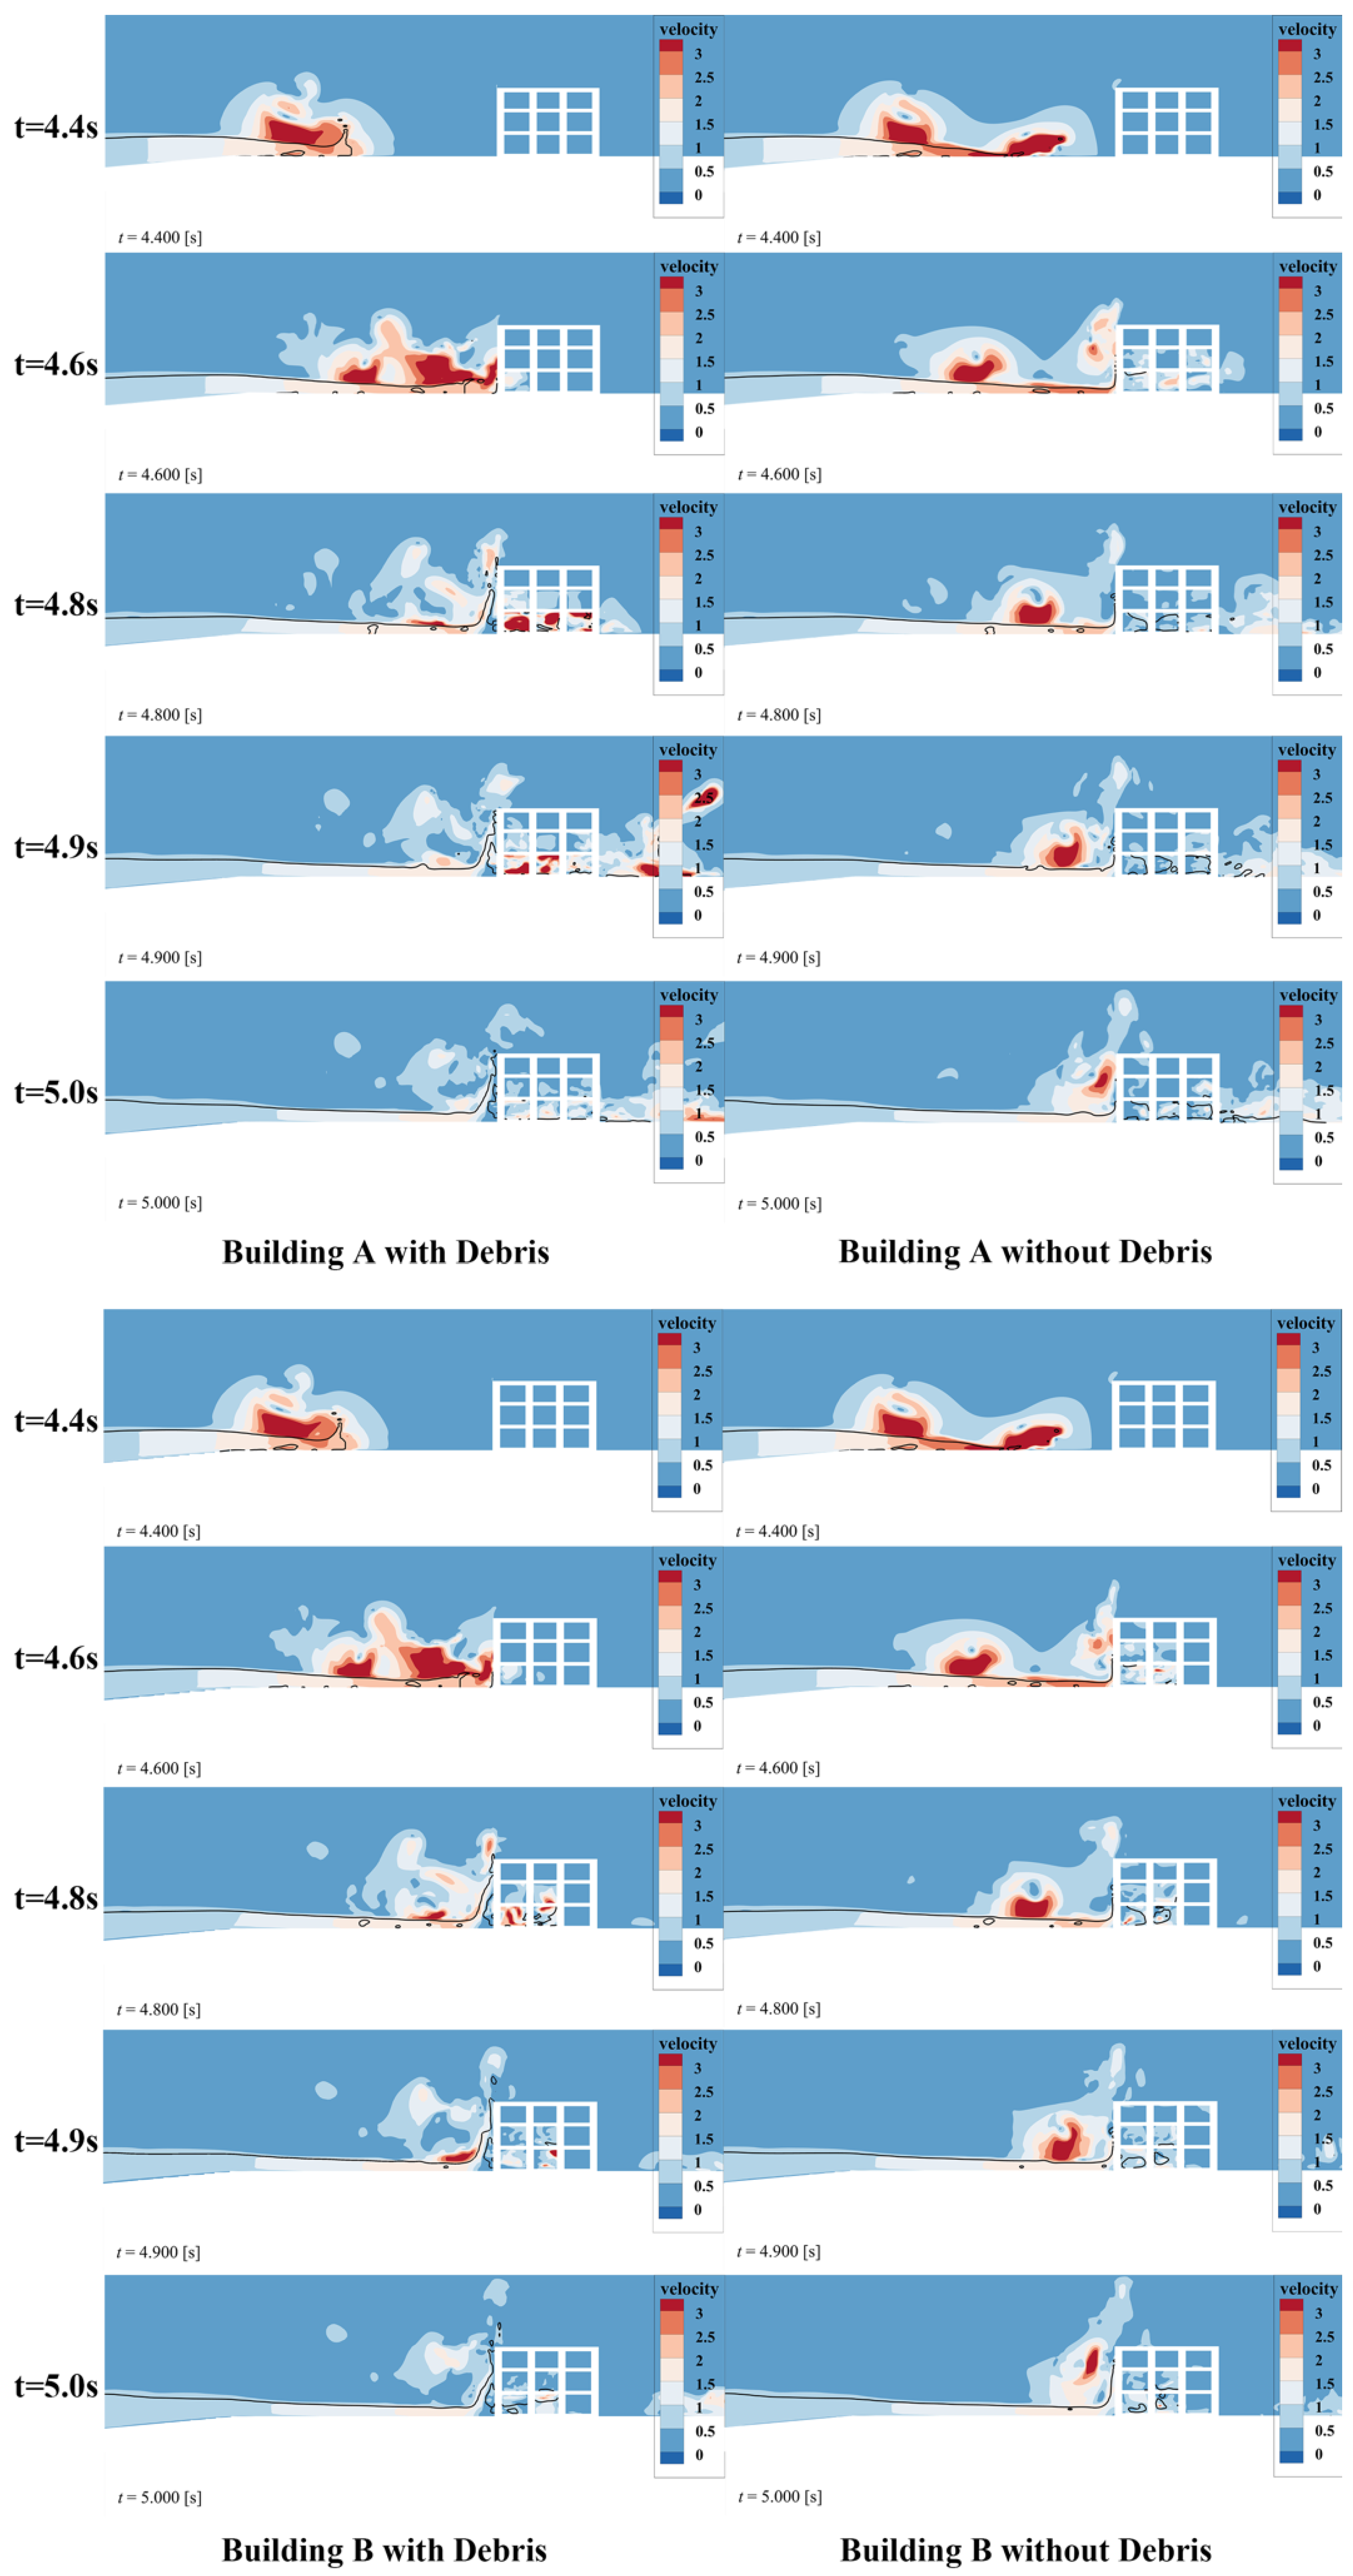
5.2. Instantaneous Resultant Velocity Distribution on Different Building Models

Figure 20 and Figure 21 show a comparative analysis of the instantaneous resultant velocity distribution time histories for Buildings A and B under the T02 and T08 wave conditions, respectively, examining scenarios with and without debris. The figures use color contours to represent the resultant flow velocities, solid black lines for the water surface, and white sections on the right for the buildings. This analysis is instrumental in understanding the dynamic interactions among tsunami-induced flows, building architecture, and debris.
Under the T02 wave conditions, Buildings A and B without debris exhibited different flow behaviors. As the waves impinged upon the building front surface, a smoother variation in velocity magnitudes along the building was observed. Notably, a localized change in the flow velocity magnitudes was observed near the front of the buildings at t = 5.8 s. In addition, Building B exhibited a higher-velocity zone at its base than Building A. This phenomenon was attributed to the interior walls of Building B, which obstructed the free inward flow of the incident waves. Consequently, this obstruction increased the magnitude of the resultant velocity at the front of the interior walls, as the flow interacted with and was redistributed by the structural barriers of the building.
In the presence of debris, Buildings A and B exhibited increased flow velocities, affecting the stability of the wave dynamics. This effect was particularly pronounced in Building B, where the flow dynamics were further complicated by its internal walls. The debris introduced local increases in the flow velocity and disrupted the normal flow paths, leading to the flow being channeled and trapped against the internal walls. The differential impact observed between Buildings A and B with debris indicated that the internal architecture of Building B significantly altered the distribution of the resultant velocity components from the incident waves.
The analysis was extended to T08 wave conditions. The analysis revealed evident disruptions within the flow field at the debris interface. The debris-laden waves impinging on the facades of Buildings A and B encountered significant resistance, increasing the localized velocities. This interaction caused variations in the velocity magnitudes near the debris and buildings, intensifying the hydrodynamic loads on the structures. Such dynamics highlight the potential for debris to significantly amplify structural loads, escalating the potential damage during tsunami events. Particularly in Building B, equipped with interior walls, these structures served as secondary barriers that distinctly modified the velocity distribution between t = 4.8 s and t = 4.9 s. As the tsunami waves impinged upon these internal barriers, the resultant velocity distribution revealed higher-velocity regions near the internal wall. These internal walls segmented the flow into distinct interaction areas, complicating the velocity patterns and potentially altering the load distribution across the structure.
Conversely, for Buildings A and B without debris, the velocity profiles exhibited a more uniform wave–structure interaction pattern. The approaching tsunami waves interacted with the buildings, causing consistent changes in velocity magnitudes as the wave encountered the structures. This interaction highlights the crucial role of building design in modifying the flow velocity magnitudes caused by tsunami impacts.
Overall, this analysis highlights the pivotal roles played by debris and interior walls in modifying tsunami-induced flow velocities. These findings are instrumental in advancing simulation models for predicting tsunami impacts and can advance the structural design of buildings in tsunami-vulnerable regions to enhance their resilience against such natural disasters.

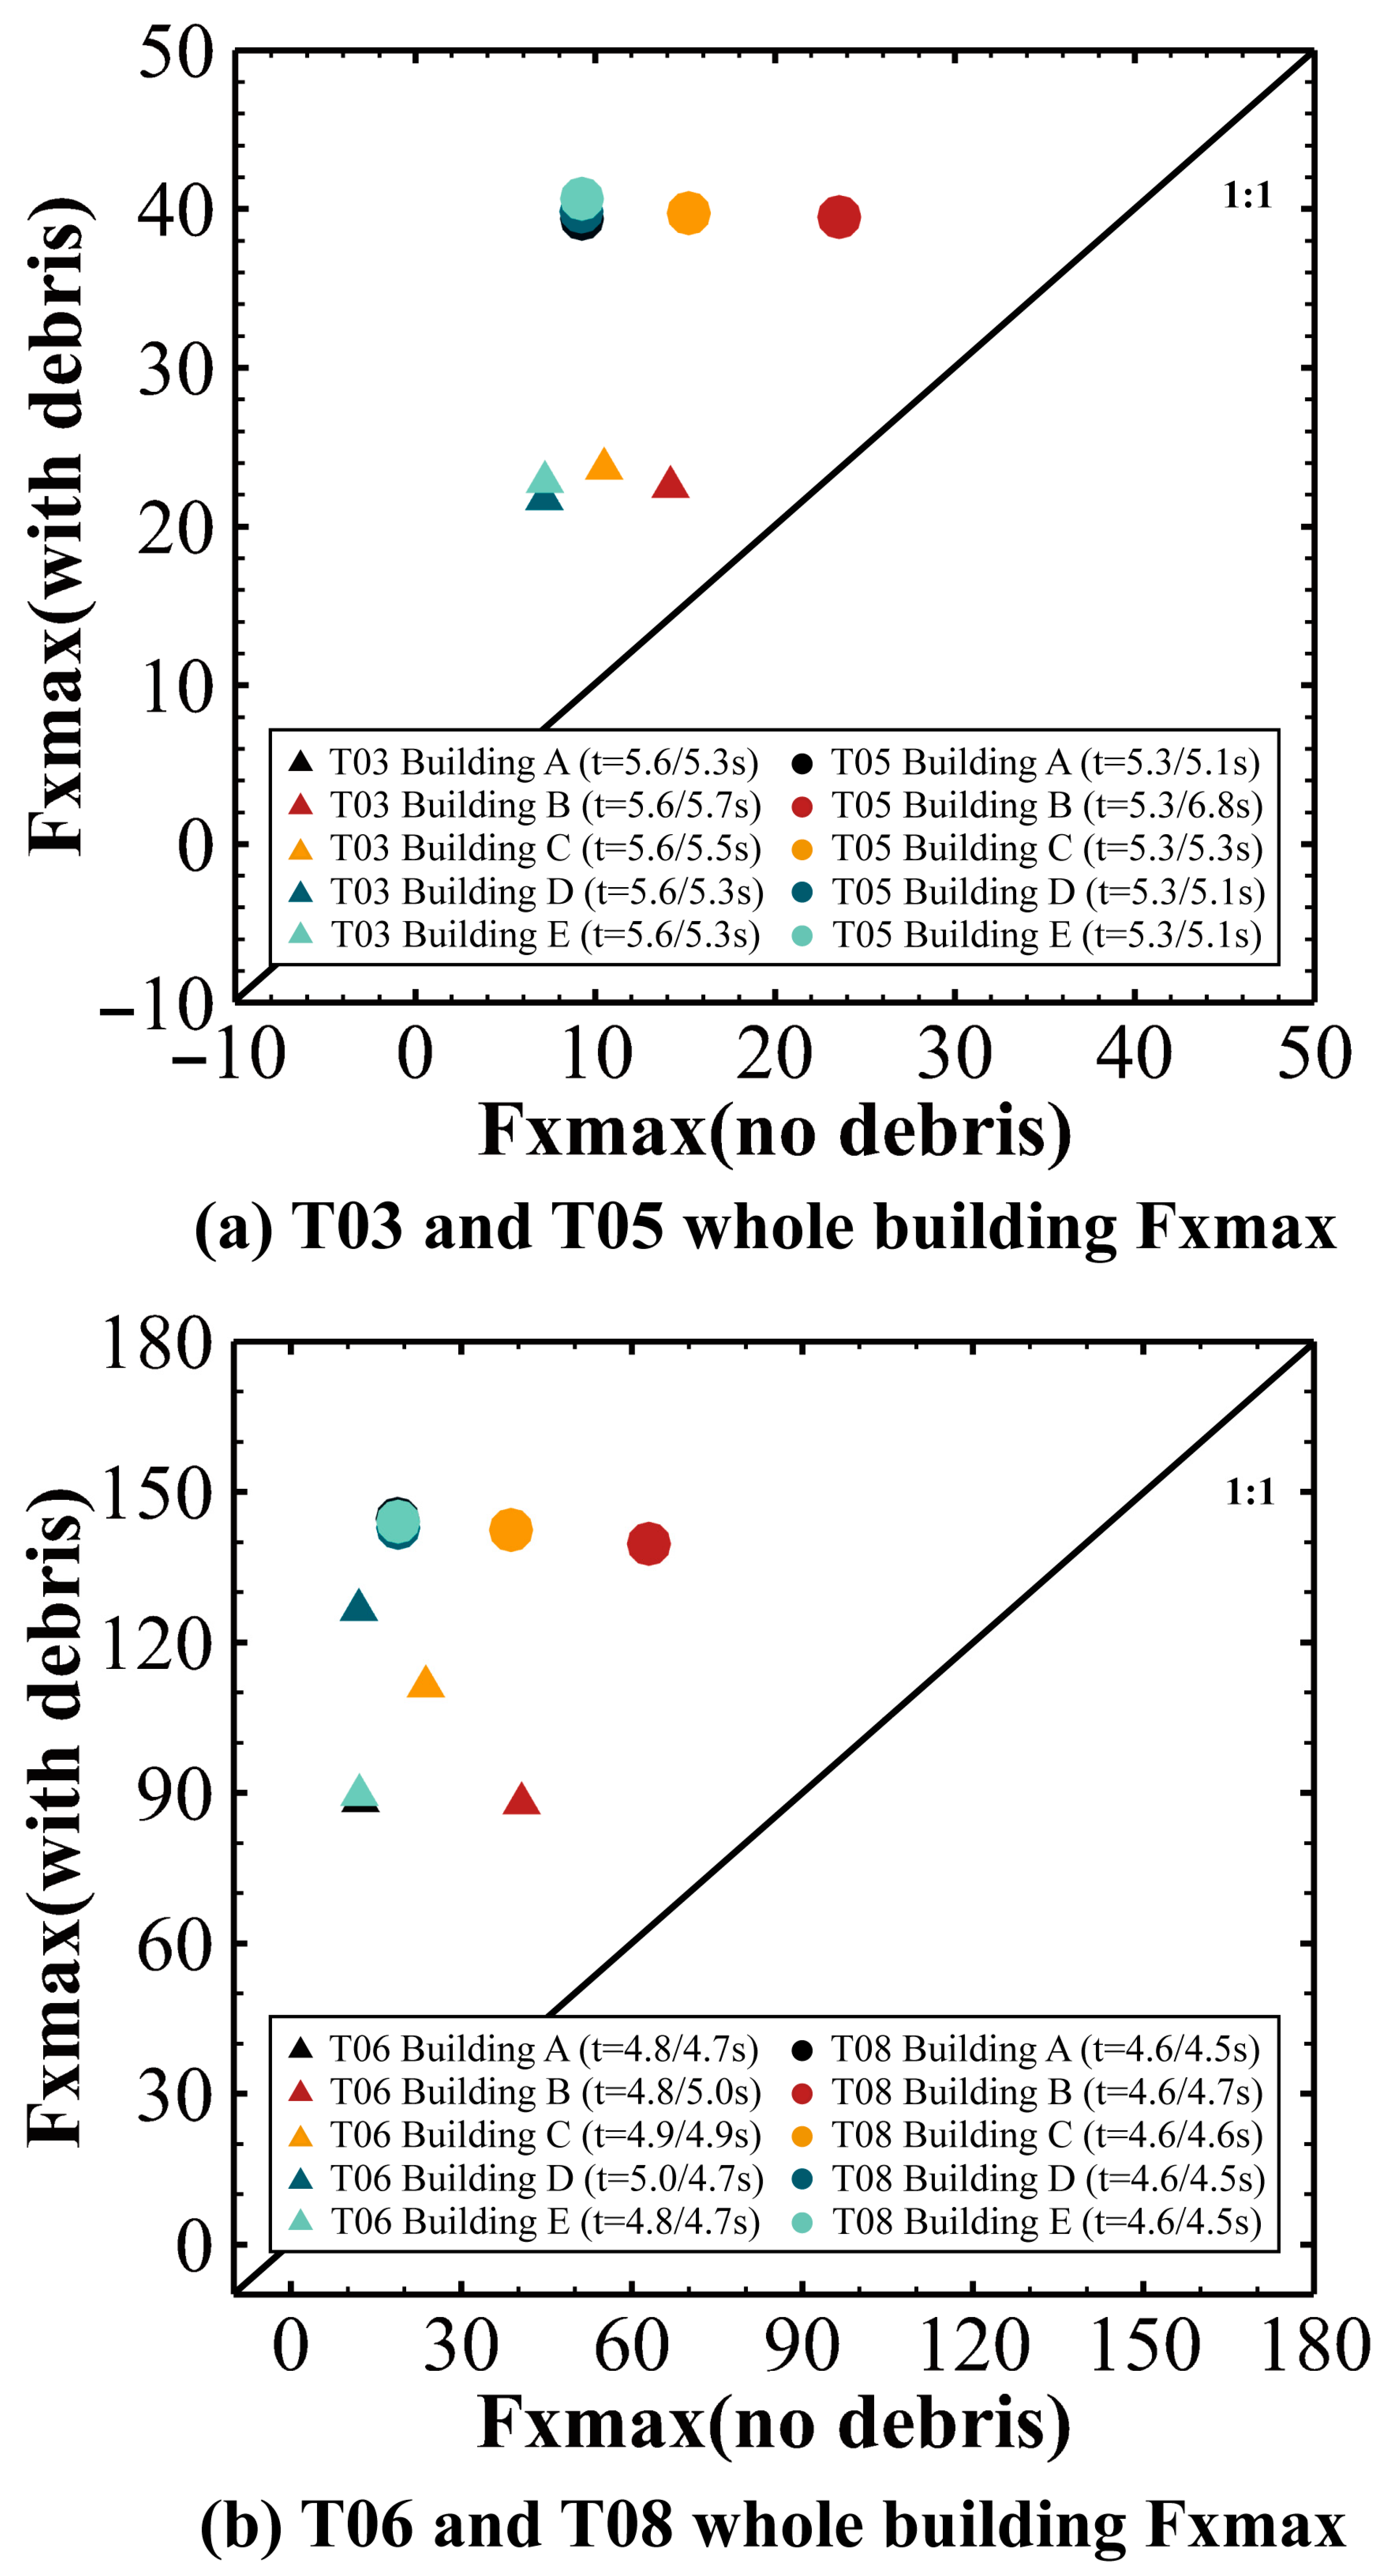
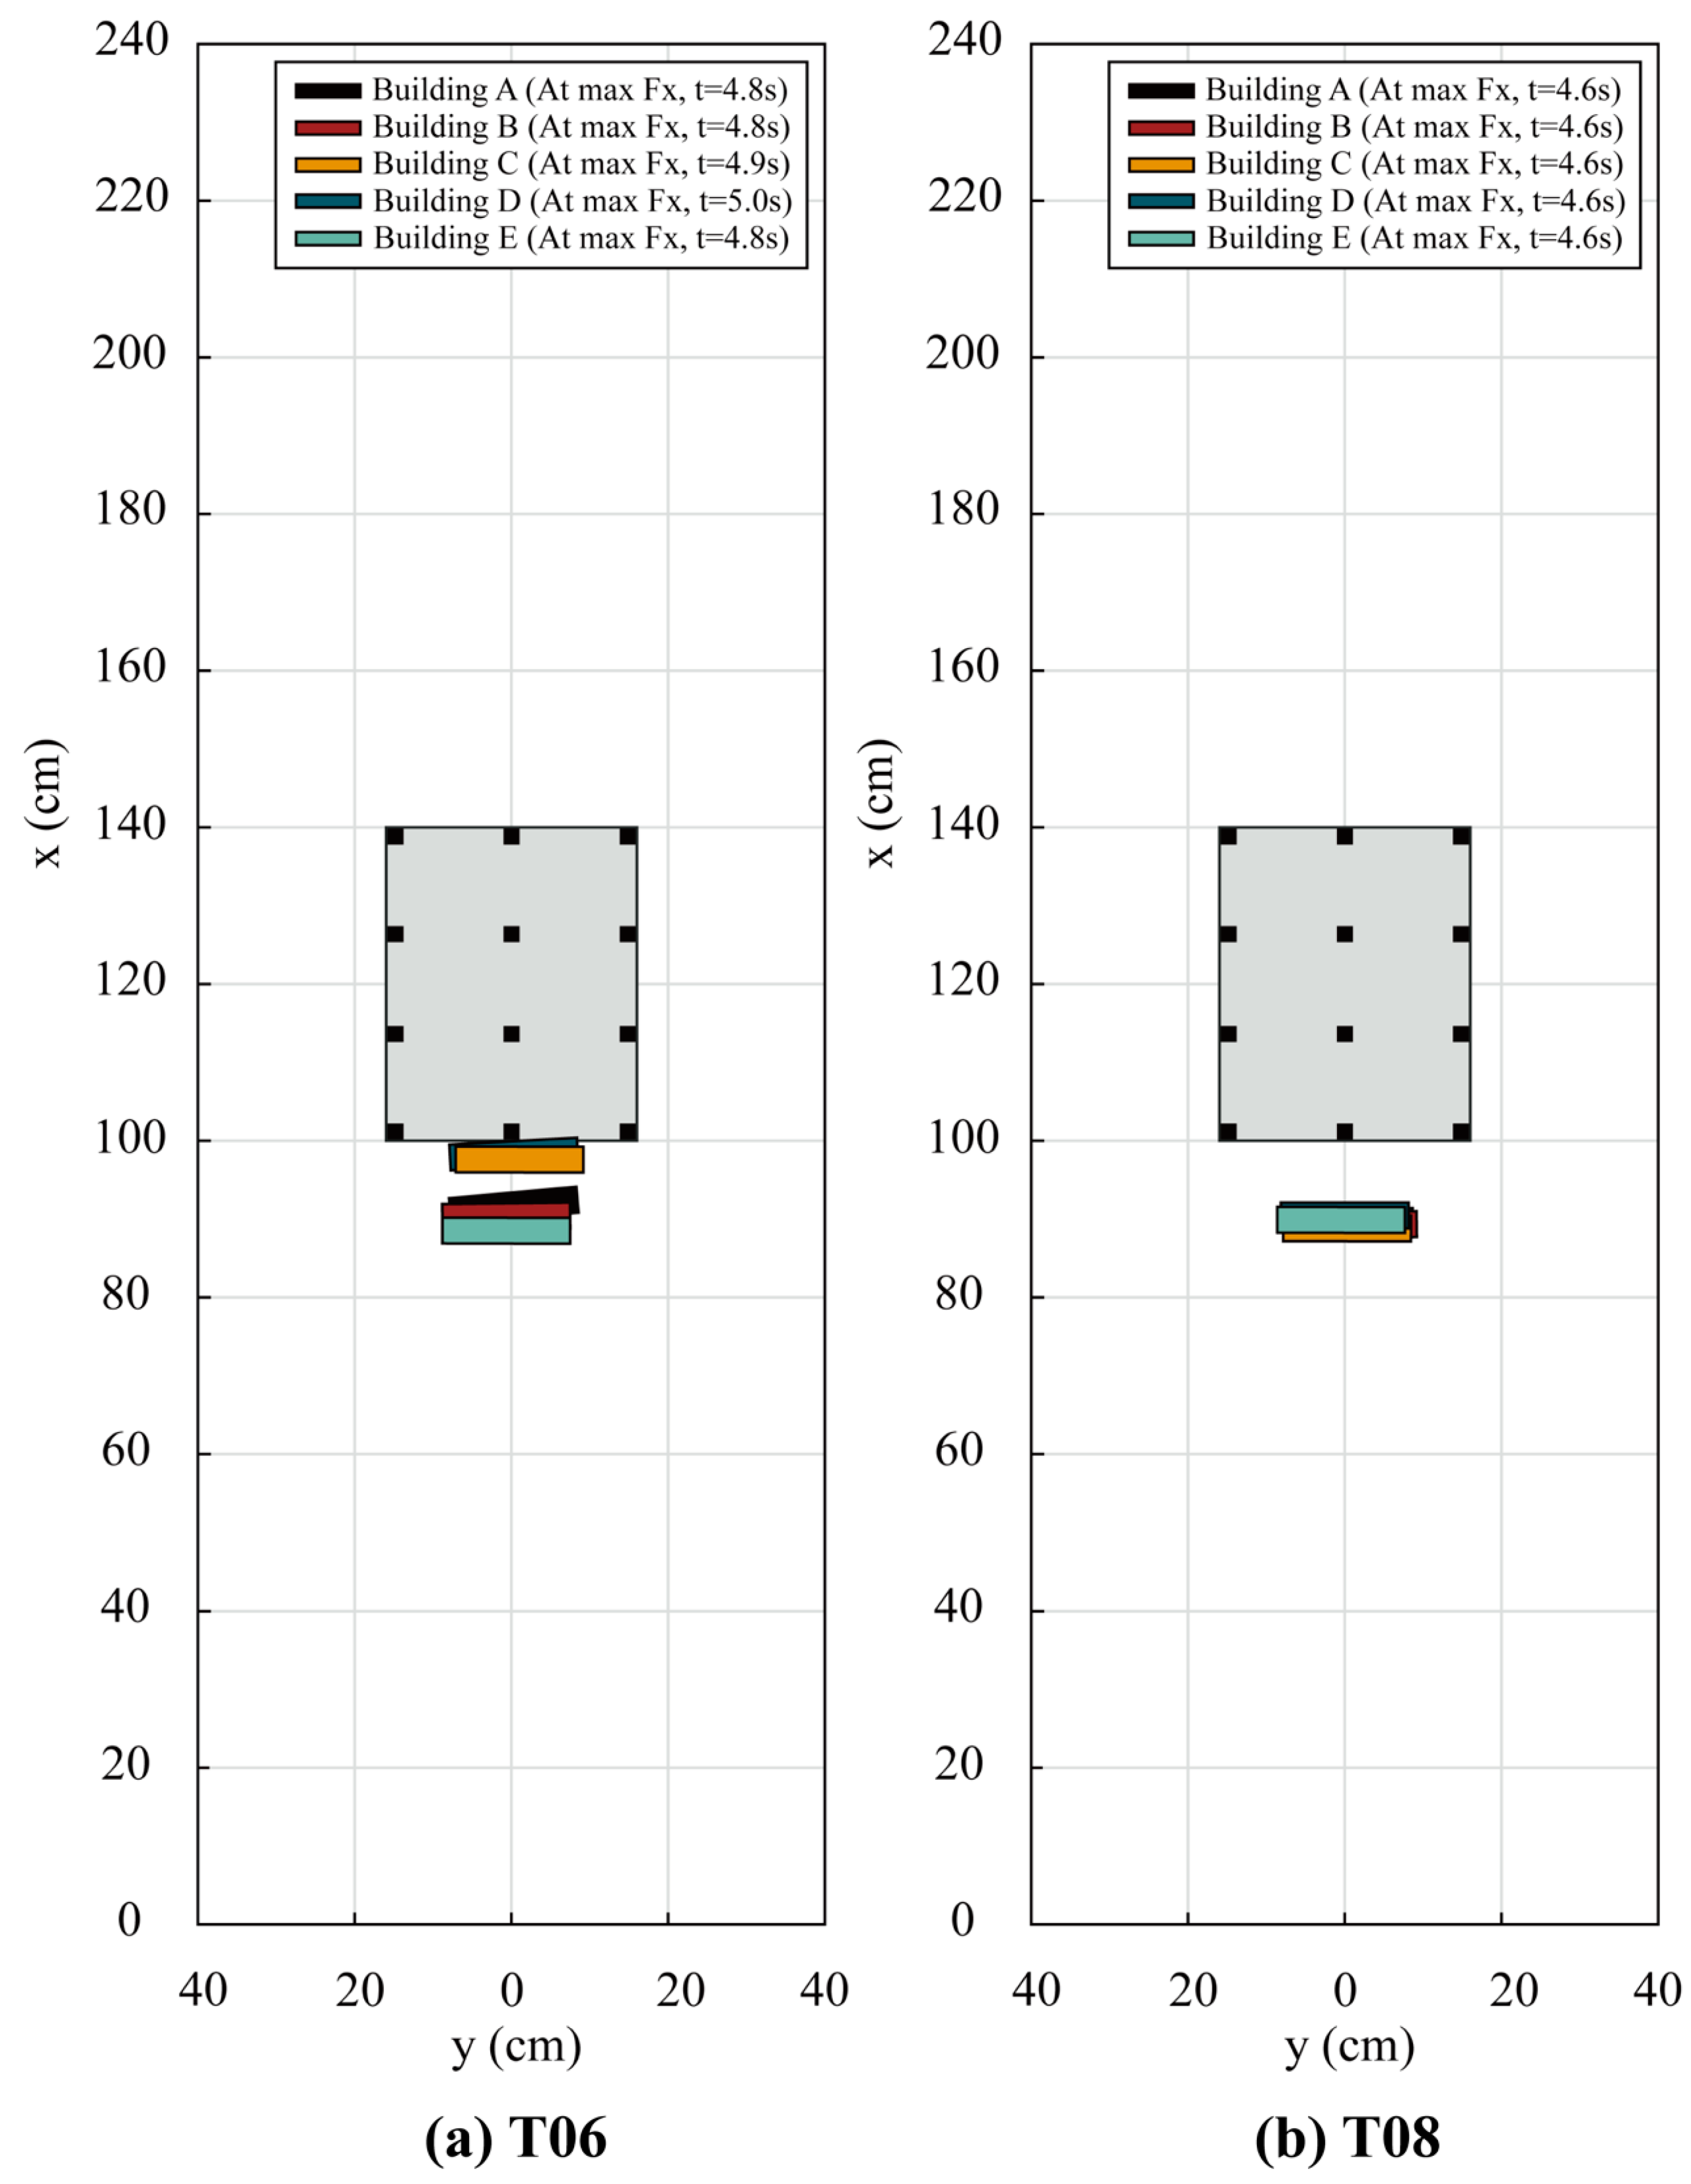
5.3. Effect Elements on Maximum Force Fxmax

Figure 22 shows the variation in the Fxmax acting on various whole-building models under different wave conditions (T03, T05, and T08), analyzed with and without debris. The results indicated that the presence of debris generally standardized the Fxmax across different building models. This indicated that the debris itself plays a significant role in modulating wave forces. Specifically, the Fxmax remained relatively consistent across all wave conditions when debris was present. Generally, in scenarios with debris, the Fxmax was consistently higher than in scenarios without debris. This increase in force can be attributed to the debris acting as an additional physical barrier disrupting the natural wave flow, causing an intensified splashing effect on the building surfaces. This effect was substantiated by the positional analysis shown in Figure 23b, where at the instant the Fxmax occurred, the debris was located in front of the buildings but not in contact. The splashing caused by debris obstruction led to higher wave forces impacting the buildings, elucidating why the Fxmax was largely independent of the building architecture in the presence of debris.
Notably, wave T06 was an exception, where the building type influenced the wave load in the presence of debris. As shown in Figure 23a, when the Fxmax occurred for Buildings C and D, the debris directly collided with the building, while the wave simultaneously splashed onto the building surfaces. This direct interaction resulted in a higher Fxmax for these buildings compared with the others, highlighting the complex interplay between structural features, debris, and wave dynamics.
In contrast, without debris, the building type significantly influenced the maximum wave load (Fxmax) on a building, reflecting a clear correlation between the structural characteristics and impact of the wave conditions. Buildings B and C, which featured interior walls perpendicular to the incoming waves, consistently exhibited higher Fxmax values than Buildings A, D, and E. These architectural features acted as internal barriers that modified the flow dynamics by concentrating the wave forces at specific points on the structure. This difference highlights the impact of the internal architectural elements on the distribution and magnitude of the wave-induced forces. Overall, the data demonstrated that the height of the incident wave primarily influenced Fxmax, whereas the correlation between the wave period and Fxmax was relatively weak.

6. Summary and Conclusions

This study explored the dynamic interactions among tsunamis, debris, and coastal building structures under extreme hydrodynamic conditions. Using the FS3M developed by Nakamura et al. [25], validated against physical experimental data [21], the impacts of varying wave conditions, debris distributions, and architectural configurations on the structural integrity and impact forces were investigated. This comparison was instrumental in refining the calibration process for FS3M, ensuring that it accurately reflected the complex dynamics observed in the physical experiments. The research methodology incorporated extensive data processing and analytical techniques to address the intricate movement patterns of debris and building flows during tsunami events. The key findings and contributions of this study are summarized as follows:
  • Larger Incident Waves and Fx Dependence on Wave Height
Larger incident waves generated higher normalized pressures and forces compared to smaller waves. Notably, higher waves reached the first floors of buildings, where their interaction with internal structures further amplified the normalized pressure and force. The results indicated that wave height was the primary factor influencing Fx, with internal wall configurations modulating the force distribution at specific regions of the buildings.
2.
Debris Influence on Fxmax and Pressure Distribution
The presence of debris significantly enhanced the peak normalized pressure, particularly when the debris became entrapped in the frontal sections of the buildings. This entrapment increased the localized velocities, intensifying the structural load. A comparative analysis revealed that Fxmax was consistently higher in scenarios with debris than in those without, underscoring the critical role of debris in modulating wave-induced forces. However, in the presence of debris, this correlation between wave forces and building type was diminished as debris obstruction altered wave impact dynamics, leading to more uniform force distributions across building types.
3.
Wave Period and Force Modulation
Longer wave periods, associated with prolonged-duration wave impacts, amplified the force exerted on structural elements. This effect was particularly pronounced in the presence of debris. Although the height of the incident wave primarily determined Fxmax, the correlation between the wave period and Fxmax remained weak. This highlights the role of wave height and debris interactions in determining the impact forces.
4.
Architectural Features and Flow Dynamics
Buildings B and C, with internal walls perpendicular to the wave approach, caused significant redistribution of flow energy, leading to localized increases in resultant velocity magnitudes near the walls. This effect was more influenced by the wall orientation than their length, as observed in Buildings D and E. The internal walls acted as secondary barriers, segmenting the flow and altering velocity magnitudes within the structures. In the presence of debris, the interaction intensified, further amplifying the resultant velocity near the internal walls, highlighting the critical role of internal architecture in modifying flow behavior and load distributions during extreme hydrodynamic events.
5.
Correlation Between Building Type and Fxmax in Debris-Free Scenarios
The building type significantly influenced the Fxmax in scenarios without debris, demonstrating a clear correlation between the structural characteristics and wave impact. For example, Buildings B and C, which featured internal walls perpendicular to the wave direction, consistently exhibited higher Fxmax values due to their ability to concentrate wave forces at specific locations. These results highlight the critical role of internal architectural features in modulating wave-induced forces in the absence of debris.
This study has limitations. Primarily, the experiments and numerical simulation were performed using scaled models, which may not fully capture the complexities inherent in full-scale dynamics. Moreover, the experimental setup included only a single building and container, thus restricting the investigation of more complex debris and structural interactions that might occur during an actual tsunami. To overcome these limitations, future studies should explore various debris configurations and multiple building models under different tsunami conditions. This requires expanded hydraulic testing and more sophisticated numerical simulations. Furthermore, developing and refining methods for estimating characteristic damage and formulating comprehensive assessment strategies will be essential to better reflect realistic conditions in coastal urban environments. Additionally, improving the computational accuracy of the FS3M remains a critical challenge, necessitating ongoing improvements to ensure its reliability in predicting the hydrodynamic impacts of tsunamis on coastal infrastructure.
Nonetheless, this study provides relevant insights into the interaction between marine forces and built environments, advancing knowledge in the field of marine structures. However, further investigations incorporating additional environmental conditions and structural variations are still required to refine the applicability of the results.

Author Contributions

Conceptualization, T.N.; methodology, Y.H. and T.N.; software, T.N.; validation, Y.H.; formal analysis, Y.H.; investigation, Y.H. and T.N.; resources, Y.H.; data curation, Y.H.; writing—original draft preparation, Y.H.; writing—review and editing, T.N., Y.-H.C., and N.M.; visualization, Y.H.; supervision, T.N.; project administration, T.N. All authors have read and agreed to the published version of the manuscript.

Funding

This research received no external funding.

Data Availability Statement

The original contributions presented in this study are included in the article. Further inquiries can be directed to the corresponding author.

Conflicts of Interest

The authors declare no conflicts of interest.

References

  1. Goff, J.R.; Dominey-Howes, D. Tsunami risk management in the aftermath of the 2004 Indian Ocean tsunami: Lessons learned. Nat. Hazards 2009, 52, 381–393. [Google Scholar]
  2. FEMA. Guidelines for Design of Structures for Vertical Evacuation from Tsunamis; Federal Emergency Management Agency: Washington, DC, USA, 2012.
  3. Mori, N.; Takahashi, T.; Yasuda, T.; Yanagisawa, H. Survey of 2011 Tohoku earthquake tsunami inundation and run-up. Geophys. Res. Lett. 2011, 38, L00G14. [Google Scholar] [CrossRef]
  4. Suppasri, A.; Koshimura, S.; Imai, K.; Mas, E.; Gokon, H.; Muhari, A.; Imamura, F. Damage characteristic and field survey of the 2011 Great East Japan tsunami in Miyagi prefecture. Coast. Eng. J. 2021, 54, 1250005-1–1250005-30. [Google Scholar] [CrossRef]
  5. Yeh, H.; Sato, S.; Tajima, Y. The 11 March 2011 East Japan earthquake and tsunami: Tsunami effects on coastal infrastructure and buildings. Pure Appl. Geophys. 2012, 170, 1019–1031. [Google Scholar] [CrossRef]
  6. Kennedy, A.; Rogers, S.; Sallenger, A.; Gravois, U.; Zachry, B.; Dosa, M.; Zarama, F. Building destruction from waves and surge on the Bolivar Peninsula during Hurricane Ike. J. Waterw. Port Coast. Ocean Eng. 2011, 137, 132–141. [Google Scholar] [CrossRef]
  7. Tomiczek, T.; Kennedy, A.; Rogers, S. Collapse limit state fragilities of wood-framed residences from storm surge and waves during Hurricane Ike. J. Waterw. Port Coast. Ocean Eng. 2014, 140, 43–55. [Google Scholar] [CrossRef]
  8. Xian, S.; Lin, N.; Hatzikyriakou, A. Storm surge damage to residential areas: A quantitative analysis for Hurricane Sandy in comparison with FEMA Flood Map. Nat. Hazards 2015, 79, 1867–1888. [Google Scholar] [CrossRef]
  9. Hatzikyriakou, A.; Lin, N.; Gong, J.; Xian, S.; Hu, X.; Kennedy, A. Component-based vulnerability analysis for residential structures subjected to storm surge impact from Hurricane Sandy. Nat. Hazards Rev. 2016, 17, 05015005. [Google Scholar] [CrossRef]
  10. Hatzikyriakou, A.; Lin, N. Assessing the vulnerability of structures and residential communities to storm surge: An analysis of flood impact during Hurricane Sandy. Front. Built Environ. 2018, 4, 4. [Google Scholar] [CrossRef]
  11. Mizutani, N.; Aoki, S.; Manawasekara, C.; Nakamura, T. Effect of space configuration of building on Tsunami Force on it. In Proceedings of the 34th Conference on Coastal Engineering, Seoul, Republic of Korea, 15–20 June 2014. [Google Scholar]
  12. Shafiei, S.; Melville, B.W.; Shamseldin, A.Y. Experimental investigation of tsunami bore impact force and pressure on a square prism. Coast. Eng. 2016, 110, 1–16. [Google Scholar] [CrossRef]
  13. Wüthrich, D.; Pfister, M.; Nistor, I.; Schleiss, A.J. Experimental study on the hydrodynamic impact of tsunami-like waves against impervious free-standing buildings. Coast. Eng. J. 2018, 60, 180–199. [Google Scholar] [CrossRef]
  14. Thusyanthan, N.I.; Madabhushi, S.P.G. Tsunami wave loading on coastal houses: A model approach. Proc. Inst. Civ. Eng.-Civ. Eng. 2008, 161, 77–86. [Google Scholar] [CrossRef]
  15. Wilson, J.S.; Gupta, R.; van de Lindt, J.W.; Clauson, M.; Garcia, R. Behavior of a one-sixth scale wood-framed residential structure under wave loading. J. Perform. Constr. Facil. 2009, 23, 336–345. [Google Scholar] [CrossRef]
  16. Moon, W.C.; Puay, H.T.; Lau, T.L. Investigations on the effect of roof types on wave impinging on a building: A hybrid experimental-numerical approach. Coast. Eng. 2021, 164, 103836. [Google Scholar] [CrossRef]
  17. Moon, W.C.; Lau, T.L.; Puay, H.T. Experimental investigations of tsunami loading on internal wall of a building with various openings and wall configurations. Coast. Eng. 2020, 158, 103691. [Google Scholar] [CrossRef]
  18. Naito, C.; Cercone, C.; Riggs, H.R.; Cox, D. Procedure for site assessment of the potential for Tsunami Debris Impact. J. Waterw. Port Coast. Ocean Eng. 2014, 140, 223–232. [Google Scholar] [CrossRef]
  19. Yeh, H.; Barbosa, A.; Mason, B.H. Tsunamis effects in man-made environment. In Complexity in Tsunamis, Volcanoes, and Their Hazards; Springer: New York, NY, USA, 2021; pp. 187–211. [Google Scholar]
  20. Ayca, A.; Lynett, P.J. Modeling the motion of large vessels due to tsunami-induced currents. Ocean Eng. 2021, 236, 109487. [Google Scholar] [CrossRef]
  21. Lee, K.; Aoki, S.; Mizutani, N.; Ashizawa, S.; Hirakawa, S. A study on tsunami force acting on buildings and the effects of buildings with openings on tsunami loads. J. Jpn. Soc. Civ. Eng. 2012, 68, I_234–I_239. [Google Scholar]
  22. Abbe, T.B.; David, R.M. Patterns and Processes of Wood Debris Accumulation in the Queets River Basin, Washington. Geomorphology 2003, 51, 81–107. [Google Scholar] [CrossRef]
  23. Burke, J. Structural Testing of a 1:6 Scaled, Light-Frame Construction, Near-Coastal Residential Structure. Master’s Thesis, Oregon State University, Corvallis, OR, USA, 2018. [Google Scholar]
  24. FEMA. Determining site-specific loads. In Coastal Construction Manual; FEMA: Washington, DC, USA, 2011; pp. 5–27. [Google Scholar]
  25. Nakamura, T.; Mizutani, N. Development of fluid-sediment-seabed interaction model and its application. In Proceedings of the 34th Conference on Coastal Engineering, Seoul, Republic of Korea, 15–20 June 2014. [Google Scholar]
  26. Kunugi, T. MARS for multiphase calculation. Comput. Fluid Dyn. J. 2001, 9, 563–571. [Google Scholar]
  27. Kajishima, T.; Takiguchi, S.; Hamasaki, H.; Miyake, Y. Turbulence structure of particle-laden flow in a vertical plane channel due to vortex shedding. JSME Int. J. Ser. B 2001, 44, 526–535. [Google Scholar] [CrossRef]
  28. Mizutani, N.; McDougal, W.G.; Mostafa, A.M. Bem-FEM combined analysis of nonlinear interaction between wave and submerged breakwater. In Coastal Engineering 1996; American Society of Civil Engineers: Reston, VA, USA, 1996; pp. 2377–2390. [Google Scholar]
  29. Brackbill, J.U.; Kothe, D.B.; Zemach, C. A continuum method for modeling surface tension. J. Comput. Phys. 1992, 100, 335–354. [Google Scholar] [CrossRef]
  30. Kobayashi, H. The subgrid-scale models based on coherent structures for rotating homogeneous turbulence and turbulent channel flow. Phys. Fluids 2005, 17, 045104. [Google Scholar] [CrossRef]
  31. Iwata, K.; Kawasaki, K.; Kim, D.S. Numerical analysis of wave breaking due to submerged structures. Proc. Coast. Eng. JSCE 1995, 42, 781–785. [Google Scholar]
  32. Hou, Y.; Nakamura, T.; Cho, Y.H.; Mizutani, N.; Tomita, T. Influence of tsunami-driven shipping containers’ layout on their motion. J. Mar. Sci. Eng. 2022, 10, 1911. [Google Scholar] [CrossRef]
  33. Small, C.; Blanpied, T.; Kauffman, A.; O’Neil, C.; Proulx, N.; Rajacich, M.; Simpson, H.; White, J.; Spaulding, M.; Baxter, C.; et al. Assessment of damage and adaptation strategies for structures and infrastructure from storm surge and sea level rise for a coastal community in Rhode Island, United States. J. Mar. Sci. Eng. 2016, 4, 67. [Google Scholar] [CrossRef]
  34. Derschum, C.; Nistor, I.; Stolle, J.; Goseberg, N. Debris impact under extreme hydrodynamic conditions part 1: Hydrodynamics and impact geometry. Coast. Eng. 2018, 141, 24–35. [Google Scholar] [CrossRef]
  35. Duncan, S.; Cox, D.; Barbosa, A.R.; Lomónaco, P.; Park, H.; Alam, M.S.; Yu, C. Physical modeling of progressive damage and failure of wood-frame coastal residential structures due to surge and wave forces. Coast. Eng. 2021, 169, 103959. [Google Scholar] [CrossRef]
  36. Borrero, J.C.; Sieh, K.; Chlieh, M.; Synolakis, C.E. Tsunami inundation modeling for Western Sumatra. Proc. Natl. Acad. Sci. USA 2006, 103, 19673–19677. [Google Scholar] [CrossRef]
  37. Fritz, H.M.; Phillips, D.A.; Okayasu, A.; Shimozono, T.; Liu, H.; Mohammed, F.; Skanavis, V.; Synolakis, C.E.; Takahashi, T. The 2011 Japan tsunami current velocity measurements from survivor videos at Kesennuma Bay Using Lidar. Geophys. Res. Lett. 2012, 39, L00G23. [Google Scholar] [CrossRef]
  38. Takahashi, S.; Sugano, T.; Tomita, T.; Arikawa, T.; Tatsumi, D.; Kashima, H.; Murata, S.; Matsuoka, Y.; Nakamura, T. Joint Survey for 2010 Chilean Earthquake and Tsunami Disaster in Ports and Coasts; Port and Airport Research Institute: Kurihama, Japan, 2010.
  39. Roeber, V.; Yamazaki, Y.; Cheung, K.F. Resonance and impact of the 2009 Samoa tsunami around Tutuila, American Samoa. Geophys. Res. Lett. 2010, 37, 1–9. [Google Scholar] [CrossRef]
Figure 1. Schematic of the wave basin setup and instrumentation: (a) plan view; (b) profile view.
Jmse 13 00513 g001
Figure 2. Details of hydraulic experimental Building A.
Jmse 13 00513 g002
Figure 3. Schematic diagram of numerical model setup: (a) plan view; (b) profile view.
Jmse 13 00513 g003
Figure 4. Pressure gauge locations in Building A—numerical simulation details.
Jmse 13 00513 g004
Figure 5. Pressure gauge locations in Building B—numerical simulation details.
Jmse 13 00513 g005
Figure 6. Pressure gauge locations in Building C—numerical simulation details.
Jmse 13 00513 g006
Figure 7. Pressure gauge locations in Building D—numerical simulation details.
Jmse 13 00513 g007
Figure 8. Pressure gauge locations in Building E—numerical simulation details.
Jmse 13 00513 g008
Figure 9. Dimensions of individual debris block.
Jmse 13 00513 g009
Figure 10. Comparison of h simulated by the FS3M and experimental data reported by Lee et al. [21].
Jmse 13 00513 g010
Figure 11. Comparison of p loads simulated by the FS3M and experimental data reported by Lee et al. [21].
Jmse 13 00513 g011
Figure 12. Time histories of numerical model results of h for the solitary wave conditions, T01 and T02.
Jmse 13 00513 g012
Figure 13. Time histories of numerical model results of horizontal (u) and vertical (w) wave velocities for the solitary wave conditions, T01 and T02.
Jmse 13 00513 g013
Figure 14. Time histories of numerical model results of p of the specimen for the solitary wave conditions, T01 and T02.
Jmse 13 00513 g014
Figure 15. Time histories of numerical model results of h for the long-period wave conditions, T03, T05, T06, and T08.
Jmse 13 00513 g015
Figure 16. (a) Time histories of numerical model results of horizontal (u) wave velocities for the long-period wave conditions, T03, T05, T06, and T08. (b) Time histories of numerical model results of vertical (w) wave velocities for the long-period wave conditions, T03, T05, T06, and T08.
Jmse 13 00513 g016aJmse 13 00513 g016b
Figure 17. Time histories of numerical model results of p of the specimen for the long-period wave conditions, T03, T05, T06, and T08.
Jmse 13 00513 g017
Figure 18. Vertical distribution of normalized maximum front face pressure.
Jmse 13 00513 g018
Figure 19. Maximum normalized pressure distribution for different wave types in numerical simulation cases (a) without debris and (b) with debris.
Jmse 13 00513 g019
Figure 20. Instantaneous resultant velocity distribution on wave T02 for different building models.
Jmse 13 00513 g020
Figure 21. Instantaneous resultant velocity distribution on wave T08 for different building models.
Jmse 13 00513 g021
Figure 22. Variation in Fxmax under different wave conditions for various building models (a) with debris and (b) without debris.
Jmse 13 00513 g022
Figure 23. Debris locations under wave conditions T06 and T08 for various building models.
Jmse 13 00513 g023
Table 1. Water levels, input wave conditions, and breaking type for all tested hydrodynamic properties.
Case NumberWater Depth (m)Wave Height (m)Wave Period (s)Test Duration (s)Wave Type
T010.320.064N/A10Solitary wave
T020.320.16N/A10Solitary wave
T030.320.128610Long-period wave
T040.320.128810Long-period wave
T050.320.1281410Long-period wave
T060.320.192610Long-period wave
T070.320.192810Long-period wave
T080.320.1921410Long-period wave
Disclaimer/Publisher’s Note: The statements, opinions and data contained in all publications are solely those of the individual author(s) and contributor(s) and not of MDPI and/or the editor(s). MDPI and/or the editor(s) disclaim responsibility for any injury to people or property resulting from any ideas, methods, instructions or products referred to in the content.

