1. Introduction
The fourth Industrial Revolution has catalyzed significant advancements in maritime and port logistics, fostering the development of the ‘Smart Maritime Logistics System’. This integrates automation and intelligent processes to optimize logistics efficiency and mitigate human error-related accidents [
1,
2,
3]. A critical area of focus is the automation of mooring operations, which remain a bottleneck in achieving fully autonomous ship–port interfaces despite progress in unmanned ships (MASS) and smart ports [
4,
5,
6].
Furthermore, smart ports aim for complete automation across all areas, from the quay to the yard. To facilitate this, the Internet of Things (IoT) technologies have been implemented within the ports, enabling optimal operational integration between ports and ships [
7]. Such systems simplify the sharing of cargo information during transportation, easing the handling of heavy loads, and increasing operational efficiency through the automation of terminals using robotics and artificial intelligence [
8]. Additionally, from an environmental perspective, the use of onshore power supply systems is being promoted to reduce particulate emissions when ships are docked at port [
9].
Traditional mooring with ropes, while reliable, demands extensive manual labor and is prone to accidents, with the IMO reporting persistent safety incidents despite regulatory efforts [
10,
11]. In pursuit of maritime and port automation, there is a growing need to automate mooring procedures. Among the various methods, automatic mooring systems using vacuum pads are regarded as essential for future operations, where unmanned ships and smart ports will be interconnected [
12,
13,
14,
15]. One of the primary considerations in designing modern automatic mooring systems is ensuring both efficiency and safety for large vessels. Traditional mooring ropes, while widely used, require significant manual labor and extended mooring times. Electromagnetic mooring, on the other hand, can be highly effective for smaller ships and ferries but may pose certain limitations in large-scale applications, such as higher installation costs and potential constraints related to ship hull material or electrical infrastructure. In contrast, vacuum pads do not depend on the vessel’s hull material properties and often exhibit lower maintenance and operational costs. By creating a strong seal against the hull surface, vacuum pads minimize the need for excessive human intervention and reduce the possibility of mooring line accidents, thus offering a promising alternative for large vessel mooring. Vacuum pads create suction by lowering internal pressure; greater pressure reduction or larger pad areas enable higher holding forces. Automatic mooring systems with vacuum suction capacities of up to 200 kN, pioneered by companies such as Cavotec (Lugano, Switzerland) and Trelleborg in Sweden, offer a promising solution by securing vessels using suction power without relying on hull configuration [
16,
17,
18]. However, the literature lacks standardized evaluation protocols for vacuum suction pads under realistic conditions.
However, specific test procedures or evaluation criteria have not been disclosed. Most vacuum pad performance tests so far have referred to industrial standards such as ASME B30.20 [
19] or partially borrowed experimental methods from earlier studies [
19,
20,
21]. Recent attempts to evaluate a 200 kN-class vacuum pad under static and dynamic loads and investigate suction performance across different surface roughness conditions have been made, but these did not fully replicate real hull surfaces (e.g., welds, coatings), which can significantly affect suction performance [
20,
22,
23,
24]. Because actual surface conditions in shipbuilding and yard environments can directly impact vacuum pad effectiveness, establishing test procedures that account for these factors is critically important prior to adopting automated mooring systems.
In this study, we used a 200 kN-class vacuum pad and associated test apparatus developed to devise test procedures under conditions reflecting real hull surfaces (including welds and coatings). The 200 kN vacuum pad used in this study was designed for ships weighing approximately 6000 tons, and was designed to accommodate larger ships by applying multiple pads in parallel when necessary. The test apparatus can apply both vacuum pressure and mechanical loads, and was designed to record raw data such as suction force and vacuum pressure. Additionally, standard shipbuilding specifications were incorporated to define test conditions (vacuum pressure, load magnitude, duration, etc.), as well as to establish evaluation items and criteria. Through these measures, we examined whether the vacuum pad could reach its maximum suction force on surfaces with varying roughness, and we monitored changes in vacuum pressure under realistic operating conditions. This approach aimed to assess the practical feasibility of vacuum pads for automated mooring.
The remainder of this paper is organized as follows:
Section 2 explains the experimental setup and materials,
Section 3 presents the methodological framework,
Section 4 discusses the results in conjunction with recent publications, and
Section 5 concludes the study with future research recommendations.
2. Test Setup
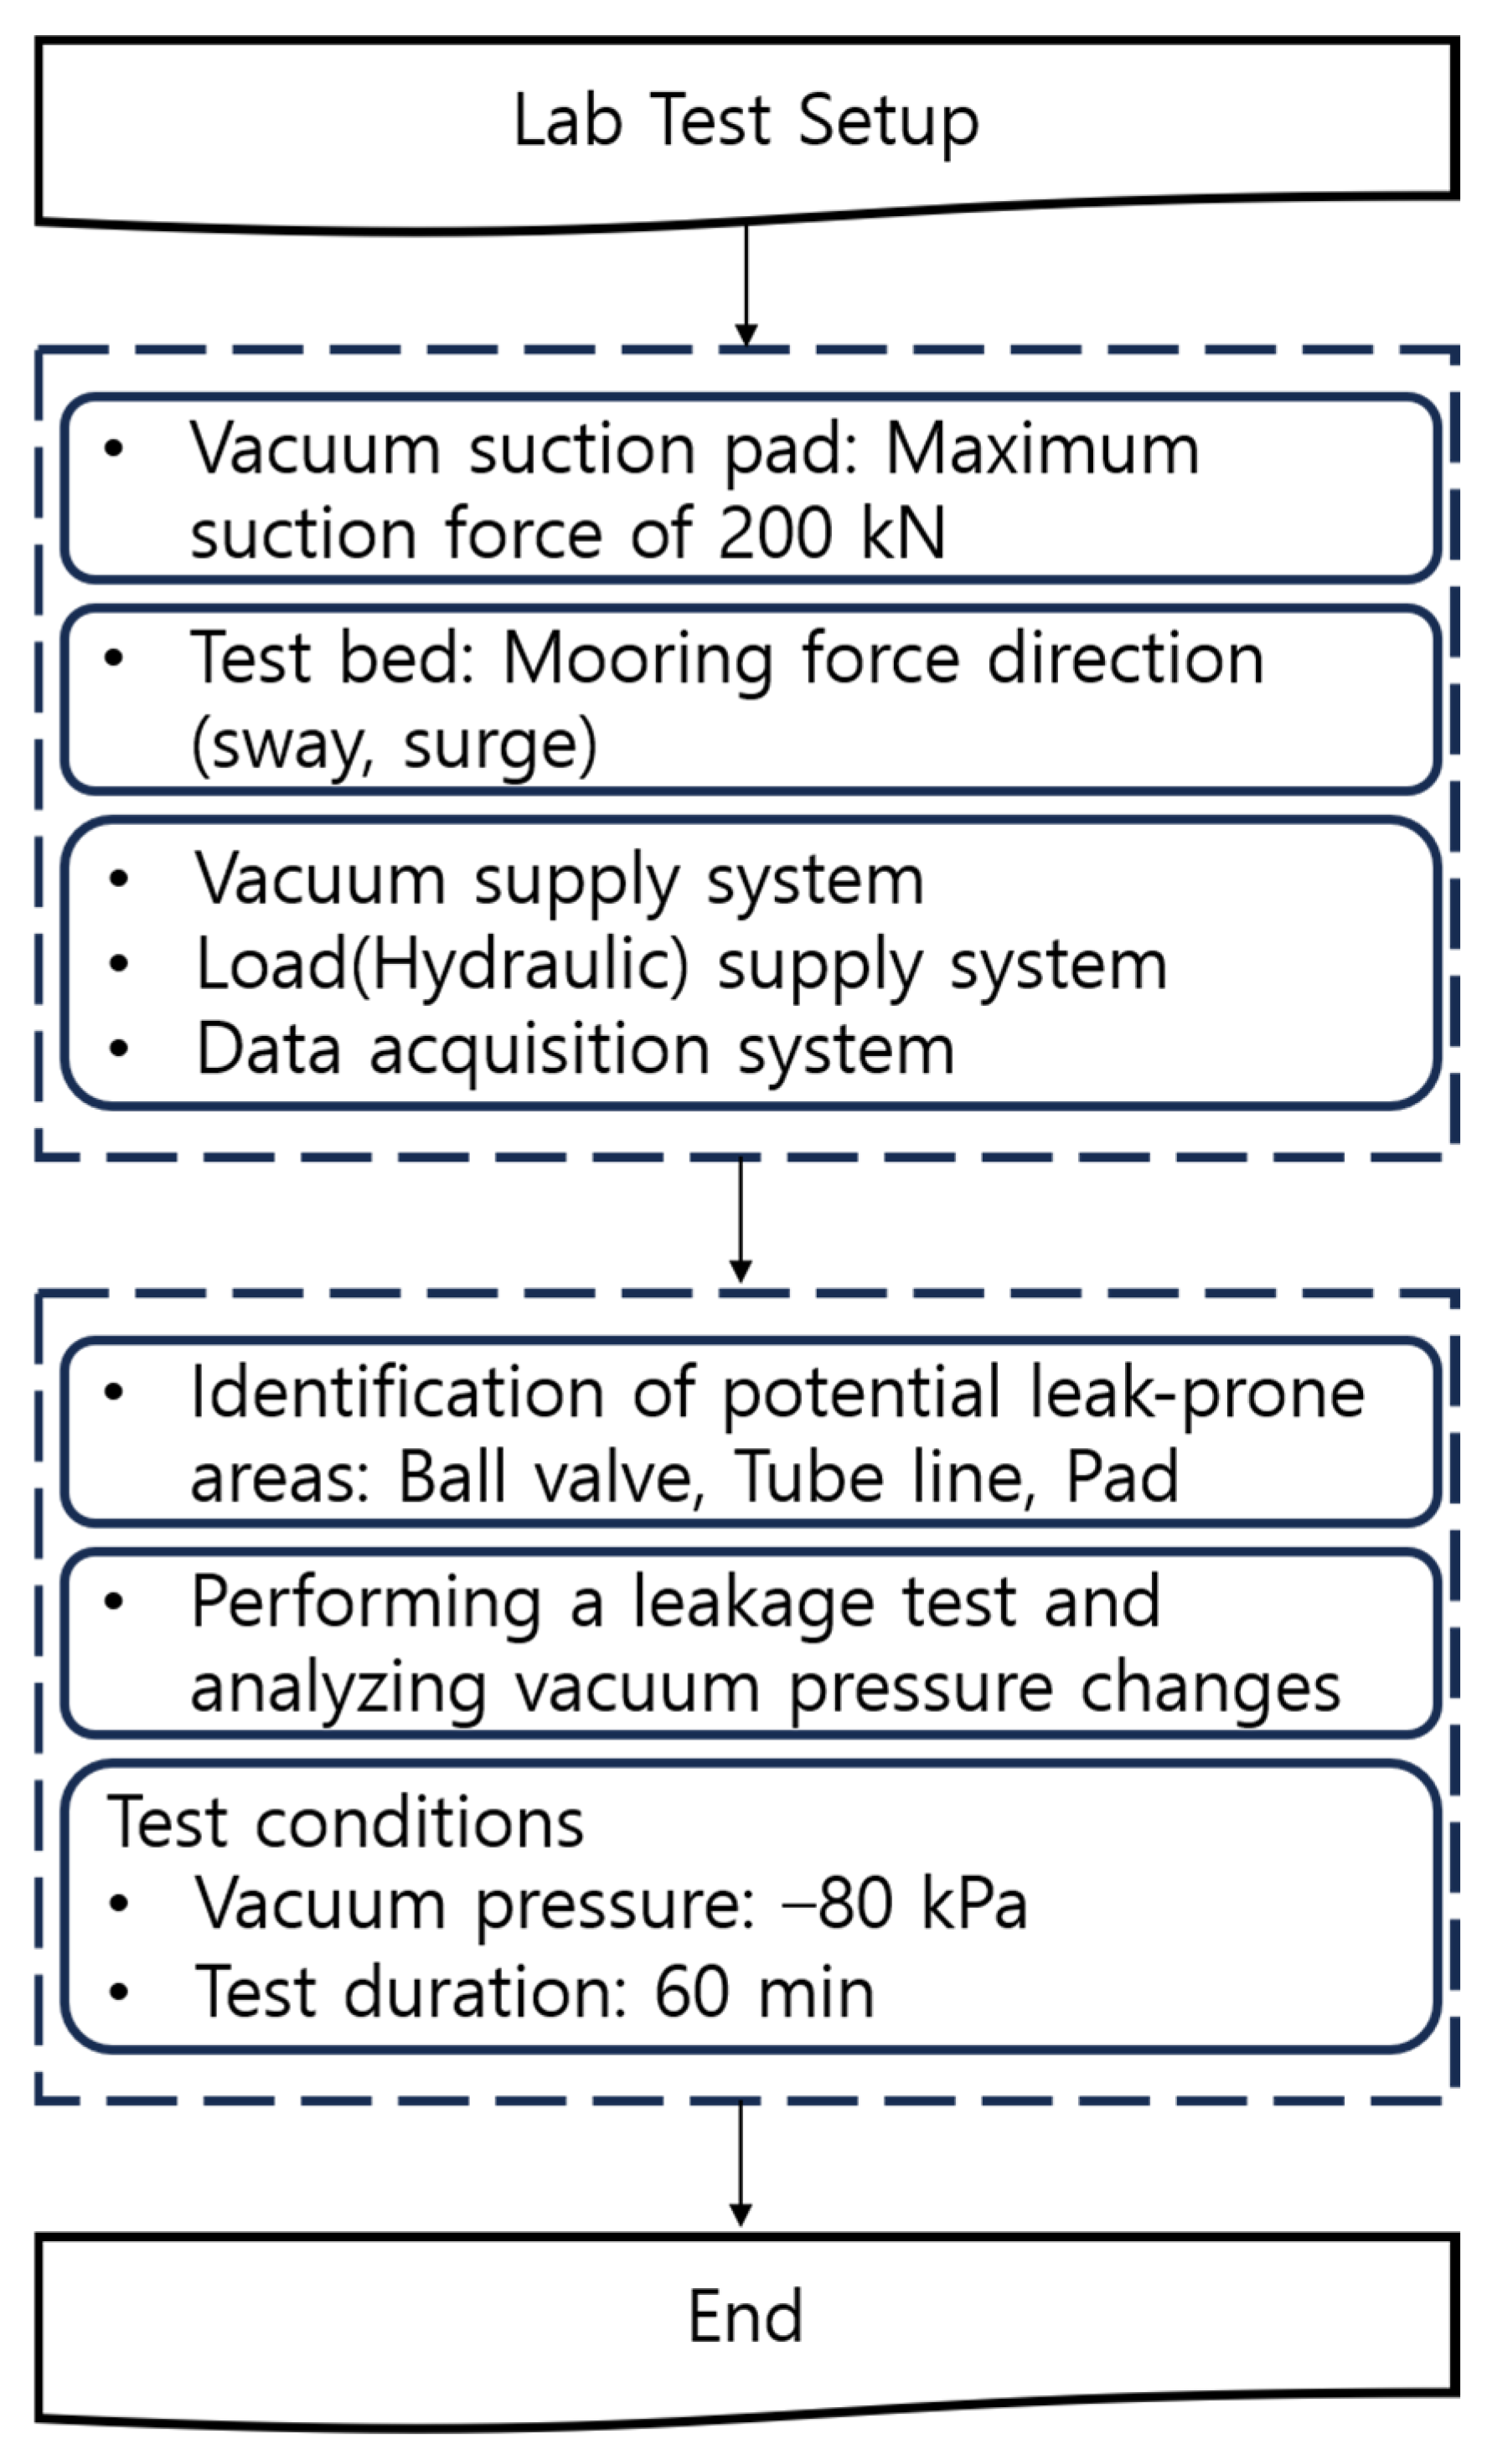
Figure 1 shows the overall test sequence in a flowchart format.
A vacuum suction pad with a 200 kN maximum suction force was designed, along with an indoor test bed for applying mooring forces (sway, surge). A vacuum and load supply system was implemented, and its operating mechanisms were analyzed for performance evaluation. Additionally, a data acquisition system was developed for preprocessing vacuum and load data. To ensure reliable evaluation, potential vacuum leakage points in the suction pad and test bed were identified and monitored using pressure sensors.
The mooring device currently under development is shown in
Figure 2, and the mooring device is rigidly mounted to the dock using anchor bolts embedded in the concrete surface. This ensures stability during mooring operations but also means that lateral forces may play a significant role in real-world applications.
2.1. Vacuum Suction Pad
The vacuum suction pad under evaluation is designed for a maximum suction force of 200 kN. Son et al. found that at −80 kPa, the seal height decreased to 36 mm, with a lip contact length of 60 mm, defining the effective suction area. Based on Cavotec’s MoorMaster
TM specifications (1910 mm × 1400 mm), a pad was designed (1950 mm × 1380 mm × 75 mm) using CR (Chloroprene Rubber) in an arch shape [
21]. While our pad’s seal height is set at 75 mm to achieve the required suction force, comparable data for Cavotec’s MoorMaster were unavailable in the reviewed sources, limiting direct comparisons. A comparison of effective (2.64 m
2) and contact suction areas (2.27 m
2) showed that this study’s pad achieved a 3.5% superior suction performance than Cavotec’s (
Figure 3,
Table 1).
The vacuum pad used in this study measures 1950 mm × 1380 mm × 75 mm, with an effective surface area of approximately 2.64 m
2 (the outer lip boundary) and a suction contact area of about 2.27 m
2 (actual seal contact region). When a vacuum of −80 kPa is applied inside the pad, the atmospheric pressure (~101.325 kPa) acts on the pad exterior, creating a pressure difference Δ
P. This difference multiplied by the suction area (
A) generates the holding force FFF, which can be expressed by the simplified equation:
For instance, with ΔP = 80 kPa and A= 2.27 m2, the theoretical suction force of this pad can reach about 181.6 kN. If we consider the slightly larger effective area (2.64 m2), it can generate up to around 211.2 kN under the same vacuum condition. In practice, this robust holding capability allows for reliable automated mooring of mid- to large-sized vessels, as the atmospheric pressure naturally keeps the pad tightly sealed against the hull surface once the internal pressure is lowered.
2.2. Test Bed
An indoor test bed was constructed to evaluate the vacuum suction pad’s performance under longitudinal (surge) and lateral (sway) mooring forces. Measuring 2510 mm × 1900 mm × 1620 mm (
Figure 4), it assesses suction performance in both directions. The jig, secured with a cross shaft and bolting fixtures, allows for ±10° rotational adjustments to simulate ship movements. A 16 mm thick steel plate, commonly used in shipbuilding, was installed to replicate hull contact conditions.
The test bed utilizes a DVP LC12 oil rotary pump (14 m
3/h) to generate a vacuum of −80 kPa. Despite requiring regular oil replacement and being moisture-sensitive, it is cost-effective for performance testing. The system connects the pump to a ball valve and pipes it to the pad’s upper frame (
Figure 5). It includes a vacuum switch, solenoid valve for remote control, and a manual ball valve for backup. A pressure sensor (MS-P200) detects air leaks, and a lever is installed on the pad’s piping for operation.
The test bed features a hydraulic system capable of applying up to 200 kN, consisting of a hydraulic pump (THPA 1C in Daejin Hydraulic Machinery, Busan, Republic of Korea), cylinder (TSSC 5050 in Daejin Hydraulic Machinery, Busan, Republic of Korea), and load cell (CSCK-30T, Bongshin Loadcell Co. Ltd./Seoul, South Korea) (
Figure 6). The pump supplies air to the cylinder, moving the suction pad into contact with the load cell for measurement. The manual hydraulic pump operates at 3.0 cc/cycle, with the cylinder and load cell handling up to 500 kN and 300 kN, respectively.
Performance evaluation was conducted by collecting load and vacuum pressure data. Pressure sensors and load cells were linked to indicators (BS 201, SM-210N) and a data acquisition module (NI USB-6363 in Austin, TX, USA), sampling at 100 Hz to minimize noise.
Figure 7 depicts the schematic of the data collection process.
2.3. Test Bed Performance Validation: Leakage Test
To verify the performance of the test bed equipment, a vacuum leakage test was conducted to monitor vacuum pressure changes in potential leak-prone areas. The areas identified as susceptible to vacuum leaks were the ball valve, tube line, and pad. The procedure (refer to
Figure 8) for each of these three components was systematically followed to assess changes in vacuum pressure.
This methodical approach ensures that any potential leaks are detected and addressed, maintaining the integrity and accuracy of the test bed during evaluations.
- (1)
Leakage test 1 (Ball valve)
Initial Setup: Close the ball valve and start the vacuum pump to create a vacuum pressure of −80 kPa.
Stabilization: Once −80 kPa is reached, stop the vacuum pump.
Observation: Monitor any changes in vacuum pressure over a duration of 1 h.
- (2)
Leakage test 2 (Tube line)
Initial Setup: Open the ball valve and lock the pad lever, then start the vacuum pump to achieve a vacuum pressure of −80 kPa.
Stabilization: After reaching −80 kPa, stop the vacuum pump.
Observation: Monitor any changes in vacuum pressure over a duration of 1 h.
- (3)
Leakage test 3 (Pad)
Initial Setup: Open both the ball valve and the pad lever, then start the vacuum pump to establish a vacuum pressure of −80 kPa.
Stabilization: Once −80 kPa is achieved, stop the vacuum pump.
Observation: Monitor any changes in vacuum pressure over a duration of 1 h.
After reaching a vacuum pressure of −80 kPa inside the pad, the operation of the vacuum pump was halted, and changes in the vacuum pressure were monitored over a 1 h period. To facilitate an intuitive understanding of the relative changes in vacuum pressure, the collected raw data were converted into a pressure ratio (P/P
i), where P represents the subsequent pressure and P
i represents the initial pressure. As depicted in the vacuum pressure ratio graphs for the three components (refer to
Figure 9), no pressure loss trends were observed over the 1 h duration. While the ball valve and tube line achieved the vacuum pressure simultaneously, a delay was noted in the pad due to its larger internal volume. As shown in
Table 2, the vacuum pressure ratios at the point of reaching −80 kPa and after 1 h for each component all displayed an error rate of 0%, thereby verifying that there are no vacuum leaks in this test bed configuration.
3. Evaluation Procedure
3.1. Test Conditions
To evaluate the performance of vacuum suction pads in automatic mooring systems, tests were conducted under controlled conditions, including vacuum pressure, applied load, load duration, and surface roughness.
- (1)
Vacuum pressure and load
Based on Cavotec’s design, the test was conducted at −80 kPa vacuum pressure.
The maximum suction force was tested with 200 kN (sway) and 100 kN (surge) on an effective area of 2.64 m2, while operational conditions were evaluated with 180 kN (sway) and 90 kN (surge) on a 2.27 m2 suction area.
- (2)
Load application duration
- (3)
Surface roughness (simulating ship hull plating)
Surface roughness affects vacuum sealing performance, especially on ship hulls with welding and painting.
To replicate real ship conditions, standard welding and coating specifications were applied to the test bed.
3.1.1. Welding (Butt Joint)
To replicate ship hull conditions, butt joint welding was applied based on Korean Register of Shipping standards [
25] and AWS D1.1/D1.1M (2020) [
26]; the weld joint specifications for butt joints are as follows. For plates with a thickness of 6.0 mm or less, the gap (S) of the weld joint should not exceed 3.0 mm. For plates with a thickness greater than 6.0 mm, the gap (S) should be 5.0 mm or less, the root face size (a) should not exceed 3.0 mm, and the groove angle (θ) must be at least 50°.
For the SAW (Submerged Arc Welding) method applied to butt joints, the specifications are valid for plate thicknesses exceeding 12.0 mm and up to 28.0 mm. In this case, the gap (S) of the weld joint should not exceed 0.8 mm, the root face size (a) should be set to 8.0 mm, and the groove angle (θ) must be at least 50°. Additionally, the gap (S) can range from 0 to 0.8 mm.
Considering the 16 mm steel plate thickness used in the test bed to replicate hull conditions, the weld dimensions were set at 10 mm width, 1.2 mm height, and 150 mm length, applied to the steel plate for vacuum sealing (see
Figure 10).
Figure 11 shows the preliminary geometric analysis (width: 8 mm, height: 1.8 mm), while
Figure 10 depicts the implemented weld within the test bed, though its small size relative to the steel plate and the applied 600 μm coating may reduce its visibility.
3.1.2. Painting (Coating Material and Thickness)
Following ISO 12944-5 (2018) [
27], a zinc-rich primer, epoxy intermediate coat, and polyurethane topcoat were applied as shown in
Table 3 [
27,
28]. To prevent peeling under a 200 kN suction force, the coating thickness was set to 600 μm. This value accounts for variations in coating thickness, as suggested by SSPC documentation. The final coated steel plate is shown in
Figure 12. Preliminary experiments indicated coating failure below 450 μm due to vacuum-induced stress and friction, supporting the adoption of a 600 μm thickness for enhanced reliability.
3.2. Evaluation Items
Since evaluation procedures for vacuum suction pads in automatic mooring systems are not standardized, this study establishes a dedicated evaluation framework considering large vessels over 10,000 tons, where existing industrial standards (e.g., ASME B30.20 [
19]) may not be directly applicable.
The evaluation includes three key tests:
To assess the effect of hull surface roughness, the pad’s internal vacuum pressure is set to −80 kPa without load for 30 min, monitoring pressure changes for potential leaks.
- (2)
Maximum Load Test
To verify suction performance, static loads of 200 kN (Sway) and 100 kN (Surge) are applied for 2 min at −80 kPa, following ASME B30.20 [
19] principles but adjusted for large vessel applications.
- (3)
Suction Test
Considering real operational conditions, static loads of 180 kN (Sway) and 90 kN (Surge) are applied for 30 min at −80 kPa, monitoring pressure retention over extended durations.
All tests begin by setting the vacuum pressure to −80 kPa, stopping the pump, and maintaining the load for 2 or 30 min while monitoring pressure changes (
Table 4).
Although wet conditions could be considered, Ahn et al. found that water evaporation under vacuum increases internal volume, enhancing suction [
16]. Thus, wet condition tests were excluded, focusing on dry operational scenarios to maintain consistency.
3.3. Evaluation Criteria
Since no standardized evaluation criteria exist for vacuum suction pads in automatic mooring systems, this study established its own criteria based on existing industrial standards.
- (1)
Maximum load test
The effective area of the vacuum suction pad (2.64 m
2) was calculated using the theoretical suction force Equation (2). The results showed that if the vacuum pressure decreases to −75 kPa, the suction force is 198 kN. Therefore, in the maximum load test, we verify whether the suction force reaches 200 kN (sway) and 100 kN (surge). If the initial vacuum pressure ratio (P/P
i) decreases by more than 5% over 2 min, it is considered a performance failure.
W: Suction force (kN)
P: Vacuum pressure (kPa)
S: Effective area of vacuum suction pad (m2)
- (2)
Vacuum leakage and suction test
The vacuum leakage test and suction test were conducted to verify the maintenance of suction force and to check for vacuum pressure reduction, based on the actual suction area (2.27 m
2), unlike the maximum load test. Notably, similar to the vacuum suction pads, the evaluation criteria of HIRD, which develops industrial equipment such as the 8 point vacuum lifter for glass, specify that the maximum suction force should not decrease by more than 5% of the initial vacuum pressure for at least 10 min [
29]. However, the pressure decay leak test procedures and standards for medical devices, automotive components, and piping systems, such as ASTM E2930, and the gas leak test to ensure the safety and reliability of equipment used in the oil and gas industry, such as API 6A, and the vacuum pressure maintenance test to verify the performance and integrity of small steam sterilizers, such as EN 13060 [
30], set the allowable gas pressure reduction rate to 5% or less [
31,
32,
33]. Based on these referenced standards, the evaluation criteria for the vacuum leakage and suction test were established to be 5% or less compared to the initial vacuum pressure.
The vacuum leakage test runs for 30 min, while the suction test (simulating operational conditions) runs for 30 min under load (180 kN Sway, 90 kN Surge) as shown in
Figure 13. To validate these criteria, data consistency tests were performed at 100 Hz sampling rate, ensuring reproducibility. The vacuum pressure ratio (P/Pi) was used for data analysis, applying appropriate averaging for fractional time points.
4. Test Results
4.1. Data Consistency Tests
The data consistency tests (vacuum leakage test, suction test) shown in
Figure 14 and
Table 5 demonstrated high reliability, with vacuum pressure ratio changes showing a maximum error of 0.2% over 2 min with no pressure reduction. Although the three data sets showed consistency, a small spike occurred between 0 and 10 s after reaching −80 kPa initial vacuum pressure in all tests.
The data consistency tests (vacuum leakage test, suction test) shown in
Figure 14 and
Table 5 demonstrated high reliability, with vacuum pressure ratio changes, showing a maximum error of 0.2% over 2 min with no pressure reduction. While the three data sets showed consistency, a small spike occurred between 0 and 10 s after reaching −80 kPa initial vacuum pressure in all tests. This spike can be attributed to different mechanisms: In vacuum leakage tests, it likely results from sudden valve closure converting kinetic energy to pressure energy, causing wave reflections [
34,
35]. In maximum load and suction tests, the spike is likely due to a momentary volume expansion in the pad’s lip suction area when load is applied. A slight, temporary vacuum pressure drop occurs under sudden load due to elastic deformation, expanding the pad’s lip area. This stabilizes quickly, with no significant effect on performance, meeting the 5% criterion within 2 min. Although such spikes could potentially damage equipment in actual automatic mooring systems, the observed spikes (up to −0.1 kPa) stabilized quickly and with no lasting effects.
4.2. Vacuum Leakage Test
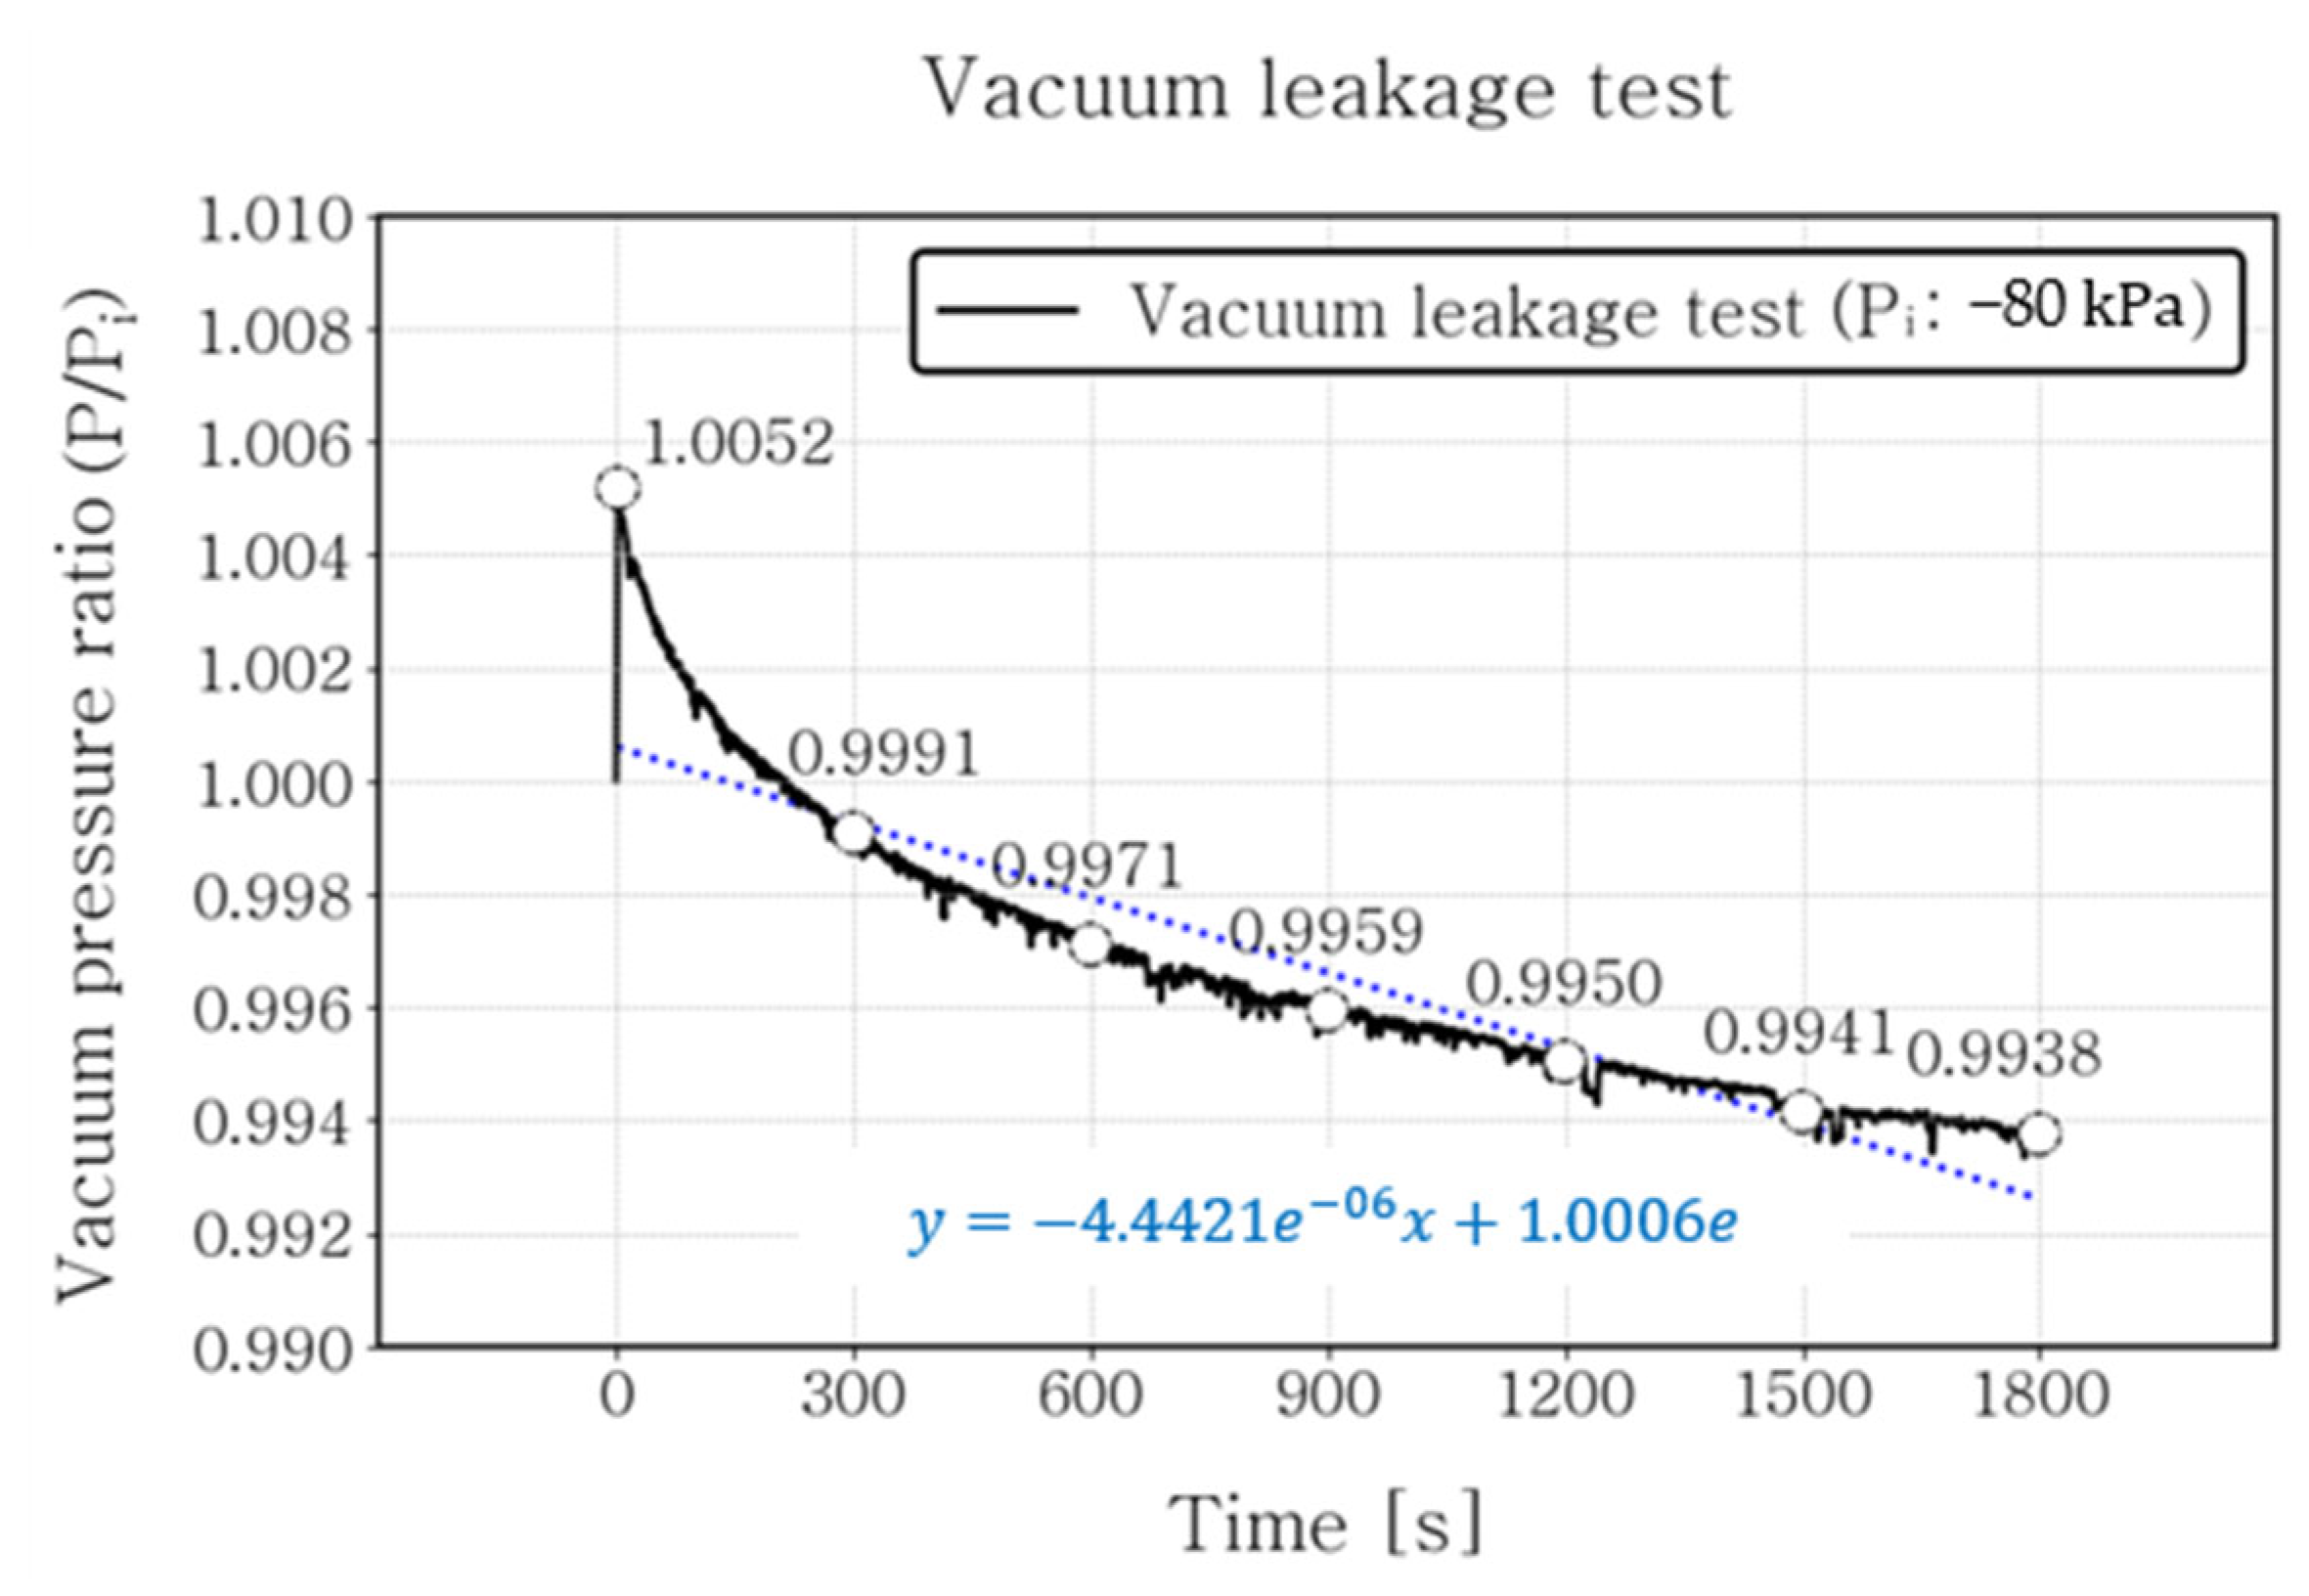
The results of the vacuum leakage test are presented in
Figure 15 and
Table 6. Over the 30 min duration, the vacuum pressure ratio did not decrease by more than 5%, showing only a 0.62% reduction from the initial vacuum pressure, thus maintaining the suction force. However, a slight continuous decrease was observed. By generating a trend line, the time at which a 5% reduction is expected to occur was estimated to be approximately 190 min.
4.3. Maximum Load Test
As shown in
Figure 16, during the maximum load test, the vacuum pressure decreased rapidly when a static load of 200 kN was applied in the sway direction at −80 kPa and −85 kPa, dropping immediately upon reaching 193 kN and 200 kN, respectively. Consequently, a vacuum pressure of −90 kPa was required to sustain 200 kN in sway, while −80 kPa sufficed for surge (100 kN), consistent with
Table 4. Despite the more severe condition at −90 kPa, the 600 μm coating thickness prevented any peeling, ensuring durability under increased vacuum pressure. Based on an effective area of 2.64 m
2, the suction force increased by 27 kN (approximately 5.6%) from −80 kPa to −90 kPa. Although this entails slightly higher energy consumption, the difference is negligible; and since −90 kPa exceeds typical mooring requirements, it does not significantly affect system performance.
Since the load application time for the maximum load test is 2 min, data consistency was verified simultaneously during the test. The results of the maximum load test in the sway and surge directions can be seen in
Figure 17 and
Table 7. Both met the criteria as the reduction rates did not exceed 5% of the initial vacuum pressure. Unlike sway, surge maintained a load of 100 kN under a vacuum pressure of −80 kPa. The time at which the reduction rate exceeds 5% was found to be 108 min for sway and 158 min for surge. Additionally, similar pressure ratios were observed in terms of data consistency.
4.4. Suction Test
The suction test results (
Figure 18,
Table 8) confirmed that both sway and surge maintained adequate suction force relative to the suction area. Vacuum pressure ratio changes showed minimal reduction rates (−0.17% for sway, −0.47% for surge), staying well below the 5% threshold. Based on trend-line equations, the time to reach 5% reduction was calculated as 451 min for sway and 346 min for surge. Surge showed a lower reduction rate in the maximum load test due to a halved load, however, it exhibited a slightly higher reduction rate in the suction test. This difference likely stems from the expanded contact area in sway under −80 kPa vacuum pressure, compared to surge’s lateral load application.
5. Discussion
The rapid evolution of the maritime and port logistics industry, driven by the fourth Industrial Revolution, underscores the need for automation to enhance efficiency and safety. This study’s lab-based evaluation of a 200 kN vacuum suction pad demonstrates its potential as a reliable component in automatic mooring systems, with all tests—vacuum leakage, maximum load, and suction—maintaining vacuum pressure reductions below the 5% threshold. Compared to Cavotec’s MoorMaster system, which achieves similar suction capacities (up to 200 kN) [
16], our pad design offers a 3.5% increase in suction efficiency due to its larger effective area (2.64 m
2 vs. 2.55 m
2). This suggests that optimized pad geometry could enhance mooring performance, particularly for mid- to large-sized vessels. However, the maximum load test in the sway direction highlighted a limitation: at −80 kPa, the pad sustained only up to 193 kN before requiring a higher vacuum pressure (−90 kPa) to reach 200 kN, particularly near weld joints. This indicates that real-world hull irregularities may demand adjustments in pad material (e.g., rubber hardness) or vacuum capacity. Prior studies, such as Ahn et al. [
20], reported stable suction under static loads, but our results extend this by simulating realistic hull surfaces, albeit in a controlled setting. The consistent performance across tests validates the test bed’s reliability, aligning with industrial standards like ASME B30.20 [
19] but tailored for maritime applications.
A key limitation is the focus on sway and surge forces, excluding heave—the vertical motion from waves or tides. The current test bed, with its fixed steel plate and ±10° rotational jig, cannot simulate heave due to the absence of vertical actuation. Incorporating a hydraulic lift could enable such simulation, though this was beyond our scope due to equipment constraints. Heave might disrupt suction by causing intermittent hull-pad separation, potentially increasing leakage rates beyond the observed 0.62% over 30 min. Similarly, tidal shifts could alter hull contact height, reducing the effective suction area. Based on simplified pressure–area calculations, we estimate that a 10 cm vertical displacement could decrease suction by 5–10%, depending on pad flexibility. These hypotheses require field validation.
These findings position vacuum pads as a viable alternative to electromagnetic systems, especially for large vessels where cost and hull material flexibility are critical. Yet, transitioning to operational ports demands addressing environmental factors (e.g., biofouling, humidity) and dynamic motions, which lab conditions cannot fully replicate.
6. Conclusions
This research establishes a foundational framework for evaluating automatic mooring systems in laboratory conditions, marking a significant step toward standardizing vacuum suction pad performance assessment. The methodology and findings confirm the pad’s suitability for mooring applications, with all tests meeting the 5% vacuum pressure reduction criterion. However, transitioning to industrial implementation requires further investigation into rubber pad performance under environmental factors like biofouling and draft variations, which could affect suction efficacy. The 30 min tests confirmed initial suction stability, but longer mooring durations in operational settings require further investigation, including field tests with environmental variables, to validate extended performance.
Future studies should focus on field tests in port environments, assessing dynamic factors such as the heave and tidal influences omitted here, alongside humidity, temperature, and extended-duration effects. These steps will refine our evaluation procedure for practical smart port integration. Although focused on static loads, this study notes that dynamic effects, like small mooring force fluctuations from environmental factors (e.g., waves, wind, tidal currents), may occur in practice. These are expected to be minor under typical conditions, but future dynamic load tests are recommended to assess their influence on long-term performance and safety.
Author Contributions
Conceptualization, Y.K. and J.K.; methodology, J.A. and J.K.; investigation, J.A. and J.K.; formal analysis, J.A.; data curation, J.A., J.K. and Y.K.; writing—original draft preparation, J.K. and J.A.; writing—review and editing, Y.K. and Y.C.; supervision, Y.K. and Y.C.; funding acquisition, Y.K. and Y.C. All authors have read and agreed to the published version of the manuscript.
Funding
This work was supported by the Technology Innovation Program (RS-2024-00430799) (RS-2024-00437087) (RS-2024-00458756) funded by the Ministry of Trade, Industry & Energy (MOTIE, Republic of Korea). This article paper was a part of the project titled “Development of Smart Port Autonomous Ships Linkage Technology”, funded by the Ministry of Oceans and Fisheries, Republic of Korea (No. 20210631).
Institutional Review Board Statement
Not applicable.
Informed Consent Statement
Not applicable.
Data Availability Statement
The original contributions presented in the study are included in the article. Further inquiries can be directed to the corresponding author/s.
Conflicts of Interest
The authors declare no conflicts of interest. The funders had no role in the design of the study, in the collection, analyses, or interpretation of data, in the writing of the manuscript, or in the decision to publish the results.
References
- De la Peña Zarzuelo, I.; Freire Soeane, M.J.; López Bermúdez, B. Industry 4.0 in the port and maritime industry: A literature review. J. Ind. Inf. Integr. 2020, 20, 100173. [Google Scholar] [CrossRef]
- Heilig, L.; Voß, S. Status quo and innovative approaches for maritime logistics in the age of digitalization: A guest editors’ introduction. Inf. Technol. Manag. 2017, 18, 175–177. [Google Scholar] [CrossRef]
- Priadi, A.A. Optimalization of Smart Technologies in Improving Sustainable Maritime Transportation. IOP Conf. Ser. Earth Environ. Sci. 2022, 972, 012084. [Google Scholar] [CrossRef]
- DNV. A New Look at Safe Mooring. DNV Maritime Impact. 2021. Available online: https://www.dnv.com/expert-story/maritime-impact/A-new-look-at-safe-mooring (accessed on 12 June 2023).
- UK P&I Club. Risk Focus: Enclosed Spaces, Master Pilot Exchange, Moorings, Loss of Power, Slips, Trips and Falls, Mental Health. 2016. Available online: https://www.ukpandi.com/ (accessed on 12 June 2023).
- Transportation Safety Board of Canada (TSB). Marine Investigation Report M17C0060: Sinking and Loss of Life, Amphibious Passenger Vehicle DUKW 34. Transportation Safety Board of Canada. 2018. Available online: https://www.tsb.gc.ca/eng/securite-safety/marine/2018/m17c0060/m17c0060.html (accessed on 12 June 2023).
- Lee, T. Smart Port Policy Trend of Europe and Singapore and Its Political Implications. J. Korea Port Econ. Assoc. 2020, 36, 77–90. [Google Scholar] [CrossRef]
- Department for Transport. Maritime 2050: Navigating the Future. Department for Transport. January 2019. Available online: https://www.gov.uk/government/publications/maritime-2050-navigating-the-future (accessed on 24 March 2023).
- Sheikh, A.A.; Lee, D.-C. Optimized Energy Management of Seaports with Integrated AMP Technology and DC Microgrid. IEEE Access 2023, 11, 141217–141231. [Google Scholar] [CrossRef]
- International Maritime Organization (IMO). Guidelines for Inspection and Maintenance of Mooring Equipment Including Lines; MSC.1/Circ.1620; International Maritime Organization: London, UK, 2020. [Google Scholar]
- International Maritime Organization (IMO). Guidelines on the Design of Mooring Arrangements and the Selection of Appropriate Mooring Equipment and Fittings for Safe Mooring; MSC.1/Circ.1619; International Maritime Organization: London, UK, 2020. [Google Scholar]
- Yan, K.; Zhang, S.; Oh, J.; Seo, D.-W. A Review of Progress and Applications of Automatic Vacuum Mooring Systems. J. Mar. Sci. Eng. 2022, 10, 1085. [Google Scholar] [CrossRef]
- Mørkrid, O.E.; Bellingmo, P.R.; Jørgensen, U.; Holden, C. Automatic Vacuum Mooring Systems: Implementation and Performance Analysis. J. Marit. Syst. Eng. 2023, 12, 85–98. [Google Scholar]
- Kuscahyo, A.R.; Buana, I.G.N.S. Application of Lineless Technology in Automatic Mooring Using Vacuum System. J. Mar. Technol. 2023, 4, 68–73. [Google Scholar] [CrossRef]
- Bellingmo, P.R.; Jørgensen, U. Automatic Mooring: Technical Gap Analysis; Report No. OC2022 A-093; SINTEF Ocean AS: Trondheim, Norway, 2022. [Google Scholar]
- Cavotec. MoorMaster® Introduction and References; Cavotec Brochure; Cavotec: Lugano, Switzerland, 2021. [Google Scholar]
- Cavotec. Automatic Mooring and Shore Power Solutions: Technical Overview. 2017. Available online: https://www.cavotec.com/en/your-applications/ports-maritime/automated-mooring (accessed on 24 June 2023).
- Trelleborg Marine and Infrastructure. AutoMoor: Smart Efficient Automatic Mooring Solutions. Trelleborg Marine and Infrastructure. 2019. Available online: https://www.trelleborg.com/marineandinfrastructure (accessed on 24 June 2023).
- ASME. Below-the-Hook Lifting Devices. In Safety Standard for Cableways, Cranes, Derricks, Hoists, Hooks, Jacks, and Slings; ASME B30.20-2018; The American Society of Mechanical Engineers: New York, NY, USA, 2018. [Google Scholar]
- Ahn, J.; Kim, Y.; Lee, T.; Lee, J.; Oh, J.; Seo, D.; Jang, H. Vacuum Suction Pad Design and Real-Scale Performance Evaluation of an Automatic Mooring System for the Establishment of a Smart Port in South Korea. J. Mar. Sci. Eng. 2023, 11, 1952. [Google Scholar] [CrossRef]
- Son, Y.; Lee, T.; Kim, J.Y.; Jang, H.; Lee, J.; Kim, Y.; Kim, S.; Kim, Y. Experimental and Numerical Evaluation of a Rubber Seal in a Vacuum Suction Pad for an Automatic Mooring System. Mar. Struct. 2024, 94, 103573. [Google Scholar] [CrossRef]
- Miyake, T.; Ishihara, H.; Yoshimura, M. Application of Wet Vacuum-based Adhesion System for Wall Climbing Mechanism. In Proceedings of the IEEE/RSJ International Conference on Intelligent Robots and Systems (IROS), San Diego, CA, USA, 29 October–2 November 2007; pp. 532–537. [Google Scholar] [CrossRef]
- Ham, Y.-B.; Lim, B.-J.; Noh, J.-H.; Park, J.-H. Suction Force of Blowing Fans on Various Surface Shapes of Outer Wall. In Proceedings of the 29th International Symposium on Automation and Robotics in Construction, Eindhoven, The Netherlands, 26–29 June 2012. [Google Scholar] [CrossRef]
- Ham, Y.-B.; Lim, B.-J.; Park, C.-D.; Gu, J.-S.; Kim, D.-G.; Jeon, S.-H. Measurement of Vacuum Suction Force on Diversely Configured Vertical Outer Walls of Buildings. In Proceedings of the International Conference on Construction and Building Technology, Nha Trang, Vietnam, 23–25 February 2018; pp. 1278–1282. [Google Scholar]
- Korean Register of Shipping. Rules for the Classification of Steel Ships: Part 2: Materials and Welding; Korean Register of Shipping: Busan, Republic of Korea, 2019. [Google Scholar]
- American Welding Society (AWS). Structural Welding Code—Steel. In AWS D1.1/D1.1M:2020, 24th ed.; American Welding Society: Doral, FL, USA, 2020; Available online: https://istasazeh-co.com/wp-content/uploads/2022/02/AWS-D1.1-D1.1M-2020.pdf (accessed on 16 August 2023).
- ISO 12944-5:2018; Paints and Varnishes—Corrosion Protection of Steel Structures by Protective Paint Systems—Part 5: Protective Paint Systems. International Organization for Standardization: Geneva, Switzerland, 2018.
- ISO 12944:2018; Summary of Main Changes for Applicators and Specifiers. Hempel: Lyngby, Denmark, 2018. Available online: https://www.hempel.com/ (accessed on 4 October 2023).
- Hird. 8-Point Vacuum Lifter Test Gives Hird Customers Performance and Safety Assurance. 2023. Available online: https://hird.co.uk/news/vacuum-glass-lifters/8-point-vacuum-lifter-test-gives-hird-customers-performance-and-safety-assurance (accessed on 13 October 2023).
- SIST EN 13060:2015+A1:2019; Small Steam Sterilizers. European Committee for Standardization: Brussels, Belgium, 2019.
- ASTM E2930-13(2021); Standard Practice for Pressure Decay Leak Test Method. ASTM International: West Conshohocken, PA, USA, 2021.
- Eng-Tips Forums. Thread: Pressure Decay Leak Test Method Discussion. Eng-Tips Engineering Forums. Available online: https://www.eng-tips.com/viewthread.cfm?qid=378883 (accessed on 25 October 2023).
- Euronda. Vacuum Test: What Is It and Why Is It Important? Euronda Pro System. Available online: https://prosystem.euronda.com/vacuum-test-what-is-it-why-important/ (accessed on 25 October 2023).
- Chen, T.; Ren, Z. Optimal Valve Closure Operations for Pressure Suppression in Fluid Transport Pipelines. IEEE/CAA J. Autom. Sin. 2019, 6, 1010–1018. [Google Scholar] [CrossRef]
- Gkrekos, K.; Tolhuis, S. Vacuum Spikes: Effects and Control of Contamination on Vacuum Sealing Surfaces. In Proceedings of the International Symposium on Contamination Control (ISCC), Malmo, Sweden, 23–26 September 2018; pp. 1–15. Available online: https://www.researchgate.net/publication/342304619 (accessed on 27 March 2024).
Figure 1.
Overall flowchart for lab test setup.
Figure 1.
Overall flowchart for lab test setup.
Figure 2.
Sketch of an automatic ship-berthing mooring system used at a dock.
Figure 2.
Sketch of an automatic ship-berthing mooring system used at a dock.
Figure 3.
Vacuum suction pad under evaluation, which possesses a suction force of 200 kN.
Figure 3.
Vacuum suction pad under evaluation, which possesses a suction force of 200 kN.
Figure 4.
Test bed for vacuum suction pad performance testing: (a) test bed; (b) jig; (c) sway direction; (d) surge direction.
Figure 4.
Test bed for vacuum suction pad performance testing: (a) test bed; (b) jig; (c) sway direction; (d) surge direction.
Figure 5.
Vacuum supply system: (a) vacuum pump; (b) vacuum switch; (c) pad lever.
Figure 5.
Vacuum supply system: (a) vacuum pump; (b) vacuum switch; (c) pad lever.
Figure 6.
Hydraulic supply system.
Figure 6.
Hydraulic supply system.
Figure 7.
The schematic diagram of load and vacuum pressure data acquisition.
Figure 7.
The schematic diagram of load and vacuum pressure data acquisition.
Figure 8.
Schematic overview for component specific leakage tests in performance validation of the test bed: (a) leakage test 1 (Ball valve); (b) leakage test 2 (Tube line); (c) leakage test 3 (Pad).
Figure 8.
Schematic overview for component specific leakage tests in performance validation of the test bed: (a) leakage test 1 (Ball valve); (b) leakage test 2 (Tube line); (c) leakage test 3 (Pad).
Figure 9.
Graphs of the vacuum pressure ratio (P/Pi) during the leakage test: (a) leakage test 1 (Ball valve); (b) leakage test 2 (Tube line); (c) leakage test 3 (Pad).
Figure 9.
Graphs of the vacuum pressure ratio (P/Pi) during the leakage test: (a) leakage test 1 (Ball valve); (b) leakage test 2 (Tube line); (c) leakage test 3 (Pad).
Figure 10.
Welding specifications applied to the 16 mm steel plate in the test bed (L: 150 mm, W: 10 mm, H: 1.2 mm), partially obscured by scale and coating in this view.
Figure 10.
Welding specifications applied to the 16 mm steel plate in the test bed (L: 150 mm, W: 10 mm, H: 1.2 mm), partially obscured by scale and coating in this view.
Figure 11.
Estimation of welding specifications through geometric analysis (Width: 8 mm, Height: 1.8 mm).
Figure 11.
Estimation of welding specifications through geometric analysis (Width: 8 mm, Height: 1.8 mm).
Figure 12.
The steel plate with completed coating.
Figure 12.
The steel plate with completed coating.
Figure 13.
Evaluation procedure flowchart for vacuum suction pad.
Figure 13.
Evaluation procedure flowchart for vacuum suction pad.
Figure 14.
Vacuum pressure ratio (P/Pi) changes in the data consistency tests to ensure the validity of test results: (a) vacuum leakage test; (b) suction test (Sway); (c) suction test (Surge).
Figure 14.
Vacuum pressure ratio (P/Pi) changes in the data consistency tests to ensure the validity of test results: (a) vacuum leakage test; (b) suction test (Sway); (c) suction test (Surge).
Figure 15.
Vacuum pressure ratio (P/Pi) changes and equation of the vacuum trend line in the vacuum leakage test.
Figure 15.
Vacuum pressure ratio (P/Pi) changes and equation of the vacuum trend line in the vacuum leakage test.
Figure 16.
Decrease in vacuum pressure at maximum load of 200 kN under −80 kPa and −85 kPa conditions.
Figure 16.
Decrease in vacuum pressure at maximum load of 200 kN under −80 kPa and −85 kPa conditions.
Figure 17.
Vacuum pressure ratio (P/Pi) changes and equation of the vacuum trend line in the maximum load test: (a) sway (200 kN); (b) surge (100 kN).
Figure 17.
Vacuum pressure ratio (P/Pi) changes and equation of the vacuum trend line in the maximum load test: (a) sway (200 kN); (b) surge (100 kN).
Figure 18.
Vacuum pressure ratio (P/Pi) changes and equation of the vacuum trend line in the suction test: (a) sway (180 kN); (b) surge (90 kN).
Figure 18.
Vacuum pressure ratio (P/Pi) changes and equation of the vacuum trend line in the suction test: (a) sway (180 kN); (b) surge (90 kN).
Table 1.
Specifications of the vacuum suction pad.
Table 1.
Specifications of the vacuum suction pad.
| Item | Value |
|---|
| Length (mm) | 1950 |
| Width (mm) | 1380 |
| Height (mm) | 75 |
| Effective area (m2) | 2.64 |
| Suction area (m2) | 2.27 |
| Weight (kg) | 945 |
| Suction force (Effective area, Vacuum pressure: −80 kPa) (kN) | 211.2 |
| Suction force (Suction area, Vacuum pressure: −80 kPa) (kN) | 181.6 |
| Seal material | CR |
| Hardness | 55 |
Table 2.
Changes in vacuum pressure ratio (P/Pi) during the Leakage test.
Table 2.
Changes in vacuum pressure ratio (P/Pi) during the Leakage test.
| Component | Initial P/Pi | Last P/Pi | Rate (%) |
|---|
| Ball valve | 1.0 | 1.0 | 0 |
| Tube line | 1.0 | 1.0 | 0 |
| Pad | 1.0 | 1.0 | 0 |
Table 3.
NDFT based on corrosivity [
27,
28].
Table 3.
NDFT based on corrosivity [
27,
28].
| Category | Corrosivity | Description | Durability | NDFT of Paint System |
|---|
| C1 | Very Low | Dry or cold with very low pollution | Up to 7 years | – |
| C2 | Low | Temperature low pollution | ≥ 160 μm |
| C3 | Medium | Temperature medium pollution, tropical low pollution | 7–15 years | ≥ 200 μm |
| C4 | High | Temperature with high pollution, tropical moderate pollution | 15–25 years | ≥ 260 μm |
| C5 | Very High | Temperature and subtropical with high pollution | ≥ 320 μm |
| CX | Extreme | Extreme industrial areas, offshore areas, salt spray | Over 25 years | ≥ 450 μm |
Table 4.
Evaluation Items for lab testing of vacuum suction pad.
Table 4.
Evaluation Items for lab testing of vacuum suction pad.
| Evaluation Items | Load Direction | Vacuum Pressure (kPa) | Load (kN) | Load Application Duration (min) |
|---|
| Vacuum leakage test | × | −80 | × | 30 |
| Maximum load test | Sway | 200 | 2 |
| Surge | 100 |
| Suction test | Sway | 180 | 30 |
| Surge | 90 |
Table 5.
Vacuum pressure ratio (P/Pi) data from vacuum leakage and suction tests in data consistency testing.
Table 5.
Vacuum pressure ratio (P/Pi) data from vacuum leakage and suction tests in data consistency testing.
| Evaluation Items | Tests | P/Pi Range at Spike | P/Pi at 0 s | P/Pi at 120 s | Rate (%) |
|---|
| Vacuum leakage test | Test 1 | 1.0020 < (P/Pi) < 1.0060 | 1.0000 | 0.9983 | −0.17 |
| Test 2 | 1.0015 | +0.15 |
| Test 3 | 1.0021 | +0.21 |
| Suction test | Sway | Test 1 | 1.0000 < (P/Pi) < 1.0020 | 1.0010 | +0.1 |
| Test 2 | 1.0008 | +0.08 |
| Test 3 | 0.9997 | −0.03 |
| Surge | Test 1 | 0.9997 | −0.03 |
| Test 2 | 0.9987 | −0.13 |
| Test 3 | 0.9996 | −0.04 |
Table 6.
Vacuum pressure ratio data from the vacuum leakage test.
Table 6.
Vacuum pressure ratio data from the vacuum leakage test.
| | 0 s | Spike | 300 s | 600 s | 900 s | 1200 s | 1500 s | 1800 s |
|---|
| P/Pi | 1.0000 | 1.0052 | 0.9991 | 0.9971 | 0.9959 | 0.9950 | 0.9941 | 0.9938 |
| Rate (%) | 0 | +0.52 | −0.09 | −0.29 | −0.41 | −0.5 | −0.59 | −0.62 |
Table 7.
Vacuum pressure ratio (P/Pi) data from maximum load tests.
Table 7.
Vacuum pressure ratio (P/Pi) data from maximum load tests.
| Load Direction | Tests | P/Pi Range at Spike | P/Pi at 0 s | P/Pi at 120 s | Rate (%) |
|---|
| Sway | Test 1 | 1.0000 < (P/Pi) < 1.0020 | 1.0000 | 0.9990 | 0.1 |
| Test 2 | 0.9990 | 0.1 |
| Test 3 | 0.9982 | 0.18 |
| Surge | Test 1 | 0.9994 | 0.06 |
| Test 2 | 0.9996 | 0.04 |
| Test 3 | 0.9995 | 0.05 |
Table 8.
Vacuum pressure ratio (P/Pi) data from the suction test.
Table 8.
Vacuum pressure ratio (P/Pi) data from the suction test.
| | 0 s | Spike | 300 s | 600 s | 900 s | 1200 s | 1500 s | 1800 s |
|---|
| Sway | P/Pi | 1.0000 | 1.0018 | 1.0013 | 1.0005 | 1.0001 | 0.9994 | 0.9988 | 0.9983 |
| Rate (%) | 0 | +0.18 | +0.13 | +0.05 | +0.01 | −0.06 | −0.12 | −0.17 |
| Surge | P/Pi | 1.0000 | 1.0002 | 0.9984 | 0.9974 | 0.9967 | 0.9962 | 0.9957 | 0.9953 |
| Rate (%) | 0 | +0.02 | −0.16 | −0.26 | −0.33 | −0.38 | −0.43 | −0.47 |
| Disclaimer/Publisher’s Note: The statements, opinions and data contained in all publications are solely those of the individual author(s) and contributor(s) and not of MDPI and/or the editor(s). MDPI and/or the editor(s) disclaim responsibility for any injury to people or property resulting from any ideas, methods, instructions or products referred to in the content. |
© 2025 by the authors. Licensee MDPI, Basel, Switzerland. This article is an open access article distributed under the terms and conditions of the Creative Commons Attribution (CC BY) license (https://creativecommons.org/licenses/by/4.0/).


