Article

The Role of Integrated Multi-Energy Systems Toward Carbon-Neutral Ports: A Data-Driven Approach Using Empirical Data

1
School of Intelligent Manufacturing, Nanjing University of Science and Technology, Nanjing 210094, China
2
School of Mechanical Engineering, Nanjing University of Science and Technology, Nanjing 210094, China
3
State Key Laboratory of Maritime Technology and Safety, Wuhan University of Technology, Wuhan 430063, China
4
National Engineering Research Center for Water Transport Safety, Wuhan University of Technology, Wuhan 430063, China
5
School of Transportation and Logistics Engineering, Wuhan University of Technology, Wuhan 430063, China
6
Center for Research on Microgrids (CROM), Department of Electronic Engineering, Technical University of Catalonia, 08019 Barcelona, Spain
7
Catalan Institution for Research and Advanced Studies (ICREA), Pg. Lluís Companys 23, 08010 Barcelona, Spain
8
Center for Research on Microgrids (CROM), AAU Energy, Aalborg University, 9220 Aalborg, Denmark
*
Author to whom correspondence should be addressed.
J. Mar. Sci. Eng. 2025, 13(3), 477; https://doi.org/10.3390/jmse13030477
Submission received: 28 January 2025 / Revised: 19 February 2025 / Accepted: 25 February 2025 / Published: 28 February 2025

Abstract

:
Ports are critical hubs in the global supply chain, yet they face mounting challenges in achieving carbon neutrality. Port Integrated Multi-Energy Systems (PIMESs) offer a comprehensive solution by integrating renewable energy sources such as wind, photovoltaic (PV), hydrogen, and energy storage with traditional energy systems. This study examines the implementation of a real-word PIMES, showcasing its effectiveness in reducing energy consumption and emissions. The findings indicate that in 2024, the PIMES enabled a reduction of 1885 tons of CO2 emissions, with wind energy contributing 84% and PV 16% to the total decreases. The energy storage system achieved a charge–discharge efficiency of 99.15%, while the hydrogen production system demonstrated an efficiency of 63.34%, producing 503.87 Nm3/h of hydrogen. Despite these successes, challenges remain in optimizing renewable energy integration, expanding storage capacity, and advancing hydrogen technologies. This paper highlights practical strategies to enhance PIMESs’ performances, offering valuable insights for policymakers and port authorities aiming to balance energy efficiency and sustainability and providing a blueprint for carbon-neutral port development worldwide.

1. Introduction

Port Integrated Multi-Energy Systems (PIMESs) [1] are an innovative solution for modern ports facing increasingly complex energy demands and environmental pressures [2]. Against the backdrop of continued growth in global trade and progress toward green and low-carbon goals, ports, as vital logistics hubs, are confronted with multiple challenges. These include reducing carbon emissions, enhancing energy efficiency, and ensuring a stable supply. Traditional port energy systems rely mainly on fossil fuels, which contribute to higher greenhouse gas emissions and carry risks related to energy security and low energy use efficiency.
To address these challenges, PIMESs integrate multiple energy forms—such as solar, wind, hydrogen, and energy storage technologies—with conventional energy sources like electricity, coal, and natural gas. They further adopt intelligent management and optimized scheduling techniques to achieve an efficient, clean, and stable energy supply [3]. This approach meets the day-to-day energy needs of port operations and provides emergency backup under extreme weather conditions or equipment failures [4]. More importantly, PIMESs help reduce operating costs, improve environmental sustainability, and foster the construction of green ports [5], thus facilitating the achievement of carbon neutrality and zero-emission targets [6].
Ports already implement various measures to cut carbon emissions, among which electric cargo handling equipment (CHE) and onshore power supply (OPS) are the principal approaches. For example, studies show that electric rubber-tired gantry cranes (RTGs) can reduce energy consumption by 86.6% and carbon emissions by 67.79% compared to traditional diesel-powered equipment [7]. The connection of OPS can reduce emissions to zero [8]. However, the effectiveness of OPS and electric CHE in reducing emissions depends heavily on the carbon intensity of the electricity supply, which is mainly produced by traditional fossil fuels. Against this background, renewable energy technologies are increasingly being applied to port settings. In particular, photovoltaic (PV) systems attract considerable attention due to their technological maturity. Research indicates that deploying PV systems in small and medium-sized ports can cut carbon emissions by around 39% [9]. In Italy’s Port of Ancona, optimally sized PV and energy storage systems have been shown to reduce carbon emissions by up to 87% [10]. Nevertheless, PV systems’ high land-use requirements pose a significant challenge in port environments.
Wind and hydrogen energy have been gradually introduced as key supplemental renewable energies to compensate for some of the shortcomings of PV systems [11]. Wind turbines (WTs) are widely used thanks to readily available wind resources in many port areas, whereas hydrogen, as a zero-carbon energy form, has become an increasingly vital component in low-carbon port energy systems [12]. For example, hydrogen-powered RTGs and trucks have already been put into operation at the Port of Qingdao [13]. On the demand side, cold ironing (i.e., shore power) can significantly reduce direct emissions, but its overall effectiveness in cutting emissions remains constrained by the continued dependence on fossil fuels for electricity generation.
Overall, by integrating PV, wind, hydrogen, energy storage, and OPS systems, PIMES offers pronounced advantages in multi-energy coupling, intelligent dispatch, and deep carbon reduction. Yet, practical applications face challenges such as site limitations, complex energy scheduling, indirect emissions, and insufficient policy and market incentives. Future research should further increase the share of renewable energy, optimize energy dispatch technologies, strengthen the integrated application of energy storage and hydrogen, and develop optimized designs aligned with the energy demand characteristics of large-scale ports, thus driving port energy systems toward greater efficiency and lower carbon emissions.
In recent years, with technological advancements and policy support, PIMES has become a key development trend in ports worldwide. Researching and implementing these systems improves energy efficiency and environmental sustainability at ports and promotes industrial upgrading in the energy sector, contributing to the global pursuit of sustainable energy. For instance, by integrating an OPS with solar power and both onshore and offshore wind power, Spain’s Port of Cartagena successfully cuts 10,000 tons of CO2 each year [14]. Sifakis et al. proposed a PV, wind, and energy storage system that significantly lowers the Levelized Cost of Energy (LCOE) while maintaining 10 h of energy autonomy [15]. Moreover, the role of hydrogen in PIMESs is increasingly pivotal. For example, Vichos et al. demonstrated that a system producing hydrogen from surplus renewable electricity achieved zero emissions and a 51.8% reduction in LCOE [16]. Other ports, such as Nigeria’s Port Harcourt and Egypt’s Port of Damietta, have also reduced carbon emissions by leveraging PV, wind, and fuel cell technologies [17].
Despite significant advances in PIMESs, current research has predominantly focused on small and medium-sized ports, leaving a critical gap in understanding the more complex energy demands and load characteristics of large-scale ports. This gap is particularly evident in scenarios involving the integration of hydrogen-powered equipment with the combined energy consumption of CHE and OPS.
To address these limitations, more research should prioritize the comprehensive integration of diverse renewable energy resources, enhance smart scheduling and management systems, and develop customized designs that meet the specific energy needs of large-scale ports. These advancements are essential for driving port energy systems toward higher efficiency, reduced carbon emissions, and smarter operation. Building on these future directions, this study explores how a PIMES—which integrates wind, solar, and hydrogen storage—performs in a large port. It examines the contributions of different renewable energy sources and identifies key challenges and opportunities for future improvement. In doing so, this study aims to fill existing research gaps and provide practical insights for developing more sustainable and efficient energy systems at ports.
This study contributes to the existing body of knowledge by offering empirical evidence from the implementation of a PIMES. Unlike previous studies that relied on simulations [1], our research evaluates the real-world performance of a PIMES and demonstrates the effectiveness of integrating renewable energy sources including wind, solar, hydrogen, and energy storage systems. The findings emphasize the significant role of wind energy in reducing CO2 emissions, the high efficiency of energy storage systems, and the potential of hydrogen production to boost energy sustainability. Additionally, we identify practical challenges in optimizing renewable energy integration and propose strategies to improve system performance, providing a valuable reference for policymakers and port authorities aiming for carbon neutrality. By focusing on a large-scale port, our research further contributes a comprehensive understanding of the complexities involved in scaling up PIMESs for larger operations.
The remainder of this paper is organized as follows: Section 2 provides an overview of the multi-energy fusion system architecture, detailing the core subsystems, including wind power, photovoltaic, energy storage, and hydrogen systems. Section 3 introduces the methodology for evaluating the performance of the PIMES and its subsystems, covering energy and emission calculations, collaborative emission reduction analysis, and subsystem performance metrics. Section 4 presents the results and analysis, focusing on energy consumption, emission reduction effects, and the comparative performance of the multi-energy integration system before and after implementation. Finally, Section 5 concludes this paper by summarizing the key findings, discussing their implications, and outlining future research directions.

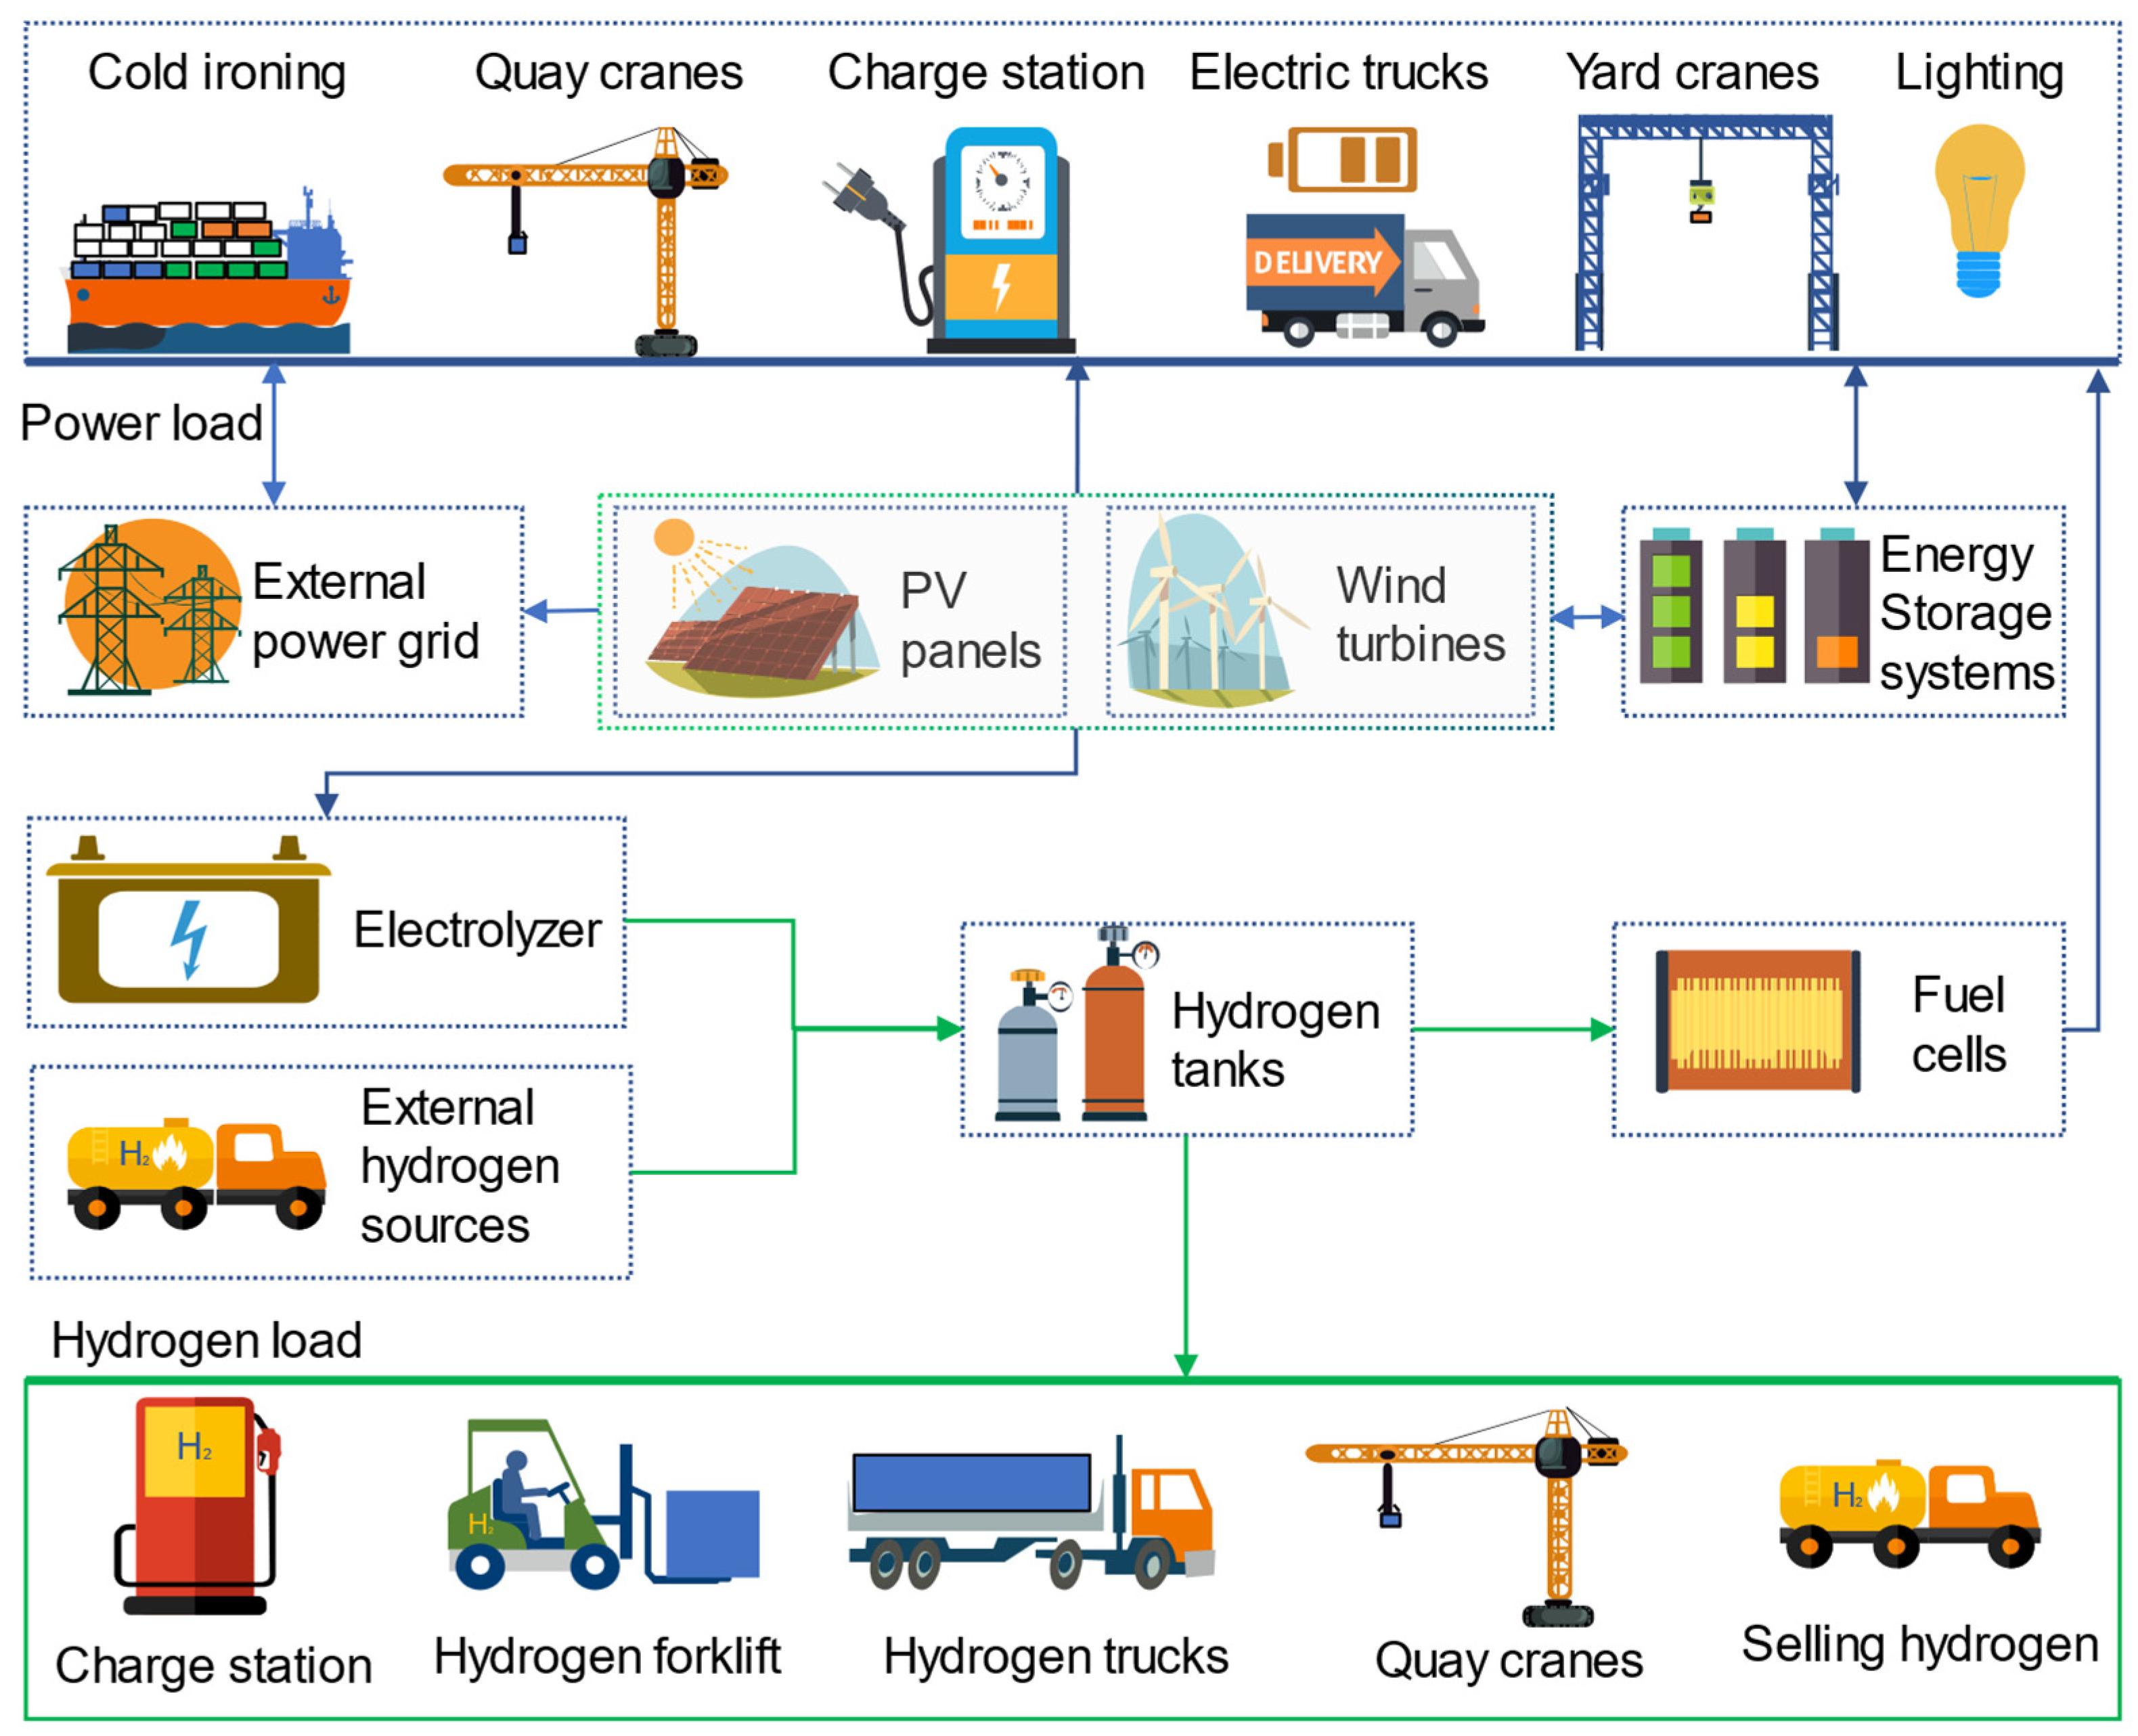
2. Multi-Energy Fusion System Architecture

This section provides an overview of the structure of the PIMES empirically studied in this paper, detailing its core subsystems, including wind and solar power, photovoltaic systems, energy storage, and hydrogen systems.

2.1. System Architecture

Figure 1 illustrates the collaborative operation of electricity and hydrogen in the PIMES in this paper [18], emphasizing the efficient interaction and dynamic balance between these two energy forms. The system significantly enhances energy utilization efficiency and stability by profoundly integrating electricity and hydrogen. It reduces dependence on traditional fossil fuels, providing a robust foundation for green and sustainable port development.
From the power system perspective, primary energy sources include the external grid, PV, and WT. These sources directly supply docked vessels, cranes, electric trucks, and lighting systems in the port. Any surplus electricity is stored in an electrical energy storage system (EESS) for later use during peak demand. Meanwhile, the hydrogen system uses electrolyzers to convert surplus electricity into hydrogen and stores it in a hydrogen energy storage system (HESS). This hydrogen system serves as fuel for hydrogen-powered forklifts, trucks, and cranes. The stored hydrogen can be converted to electricity through a fuel cell to meet additional load requirements in the power system when needed.
Thanks to this seamless integration and complementary mechanism between electricity and hydrogen, the multi-energy system achieves flexible and efficient dispatch while also improving the adaptability and stability of the port’s energy infrastructure. By coordinating multiple energy resources, the PIMES substantially furthers the port’s carbon-reduction objectives and provides sustainable technological support for building greener ports.
Note that other researchers have also studied similar systems. In 2020, Song et al. [19] proposed an integrated port energy system that converts excess electricity into natural gas for storage. In contrast, the PIMES system discussed in this paper stores surplus electricity in the form of hydrogen. Pu et al. [20] introduced a port integrated energy system that uses natural gas for power generation. Likewise, our PIMES model can generate electricity by burning stored hydrogen to meet additional load requirements in the power system when necessary.
Figure 2 shows a real-world image of the PIMES system studied in this paper. As shown in the Figure, WT1 and WT2 represent wind turbines, PV indicates the photovoltaic power station, and Node 1 and Node 6 are substations. EESS1 and EESS2 handle the dynamic regulation of electricity, whereas the HESS stores and distributes hydrogen efficiently. AC/DC denotes alternating current to direct-current conversion devices. In operation, electricity generated by WT1, WT2, and the PV system is first delivered through Node 1 and Node 6 to meet the port’s loads. When there is surplus electricity, the excess is stored in the EESS or, after AC/DC conversion, sent to electrolyzers for hydrogen production. The EESS and fuel cells collectively provide dynamic balancing in case of insufficient electricity. The hydrogen produced is compressed by a compressor and stored in the HESS. It is then delivered through hydrogen pipelines to fuel cells for reconversion into electricity or dispensed at a refueling station to power hydrogen-fueled equipment.

2.2. Subsystem Composition

2.2.1. Wind Power System

Generally, wind power generation has two principal modes: off-grid and grid-connected [22].
Off-grid wind power systems are typically small and paired with energy storage devices or other generation technologies like diesel generators. Although independent and suitable for specific settings without grid access, such systems often yield a smaller total power capacity.
Grid-connected wind power is the main development pathway for wind technology, with capacities ranging from few to hundreds of megawatts. Connected to large grids, grid-connected wind farms can fully capitalize on wind resources and obtain grid support to ensure stable, flexible operation. Grid-connected wind power has the advantages of being clean, renewable, and having a short construction cycle [23].
Two 6.25 MW turbines have been installed in the considered PIMES in this paper, totaling 12.5 MW of capacity. Surplus wind and solar power from the port is consumed on-site first, with any remaining electricity fed into the grid via the 110 kV Zhuwan substation.

2.2.2. Photovoltaic System

Photovoltaic power generation converts sunlight directly into electricity using solar-grade semiconductors, with the generation time aligned with the solar radiation levels. Grid-connected PV power systems offer advantages such as being clean and environmentally friendly, improving power supply stability, and facilitating large-scale integration [24]. By harnessing solar energy, PV systems produce no pollution or carbon emissions and represent one of the most mature and widely applied solar power generation technologies. They optimize peak electricity supply, enhance safety and efficiency, and employ maximum power point tracking technology and centralized inverter management to ensure high integration efficiency, meeting power grid needs like peak shaving and reactive power compensation [25].
This study uses about 24,000 m2 of rooftop space to install distributed rooftop PV cells with a target capacity of roughly 3.66 MWp. The key technical features are as follows:
  • Module selection: 540 Wp PERC high-efficiency monocrystalline modules (conversion efficiency > 20%) and 330 Wp TopCon monocrystalline modules were chosen for the steel rooftop, balancing aesthetics and performance.
  • Power generation efficiency: A distributed PV configuration combines data collection and performance optimization for steady, high-efficiency operation.

2.2.3. Energy Storage System

Energy storage is crucial in PIMESs, primarily to mitigate renewable energies’ unstable and intermittent nature and ensure stable operation by balancing supply and demand. The energy storage system provides key functionalities such as peak shaving, frequency regulation, and power quality management and is an emergency backup power source.
In the integrated multi-energy system studied in this paper, two centralized electrochemical energy storage systems were designed:
  • 3.8 MW/0.8 MWh system: This employs lithium titanate batteries and is comprised of one storage unit with one battery cabin and one step-up converter cabin.
  • 2.5 MW/3 MWh system: Similarly, lithium titanate batteries comprise one storage unit with two battery cabins and one step-up converter cabin.

2.2.4. Hydrogen Energy System

The hydrogen energy system is characterized by its clean and efficient nature, offering zero carbon emissions and the ability to store energy on a large scale, making it suitable for meeting emission reduction needs across various sectors [26]. Additionally, the system enables flexible energy conversion across different domains through water electrolysis for hydrogen production and power generation using fuel cells. This enhances the system’s economic viability and improves its overall control and adaptability [27].
To address the intermittent nature of renewable power and avoid wasted energy, the ports studied in this paper convert surplus electricity into hydrogen, harnessing it cleanly and effectively. The hydrogen system is divided into production, storage, and utilization components:
  • Hydrogen production: A 500 Nm3/h water-electrolysis hydrogen plant, including a hydrogen purification device, is installed. The electrolyzer uses electricity to split water and yield hydrogen with 99.8% purity, further purified to 99.999% for practical applications.
  • Hydrogen storage: The system includes high and medium-pressure hydrogen tanks (20 MPa and 45 MPa), each with capacities of 49.35 m3 and 9 m3, respectively. Compressors (one at 20 MPa and one at 45 MPa) feed hydrogen into the storage tanks for subsequent dispensing.
  • Hydrogen fuel cell systems: A 280 kW fuel cell system offers backup power for the port, featuring three 120 kW fuel cell modules that yield 94 kW. The hydrogen-powered equipment includes heavy-duty hydrogen trucks, hydrogen forklifts, and hybrid fuel cell yard cranes.

3. Methodology

This study adopts an empirical research approach structured in three main phases. In the first phase, we propose a series of evaluation methods specifically designed for assessing the performance of the multi-energy integration system. In the second phase, the required date are collected. Finally, in the third phase, we analyze the collected data to draw robust conclusions regarding the system’s performance. This section details the approaches used to assess the PIMES and its various subsystems.

3.1. System-Level Evaluation Methods

This section develops a comprehensive evaluation process for the emission performance of a port integrated multi-energy system, covering from accounting methods to collaborative emission reduction analysis.

3.1.1. Energy and Emission Calculation Methods

This study uses electricity-based conversion to calculate CO2 emissions and other pollutants, deriving emission factors from a combination of energy balance, empirical data, China’s energy structure, and technological advances. The steps for calculating CO2 and other pollutant emissions are as follows:
  • Determine electricity consumption: Calculate the port’s total electricity consumption over a specific period, covering all relevant equipment.
  • Convert to standard coal consumption: Convert the electricity consumption into standard coal based on the coefficient (0.4 kg of standard coal per kWh [28]).
  • Calculate emissions: Determine the standard coal-to-CO2 and pollutant emission factors (Table 1). Multiply these factors by the amount of standard coal to determine the emissions of CO2, SO2, NOX, etc.
The formulas are as follows:
m c = 0.68 m s c
m C O 2 = 2.49 m s c
m S O 2 = 0.075 m s c
m N O x = 0.038 m s c
Here:
  • m c is carbon emissions,
  • m s c is standard coal,
  • m C O 2 is CO2 emissions,
  • m S O 2 is SO2 emissions,
  • m N O x is NOX emissions.
Note: In practice, the real-world standard coal consumption per kWh of electricity exceeds a theoretical 0.123 kg. Given actual power generation, electricity coal consumption rates, various coal types, and standard coal reference coefficients, the industry often uses Table 1’s coefficients.

3.1.2. Collaborative Emission Reduction Calculation

Energy conversion coefficient: Different energy types are converted to standard coal based on lower heating values. This provides a unified measuring unit (standard coal) for comparing multiple energy consumptions:
C i = Q i × q i
Here:
  • C i is total standard coal consumption (t),
  • Q i is the physical amount of fuel used (t),
  • q i is the conversion factor (tce/t or tce/kWh),
  • i is the energy type.
Emission reduction contributions: Based on the amount of clean energy used to replace fossil-based electricity, the resulting reduction in CO2, SO2, etc. is calculated. The collaborative emission reduction contribution rate (CR) expresses each clean energy’s relative share:
C R x , y = Δ C R x / Δ C R x , y
Here:
  • C R x , y is the contribution rate (%) of clean energy x for pollutant y,
  • Δ C R x is the pollution reduction achieved using clean energy x (t),
  • Δ C R x , y is the total pollutant y reduction achieved by employing all clean energies (t).

3.2. Subsystem Evaluation Method

The following will introduce the performance evaluation methods for four systems: wind power, photovoltaic, energy storage, and hydrogen energy.

3.2.1. Wind Energy System Performance Evaluation

The performance evaluation of a wind energy system primarily focuses on two key aspects: availability and utilization rate.
Availability Evaluation
Availability measures the actual electricity generation time ratio to theoretical generation time within a given period. Theoretically, a wind turbine should generate power when wind speeds are between the cut-in and cut-out wind speeds.
  • Cut-in wind speed is the minimum wind speed required for the wind turbine to start generating power.
  • Cut-out wind speed is the critical wind speed beyond which the turbine shuts down to prevent damage, either through emergency braking or by adjusting the blade pitch to the maximum.
For a wind farm, the wind turbine should be in operation when the wind speed is between the cut-in and cut-out speeds. The turbine is considered unavailable if no power is generated during this period.
The availability of a wind turbine can be calculated using the following equation [29]:
a = N { v c u t i n < v < v c u t o u t , P > 0 | ( v , P ) } N { v c u t i n < v < v c u t o u t | ( v , P ) }
Here:
  • a is the availability of the wind turbine,
  • V is wind speed,
  • V c u t i n is cut-in wind speed,
  • V c u t o u t is cut-out wind speed,
  • P is power output,
  • N { } is the number of valid data points.
In application, 10 min average data provided by the SCADA (Supervisory Control and Data Acquisition) system is used to compute this indicator. The denominator of Equation (7) approximates the total theoretical generation time, while the numerator represents the actual generation time. Availability reflects the proportion of time that the turbine operates when wind conditions are favorable for power generation, providing valuable insights for failure time analysis and maintenance decisions.
Utilization Rate Evaluation
The utilization rate of a wind turbine reflects its operational efficiency and reliability, indicating the proportion of time it is generating power without fault. Time-based availability (TBA) represents the percentage of time within a specific evaluation period that the wind turbine is available for operation [30]. The equation is as follows:
T B A = ( 1 T U T A + T U )  
Here:
  • T B A is the wind turbine utilization rate,
  • T A is available hours,
  • T U is unavailable hours.
After installation, the theoretical total operational time for the turbine (e.g., 8760 h in a year) is fixed. Unavailability caused by external factors (such as environmental conditions or grid constraints) is not included in the utilization rate evaluation. Therefore, the turbine’s utilization rate is primarily affected by downtime due to faults.
The smaller the downtime due to faults, the higher the turbine’s utilization rate. By identifying subsystems responsible for the most significant downtime and performing regular maintenance, the utilization rate can be effectively improved [31].

3.2.2. PV System Performance Evaluation

In evaluating the performance of a PV system, power generation performance is one of the core indicators, directly affecting the system’s energy conversion efficiency and economic benefits. To thoroughly analyze the PV system’s performance, the following key metrics are examined:
  • System efficiency: Measures the ability of the PV system to convert solar energy into electricity.
  • Conversion efficiency: Reflects the energy conversion efficiency of the PV cells.
  • Electrical efficiency: Assesses the energy losses during the electrical output process.
These indicators help to provide a clearer understanding of the PV system’s actual generation efficiency and operational state, offering valuable data for system optimization and economic benefit improvements [32]. The following explains each indicator in detail.
System Efficiency
System efficiency (performance ratio, PR) is an important metric that reflects the overall energy conversion capability of the PV power station, usually obtained through field testing. The testing period should exceed one week, with synchronized meteorological and generation measurement devices [33].
The system efficiency is calculated as follows:
P R = ( E O U T , τ C I ) / ( G G 0 )
Here:
  • P R is the performance ratio,
  • E O U T , r is the total energy output of the PV system during the τ period, in kilowatt-hours (kWh),
  • C I is the installed capacity of the PV system in kilowatts (kW),
  • G is total irradiance received by the PV array during the τ period, in kWh/m2,
  • G 0 is standard irradiance condition, set to 1 kW/m2.
System efficiency provides an integrated measure of the PV system’s operational performance under varying environmental conditions and is a crucial basis for operations and maintenance optimization.
Conversion Efficiency
Conversion efficiency measures the ability of the PV cells to convert light energy into electrical energy. This efficiency is influenced not only by the materials and structure of the cells but also by environmental factors such as temperature and light intensity [34].
The conversion efficiency is calculated as follows:
n = P o u t , υ A × P i n , υ × 100 %
Here:
  • n is the conversion efficiency (%),
  • P o u t is the maximum output power under standard test conditions (kW),
  • A is the area of the photovoltaic cells (m2),
  • P i n is the solar irradiance incident on the PV cells during the υ period (kWh/m2).
Electrical Efficiency
Electrical efficiency assesses the energy losses during the power output process. This metric is evaluated using field tests under operational conditions, with data provided by the PV system’s SCADA system.
Tests are typically conducted under clear skies with strong sunlight, and measurements are taken when irradiance exceeds 800 W/m2. Electrical efficiency is calculated as follows:
η p = P O U T C I × 100 %
Here:
  • η p is electrical efficiency (%),
  • P O U T is the total output power of the PV system (kW),
  • C I is the installed capacity of the PV system (kW).
Electrical efficiency testing results provide essential data for loss analysis and system optimization.

3.2.3. Energy Storage System Performance Evaluation

When evaluating the performance of an energy storage system, this section focuses on energy efficiency and energy density.
Energy Efficiency Evaluation
Energy performance is a key indicator of whether an energy storage system can efficiently and stably output electrical power. It affects both the energy utilization during charging and discharging and the overall efficiency of the system in grid-connected operations [35].
Common energy performance indicators include the following:
  • Energy efficiency (charge/discharge efficiency): Measures energy conversion efficiency during charging and discharging.
  • Power factor: Reflects the quality of the power output.
  • Response time: Assesses the system’s ability to respond to load changes quickly.
The core indicator for energy performance evaluation is energy efficiency, calculated as follows:
η = E d i s c h a r g e E c h a r g e × 100 %
Here:
  • η is energy efficiency (%),
  • E c h a r g e is energy input to the battery module (charging energy),
  • E d i s c h a r g e is energy output from the battery module (discharging energy).
The energy efficiency calculation directly measures energy loss during the charging and discharging process and offers valuable insights for system efficiency optimization.
Energy Density Evaluation
Energy density focuses on the storage system’s mass and volume energy density. These two parameters are critical for evaluating the energy storage capability of batteries or battery modules [36].
  • Mass energy density
Mass energy density, expressed as the amount of energy (Wh/kg) that can be stored per unit mass, is an important performance indicator of energy storage systems in weight-limited scenarios. A higher quality energy density means the battery can provide more energy with a smaller weight, improving portability and efficiency.
(1) Charging mass–energy density:
The calculation method for charging quality energy density is to divide the battery module’s initial charging energy by the battery module’s total mass.
W g c = E c h a r g e m
Here:
  • W g c is the charging mass–energy density (Wh/kg),
  • E c h a r g e is the initial charging energy,
  • m is the mass of the battery (kg).
(2) Discharging mass–energy density:
The calculation method for discharge mass–energy density is to divide the initial discharge energy of the battery module by the total mass of the battery module.
W g d = E d i s c h a r g e m
Here:
  • W g d is the discharging mass–energy density (Wh/kg),
  • E d i s c h a r g e is the initial discharging energy,
  • m is the mass of the battery (kg).
  • Volume energy density
Volume energy density: Measures the energy stored per unit volume (Wh/L), which helps to assess space efficiency in constrained environments. A higher volume energy density allows for more energy storage in a limited space, improving system compactness and performance [37].
(1) Charging volume energy density:
The calculation method for volumetric energy density during charging is to divide the initial charging energy of the battery module by its volume.
W v c = E c h a r g e V
Here:
  • W vc is the charging volume energy density (Wh/L),
  • E c h a r g e is the initial charging energy,
  • V is the volume of the battery (L).
(2) Discharging volume energy density:
The calculation method for discharge volume energy density is to divide the initial discharge energy of the battery module by the volume of the battery module.
W v d = E d i s c h a r g e V
Here:
  • W v d is the discharging volume energy density (Wh/L),
  • E d i s c h a r g e is the initial discharging energy,
  • V is the volume of the battery (L).

3.2.4. Hydrogen Energy System Performance Evaluation

The evaluation of hydrogen energy systems focuses on technical efficiency, particularly key performance indicators for hydrogen production systems, such as hydrogen production rate and efficiency.
Hydrogen Production Rate
The hydrogen production rate [38] is a fundamental indicator of system performance, representing the volume of hydrogen produced over a specific time period, typically measured in standard cubic meters per hour (Nm3/h). Higher hydrogen production rates indicate greater production capacity.
Hydrogen Production Efficiency
Hydrogen production efficiency assesses the system’s ability to convert electrical energy into chemical energy stored in hydrogen, commonly represented as the energy conversion efficiency (ECE). The equation is as follows [39]:
E C E = L H V × Q H 2 3.6 × U × I × t × 100 %
Here:
  • E C E is hydrogen production efficiency (%),
  • LHV is a lower heating value of hydrogen (MJ/Nm3),
  • Q H 2 is total hydrogen produced (m3),
  • U is the system’s input voltage (V),
  • I is the system’s input current (A),
  • t is hydrogen production time (hours).
This formula directly measures the system’s efficiency in converting electrical energy into chemical energy stored in hydrogen.
Illustration:
  • The numerator L H V × Q H 2 represents the total chemical energy stored in the hydrogen.
  • The denominator U × I × t represents the total electrical energy consumed by the system during hydrogen production.
  • Using this formula, the system’s efficiency in converting electrical energy into the chemical energy stored in hydrogen can be intuitively assessed.

4. Results Analysis

4.1. System Performance Analysis

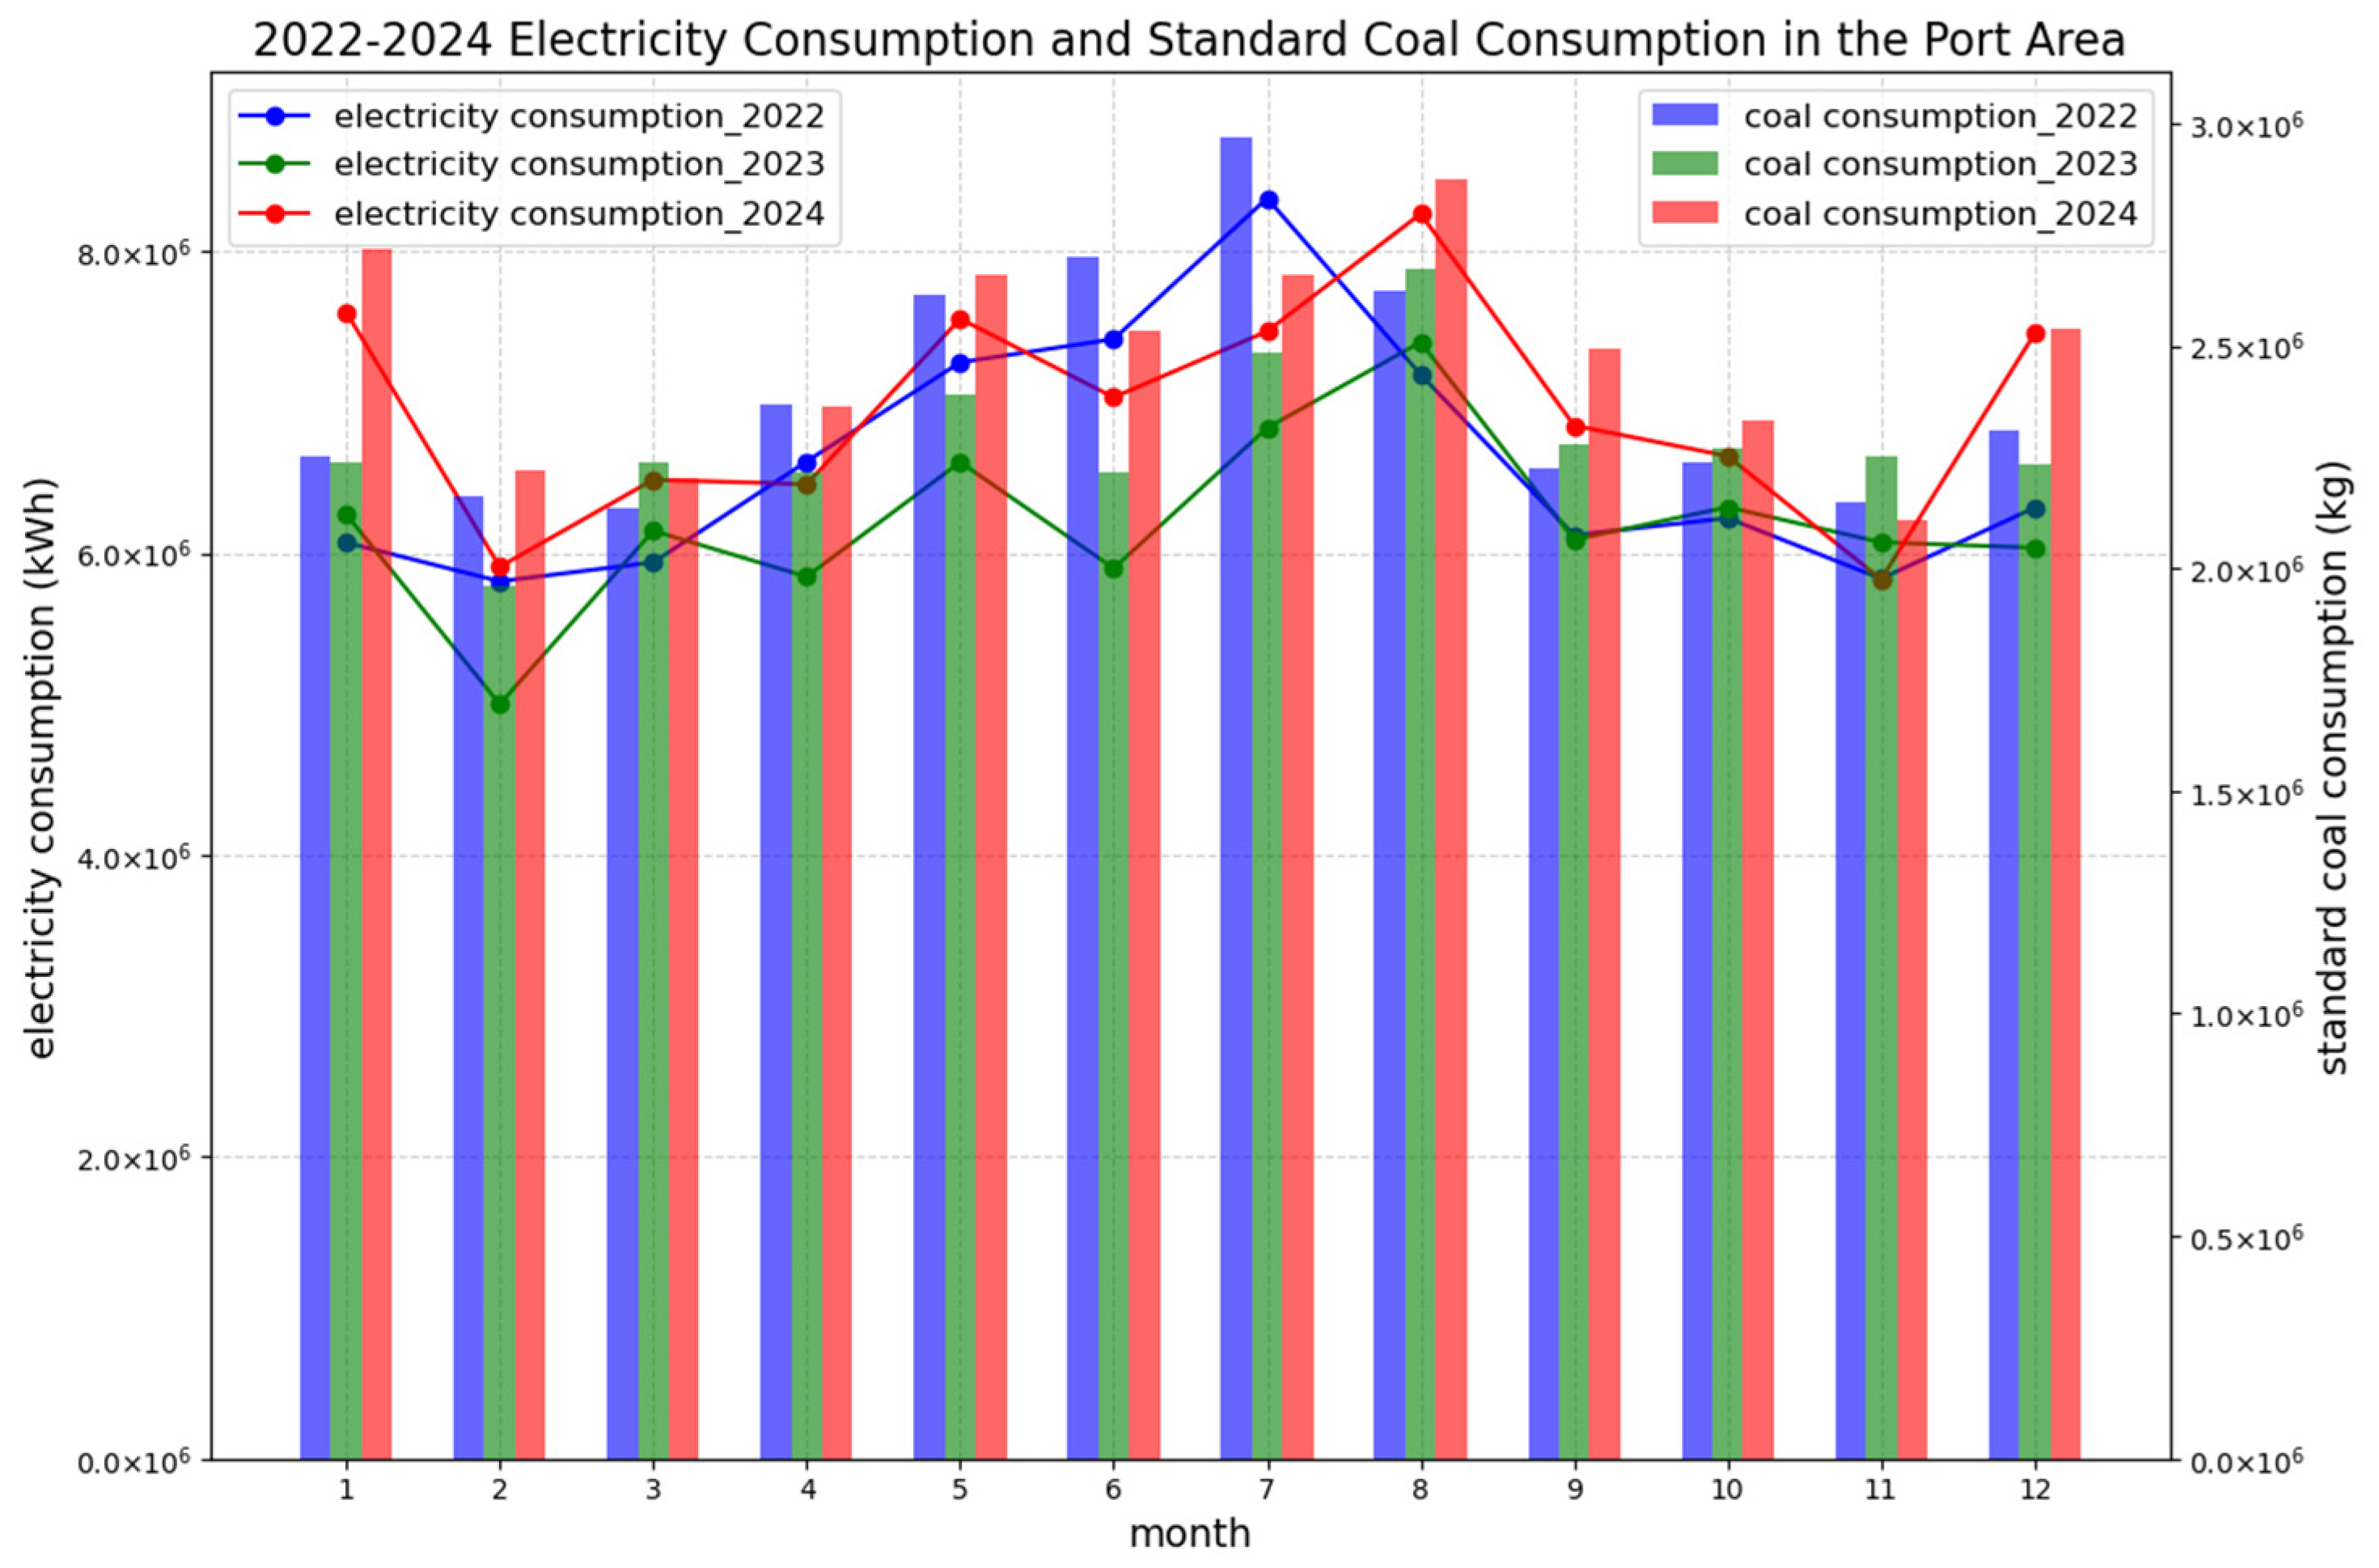
4.1.1. Energy Consumption and Emission Characteristics Analysis

Table 1 presents the annual statistics of total electricity consumption, total energy consumption, CO2, and pollutant emissions in the port area from 2019 to 2023. The data reveal trends and changes in energy management and environmental protection within the port area.
Firstly, the total electricity consumption during these five years showed relatively stable fluctuations. From 2019 to 2023, the total electricity consumption slightly increased from 0.75 billion kWh to 0.745 billion kWh, with no significant changes. This indicates that the port’s electricity demand remained steady, likely tied to consistent production and transportation activities. Meanwhile, the energy consumption and CO2 emissions displayed a downward trend, especially after 2021, with more noticeable reductions in energy consumption and CO2 emissions. Specifically, the energy consumption in 2023 was 27,450 tons, a reduction of approximately 2000 tons compared to 2019, and the CO2 emissions decreased from 73,608 tons in 2019 to 68,351 tons in 2023, marking a reduction of nearly 7%.
In addition, the SO2 and NOx emissions also declined annually. In 2023, the SO2 emissions were 2059 tons, a reduction of 158 tons compared to 2019, while the NOx emissions fell from 1123 tons in 2019 to 1043 tons in 2023. This demonstrates that the port has significantly improved pollutant control and emission reduction. While the port’s electricity consumption remained relatively stable, its energy efficiency and environmental performance improvements were notable.
Figure 3 and Figure 4 illustrate the monthly electricity consumption, standard coal consumption, and emission trends in the port area from 2022 to 2024, as well as the monthly electricity consumption and pollutant emissions of the port in 2023.
From Figure 3, it can be observed that monthly electricity consumption and standard coal consumption exhibit more pronounced seasonal fluctuations. Electricity consumption is significantly higher in the winter (e.g., December–January) and summer (e.g., July–August) of each year, particularly in the winter. This may be due to increased heating demands and port activities, leading to rising electricity demand and standard coal consumption. In 2023 and 2024, winter and summer electricity consumption levels were more prominent, while 2022 showed relatively stable fluctuations, indicating differences in electricity demand across these years.
Figure 4 shows the monthly variations in carbon emissions, CO2 emissions, SO2 emissions, and NOx emissions in 2023. Similar to the electricity consumption trends, pollutant emissions also exhibited significant seasonal fluctuations. Notably, the increased electricity consumption during the winter and summer directly led to higher emissions, especially CO2 emissions, which peaked in certain months (e.g., May and October).

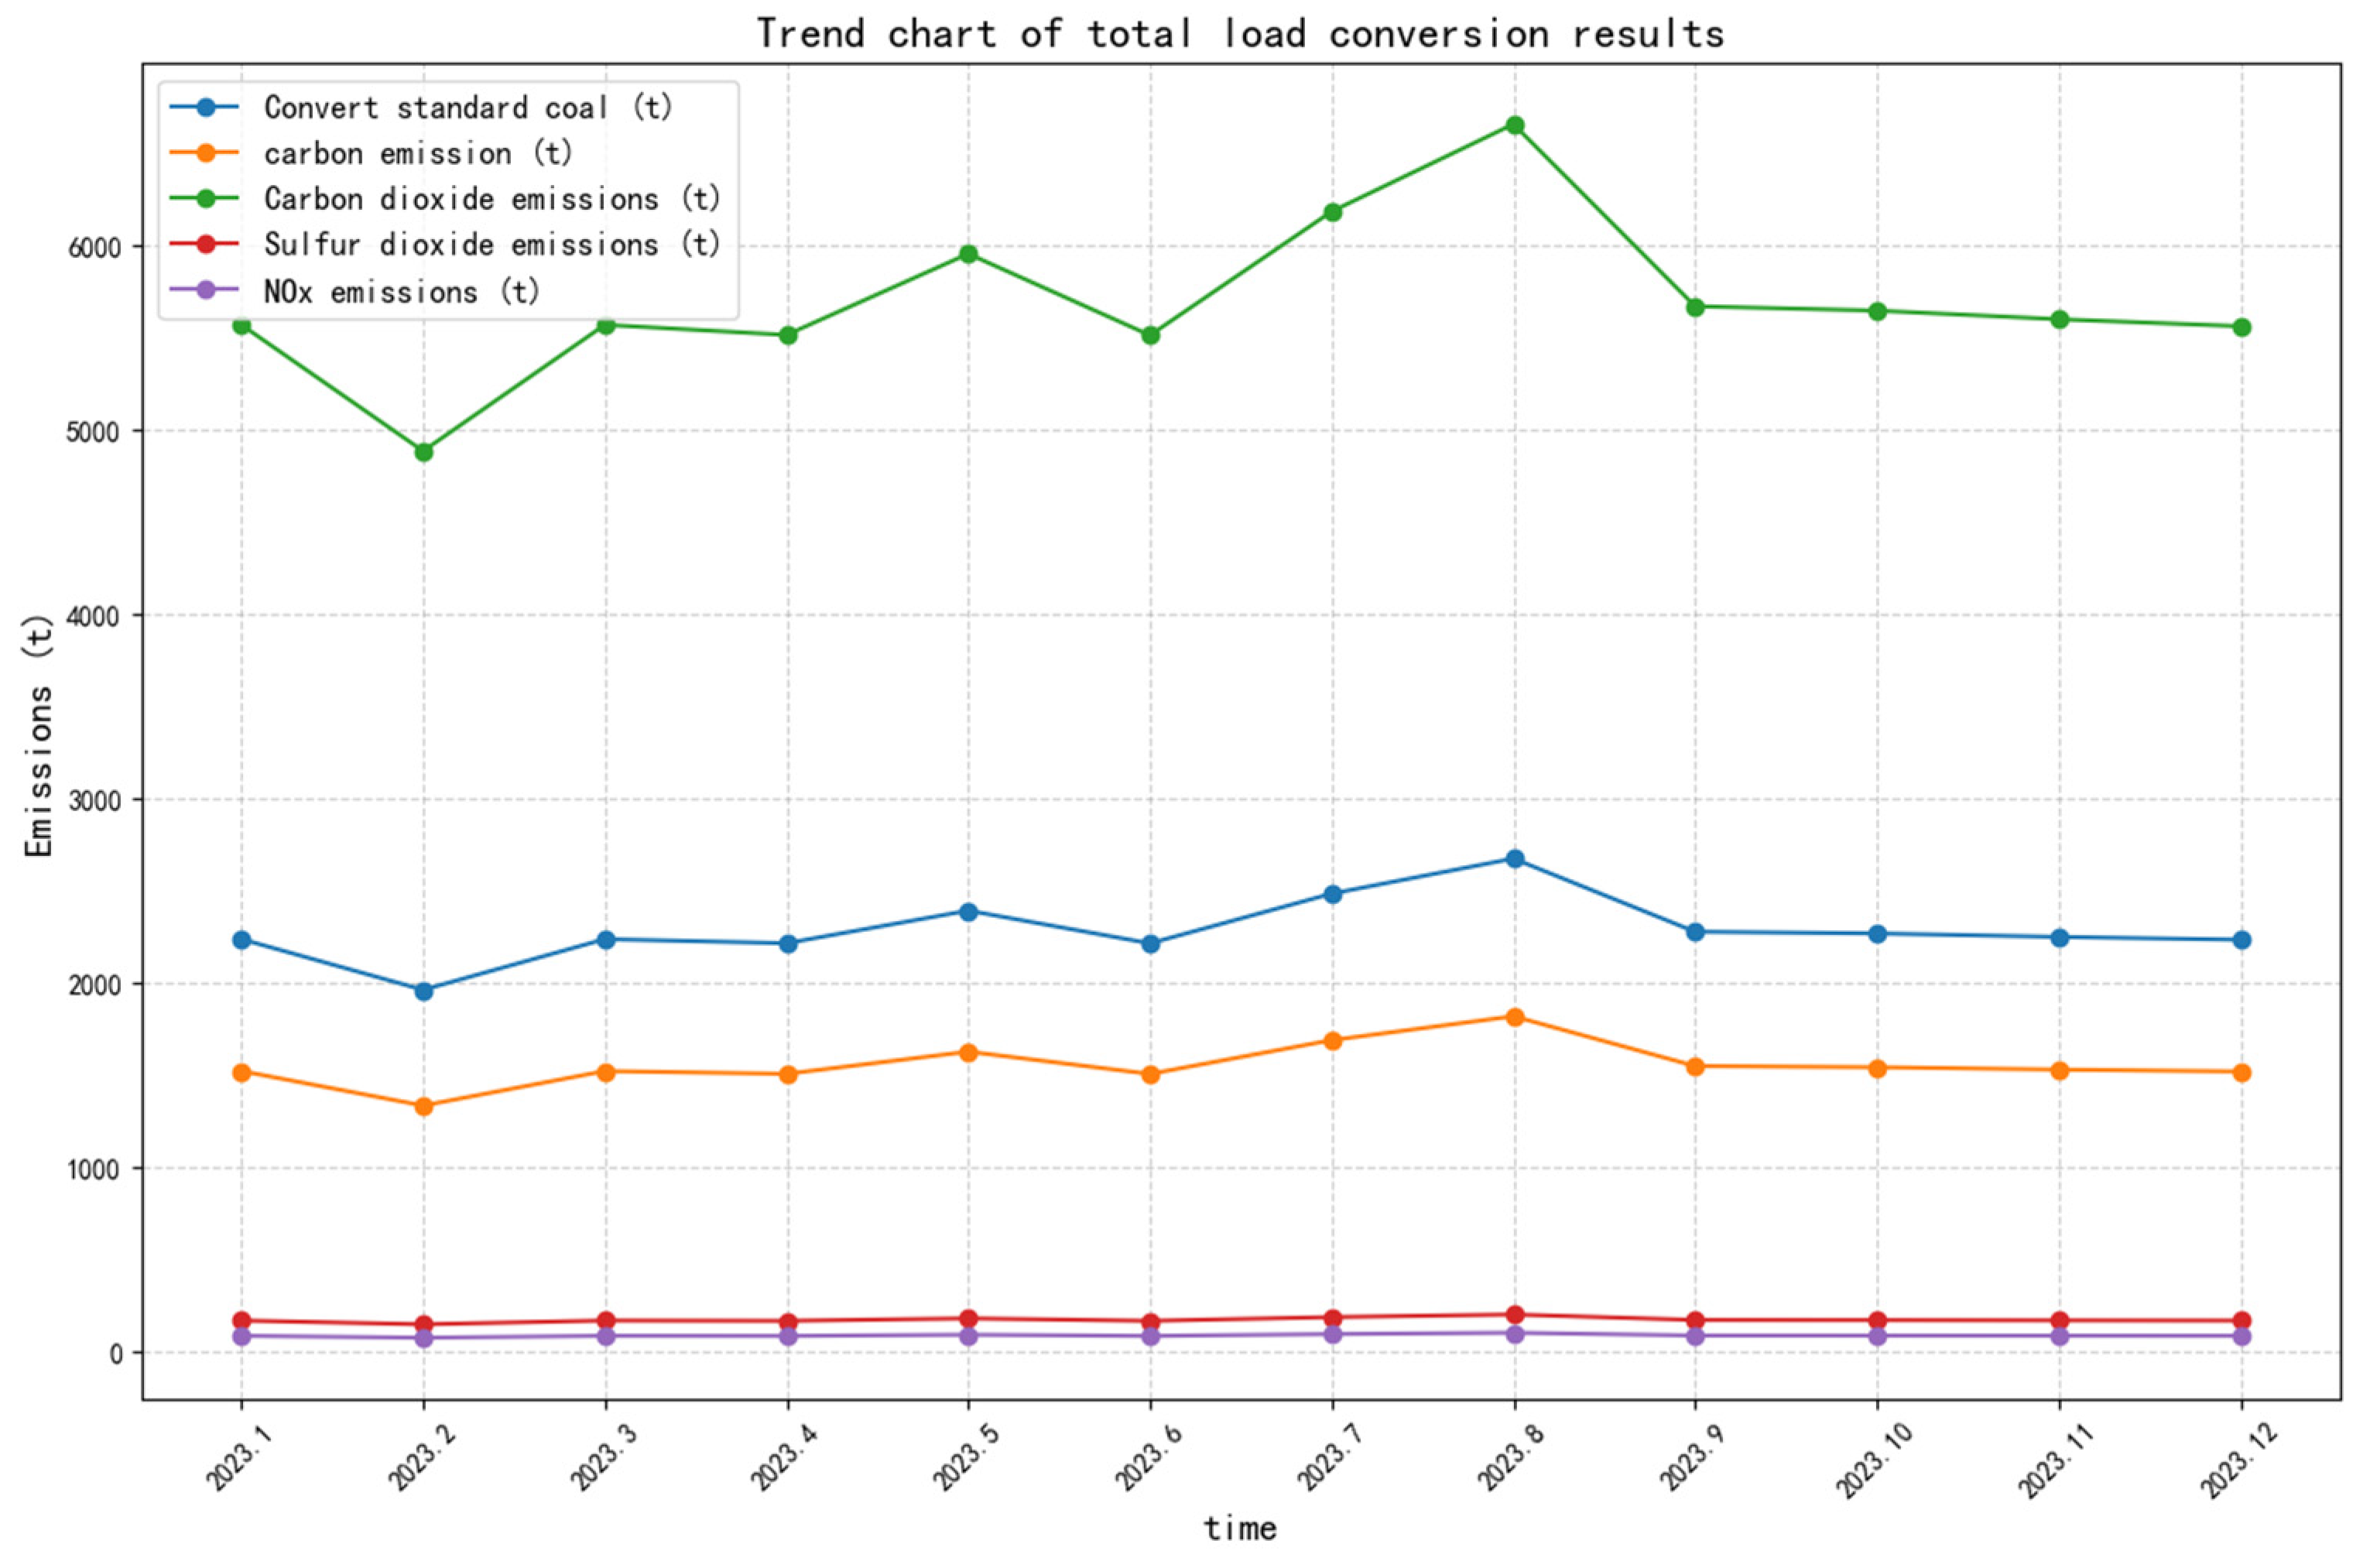
4.1.2. Emission Reduction Effects Analysis

Energy Savings, CO2, and SO2 Emission Reductions
Using the calculation method in Equation (5), the energy savings and emission reductions achieved by replacing fuel or grid electricity with various types of clean energy in the multi-energy integrated system in September 2024 were calculated. The results are shown in Table 2.
The table indicates that replacing fuel or grid electricity with clean energy in the multi-energy integrated system reduces energy consumption. All clean energy applications demonstrated significant CO2, SO2, and NOx emission reduction effects.
Contribution Analysis of Clean Energy to Collaborative Emission Reductions
Based on Equation (6), the collaborative emission reduction contribution rate of clean energy was calculated, and the results are shown in Table 3.
The results indicate that wind power contributes the most to collaborative emission reductions in the multi-energy integrated system, accounting for 84%, followed by solar PV at 16% and shore power at 1%. The application of various clean energy sources in the port significantly reduced SO2 and CO2 emissions as the primary contributors to clean energy substitution, while wind and solar energy played a significant role in collaborative emission reductions.

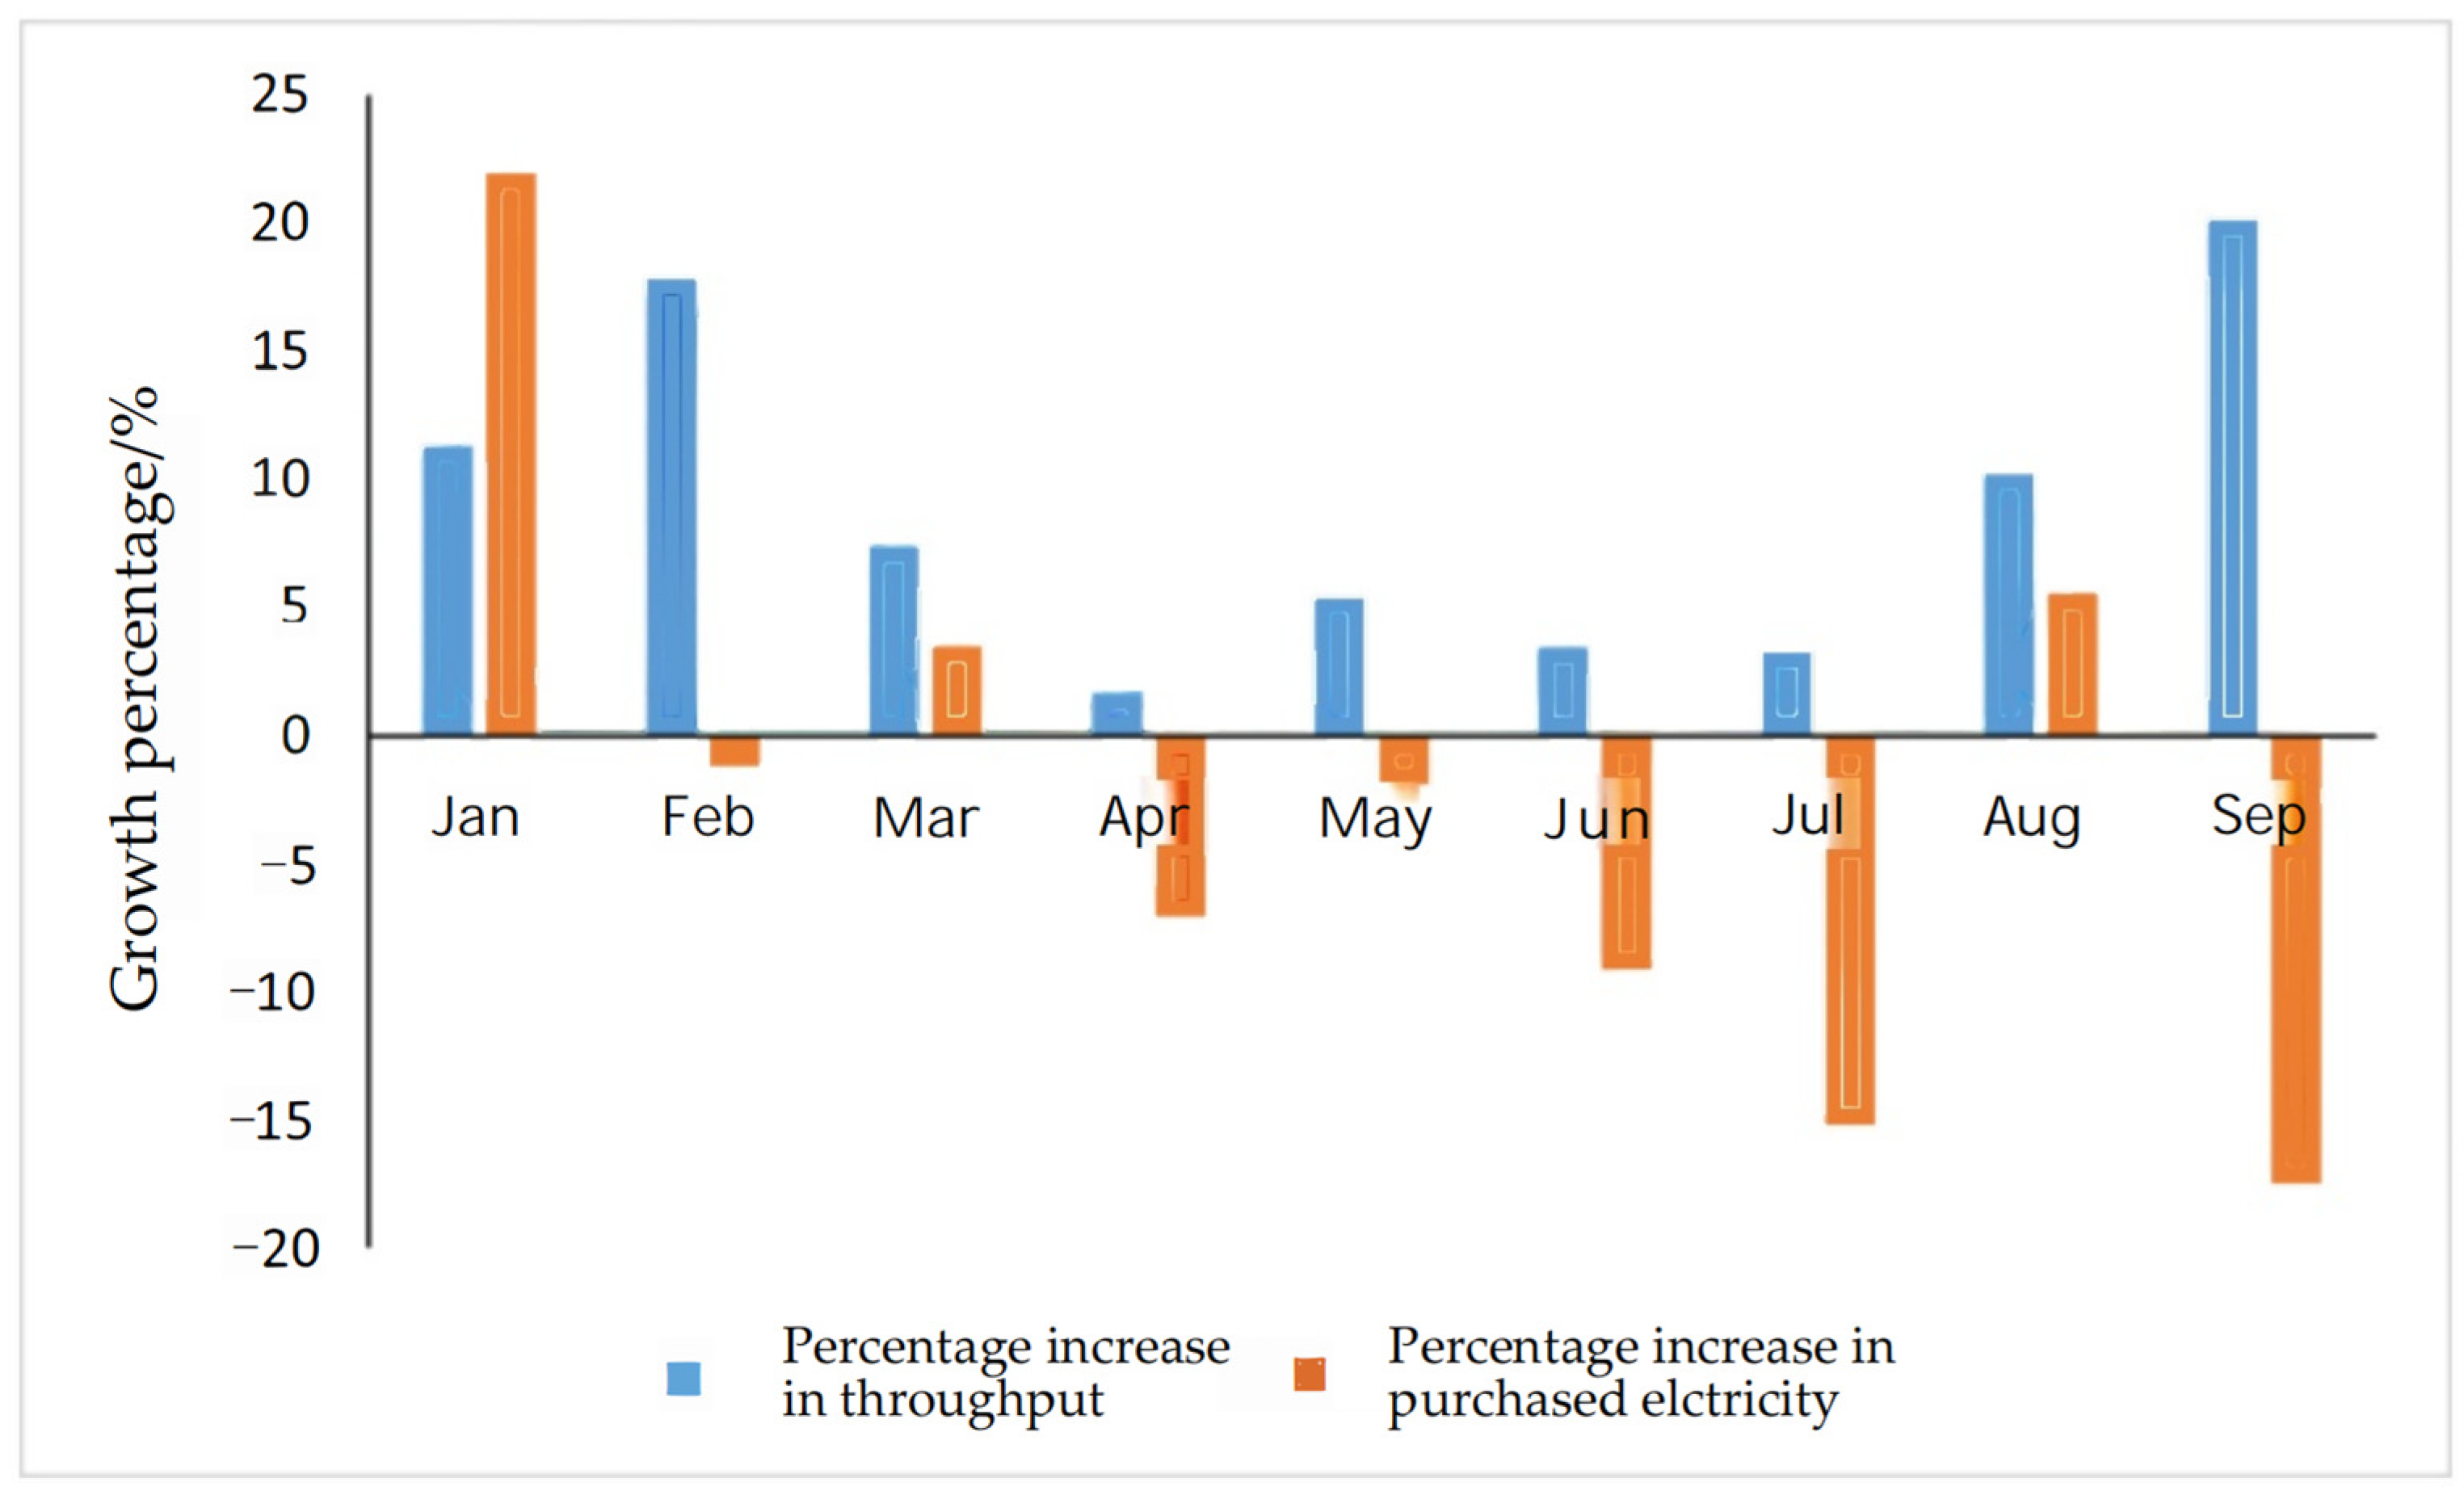
4.1.3. Comparison Analysis Before and After the Implementation of the Multi-Energy Integration System

Since the photovoltaic system was officially put into operation in May 2023, the multi-energy integration system has entered the implementation stage of renewable energy generation. With the integration of the wind power system into the grid in August 2024, the port area has gradually formed a multi-energy integration model centered around wind and solar power, combined with grid electricity and energy storage. The following analysis compares the impact of the multi-energy integration system on purchased electricity, energy efficiency, and the contribution of renewable energy to the overall energy structure. Purchased electricity is defined as the total electricity consumption minus the internal electricity generated from wind, solar, and other sources.
Impact of the Multi-Energy Integration System on Purchased Electricity
Figure 5 compares the purchased electricity before and after implementing the multi-energy integration system in 2023. As seen in the figure, the throughput in the second half of 2023 showed significant growth compared to the same period in 2022, but the purchased electricity decreased. Specifically, from September to December 2023, the throughput increased by 32.5%, 27.97%, 20.96%, and 25.06%, respectively, compared to the same months in 2022, while the purchased electricity decreased by 6.2%, 3.67%, 0.21%, and 7.26% in the same period.
This trend suggests that integrating photovoltaic power generation has effectively reduced traditional energy consumption and improved energy utilization efficiency. As throughput significantly increased, the decrease in purchased electricity highlights the positive impact of solar power integration in the multi-energy system.
Performance of the Multi-Energy Integration System in 2024
Figure 6 shows the percentage growth in throughput and purchased electricity from January to September 2024, before and after implementing the multi-energy integration system. The figure shows that the port’s container throughput continued to grow, while the purchased electricity showed an overall declining trend. Except for January, March, and August, the electricity purchased was lower than in the same period last year.
In January, while throughput increased by 11.33%, the purchased electricity grew by 21.96%. This was mainly due to shorter sunlight hours in January, leading to insufficient photovoltaic power generation. Additionally, the increase in electricity consumption was closely linked to the growth in throughput, reflecting the seasonal variation of photovoltaic power generation.
From February to July, the purchased electricity gradually decreased, or its growth rate slowed, indicating photovoltaic power’s positive effect on the multi-energy integration system. After the wind power system was integrated into the grid on August 20, the energy structure of the port area changed significantly. Compared to January, the throughput growth percentage in August remained similar. Still, the increase in purchased electricity dropped dramatically from 21.96% to 5.55%, highlighting the significant impact of wind power integration on improving energy efficiency.
In September, as the wind power system stabilized, the port’s throughput increased by 20.12% year-over-year, while the purchased electricity decreased by 17.48%, further demonstrating the potential of the multi-energy integration system to reduce traditional energy consumption.

4.2. Subsystem Performance Analysis

4.2.1. Performance Analysis on Wind Power System

This section analyzes the operational performance of the wind power generation system from two aspects: availability and utilization rate. The results are shown in Figure 7.
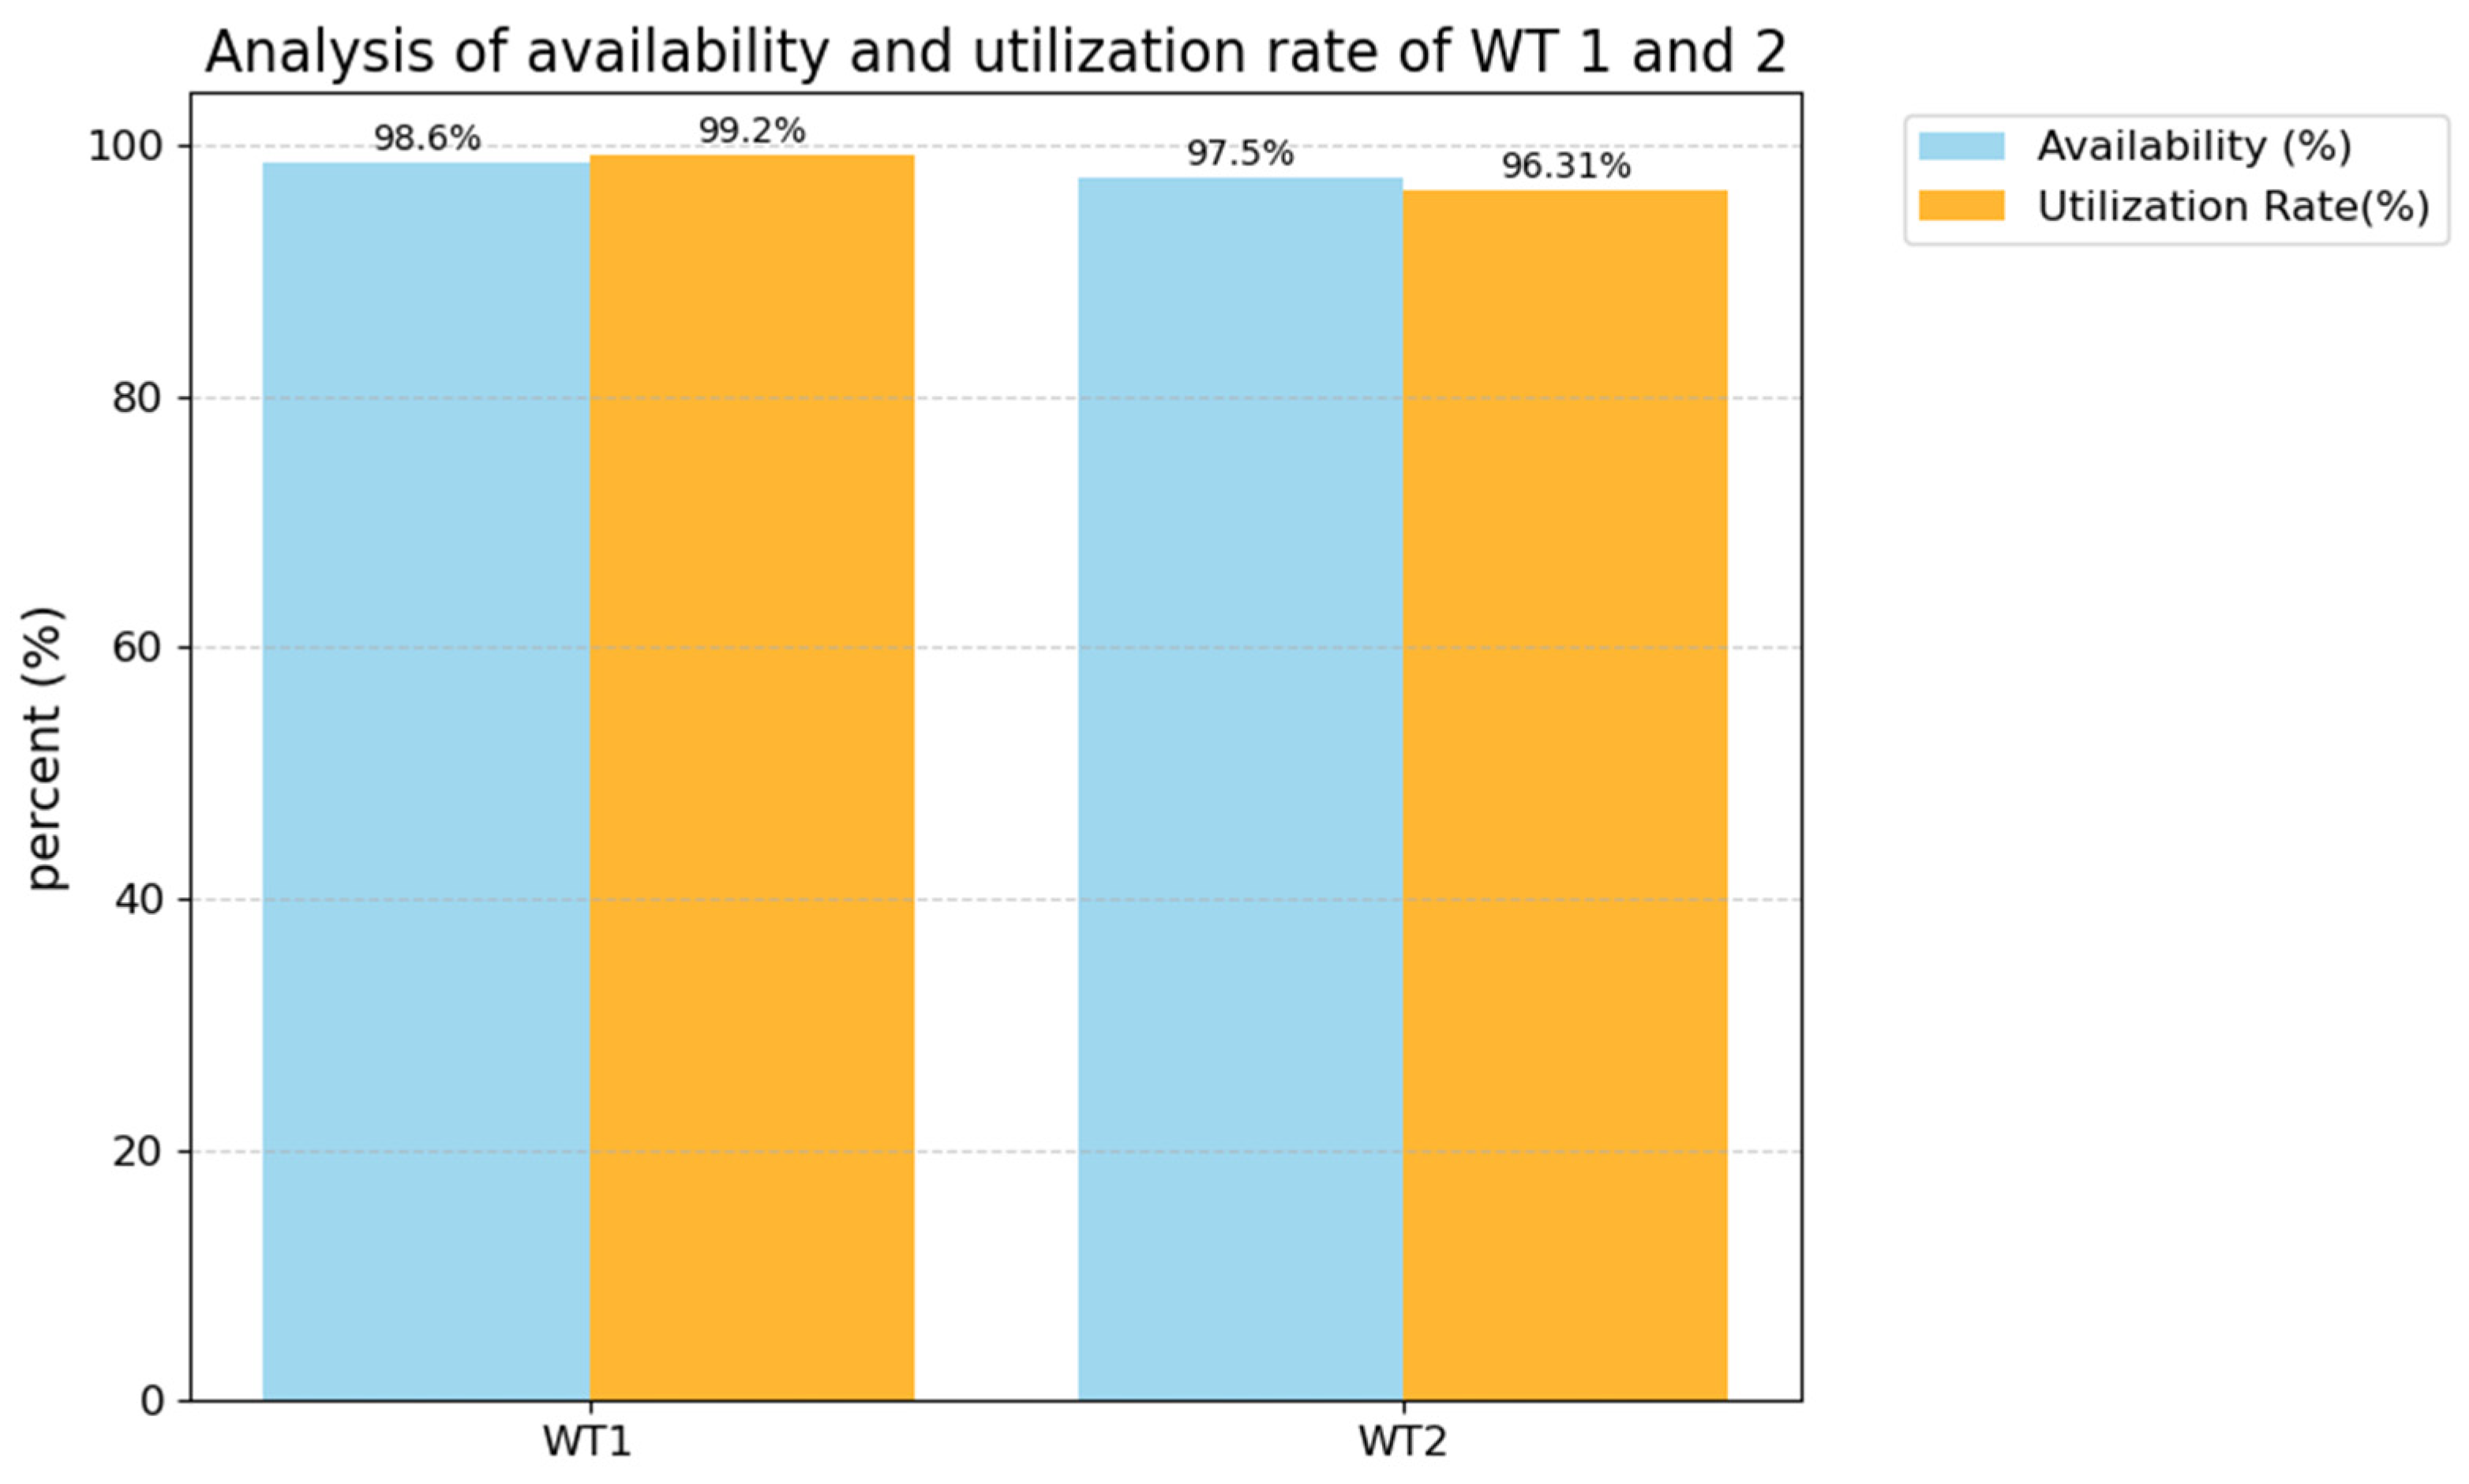
Availability Analysis
From 20 August 2024 to 20 October 2024, based on 10 min average data collected by the SCADA system, the availability of WT1 and WT2 was analyzed. A total of 8928 data points were collected for each turbine. The results show that the availability of Wind Turbine 1 is 0.986, and the availability Wind Turbine 2 is 0.975.
Analysis: Availability refers to the ratio of actual power generation time to theoretical power generation time within the statistical period and is an essential indicator of turbine performance. Both turbines could generate power under favorable wind conditions for most of the time, indicating high efficiency and reliability while minimizing downtime caused by equipment failure or maintenance.
Utilization Rate Analysis
During the same period, the utilization rates of WT1 and WT2 were assessed. WT1 had 1476.162 h of available time and 11.838 h of unavailable time, while WT2 had 1433.143 h of available time and 54.857 h of unavailable time. Based on the utilization rate formula, the utilization rate of WT1 was 99.20%, and for WT2, it was 96.31%.
Analysis: The utilization rate reflects the proportion of time a turbine is available for power generation in a given period and is a key indicator of operational efficiency and reliability. WT1’s utilization rate of 99.20% is close to optimal, indicating it maintained regular operation most of the time, with only brief interruptions for maintenance or failures. WT2’s utilization rate of 96.31% is also reasonable but shows that its downtime (54.857 h) was significantly higher than WT1’s (11.838 h), approximately five times greater.

4.2.2. Performance Analysis on PV System

This section analyzes the operational performance of the PV power generation system from three perspectives: system efficiency, conversion efficiency, and electrical efficiency, as shown in Figure 8. The analysis indicates that while the system’s conversion and electrical efficiencies are high, the overall system efficiency is relatively low, suggesting room for optimization.
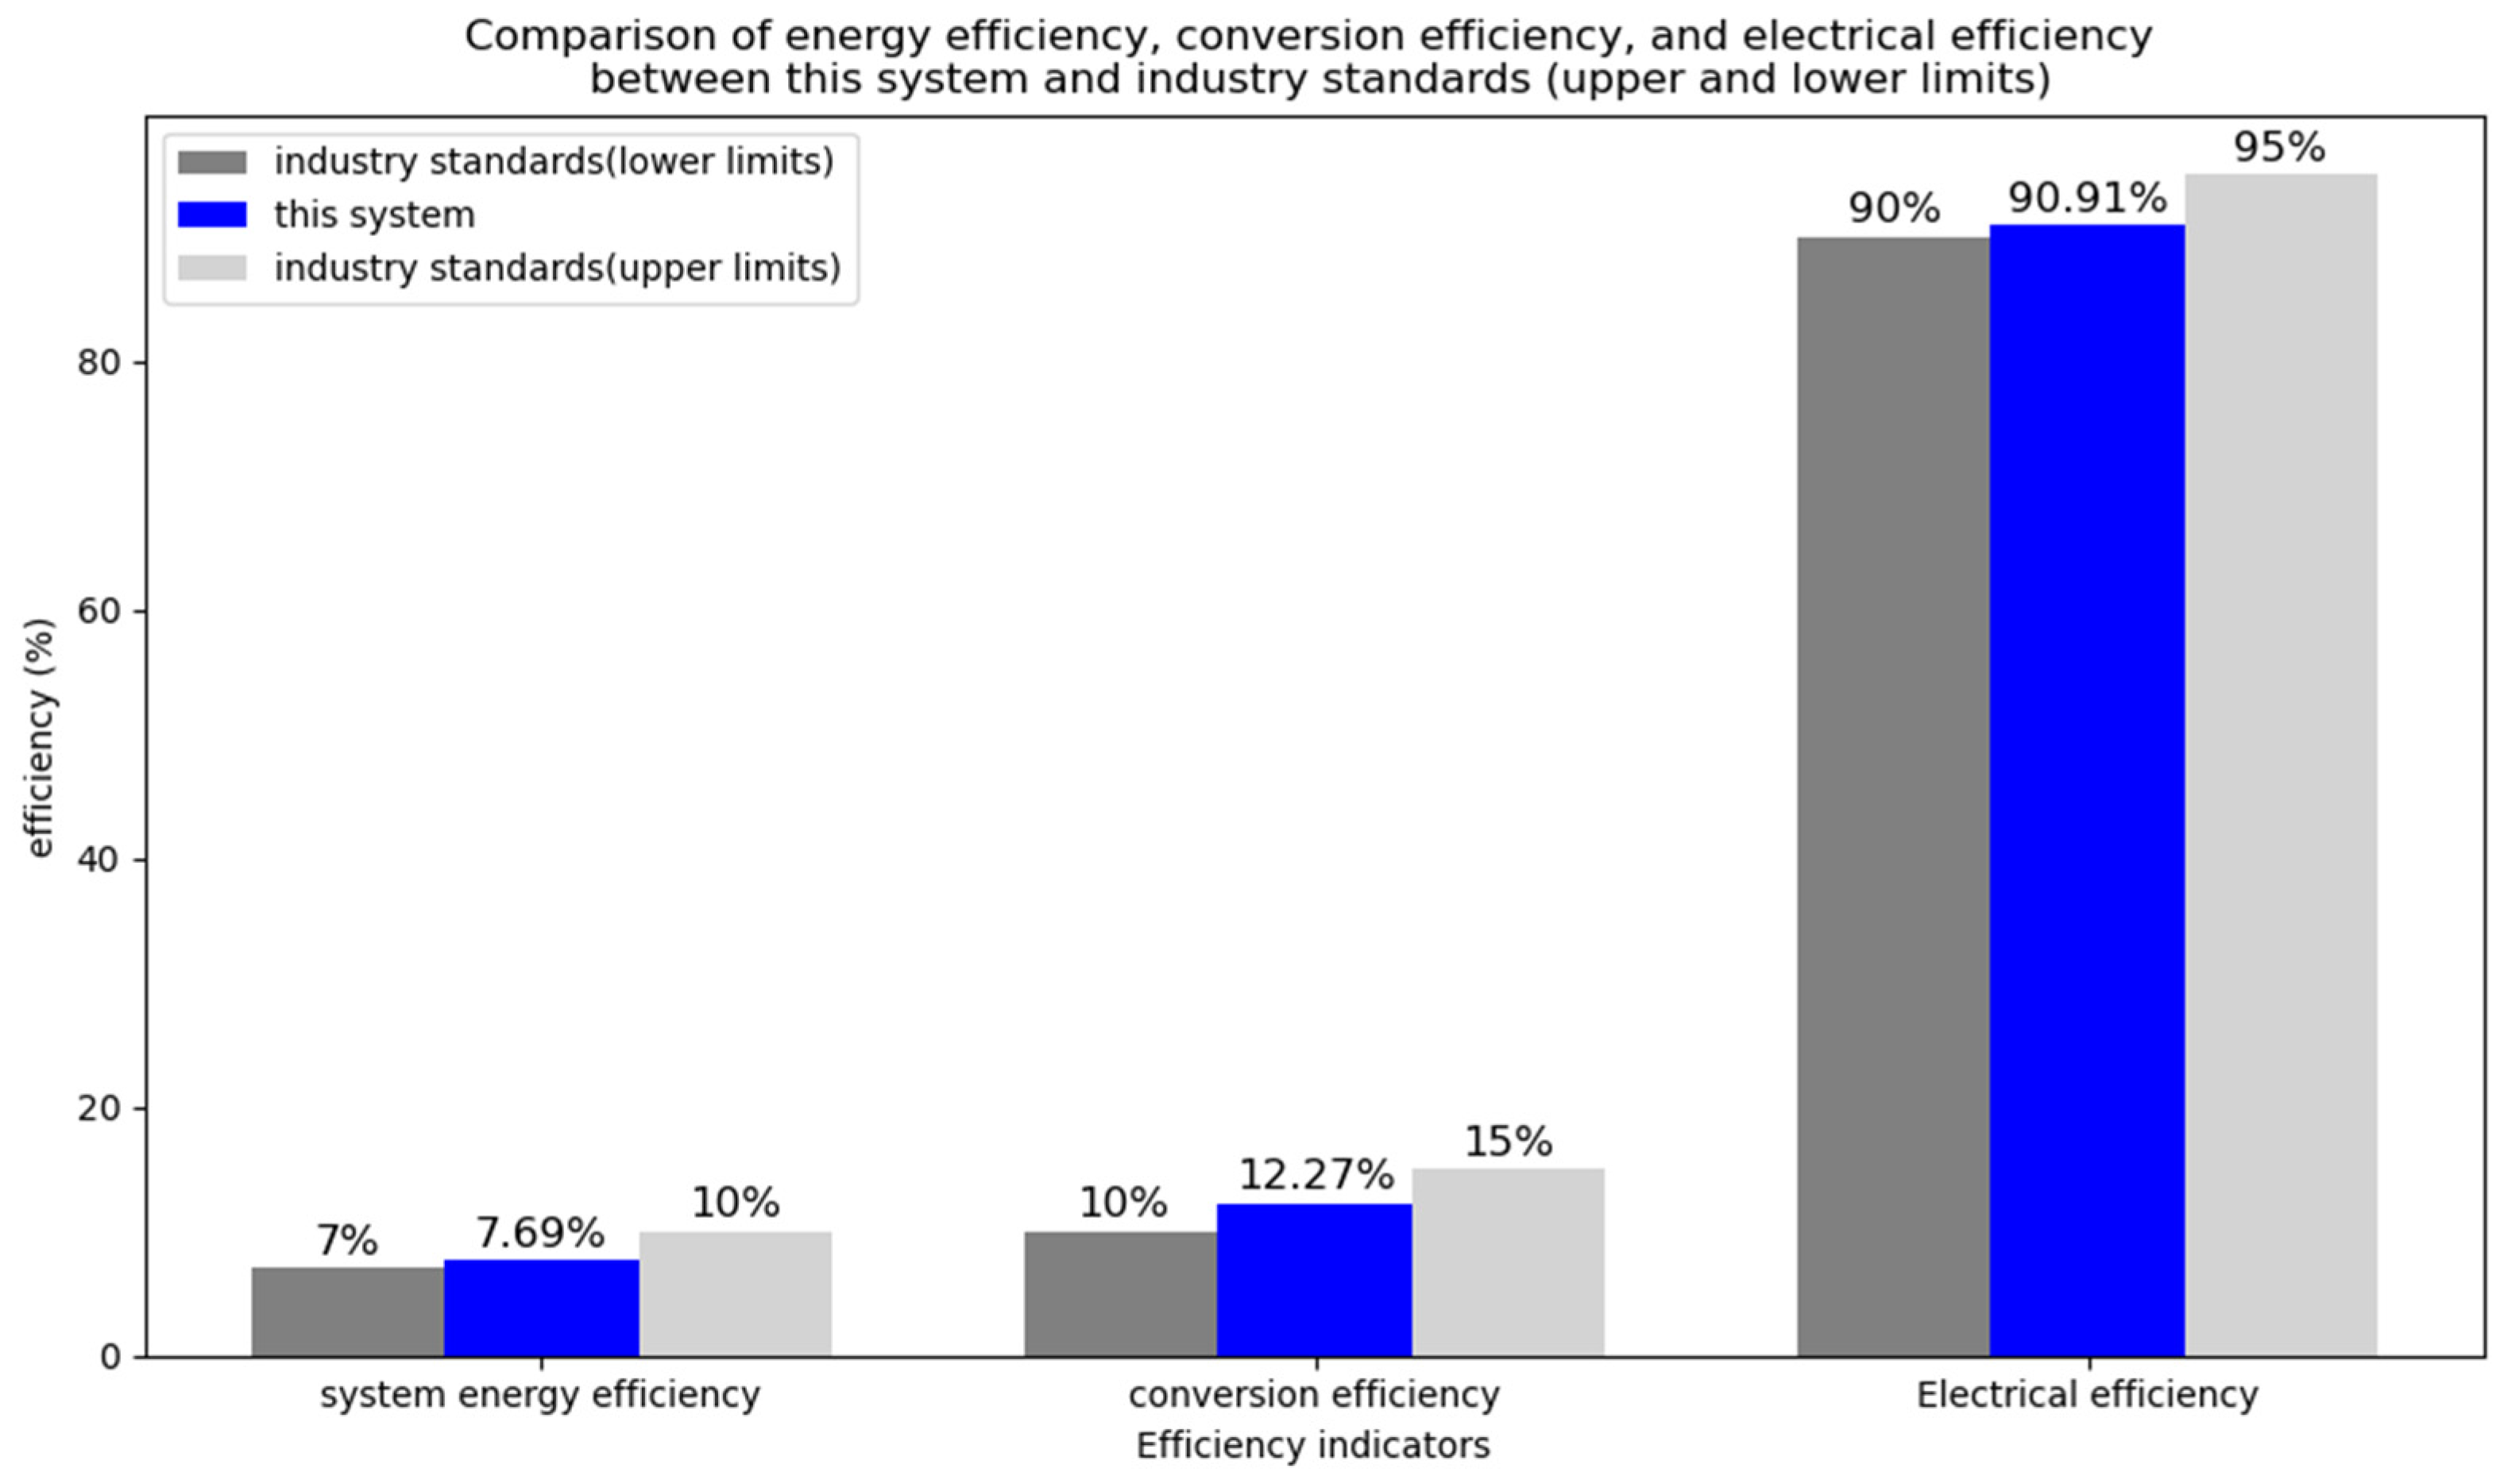
System Efficiency Analysis
The statistical period was from 1 June 2023 to 31 October 2023. The total power generation during this period was 1,732,800 kWh, with an installed capacity of 3630 kW and a total irradiance of 6204.091 kWh/m2 on the tilted surface of the PV array. Using the formula, the system efficiency was calculated as 7.69%.
Analysis: This result indicates relatively low system efficiency, likely influenced by factors such as the type of PV modules, environmental temperature, pollution, and internal system losses. There is potential for improvement.
Conversion Efficiency Analysis
The PV system comprises 6662 monocrystalline PV modules, each with a maximum output power of 0.55 kW under standard test conditions. The total area of the modules is 24,000 m2, and the solar irradiance incident on the surface of the modules is 1 kW/m2. The conversion efficiency of the system was calculated to be 12.27%.
Analysis: A conversion efficiency of 12.27% indicates that the system has good energy conversion capability under actual operating conditions. While not reaching the theoretical maximum, this efficiency is still considered high compared to industry standards, reflecting good overall system performance.
Electrical Efficiency Analysis
According to field test results, when the irradiance reaches or exceeds 800 W/m2, the PV system’s real-time total output power is 3300 kW, with a total installed capacity of 3630 kW. The electrical efficiency was calculated as 90.91%.
Analysis: An electrical efficiency of 90.91% indicates that the system effectively converts solar energy into electrical energy. The remaining 9.1% of energy loss is likely due to conversion losses, cable transmission losses, and environmental factors, suggesting room for further improvement.

4.2.3. Performance Analysis on Energy Storage System

This section provides a detailed analysis of the energy efficiency and energy performance (specific energy density and volumetric energy density) of the lithium titanate battery module based on initial charge and discharge energy test data. The analysis also explores its practical significance and optimization direction in port applications. The results are shown in Figure 9.
Energy Efficiency Analysis
Based on the initial charge and discharge energy test data, the initial charging energy of the battery module was 9390 Wh, and the initial discharging energy was 9310 Wh. Using the formula, the energy efficiency of the lithium titanate battery module was calculated to be 99.15%.
Analysis: This result shows that the battery module has extremely low energy loss during the charge and discharge processes, efficiently converting input electrical energy into output energy, demonstrating excellent energy conversion efficiency.
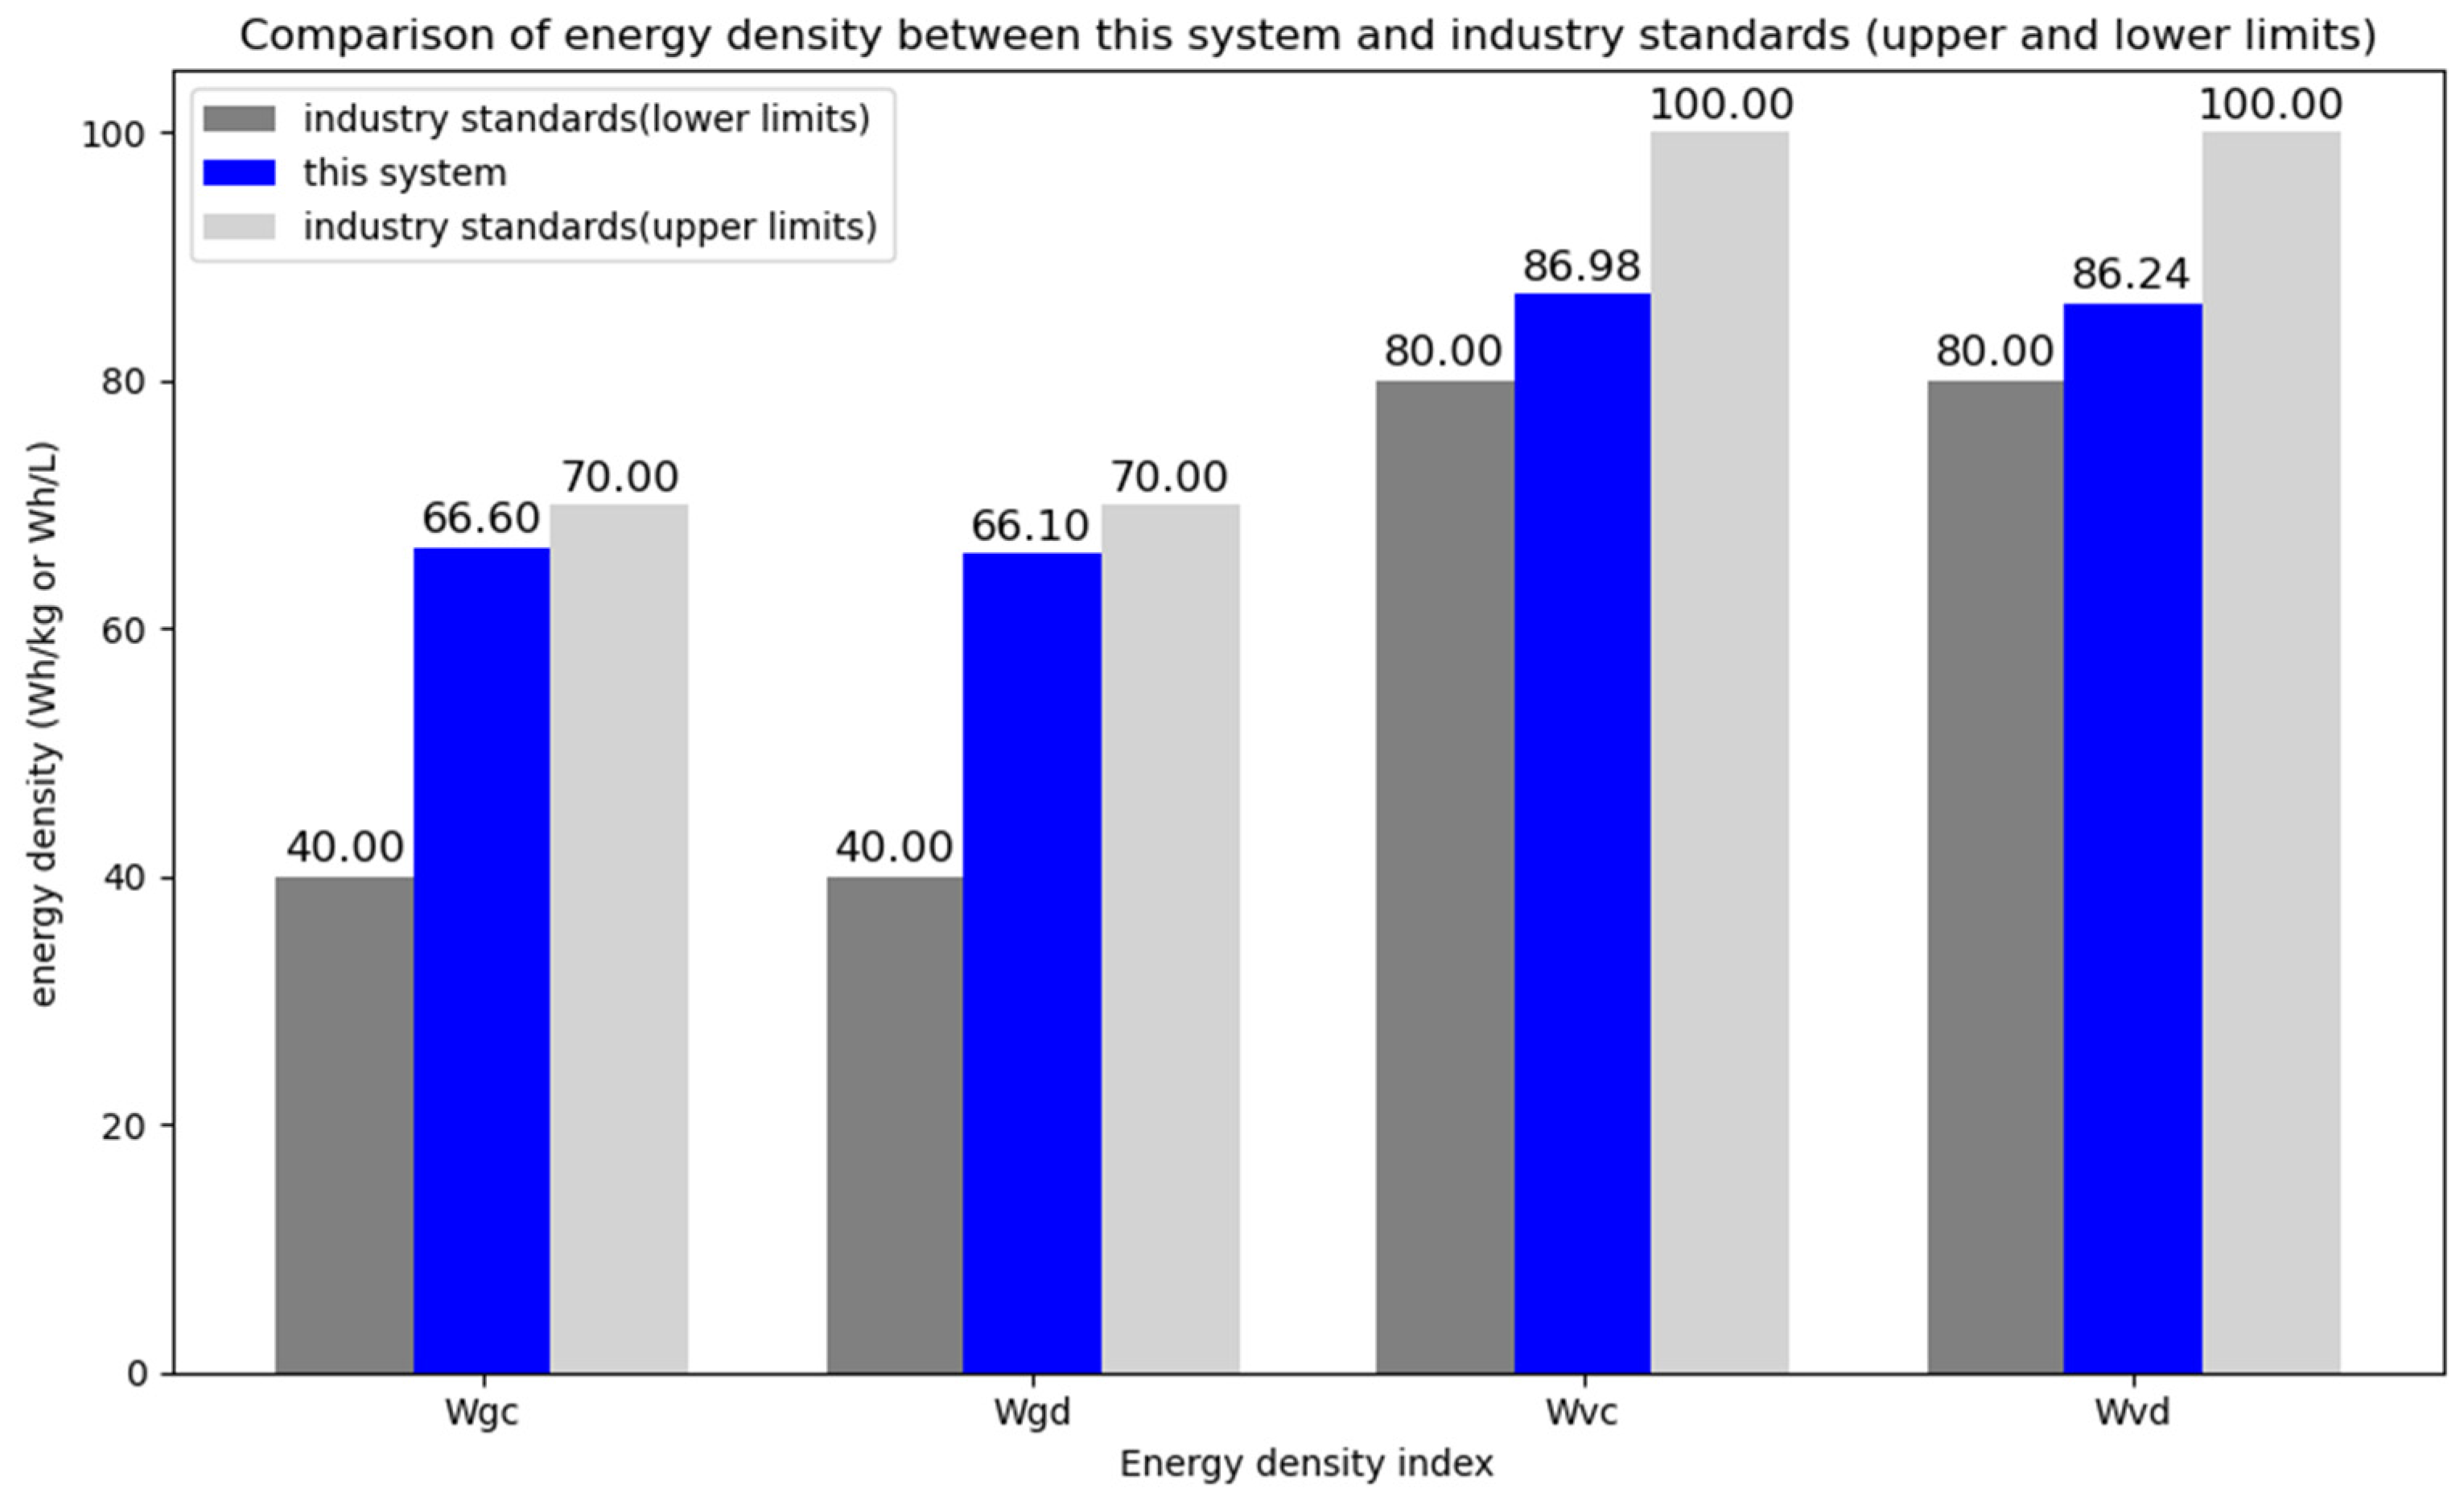
Specific Energy Density Analysis
Based on the test data, the initial charging energy of the battery module was 9390 Wh, and the mass was 140.93 kg. The charging-specific energy density was calculated to be 66.6 Wh/kg. Similarly, the initial discharging energy was 9310 Wh, and the mass was 140.93 kg, resulting in a discharging specific energy density of 66.1 Wh/kg.
Analysis: This battery module provides sufficient energy while maintaining a relatively light mass. It suits applications requiring high energy density and mobility, such as port energy storage systems and emergency power supplies. Its high energy density and portability help reduce transportation and installation pressure, improving operational efficiency and meeting diverse power needs.
Volumetric Energy Density Analysis
Based on the test data, the initial charging energy of the battery module was 9390 Wh, and the volume was 107.96 L, yielding a charging volumetric energy density of 86.98 Wh/L. The initial discharging energy was 9310 Wh with the same volume, resulting in a discharging volumetric energy density of 86.24 Wh/L.
Analysis: This battery module has a high volumetric energy density, making it ideal for space-constrained environments such as port and ship energy storage systems. Its high volumetric energy density optimizes equipment layout, enhances system flexibility, and improves practicality, particularly during peak energy demand, helping to stabilize the power supply in the port area.

4.2.4. Performance Analysis on Hydrogen Energy System

Hydrogen Production Analysis
During a 60 h test period, the electrolyzer produced an average hydrogen volume of 503.87 Nm3 per hour. This indicates that the hydrogen production system has a high production capacity, can meet large-scale industrial demands, and provides sufficient hydrogen support for various applications such as fuel cells and industrial gas supply.
Hydrogen Production Efficiency Analysis
The lower heating value of hydrogen is 10.786 MJ/Nm3. According to the test data, the average input voltage to the system was 366.54 V, and the average input current was 6503.97 A, with an average hydrogen production volume of 503.87 Nm3 per hour.
Using the formula, the hydrogen production system efficiency was calculated to be 63.34%. Considering that current electrolysis-based hydrogen production efficiency typically ranges from 50% to 70%, a system efficiency of 63.34% indicates that the system performs well in converting electrical energy into hydrogen chemical energy, achieving a medium–high efficiency level and meeting industrial standards.

5. Conclusions

PIMES is a crucial solution for driving ports’ green and low-carbon transformation. By integrating wind energy, solar power, energy storage, hydrogen energy, and traditional energy, it significantly improves energy efficiency and reduces carbon emissions, providing technical support for the port’s sustainable development. Based on practical application, the multi-energy integration system has shown remarkable results in optimizing energy structure and improving energy efficiency.
Significant energy saving and emission reduction: According to 2024 statistics, solar and wind energy provided 282,200 kWh and 1,513,300 kWh of electricity, respectively, resulting in a total reduction of 1885 tons of CO2 and 53.87 tons of SO2. Of this, wind energy contributed 84% to the reduction, solar power 16%, and shore power systems 1%. These results highlight the system’s effectiveness in reducing fossil fuel dependency and promoting the use of green energy.
Efficient utilization of clean energy: As core technologies, the energy storage and hydrogen systems effectively address the variability issues of wind and solar power. The energy storage system achieves a charge–discharge efficiency of 99.15%, with the titanium lithium battery module having an energy density of 66.1 Wh/kg, demonstrating high energy conversion efficiency. The hydrogen system has a hydrogen production efficiency of 63.34%, with an output of 503.87 Nm3 of hydrogen per hour, ensuring reliable support for the stable operation of port equipment.
Early results in energy structure transformation: The operation of the multi-energy integration system has significantly improved energy efficiency at the port. In the second half of 2023, despite a 32.5% year-over-year increase in port throughput, the total electricity consumption decreased by 6.2%, demonstrating the system’s substantial potential in optimizing energy utilization and enhancing carbon reduction capacity.
Overall, with its smart scheduling of wind, solar, storage, and hydrogen, the multi-energy integration system has successfully made port energy consumption greener and more diversified. It provides a practical solution for modern ports to meet complex energy demands and environmental pressures and serves as a model for sustainable development in other ports.
Although this study provides valuable insights into the performance of the PIMES, it still has some limitations. Due to practical constraints, the various energy systems were placed online at different times, with some systems (such as wind and hydrogen energy) operating for only a short period. This may lead to an incomplete assessment of the system’s long-term performance, as some indicators can only be evaluated over specific time frames.
Despite these limitations, this study lays a solid foundation for future research. In the future, the dynamic coupling of wind, solar, and hydrogen energies should be strengthened to address the seasonal and intermittent fluctuations of wind and solar power. Expanding the energy storage system capacity and improving hydrogen production efficiency is key to balancing energy supply. Moreover, hydrogen energy technology must enhance storage and distribution capabilities and be combined with fuel cells to provide energy for more equipment, gradually establishing hydrogen as a dominant energy source. Policy support and the introduction of intelligent energy management systems are also essential. Policies can reduce technology costs through subsidies and incentives, while intelligent management optimizes energy scheduling and equipment efficiency. By improving equipment energy efficiency, increasing the proportion of clean energy, and incorporating intelligent control, the port area is expected to reduce carbon emissions by more than 50% within five years, becoming a benchmark for international green ports and providing a model for the sustainable development of global port energy systems.

Author Contributions

Conceptualization, D.T., S.Y., and J.M.G.; methodology, D.T. and S.Y.; validation, S.Y. and Z.H.; formal analysis, S.Y., Z.H., D.T., W.M., and J.M.G.; resources, W.M. and D.T.; data curation, W.M. and D.T.; writing—original draft preparation, S.Y.; writing—review and editing, D.T. and J.M.G.; visualization, Z.H. and W.M.; funding acquisition, S.Y. All authors have read and agreed to the published version of the manuscript.

Funding

The research was supported by the National Natural Science Foundation of China [grant no. 72301137] and the Jiangsu Province University Philosophy and Social Science Research Fund [grant no. 2023SJYB0008].

Data Availability Statement

The data are available upon request.

Acknowledgments

The authors would like to thank the anonymous reviewers for their constructive comments, which helped us considerably improve the quality of the paper.

Conflicts of Interest

The authors declare no conflicts of interest.

References

  1. Tang, D.; Chen, Z.; Zhao, W.; Yuan, Y.; Yuan, C.; Guerrero, J.M.; Zio, E. Sustainable mega-seaports with integrated multi-energy systems: Life-cycle environmental and economic evaluation. J. Clean. Prod. 2024, 478, 143905. [Google Scholar] [CrossRef]
  2. Zhang, Z.; Song, C.; Zhang, J.; Chen, Z.; Liu, M.; Aziz, F.; Yap, P.S. Digitalization and innovation in green ports: A review of current issues, contributions and the way forward in promoting sustainable ports and maritime logistics. Sci. Total Environ. 2024, 912, 169075. [Google Scholar] [CrossRef]
  3. Abas, N.; Kalair, A.; Khan, N. Review of fossil fuels and future energy technologies. Futures 2015, 69, 31–49. [Google Scholar] [CrossRef]
  4. Zhang, Q.; Qi, J.; Zhen, L. Optimization of integrated energy system considering multi-energy collaboration in carbon-free hydrogen port. Transp. Res. Part E Logist. Transp. Rev. 2023, 180, 103351. [Google Scholar] [CrossRef]
  5. Chang, C.C.; Wang, C.M. Evaluating the effects of green port policy: Case study of Kaohsiung harbor in Taiwan. Transp. Res. Part D Transp. Environ. 2012, 17, 185–189. [Google Scholar] [CrossRef]
  6. Sachs, J.D.; Schmidt-Traub, G.; Williams, J. Pathways to zero emissions. Nat. Geosci. 2016, 9, 799–801. [Google Scholar] [CrossRef]
  7. Yang, Y.C.; Chang, W.M. Impacts of electric rubber-tired gantries on green port performance. Res. Transp. Bus. Manag. 2013, 8, 67–76. [Google Scholar] [CrossRef]
  8. Herrero, A.; Ortega Piris, A.; Diaz-Ruiz-Navamuel, E.; Gutierrez, M.A.; Lopez-Diaz, A.I. Influence of the implantation of the onshore power supply (OPS) system in Spanish medium-sized ports on the reduction in CO2 emissions: The case of the Port of Santander (Spain). J. Marine Sci. Eng. 2022, 10, 1446. [Google Scholar] [CrossRef]
  9. Colarossi, D.; Lelow, G.; Principi, P. Local energy production scenarios for emissions reduction of pollutants in small-medium ports. Transp. Res. Interdiscip. Perspect. 2022, 13, 100554. [Google Scholar] [CrossRef]
  10. Colarossi, D.; Principi, P. Optimal sizing of a photovoltaic/energy storage/cold ironing system: Life Cycle cost approach and environmental analysis. Energy Convers. Manag. 2023, 291, 117255. [Google Scholar] [CrossRef]
  11. Gong, X.; Li, X.; Zhong, Z. Strategic bidding of hydrogen-wind-photovoltaic energy system in integrated energy and flexible ramping markets with renewable energy uncertainty. Int. J. Hydrogen Energy 2024, 80, 1406–1423. [Google Scholar] [CrossRef]
  12. Pivetta, D.; Dall’Armi, C.; Sandrin, P.; Bogar, M.; Taccani, R. The role of hydrogen as enabler of industrial port area decarbonization. Renew. Sustain. Energy Rev. 2024, 189, 113912. [Google Scholar] [CrossRef]
  13. Donelly, J. Qingdao Port Becomes the World’s First Hydrogen-Powered and 5G Intelligent Port; Port Technology: London, UK, 2022. [Google Scholar]
  14. Gutierrez-Romero, J.E.; Esteve-Pérez, J.; Zamora, B. Implementing Onshore Power Supply from renewable energy sources for requirements of ships at berth. Appl. Energy 2019, 255, 113883. [Google Scholar] [CrossRef]
  15. Sifakis, N.; Konidakis, S.; Tsoutsos, T. Hybrid renewable energy system optimum design and smart dispatch for nearly Zero Energy Ports. J. Clean. Prod. 2021, 310, 127397. [Google Scholar] [CrossRef]
  16. Vichos, E.; Sifakis, N.; Tsoutsos, T. Challenges of integrating hydrogen energy storage systems into nearly zero-energy ports. Energy 2022, 241, 122878. [Google Scholar] [CrossRef]
  17. Seddiek, I.S. Application of renewable energy technologies for eco-friendly sea ports. Ships Offshore Struct. 2020, 15, 953–962. [Google Scholar] [CrossRef]
  18. Tang, D.; Zheng, Z.; Guerrero, J.M. A hybrid multi-criteria dynamic sustainability assessment framework for integrated multi-energy systems incorporating hydrogen at ports. Int. J. Hydrogen Energy 2025, 99, 540–552. [Google Scholar] [CrossRef]
  19. Song, T.; Li, Y.; Zhang, X.P.; Wu, C.; Li, J.; Guo, Y.; Gu, H. Integrated port energy system considering integrated demand response and energy interconnection. Int. J. Electr. Power Energy Syst. 2020, 117, 105654. [Google Scholar] [CrossRef]
  20. Pu, Y.; Chen, W.; Zhang, R.; Liu, H. Optimal operation strategy of port integrated energy system considering demand response. In Proceedings of the 2020 IEEE 4th Conference on Energy Internet and Energy System Integration (EI2), Wuhan, China, 30 October–1 November 2020; pp. 518–523. [Google Scholar] [CrossRef]
  21. Li, Y.; Tang, D.; Yuan, C.; Diaz-Londono, C.; Agundis-Tinajero, G.D.; Guerrero, J.M. The roles of hydrogen energy in ports: Comparative life-cycle analysis based on hydrogen utilization strategies. Int. J. Hydrogen Energy 2025, 106, 1356–1372. [Google Scholar] [CrossRef]
  22. Georgilakis, P.S. Technical challenges associated with the integration of wind power into power systems. Renew. Sustain. Energy Rev. 2008, 12, 852–863. [Google Scholar] [CrossRef]
  23. Rosen, M.A.; Koohi-Fayegh, S. The prospects for hydrogen as an energy carrier: An overview of hydrogen energy and hydrogen energy systems. Energy Ecol. Environ. 2016, 1, 10–29. [Google Scholar] [CrossRef]
  24. Ramakumar, R.; Bigger, J.E. Photovoltaic systems. Proc. IEEE 1993, 81, 365–377. [Google Scholar] [CrossRef]
  25. Rajesh, R.; Mabel, M.C. A comprehensive review of photovoltaic systems. Renew. Sustain. Energy Rev. 2015, 51, 231–248. [Google Scholar] [CrossRef]
  26. Nikolaidis, P.; Poullikkas, A. A comparative overview of hydrogen production processes. Renew. Sustain. Energy Rev. 2017, 67, 597–611. [Google Scholar] [CrossRef]
  27. Ge, P.; Tang, D.; Yuan, Y.; Guerrero, J.M.; Zio, E. A hierarchical multi-objective co-optimization framework for sizing and energy management of coupled hydrogen-electricity energy storage systems at ports. Appl. Energy 2025, 384, 125451. [Google Scholar] [CrossRef]
  28. Zhang, F.; Bai, F. Medium- and long-term prediction of carbon emissions from coal consumption and carbon dioxide emissions. China Coal 2022, 48, 36–40. [Google Scholar] [CrossRef]
  29. Zhao, M.; Chen, Z.; Blaabjerg, F. Generation ratio availability assessment of electrical systems for offshore wind farms. IEEE Trans. Energy Convers. 2007, 22, 755–763. [Google Scholar] [CrossRef]
  30. Mabel, M.C.; Raj, R.E.; Fernandez, E. Adequacy evaluation of wind power generation systems. Energy 2010, 35, 5217–5222. [Google Scholar] [CrossRef]
  31. Castro Sayas, F.; Allan, R.N. Generation availability assessment of wind farms. IEE Proc. Gen. Trans. Distr. 1996, 143, 507–518. [Google Scholar] [CrossRef]
  32. Meral, M.E.; Dincer, F. A review of the factors affecting operation and efficiency of photovoltaic based electricity generation systems. Renew. Sustain. Energy Rev. 2011, 15, 2176–2184. [Google Scholar] [CrossRef]
  33. Lukutin, B.V.; Shandarova, E.B.; Fuks, I.L. Energy efficiency of photovoltaic power plants in stand-alone power supply systems. In Proceedings of the 2016 2nd International Conference on Industrial Engineering, Applications and Manufacturing (ICIEAM), Chelyabinsk, Russia, 19–20 May 2016; pp. 1–5. [Google Scholar] [CrossRef]
  34. Green, M.A.; Bremner, S.P. Energy conversion approaches and materials for high-efficiency photovoltaics. Nat. Mater. 2017, 16, 23–34. [Google Scholar] [CrossRef] [PubMed]
  35. Abdi, H.; Mohammadi-ivatloo, B.; Javadi, S.; Khodaei, A.R.; Dehnavi, E. Energy storage systems. Distrib. Gener. Syst. 2017, 7, 333–368. [Google Scholar] [CrossRef]
  36. Wang, D.; Han, C.; Mo, F.; Yang, Q.; Zhao, Y.; Li, Q.; Han, C.; Liang, G.; Dong, B.; Zhi, C. Energy density issues of flexible energy storage devices. Energy Storage Mater. 2020, 28, 264–292. [Google Scholar] [CrossRef]
  37. Liu, Y.T.; Liu, S.; Li, G.R.; Gao, X.P. Strategy of enhancing the volumetric energy density for lithium–sulfur batteries. Adv. Mater. 2021, 33, 2003955. [Google Scholar] [CrossRef]
  38. Younas, M.; Shafique, S.; Hafeez, A.; Javed, F.; Rehman, F. An overview of hydrogen production: Current status, potential, and challenges. Fuel 2022, 316, 123317. [Google Scholar] [CrossRef]
  39. Ozbilen, A.; Dincer, I.; Rosen, M.A. Comparative environmental impact and efficiency assessment of selected hydrogen production methods. Environ. Impact Assess. Rev. 2013, 42, 1–9. [Google Scholar] [CrossRef]
Figure 1. Coordinated operation model of the multi-energy integration system, adapted from [18] with permission from Elsevier/2025.
Jmse 13 00477 g001
Figure 2. Example of multi-energy integration system operation in a port, reproduced from [21], with permission from Elsevier/2025.
Jmse 13 00477 g002
Figure 3. Monthly total electricity consumption and standard coal consumption in the port area from 2022 to 2024.
Jmse 13 00477 g003
Figure 4. Monthly emission data of total electricity consumption in the port area for 2023.
Jmse 13 00477 g004
Figure 5. Comparison of purchased electricity before and after the implementation of the multi-energy integration system in 2023.
Jmse 13 00477 g005
Figure 6. Percentage growth in throughput and purchased electricity before and after the implementation of the integrated multi-energy system in 2024.
Jmse 13 00477 g006
Figure 7. Analysis of availability and utilization rate of WT1 and WT2.
Jmse 13 00477 g007
Figure 8. Comparison of photovoltaic system performance with industry standards.
Jmse 13 00477 g008
Figure 9. Comparison of energy density of the energy storage system with industry standards.
Jmse 13 00477 g009
Table 1. Annual accounting of total electricity consumption, total energy consumption, CO2, and pollutant emissions in the port area.
YearTotal Electricity Consumption (Billion kWh)Total Energy Consumption (10,000 Tons)Carbon (Tons)CO2 (Tons)SO2 (Tons)NOx (Tons)
20190.752.95620,10273,60822171123
20200.783.01320,48975,02522601145
20210.8042.89919,71072,17421741101
20220.792.87419,54371,56321561092
20230.7452.74518,66668,35120591043
Table 2. Energy savings and emission reductions from clean energy replacing fuel or grid electricity.
Clean Energy TypeSolar PVWind PowerHydrogen EnergyShore Power
Electricity (10,000 kWh)28.22151.33/1.1
Standard coal saved (tons)112.88605.32/4.4
Carbon saved (tons)76.76411.62/2.99
CO2 reduction (tons)281.351508.76/10.97
SO2 reduction (tons)8.4745.4/0.33
NOx reduction (tons)4.2322.7/0.17
Table 3. Collaborative emission reduction contribution rate of clean energy.
Clean Energy TypeSolar PVWind PowerHydrogen EnergyShore Power
Contribution rate0.160.84/0.01
Disclaimer/Publisher’s Note: The statements, opinions and data contained in all publications are solely those of the individual author(s) and contributor(s) and not of MDPI and/or the editor(s). MDPI and/or the editor(s) disclaim responsibility for any injury to people or property resulting from any ideas, methods, instructions or products referred to in the content.

