Abstract
Brillouin scattering lidar is a potential remote sensing technique for measuring the distribution profiles of temperature and salinity in the upper ocean. To realize high-precision simultaneous inversion of temperature and salinity in seawater, we propose a solution tailored for the measurement of temperature–salinity profiles. Three distinct models with error correction are discussed based on dual-wavelength, dual-angle, and dual-parameter approaches, respectively. We analyze the accuracy of these three inversion models using the least squares method based on the actual temperature and salinity data of World Ocean Atlas 2023 (WOA23). The results show that the average temperature and salinity errors for the dual-wavelength model are 0.009 °C and 0.001‰, for the dual-angle model are 0.13 °C and 0.30‰, and for the dual-parameter model are 0.03 °C and 0.08‰. And on this basis, we inverse the temperature and salinity of 0–200 m upper seawater in the South China Sea by employing the dual-wavelength model with the average inversion errors of 0.05 °C and 0.02‰, respectively. The findings presented in this work hold significant importance for the application of Brillouin lidar in remote sensing the distribution of temperature and salinity in ocean.
1. Introduction
The assessment of marine environmental parameters is pivotal for advancing our understanding of ocean dynamics [1,2,3,4], marine organisms [5,6,7], ecological environment [8,9,10], and global climate change [11,12,13]. The temperature and salinity of seawater are the most elementary and extensively studied variables and exert a profound influence on fisheries, industrial operations, maritime transport, military endeavors, and so on. Globally, temperature and salinity data are predominantly sourced from thermal infrared radiometers, microwave radiometers, conductivity–temperature–depth (CTD) profilers, and Argo profiling floats [14,15,16,17]. While satellite-based radiometers are adept at capturing sea surface temperatures, the depth-wise profiling of these parameters is primarily facilitated by CTD profilers and Argo floats. Notably, CTD profilers have achieved remarkable precision in the vertical monitoring of temperature and salinity, with a depth range of 0–6000 m with a resolution of 0.001 °C and 0.01 PSU [18,19]. However, these in situ measurement techniques are not only time-consuming and labor-intensive but also do not allow for the rapid and real-time measurement of ocean temperature and salinity profiles.
With the development of laser technology, the active optical remote sensing method is a promising alternative approach. This method boasts the benefits of real-time monitoring, extensive coverage, and high precision, holding the potential to fill the gaps in three-dimensional ocean sensing. Particularly, Brillouin-scattering-based lidar has the advantages of no electromagnetic interference and sensitivity to temperature and salinity, regarded as a potential probe for profiling temperature and salinity profiles [20,21,22,23,24,25,26]. As a frequency-modulation technique, Brillouin-based lidar can acquire environmental information by monitoring the spectral parameters of backscattered signals such as frequency shift, linewidth, and peak intensity [27,28,29,30]. The Brillouin spectrum of seawater is affected by laser wavelength, scattering angle, temperature, and salinity [31]. Given a specific excitation wavelength and scattering angle, the Brillouin scattering spectrum is jointly affected by temperature and salinity. Consequently, the temperature–salinity inversion is essential for the successful application of Brillouin lidar in ocean remote sensing.
Since the Brillouin frequency shift depends on both temperature and salinity, it is necessary to know the salinity information when constructing a temperature inversion model based on the frequency shift, which is a single-parameter inversion [32]. Using the single-parameter inversion model, it is usually necessary to rely on the known parameters, for example, establishing a functional relationship between temperature and frequency shift under the premise of pure water or known seawater salinity. However, in the actual marine environment, especially in the upper ocean mixed layer, the seawater salinity is not constant and its magnitude depends on factors such as the sea area and ocean currents. Therefore, if a high-precision model can be established for the simultaneous inversion of temperature and salinity, it would be of great significance for the realization of real-time profiling of ocean temperature and salinity parameters by Brillouin lidar. Previous reports have demonstrated several effective methods for inverting temperature and salinity, including techniques based on the combination of Brillouin frequency shift and echo signal power, and Brillouin frequency shift and linewidth, as well as double Brillouin frequency shift at dual wavelengths [33,34]. These methods did not consider the effect of depth change on the frequency shift in seawater, and the models were constructed under the assumption of zero pressure. However, in the actual marine environment, the pressure of seawater at different depths may affect Brillouin frequency shift. Currently, the detection depth for ocean lidar utilizing time-gated technology ranges up to tens of meters, extending to 100 m in clear water conditions, with depth resolution at the meter or even decimeter scale [35,36,37,38]. This resolution is contingent upon factors such as laser pulse characteristics, lidar performance, and water quality. A depth variation of 100 m can induce a pressure change of approximately 1 MPa, as calculated by the international equation of state for seawater [39]. The impact of pressure on frequency shift, for every 1 MPa, exceeds that of salinity for every 1‰ at a constant temperature [40]. Therefore, pressure must be considered when developing a high-precision temperature–salinity inversion model.
In this paper, a more complete temperature–salinity inversion method for ocean remote sensing is presented. Three inversion models based on dual-wavelength, dual-angle, and dual-parameter approaches are discussed, respectively. The accuracies, strengths, and limitations of these three inversion models are analyzed based on the actual temperature and salinity data of World Ocean Atlas 2023 (WOA23) [41,42]. The results provide significant support for remote sensing of temperature and salinity profiles using the Brillouin lidar technique.
2. General Principle
2.1. Brillouin Frequency Shift and Linewidth
Brillouin scattering is an inelastic scattering process arising from density fluctuation or acoustic phonons in media [43]. The acoustic waves move stochastically in all propagation directions with the sound velocity. Due to the optical Doppler effect, the scattered light exhibits a frequency shift with respect to the initially incident light. The frequency shift in Brillouin scattering light depends on the medium parameters such as temperature, refractive index, and sound speed. The linewidth of the Brillouin signal is associated with the acoustic attenuation and, thus, the viscous properties of the media, which can provide the viscosity information of seawater related to its temperature and salinity [44]. The frequency shift and linewidth of Brillouin scattering can be expressed as follows:
Here, n is the refractive index, is the sound velocity, is the incident wavelength, and is the scattering angle. is the acoustic damping term, which is a function of the thermodynamic variables:
where is the density, is the shear viscosity, is the bulk viscosity, is the thermal conductivity, is the specific heat ratio, is the specific heat at constant pressure, and is the specific heat at constant volume. These quantities are contingent upon either temperature (T) or salinity (S), or a combination of both, which complicates the process of achieving accurate simulations. To facilitate the modeling analysis, the parameters characterizing the properties of seawater can be expressed by empirical formulas [44,45,46,47]. The refractive index n, sound velocity , and density of seawater are also related to the pressure P.
2.2. Temperature–Salinity Inversion Model
The temperature–salinity inversion can be realized by establishing two equations related to the temperature and salinity of seawater. According to Equations (1) and (2), there are three feasible inversion methods based on dual-wavelength, dual-angle, and dual-parameter approaches, respectively:
Equations (9)–(11) represent the dual-wavelength, dual-angle, and dual-parameter models, respectively, that is, models based on the two Brillouin frequency shifts at two different wavelengths or two scattering angles, or the frequency shift and linewidth at a fixed wavelength and scattering angle. Two wavelengths of 532 nm and 486 nm and two backscattering angles of 180° and 150° were selected for ocean lidar detection. The spectral distributions of the three models in seawater are presented in Figure 1, where the Brillouin spectra are simulated under controlled conditions of water temperature (20 °C) and salinity (33‰).
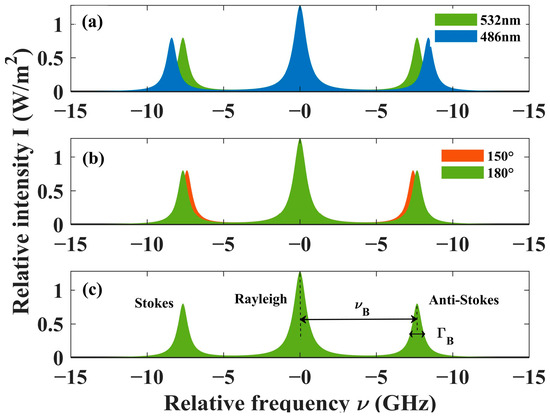
Figure 1.
Schematic of Brillouin scattering spectra of three models: (a) dual-wavelength, (b) dual-angle, and (c) dual-parameter models.
Figure 2 shows the corresponding schematic diagrams of three Brillouin lidar systems. The dual-wavelength lidar system appears to be a relatively complex structure, which needs two laser sources with different wavelengths and signal detectors that match the wavelengths. For the dual-angle lidar system, it depends on two scattering angled geometries for the incident and scattered photons at two different angles. The optical setup of dual-parameter lidar is the simplest of the three systems; it requires the high-precision extraction of Brillouin frequency shift and linewidth. These three inversion methods possess their own advantages in implementation, and further analysis of the model’s inversion capabilities is helpful to enhance the efficacy for practical applications.

Figure 2.
Schematics of three inversion methods: (a) dual-wavelength, (b) dual-angle, and (c) dual-parameter models. M: mirror; F-P: Fabry–Perot etalon; BPF: bandpass filter.
3. Results and Discussion
3.1. Influence of Pressure on Temperature–Salinity Inversion Model
The relationship between pressure and Brillouin characteristics can be established by bringing Equations (4)–(8) into Equations (1) and (2). Figure 3 shows the changes in frequency shift and linewidth of Brillouin scattering with the change in pressure at the same temperature and salinity. Based on the ability of ocean lidar to detect the upper ocean, we simulated the pressure distribution ranging from 0 to 2 MPa, corresponding to seawater depths of 0 to 200 m. The Brillouin frequency shift and linewidth exhibit a linear and positive correlation with pressure, with the frequency shift changing by approximately 18 MHz and the linewidth by 0.2 MHz. Consequently, the influence of pressure on the inversion model cannot be ignored, particularly in the case of the Brillouin frequency shift.
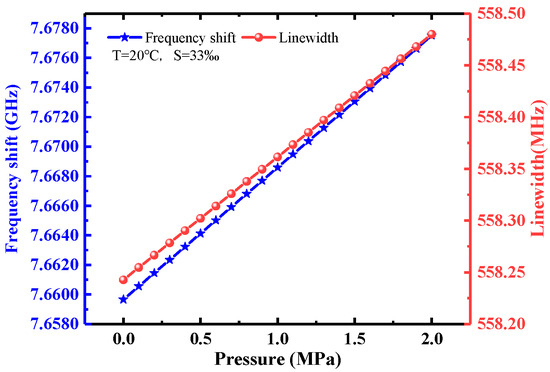
Figure 3.
The changes in frequency shift and linewidth with the change in pressure at T = 20 °C, S = 33‰.
Figure 4 shows the 3D distributions of frequency shift and linewidth versus temperature, salinity, and pressure. Based on the temperature and salinity data from World Ocean Atlas 2023 (WOA23), we simulated the Brillouin frequency shift and linewidth at 180° backward scattering, as well as Brillouin frequency shifts at 532 nm and 486 nm and at 150° backward scattering using Equations (1)–(8), respectively. The temperature range was set at 0~30 °C, the salinity range was from 30~40‰, and the pressure was from 0~2 MPa. The results demonstrate that the frequency shift increases gradually with the increases in temperature, salinity, and pressure. The linewidth shows a significant decrease with the increase in temperature, while it experiences a slight increase with the increase in salinity and pressure. For ocean lidar systems, which typically have a detection depth in the order of hundreds of meters and a vertical resolution in the order of meters in seawater, the corresponding pressure changes are in the order of ~MPa, with a resolution of ~0.01 MPa. A pressure change of 1 MPa results in a frequency shift change of approximately 9 MHz, while a frequency shift error of 1 MHz causes a temperature measurement error of approximately 0.1 °C in actual measurements. If pressure is simply assumed to be zero, the measurement errors for temperature and salinity will increase significantly with greater lidar penetration depths. Therefore, pressure is thoroughly accounted for in the modeling process to correct its impact on the measurements.
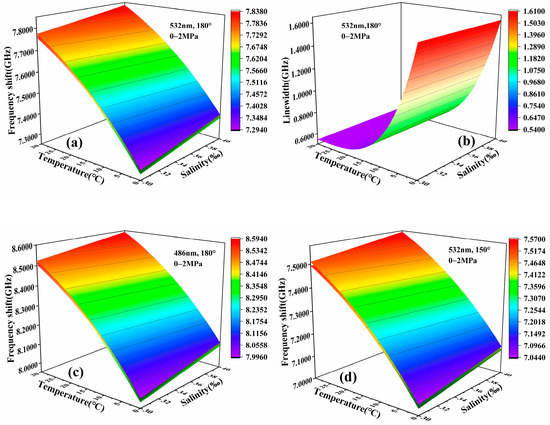
Figure 4.
Three-dimensional distributions of frequency shift and linewidth versus temperature, salinity, and pressure: (a) frequency shift at 532 nm, 180°; (b) linewidth at 532 nm, 180°; (c) frequency shift at 486 nm, 180°; (d) frequency shift at 532 nm, 150°.
More detailed analyses of the effects of pressure on frequency shift and linewidth are presented in Figure 5, and the influences of temperature and salinity are provided for comparative purposes. Using a pressure gradient of 0.01 MPa (corresponding to a depth resolution of 1 m), a temperature gradient of 1 °C, and a salinity gradient of 1‰, the results for each group were obtained by calculating the difference between the frequency shift values before and after the environmental condition changes. There exists a nonlinear relationship among temperature, salinity, frequency shift, and linewidth. At lower temperatures, both the Brillouin frequency shift and linewidth exhibit significant changes, whereas at higher temperatures, these changes are minimal. This behavior is opposite to that observed with variations in salinity. Temperature and salinity increase, and the average increments for the dual-wavelength model are 15.8 MHz/°C and 6.7 MHz/‰ at 532 nm, and 17.3 MHz/°C and 7.4 MHz/‰ at 486 nm. For the dual-angle model, the average increments are 15.8 MHz/°C and 6.7 MHz/‰ at a 180° scattering angle, and 15.3 MHz/°C and 6.5 MHz/‰ at a 150° scattering angle. In the two-parameter model, the changes are 15.8 MHz/°C and 6.7 MHz/‰ for the frequency shift, and 35.0 MHz/°C and 0.9 MHz/‰ for the linewidth. The frequency shift and linewidth exhibit a linear dependence on pressure. When the detection depth of Brillouin lidar increases by 1 m, the frequency shift increment is 0.089 MHz at 532 nm and 0.098 MHz at 486 nm in the dual-wavelength model, and it is 0.089 MHz at 180° and 0.086 MHz at 150° in the dual-angle model. In the dual-parameter model, the linewidth increment is 0.001 MHz and the frequency shift increment is 0.089 MHz. The measurement results can be estimated by correcting the frequency shift of the corresponding depth.
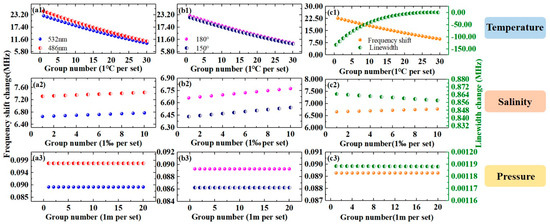
Figure 5.
Differences in frequency shift and linewidth vary with the changes in temperature, salinity, and pressure: (a1–a3) dual-wavelength model, (b1–b3) dual-angle model, and (c1–c3) dual-parameter model.
3.2. Construction of Three Inversion Models
Three temperature–salinity inversion models can be established by using the least squares method based on the 3D data shown in Figure 4. The modeling expressions of the dual-wavelength model for the inversion of temperature and salinity are shown in Equations (12) and (13), where b0~b13 and d0~d13 are the coefficients shown in Table 1. Variables x and y represent the frequency shifts in gigahertz (GHz) units, corresponding to wavelengths of 532 nm and 486 nm, respectively. From the evaluation metrics of the model, the R2 values for both the temperature and salinity fitting curves reach 1, respectively.

Table 1.
The values of b0~b13 and d0~d13.
The relationships between temperature, salinity, and the frequency shift values at 180° and 150° are modeled, respectively, as Equations (14) and (15). The coefficients m0~m14 and n0~n14 are listed in Table 2. The R2 values of the inversion model are 0.9837 and 0.8537, respectively.

Table 2.
The values of m0~m14 and n0~n14.
A dual-parameter model was constructed based on frequency shift and linewidth data, with the inversion model formulated as Equations (16) and (17). Here, the R2 values for the temperature and salinity fitting models are 0.9990 and 0.9361, respectively, indicating a high degree of fit. The corresponding coefficient values are detailed in Table 3.

Table 3.
The values of p0~p19 and q0~q14.
3.3. Error Estimation
3.3.1. Errors from Empirical Formula
Since the model data are derived from empirical formulas, which inherently carry some degree of inaccuracy, these inaccuracies are inevitably propagated to the inversion model. Consequently, the data’s precision is crucial to mitigate the adverse effects of the empirical formula on the model’s performance. The errors of frequency shift and linewidth from the empirical formulas are calculated by Equations (18) and (19), and the results are shown in Table 4. The errors are all less than the order of megahertz, and it is effective to keep the data after four decimal places when fitting the model. The Brillouin frequency shift and linewidth are only accurate in megahertz in the actual measurement.

Table 4.
Errors of the inversion model from the empirical formula.
3.3.2. Errors from Fitting
To compare further, the fitting errors of the three models are analyzed by randomly selecting 35 sets of frequency shift data as test values, and the results are shown in Figure 6. The dual-wavelength model exhibits a discrepancy of less than 0.05 °C between the true and inverse values of temperature, with the inversion error for salinity being even smaller, within 0.02‰. The fitting error of the dual-angle model is relatively large, the temperature difference is within 0.4 °C, and the salinity difference is within 0.6‰, which may be related to the low fitting accuracy of the model. The dual-parameter model exhibits minimal fluctuations in the inversion error of temperature and salinity, with temperature differences not exceeding 0.1 °C and salinity differences not surpassing 0.15‰. The average errors of the three inversion models of temperature and salinity are 0.009 °C and 0.001‰ for the dual-wavelength model, 0.13 °C and 0.30‰ for the dual-angle model, and 0.03 °C and 0.08‰ for the dual-parameter model. Therefore, the dual-wavelength model exhibits the highest accuracy and superior performance in random data testing among the results obtained through the fitting method.

Figure 6.
Inversion error of three models: (a) dual-wavelength, (b) dual-angle, and (c) dual-parameter models.
3.3.3. Model Uncertainty
The uncertainty of the model represents the effect of the change in unit frequency shift or linewidth on temperature and salinity, which is an important indicator of the model’s inversion capability. The temperature and salinity of seawater are related to only two known parameters in the inversion model. Similarly to Equations (18) and (19), the uncertainty is obtained by solving the following partial derivative equations:
where P1 and P2 represent the two known parameters in the inversion models. When , changes at 1 MHz; the measurement uncertainties of the three models are shown in Table 5. Compared with the fitting errors, the uncertainty of the model is larger, and the fitting errors are all within the range of their uncertainties, which indicates that the three models exhibit measurement accuracy at a level approaching ~MHz precision.

Table 5.
The uncertainty of the three models.
Generally, all three models have the potential to achieve optimal accuracy. The error of datasets derived from the empirical formula is less than 1 MHz, and the fitting error of the three models obtained through the least squares fitting method is smaller than the model uncertainty. From a system design perspective, the dual-parameter system is the simplest in terms of layout. However, due to the subtle variations in linewidth, it imposes higher algorithmic demands in practice. The dual-angle system represents a novel approach that can be explored further with numerous experiments required to determine the optimal scattering angle. The dual-wavelength system is relatively complex, but it can be combined with the multi-wavelength ocean lidar to acquire more observation objects. Based on the inversion model results, the dual-wavelength models at 532 nm and 486 nm exhibit superior inversion results owing to their smaller inversion errors. With the advancement of the laser technology, the implementation of the dual-wavelength Brillouin lidar becomes more feasible as it only requires extraction of the frequency shift from the 180° backscattering signal, which offers practical convenience and minimal interference. Based on this, the dual-wavelength model was used to invert the temperature and salinity of seawater in different depths of ocean.
3.4. Inversion of Temperature and Salinity in the South China Sea via Dual-Wavelength Model
The distributions of temperature and salinity in 0–200 m upper seawater in the South China Sea are mapped based on the WOA23 ocean database, as shown in Figure 7a,b. The corresponding Brillouin frequency shifts at 532 nm and 486 nm are shown in Figure 7c,d, respectively. The distribution of the Brillouin frequency shift in the South China Sea is basically consistent with the temperature distribution in the corresponding regions, in which the Brillouin frequency shift gradually decreases with the increase in ocean depth. Although the salinity of seawater increases with the increase in depth, the influence of temperature on the frequency shift is more obvious. The temperature and salinity of seawater in the 0–200 m depth range can be obtained by bringing the frequency shift data into the dual-wavelength inversion model, as shown in Figure 7e,f. The inversion results of temperature and salinity present the same distributions as the original temperature and salinity results, and they all perform well at different depths.
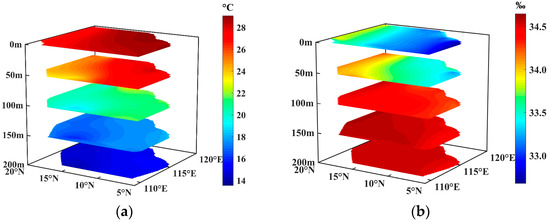
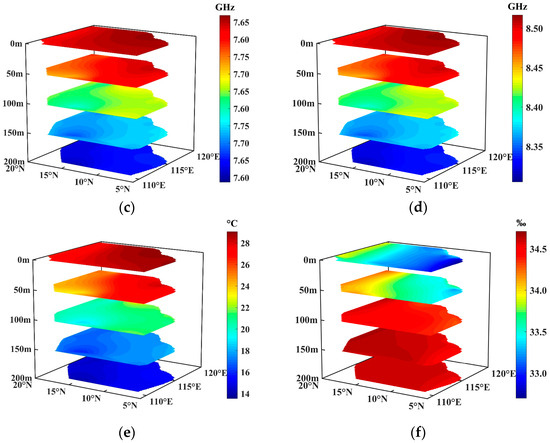
Figure 7.
Inversion results of temperature and salinity via the dual-wavelength model in the South China Sea at 0–200 m depth. (a,b) Actual temperature and salinity, (c,d) frequency shift at 532 nm and 486 nm, and (e,f) inversion of temperature and salinity.
The inversion errors presented in Figure 8 indicate that the discrepancies between the inverted and original values for temperature are less than 0.011 °C, while those for salinity are less than 0.0006‰. Using the dual-wavelength model, the average inversion errors for temperature and salinity theoretically reach 0.01 °C and 0.0009‰, respectively, as illustrated in Figure 9.
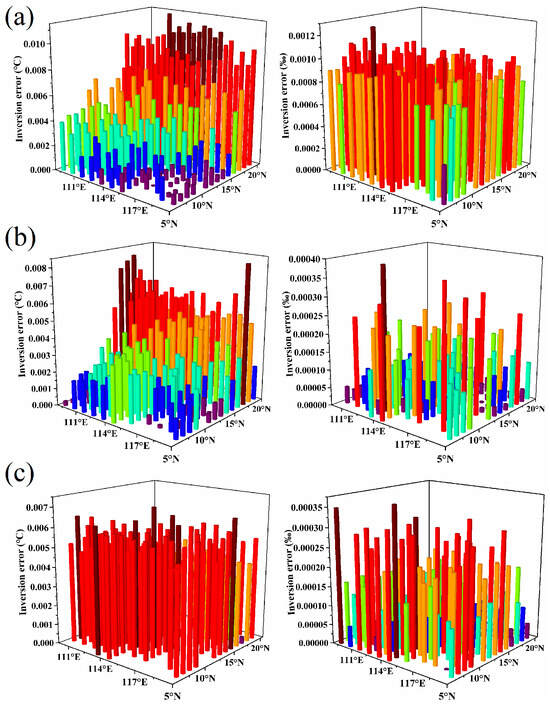
Figure 8.
Inversion errors of temperature and salinity at different depths: (a) 0 m, (b) 100 m, and (c) 200 m.
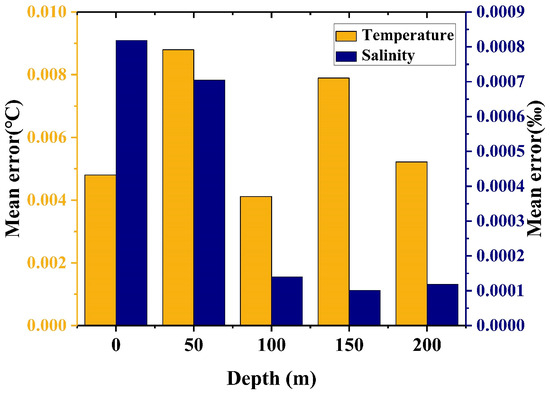
Figure 9.
Average inversion error of temperature and salinity in different depths of the South China Sea.
It is necessary to state that the actual inversion accuracy depends on the measurement accuracy of Brillouin frequency shift; however, the accuracy of Brillouin frequency shift measurements may be diminished due to instrument limitations and the influence of sea conditions. But even so, the dual-wavelength model remains the most straightforward and dependable among the three inversion models, thereby serving as a significant theoretical support for the implementation of dual-wavelength-based Brillouin lidar.
4. Conclusions
In summary, three inversion models were analyzed for simultaneous inversion of the temperature and salinity by Brillouin lidar based on dual-wavelength, dual-angle, and dual-parameter models. We compared the accuracies of these three models based on the actual temperature and salinity data of World Ocean Atlas 2023 (WOA23). Theoretical results indicate that the dual-wavelength model exhibits the smallest inversion errors, while the dual-angle model demonstrates the largest errors when fitted using the least squares method. The accuracy of the inversion models is in the order of MHz, which is based on the accuracy of the frequency shift data below megahertz order. The detection performance of Brillouin lidar depends on the stability of laser frequency and the resolution of the spectrometer, and the measurement accuracy is limited by the frequency resolution instrument and complex signal processing algorithm. In Brillouin lidar ocean remote sensing, if an accuracy of at least 0.1 °C for temperature is to be desired, the measurement accuracy of the Brillouin frequency shift must break the ~MHz limit; this becomes even more necessary as the depth of lidar detection increases. From the perspective of operability, the dual-wavelength Brillouin lidar possesses a distinct advantage. This is attributed to the advanced wavelength-tunable laser technology, which eliminates the need for high-precision linewidth extraction algorithms and complex angular control mechanisms. The results show that the dual-wavelength model also has good retrieval ability in the vertical direction of seawater. This work is essential to future applications of Brillouin-based lidar in remote sensing of the temperature and salinity profiles of oceans.
Author Contributions
X.J.: data curation (lead); formal analysis (lead); investigation (lead); validation (lead); writing—original draft (lead). G.Y.: investigation (supporting); formal analysis (supporting); software (supporting). X.W.: investigation (supporting); formal analysis (supporting). N.L.: formal analysis (supporting); writing—original draft (supporting); writing—review and editing (supporting); L.W.: formal analysis (supporting); writing—original draft (supporting); J.S.: conceptualization (lead); data curation (supporting); formal analysis (supporting); funding acquisition (lead); investigation (supporting); methodology (lead); project administration (lead); writing—original draft (supporting); writing—review and editing (lead). All authors have read and agreed to the published version of the manuscript.
Funding
This research was funded by the National Natural Science Foundation of China (Nos. 41776111, 12264031, and 62264011).
Institutional Review Board Statement
Not applicable.
Informed Consent Statement
Not applicable.
Data Availability Statement
Data underlying the results presented in this paper are not publicly available at this time but may be obtained from the authors upon reasonable request.
Conflicts of Interest
The authors declare no conflicts of interest.
Abbreviations
The following abbreviations are used in this manuscript:
| lidar | Light detection and ranging |
References
- Zou, L.; Wang, X.; Wen, Z.; Yu, Z.; Ma, X. Distribution characteristics of pycnocline in the northern South China Sea based on an improved vertical gradient method. J. Oceanogr. 2022, 78, 449–466. [Google Scholar] [CrossRef]
- Somavilla, R.; Rodriguez, C.; Lavín, A.; Viloria, A.; Marcos, E.; Cano, D. Atmospheric Control of Deep Chlorophyll Maximum Development. Geosciences 2019, 9, 178. [Google Scholar] [CrossRef]
- Mourn, J.N.; Perlin, A.; Nash, J.D.; Mcphaden, M.J. Seasonal sea surface cooling in the equatorial Pacific cold tongue controlled by ocean mixing. Nature 2013, 500, 64–67. [Google Scholar]
- Somavilla Cabrillo, R.; González-Pola, C.; Ruiz-Villarreal, M.; Lavín Montero, A. Mixed layer depth (MLD) variability in the southern Bay of Biscay. Deepening of winter MLDs concurrent with generalized upper water warming trends? Ocean Dyn. 2011, 61, 1215–1235. [Google Scholar] [CrossRef]
- Enzor, L.A.; Hunter, E.M.; Place, S.P. The effects of elevated temperature and ocean acidification on the metabolic pathways of notothenioid fish. Conserv. Physiol. 2017, 5, cox019. [Google Scholar] [CrossRef]
- Sandersfeld, T.; Davison, W.; Lamare, M.D.; Knust, R.; Richter, C. Elevated temperature causes metabolic trade-offs at the whole-organism level in the Antarctic fish Trematomus bernacchii. J. Exp. Biol. 2015, 218, 2373–2381. [Google Scholar] [CrossRef]
- Pezzolesi, L.; Guerrini, F.; Ciminicllo, P.; Dell’Auerscmo, C.; Iacouo, E.D.; Fattorusso, E.; Forino, M.; Tartaglione, L.; Pistocchi, R. Influence of temperature and salinity on Ostreopsis cf. ovata growth and evaluation of toxin content through HR LC-MS and biological assays. Water Res. 2012, 46, 82–92. [Google Scholar] [CrossRef]
- Okpobiri, O.; Rowland, E.D.; Egobueze, F.E.; Chinwe, M.F. Monitoring and Quantification of Carbon Dioxide Emissions and Impact of Sea Surface Temperature on Marine Ecosystems as Climate Change Indicators in the Niger Delta Using Geospatial Technology. Atmos. Res. 2023, 6, 1–20. [Google Scholar] [CrossRef]
- Smith, A.N.; Hennon, G.M.M.; Zinser, E.R.; Calfee, B.C.; Chandler, J.W.; Barton, A.D. Comparing Prochlorococcus temperature niches in the lab and across ocean basins. Limnol. Oceanogr. 2021, 66, 2632–2647. [Google Scholar] [CrossRef]
- Hu, C.; Muller-Karger, F.E.; Taylor, C.; Carder, K.L.; Kelble, C.; Johns, E.; Heil, C.A. Red tide detection and tracing using MODIS fluorescence data: A regional example in SW Florida coastal waters. Remote Sens. Environ. 2005, 97, 311–321. [Google Scholar] [CrossRef]
- Yang, F.; Zhang, L.; Long, M. Intensification of Pacific Trade Wind and Related Changes in the Relationship Between Sea Surface Temperature and Sea Level Pressure. Geophys. Res. Lett. 2022, 49, e2022GL098052. [Google Scholar] [CrossRef]
- Delorme, N.J.; Sewell, M.A. Temperature and salinity: Two climate change stressors affecting early development of the New Zealand sea urchin Evechinus chloroticus. Mar. Biol. 2014, 161, 1999–2009. [Google Scholar] [CrossRef]
- Walczowski, W.; Piechura, J.; Goszczko, I.; Wieczorek, P. Changes in Atlantic water properties: An important factor in the European Arctic marine climate. ICES J. Mar. Sci. 2012, 69, 864–869. [Google Scholar] [CrossRef]
- Yang, Y.; Zhong, M.; Feng, W.; Mu, D. Detecting Regional Deep Ocean Warming below 2000 meter Based on Altimetry, GRACE, Argo, and CTD Data. Adv. Atmos. Sci. 2021, 38, 1778–1790. [Google Scholar] [CrossRef]
- Koner, P.K.; Harris, A.; Maturi, E. A Physical Deterministic Inverse Method for Operational Satellite Remote Sensing: An Application for Sea Surface Temperature Retrievals. IEEE Trans. Geosci. Remote Sens. 2015, 53, 5872–5888. [Google Scholar] [CrossRef]
- Liu, Y.; Zhang, R.; Yin, Y.; Niu, T. The Application of ARGO Data to the Global Ocean Data Assimilation Operational System of NCC. Acta Meteorol. Sin. 2005, 19, 355. [Google Scholar]
- Gordon, A.L.; Haxby, W.F. Agulhas eddies invade the south Atlantic: Evidence From Geosat altimeter and shipboard conductivity-temperature-depth survey. J. Geophys. Res. Ocean. 1990, 95, 3117–3125. [Google Scholar] [CrossRef]
- Hailun, H.E.; Shouchang, W.U. Comparison of ship-based CTD measurement of Circumpolar Deep Water in the Amundsen Sea based on World Ocean Database. Adv. Polar Sci. 2022, 33, 11. [Google Scholar]
- Shivaprasad, S.; Dinesh, K.; Ashok, K.; Ravichandran, M. Acquisition of High Resolution Upper Ocean Spatial Thermo-Haline Structure by Underway Conductivity Temperature and Depth (UCTD) System in the Bay of Bengal; Indian National Centre for Ocean Information Services (INCOIS): New Delhi, India, 2015. [Google Scholar]
- Hirschberg, J.G.; Byrne, J.D.; Blizard, M.A. Rapid Underwater Ocean Measurements Using Brillouin Scattering. In Proceedings of the Ocean Optics VII, Monterey, CA, USA, 25–28 June 1984; pp. 270–276. [Google Scholar]
- Koestel, D.; Rupp, D.; Langfeld, B.; Walther, T. A Brillouin LIDAR For Remote Sensing the Temperature Profile in the Mixed Layer. In Proceedings of the Conference on Lasers and Electro-Optics, San Jose, CA, USA, 10–15 May 2020; p. ATu4I.3. [Google Scholar]
- Popescu, A.; Schorstein, K.; Walther, T. A novel approach to a Brillouin–LIDAR for remote sensing of the ocean temperature. Appl. Phys. B 2004, 79, 955–961. [Google Scholar] [CrossRef]
- Rudolf, A.; Walther, T. Laboratory demonstration of a Brillouin lidar to remotely measure temperature profiles of the ocean. Opt. Eng. 2014, 53, 051407. [Google Scholar] [CrossRef]
- Rudolf, A.; Walther, T. A Brillouin lidar for remote sensing of the temperature profile in the ocean: Towards the laboratory demonstration. In Proceedings of the Oceans-Yeosu, Yeosu, Republic of Korea, 21–24 May 2012; pp. 1–6. [Google Scholar]
- Schorstein, K.; Fry, E.S.; Walther, T. Depth-resolved temperature measurements of water using the Brillouin lidar technique. Appl. Phys. B 2009, 97, 931–934. [Google Scholar] [CrossRef]
- Moisan, J.R.; Rousseaux, C.S.; Stysley, P.R.; Clarke, G.B.; Poulios, D.P. Ocean Temperature Profiling Lidar: Analysis of Technology and Potential for Rapid Ocean Observations. Remote Sens. 2024, 16, 1236. [Google Scholar] [CrossRef]
- Yu, Y.; Ma, Y.; Li, H.; Huang, J.; Fang, Y.; Liang, K.; Zhou, B. Simulation of simultaneously obtaining ocean temperature and salinity using dual-wavelength Brillouin lidar. Laser Phys. Lett. 2014, 11, 036001. [Google Scholar] [CrossRef]
- Koestel, D.; Walther, T. The Brillouin linewidth in water as a function of temperature and salinity: The missing empirical relationship. Appl. Phys. B 2024, 130, 53. [Google Scholar] [CrossRef]
- Shi, J.; Xu, N.; Luo, N.; Li, S.; Xu, J.; He, X. Retrieval of sound-velocity profile in ocean by employing Brillouin scattering LiDAR. Opt. Express 2022, 30, 16419–16431. [Google Scholar] [CrossRef] [PubMed]
- Hickman, G.D.; Harding, J.M.; Carnes, M.; Pressman, A.; Kattawar, G.W. Aircraft Laser Sensing of Sound Velocity in Water: Brillouin Scattering. Remote Sens. Environ. 1991, 36, 165–178. [Google Scholar] [CrossRef]
- Liu, D.H.; Shi, J.W.; Chen, X.D.; Ouyang, M.; Gong, W.P. Brillouin lidar and related basic physics. Front. Phys. China 2010, 5, 82–106. [Google Scholar] [CrossRef]
- Fry, E.S.; Emery, Y.; Quan, X.; Katz, J.W. Accuracy limitations on Brillouin lidar measurements of temperature and sound speed in the ocean. Appl. Opt. 1997, 36, 6887. [Google Scholar] [CrossRef]
- Liang, K.; Ma, Y.; Yu, Y.; Huang, J.; Li, H. Research on simultaneous measurement of ocean temperature and salinity using Brillouin shift and linewidth. Opt. Eng. 2012, 51, 6002. [Google Scholar] [CrossRef]
- Yong, M.; Kun, L.; Hong, L.; Hang, J. Study on Simultaneous Measurement of Temperature and Salinity Based on Brillouin Scattering. Acta Opt. Sin. 2008, 28, 1508–1512. [Google Scholar] [CrossRef]
- Li, K.; He, Y.; Ma, J.; Jiang, Z.; Hou, C.; Chen, W.; Zhu, X.; Chen, P.; Tang, J.; Wu, S.; et al. A Dual-Wavelength Ocean Lidar for Vertical Profiling of Oceanic Backscatter and Attenuation. Remote Sens. 2020, 12, 2844. [Google Scholar] [CrossRef]
- Zhou, Y.; Chen, Y.; Zhao, H.; Jamet, C.; Dionisi, D.; Chami, M.; Di Girolamo, P.; Churnside, J.H.; Malinka, A.; Zhao, H.; et al. Shipborne oceanic high-spectral-resolution lidar for accurate estimation of seawater depth-resolved optical properties. Light Sci. Appl. 2022, 11, 261. [Google Scholar] [CrossRef]
- Kushina, M.E.; Heberle, G.; Hope, M.; Hall, D.; Bethel, M.; Calmes, L.K. ALMDS laser system. In Solid State Lasers XII, Proceedings of the High-Power Lasers and Applications, San Jose, CA, USA, 25–31 January 2003; SPIE: Bellingham, WA, USA, 2003. [Google Scholar] [CrossRef]
- Sofranec, D. Small-Scale Topo and Bathy Lidar Ready for UAVs. GPS World, 1 April 2020. Available online: https://www.gpsworld.com/small-scale-topo-and-bathy-lidar-ready-for-uavs/ (accessed on 5 February 2025).
- Saunders, P.M.; Fofonoff, N.P. Conversion of pressure to depth in the ocean. Deep Sea Res. Oceanogr. Abstr. 1976, 23, 109–111. [Google Scholar] [CrossRef]
- Xu, N.; Liu, Z.; Zhang, X.; Xu, Y.; Luo, N.; Li, S.; Xu, J.; He, X.; Shi, J. Influence of temperature-salinity-depth structure of the upper-ocean on the frequency shift of Brillouin LiDAR. Opt. Express 2021, 29, 36442–36452. [Google Scholar] [CrossRef]
- Locarnini, R.; Mishonov, A.; Baranova, O.; Boyer, T.; Zweng, M.; Garcia, H.; Reagan, J.; Seidov, D.; Weathers, K.; Paver, C.; et al. World Ocean Atlas 2018, Volume 1: Temperature; NOAA: Silver Spring, MD, USA, 2019. [Google Scholar]
- Reagan, J.R.; Seidov, D.; Wang, Z.; Dukhovskoy, D.; Boyer, T.P.; Locarnini, R.A.; Baranova, O.K.; Mishonov, A.V.; Garcia, H.E.; Bouchard, C.; et al. World Ocean Atlas 2023, Volume 2: Salinity; NOAA: Silver Spring, MD, USA, 2024. [Google Scholar] [CrossRef]
- Boyd, R.W.; Rza̧ewski, K.; Narum, P. Noise initiation of stimulated Brillouin scattering. Phys. Rev. A 1990, 42, 5514–5521. [Google Scholar] [CrossRef]
- Xu, J.; Ren, X.; Gong, W.; Dai, R.; Liu, D. Measurement of the Bulk Viscosity of Liquid by Brillouin Scattering. Appl. Opt. 2003, 42, 6704–6709. [Google Scholar] [CrossRef]
- Del Grosso, V.A. New equation for the speed of sound in natural waters (with comparisons to other equations). J. Acoust. Soc. Am. 1974, 56, 1084–1091. [Google Scholar] [CrossRef]
- Millard, R.C.; Seaver, G. An index of refraction algorithm for seawater over temperature, pressure, salinity, density, and wavelength. Deep Sea Res. Part A Oceanogr. Res. Pap. 1990, 37, 1909–1926. [Google Scholar] [CrossRef]
- Richards, S.D. The effect of temperature, pressure, and salinity on sound attenuation in turbid seawater. J. Acoust. Soc. Am. 1998, 103, 205–211. [Google Scholar] [CrossRef]
Disclaimer/Publisher’s Note: The statements, opinions and data contained in all publications are solely those of the individual author(s) and contributor(s) and not of MDPI and/or the editor(s). MDPI and/or the editor(s) disclaim responsibility for any injury to people or property resulting from any ideas, methods, instructions or products referred to in the content. |
© 2025 by the authors. Licensee MDPI, Basel, Switzerland. This article is an open access article distributed under the terms and conditions of the Creative Commons Attribution (CC BY) license (https://creativecommons.org/licenses/by/4.0/).