Abstract
Multi-fidelity surrogate-based methods play an important role in modern engineering design applications, aiming to improve model accuracy while reducing computational cost. One of the widely adopted approaches is the calibration-based method, which calibrates the low-fidelity model through a discrepancy model between low-fidelity and high-fidelity models. Since discrepancies between models exhibit varying characteristics across different problems, using a single surrogate for discrepancy approximation may lack stability. In practical engineering design problems, it is often hard for designers to select optimal surrogate models. To this end, a hybrid-surrogate-calibration-assisted multi-fidelity modeling (HSC-MFM) approach is proposed in this paper. Specifically, this approach integrates three representative surrogate models, including the polynomial response surface, Kriging model, and radial basis function, to comprehensively capture the discrepancy characteristics between different fidelity models. Furthermore, an adaptive weight calculation method is developed to improve the modeling accuracy. Testing results demonstrate that HSC-MFM achieves enhanced stability compared to most existing methods while maintaining good prediction accuracy. Finally, the proposed method is applied to predict the strength of the frame for a blended-wing-body underwater glider, which verifies its engineering applicability.
1. Introduction
In modern engineering design fields, simulations are widely employed to replace expensive physical experiments during analysis and optimization stages. Although simulations are generally less expensive than physical experiments, relying solely on high-fidelity (HF) simulations in the design process still incurs significant computational costs. To address this issue, surrogate model (SM)- or metamodel-based methods are gaining popularity. For example, Zheng et al. [1] built an experimental surrogate model to predict the pneumatic performances of flapping wings, and they also established comprehensive aerodynamic surrogate models to precisely anticipate pneumatic performances and torque allocations under different attitude control patterns. Xi et al. [2] utilized the polynomial response surface model to optimize a high-pressure capturing wing under hypersonic and supersonic conditions.
Although surrogate-based methods can dramatically reduce the computational cost associated with performance analysis or optimizations, it is still computationally intensive to build an accurate enough surrogate model. Given that multi-fidelity (MF) simulation models commonly exist in engineering problems, researchers have concentrated on utilizing different fidelity data to build a more accurate surrogate model and reduce the involved computational cost at the same time. Generally, a complex physical model can be analyzed with different fidelity calculations. For instance, both the Reynolds-averaged Navier–Stokes equations and the Euler inviscid equations can be employed for hydrodynamic analysis in marine engineering. Additionally, when discretizing the governing equations through computational fluid dynamics, different mesh qualities can be adopted. To reconcile the trade-off between model accuracy and computational expense, several methods that integrate the best features of different fidelity models to construct multi-fidelity surrogate models (MFSMs) have been proposed [3,4,5,6,7]. The primary purpose of constructing MFSMs is to enhance model accuracy by utilizing fewer HF calculations, supplemented by low-fidelity (LF) calculations.
The correction-based method, which corrects a low-fidelity model (LFM) with a high-fidelity model (HFM), is the most popular approach for constructing an MFSM. The correction-based approaches include additive correction, multiplicative correction, comprehensive correction, and space mapping. For instance, Balabanov et al. [8] developed a quadratic response surface model using thousands of LF samples, and subsequently employed a hundred HFM evaluations to create a linear multiplicative and additive correction response surface model (RSM). Alexandrov et al. [9,10] introduced the first-order additive and multiplicative scaling modeling method, while Eldred et al. [11] expanded this first-order to a second-order scaling method, which requires the second-order derivative information of the HF and LF responses. Gano [12] proposed a hybrid MFSM based on a Kriging scaling function. Sun et al. [13] applied the moving least square method to approximate the LFM and correct it using the RSM scaling. Han et al. [14] combined direct gradient-enhanced Kriging with a generalized hybrid bridge function to enhance the efficiency and accuracy of the MFSM. Zheng et al. [15] developed a hybrid MFSM that combines a tuned radial basis function base model and a Kriging linear correction function. Tyan et al. [16] proposed a global MF modeling method to efficiently address design optimization problems by extending an original variable-complexity modeling algorithm, which utilizes an LFM and a scaling function to approximate an HF function. Wang et al. [17] constructed LFMs with the Kriging modeling method and also developed a Kriging-based additive correction function. Palar et al. [18] presented an MF extension of non-intrusive polynomial chaos, and this MF expansion combined an LFM with additive correction polynomial expansions. Zhao et al. [19] employed a support vector regression model to conveniently generate a single-dimensional output mapping model, which approximates the relationship between LF and HF outputs. Recently, Kou et al. [20] proposed an unsteady multi-fidelity aerodynamic modeling framework, in which the correction term from the low-fidelity model to the high-fidelity result is identified using a machine learning approach. Test results indicate that the proposed MF model outperforms the single aerodynamic reduced-order model in most cases. Zhang et al. [21] proposed a method to determine the scale factor for MFSMs, which uses feasible intervals to determine a series of scaling factors and their corresponding MFSMs, and this ensemble of MFSMs is then employed to enhance prediction accuracy. Hai et al. [22] developed an active learning-assisted multi-fidelity surrogate modeling method that employs geometric transformations to adjust the LF surrogate, aligning it more closely with the HF data. The transformed LF surrogate and the HF surrogate are coupled using correlation functions, the active learning strategy combines accelerated error convergence with enhanced sample set diversity to judiciously select incremental HF samples.
In addition to the aforementioned correction-based methods, several other MF modeling approaches have been developed in recent years. Kennedy and O’Hagan [23] proposed a Cooperative Kriging (CoK) model based on the Gaussian process, and Forrester et al. [24] provided an intuitive derivation of the two-fidelity CoK model. Han et al. [3] introduced a Hierarchical Kriging (HK) model that employs an LF Kriging model as a trend model. The variation in the LF data is mapped to the HF data, resulting in a more accurate Kriging surrogate model for the HFM. Ulaganathan et al. [25] investigated the performance of Kriging models when MF gradient data are introduced along with MF data to approximate computationally expensive black-box simulations. This approach is referred to as gradient-enhanced recursive CoK. Xiao et al. [26] extended the CoK method to multi-level MF to enhance the accuracy of approximation models. Li et al. [6] developed a cooperative radial basis function (Co-RBF) method for MFSMs by modifying the basis function of the RBF model, treating the LFM as a basis function within the RBF model. Test results indicate that the Co-RBF method improves the efficiency, accuracy, and robustness of existing MFSMs. Dong et al. [27] utilized optimal estimation from the Kalman filter to fuse the independent information from different fidelity models synthetically and construct an MFSM using the fused data. Zhou et al. [28] proposed a sequential MFSM for data regression, addressing the issues of sample point allocation for LF and HF models, as well as determining the optimal sample sizes for both models within a specified computational budget and cost ratio. Liu et al. [29] proposed a novel MF Gaussian process for modeling with diverse data structures, which is composed of a global trend term and a local residual term. Zheng et al. [19] also presented an MF output mapping modeling method, in which LF outputs are directly mapped to HF outputs using least square support vector regression. Hu et al. [30] proposed an ensemble weighted average conservative multi-fidelity modeling method that integrates the performance of different error metrics. The bootstrap method and mean-square-error method are reasonably weighted to calculate the safety margin of the MF surrogate model. The effectiveness of the proposed method was demonstrated through several numerical examples and a pressure vessel design problem. Xu et al. [31] proposed a hierarchical regression framework for MF modeling, which includes a hierarchical regressor for bi-fidelity modeling and a recursive method for multi-fidelity modeling. This recursive method extends the bi-fidelity model to the MF case by propagating HF information to the samples at relatively LF levels to update their responses, then the bi-fidelity models are built based on the updated sample sets. Test results indicate that the MF models developed under the proposed framework exhibit superior performance and have high robustness for varying sample sizes. Li et al. [32] proposed a nonlinear integrated bi-fidelity model that maps predictions from an LFM to HFM in a nonlinear manner, enhancing the ability to capture nonlinear correlations between HF and LF models. Recently, Tang et al. [33] proposed a combination modeling method for complex MF data fusion, aimed at improving the scalability of existing MF data fusion methods. They addressed the modeling problems with three types of MF data fusion and explored a general solution applicable to any n types of MF data fusion. He et al. [34] proposed an efficient HK modeling method which utilizes distance correlation to determine the relative value of the hyper-parameter for the LFM and can improve the modeling efficiency significantly. Similarly, the HFM is built by treating the hyper-parameter of the LFM as the relative value for the hyper-parameter of the HFM. Experimental results demonstrate that this method substantially reduces modeling time without compromising accuracy. Wang et al. [35] proposed an ensemble learning-based MFSM which utilizes an adaptive ensemble surrogate model to effectively alleviate the negative impact of inappropriate LFM selection on HF approximation results. In addition, feature mapping and a hierarchical framework are exploited to boost the versatility of the model and alleviate the dependence of MFSM performance on the relationship between the HFM and LFM.
All the above-mentioned MF modeling methods can be utilized to solve computationally expensive engineering design or analysis problems, and the correction-based method is the most widely used in engineering applications since its modeling process is relatively simple and easy to use. Most existing correction-based methods adopt one single surrogate to approximate the discrepancy between the HFM and LFM. However, the discrepancies between different fidelity models among different problems usually have various characteristics, and using one single surrogate to approximate the discrepancy may lack stability. To this end, a hybrid-surrogate-calibration-assisted multi-fidelity modeling (HSC-MFM) approach is proposed in this work. This method integrates three typical surrogate models to capture the characteristics of the discrepancies between different fidelity models. Additionally, an adaptive weight coefficient calculation method has been developed to enhance the modeling accuracy. The proposed HSC-MFM method was tested through eighteen benchmark problems and compared with five existing methods. The testing results indicate that HSC-MFM provides more-stable predictions while maintaining good prediction accuracy. In addition, the HSC-MFM method is applied to predict the strength of the frame for a blended-wing-body underwater glider, which verifies its engineering applicability. The main contributions of this work include the following: (1) a novel multi-fidelity surrogate modeling approach is proposed through hybrid-surrogate calibration, which enhances the stability of existing methods; (2) an adaptive weight coefficient calculation method is defined to integrate three calibration models, aimed at improving the accuracy of HSC-MFM; (3) the prediction stability of HSC-MFM is verified through benchmark test problems; and (4) the engineering applicability of HSC-MFM is validated through a strength prediction problem.
The remainder of this paper is organized as follows. Section 2 provides a short review of the basic theories used in this work. Section 3 illustrates the proposed HSC-MFM method and the weight coefficient calculation method. Subsequently, eighteen mathematical problems are utilized to evaluate the performance of HSC-MFM in Section 4. In Section 5, HSC-MFM is applied to predict the frame strength of a blended-wing-body underwater glider. Finally, we summarize this work and discuss its contributions and deficiencies.
2. Short Reviews of the Basic Theories
In this work, three commonly used SMs are combined to construct the HSC-MFM system. Firstly, the basic theories of these modeling techniques are introduced, as follows.
2.1. Polynomial Response Surface Model
Polynomial response surface (PRS) is the most widely used surrogate model in the engineering design field [36], which utilizes a polynomial to approximate the expensive function. Generally, a one-dimensional function can be approximated by a polynomial of order, which can be represented by Equation (1).
The parameters can be estimated through the least square solution of Φw = y, where Φ is the Vandermonde matrix and y is the actual response vector of the sample points.
Then, the maximum likelihood estimation of w is obtained as follows:
The m-order polynomial approximation is similar to a Taylor series expansion with (m + 1) terms. It indicates that a larger can yield a more accurate PRS model. However, a larger will lead to a more flexible model and may cause overfitting with noisy data. To avoid these cases, some different criteria can be used to choose an appropriate [37]. The structure of the PRS model is simple, it is efficient to construct, and it can provide good prediction for low-dimensional nonlinear problems.
2.2. Kriging Model
The Kriging model (KM) was initially presented by the geologist Krige [38], and Sacks et al. [39] first applied it to predict the responses of an input based on simulation results. The Kriging model predicts responses through a constant plus a stochastic process.
where y(x) is the responses of the predictor, μ is the global approximation constant, and Z(x) is the stochastic process with the following characteristics.
where σ2 represents the variance of the response and R(x(i), x(j)) is the correlation function between x(i) and x(j). In this paper, the Gaussian function is selected as the correlation, which is described in Equation (6).
where θk are the hyper-parameters that need to be determined by maximum likelihood estimation. Since the correlation function selected is the Gaussian function, the predicted response can be expressed as Equations (7) and (8).
where y represents the responses of the sample points, r(x) is the vector of correlation function between the to-be-estimated point x and the sample points, and denotes the generalized least square estimator. In addition, the prediction variance of the Kriging model can be estimated as follows:
2.3. Radial Basis Function Model
The radial basis function (RBF) model uses the sum of weighted real-valued basis functions to approximate the true function. The values of the basis function only depend on the Euclidean distances between samples or between samples and to-be-predicted points. The general form of an RBF model is given as follows:
where is the basis function, c(i) represents the center of the i-th basis function, denotes the vector that contains the values of the basis function, and w is the weights of these basis functions. The commonly used forms of basis functions are listed in Table 1. Parametric basis functions have more freedom than fixed basis functions, which can improve the generalization properties of the RBF model but require a more complex parameter estimation process.

Table 1.
The commonly used basis functions in the RBF model.
Once the basis function is chosen, the only parameters that need to be estimated are the weights w, which can be solved through the interpolation condition.
where x(j) and y(j) are the location and response of the j-th sample, respectively. Since the RBF model is a function that only concerns the Euclidean distances and the parameters are easy to estimate, the modeling process is efficient, and it is suitable for high-dimensional problems.
3. Description of Proposed HSC-MFM Approach
3.1. Main Procedures of HSC-MFM
The proposed hybrid-surrogate-calibration-assisted multi-fidelity modeling method mainly aims at integrating the features of the PRS, Kriging, and RBF models to construct a hybrid calibration model, and to then utilize this model to calibrate a LF Kriging model. The flowchart of this process is shown in Figure 1, and the main steps are described as follows. In addition, a core step of HSC-MFM is the calculation of adaptive weights, which will be described in detail in the next subsection.
| Main steps of HSC-MFM: |
|
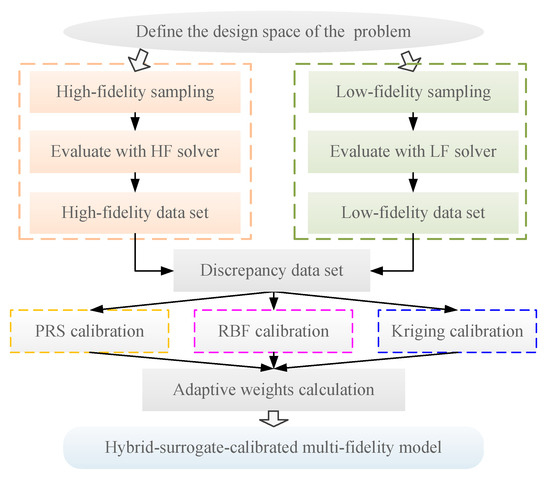
Figure 1.
The flowchart of the proposed HSC-MFM process.
3.2. Calculation of Weight Coefficient
In this subsection, an error-based adaptive weight coefficient calculation method is proposed for different calibration models. Generally, more accurate models should have larger weight coefficients in the hybrid model; therefore, how to measure the accuracy of the calibration models is the prime problem. Since true high-fidelity models are usually expensive in multi-fidelity problems, it is impractical to use a lot of extra samples to test the calibration models. In this work, the leave-one-out cross-validation (LOOCV) method was adopted, as it does not require test samples.
The principle of LOOCV is described as follows: assuming there are m samples, each sample is removed from the entire sample set, and a SM is constructed using the remaining samples. The removed sample is then predicted using the SM. When all the samples have been removed from the sample set in turns, predictions for the true responses are calculated. Then, the cross-validation error of the SM is calculated using Equation (13), where represents the prediction and is the true response.
Based on the present data set, the cross-validation error of the current PRS, Kriging, and RBF models can be calculated, which are denoted as , and . Assume the hybrid-surrogate calibration possesses the following form:
where , , and are the three calibration surrogate models and w1, w2, and w3 are the corresponding weight coefficients of the single calibration models. In this work, an error-based approach was utilized to calculate the weights adaptively. Specifically, the weight coefficients of the calibration models are defined as Equations (15)–(17)
Then, the hybrid-surrogate-calibrated multi-fidelity model can be represented with Equation (18), where is the LF Kriging model.
3.3. Demonstration of HSC-MFM
To illustrate the modeling process intuitively, a one-dimensional problem is used as an example here. The formulation of the problems is described as Equation (A2) in the appendix, and the graph of this problem is shown in Figure 2. Assume the available HF samples are Xh = [0, 0.2, 0.4, 0.6, 0.8, 1.0], the HF responses are Yh = [3.0272, −0.6397, 0.1148, −0.1494, −4.9491, 15.8297], and the LF responses at the HF samples are Yl = [−8.4864, −8.3199, −5.9426, −4.0747, −4.4746, 7.9149]. Then, the discrepancy data set can be obtained and denoted with Xd and Yd.
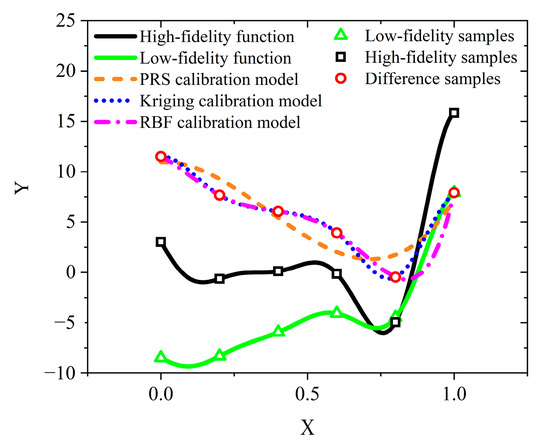
Figure 2.
Graph of high-fidelity function, low-fidelity function, and different calibration surrogate models.
Based on the discrepancy data, three calibration surrogate models were constructed using MATLAB R2023b and are shown in Figure 2. Then, the weights of these calibration models could be calculated using the above equations, and the hybrid-surrogate-calibrated model was obtained.
The hybrid-surrogate-calibrated model and single-surrogate-calibrated models are illustrated in Figure 3. The accuracy of these models was evaluated, and the results are presented in Table 2. In this table, RMSE refers to the root mean square error, MAX denotes the maximum error, and R2 represents the R-squared score. Lower values of RMSE and MAX indicate higher model accuracy, while an R2 value approaching unity signifies a stronger correlation between the approximate model and the high-fidelity function. The results indicate that HSC-MFM outperforms both the single PRS- and RBF-calibrated models, as well as the Kriging model constructed solely with HF samples. Although HSC-MFM exhibits slightly lower accuracy than the Kriging-calibrated model, its primary objective is to enhance the prediction stability across various types of problems, which will be further tested in the next section.
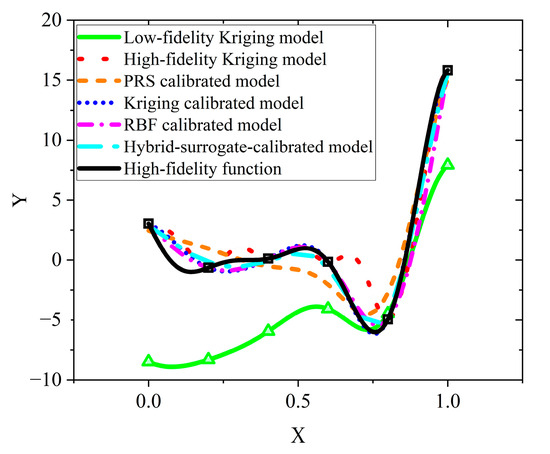
Figure 3.
Comparisons of HSC-MFM approach and single-surrogate-calibrated models.

Table 2.
An accuracy comparison of the differently calibrated models for the example problem.
4. Mathematical Problem Testing
4.1. Test Problem Suite
In this study, eighteen widely used multi-fidelity mathematical test problems were employed to investigate the performance of HSC-MFM. These test problems, sourced from the relevant literature [40,41,42,43], range from one to ten dimensions and possess different properties. In addition, the relations between the LF and HF models differ across the test problems. The properties of these problems are summarized in Table 3, and the specific expressions of these test problems are provided in Appendix A.

Table 3.
Properties of different mathematical test problems.
4.2. Comparison and Results Discussion
To investigate the performance of the proposed HSC-MFM method, three types of commonly used multi-fidelity modeling methods were adopted to make a comparison. One of them was the well-known additive bridge function (ABF) method [17], the other two methods were the HK method [3] and the CoK modeling method [23]. For the ABF method, three different surrogate models were used to construct the discrepancy models and low-fidelity models, including polynomial response surface-based ABF (ABF-PRS), Kriging-based ABF (ABF-K), and radial basis function-based ABF (ABF-RBF). The modeling accuracies of all these methods were verified using the above-mentioned test problems. In this work, the Kriging model was implemented with the DACE toolbox [44], PRS models were constructed with the Matsumoto toolbox [45], RBF models were created based on the code from Jekabsons [46], CoK models were implemented with the code from Kitson et al. [47], and the HK models were constructed through a modification of the DACE toolbox.
The samples should be determined first before building these multi-fidelity models. Since the number of samples required should increase with the number of variables, the number of HF samples and LF samples were set to 10d and 16d for all test methods, respectively, where d is the number of dimensions of the test problem. In addition, to measure the accuracy of the constructed models, 50d HF samples were selected to calculate the RMSE of each established model. The sample sets for modeling and testing were all selected using the OLHS method. To eliminate the influence of random factors, all these methods were tested ten times on each problem, and their mean RMSEs are compared in Table 4.

Table 4.
Root mean square errors of different methods for test problems.
It can be observed from the results that the model accuracy differs a lot for the different modeling methods. For example, the ABF-PRS method performs much better on F5 and F15 than other methods, while not performing so well on other test problems. In addition, the ABF-K and HK methods perform better in most test problems. Specifically, both of them possess the smallest modeling error on six test problems each. However, the performances of the ABF-RBF and CoK methods are relatively poor, since they are not superior to other comparison methods in any problem. The proposed HSC-MFM method performs best on F11, F12, and F14. Since it is not reasonable to only compare the number of best performances, a ranking-based method was utilized to compare the performance of these methods, and the results are presented in Table 5. Each row in this table represents the ranking of different methods on the same problem. Based on the rankings of these methods across eighteen problems, the average ranking could be calculated and the synthetic ranking of all methods was obtained.

Table 5.
Rankings of different methods for all test problems.
The results in Table 5 indicate that the proposed HSC-MFM method performs better than the ABF-PRS, ABF-RBF, and CoK methods while performing worse than the ABF-K and HK methods from the perspective of model accuracy. However, the main intention of HSC-MFM is to improve prediction stability by fusing the features of different calibration models. Since model accuracy is greatly affected by the samples that are used to build the model, one method will have different prediction accuracies in the ten-time test. The RMSE intervals of the ten-time test results are presented in Table 6, where the interval with the most concentrated data is marked as bold. The data in Table 6 indicates that the ABF-PRS, ABF-RBF, CoK, and HK models own the smallest intervals in some of the test problems, but do not perform well enough on other problems. Although HSC-MFM does not have the smallest RMSE interval in all the test problems, it has relatively small intervals in all the problems, which indicates that HSC-MFM can provide more stable predictions among different problems. To show the results more intuitively, the distribution of the ten-time test results is shown with box plots in Figure 4a–r. In the box plots, it is obvious that the ten-time test results of HSC-MFM are relatively concentrated in all problems, which verifies the stability of the prediction model.

Table 6.
Comparison of RMSE intervals for different methods on all test problems.
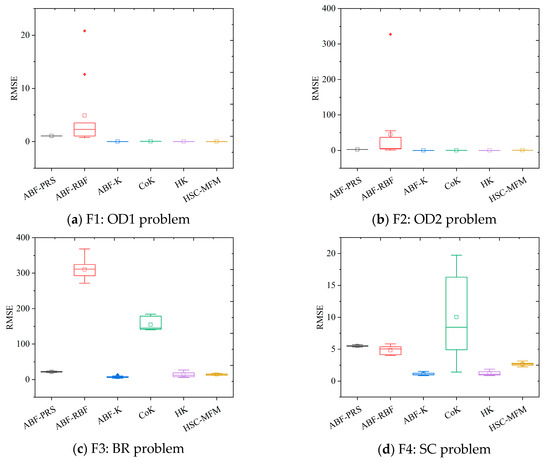
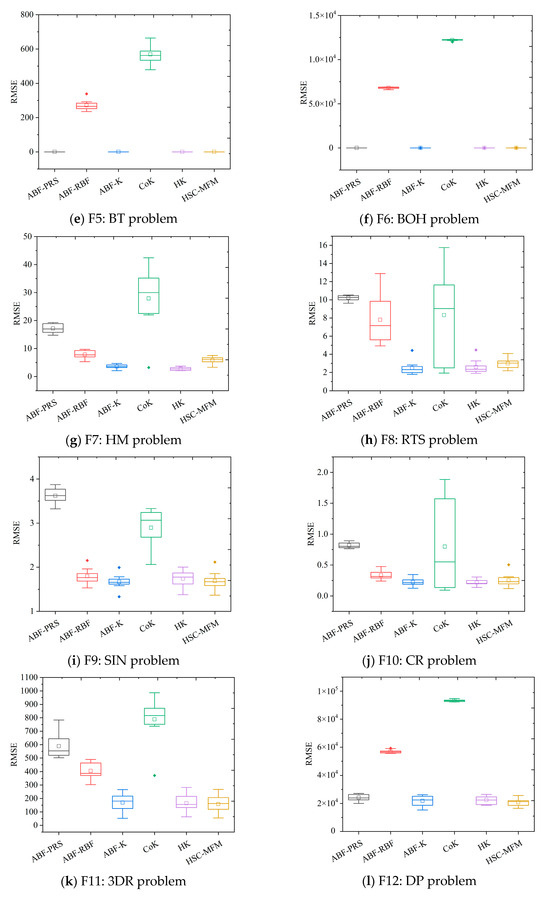
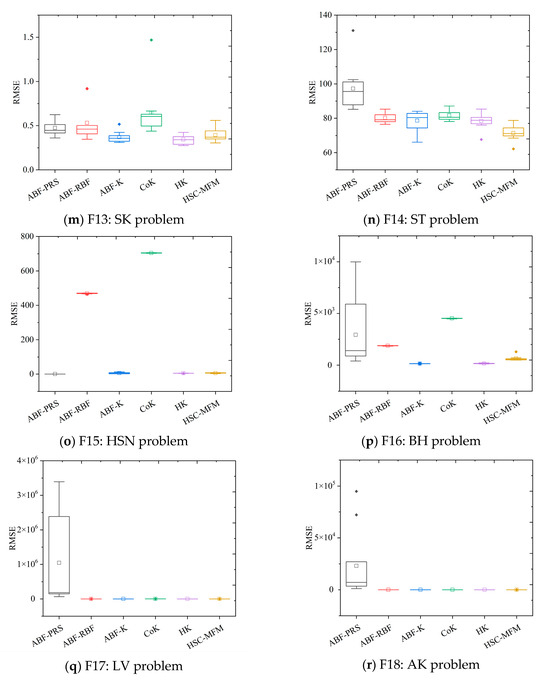
Figure 4.
Box plots of ten-time test results for different methods on all test problems.
5. Frame Strength Prediction for a Blended-Wing-Body Underwater Glider
5.1. Problem Description
In this section, the proposed HSC-MFM method was applied to a structural analysis problem to validate its engineering applicability. The blended-wing-body underwater glider (BWBUG) is a novel type of autonomous underwater vehicle that has many advantages over traditional torpedo-shaped underwater vehicles, including a long range, extended duration, low cost, and low noise. Therefore, BWBUGs are well-suited for oceanographic sensing and data collection [48]. Generally, the release and retrieval of BWBUGs must be conducted on board vessels with the help of a crane. Due to their large span and small thickness, the wings are prone to damage during the release or retrieval process. To ensure the safety of the structure, extensive analyses are required during the design and optimization phases, which can be computationally intensive and time-consuming. In this work, HSC-MFM was constructed to predict the structural strength of a BWBUG using multi-fidelity simulation data.
Structural strength mainly depends on the strength of the frame. As shown in Figure 5, the frame is mainly composed of longitudinal beams, crossbeams, and lead and trailing edge beams. In this work, the shape of the BWBUG is fixed, and there are a total of five parameters that describe the structure of the frame, as shown in Figure 6. The scopes of the design parameters are specified and listed in Table 7.
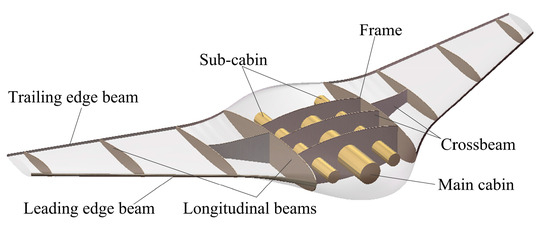
Figure 5.
Diagram of frame structure for BWBUG.
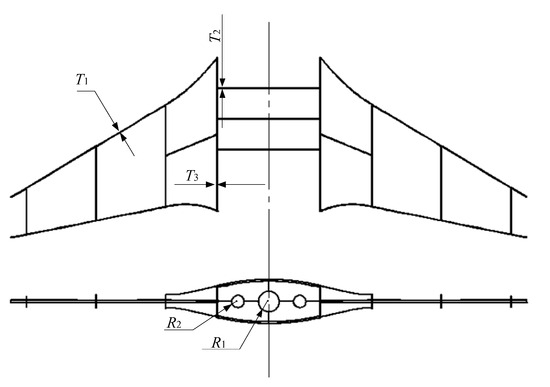
Figure 6.
Diagram of structural design parameters for BUWUG frame.

Table 7.
Scopes of frame design parameters.
To avoid structural failure during the release or retrieval process, the maximum stress of the frame had to be calculated and needed to be less than the ultimate stress of the material. In this work, aluminum alloy was selected as the material for the frame, with an ultimate stress of 343 MPa. During the conceptual design phase, a large number of designs with different parameters must be evaluated to ensure that their strength is adequate. The maximum stress of the frame is usually obtained through finite element analysis (FEA), which is relatively computationally intensive. To reduce the time required for a large number of simulations, the proposed HSC-MFM method was utilized to build a predictive model for the maximum stress of the frame with the LF and HF simulation data.
5.2. Multi-Fidelity Simulations for Structure Analysis
To generate simulation data of different fidelities, two simulation models were built first. In the FEA process, the quality of the computational grids will affect the accuracy and efficiency of the simulations. In this study, fine and coarse grids were adopted to produce LF and HF simulation data, respectively. As shown in Figure 7, the fine-grid model comprises a total of 22,729 elements, while the coarse-grid model contains 2835 elements. Then, the calculation cost ratio between the high-fidelity and low-fidelity models could be approximately regarded as 8.

Figure 7.
The fine grids (left) and coarse grids (right) for the frame.
Generally, the lifting speed during release or retrieval is quite slow, so it can be considered uniform lifting. During the lifting process, the main load exerted on the frame is gravity. Therefore, the dead weight was applied uniformly on the frame in the FEA model to simulate the release or retrieval process. Figure 8 shows an example of the stress distribution in the HF and LF simulation results for the same frame. The simulations revealed that the maximum stress occurs at the leading edge beam, specifically near the junction of the wing and body, where stress concentration exists. The simulation data showed that the maximum stress for the HF result was 943 MPa, while it was 971 MPa for the LF result. In addition, the figure demonstrates that these two stress distributions are similar, although the HF simulation provides more details of the stress distribution.

Figure 8.
Example of HF (left) and LF (right) simulation results.
5.3. Strength Prediction and Result Discussion
According to the modeling process described in Section 3, the HF and LF samples needed to be generated first. The required numbers of HF and LF samples were specified as 50 and 80, respectively, and these samples were selected using the OLHS method within the design space. To validate the accuracy of the prediction model, an additional 250 HF samples were selected using OLHS. To illustrate the high accuracy of the proposed HSC-MFM, the comparison methods used in mathematical problems were also adopted here. The prediction accuracy of these MFMs is presented in Table 8, and the results indicate that the accuracy of HSC-MFM is neither the highest nor the lowest.

Table 8.
Prediction accuracy of different MFMs in strength prediction problem.
To illustrate the prediction accuracy of different models more intuitively for this problem, the predictions on each dimension were illustrated using point-and-figure charts, as shown in Figure 9, Figure 10, Figure 11, Figure 12 and Figure 13. In each figure, only one variable is altered, while the remaining variables remain constant. One hundred samples were selected in each dimension and the HF simulated maximum stresses were evaluated. The HF simulation and predictions of the MFMs are compared in these figures, where the black line with squares represents the HF simulations, red line with dots denotes the ABF-PRS prediction, blue line with upward triangles is the ABF-RBF prediction, green line with inverted triangles represents the ABF-K prediction, purple line with rhombuses denotes the CoK prediction, yellow line with left triangles is the HK prediction, and the light blue line with right triangles is the HSC-MFM prediction.
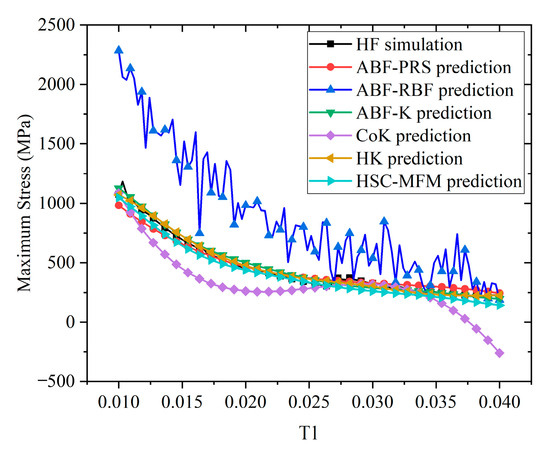
Figure 9.
Prediction comparison of different methods with varying T1.
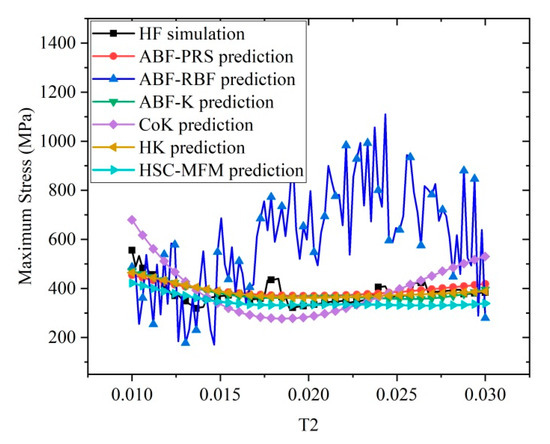
Figure 10.
Prediction comparison of different methods with varying T2.
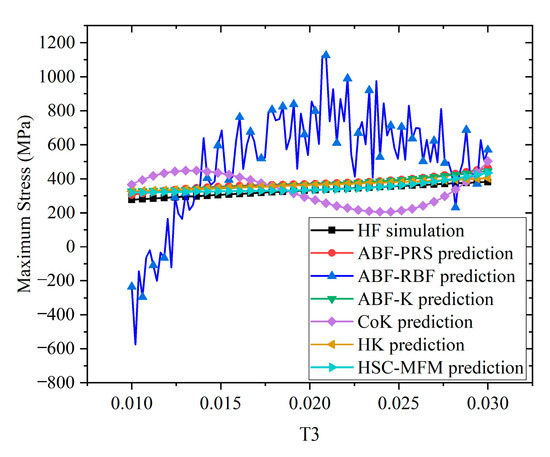
Figure 11.
Prediction comparison of different methods with varying T3.
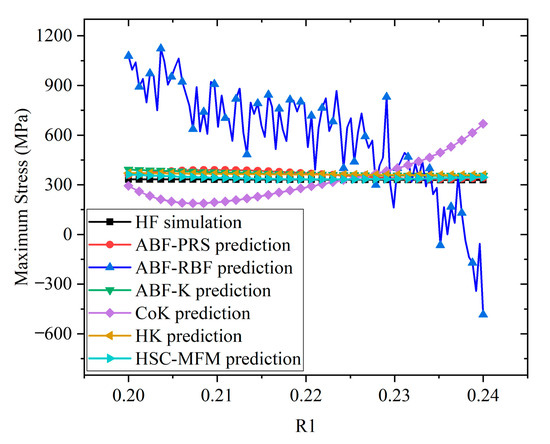
Figure 12.
Prediction comparison of different methods with varying R1.
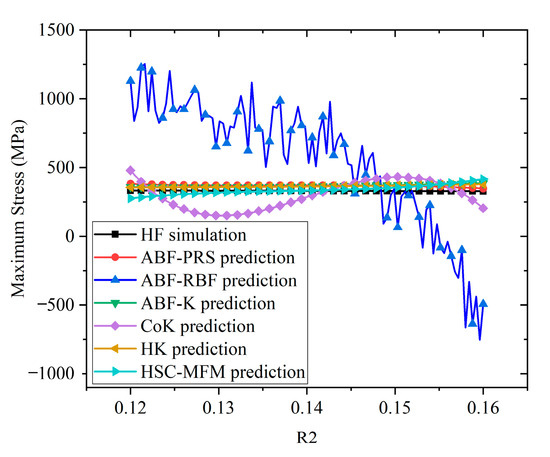
Figure 13.
Prediction comparison of different methods with varying R2.
Figure 9 indicates that the maximum stress gradually decreases with the increase of T1, while Figure 10 shows that the maximum stress initially decreases and then increases with the increase of T2. In addition, Figure 11 reveals that the maximum stress increases with the increase of T3. However, Figure 12 and Figure 13 show that the maximum stress changes little with the increase of R1 and R2, which means that the radii of the main and sub-cabin mounting holes have a very small impact on the strength of the structure.
From the perspective of model prediction accuracy, it can be seen that the ABF-RBF model exhibits the lowest prediction accuracy across all dimensions, failing to capture the changing trends of the actual model. Although the CoK model outperforms ABF-RBF on this problem, it still shows significant discrepancies in both trend and value compared to the real model. In contrast, the other four models, including the ABF-PRS, ABF-K, HK, models and the proposed HSC-MFM approach, can provide a better prediction and are closely aligned with the HF simulation values.
6. Conclusions
To improve the stability of the correction-based multi-fidelity surrogate modeling method, this work proposes a hybrid-surrogate-calibration-assisted multi-fidelity modeling approach. Three typical surrogate models, including the polynomial response surface model, Kriging model, and radial basis function model, were integrated to effectively capture the characteristics of the discrepancies between different fidelity models. An adaptive weight calculation method was developed to improve modeling accuracy. The proposed HSC-MFM method was tested against eighteen benchmark problems, and the results were compared with five existing MFSM methods. The testing results indicate that HSC-MFM provides more stable predictions than most existing methods while maintaining high prediction accuracy. Furthermore, the HSC-MFM method was applied to predict the strength of the frame for a blended-wing-body underwater glider, thereby demonstrating its engineering applicability. The main contributions of this work can be summarized as follows: (1) a novel multi-fidelity surrogate modeling approach is proposed through hybrid-surrogate calibration; (2) an adaptive weight coefficient calculation method is defined and validated; (3) the prediction stability of the proposed HSC-MFM approach is verified through benchmark test problems; and (4) the engineering applicability of HSC-MFM is verified through a frame strength prediction problem for BWBUGs.
There are also some deficiencies in this work. For example, the proposed HSC-MFM method is only an offline data-driven modeling method, and active learning or sequential updating strategies are not discussed in this work, but will be explored in our future work.
Author Contributions
Conceptualization, C.L.; Data Curation, Y.C.; Formal Analysis, D.L.; Funding Acquisition, C.L. and X.A.; Investigation, D.L.; Methodology, C.L.; Project Administration, C.L. and X.A.; Resources, D.L.; Software, X.A.; Supervision, C.L. and X.A.; Validation, Y.C. and J.L.; Visualization, Y.C.; Writing—Original Draft, Y.C.; Writing—Review and Editing, X.A. All authors have read and agreed to the published version of the manuscript.
Funding
This research was financially supported by the National Natural Science Foundation of China (Grant No. 52205249) and the Natural Science Basic Research Program of Shaanxi Province (Grant No. 2024JC-YBQN-0385, Grant No. 2022JQ-434).
Institutional Review Board Statement
Not applicable.
Informed Consent Statement
Not applicable.
Data Availability Statement
The data are available from the corresponding author on reasonable request.
Acknowledgments
The authors would like to thank Chongbo Fu for his assistance in the implementation of frame strength prediction. The authors also would like to thank the valuable comments from the reviewers for guiding the improvement of this work.
Conflicts of Interest
The authors declare no conflicts of interest related to this publication.
Abbreviations
The following abbreviations are used in this manuscript:
| LF | Low-fidelity |
| HF | High-fidelity |
| MF | Multi-fidelity |
| SM | Surrogate model |
| LFM | Low-fidelity model |
| HFM | High-fidelity model |
| MFSM | Multi-fidelity surrogate model |
| RSM | Response surface model |
| CoK | Cooperative Kriging |
| KM | Kriging model |
| RBF | Radial basis function |
| HSC-MFM | Hybrid-surrogate-calibration-assisted multi-fidelity modeling |
| HK | Hierarchical Kriging |
| Co-RBF | Cooperative radial basis function model |
| LOOCV | Leave-one-out cross-validation |
| ABF | Additive bridge function |
| ABF-PRS | Polynomial response surface-based additive bridge function |
| ABF-K | Kriging-based additive bridge function |
| ABF-RBF | Radial basis function-based additive bridge function |
| OLHS | Optimal Latin Hypercube sampling |
| BWBUG | Blended-wing-body underwater glider |
| FEA | Finite element analysis |
Appendix A
The following are expressions of the employed mathematical test problems:
F1: One-dimensional function (OD-1)
F2: One-dimensional function (OD-2)
F3: Branin function (BR)
F4: Six-hump camel-back function (SC)
F5: Booth function (BT)
F6: Bohachevsky function (BOH)
F7: Himmelblau function (HM)
F8: Rastrigin’s function (RTS)
F9: Sinusoidal function (SIN)
F10: Currin problem (CR)
F11: 3D Rosenbrock function (3DR)
F12: Dixon and Price function (DP)
F13: Shekel function (SK)
F14: Styblinski–Tang problem (ST)
F15: Hessen function (HSN)
F16: Borehole model (BH)
F17: Levy problem (LV)
F18: Ackley problem (AK)
References
- Zheng, H.; Wang, Z.; Zhang, W.; Yu, H.; Wu, C. Surrogate-based pneumatic and aerodynamic allocation design optimization for flapping-wing micro air vehicles. Aerosp. Sci. Technol. 2024, 148, 109108. [Google Scholar] [CrossRef]
- Xiaozhe, X.; Guangli, L.; Kaikai, Z.; Yao, X.; Siyuan, C.; Kai, C. Surrogate-based shape optimization and sensitivity analysis on the aerodynamic performance of HCW configuration. Aerosp. Sci. Technol. 2025, 152, 109347. [Google Scholar] [CrossRef]
- Han, Z.H.; Görtz, S. Hierarchical kriging model for variable-fidelity surrogate modeling. Aiaa J. 2012, 50, 1885–1896. [Google Scholar] [CrossRef]
- Zheng, J.; Shao, X.; Gao, L.; Jiang, P.; Qiu, H. Difference mapping method using least square support vector regression for variable-fidelity metamodelling. Eng. Optim. 2015, 47, 719–736. [Google Scholar] [CrossRef]
- Jiang, P.; Xie, T.; Zhou, Q.; Shao, X.; Cao, L. A space mapping method based on gaussian process model for variable fidelity metamodeling. Simul. Model. Pract. Theory 2018, 81, 64–84. [Google Scholar] [CrossRef]
- Li, X.; Gao, W.; Gu, L.; Gong, C.; Jing, Z.; Su, H. A cooperative radial basis function method for variable-fidelity surrogate modeling. Struct. Multidiscip. Optim. 2017, 56, 1077–1092. [Google Scholar] [CrossRef]
- Bertram, A.; Zimmermann, R. Theoretical investigations of the new Cokriging method for variable-fidelity surrogate modeling: Well-posedness and maximum likelihood training. Adv. Comput. Math. 2018, 44, 1693–1716. [Google Scholar] [CrossRef]
- Balabanov, V.; Grossman, B.; Watson, L.; Mason, W.; Haftka, R. Multifidelity response surface model for HSCT wing bending material weight. In Proceedings of the 7th AIAA/USAF/NASA/ISSMO Symposium on Multidisciplinary Analysis and Optimization, St. Louis, MO, USA, 2–4 September 1998. [Google Scholar] [CrossRef]
- Alexandrov, N.M.; Lewis, R.M.; Gumbert, C.R.; Green, L.L.; Newman, P.A. Approximation and model management in aerodynamic optimization with variable fidelity models. J. Aircr. 2001, 38, 1093–1101. [Google Scholar] [CrossRef]
- Alexandrov, N.M.; Lewis, R.M.; Gumbert, C.R.; Green, L.L.; Newman, P.A. Optimization with variable-fidelity models applied to wing design. In Proceedings of the 38th Aerospace Sciences Meeting and Exhibit, 2000, Reno, NV, USA, 10–13 January 2000. [Google Scholar] [CrossRef]
- Eldred, M.; Giunta, A.; Collis, S. Second-order corrections for surrogate-based optimization with model hierarchies. In Proceedings of the 10th AIAA/ISSMO Multidisciplinary Analysis and Optimization Conference, Albany, NY, USA, 30 August–1 September 2004; American Institute of Aeronautics and Astronautics Inc.: Albany, NY, USA, 2004; pp. 1754–1768. [Google Scholar]
- Gano, S.; Renaud, J.; Sanders, B. Hybrid variable fidelity optimization by using a Kriging-based scaling function. AIAA J. 2005, 43, 2422–2430. [Google Scholar] [CrossRef]
- Sun, G.; Li, G.; Zhou, S.; Xu, W.; Yang, X.; Li, Q. Multifidelity optimization for sheet metal forming process. Struct. Multidiscip. Optim. 2011, 44, 111–124. [Google Scholar] [CrossRef]
- Han, Z.H.; Görtz, S.; Zimmermann, R. Improving variable-fidelity surrogate modeling via gradient-enhanced Kriging and a generalized hybrid bridge function. Aerosp. Sci. Technol. 2013, 25, 177–189. [Google Scholar] [CrossRef]
- Zheng, J.; Shao, X.; Gao, L.; Jiang, P.; Li, Z. A hybrid variable-fidelity global approximation modelling method combining tuned radial basis function base and kriging correction. J. Eng. Des. 2013, 24, 604–622. [Google Scholar] [CrossRef]
- Tyan, M.; Nguyen, N.V.; Lee, J.W. Improving variable-fidelity modelling by exploring global design space and radial basis function networks for aerofoil design. Eng. Optim. 2015, 47, 885–908. [Google Scholar] [CrossRef]
- Wang, P.; Li, Y.; Li, C. An Optimization Framework Based on Kriging Method with Additive Bridge Function for Variable-Fidelity Problem. In Proceedings of the 14th International Symposium on Distributed Computing and Applications for Business Engineering and Science (DCABES), Guiyang, China, 18–24 August 2015. [Google Scholar]
- Palar, P.S.; Tsuchiya, T.; Parks, G.T. Multi-fidelity non-intrusive polynomial chaos based on regression. Comput. Methods Appl. Mech. Eng. 2016, 305, 579–606. [Google Scholar] [CrossRef]
- Zheng, J. An output mapping variable fidelity metamodeling approach based on nested latin hypercube design for complex engineering design optimization. Appl. Intell. 2018, 48, 3591–3611. [Google Scholar] [CrossRef]
- Kou, J.; Zhang, W. Multi-fidelity modeling framework for nonlinear unsteady aerodynamics of airfoils. Appl. Math. Model. 2019, 76, 832–855. [Google Scholar] [CrossRef]
- Zhang, S.; Liang, P.; Pang, Y.; Li, J.; Song, X. Multi-fidelity surrogate model ensemble based on feasible intervals. Struct. Multidiscip. Optim. 2022, 65, 212. [Google Scholar] [CrossRef]
- Hai, C.; Qian, W.; Wang, W.; Mei, L. Active learning-assisted multi-fidelity surrogate modeling based on geometric transformation. Comput. Methods Appl. Mech. Eng. 2024, 426, 116990. [Google Scholar] [CrossRef]
- Kennedy, M.; O’Hagan, A. Predicting the output from a complex computer code when fast approximations are available. Biometrika 2000, 87, 1–13. [Google Scholar] [CrossRef]
- Forrester, A.I.J.; Sóbester, A.; Keane, A.J. Multi-fidelity optimization via surrogate modelling. Proc. R. Soc. A Math. Phys. Eng. Sci. 2007, 463, 3251–3269. [Google Scholar] [CrossRef]
- Ulaganathan, S.; Deschrijver, D.; Pakparvar, M.; Couckuyt, I.; Liu, W.; Plets, D.; Joseph, W.; Dhaene, T.; Martens, L.; Moerman, I. Building accurate radio environment maps from multi-fidelity spectrum sensing data. Wirel. Netw. 2016, 22, 2551–2562. [Google Scholar] [CrossRef]
- Xiao, M.; Zhang, G.; Breitkopf, P.; Villon, P.; Zhang, W. Extended Co-Kriging interpolation method based on multi-fidelity data. Appl. Math. Comput. 2018, 323, 120–131. [Google Scholar] [CrossRef]
- Dong, H.; Song, B.; Wang, P.; Huang, S. Multi-fidelity information fusion based on prediction of kriging. Struct. Multidiscip. Optim. 2015, 51, 1267–1280. [Google Scholar] [CrossRef]
- Zhou, Q.; Wang, Y.; Choi, S.K.; Jiang, P.; Shao, X.; Hu, J. A sequential multi-fidelity metamodeling approach for data regression. Knowl.-Based Syst. 2017, 134, 199–212. [Google Scholar] [CrossRef]
- Liu, H.; Ong, Y.S.; Cai, J.; Wang, Y. Cope with diverse data structures in multi-fidelity modeling: A gaussian process method. Eng. Appl. Artif. Intell. 2018, 67, 211–225. [Google Scholar] [CrossRef]
- Hu, J.; Peng, Y.; Lin, Q.; Liu, H.; Zhou, Q. An ensemble weighted average conservative multi-fidelity surrogate modeling method for engineering optimization. Eng. Comput. 2020, 38, 2221–2244. [Google Scholar] [CrossRef]
- Xu, Y.; Song, X.; Zhang, C. Hierarchical regression framework for multi-fidelity modeling. Knowl.-Based Syst. 2021, 212, 106587. [Google Scholar] [CrossRef]
- Li, K.; Li, Q.; Lv, L.; Song, X.; Ma, Y.; Lee, I. A nonlinearity integrated bi-fidelity surrogate model based on nonlinear mapping. Struct. Multidiscip. Optim. 2023, 66, 196. [Google Scholar] [CrossRef]
- Tang, L.; Liu, F.; Wu, A.; Li, Y.; Jiang, W.; Wang, Q.; Huang, J. A combined modeling method for complex multi-fidelity data fusion. Mach. Learn. Sci. Technol. 2024, 5, 035071. [Google Scholar] [CrossRef]
- He, Y.; Luo, J. Efficient hierarchical kriging modeling method for high-dimension multi-fidelity problems. Chin. J. Mech. Eng. 2024, 37, 151. [Google Scholar] [CrossRef]
- Wang, Y.; Pang, Y.; Xue, T.; Zhang, S.; Song, X. Ensemble learning based hierarchical surrogate model for multi-fidelity information fusion. Adv. Eng. Inform. 2024, 60, 102535. [Google Scholar] [CrossRef]
- Forrester, A.J.; Keane, A. Recent advances in surrogate-based optimization. Prog. Aerosp. Sci. 2009, 45, 50–79. [Google Scholar] [CrossRef]
- Fan, C.; Huang, Y.; Wang, Q. Sparsity-promoting polynomial response surface: A new surrogate model for response prediction. Adv. Eng. Softw. 2014, 77, 48–65. [Google Scholar] [CrossRef]
- Krige, D.G. A statistical approach to some basic mine valuation problems on the Witwatersrand. OR 1951, 4, 18. [Google Scholar]
- Sacks, J.; Welch, W.J.; Mitchell, T.J.; Wynn, H.P. Design and analysis of computer experiments. Stat. Sci. 1989, 4, 409–423. [Google Scholar] [CrossRef]
- Yi, J.; Li, X.; Xiao, M.; Xu, J.; Zhang, L. Construction of nested maximin designs based on successive local enumeration and modified novel global harmony search algorithm. Eng. Optim. 2017, 49, 161–180. [Google Scholar] [CrossRef]
- Durantin, C.; Rouxel, J.; Désidéri, J.A.; Glière, A. Multifidelity surrogate modeling based on radial basis functions. Struct. Multidiscip. Optim. 2017, 56, 1061–1075. [Google Scholar] [CrossRef]
- Zhou, Q.; Shao, X.; Jiang, P.; Zhou, H.; Shu, L. An adaptive global variable fidelity metamodeling strategy using a support vector regression based scaling function. Simul. Model. Pract. Theory 2015, 59, 18–35. [Google Scholar] [CrossRef]
- Liu, B.; Koziel, S.; Zhang, Q. A multi-fidelity surrogate-model-assisted evolutionary algorithm for computationally expensive optimization problems. J. Comput. Sci. 2016, 12, 28–37. [Google Scholar] [CrossRef]
- Lophaven, S.N. DACE—A MATLAB Kriging Toolbox—Version 2.0 2002. Available online: https://github.com/psbiomech/dace-toolbox-source (accessed on 13 April 2020).
- Mueller, J. Matsumoto: The matlab surrogate model toolbox for computationally expensive black-box global optimization problems. arXiv 2014, arXiv:1404.4261. Available online: https://github.com/Piiloblondie/MATSuMoTo (accessed on 25 December 2018).
- Jekabsons, G. Radial Basis Function Interpolation for Matlab. 2009. Available online: http://www.cs.rtu.lv/jekabsons/ (accessed on 17 March 2022).
- Kitson, R.C.; Cesnik, C.E.S. High speed vehicle fluid-structure-jet interaction analysis and modeling. In Proceedings of the 58th AIAA/ASCE/AHS/ASC Structures, Structural Dynamics, and Materials Conference, AIAA 2017-0405, Grapevine, TX, USA, 9–13 January 2017; AIAA Structural Dynamics Best Student Paper. Available online: https://github.com/rckitson/cokriging (accessed on 24 January 2019).
- Li, C.; Wang, P.; Qiu, Z.; Dong, H. A double-stage surrogate-based shape optimization strategy for blended-wing-body underwater gliders. China Ocean. Eng. 2020, 34, 400–410. [Google Scholar] [CrossRef]
Disclaimer/Publisher’s Note: The statements, opinions and data contained in all publications are solely those of the individual author(s) and contributor(s) and not of MDPI and/or the editor(s). MDPI and/or the editor(s) disclaim responsibility for any injury to people or property resulting from any ideas, methods, instructions or products referred to in the content. |
© 2025 by the authors. Licensee MDPI, Basel, Switzerland. This article is an open access article distributed under the terms and conditions of the Creative Commons Attribution (CC BY) license (https://creativecommons.org/licenses/by/4.0/).