Abstract
Sea anchors are crucial for stabilizing fishing vessels and improving operations, specifically for jigging vessels. Their effective performance depends on design and material choice, with the canopy material playing a key role. We compared the drainage and drying rates of sea anchor canopies made from polyamide (PA) fabric, polyester (PES) fabric, and canopies designed with alternating strips of PA and PES (PA-PES) fabric to improve sea anchor performance, work efficiency, safety, and the stability of fishing operations. PA fabric had a fast initial draining rate due to high seawater absorption but a slow drying rate, resulting in a heavy canopy. PES fabric showed optimal draining due to low seawater absorption and fast drying. PA-PES fabric showed intermediate performance. Statistical analyses revealed that Sample B performed significantly better than PA fabric and PA-PES fabric, which showed no significant differences in performance. The low absorption and fast drying properties of PES fabric enhance the handling and efficiency of sea anchors, reducing worker fatigue and improving safety. These characteristics make it an exceptional alternative to PA fabric for sea anchor canopies. Future studies should examine the roles of sea anchor canopy material and structure in fishing operation safety and efficiency.
1. Introduction
Sea anchors, typically installed at the bow, serve various functions. They help stabilize the vessel during harsh weather conditions, provide fluid dynamic drag to mitigate the effects of strong winds and tidal currents and prevent the vessel from being turned broadside and capsized by large waves [1]. Moreover, their performance is critical during fishing operations as they stabilize the vessel’s position and minimize the effects of the external environment. By regulating drift velocity, sea anchors can also ensure drift stability while improving the efficiency and safety of fishing operations [1,2].
Specifically, jigging fishing vessels play a crucial role in the fishing industry by employing a method that selectively targets species without bycatch [3,4]. This technique is highly valued for minimizing physical damage to the target species, thereby improving their commercial value. As of 2022, jigging fishing vessels accounted for 17% (404 out of 2372) of registered offshore fishing vessels and 14.4% (28 out of 194) of registered deep-sea fishing vessels in South Korea [5]. Among the country’s coastal and offshore fishing vessels, squid or hairtail jigging fishing vessels are the main types that use sea anchors for fishing operations, particularly at nighttime [1]. During jigging operations, the sea anchor and spanker help in maintaining the vessel’s position, allowing it to drift according to the influence of the wind, sea currents, tidal currents, and other external forces, unlike other techniques [1,6]. In addition, some Korean fishing boats and carrier vessels also use sea anchors during their operations [2].
The canopies of sea anchors are the structures most affected by underwater drag [2] and are necessary for maintaining jigging lines in a near-vertical position [7], directly impacting catch. Failure to control the angle of the jigging line properly can result in the hook not being positioned correctly under the hull’s shadow, leading to reduced catch and potential issues such as tangling the jigging lines, thereby affecting catch efficiency. In summary, sea anchors improve catch efficiency in fishing operations by stabilizing vessel position and drift, ensuring operational continuity, optimizing the catch of the target species, and promoting work safety.
Previous studies on sea anchors for fishing have focused on structural design and methods of use [8,9,10,11]; however, recent studies have delved deeper into the opening characteristics of sea anchors depending on water resistance [12,13,14]. Recent research has explored several critical aspects, including the standardization of sea anchors [15], the impact of vent size and sinker weight on opening characteristics [16], the estimation of drift in jigging fishing vessels due to external forces [6], the standardization of sea anchor canopy material performance [2], and the assessment of sea anchor opening performance through numerical simulations and water tank experiments [17].
However, the performance of sea anchors for fishing primarily depends on the design and choice of material, with the canopy material being a key determining component. It significantly affects several physical properties, including underwater drag, stability, durability, and the seawater drying rate after a fishing operation [2,12,14]. While previous studies have primarily focused on structural design, there has been less attention paid to the drainage rate and drying performance of sea anchor canopy fabrics, which affect the vessel and work stability [2], sea anchor casting and hauling efficiency, and crew’s work-related fatigue. Thus, to improve the work environment and ensure work continuity, it is essential to optimize the physical properties of the canopy material.
Traditionally, except for a few essential metal components, sea anchor canopies have been made entirely of strong, water-resistant polyamide (PA) fabric [17]. However, polyester (PES) has recently gained attention due to its outstanding durability, dimensional stability, rapid drying rate, and affordability. PES is widely used in various fields owing to its favorable performance relative to price [18]. It has also been identified as a promising alternative for parachute and Paraglider fabric [19]. These findings provide important insights into material selection and design optimization for sea anchors. The key factors for sea anchor performance are high fluid resistance, excellent durability, lightweight design, and low water absorption [20]. In addition, additional factors such as efficient drainage, stability during use, low underwater sway, and ease of handling during hauling of the sea anchor and transportation should be considered for optimal performance.
In this study, we assessed the properties of PA, which is currently the standard material for sea anchor canopies in the fishing industry. We also evaluated the effectiveness and practicality of PES as an alternative to PA. Moreover, we proposed a method to directly compare and evaluate real sea anchors made from different materials for fishing, providing relevant data to improve usability in the industry. Our findings highlight the potential of PES to enhance sea anchor performance, work efficiency, and overall safety in fishing operations.
2. Materials and Methods
2.1. Manufacturing Sea Anchor Canopies
To evaluate performance in a marine environment, we selected the smallest sea anchor canopy size commonly used on small 2–5 ton (G/T) fishing vessels (Table 1). Each of the 24 panels constituting the sea anchor canopies was designed with uniform size and structure and was joined by stitching with a thick PA band (Figure 1). All other finishing and stitching procedures were performed using typical commercial fishing vessels. The same fabric-cutting methods were used for existing canopies. To ensure the consistency of the experiment, all other components were kept constant in terms of size and methods, except for the material of the sea anchor canopy.

Table 1.
Specification of the canopy cloth.
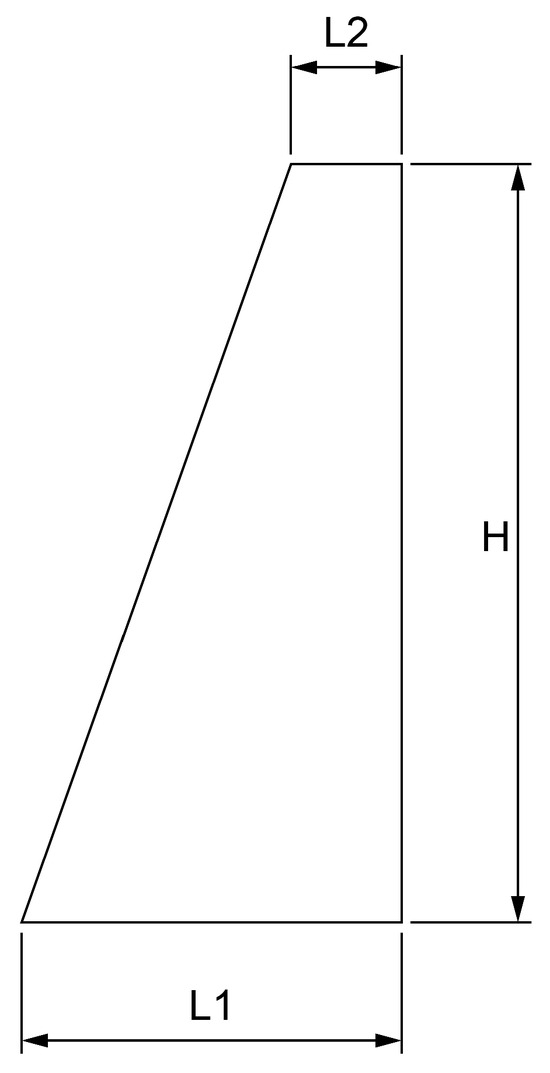
Figure 1.
Schematic of the canopy cloth (one strip). H: Height, L1: Length of Bottom side, and L2: Length of the vent side.
Three sea anchor canopies of varied materials were manufactured to evaluate the potential to enhance or replace PA material (Figure 2 and Figure 3). Sample A was designed to reflect commercial products using PA fabric. In contrast, Samples B and C were experimental models constructed to be the same size as real sea anchor canopies. Sample B was made of PES fabric, and Sample C had an alternating combination of PA and PES fabric in each strip.

Figure 2.
Schematic of fabric arrangement in the samples: (a) Sample A, (b) Sample B, and (c) Sample C.
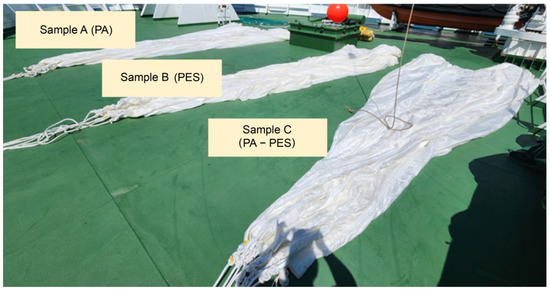
Figure 3.
Three types of samples prepared for the experiment: Sample A (PA), Sample B (PES), and Sample C (PA-PES).
The properties and composition of the PA and PES fabrics used in constructing sea anchor canopies for Samples A, B, and C are summarized, including the type of yarn, weave type, fineness (Tex), thread density (PPM), mass per unit area (g/m²), and thickness (mm) (Table 2). Both fabrics were woven in a plain weave structure. The polyamide fabric is composed of Nylon 6 in the warp direction and Nylon 6.6 in the weft direction, both with a fineness of 50 Tex. The polyester fabric consists of PET in both warp and weft directions, with a fineness of 34 Tex. PA fabric is characterized by its high strength and durability, as well as its excellent moisture absorption, which allows it to retain significant amounts of water. However, it has drawbacks, including relatively high production costs and vulnerability to UV radiation. In contrast, PES fabric demonstrates low moisture absorption, enabling it to dry quickly, and offers excellent wrinkle resistance, durability, and resilience. Additionally, PES is more cost-effective but has the disadvantage of lower elasticity.

Table 2.
Properties and composition of PA and PES fabrics used in sea anchor canopy.
The PA fabric (Nylon 6, 50 Tex/Nylon 6.6, 50 Tex) and PES fabric (PET, 34 Tex/PET, 34 Tex) (Yuil SA, Busan, Republic of Korea) used in this study showed that, under standard conditions, PA fabric outperforms PES fabric in terms of tensile strength. However, under wet conditions, the tensile strength of both materials is comparable. This characteristic was a key factor in material selection, considering the underwater application of sea anchors, where the tensile strength in wet conditions was prioritized.
2.2. Experimental Methods
To simulate oceanic conditions, the experiment was conducted at the bow of Baek Kyung, a training ship owned by Pukyong National University, docked at the Landfill Pier at Yongho Bay, Busan. Table 3 shows the main pieces of equipment used in the experiment and their specifications.

Table 3.
Types and specifications of measuring equipment.
To evaluate the seawater drainage and drying efficiency of different sea anchor canopy samples after seawater submersion, we measured changes in their weight at 1 min intervals using a data logger connected to a load cell, which recorded the changes in weight of the sea anchor canopies as they dried over time, and a digital weighing indicator (Figure 4; Table 3). This process was repeated twice on different dates, and the resulting data were compiled for analysis.
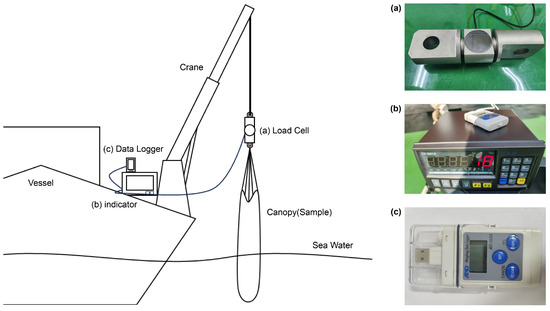
Figure 4.
Schematic of equipment setup: (a) load cell, (b) indicator, and (c) data logger.
First, we weighed each sample when it was dry. Subsequently, the samples were suspended from a crane and completely submerged in seawater for 10 min to facilitate maximum seawater absorption. After 10 min, the sea anchors were pulled above the water surface. The change in weight over time of the sea anchor canopies holding seawater was then measured using a load cell, as shown in Figure 5a. As the water drained rapidly during the first 25 min of the experiment, weight changes were recorded at 1 min intervals. This process was repeated twice on different dates, and the resulting data were aggregated.
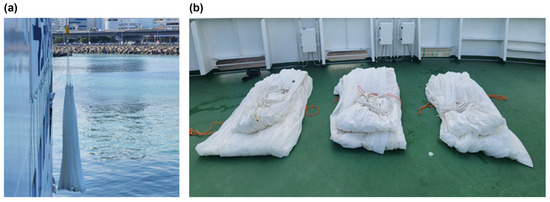
Figure 5.
Seawater drying process of the canopy cloth: (a) up to 25 min and (b) from 25 min to 120 min.
Subsequently, the samples were folded to investigate the drying of sea anchors in a condition like that on a fishing vessel, where they wound around a winch drum or placed on the deck (Figure 5b), and an additional drying experiment was performed. Weight changes were recorded after 1 and 2 h, and the same experiment was repeated twice. The drainage and drying rates of each material were then compared.
2.3. Weather Conditions
Table 4 shows the air temperature, water temperature, humidity, wind direction, and wind speed on each material’s specific drainage and drying experiment dates.

Table 4.
Experiment date and weather conditions.
2.4. Statistical Analyses
We conducted statistical analyses to test differences in the drainage and drying efficiencies of the three materials used in the sea anchor canopies, Samples A, B, and C. Thus, we defined the null hypothesis (H0) and the alternative hypothesis (H1). The null hypothesis (H0) suggests no drainage or drying performance discrepancies among the three materials. In contrast, the alternative hypothesis (H1) indicates differences in drainage or drying performance between the three materials. If H0 is rejected, H1 is statistically significant.
The Shapiro–Wilk test assessed whether the data followed a normal distribution [21]. This test examines whether the data satisfy the normality condition; a p-value > 0.05 follows a normal distribution. However, in this study, data for Samples A, B, and C showed p < 0.05, suggesting that the normality assumption had not been met. Therefore, we used non-parametric methods that do not require normally distributed data.
We used Levene’s test to verify the homogeneity of variance among the three materials [22]. This test is important to ensure that the data meet the assumption of homogeneity of variance before analyzing variance (ANOVA). A p-value of >0.05 indicates homogeneity of variance across the groups.
ANOVA was performed to test for differences in the means among the three groups [23]. It is suitable for assessing the statistical significance of the means between three or more groups and can be applied to data that demonstrate homogeneity of variance.
We used the Mann–Whitney U test for a detailed group comparison [24]. This non-parametric test evaluates significance based on rank differences between the two groups without assuming that the data are normally distributed. After calculating each group’s U and p values, we evaluated the first, second, and mean differences.
All statistical analyses were conducted using Python (Version 3.8) and the SciPy (Version 1.13.1) library. Pandas (Version 2.2.2) and Matplotlib (Version 3.8.4) libraries were used for data preparation and visualization. p-values < 0.05 were statistically significant.
Our methodology focused on deriving reliable results by analyzing differences between the three groups from multiple angles, thereby ensuring validity. This approach provides a theoretical basis for interpreting the results and helps improve analysis reproducibility.
3. Results
3.1. Weight Before and After Seawater Submersion
First, we measured the dry weight of the samples before seawater submersion; then, after submerging the samples for a given time in seawater and lifting them completely out of the water, we monitored the weight of the sea anchor canopies over time.
Table 5 shows the dry weights of Samples A, B, and C and their weights when they were first pulled out of the seawater after absorbing the maximum amount of water. The dry weights were 38.0 kg, 34.0 kg, and 36.0 kg, respectively. The mean maximum weights were 87.5 kg for Sample A, 73.0 kg for Sample B, and 81.0 kg for Sample C.

Table 5.
Dry weight and maximum weight, including seawater, for each sample.
Sample A absorbed 49.5 kg of seawater, the highest initial weight, indicating maximum absorption (Table 5). Samples B and C absorbed 39 kg and 45 kg, respectively.
3.2. Weight Change over Time
Figure 6 shows the weight change of each sample over time in terms of the mean observed values. Figure 6a shows the weight change within 25 min relative to the maximum weight after initial seawater absorption.

Figure 6.
Canopy weight variation over time for each sample: (a) weight change of each sample up to 25 min and (b) initial seawater included weight and change after 60 and 120 min.
After 1 min of drying, Sample A exhibited the fastest initial drainage rate, decreasing by 16 kg to 71.5 kg. At the same time, Samples B and C experienced an 11 kg weight decrease to 62 kg and a 13 kg decrease to 68.0 kg, respectively. After 5 min, Sample A maintained the fastest drainage rate with a decrease of 8.0 kg, while Samples B and C decreased to 3.5 kg and 5.5 kg, respectively. Sample A weighed 63.5 kg, Sample B weighed 58.5 kg, and Sample C weighed 62.5 kg. After 10 min, Sample A showed a slowing drying rate after the fast initial drainage. At the same time, Samples B and C dried at a relatively constant rate, with weight decreases of 2.5 kg, 2.0 kg, and 2.5 kg, respectively, compared to the weights after 5 min. After 25 min, Sample A showed a decrease of 1.5 kg, while Samples B and C showed a decrease of 3.5 kg and 2.5 kg, respectively (Figure 6a). After this time point, it can be observed that Sample B and Sample C dried faster than Sample A.
After 25 min, as shown in Figure 5b, the sea anchors were folded and placed on the deck. The weight change was then compared after 60 and 120 min, mimicking the situation where sea anchors are stored on the deck for casting on fishing vessels. Figure 6b shows the mean measurements obtained from the experiment.
After 60 min, Sample A showed a 40% decrease compared to its initial wet weight of 87.5 kg, while Samples B and C showed a 37.7% and 38.3% decrease, respectively, compared to their initial wet weights of 73.0 kg and 81.0 kg. At this time, Sample A retained more water than Samples B and C, which can be attributed to the high absorption and slow drying rate of the PA fabric in Sample A. Meanwhile, Sample B showed the fastest drying rate and weighed less than the other samples.
After 120 min, Sample A showed a 41.7% decrease compared to its initial wet weight, while Samples B and C showed a 43.2% and 42.0% decrease. At this point, Sample A remained the heaviest and showed a slowing drying rate. Sample B continued to dry consistently and remained the lightest, whereas Sample C showed intermediate properties between Samples A and B; this demonstrates that Sample A had the highest initial water content and a slow drying rate, Sample B had a rapid drying rate, and Sample C showed intermediate performance owing to the properties of the mixed fabrics.
During the first minute, the water content of Sample A decreased by 16.7 kg, followed by reductions of 8.0 kg up to 5 min, 2.5 kg up to 10 min, 1.5 kg up to 25 min, 7.0 kg up to 60 min, and 1.5 kg up to 120 min (Figure 7). Sample B lost 11.0 kg of weight in the first minute, followed by further losses of 3.5 kg up to 5 min, 2.0 kg up to 10 min, 3.5 kg up to 25 min, 8.0 kg up to 60 min, and 4.0 kg up to 120 min. Sample C lost 13.0 kg of seawater in the first minute, followed by further losses of 5.5 kg up to 5 min, 2.5 kg up to 10 min, 2.5 kg up to 25 min, 7.5 kg up to 60 min, and 3.0 kg up to 120 min (Figure 7). Overall, these results demonstrate that Sample A showed the fastest initial drainage properties. However, Sample B showed the fastest drying performance over time, particularly at 60 min, suggesting its potential utility for drainage and drying when the sea anchor is wound around a winch drum or stored on the deck, and Sample C showed intermediate performance, combining the properties of the two materials.
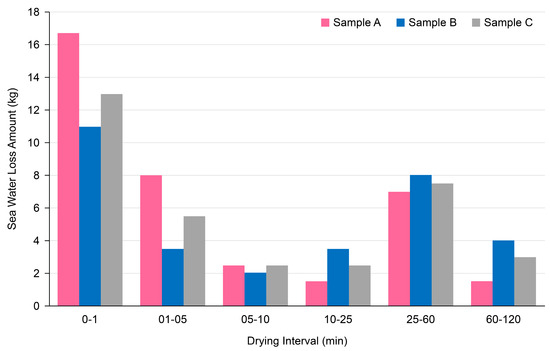
Figure 7.
Seawater reduction over time for each sample.
According to Method 8.25A in the Korean Industrial Standards KS K 0642, the drying time for PA fabric ranges from 90 to 100 min, with an average of 95.3 min, but is expected to be even longer in actual fishing operations [2]; this time duration required to drain water from the canopy fabric after hauling the sea anchor out of the seawater is crucial as it affects vessel stability and worker safety [2]. In this study, after drying the fabric for 120 min, Sample A (PA fabric) retained high water content; however, Sample B (PES fabric) showed a fast drying rate and low water absorption. Although PA and PES are both well known to be hydrophobic, PES absorbs less water because it is more hydrophobic than PA [25]; this explains why Sample B showed superior drying performance than other samples in our study.
3.3. Statistical Analysis
Levene’s test confirmed homogeneity of variance across experiments (Table 6), and ANOVA showed significant differences in mean drainage and drying performance among Samples A, B, and C (F = 7.708, p = 0.0008) (Table 7). The p-values were >0.05, demonstrating that the samples’ variance between experiments was statistically similar, satisfying the assumption of homogeneity of variance.

Table 6.
Levene’s test results for homogeneity of variance across experiments.

Table 7.
ANOVA results for group mean differences across experiments.
The Mann–Whitney test’s U-statistic showed a significant difference between Samples A and B and between Samples B and C in both experiments (Table 8). However, the U-statistic between Samples A and C was significant in the first experiment (p < 0.05) but not in the second experiment (p > 0.05), suggesting that the performance of Sample A is like that of Sample C under certain circumstances. Based on the Mann–Whitney U test results, Sample B, demonstrated the best performance, exhibiting significantly faster drainage and better drying than Samples A and C (p < 0.05). However, with prolonged drainage and drying times, Sample A demonstrated the least effective performance; this highlights that Sample B had the most efficient physical properties for drainage and drying performance, and it is expected to show the highest efficiency in actual marine environment settings.

Table 8.
Mann–Whitney U test results for pairwise comparisons across experiments.
Low water absorption by the canopy is a critical factor influencing the performance of sea anchors [20]. PA fabric with reduced absorption through waterproofing showed a better opening rate and performance than normal PA fabric [14]. In that context, PES fabric, which has lower water absorption than PA fabric, is anticipated to considerably enhance sea anchor opening performance and work efficiency compared to the currently utilized PA fabric.
In this study, we analyzed the drainage and drying characteristics of sea anchors made from PA, PES, and a combination of both. We assessed their influence on the efficiency of fishing operations, highlighting clear differences in drainage rate and drying performance among the sea anchor canopy materials (PA, PES, and a combination of both), which will directly impact work efficiency and worker safety. A rapidly drying sea anchor canopy reduces the weight of the sea anchor after absorbing seawater, making it lightweight; this could potentially prevent industrial accidents by reducing worker fatigue and improving worker safety, given that slip during fishing operations is the most common accident type for coastal and offshore fishing vessels in South Korea [26]. Its risks increase when lifting heavy objects [27]. Moreover, when mechanization of work is difficult, and there is a greater dependence on manpower, such as in small fishing vessels, these properties become even more relevant.
4. Conclusions
Our results emphasize the importance of material selection in enhancing the design and performance of sea anchors used in fishing operations; this demonstrates that PES fabric (PET, 34 Tex/PET, 34 Tex) outperformed the industry standard PA fabric (Nylon 6/50 Tex/Nylon 6.6, 50 Tex) and the combination. The PES fabric (Sample B) showed relatively low seawater absorption and had the fastest drying rate after the initial 10 min, showing excellent and efficient drainage and drying performance compared to PA fabric, which initially showed fast initial drainage but a slower drying rate and retained more weight. The intermediate performance of Sample C, made of a combination of PA and PES, showed significant differences in drainage and drying rates between the two materials. The exceptional qualities of PES fabric also aid in improving ease-of-handling and work efficiency for sea anchors, contributing to worker safety by reducing worker fatigue and decreasing the loads due to less added weight from absorbed seawater; this highlights the potential of PES fabric as a viable alternative to the current PA fabrics used in the fishing industry. Further research will focus on evaluating the effects of the individual physical properties of PA and PES fabrics on the performance of sea anchors. Additionally, it should examine the usability of PES fabric-based sea anchors in fishing operations, the adaptability of PES fabric in various marine conditions, and its durability after long-term use. Such studies would contribute to the advancement of a sustainable fishing industry, improved competitiveness in the aquatic equipment industry, and innovation in the design and performance of fishing equipment.
Author Contributions
Conceptualization, K.-J.R.; methodology, S.-H.K.; validation, S.-H.K. and Y.-W.L.; formal analysis, N.K.; investigation, N.K.; resources, Y.-W.L.; writing—original draft preparation, N.K.; writing—review and editing, K.-J.R.; supervision, K.-J.R.; project administration, K.-J.R. All authors have read and agreed to the published version of the manuscript.
Funding
This research was funded by a Research Grant from Pukyong National University (2024), grant number 202416300001. The funders had no role in the design of the study; in the collection, analysis, or interpretation of the data; in the writing of the manuscript; or in the decision to publish the results.
Data Availability Statement
The original contributions presented in this study are included in the article. Further inquiries can be directed to the corresponding author.
Conflicts of Interest
The authors declare no conflicts of interest.
References
- Chong, D.Y. A study on the legal status of vessels laying sea anchor—Focused on the judgments of KMST. Marit. Law Res. 2022, 34, 81–104. [Google Scholar] [CrossRef]
- Ryu, K.J.; Kim, N.; Lee, Y.W. A study on the performance test of canopy cloth on the fishery sea anchor. J. Korean Soc. Fish. Ocean. Technol. 2023, 59, 110–116. [Google Scholar] [CrossRef]
- Jiang, M.; Wang, J.; Li, G.; Liu, B.; Chen, X. Is seasonal closure an effective way to conserve oceanic squids—Taking Chinese autonomic seasonal closure on the high seas as an example. Fish. Res. 2024, 271, 106914. [Google Scholar] [CrossRef]
- Chen, X.; Chen, Y.; Tian, S.; Liu, B.; Qian, W. An assessment of the west winter–spring cohort of neon flying squid (Ommastrephes bartramii) in the northwest Pacific Ocean. Fish. Res. 2008, 92, 221–230. [Google Scholar] [CrossRef]
- Ministry of Oceans and Fisheries (MOF). Statistical Yearbook of Oceans and Fisheries; MOF: Sejong-si, Republic of Korea, 2023; pp. 1–554. [Google Scholar]
- Lee, C.H.; Kim, K.I.; Kim, J.S.; Yoo, S.L. Estimation of leeway of jigging fishing vessels by external factors. J. Korean Soc. Fish. Ocean Technol. 2022, 58, 299–309. [Google Scholar] [CrossRef]
- Rodhouse, P.G. C2. World squid resources. In Review of the State of World Marine Fishery Resources; Fisheries Technical Paper; FAO: Rome, Italy, 2005; Volume 457, pp. 175–187. [Google Scholar]
- Sato, M. On the Use of Sea Anchors (The 35th Lecture of the Japan Institute of Navigation). J. Naut. Soc. Jpn. 1967, 36, 153–158. [Google Scholar] [CrossRef][Green Version]
- Nomura, M.; Mori, K.; Tahara, Y.; Osaku, Y. Underwater drag of sea anchor. Bull. Tokai Reg. Fish. Res. Lab. 1967, 52, 49–74. [Google Scholar]
- Sasaki, Y.; Suzuki, H.; Yanagawa, S.; Koike, T. A study on the sea anchor of parachute type. J. Naut. Soc. Jpn. 1967, 37, 125–130. [Google Scholar] [CrossRef]
- Oikawa, K. Full scale test on the parachute type sea anchor. J. Naut. Soc. Jpn. 1970, 43, 51–57. [Google Scholar]
- Hyun, Y.K.; Kim, J.K.; Kwon, B.G.; An, H.C. The relationship between resistance and shape of sea anchor used in squid jigging boats. J. Korean Soc. Fish. Ocean. Technol. 1998, 34, 359–365. [Google Scholar]
- Ro, K.D.; Kwon, B.G.; An, H.C. Numerical analysis for flowfield of a circular arc type sea anchor by discrete vortex method. Trans. Korean Soc. Mech. Eng. B 1998, 22, 1041–1051. [Google Scholar]
- An, H.C. Development and Hydrodynamic Characteristics of Sea Anchor for Squid Jigging Vessel. Ph.D. Thesis, Pukyong National University, Busan, Republic of Korea, 2000; pp. 1–86. [Google Scholar]
- Kim, N.; Kim, H.S.; Lee, Y.W.; Ryu, K.J. A study on standardization through the analysis of the survey on the use of fishery sea anchor. J. Korean Soc. Fish. Ocean Technol. 2022, 58, 10–18. [Google Scholar] [CrossRef]
- Jung, J.M.; Kim, H.S. A study on the underwater stability according to the composition of the sea anchor. J. Korean Soc. Fish. Ocean Technol. 2022, 58, 289–298. [Google Scholar] [CrossRef]
- Li, K.; Wang, Z.; Ma, Y.; Wang, Y.; Li, H. Research on the inflation process of underwater parachute by numerical simulation and model test. Ocean Eng. 2024, 293, 116554. [Google Scholar] [CrossRef]
- Azeem, M.; Wiener, J.; Khan, M.Z. Hydrophobic analysis of nano-filament polyester fabric. Vlákná à Textil 2018, 25, 5. [Google Scholar]
- Militký, J.; Wiener, J.; Křemenáková, D.; Mishra, R. Properties of parachute fabrics from polyamide and polyester materials. Fibres Text. 2023, 30, 3–10. [Google Scholar] [CrossRef]
- National Fisheries Research and Development Institute (NFRDI). Improvement of Sea Anchor and Mechanization of Sea Anchor Operating System; NFRDI: Busan, Republic of Korea, 1997; pp. 1–208. [Google Scholar]
- Shapiro, S.S.; Wilk, M.B. An analysis of variance test for normality (complete samples). Biometrika 1965, 52, 591–611. [Google Scholar] [CrossRef]
- Carroll, R.J.; Schneider, H. A note on Levene’s tests for equality of variances. Stat. Probab. Lett. 1985, 3, 191–194. [Google Scholar] [CrossRef]
- Kaufmann, J.; Schering, A.G. Analysis of variance ANOVA. In Wiley Encyclopedia of Clinical Trials; D’Agostino, R.B., Sullivan, L., Massaro, J., Eds.; John Wiley & Sons: Chichester, UK, 2007. [Google Scholar] [CrossRef]
- McKnight, P.E.; Najab, J. Mann–Whitney U test. In The Corsini Encyclopedia of Psychology; Weiner, I.B., Craighead, W.E., Eds.; John Wiley & Sons: Chichester, UK, 2010; p. 1. [Google Scholar] [CrossRef]
- Zhang, W.; Li, J.X.; Tang, R.C.; Zhai, A.D. Hydrophilic and antibacterial surface functionalization of polyamide fabric by coating with polylysine biomolecule. Prog. Org. Coat. 2020, 142, 105571. [Google Scholar] [CrossRef]
- Kim, W.S.; Cho, Y.B.; Kim, S.J.; Ryu, K.J.; Lee, Y.W. A basic research on risk control measure for reducing the fishermen’s occupational accident in offshore and coastal fishing vessel. J. Korean Soc. Fish. Ocean Technol. 2014, 50, 614–622. [Google Scholar] [CrossRef]
- Liu, J.; Qu, X. Postural stability and risk of slips in lifting tasks: Effects of load weight and load knowledge. Int. J. Ind. Ergonom. 2025, 105, 103675. [Google Scholar] [CrossRef]
Disclaimer/Publisher’s Note: The statements, opinions and data contained in all publications are solely those of the individual author(s) and contributor(s) and not of MDPI and/or the editor(s). MDPI and/or the editor(s) disclaim responsibility for any injury to people or property resulting from any ideas, methods, instructions or products referred to in the content. |
© 2025 by the authors. Licensee MDPI, Basel, Switzerland. This article is an open access article distributed under the terms and conditions of the Creative Commons Attribution (CC BY) license (https://creativecommons.org/licenses/by/4.0/).