The Influence of Voltage Gradient Application History on Electro-Osmotic Reinforcement of Marine Soft Clay


Abstract
1. Introduction

| References | Type of Tests | Applied Voltage (V) or Voltage Gradient (V/cm) | Voltage Application Method | Method | Soil Improvement |
|---|---|---|---|---|---|
| Sun et al. [15] | On-site engineering application | Daytime: 20 V–40 V (increases by 5 V every 5 days); nighttime: 60 V–68 V (electrode conversion) | Multistage voltage | Vacuum preloading combined with electroosmosis | The stepped-up voltage during the day and electrode conversion during the night were helpful in maintaining the electric current in the soil during the day, and it did not decrease but instead slowly increased. |
| Burnotte et al. [16] | Field test | 0.33 → 0.23 → 0.50 V/cm | Multistage voltage | Electroosmosis | When temperatures at the anode reached values close to 100 °C, the resistivity of the system increased rapidly, resulting in a smaller effective voltage gradient in the soil and less efficient EO consolidation. |
| Chew et al. [21] | Field test | 5 V or 14 V | Single stage voltage | Electroosmosis | Shear strength improvement is clearly visible in the EO-treated clay, which is also indicated by the pore pressure response observed. |
| Rittirong et al. [11] | Field test | 7–10 V → 18–29 V | Multistage voltage | Stepped voltage electroosmosis | The average undrained shear strengths range from 22 kPa to 39 kPa after only five days of treatment. |
| Mahalleh et al. [22] | Laboratory model test | 0.5 V/cm or 1 V/cm or 2 V/cm or | Single stage voltage | Electroosmosis | Considering the voltage effect, it appears that soil strength increased with increasing voltage gradients, with the best improved result belonging to the voltage gradient of 2 V/cm. |
| Wen and Yan [23] | Laboratory model test | 6 V/cm or 4 V/cm or 2 V/cm | Single-stage voltage | Electroosmosis | A higher voltage gradient can improve electro-osmosis dewatering. |
| Xue et al. [24] | Laboratory model test | 6 V or 9 V or 12 V | Single-stage voltage | Electroosmosis combined with loading pressure | Although anode corrosion caused voltage loss, high voltage was still beneficial for reducing soil water content and increasing shear strength. |
| Shen et al. [17] | Laboratory model test | 1 V/cm or 1.5 V/cm or 1.75 V/cm or 2 V/cm or 2.25 V/cm | Single-stage voltage | Electroosmosis | An increased voltage gradient only improved the proportion of effective voltage in the early stage of the electro-osmotic process; in the long term, an overly high voltage gradient was not beneficial for increasing the ratio of effective voltage to output voltage. |
| Liu et al. [18] | Laboratory model test | 0.50 → 0.75 → 1.00 → 1.25 V/cm | Multistage voltage | Electroosmosis | A reasonable stepped voltage scheme can reduce power consumption and increase electroosmotic drainage volume and, later, electroosmotic efficiency. |
| Li et al. [19] | Laboratory model test | 10 V → 12.5 V → 15 V → 17.5 V (0.35 V/cm) | Multistage voltage | Vacuum preloading combined with electroosmosis | The appropriate stepped voltage method is better than the general combined methods, requires less power consumption, and causes less electrode corrosion. |
| Liu et al. [25] | Laboratory model test | 6.5 V → 8.0 V → 9.5 V | Multistage voltage | Stepped vacuum preloading combined with stepped voltage electroosmosis | Three vacuum preloading steps yielded better soil reinforcement effects. |
| Bian et al. [20] | Laboratory model test | 15 V → 22.5 V → 30 V | Multistage voltage | Vacuum preloading combined with stepped voltage electroosmosis | Stepped electroosmosis avoided the rapid increase in interface resistance between the electrode and the soil, and it maintained the current intensity and electroosmosis efficiency at a high level in the later stage of electroosmosis. |
| Huweg et al. [26] | Laboratory model test | 3 V/cm → 6 V/cm → 10 V/cm | Multistage voltage | Stepped voltage electroosmosis | The extracted water volumes were observed to increase with increased electric field intensity. |
2. Materials and Methods
2.1. Soft Clay
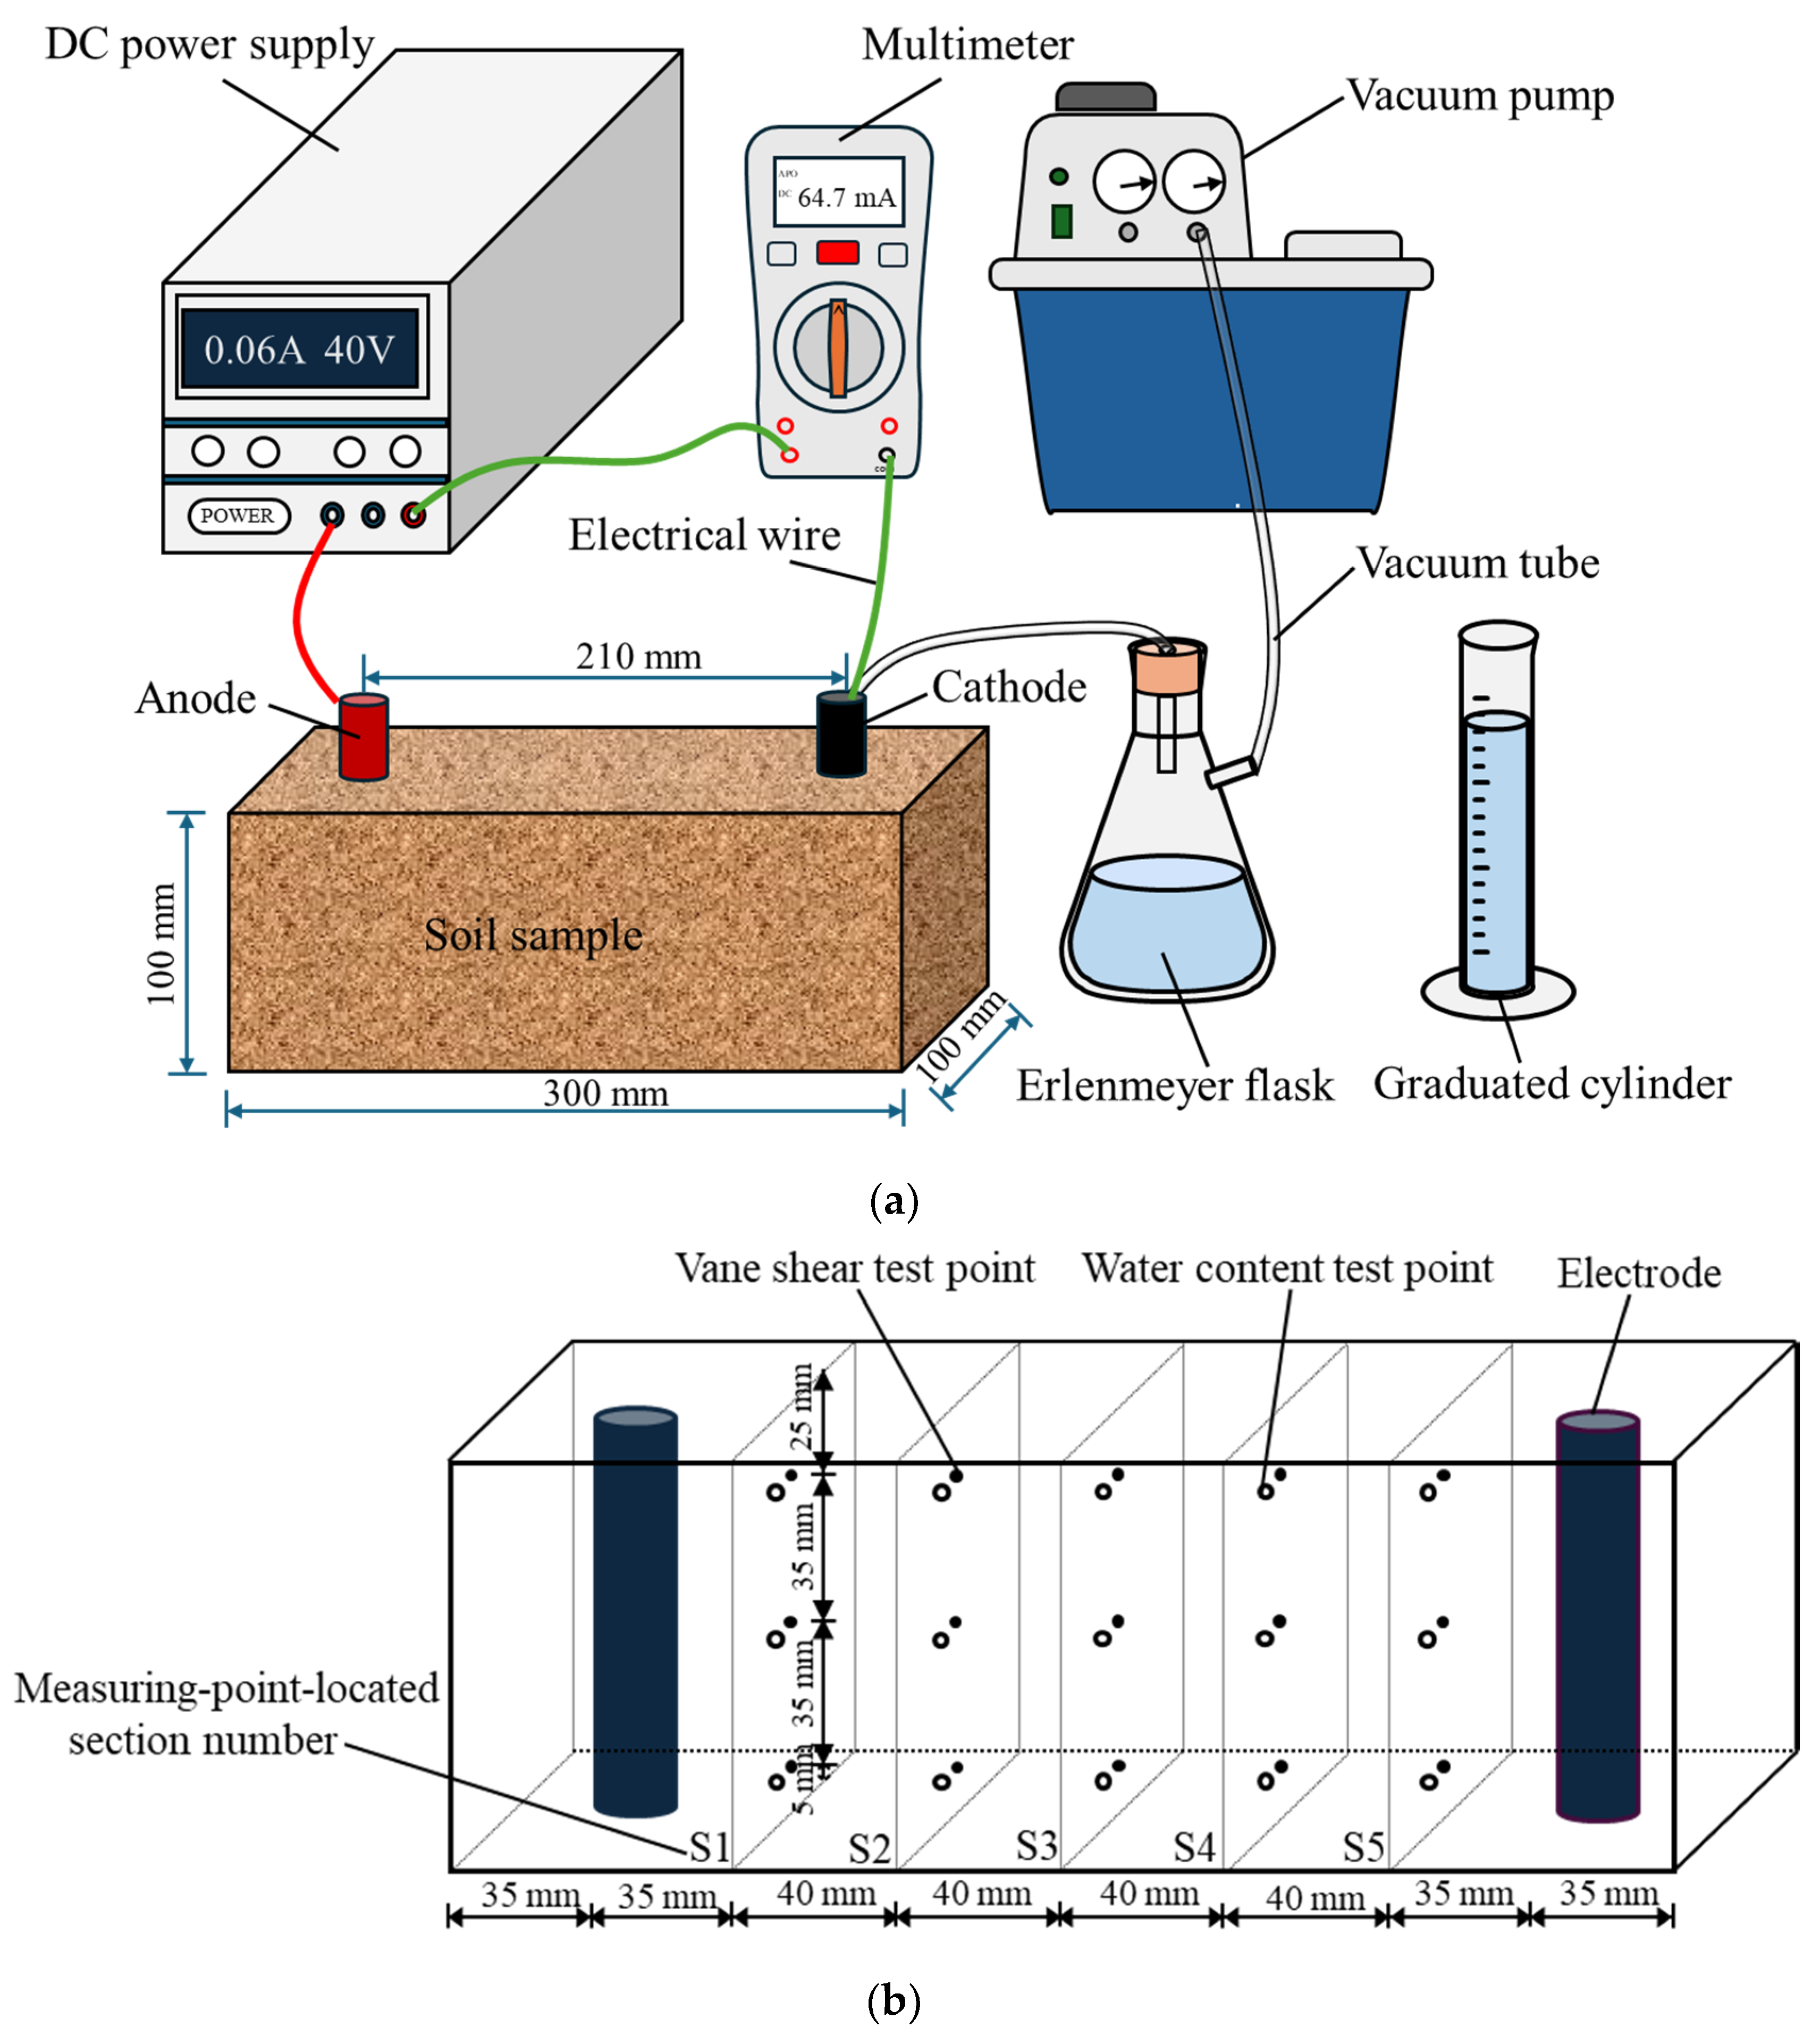
2.2. Electrokinetic Experiments Device
2.3. Experimental Scheme
3. Results and Discussion
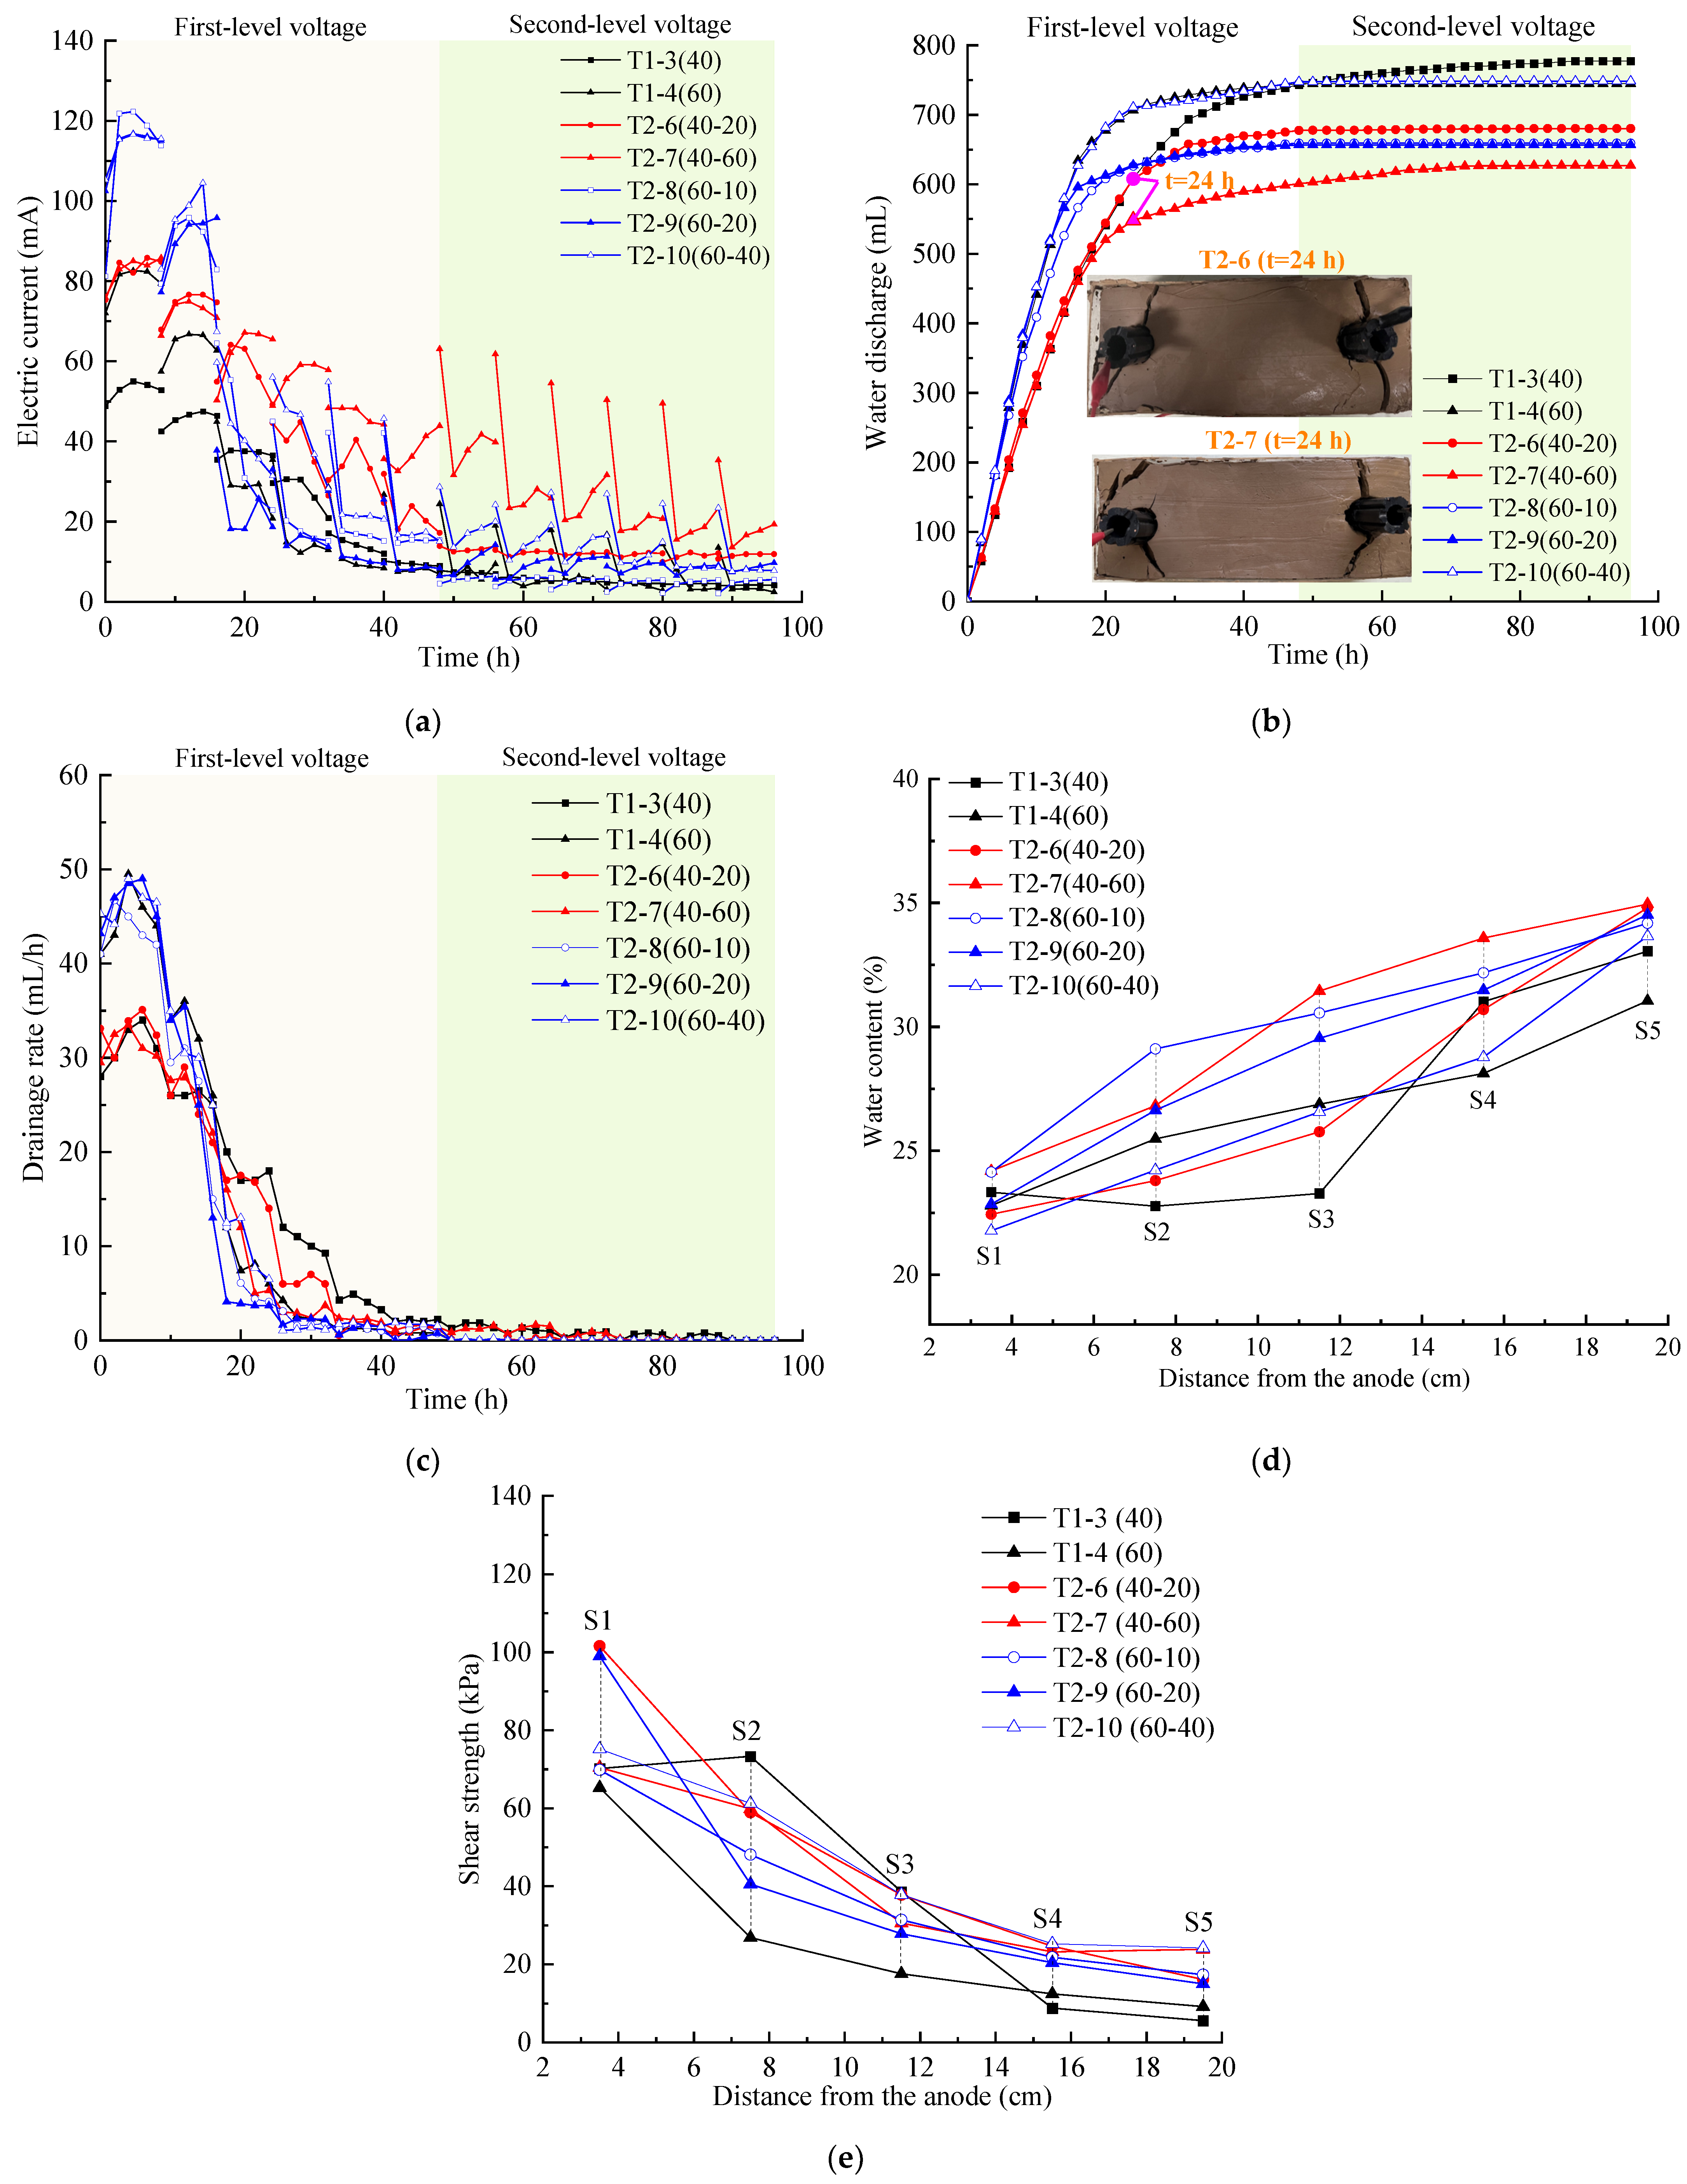
3.1. Influence of Historical High Electric Voltage Gradients on the Electroosmosis Reinforcement Effect at the Present Stage
- (a)
- Electric current
- (b)
- Water discharge and drainage rate
- (c)
- Water content and shear strength distribution
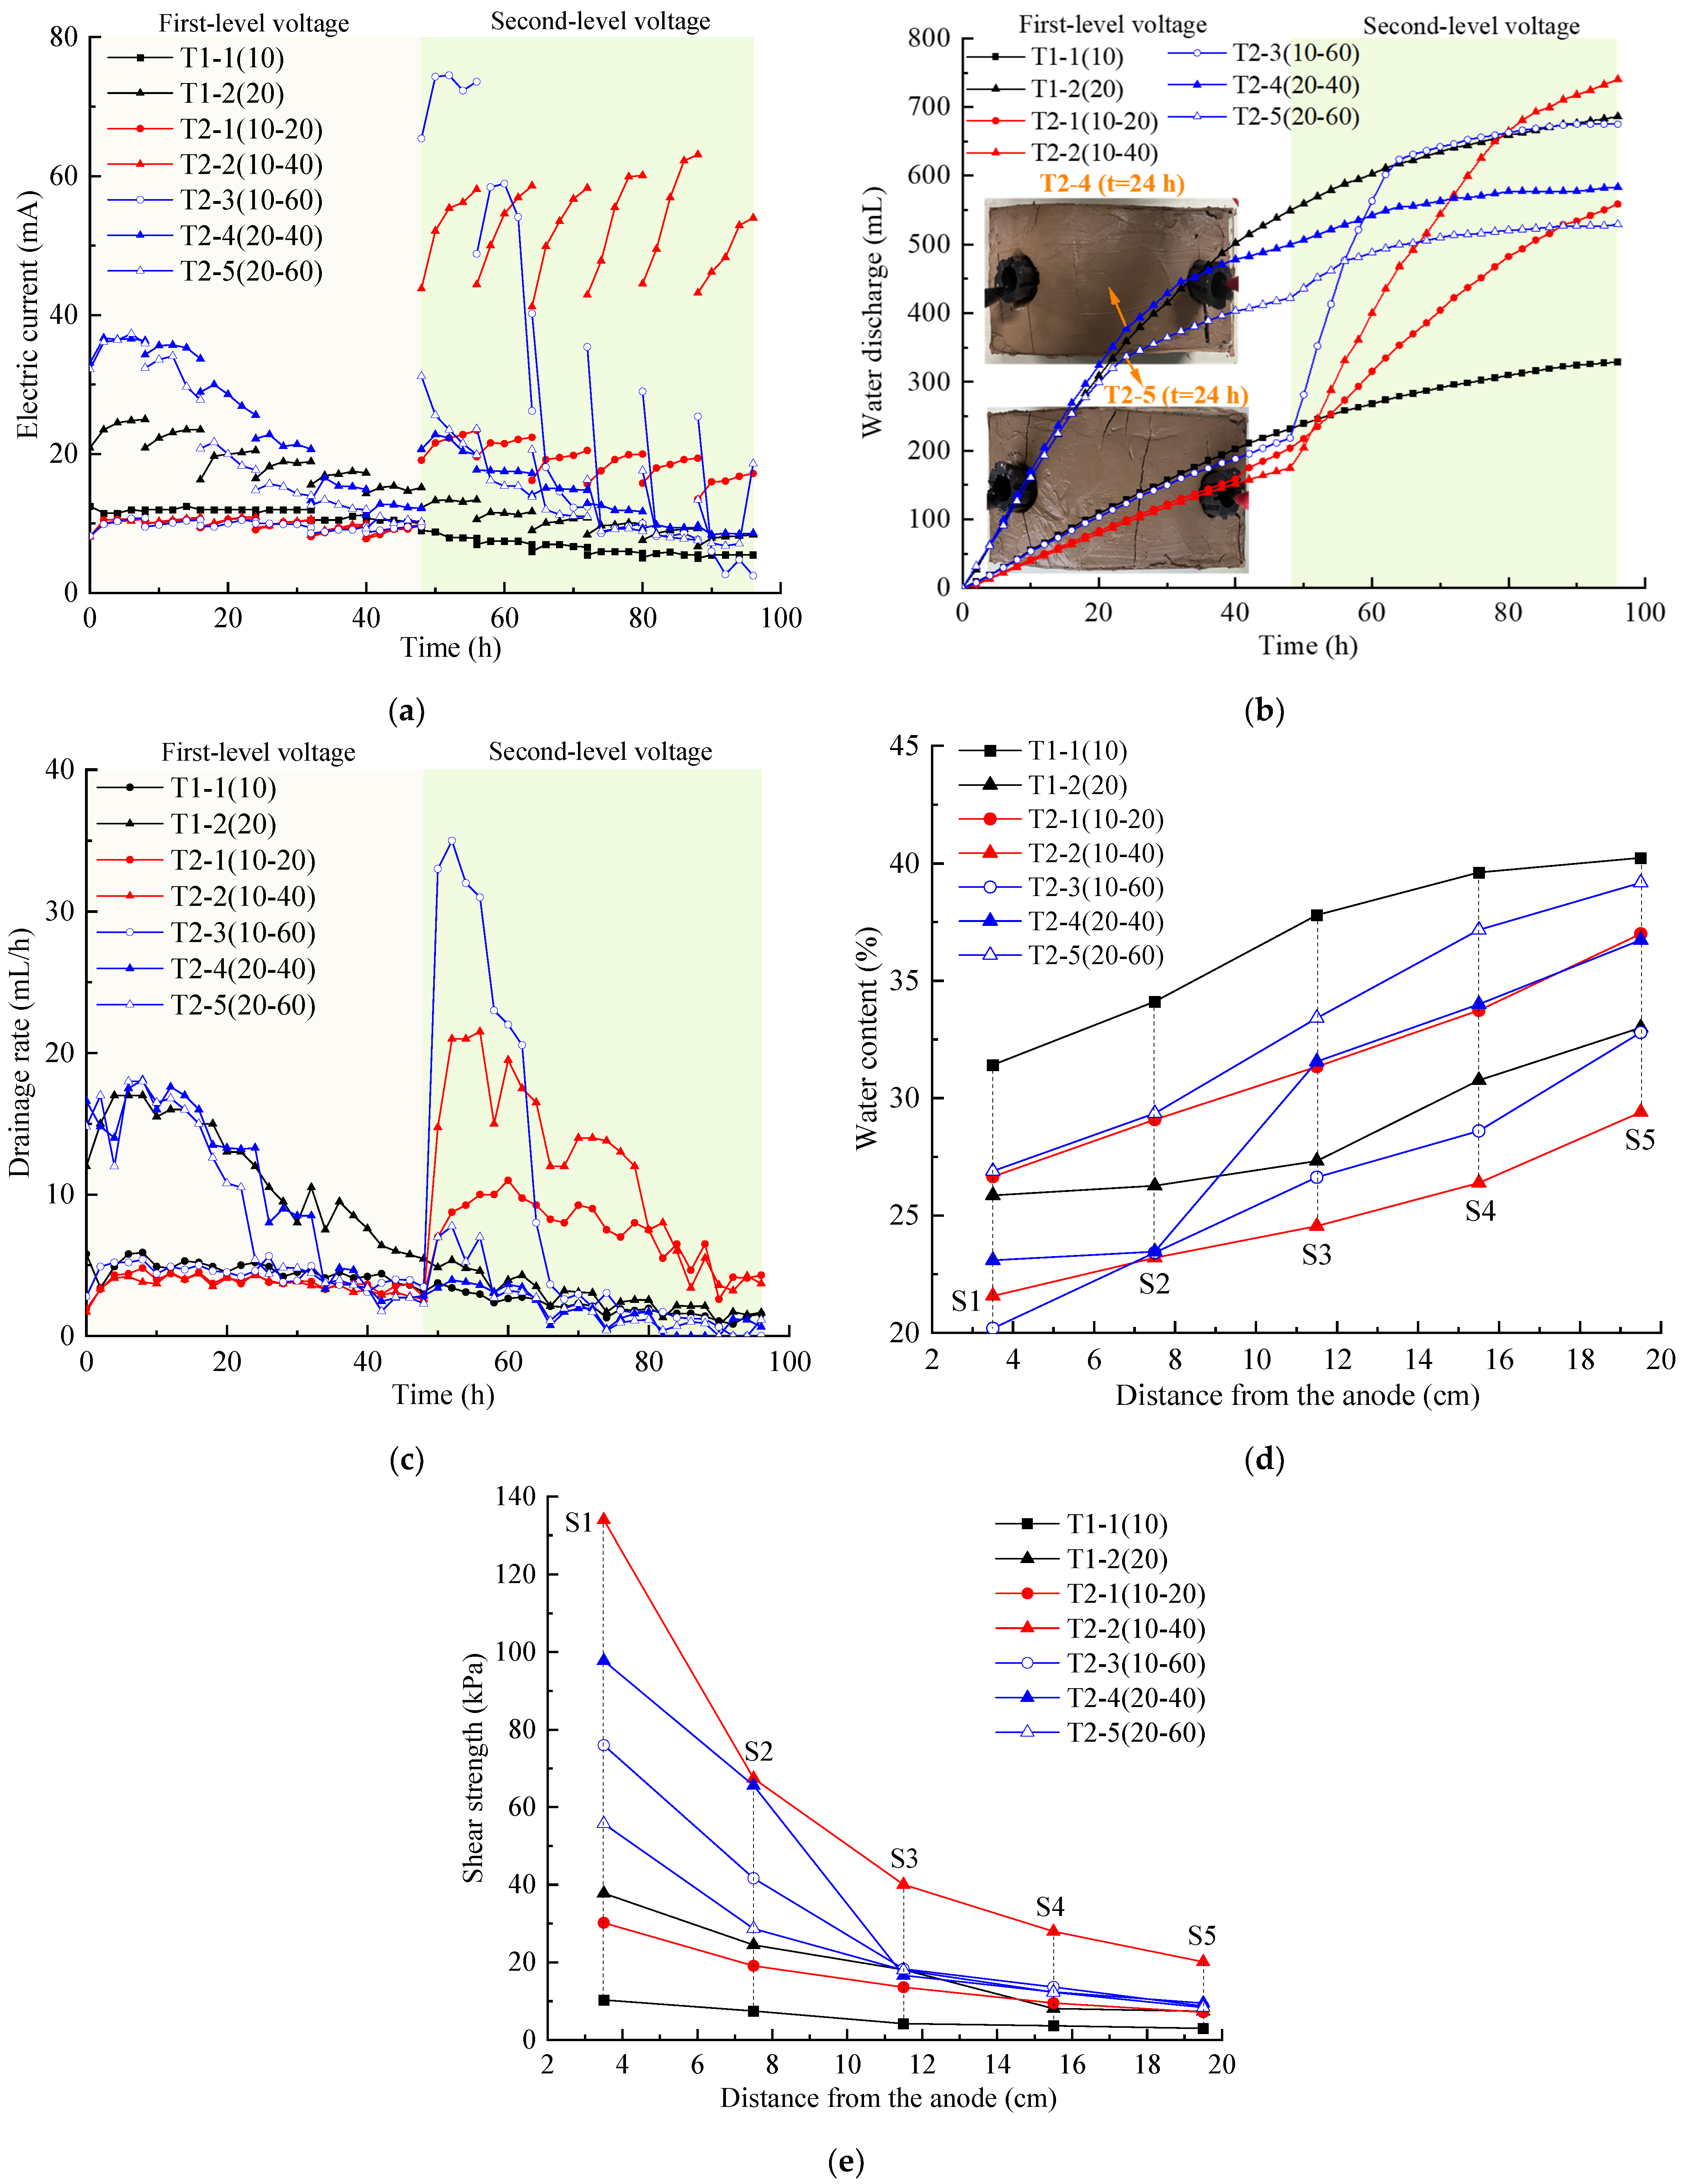
3.2. Influence of Historical Low Electric Voltage Gradients on the Electro-Osmosis Reinforcement Effect at the Present Stage
- (a)
- Electric current
- (b)
- Water discharge and drainage rate
- (c)
- Water content and shear strength distribution
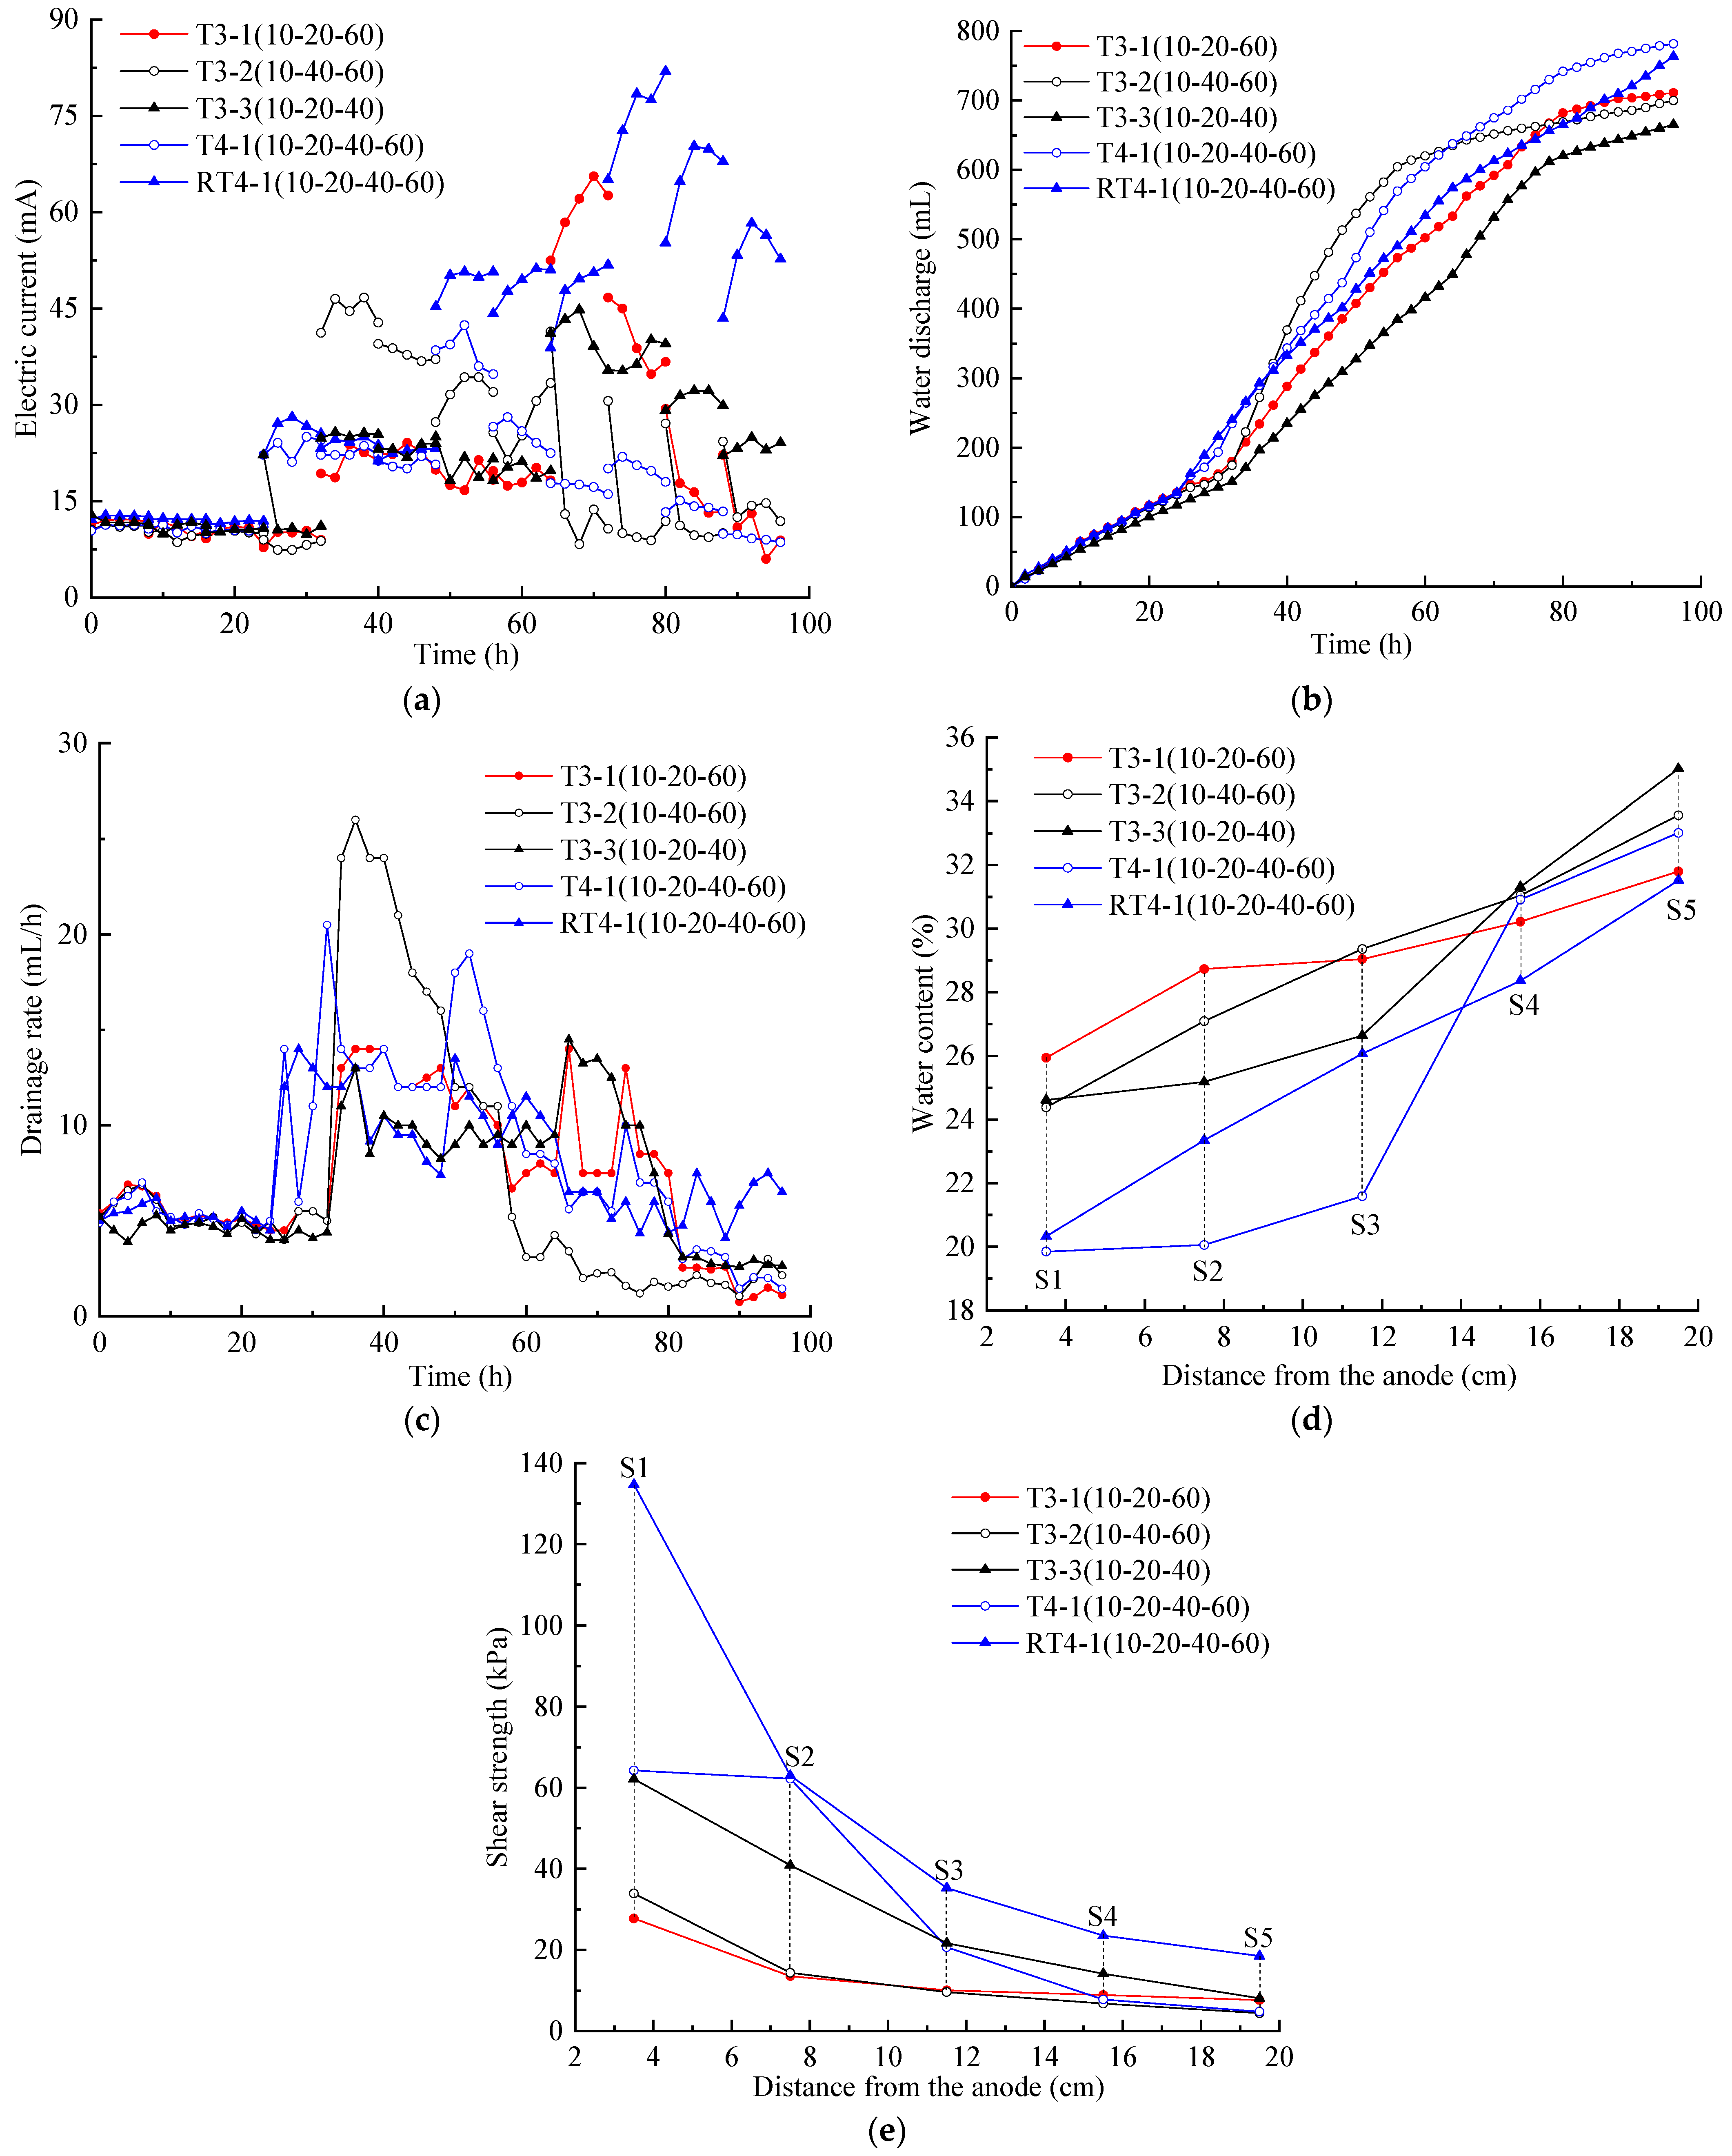
3.3. Electroosmosis Reinforcement Effect Under Multi-Stage Electric Voltage Gradients
- (a)
- Electric current
- (b)
- Water discharge and drainage rate
- (c)
- Water content and shear strength distribution
3.4. Discussion
4. Conclusions
Author Contributions
Funding
Institutional Review Board Statement
Informed Consent Statement
Data Availability Statement
Conflicts of Interest
References
- Casagrande, I.L. Electro-osmosis in soils. Geotechnique 1949, 1, 159–177. [Google Scholar] [CrossRef]
- Mitchell, J.K. Conduction phenomena: From theory to geotechnical practice. Geotechnique 1991, 41, 299–340. [Google Scholar] [CrossRef]
- Estabragh, A.R.; Naseh, M.; Javadi, A.A. Improvement of clay soil by electro-osmosis technique. Appl. Clay Sci. 2014, 95, 32–36. [Google Scholar] [CrossRef]
- Martin, L.; Alizadeh, V.; Meegoda, J. Electro-osmosis treatment techniques and their effect on dewatering of soils, sediments, and sludge: A review. Soils Found. 2019, 59, 407–418. [Google Scholar] [CrossRef]
- Mohamedelhassan, E.; Shang, J.Q. Effects of electrode materials and current intermittence in electro-osmosis. Proc. Inst. Civ. Eng.-Ground Improv. 2001, 5, 3–11. [Google Scholar] [CrossRef]
- Kherad, M.K.; Vakili, A.H.; bin Selamat, M.R.; Salimi, M.; Farhadi, M.S.; Dezh, M. An experimental evaluation of electroosmosis treatment effect on the mechanical and chemical behavior of expansive soils. Arab. J. Geosci. 2020, 13, 260. [Google Scholar] [CrossRef]
- Iwata, M.; Tanaka, T.; Jami, M.S. Application of electroosmosis for sludge dewatering—A review. Dry. Techn. 2013, 31, 170–184. [Google Scholar] [CrossRef]
- Shang, J.Q.; Lo, K.Y.; Huang, K.M. On factors influencing electro-osmotic consolidation. Geotech. Eng. 1996, 27, 23–36. [Google Scholar]
- Fu, H.; Fang, Z.; Wang, J.; Chai, J.; Cai, Y.; Geng, X.; Jin, J.; Jin, F. Experimental comparison of electroosmotic consolidation of Wenzhou dredged clay sediment using intermittent current and polarity reversal. Mar. Georesources Geotechnol. 2018, 36, 131–138. [Google Scholar] [CrossRef]
- Jayasekera, S. Electrokinetics to modify strength characteristics of soft clayey soils: A laboratory based investigation. Electrochim. Acta 2015, 181, 39–47. [Google Scholar] [CrossRef]
- Rittirong, A.; Douglas, R.S.; Shang, J.Q.; Lee, E.C. Electrokinetic improvement of soft clay using electrical vertical drains. Geosynth. Int. 2008, 15, 369–381. [Google Scholar] [CrossRef]
- Pandey, B.K.; Rajesh, S. Enhanced engineering characteristics of soils by electro-osmotic treatment: An overview. Geotech. Geol. Eng. 2019, 37, 4649–4673. [Google Scholar] [CrossRef]
- Akram, S.; Imran, M.; Ashraf, S.; Akram, A.; Kamran, K.; Ishaq, M.; Hussain, A.A.; Abbas, J.K.; Ajaj, Y.; Habila, M.A. Effect of electroosmotic and hydraulic flow on the desalination of soils. J. Appl. Electrochem. 2024, 54, 1685–1698. [Google Scholar] [CrossRef]
- Pandey, B.K.; Rajesh, S.; Chandra, S. Engineering and physicochemical response of soft clay with electrokinetic consolidation process. Acta Geotech. 2024, 19, 5125–5141. [Google Scholar] [CrossRef]
- Sun, Z.; Geng, J.; Wei, G.; Li, W. Engineering application of vacuum preloading combined with electroosmosis technique in excavation of soft soil on complex terrain. PLoS ONE 2023, 18, e0288026. [Google Scholar] [CrossRef] [PubMed]
- Burnotte, F.; Lefebvre, G.; Grondin, G. A case record of electroosmotic consolidation of soft clay with improved soil electrode contact. Can. Geot. J. 2004, 41, 1038–1053. [Google Scholar] [CrossRef]
- Shen, Y.; Feng, J.; Shi, W.; Qiu, C. Effects of voltage gradients on electro-osmotic characteristics of Taizhou soft clay. Int. J. Electrochem. Sci. 2019, 14, 2136–2159. [Google Scholar] [CrossRef]
- Liu, H.; Cui, Y.; Shen, Y.; Ding, X. A new method of combination of electroosmosis, vacuum and surcharge preloading for soft ground improvement. China Ocean Eng. 2014, 28, 511–528. [Google Scholar] [CrossRef]
- Li, X.; Zhao, R.; Fu, H.; Wang, J.; Cai, Y.; Hu, X.; Zhou, J.; Hai, J. Slurry improvement by vacuum preloading and electro-osmosis. Proc. Inst. Civ. Eng.-Geotech. Eng. 2019, 172, 145–154. [Google Scholar] [CrossRef]
- Bian, X.; Yang, H.; Liu, H.; Xu, Z.; Zhang, R. Experimental study on the improvement of sludge by vacuum preloading-stepped electroosmosis method with prefabricated horizontal drain. Geotext. Geomembr. 2024, 52, 753–761. [Google Scholar] [CrossRef]
- Chew, S.H.; Karunaratne, G.P.; Kuma, V.M.; Lim, L.H.; Toh, M.L.; Hee, A.M. A field trial for soft clay consolidation using electric vertical drains. Geotext. Geomembr. 2004, 22, 17–35. [Google Scholar] [CrossRef]
- Mahalleh, H.A.M.; Siavoshnia, M.; Yazdi, M. Effects of electro-osmosis on the properties of high plasticity clay soil: Chemical and geotechnical investigations. J. Electroanal. Chem. 2021, 880, 114890. [Google Scholar] [CrossRef]
- Wen, L.; Yan, C. Influence of the electric voltage gradient, electrode spacing and electrode radius on slurry dewatering by vertical electro-osmosis. Int. J. Electrochem. Sci. 2020, 15, 11326–11339. [Google Scholar] [CrossRef]
- Xue, Z.; Tang, X.; Yang, Q. Influence of voltage and temperature on electro-osmosis experiments applied on marine clay. Appl. Clay Sci. 2017, 141, 13–22. [Google Scholar] [CrossRef]
- Liu, F.; Li, Z.; Yuan, G.; Hu, X.; Zhang, D.; Du, Y.; Gou, C. Improvement of dredger fill by stepped vacuum preloading combined with stepped voltage electro-osmosis. Mar. Georesources Geotechnol. 2021, 39, 822–831. [Google Scholar] [CrossRef]
- Huweg, A.F.S.; Kamel, F.; Raine, S. Investigating the effect of electro-osmosis on sandy soil near saturated conditions. In Proceedings of the 2010 Southern Region Engineering Conference (SREC 2010), Toowoomba, Australia, 10–12 November 2010. [Google Scholar]
- GB/T 50145-2007; Standardization Administration of the People’s Republic of China. Standard for Engineering Classification of Soils. China Planning Press: Beijing, China, 2007. (In Chinese)
- GB/T 50123-2019; Standardization Administration of the People’s Republic of China. Standard for Geotechnical Testing Method. China Planning Press: Beijing, China, 2019. (In Chinese)
- Sun, Z.; Wu, T.; Yao, K.; Kasu, C.M.; Zhao, X.; Li, Z.; Gong, J. Consolidation of soft clay by cyclic and progressive electroosmosis using electrokinetic geosynthetics. Arab. J. Geosci. 2022, 15, 1193. [Google Scholar] [CrossRef]
- Acar, Y.B.; Alshawabkeh, A.N. Principles of electrokinetic remediation. Environ. Sci. Technol. 1993, 27, 2638–2647. [Google Scholar] [CrossRef]
- Asadi, A.; Huat, B.B.K.; Nahazanan, H.; Keykhah, H.A. Theory of electroosmosis in soil. Int. J. Electrochem. Sci. 2013, 8, 1016–1025. [Google Scholar] [CrossRef]
- Cameselle, C. Enhancement of electro-osmotic flow during the electrokinetic treatment of a contaminated soil. Electrochimica Acta 2015, 181, 31–38. [Google Scholar] [CrossRef]
- Lee, S.H.H.; Widjaja, B. Phase concept for mudflow based on the influence of viscosity. Soils Found. 2013, 53, 77–90. [Google Scholar] [CrossRef]
- Sun, Z.; Qing, Y.; Zhang, C.; Eugene, B.D. Electroosmosis and electrophoresis in soft clay under direct current electric field. Heliyon 2024, 10, e28718. [Google Scholar] [CrossRef] [PubMed]
- Jeyakanthan, V.; Gnanendran, C.T.; Lo, S. Laboratory assessment of electro-osmotic stabilization of soft clay. Can. Geotech. J. 2011, 48, 1788–1802. [Google Scholar] [CrossRef]
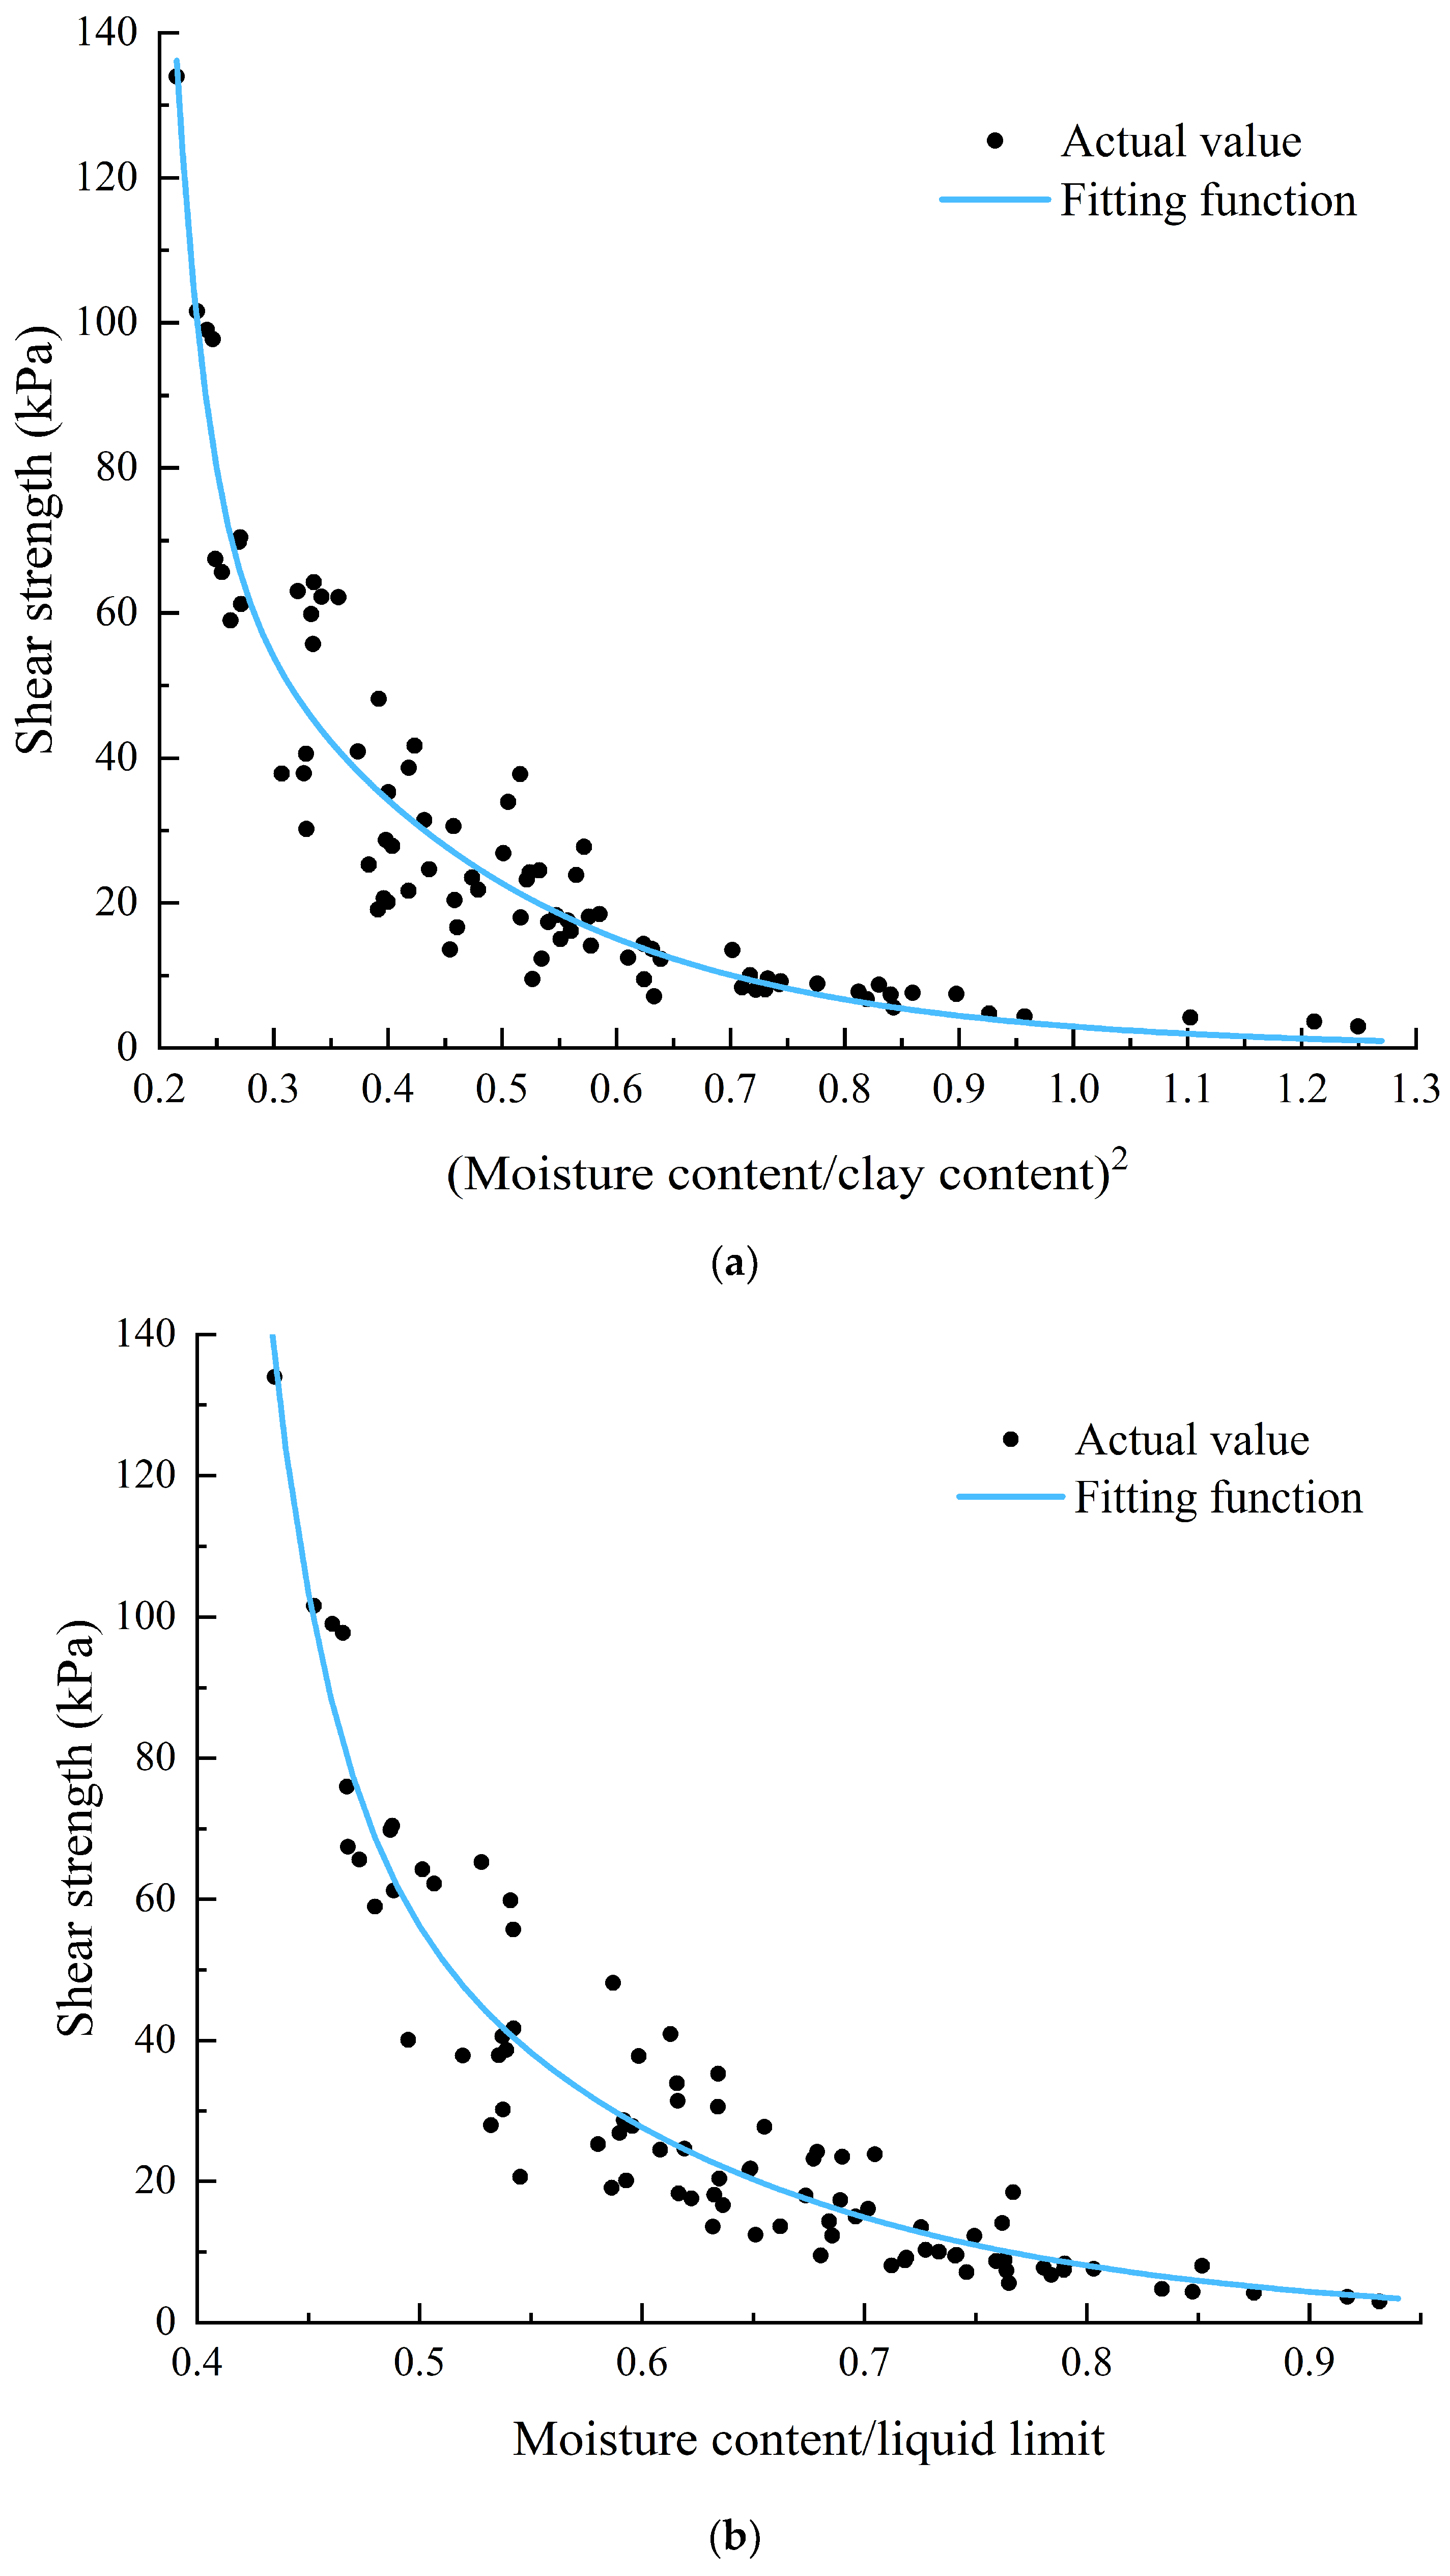
- Trask, P.D.; Close, J.E.H. Effect of clay content on strength of soils. Coast. Eng. Proc. 1957, 1, 50. [Google Scholar] [CrossRef]
| Properties | First Batch of Soil Samples | Second Batch of Soil Samples | Third Batch of Soil Samples | Fourth Batch of Soil Samples | |
|---|---|---|---|---|---|
| Particle size analysis a | P0.005–0.075 (%) | 59.3 | 56.7 | 64.9 | 57.4 |
| P0.005 (%) | 36.0 | 43.3 | 35.1 | 42.6 | |
| P0.002 (%) | 25.1 | 28.0 | 24.5 | 26.4 | |
| Water content (%) | 6.0 | 3.9 | 3.4 | 4.1 | |
| pH | 6.5 | 6.5 | 6.5 | 6.4 | |
| Liquid limit (%) | 41.0 | 49.6 | 39.6 | 41.1 | |
| Plastic limit (%) | 21.2 | 21.4 | 20.8 | 18.9 | |
| Plasticity index | 19.8 | 28.2 | 18.8 | 22.2 | |
| Activity index | 0.79 | 1.01 | 0.77 | 0.84 | |
| Soil Sample Batch | Test Number | Initial Soil Moisture Content (%) | Applied Voltage (V) | Power on Time for Each Voltage (h) | Initial Vane Shear Strength (kPa) | Total Treatment Time (h) |
|---|---|---|---|---|---|---|
| First batch | T1-1 | 49.8 | 10 | 96 | 1.915 | 96 |
| T1-2 | 49.6 | 20 | 96 | |||
| T1-3 | 49.6 | 40 | 96 | |||
| T1-4 | 49.8 | 60 | 96 | |||
| Second batch | T2-1 | 50.1 | 10 | 48 | 2.131 | |
| 20 | 48 | |||||
| T2-2 | 50.1 | 10 | 48 | |||
| 40 | 48 | |||||
| First batch | T2-3 | 49.5 | 10 | 48 | 1.915 | |
| 60 | 48 | |||||
| Second batch | T2-4 | 50.3 | 20 | 48 | 2.131 | |
| 40 | 48 | |||||
| T2-5 | 49.5 | 20 | 48 | |||
| 60 | 48 | |||||
| T2-6 | 50.3 | 40 | 48 | |||
| 20 | 48 | |||||
| T2-7 | 49.9 | 40 | 48 | |||
| 60 | 48 | |||||
| T2-8 | 49.9 | 60 | 48 | |||
| 10 | 48 | |||||
| T2-9 | 50.2 | 60 | 48 | |||
| 20 | 48 | |||||
| T2-10 | 50.2 | 60 | 48 | |||
| 40 | 48 | |||||
| Third batch | T3-1 | 49.2 | 10 | 32 | 1.826 | |
| 20 | 32 | |||||
| 60 | 32 | |||||
| T3-2 | 49.2 | 10 | 32 | |||
| 40 | 32 | |||||
| 60 | 32 | |||||
| Fourth batch | T3-3 | 50.2 | 10 | 32 | 1.998 | |
| 20 | 32 | |||||
| 40 | 32 | |||||
| Third batch | T4-1 | 49.2 | 10 | 24 | 1.826 | |
| 20 | 24 | |||||
| 40 | 24 | |||||
| 60 | 24 | |||||
| Fourth batch | RT4-1 | 50.2 | 10 | 24 | 1.998 | |
| 20 | 24 | |||||
| 40 | 24 | |||||
| 60 | 24 |
| Test Number (Voltage (V)) | Drainage Volume Under Each Level of Voltage (mL) | Total Water Discharge (mL) | Moisture Content (%) | Shear Strength (kPa) | Total Energy Consumption W (kW·h) | Energy Consumption per Unit of Water Discharge (W·h/mL) | Energy Consumption Required to Increase Unit Shear Strength (W·h/kPa) | ||
|---|---|---|---|---|---|---|---|---|---|
| Average | COV | Average | COV | ||||||
| T1-1 (10) | 328.5 | 328.5 | 36.6 | 0.10 | 5.719 | 0.51 | 1.850 | 5.63 | 486.33 |
| T1-2 (20) | 686.1 | 686.1 | 28.6 | 0.11 | 19.168 | 0.63 | 1.978 | 2.88 | 114.65 |
| T1-3 (40) | 777.2 | 777.2 | 26.7 | 0.18 | 39.311 | 0.85 | 2.117 | 2.72 | 56.61 |
| T1-4 (60) | 744.8 | 744.8 | 26.9 | 0.11 | 26.266 | 0.82 | 2.462 | 3.31 | 101.10 |
| T2-1 (10–20) | 203.4-355.6 | 559.0 | 31.6 | 0.12 | 15.904 | 0.55 | 1.926 | 3.45 | 139.84 |
| T2-2 (10–40) | 174.8-565.4 | 740.2 | 25.0 | 0.13 | 57.914 | 0.92 | 2.075 | 2.80 | 37.20 |
| T2-3 (10–60) | 218.2-456.9 | 675.1 | 26.3 | 0.18 | 31.656 | 0.88 | 2.171 | 3.22 | 73.00 |
| T2-4 (20–40) | 499.5-83.8 | 583.3 | 29.8 | 0.20 | 40.367 | 0.93 | 2.130 | 3.65 | 55.71 |
| T2-5 (20–60) | 422.2-107.0 | 529.2 | 33.2 | 0.15 | 24.606 | 0.72 | 2.094 | 3.96 | 93.17 |
| T2-6 (40–20) | 677.6-2.6 | 680.2 | 27.5 | 0.18 | 47.826 | 0.70 | 2.142 | 3.15 | 46.88 |
| T2-7 (40–60) | 601.1-26.0 | 627.1 | 30.2 | 0.17 | 41.584 | 0.64 | 2.001 | 3.19 | 50.72 |
| T2-8 (60–10) | 659.3-0 | 659.3 | 30.0 | 0.14 | 37.721 | 0.68 | 2.197 | 3.33 | 61.73 |
| T2-9 (60–20) | 656.8-0 | 656.8 | 29.0 | 0.14 | 40.570 | 0.78 | 2.213 | 3.37 | 57.57 |
| T2-10 (60–40) | 747.5-0.8 | 748.3 | 27.0 | 0.17 | 44.749 | 0.53 | 2.553 | 3.41 | 59.90 |
| T3-1 (10–20–60) | 180.1-353.2-178.0 | 711.3 | 29.1 | 0.07 | 13.550 | 0.63 | 2.091 | 2.94 | 178.35 |
| T3-2 (10–40–60) | 174.5-460.5-65.0 | 700.0 | 29.1 | 0.11 | 13.790 | 0.86 | 2.213 | 3.16 | 184.97 |
| T3-3 (10–20–40) | 151.0-298.3-216.1 | 665.4 | 28.6 | 0.15 | 29.374 | 0.79 | 2.078 | 3.12 | 75.91 |
| T4-1 (10–20–40–60) | 133.5-304.0-248.6-95.8 | 781.9 | 25.1 | 0.25 | 31.925 | 0.86 | 2.073 | 2.65 | 68.87 |
| RT4-1 (10–20–40–60) | 135.0-266.3-222.2-139.8 | 763.3 | 25.9 | 0.16 | 54.984 | 0.88 | 2.245 | 2.94 | 42.37 |
Disclaimer/Publisher’s Note: The statements, opinions and data contained in all publications are solely those of the individual author(s) and contributor(s) and not of MDPI and/or the editor(s). MDPI and/or the editor(s) disclaim responsibility for any injury to people or property resulting from any ideas, methods, instructions or products referred to in the content. |
© 2025 by the authors. Licensee MDPI, Basel, Switzerland. This article is an open access article distributed under the terms and conditions of the Creative Commons Attribution (CC BY) license (https://creativecommons.org/licenses/by/4.0/).
Share and Cite
Sun, Z.; Qing, Y.; Zhang, J.; Mediamartha, B.M. The Influence of Voltage Gradient Application History on Electro-Osmotic Reinforcement of Marine Soft Clay. J. Mar. Sci. Eng. 2025, 13, 352. https://doi.org/10.3390/jmse13020352
Sun Z, Qing Y, Zhang J, Mediamartha BM. The Influence of Voltage Gradient Application History on Electro-Osmotic Reinforcement of Marine Soft Clay. Journal of Marine Science and Engineering. 2025; 13(2):352. https://doi.org/10.3390/jmse13020352
Chicago/Turabian StyleSun, Zhaohua, Yuxing Qing, Jianming Zhang, and Bintang Mas Mediamartha. 2025. "The Influence of Voltage Gradient Application History on Electro-Osmotic Reinforcement of Marine Soft Clay" Journal of Marine Science and Engineering 13, no. 2: 352. https://doi.org/10.3390/jmse13020352
APA StyleSun, Z., Qing, Y., Zhang, J., & Mediamartha, B. M. (2025). The Influence of Voltage Gradient Application History on Electro-Osmotic Reinforcement of Marine Soft Clay. Journal of Marine Science and Engineering, 13(2), 352. https://doi.org/10.3390/jmse13020352