Article

Marine Radar Target Ship Echo Generation Algorithm and Simulation Based on Radar Cross-Section

Navigation College, Dalian Maritime University, Dalian 116026, China
*
Author to whom correspondence should be addressed.
J. Mar. Sci. Eng. 2025, 13(2), 348; https://doi.org/10.3390/jmse13020348
Submission received: 20 January 2025 / Revised: 4 February 2025 / Accepted: 12 February 2025 / Published: 14 February 2025
(This article belongs to the Section Ocean Engineering)

Abstract

:
In this study, a simplified radar echo signal model suitable for radar simulators and a Radar Cross-Section (RCS) calculation model based on the Physical Optics (PO) method was developed. A comprehensive radar target ship echo generation algorithm was designed, and the omnidirectional radar RCS values of three typical ships were calculated. The simulation generates radar target ship echo images under varying incident angles (0–360°), detection distances (0–24 nautical miles), and three common target material properties. The simulation results, compared with those from existing radar simulators and real radar systems, show that the method proposed in this study, based on RCS values, generates highly realistic radar target ship echoes. It accurately simulates radar echoes under different target ship headings, distances, and material influences, fully meeting the technical requirements of the STCW international convention for radar simulators.

1. Introduction

Radar echo simulation has been a crucial area of research in radar simulators for many years. In compliance with the 2010 International Maritime Organization (IMO) Manila Amendment to the International Standard for Training, Certification and Watchkeeping of Seafarers (STCW Convention), trainees must be able to accurately identify radar echoes during radar simulator training. This requirement not only raises the standards for improving seafarers’ operational skills but also provides clear direction for advancing radar echo simulation technologies. As the global shipping industry places increasing emphasis on the quality of crew training, the STCW convention’s requirements have accelerated the development of echo simulation technology in radar simulators, positioning it as a key technology for enhancing training effectiveness and skill assessment. Simultaneously, the rapid advancement of intelligent ships has introduced new demands for shore-based center technologies. In order to meet the precise navigation and remote operation requirements of intelligent ships, shore-based centers must utilize real-time monitoring and feedback facilitated by advanced radar echo simulation technologies. This technology not only enhances the realism of simulation training but also provides reliable simulation data support for the remote control of intelligent ships. With the ongoing development of simulation systems, radar image simulation has attracted widespread attention from scholars both domestically and internationally, and extensive research has been conducted in various aspects of intelligent shipping and ship operations.
Research on radar simulators dates back to the previous century, and with advancements in computer technology, a variety of radar image simulators have since been developed. Xu [1] developed a radar simulator using image signal processing techniques, generating radar echo images by processing image data. Yu [2] evaluated the Furuno simulator and demonstrated that it accurately simulates the radar’s real operational interface, supporting multi-target tracking and trajectory visualization. Afonin [3] developed a simulator that takes into account the geometric shape and relative position of the target, achieving high-fidelity image simulation. The rapid development of electronic chart systems has introduced a new approach to radar image simulation. Zhang [4] proposed integrating electronic charts with radar images, enabling real-time updates and precise matching of radar images, thereby further enhancing the realism and practicality of the simulation. Yao [5] from Dalian University of Technology developed a RADAR/ARPA simulation training system by generating radar images and overlaying them with electronic charts, which helps trainees complete basic ARPA function training. The fully software-based radar simulators developed by Tian [6] and Li [7] at Dalian Maritime University utilize OpenGL and DirectDraw technologies for radar image simulation, generating echo images with high realism and real-time performance. These simulators have been widely applied in maritime education and training. Although current radar simulators partially fulfill the basic radar functionality training requirements, they exhibit significant shortcomings in the realism and accuracy of target ship echo simulations. Many existing simulators neglect the electromagnetic characteristics of targets, leading to substantial discrepancies between simulated and real echoes. Furthermore, while some high-precision simulation methods can produce more accurate echo signals, their application in real-time simulations is severely constrained by computational complexity and extensive data requirements. Moreover, most current radar simulators primarily focus on static or simplistic dynamic target scenarios, lacking the capability to simulate multi-target, highly dynamic, and complex environments. This limitation is particularly apparent in the training of intelligent ship systems and automated navigation systems. Radar simulator research generally classifies existing imaging technologies into three categories. The first approach [8] strictly adheres to the radar imaging process, beginning with echo formation in target space, transitioning to signal space, and finally to image space. This approach focuses on simulating radar echo signals, utilizing techniques akin to those of actual radar imaging algorithms to generate simulated images. The second approach [9] treats radar as a signal transmission system. By convolving the radar system’s transfer function with a backscatter coefficient map, radar simulation images are generated. The third approach [10] relies on the Radar Cross-Section (RCS) of targets, integrating radar image features with RCS data to directly generate simulated images. While the former two approaches achieve high realism, their computational complexity often limits their application to theoretical research. In contrast, the third approach is computationally efficient, faster, and highly suitable for real-time applications, making it ideal for radar training scenarios involving target recognition and radar functionality training. Consequently, the numerical simulation of RCS for maritime vessels has become a prominent research focus in recent years.
RCS is a critical parameter for studying the electromagnetic scattering characteristics of targets [11]. There are two main approaches to solving RCS: numerical analysis methods and approximate analytical methods [12]. Numerical analysis methods offer high accuracy but are computationally intensive. Common techniques include the Method of Moments (MoM), the Finite Element Method (FEM) [13] and the Fast Multipole Method (FMM) [14]. In contrast, approximate analytical methods are more computationally efficient, though less accurate than numerical methods. These methods are commonly employed to quickly analyze the electromagnetic scattering of electrically large targets. Techniques in this category include the Ray Tracing Method [15], the Physical Optics (PO) Method [16], and the Geometric–Physical Optics (GO-PO) Method [17,18,19]. Approximate analytical methods are particularly effective at handling scattering problems on planar and high-curvature surfaces, making them widely used for RCS calculations of large, complex targets. For instance, Zhang [20] analyzed the scattering characteristics of sea targets using an optimized facet scattering model combined with the GO-PO hybrid method. Zhao [21] integrated a K-d tree model into the GO-PO method, significantly improving the accuracy and efficiency of RCS calculations for ships at sea. Meanwhile, Dong [22] incorporated the Physical Theory of Diffraction (PTD) into the GO-PO algorithm to solve the RCS of large, complex targets, validating the method’s effectiveness using FEKO 2022. A target’s structure, shape, motion state, and electromagnetic scattering mechanisms significantly influence its RCS. Researchers, including Chen, L. [23], Li, G. [24], Chen, C. [25], and Chen, S. [26], have examined the impact of factors such as frequency, polarization, incident angle, bow direction, and motion fluctuation models on ship RCS, laying the theoretical foundation for subsequent ship target recognition and simulation. Ji [27] explored how the complexity of a target’s structure, shape, motion state, and electromagnetic scattering mechanisms influences the accuracy of RCS calculations. Zhang [28] calculated the RCS of moving targets by combining azimuthal data with omnidirectional RCS values. Zhao [29] approximated large, complex targets as multiple point sources and applied the principle of scattered field superposition to calculate the RCS. Li [30] investigated seabed scattering models under various seabed materials and analyzed the influence of material properties on electromagnetic wave scattering. Chen [31] performed electromagnetic scattering simulations for multi-material targets and analyzed their imaging characteristics. This offers new insights into ship scattering models and imaging under diverse materials. Dai [32] researched the impact of atmospheric and oceanic characteristics on the RCS at large scales, providing critical theoretical support for RCS simulation in complex environments. Currently, most of these studies remain centered on target echo signal models and have not deeply explored the impact of the RCS on echo images. With advances in electromagnetic modeling technology, researchers such as Li and Ezuma M. [33,34] have made significant strides in RCS simulations using computational electromagnetic modeling. Zhu [35] calculated radar echo signals based on the dynamic RCS, simulating ships in various scenarios under specified radar parameters and sea surface conditions. Cao [9] proposed an echo intensity-based radar image simulation method that determines the echo intensity of a target using its RCS and the radar equation. However, most of these studies are limited to static target simulations and have not been fully extended to dynamic target scenarios, lacking real-time tracking and simulation of echo variations under complex motion and changing environmental conditions.
Current radar target ship echo simulations often fail to adequately consider electromagnetic wave propagation characteristics, which results in a lack of realism in the radar simulator’s target ship echoes. To address this issue, this study presents a comprehensive radar target ship echo generation algorithm based on the operational environment of ship navigation radars. Given the requirements for radar simulator echo simulations, this algorithm simplifies the radar target echo signals based on the typical operating modes of navigation radars and the characteristics of detected targets in order to enhance simulation efficiency. The algorithm calculates the omnidirectional radar RCS values of typical ships, enabling radar target ship echo image simulations under varying incident angles, detection distances, and target material effects. This approach is designed to improve the realism and efficiency of radar echo simulations, addressing the limitations currently observed in radar simulators.

2. Radar Target Signal and RCS Model

2.1. Target Echo Signal Model

Ship navigation radars are mainly composed of a transmitter, receiver, transceiver antenna, and information processing and display unit. During radar operation, the transmitter emits electromagnetic waves through the antenna [36]. Let the radar’s transmitted power be P t , the received power be P r and the antenna gain be G t . The relationship between these parameters can be represented by the radar equation [37]:
P r = P t G t 2 λ 2 σ ( 4 π ) 3 R 4
where P t is the radar transmission power, P r is the radar received power after reflection, G t is the radar antenna gain, λ is the radar wavelength, σ is the RCS of the target, and R is the distance between the radar and the target.
The operational mode of ship navigation radars is primarily based on the pulse mode. The signals they transmit are typically conventional pulse signals modulated at high frequencies, represented as:
S i ( t ) = n = 0 + R e c t ( t n T r T p ) cos ( 2 π f 0 t + ψ 0 )
where T r is the pulse repetition period, T p is the pulse width, f 0 is the carrier frequency, ψ 0 is the carrier phase, and R e c t ( t T p ) = 1                 0 1 T p 0                       o t h e r s       is the Rectangular function.
The radar echo signal received after reflection from the target is as follows:
S o ( t ) = A o n = 0 + R e c t ( t n T r τ r T p ) cos ( 2 π f 0 ( t τ r ) + ψ 0 + ψ r )
where ψ r represents the phase shift caused by the target reflection, τ r represents the two-way propagation delay of the target signal, and A o represents the amplitude variation of the target echo signal [38], represented as:
A o = P t ( 4 π ) 3 L s g v t ( θ ) g v r ( θ ) R 2 ( t ) λ σ
where P t is the radar transmitted power, L s is the combined transmission and reception loss of the radar, g v t ( θ ) is the transmitting antenna pattern of the radar, g v r ( θ ) is the receiving antenna pattern of the radar, R ( t ) is the instantaneous distance between the radar and the target, λ is the radar wavelength, and σ is the RCS of the target.
Considering the operational environment of ship navigation radars and the practical requirements of radar target echo simulation, this study simplifies the radar target signal model in the following three aspects to construct a simplified radar echo signal model suitable for radar simulators.
(1)
Radar scanning mode: Since the ship navigation radar operates with a constant rotational speed during scanning, the g v t ( θ ) and g v t ( θ ) of the scanning antenna in the target direction can be considered as constant G ;
(2)
Doppler shift: Since the targets detected by ship navigation radars are primarily low-speed objects such as ships, the Doppler shift phenomenon can be neglected in radar echo simulations;
(3)
Phase information: Since ship navigation radars are non-coherent radars, phase information is not considered in the generation of target echoes.
In summary, the echo signal model for ship navigation radars can be simplified as:
S o ( t ) = P t ( 4 π ) 3 L s G 2 R 2 ( t ) λ σ n = 0 + R e c t ( t n T r τ r T p ) cos ( 2 π f 0 t )
From the above equation, it can be observed that distance and the RCS are the two key factors determining the intensity of the radar echo signal. The intensity of the echo signal received by the radar decreases rapidly with the fourth power of the distance R between the target and the radar. This means that the farther the target, the weaker the echo signal becomes exponentially. As a result, echoes from distant targets may become faint or even undetectable. On the other hand, the RCS directly reflects the target’s ability to scatter radar electromagnetic waves. A larger RCS value results in stronger reflected echo signals, leading to higher image brightness and clarity. Conversely, targets with smaller RCS values may result in insufficient echo signal intensity, adversely affecting detection performance. Therefore, in radar echo signal modeling and simulation, dynamically adjusting the RCS and distance parameters is essential for enhancing the realism and stability of radar signals.

2.2. Target Ship RCS Calculation Model

The RCS is a physical quantity that measures a target’s ability to scatter electromagnetic waves emitted by a radar. It is commonly denoted by the symbol σ . Under plane wave illumination, the RCS is defined as the ratio of the power scattered per unit solid angle to the power density received by the target [39], as shown in Equation (6):
σ = lim 4 π R 2 E S 2 E I 2 = lim 4 π R 2 H S 2 H I 2
where R represents the distance from the radar to the target and E I and H I represent the incident electric field at the target and the scattered electric field at the receiving antenna, respectively.
When R is sufficiently large, both the incident wave and the reflected wave can be approximated as plane waves. The RCS of a ship is primarily influenced by the following factors:
(1)
Geometric shape and size of the ship: The shape and size of the hull significantly impact the reflection of electromagnetic waves. From a geometric perspective, different ship designs lead to varying interactions between electromagnetic waves and the target surface. Ships with sharp edges or acute angles tend to produce stronger reflections, while smooth curves or rounded hulls scatter electromagnetic waves, reducing reflection. In terms of size, larger ships typically have a greater RCS because their larger surface area allows them to reflect more electromagnetic waves, thereby increasing the RCS;
(2)
Surface material of the ship: The electromagnetic reflection, scattering, and absorption properties vary with the hull materials, resulting in different RCS values. For example, metallic materials like steel have high reflection capacity, while materials like xylon and composites have weaker reflective capabilities and absorb more electromagnetic waves;
(3)
Incident angle of the radar waves: The ship’s complex structure, especially the presence of superstructures, causes significant variation in radar wave reflections with different incident angles. In practical environments, the relative motion between the target ship and radar causes the incident angle to change continuously, dynamically altering the target’s RCS.
The radar wave scattering mechanisms of ships are characterized by specular reflection, multiple scattering, and diffraction. Commercial ships typically use X-band and S-band radars. Commercial ships are typically over 50 m in size and considered electrically large for navigation radars. The PO method efficiently simulates and calculates the reflection, scattering, and diffraction of electrically large targets and is widely used for the RCS calculation of target ships. The following outlines the steps for calculating the RCS of a target using the PO method:
(1)
Target model meshing: Divide the target surface into small facets, each with an area of Δ S . These facets are sufficiently small to accurately describe the target’s geometric shape;
(2)
Illuminated and shadowed region determination: When electromagnetic waves illuminate the target from a specific angle, the surface is divided into illuminated and shadowed regions. Shadowed regions do not induce currents and thus do not contribute to radar scattering. To enhance computational efficiency, shadowed regions are excluded, and calculations are performed only for the illuminated regions;
(3)
Scattered field calculation for individual facets: For each facet in the illuminated region, calculate its contribution to the scattered field. Due to variations in the incident angle and orientation of each facet, the scattered field calculation varies for each facet;
(4)
Total scattered field summation: Sum the scattered fields of all facets in the illuminated region to obtain the target’s total scattered field. The calculation of the scattered field is given by Equation (7):
E s = s ( 1 R e j k R ) n ^ r ^ Δ S
where k is the propagation constant of the electromagnetic wave, which is related to the wavelength; R is the distance from the observation point to the target, r ^ is the unit vector in the observation direction, n ^ is the normal vector of the target facet, S represents the surface area of the entire target, and Δ S is the area of each facet.
By integrating the scattered fields of all facets on the target’s surface, the total scattered field of the target can be obtained, thereby determining the RCS value of the target.

3. Radar Target Ship Echo Generation Algorithm

This study proposes a radar target ship echo generation algorithm based on the RCS, capable of generating echo images based on the target ship’s geometric features and RCS distribution. The algorithm workflow is shown in Figure 1, with the design concept and implementation steps presented in detail below.

3.1. Target Ship Position Coordinate Calculation

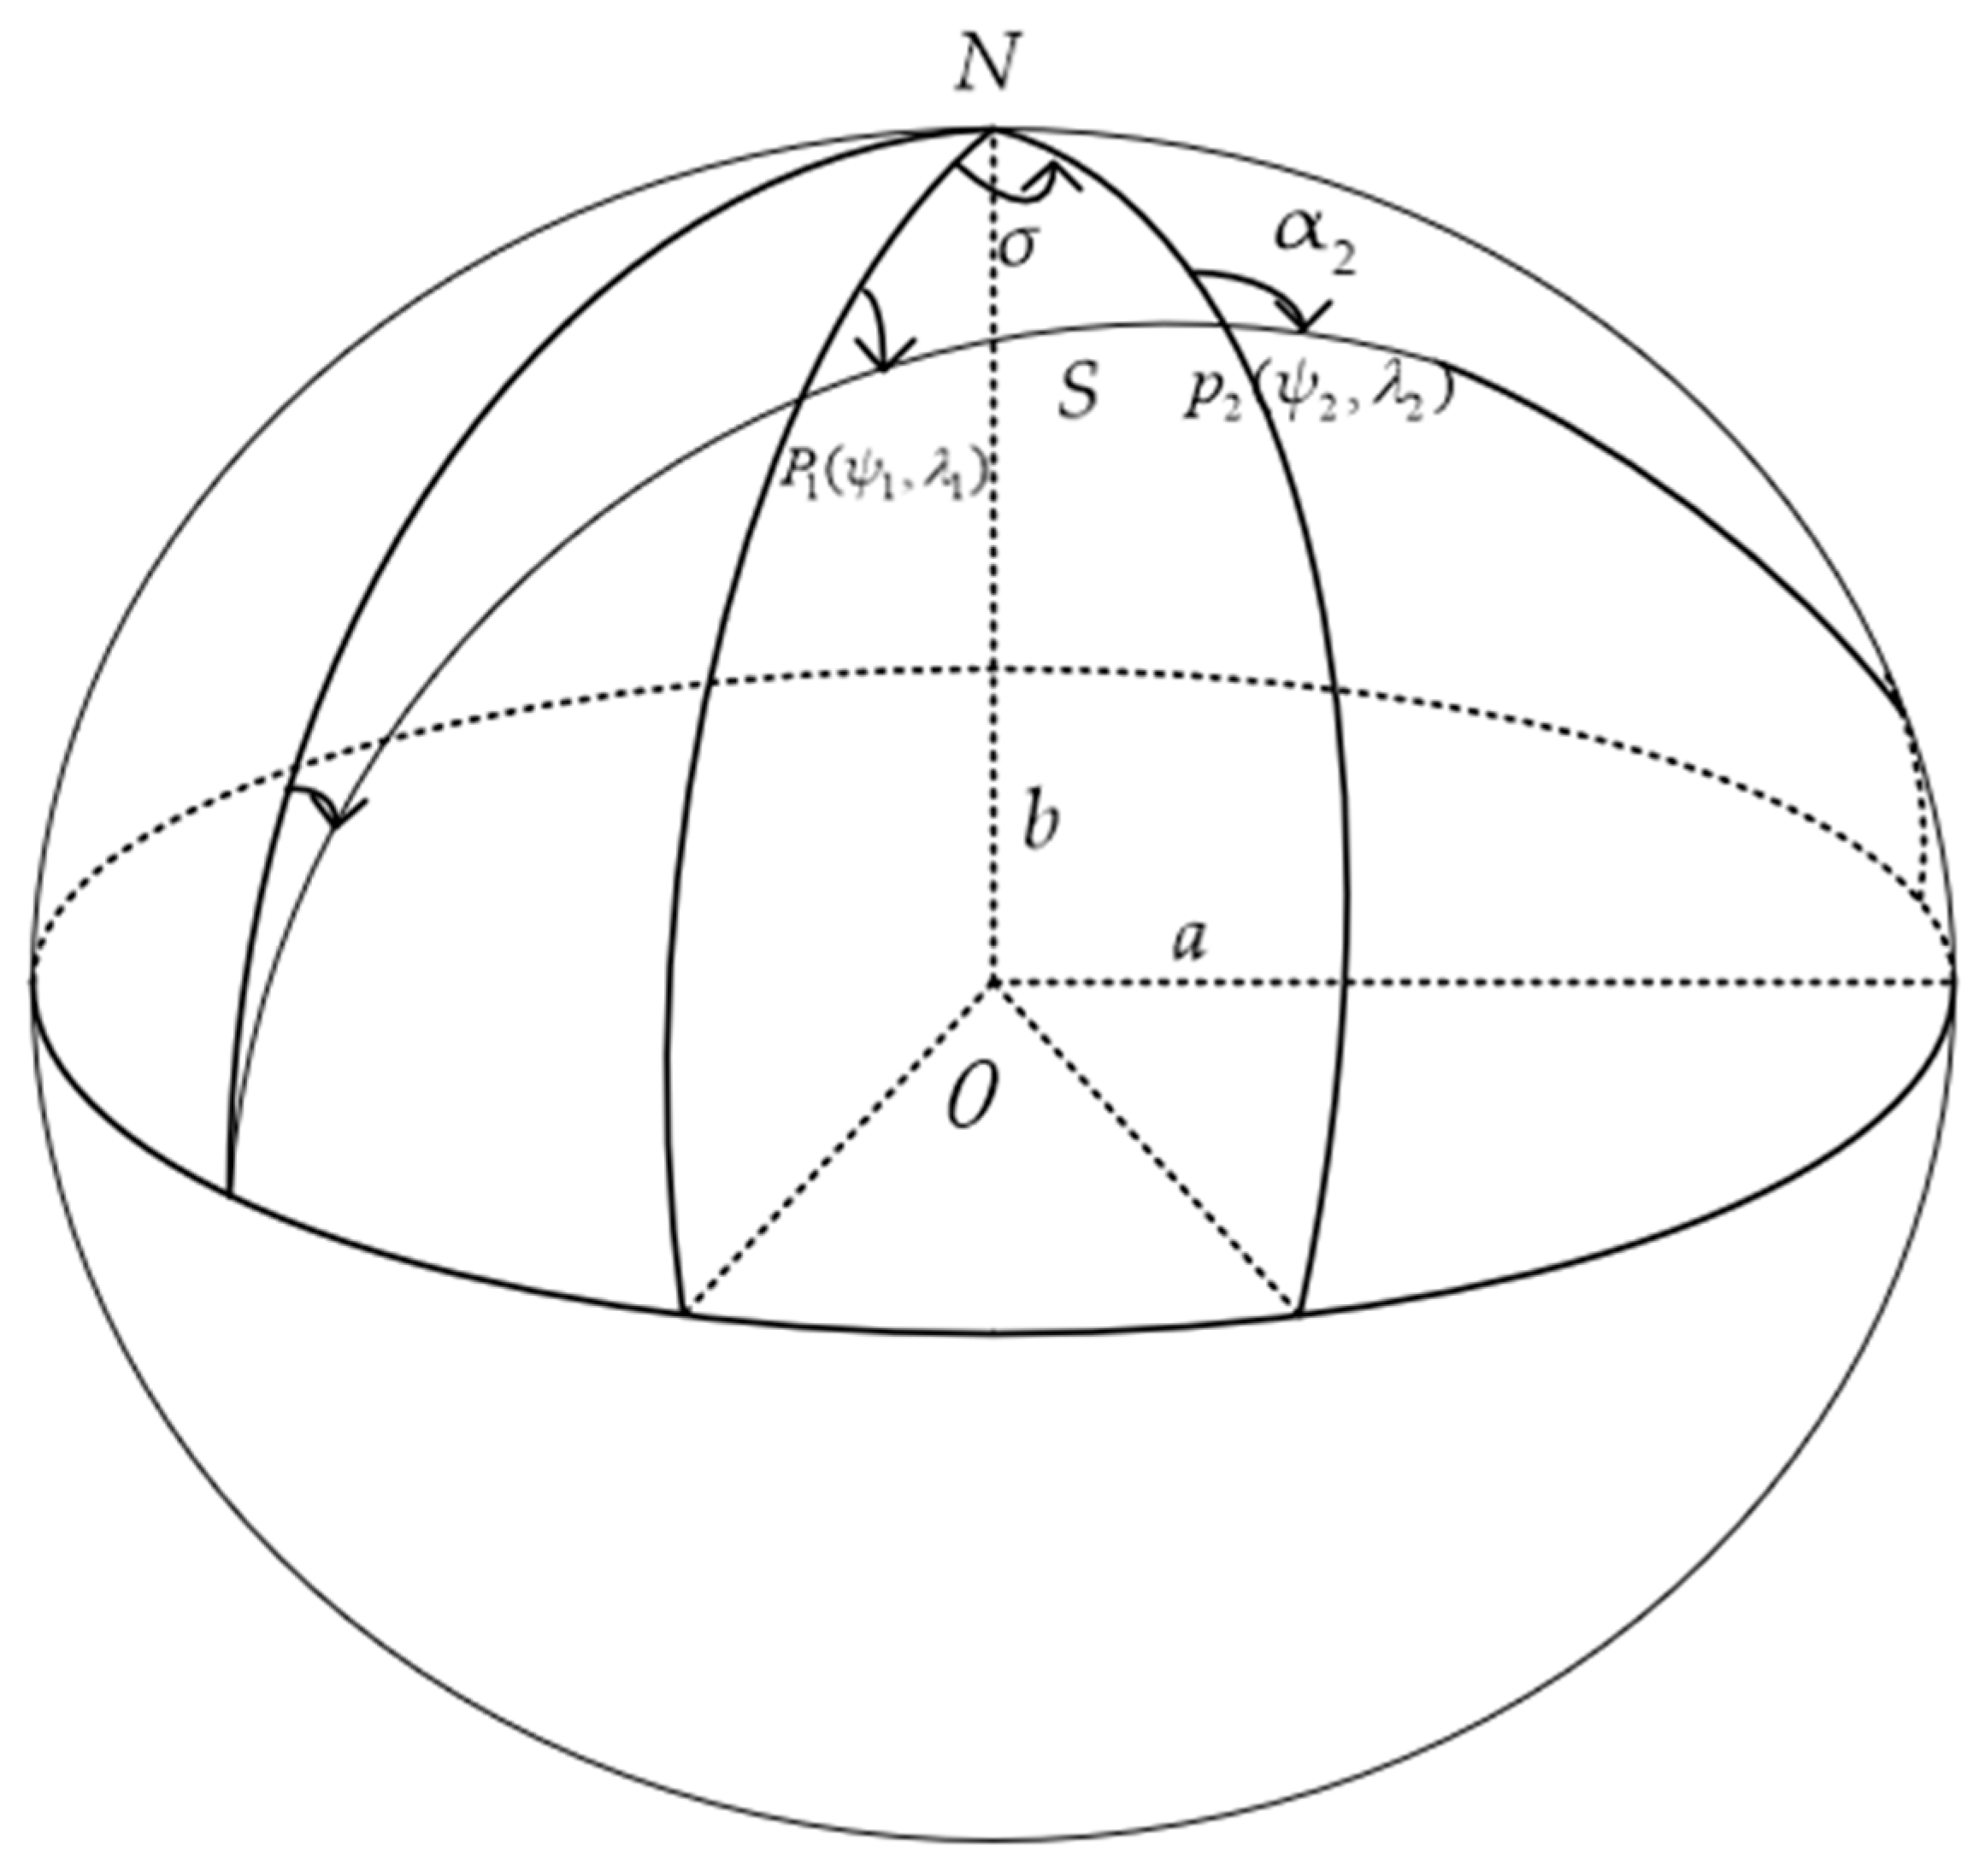
The target ship data sent from the console include the ship’s geographic coordinates, which must be converted into screen coordinates through a coordinate transformation. This study uses a two-step method: first converting the geographic coordinates into polar coordinates relative to the radar and then converting the polar coordinates into screen coordinates. This approach minimizes conversion errors. The key is converting the geographic coordinates into polar coordinates centered on the radar’s location. In a polar coordinate system, a point’s position is determined by its radial distance ρ and angle θ . For the target ship, the radial distance and angle correspond to its distance and bearing relative to the radar. Thus, calculating the target ship’s distance and bearing relative to the radar provides its polar coordinates. In solving for azimuth and distance, this study uses the inverse Vincenty formula [40]. As shown in Figure 2, given the coordinates of points P 1 and P 2 , the steps to calculate the distance and azimuth between P 1 and P 2 using Vincenty’s inverse formula are as follows:
(1)
Input data: Given the latitude and longitude of two points, ψ 1 , λ 1 and ψ 2 , λ 2 , the flattening of the Earth’s ellipsoid f = a b a and the longitude difference between the two points λ = λ 1 λ 2 ;
(2)
Calculate the initial parameters: Convert the latitude to the auxiliary spherical latitude to simplify the calculations on the ellipsoid:
U 1 = tan 1 ( 1 f ) tan ψ 1
U 2 = tan 1 ( 1 f ) tan ψ 2
where U 1 and U 2 are latitudes on the auxiliary spherical surface, also known as the corrected latitudes.
(3)
Iterative solution: Based on the spherical trigonometry formula, the following equations can be derived:
y = sin σ = ( cos ( U 2 ) sin ( λ ) + ( cos ( U 1 ) sin ( U 2 ) sin ( U 1 ) cos ( U 2 ) cos ( λ ) ) 2
x = cos σ = sin ( U 1 ) sin ( U 2 ) + cos ( U 1 ) cos ( U 2 ) cos ( λ )
σ = tan 1 ( y / x )
(4)
Calculation of geodesic distance: Using the iterative results, the auxiliary sphere solution is corrected to the ellipsoid by applying ellipsoidal correction terms. First, the coefficients M and N for the geodesic length are calculated as follows:
M = 1 + u 2 16384 ( 4096 + u 2 ( 768 + u 2 ( 320 175 u 2 ) ) )
N = u 2 1024 ( 256 + u 2 ( 128 + u 2 ( 74 47 u 2 ) ) )
where
u 2 = ( a 2 b 2 ) / b 2 cos 2 ( A )
Calculate the correction term for the arc length between two points on the auxiliary sphere:
Δ σ = N sin σ ( cos ( 2 σ m ) + N 4 ( cos σ ( 1 + 2 cos 2 ( 2 σ m ) ) N 6 cos ( 2 σ m ) ( 3 + 4 cos 2 ( 2 σ m ) ( 3 + 4 sin 2 σ ) ) )
(5)
Calculate the geodesic arc length S and the azimuth angle θ :
S = b M ( σ Δ σ )
θ = tan 1 ( cos ( x 2 ) sin ( λ ) cos ( x 1 ) sin ( x 2 ) sin ( x 1 ) cos ( x 2 ) cos ( λ ) )
The geodesic distance S and the initial azimuth angle θ are ultimately obtained and stored in polar coordinate form. The screen coordinates are then determined through a translation transformation. Once the target ship’s screen coordinates are obtained, the heading is used to calculate the incident angle of the electromagnetic wave, which determines the RCS value at the current angle.
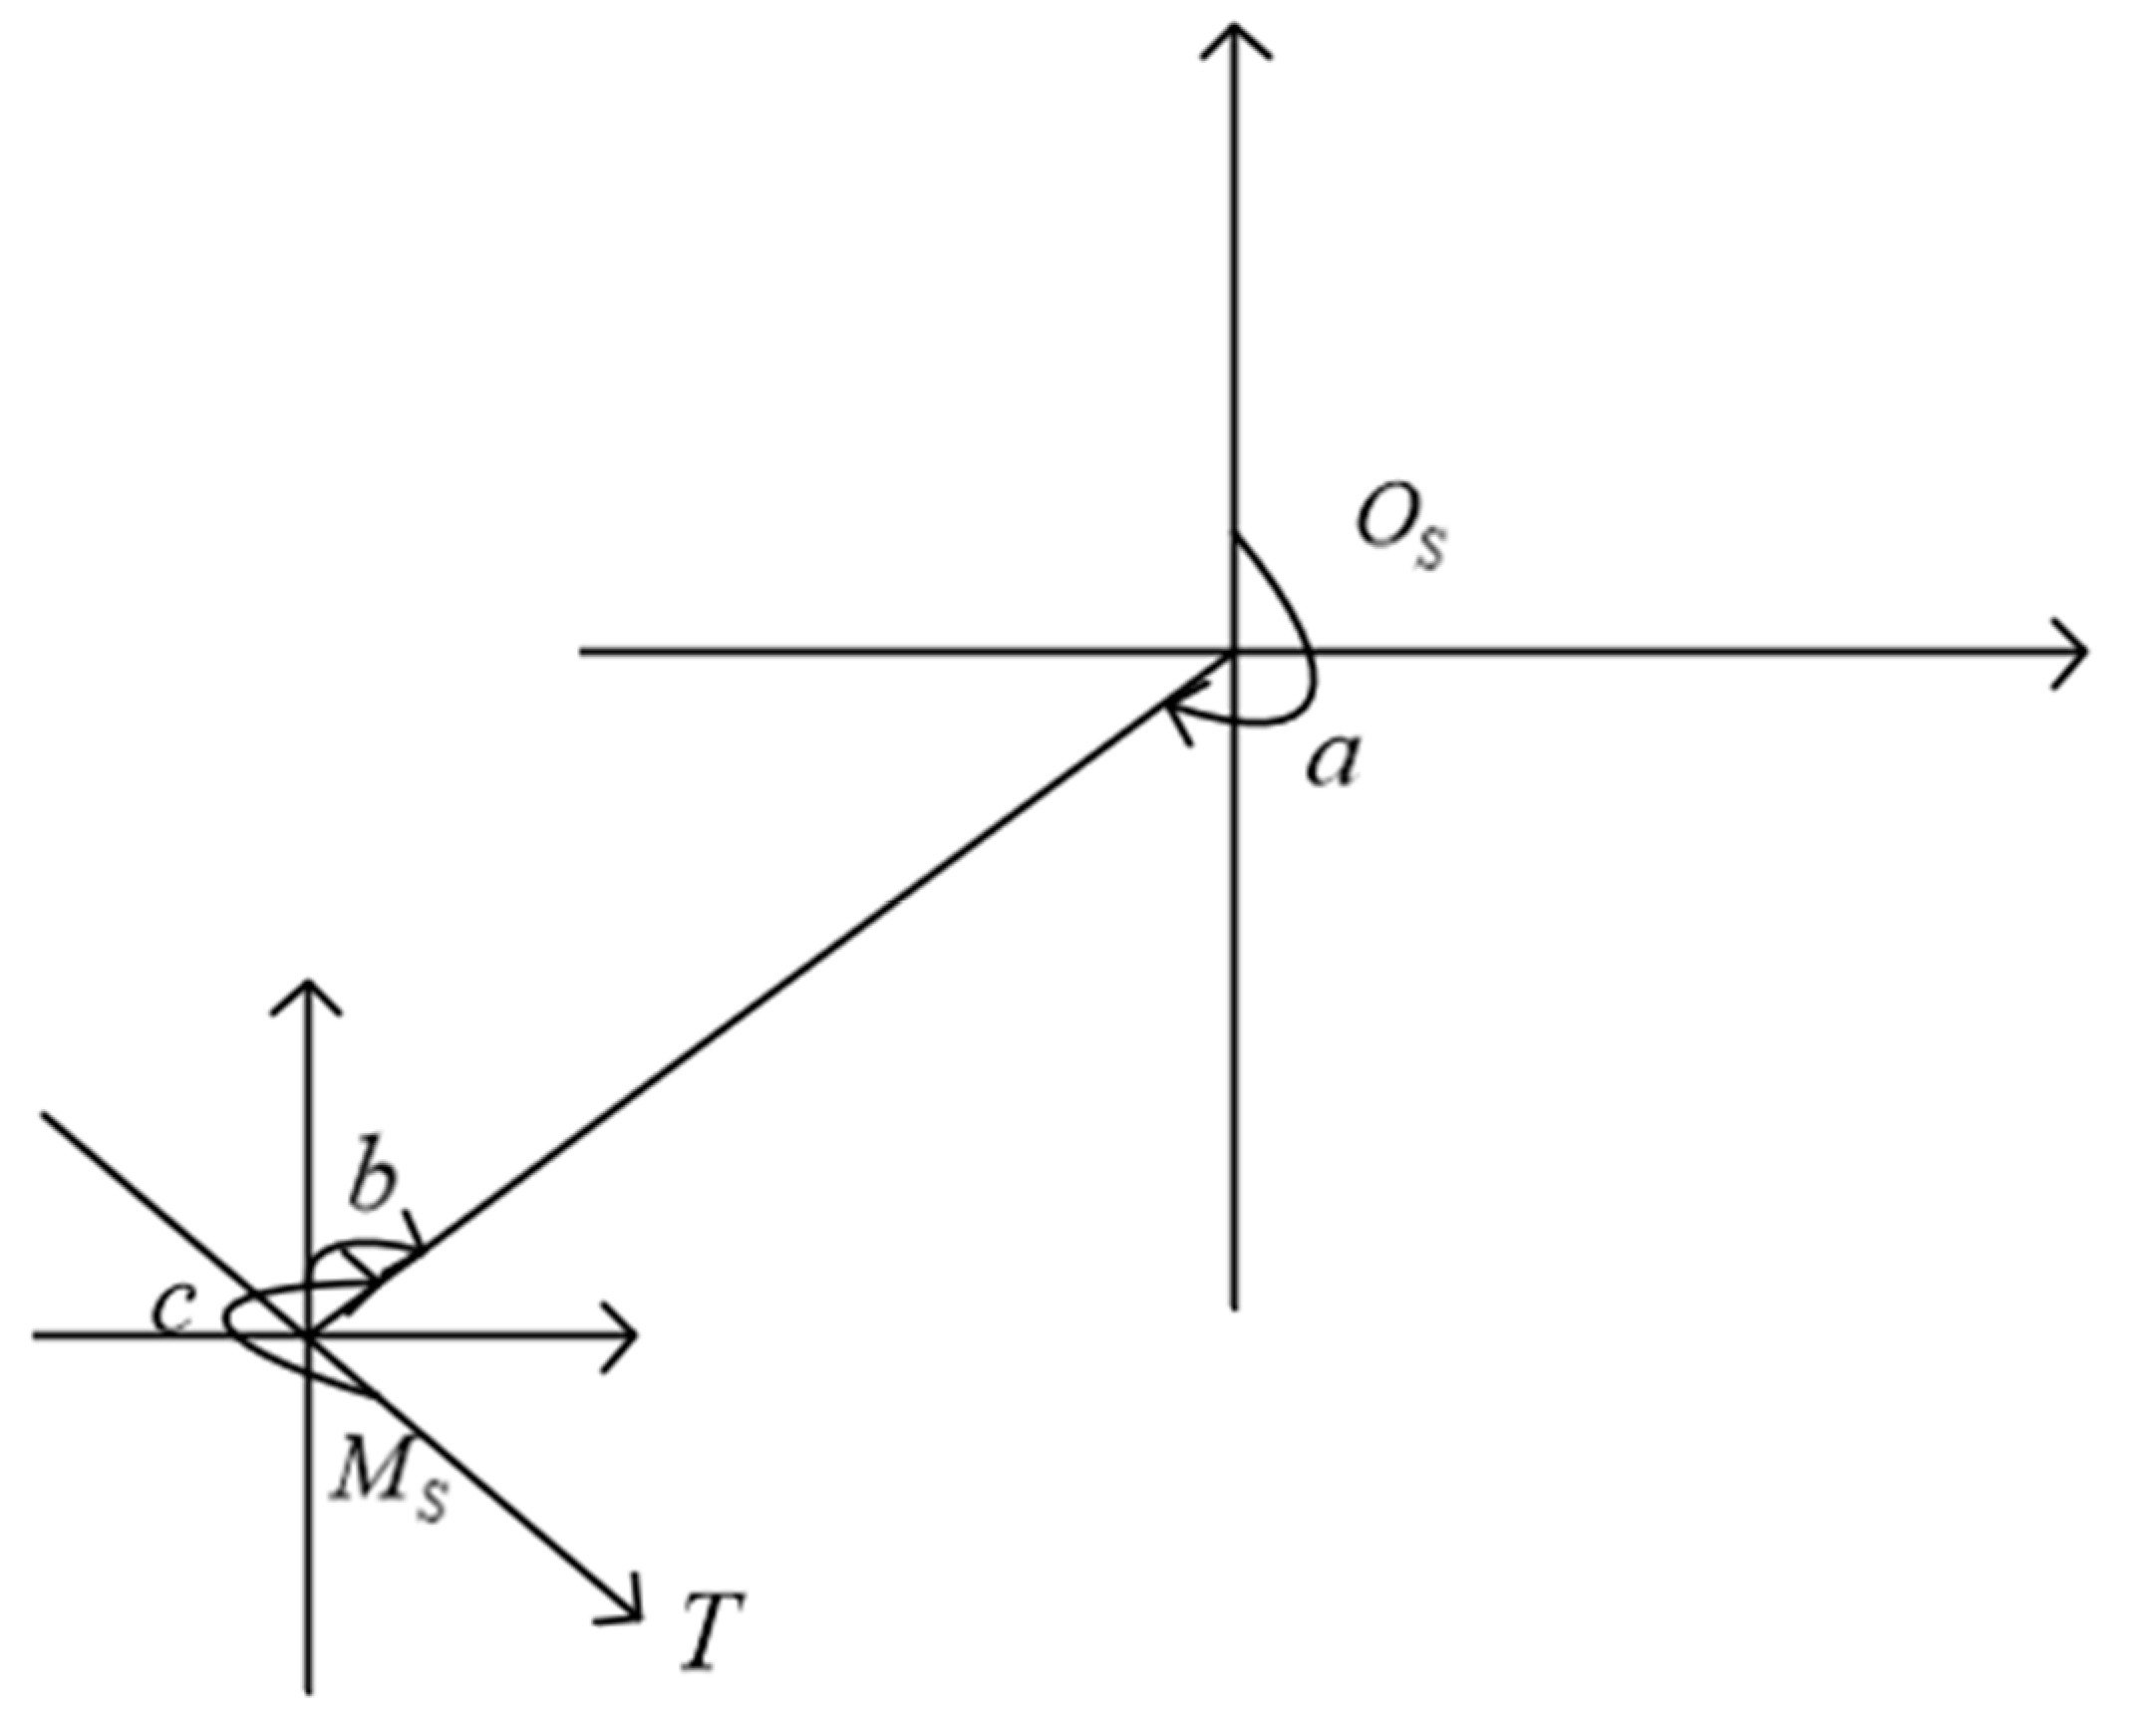
The calculation process for the incident angle is shown in Figure 3. The radar is located at O S , and the target ship is located at M S . The bearing angle of the target ship relative to the radar is a , and the target ship’s heading is T . Let the radar’s bearing relative to the target ship be b , and the incident angle of the radar wave be c . The first step is to transform the coordinate system, changing it from the one with the radar’s origin O S to the one with the origin at M S , as described in Equation (19). Then, in the new coordinate system, the angle between the target ship’s heading T and the radar’s azimuth relative to the target ship b is calculated, as shown in Equation (20).
b = ( a + 180 ) mod 360 °
c = ( b T ) mod 360 °
where mod is the modulus operator, and c represents the electromagnetic wave incident angle from the radar.
Using these relationships, the current RCS value corresponding to the incident angle can be obtained.

3.2. Dynamic RCS Calculation for Target Ships

This study uses the PO method to solve the RCS of ships. The flowchart for the electromagnetic calculation and analysis of the target ship is shown in Figure 4.
Figure 4 illustrates the steps for calculating the ship’s RCS using FEKO 2024 software. By inputting the ship model, setting electromagnetic field parameters, generating the mesh, and configuring the appropriate solver, the RCS calculation is ultimately completed. After obtaining the RCS data, the results can be viewed and analyzed using PostFeko 2024, and they can also be exported as files for subsequent use.
After obtaining the omnidirectional RCS values of the target ship, the RCS value of the target ship at the current radar wave’s incident angle is determined. The peak RCS value from the omnidirectional RCS chart (usually obtained at the optimal incident angle) is selected as the reference value. The ratio coefficient σ n is then calculated to represent the relationship between the current RCS value and the reference value, as shown in Equation (21):
σ n = σ σ max
where σ represents the RCS value at the current angle and σ max represents the maximum RCS value of the ship.
This coefficient σ n can be used to dynamically adjust the RCS value for a more precise analysis of the radar target’s scattering characteristics.

3.3. Target Ship Echo Generation

After calculating the relevant information of the target ship, we adopted a method where the target ship’s profile is determined first, followed by graphical rendering to generate the target ship’s echo. Specifically, a custom transparent elliptical target ship control is created, and the ship’s information (including the screen coordinates and the RCS ratio coefficient) is bound to this control. Next, the size and shape of the target ship are adjusted using the RCS coefficient. The specific process is as follows: when σ n = 1 , the echo is complete and undistorted. As the coefficient decreases, the integrity of the target ship’s echo gradually diminishes, and distortions appear, specifically manifesting as changes in the shape of the target ship’s echo. The size of the target ship echo is primarily influenced by two factors: the ship’s dimensions and the RCS value. The ship’s dimensions are fixed values and will not be discussed further herein. The effect of the RCS on the echo primarily affects its shape. When the incident angle is parallel to the ship’s heading, the echo’s width remains undistorted, but its length decreases, causing the echo to appear shorter and more rounded. When the incident angle is perpendicular to the ship’s heading, the echo’s length remains almost unchanged, but its width decreases, making the echo appear narrower. When the incident angle is between parallel and perpendicular to the ship’s heading, the degree of echo distortion depends on the angle between the incident angle and the ship’s heading. The specific relationship can be expressed by the following formulas:
a = a cos ( α ) + σ n a sin ( α )
b = b cos ( α ) + σ n b sin ( α )
where a and b represent the original length and width of the ship, respectively, a and b are the distorted length and width after deformation, and α is the angle between the radar wave’s incident angle and the ship’s heading.
Based on the above calculations, the new length and width of the target ship can be determined using the parametric equation of an ellipse. Specifically, the target ship’s contour will be represented by 36 points, equally spaced along the ellipse. The coordinates of these points are calculated using the following parametric equations for the ellipse:
x = a cos ( t )
y = b sin ( t )
where x and y are the coordinates of the boundary points of the closed polygon, a is the semi-major axis of the ellipse, b is the semi-minor axis, and t is the angle.
The angle increases sequentially from 0° to 360° at 10-degree intervals. Using these parameters, the coordinates of each boundary point of the target ship’s contour are calculated and stored in a collection. After determining the contour shape of the target ship, a custom control is used to bind the target ship’s information, such as heading, bearing, and distance. Through rotation and translation transformations, the final appearance of the target ship on the screen is obtained. Finally, the vertex coordinates of the control are stored in a collection, and the echo image of the target ship is generated using a scan-line intersection algorithm.

4. Simulation Results and Discussion

4.1. Target Ship RCS Simulation Results

In this study, we selected three common types of target ships, bulk carriers, container ships, and fishing boats, based on the operational environment of ship navigation radars for simulation research. Table 1 presents the main dimensions and mesh data of the simulated ships. To enhance computational efficiency, the geometric models of the ships were simplified. The 3D geometric models of the ships constructed in this study are shown in Figure 5.
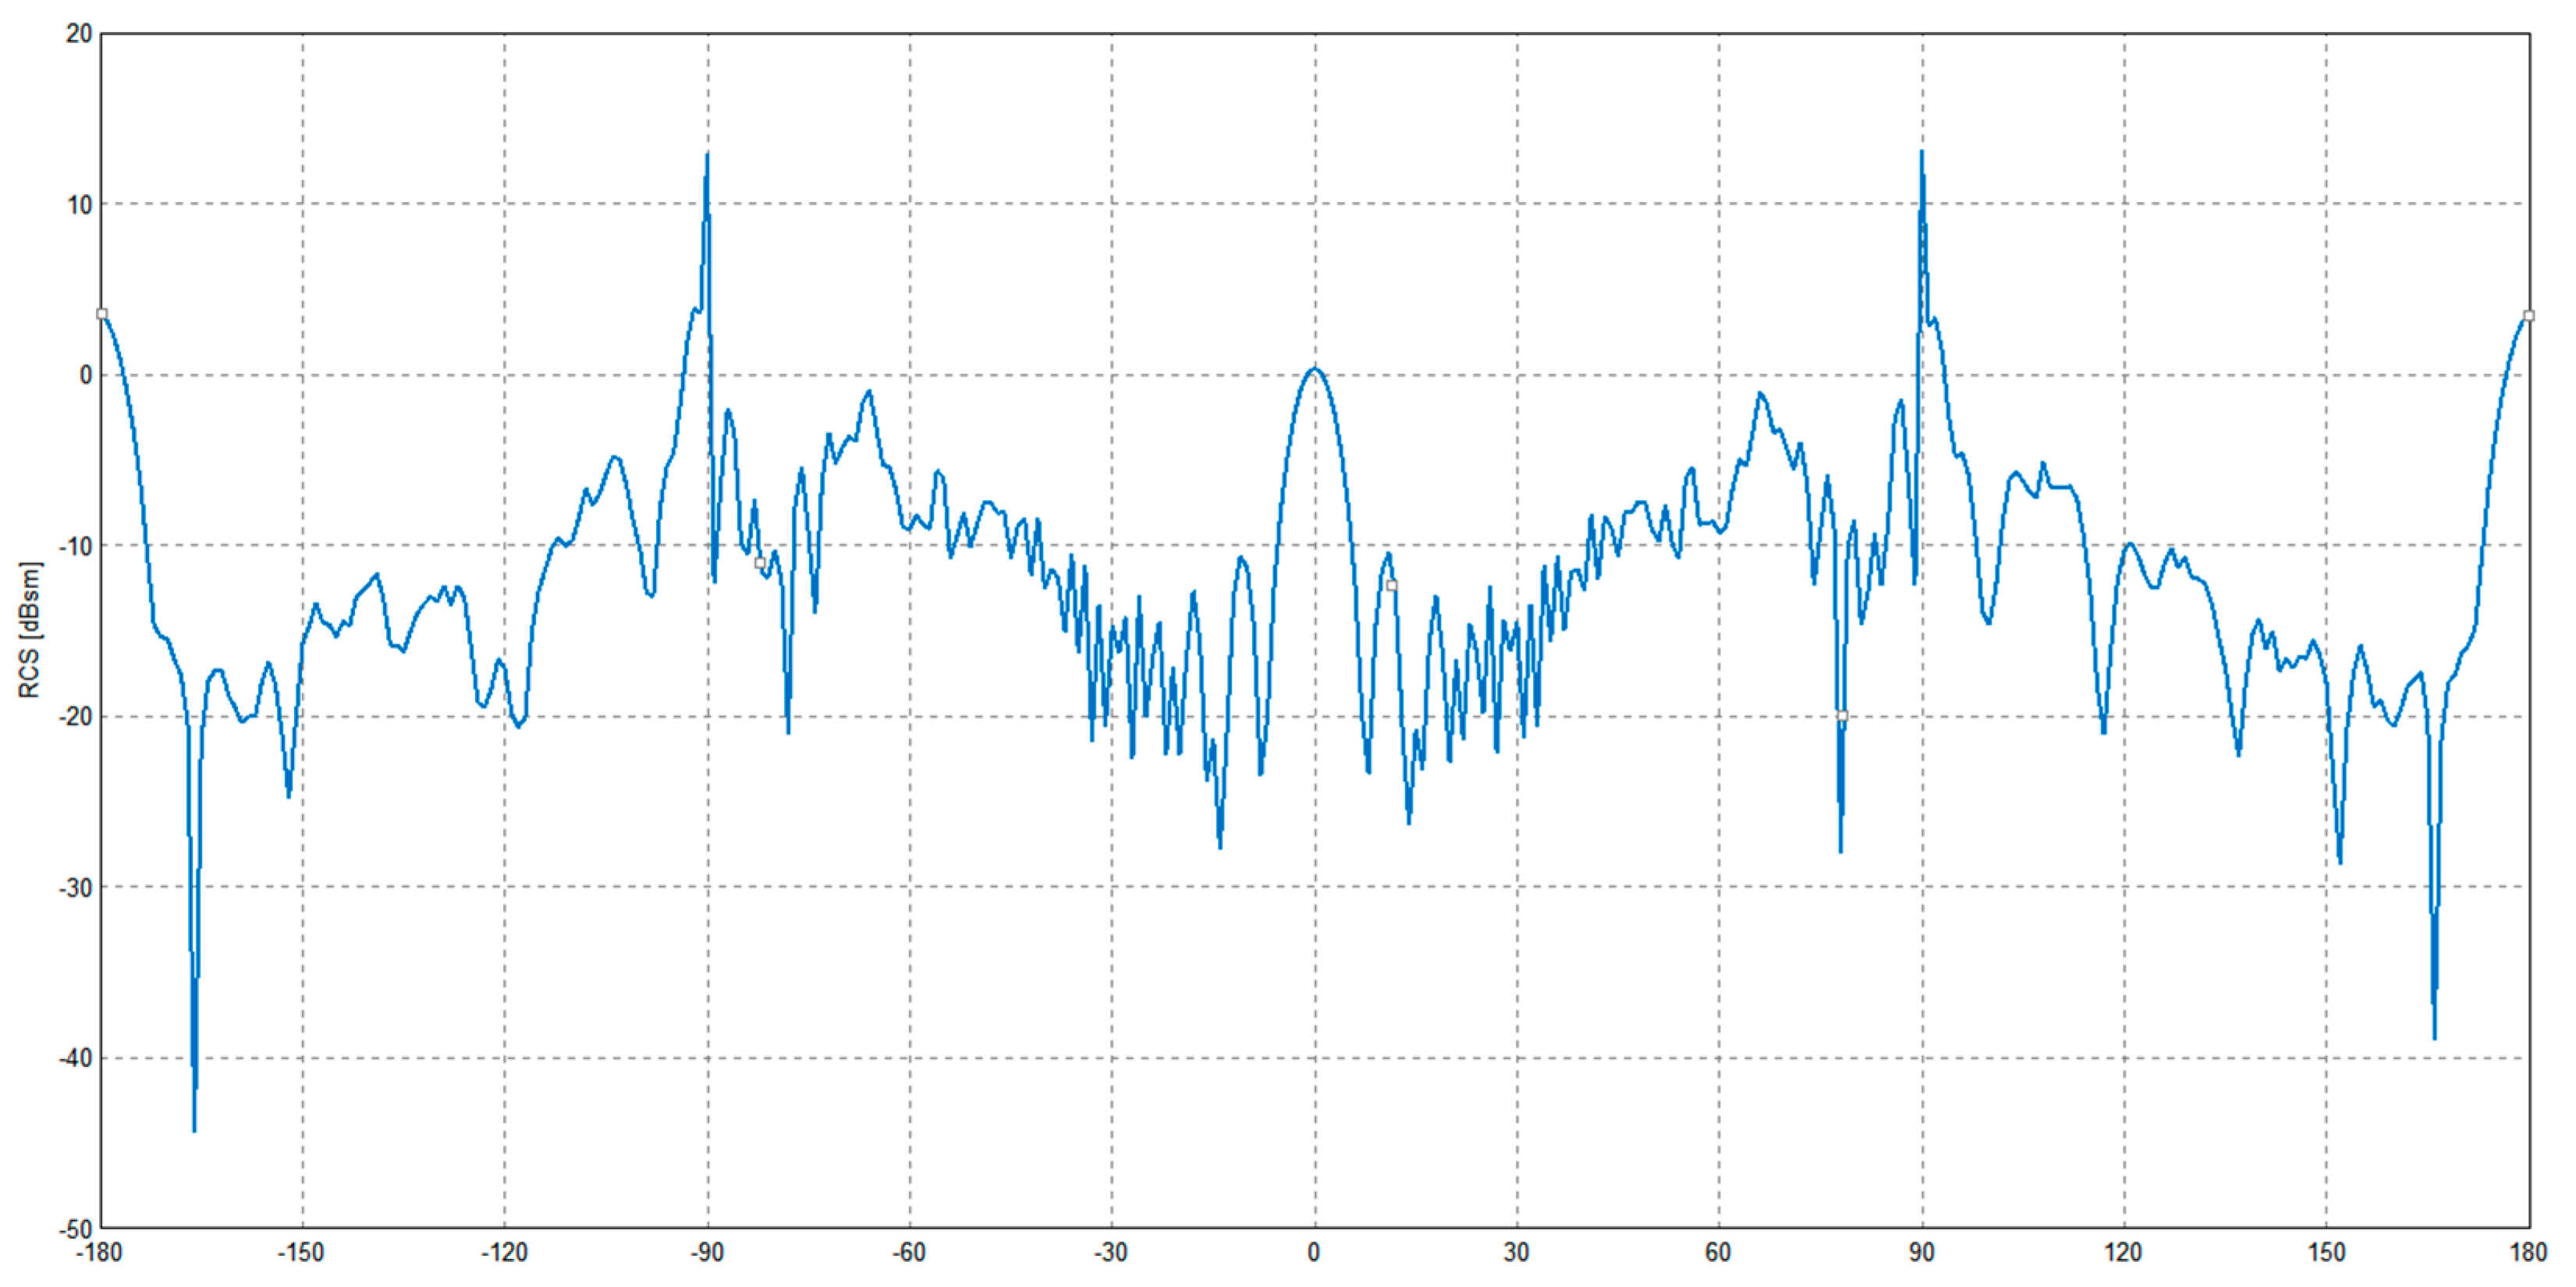
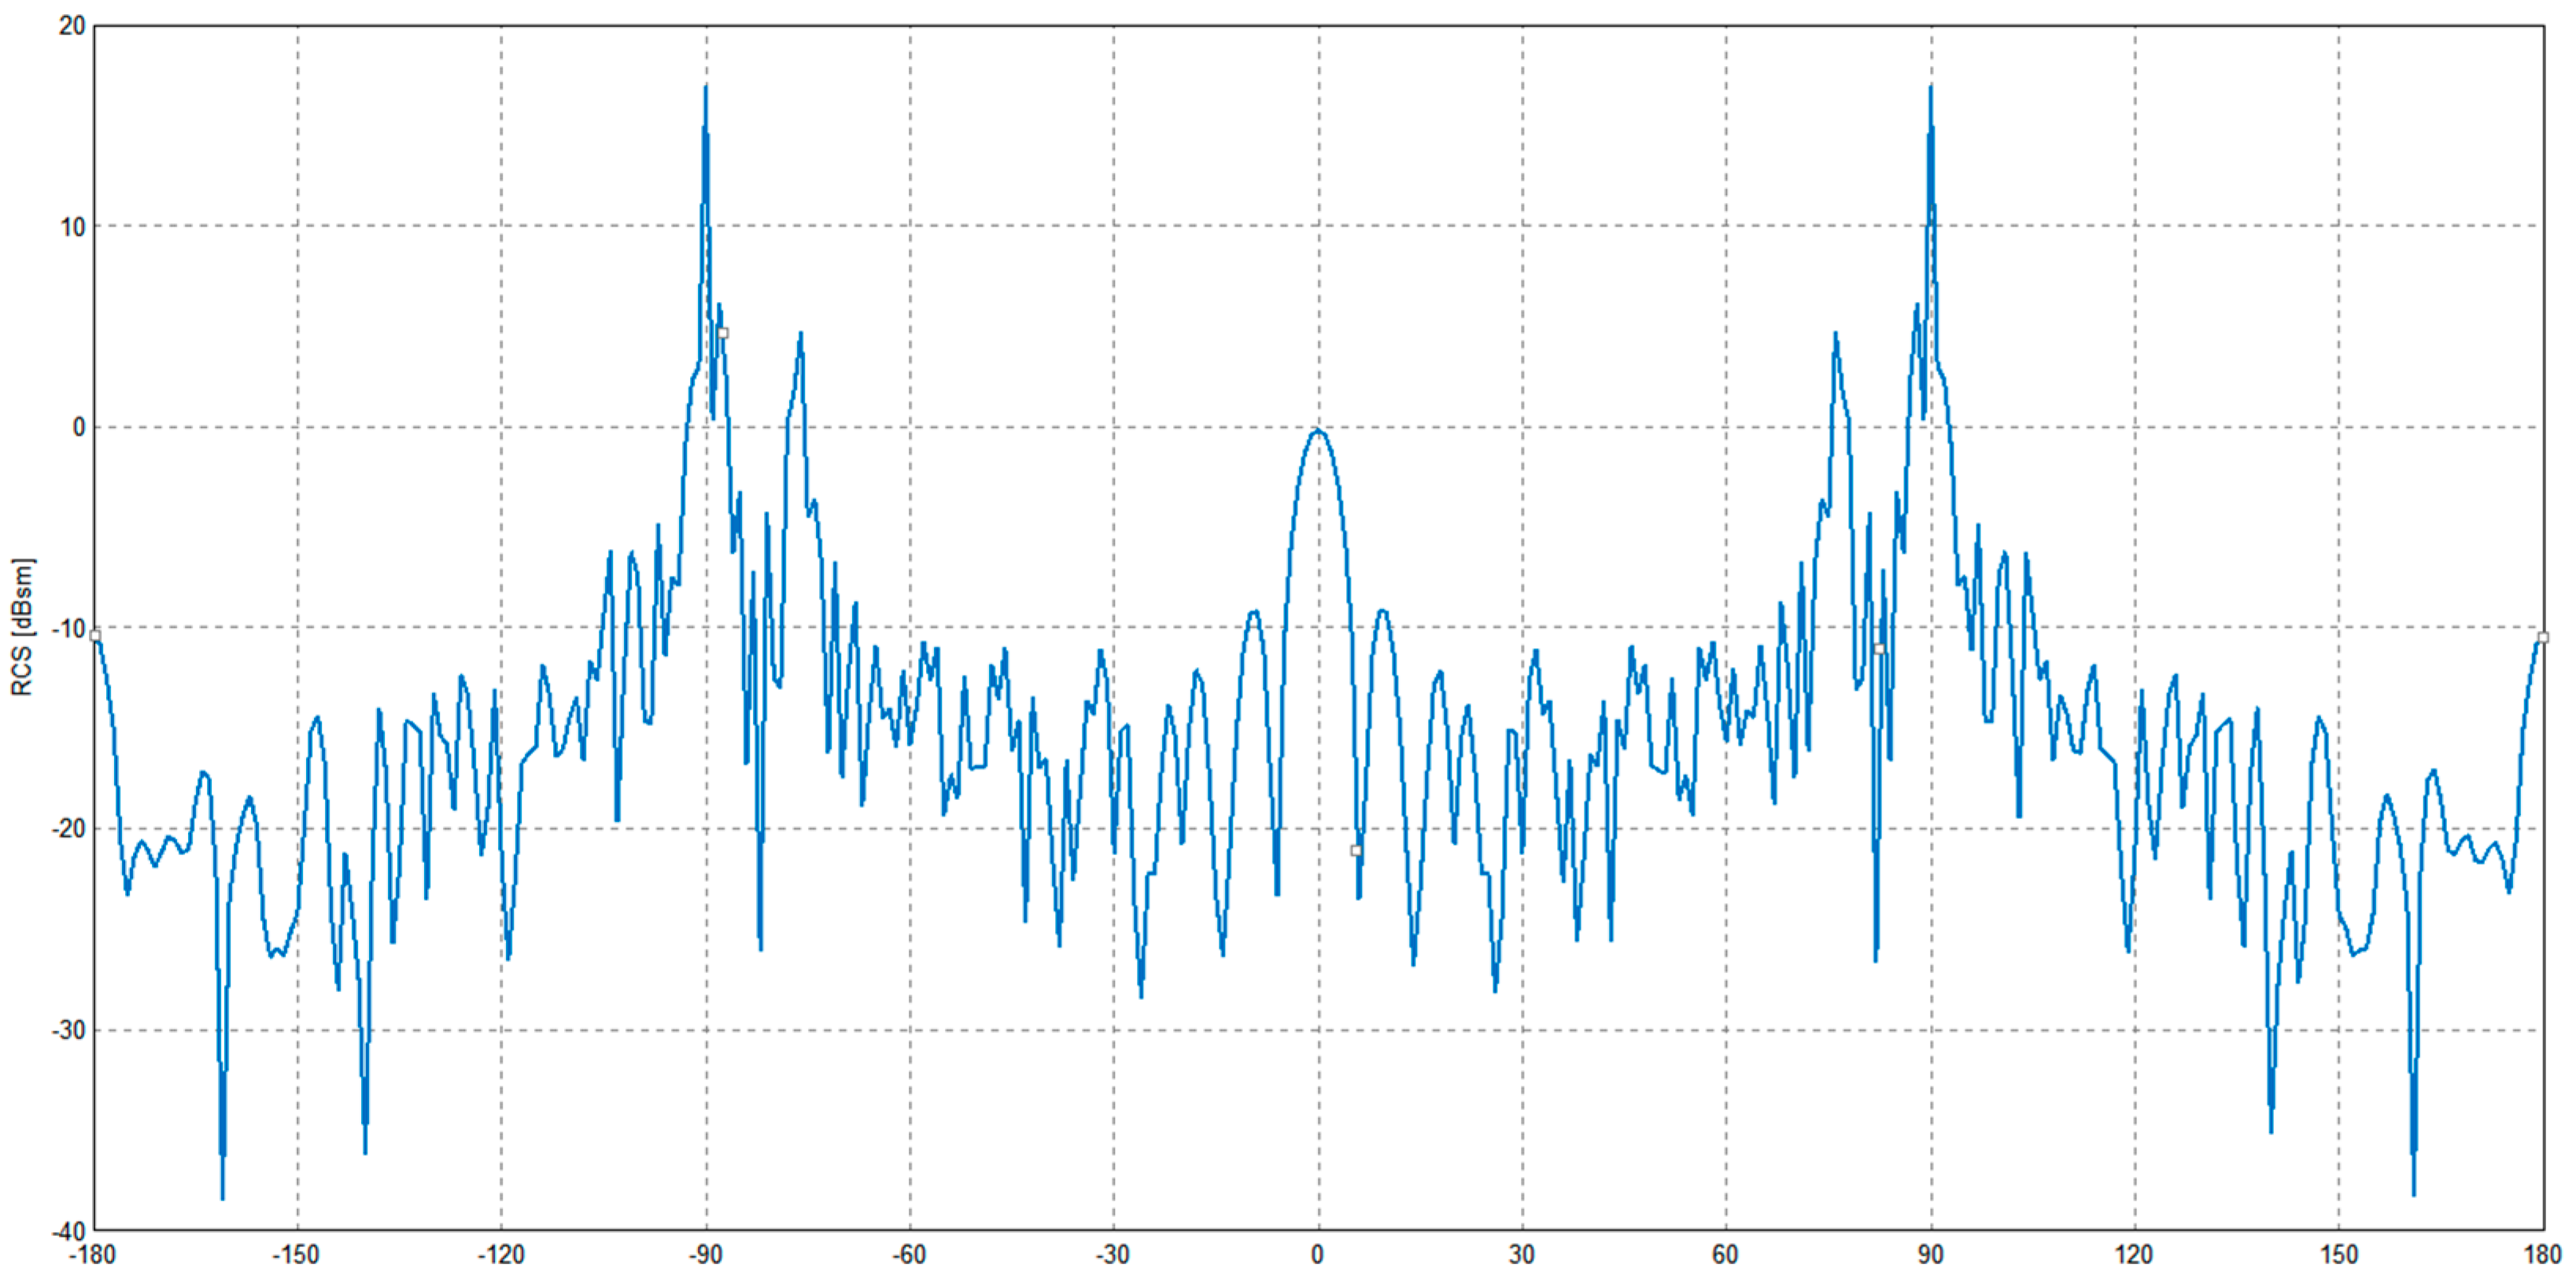
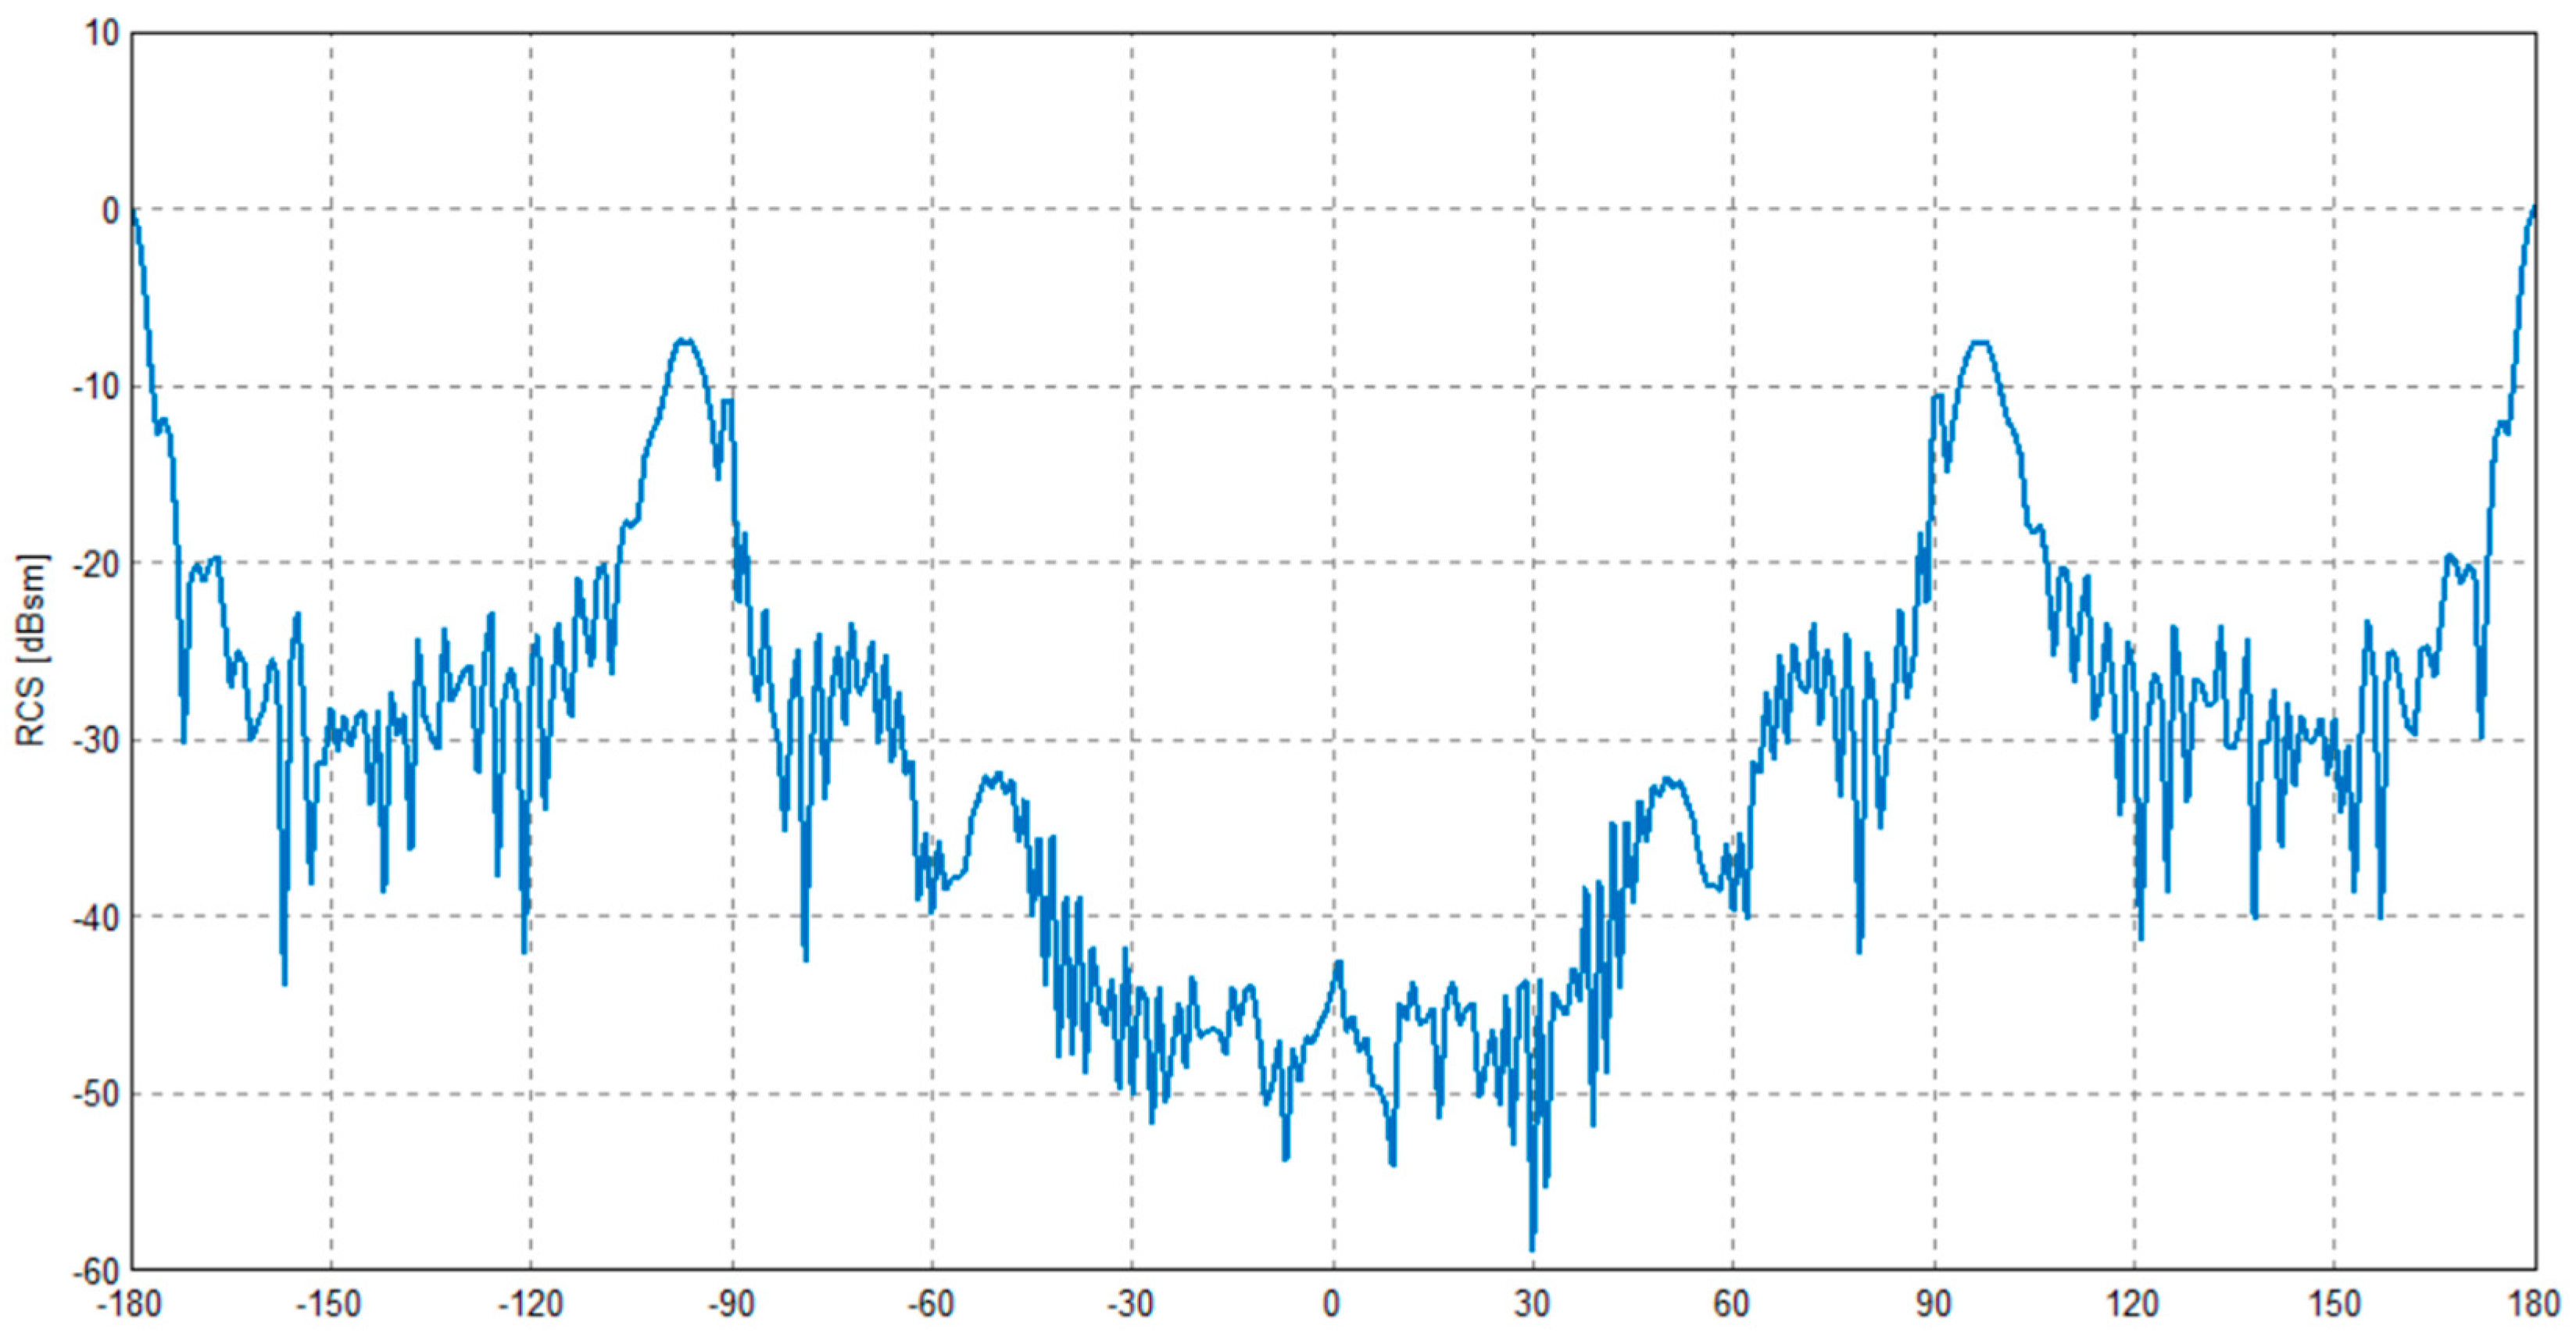
In terms of simulation parameters, the electromagnetic wave frequency was set to 9 GHz, with the incident angle ranging from −180° to 180°. Horizontal polarization was chosen as the polarization method. Single-station RCS simulations were performed for the ships, yielding omnidirectional RCS diagrams. The detailed simulation results are presented in Figure 6, Figure 7, Figure 8 and Figure 9.
From Figure 6, Figure 7, Figure 8 and Figure 9, the following characteristics of the ships’ RCS can be observed:
(1)
RCS Variation with Different Angles: The RCS is higher at 0°, 180°, and broadside directions. This occurs because at 0° and 180°, electromagnetic waves undergo specular reflection from the hull and superstructure, resulting in stronger reflected signals. In the broadside direction, the ship’s larger cross-sectional area also results in higher RCS values. In contrast, when electromagnetic waves are incident from the side, the grazing effect causes the incident waves to scatter in multiple directions, rather than directly reflecting back to the radar, resulting in a lower RCS in the side direction;
(2)
The Impact of Different Dimensions and Hull Shapes on the RCS: In terms of dimensions, the RCS of fishing vessels is significantly smaller compared to bulk carriers and container ships due to the much smaller hull size. Consequently, their RCS values exhibit considerable differences, with the RCS of bulk carriers and container ships typically ranging from −40 dB to −20 dB, while the RCS of fishing vessels falls within the range of −60 dB to 0 dB. Regarding hull shape, the RCS of bulk carriers, container ships, and fishing vessels exhibits distinct peak values at different angles. For bulk carriers, the superstructure is mainly concentrated at the bow and stern, with relatively open sides, resulting in RCS peaks at 0° and 180°. In contrast, container ships have a more complex hull shape designed for functional purposes, particularly along the sides, which leads to higher RCS values along the ship’s beam. On the other hand, fishing vessels, with their narrow bow and wider stern and sides, exhibit the lowest RCS at the bow and higher RCS values at the stern and beam.

4.2. Simulated Results of Target Ship Echo Images

All simulation results in this study were conducted based on the radar parameters specified in Table 2. To improve visualization, the size of the target ship’s echo image has been proportionally enlarged, while its attributes remain unchanged.

4.2.1. Simulated Echo Images of Target Ships at Different Incident Angles

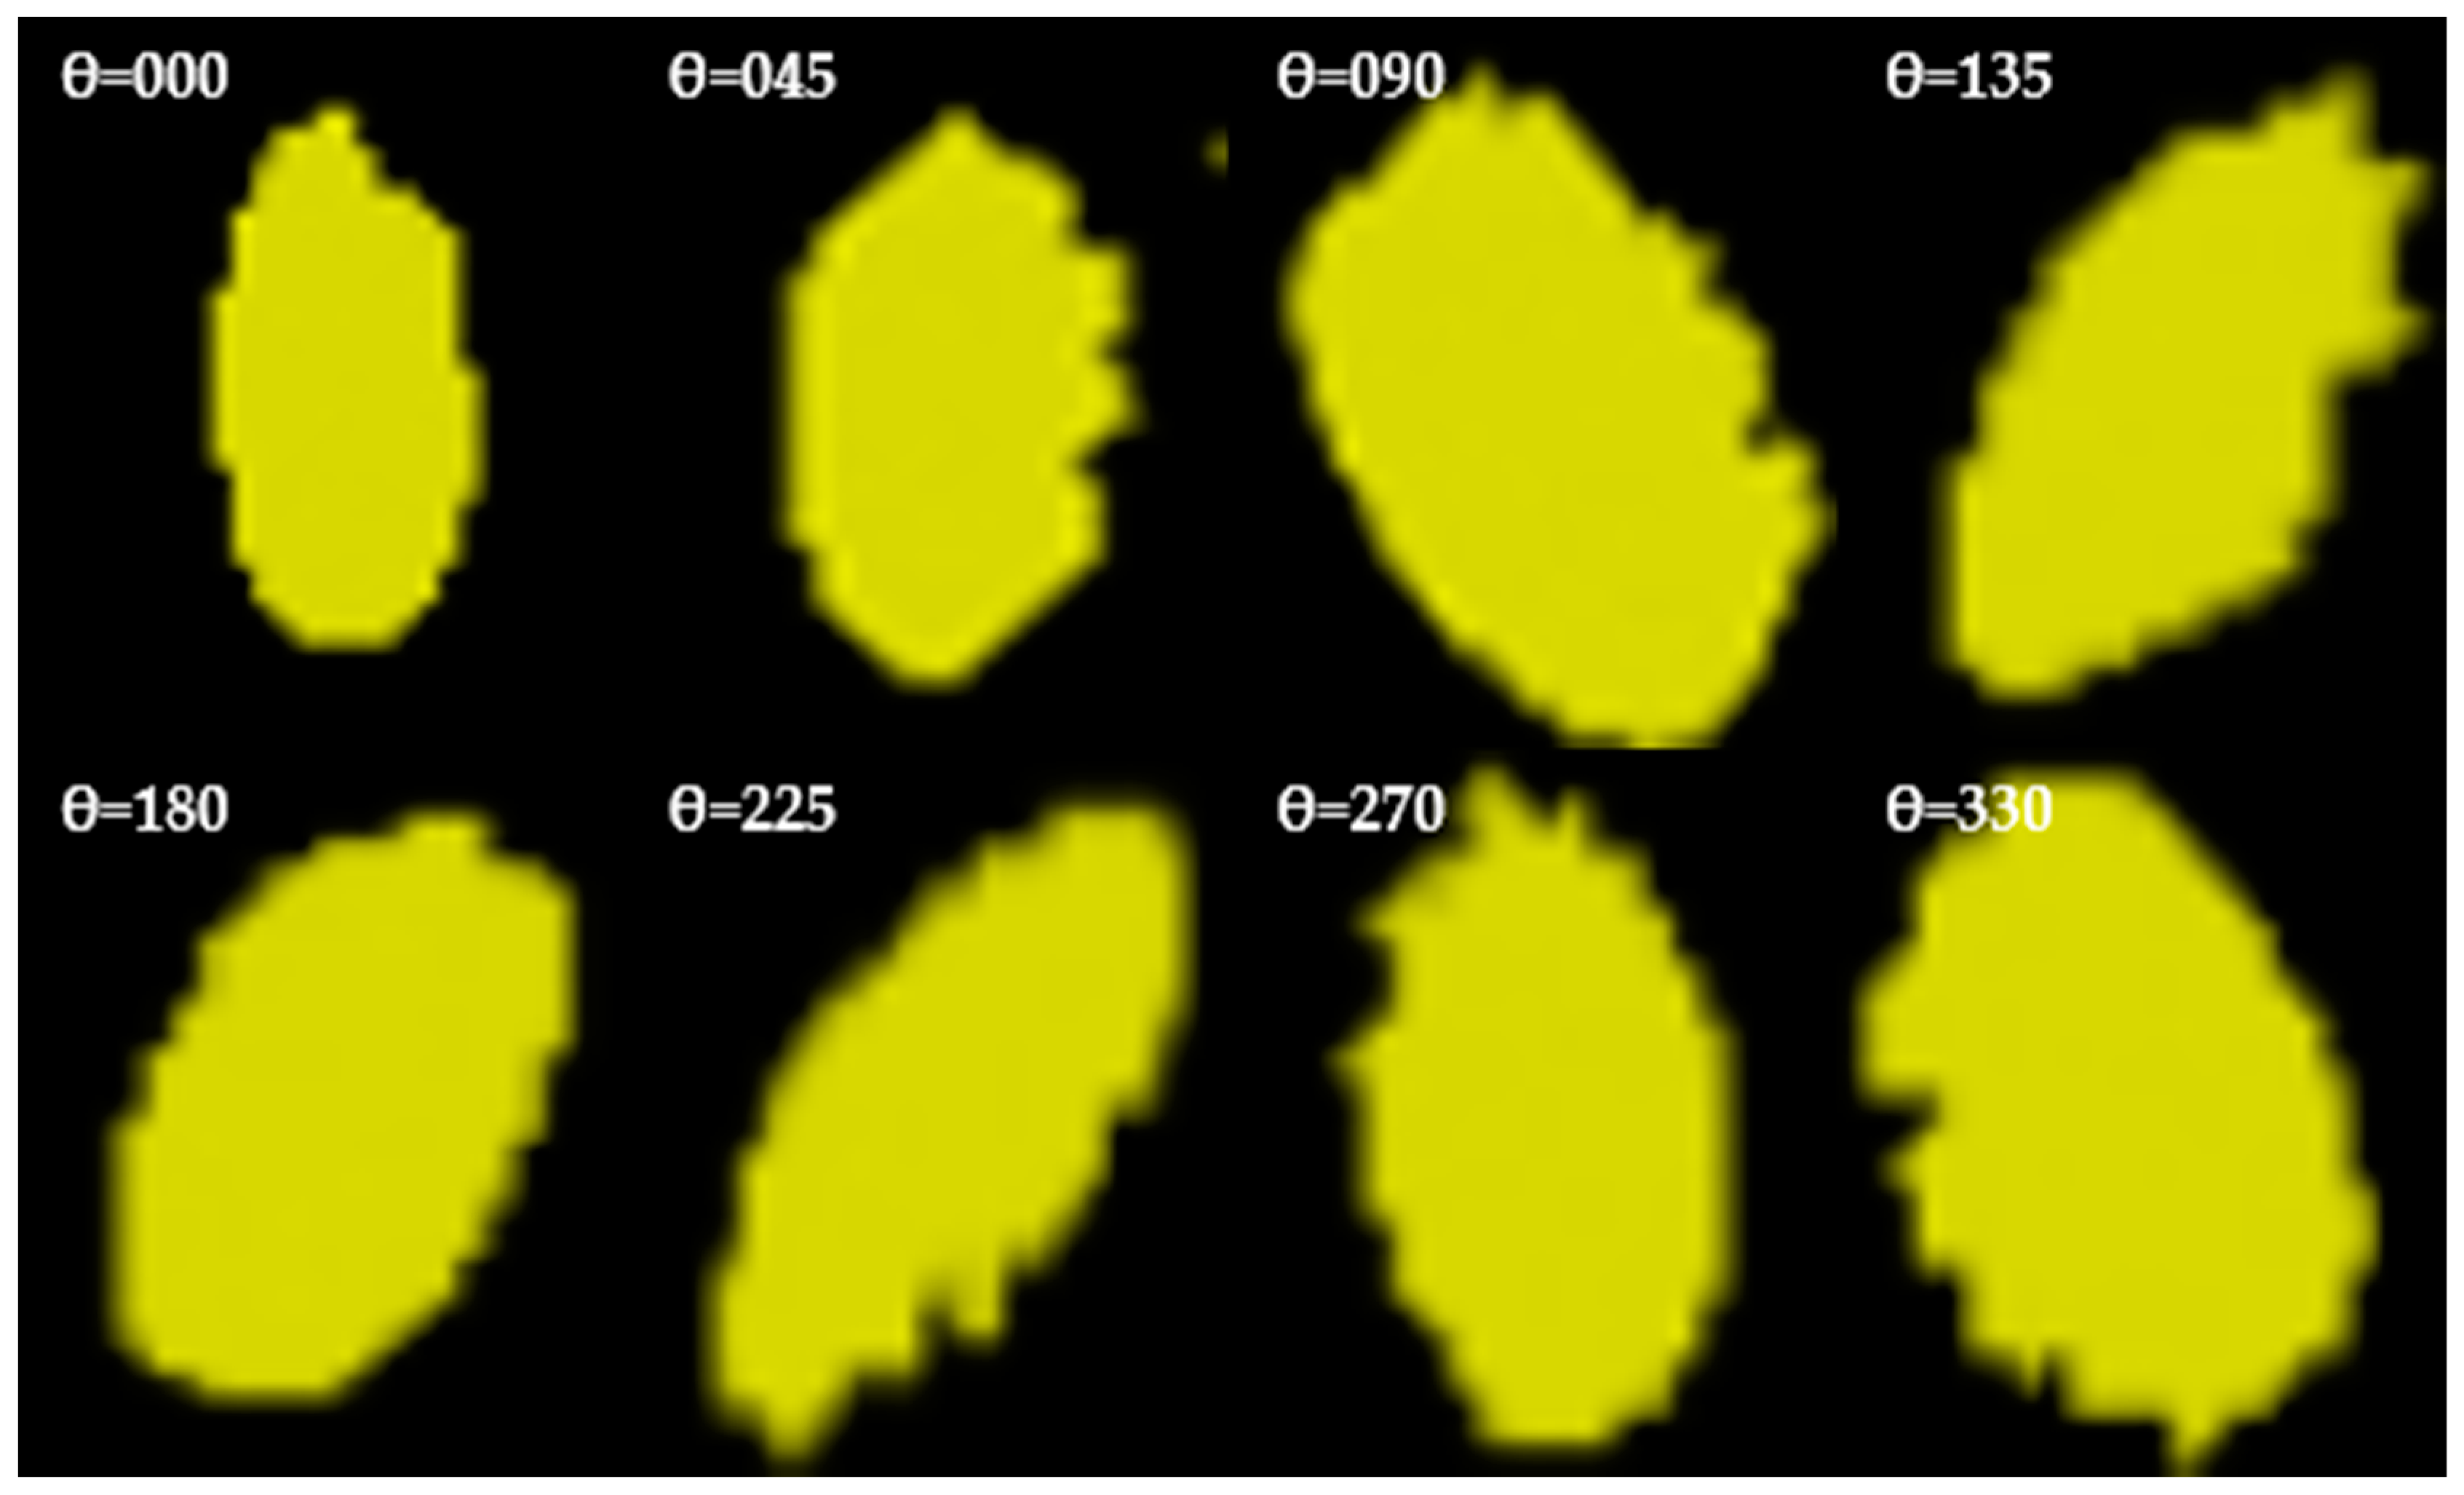
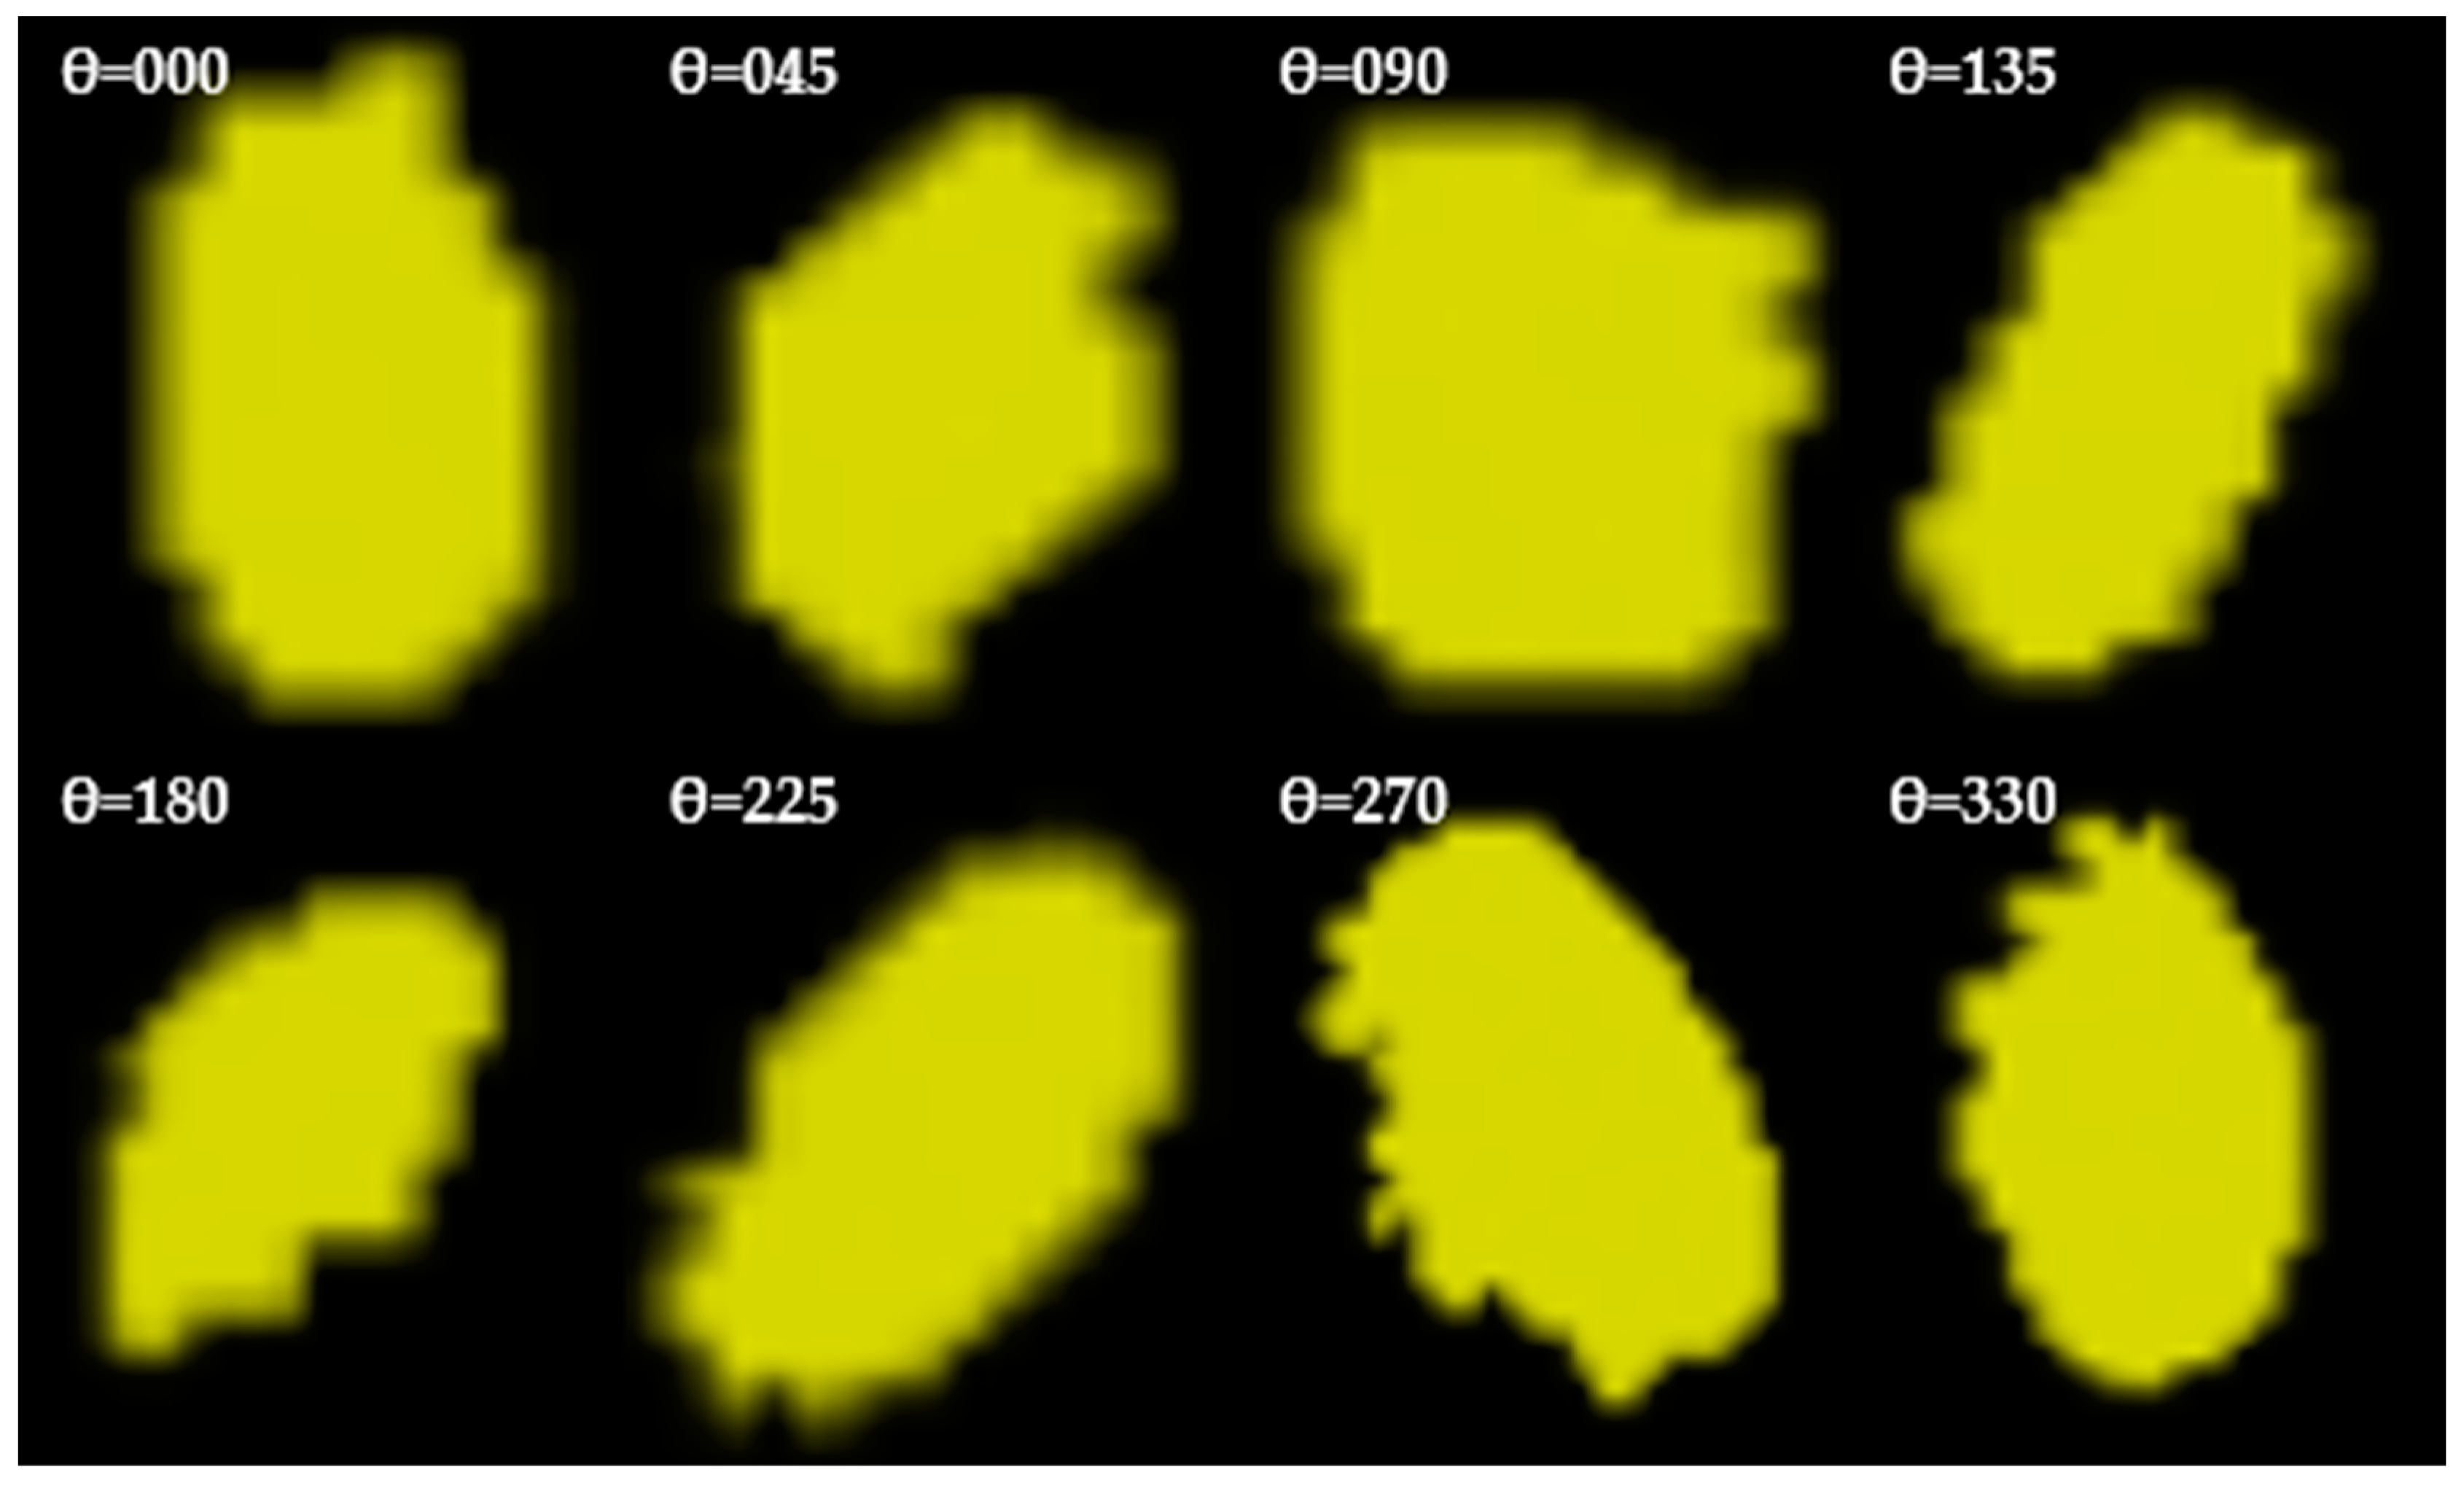
Two types of ships, a bulk carrier and a container ship, were selected for the simulation. The ship parameters are provided in Table 1, and both ships are positioned 3 nautical miles from the radar. Figure 10 and Figure 11 illustrate the echo images of the bulk carrier and container ship at different incident angles.
The RCS of the ship changes at different incident angles, affecting both the intensity and shape of the radar echoes. When the incident angles are 000, 090, 180, and 270, the electromagnetic waves are nearly perpendicular to the ship’s surface, resulting in strong specular reflections. This results in clearer and more complete echo images. When the incident angles are 045, 135, 225, and 330, the electromagnetic waves form acute or obtuse angles with the ship’s surface. In these cases, scattering effects dominate, significantly reducing the echo intensity and causing varying degrees of distortion in the echo shape, such as narrowing, shortening, or irregularity.
When comparing bulk carriers and container ships at the same incident angle, it was observed that the RCS peak of bulk carriers occurs at the bow and stern, while the RCS peak of container ships occurs at the beam. Therefore, the simulation images of bulk carriers at 000 and 180 exhibit the highest realism, while for container ships, the highest realism is observed at 090 and 270. Additionally, by comparing the ship models, it was found that the hull of bulk carriers is relatively narrower at the bow and stern, resulting in simpler echo images. In contrast, container ships have a wider midship section, resulting in more complex echo images, reflecting the differences in shape and size between the two.

4.2.2. Simulated Echo Images of Target Ships at Different Distances

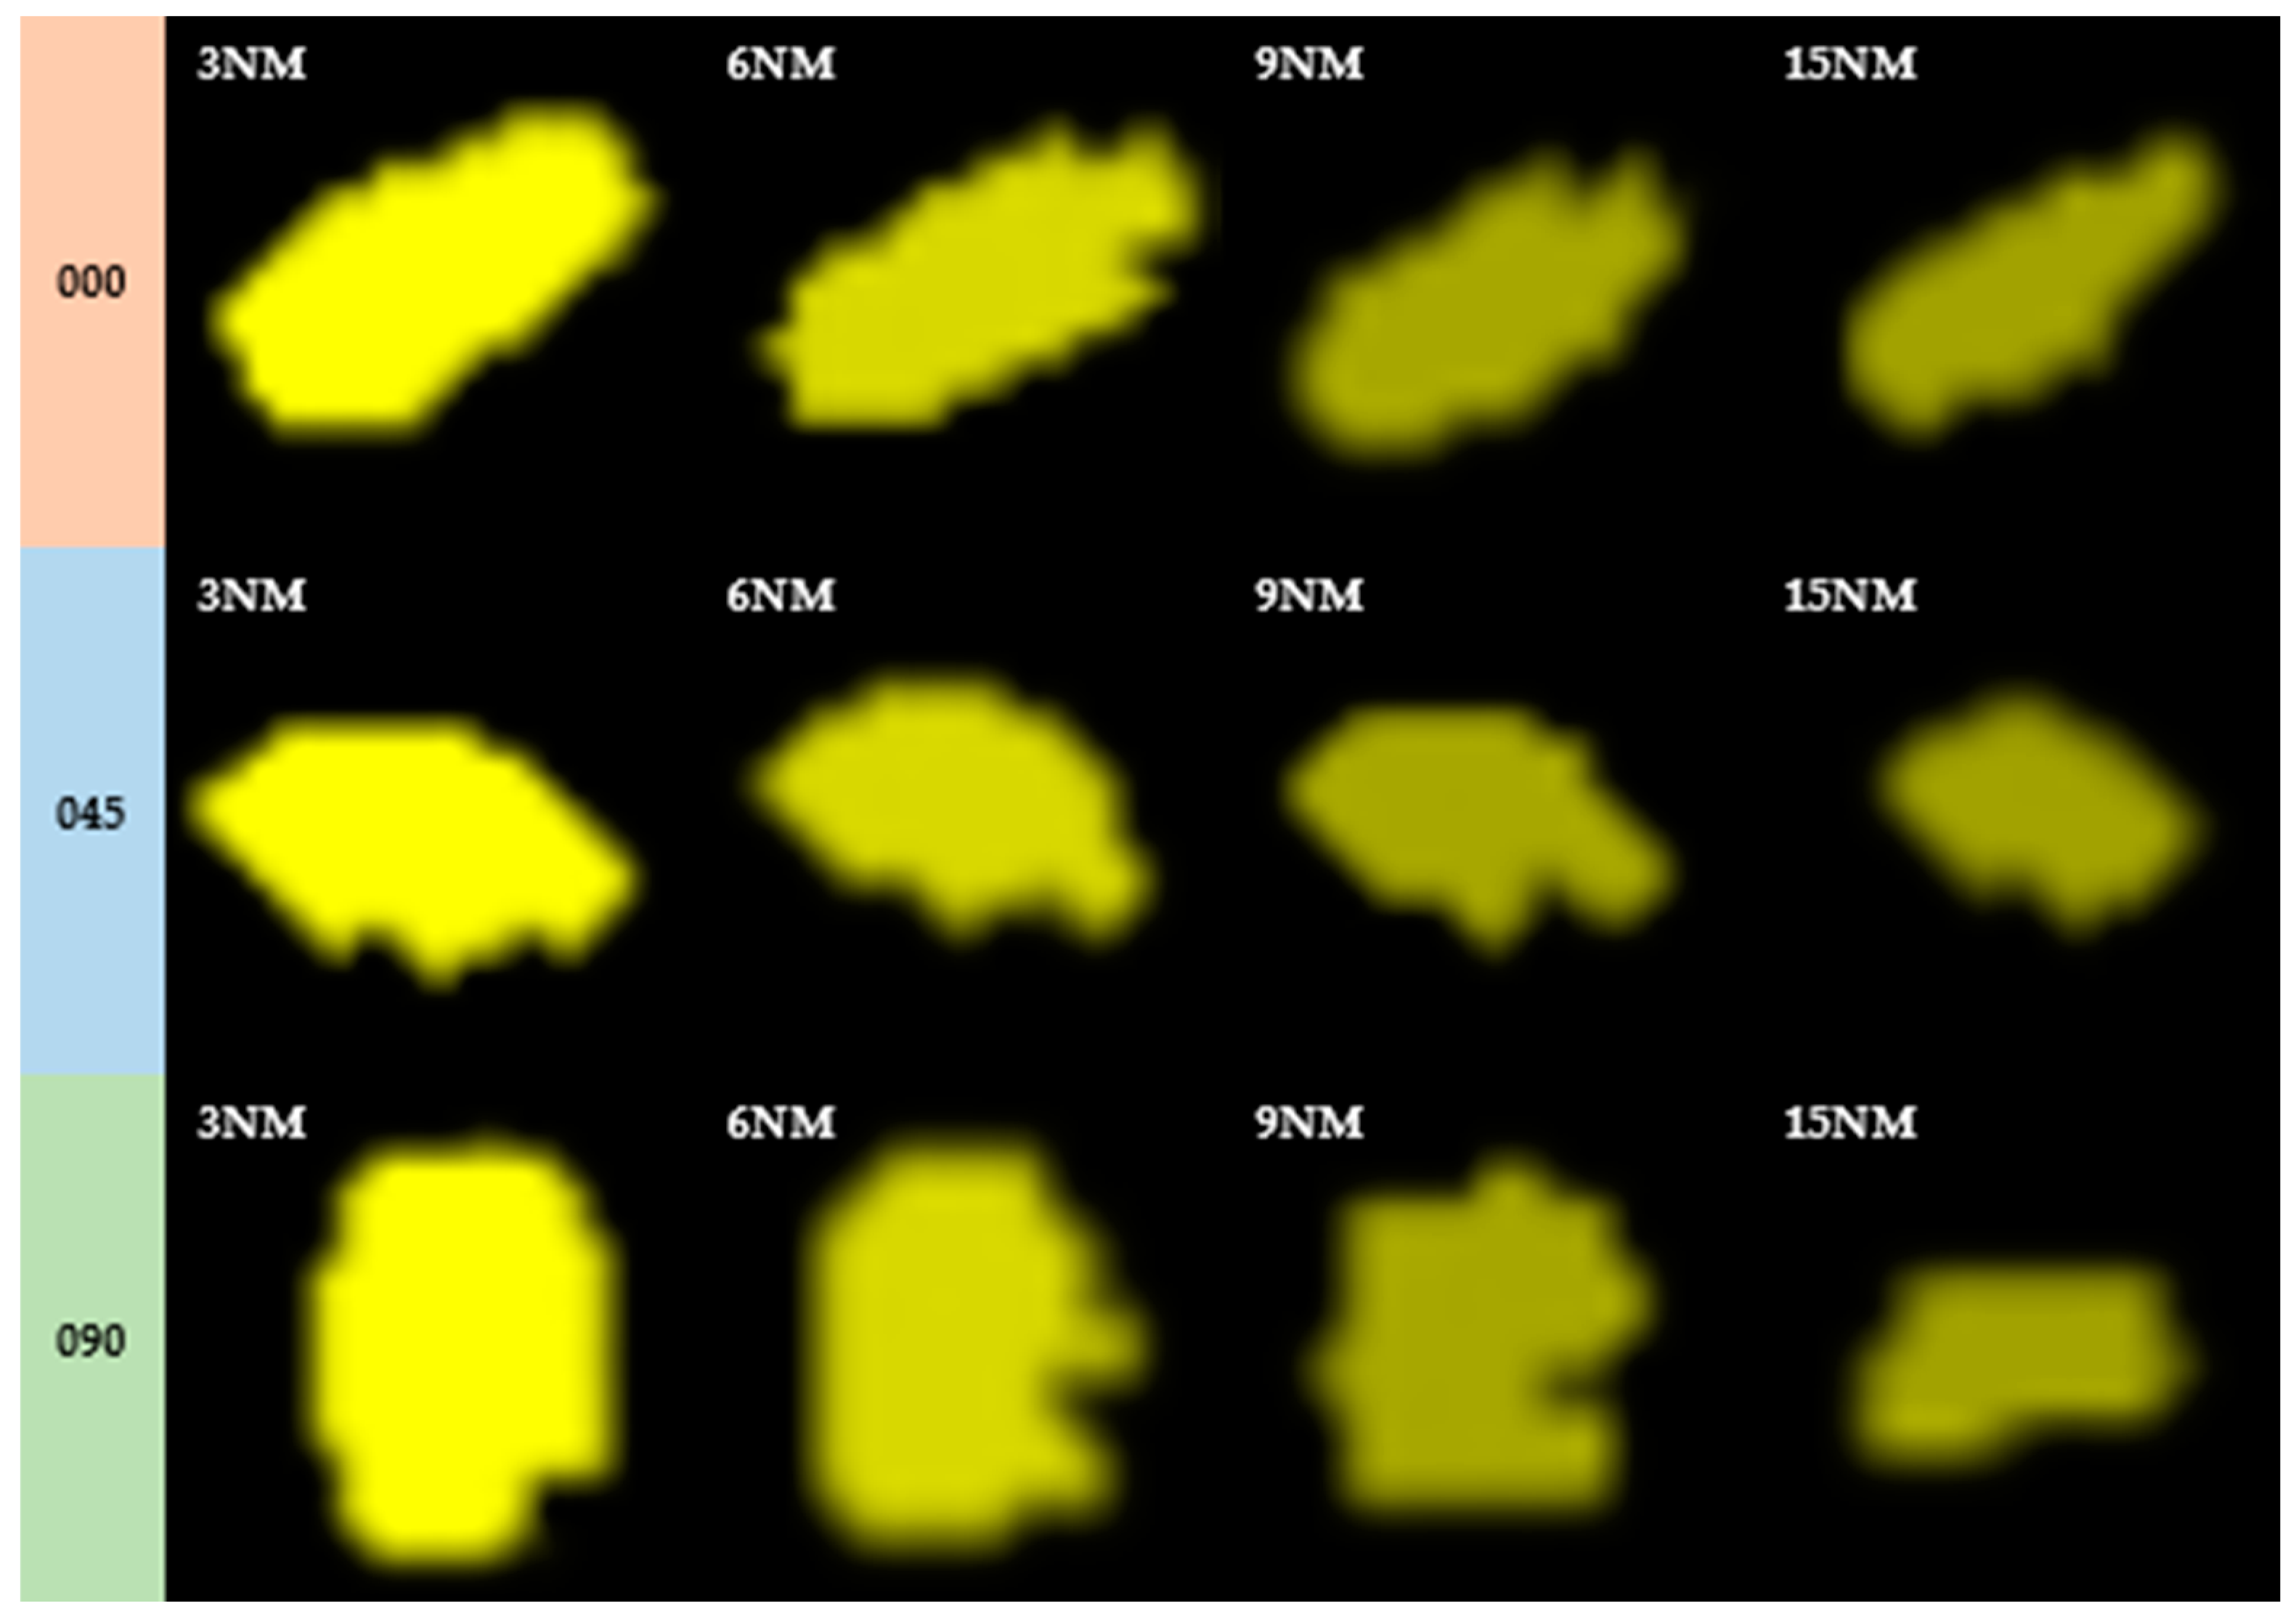
This study uses a bulk carrier as the simulation target to investigate its echo characteristics at varying distances. In this scenario, all target ships are modeled as bulk carriers, with their navigation information presented in Table 3.
The simulation results are shown in Figure 12.
As observed in Figure 12, at the same distance, different incident angles lead to different contours and states in the echo images, which is primarily due to the variations in RCS values. When the angle remains constant, the clarity and realism of the echo images gradually decrease as the distance between the radar and the target ship increases. According to the radar equation (Equation (1)), the received echo signal strength is inversely proportional to the square of the distance. Therefore, as the distance increases, the attenuation of the echo signal becomes more severe, leading to blurred images, loss of detail, and distortion of the contours.

4.2.3. Simulated Echo Images of Target Ships with Different Materials

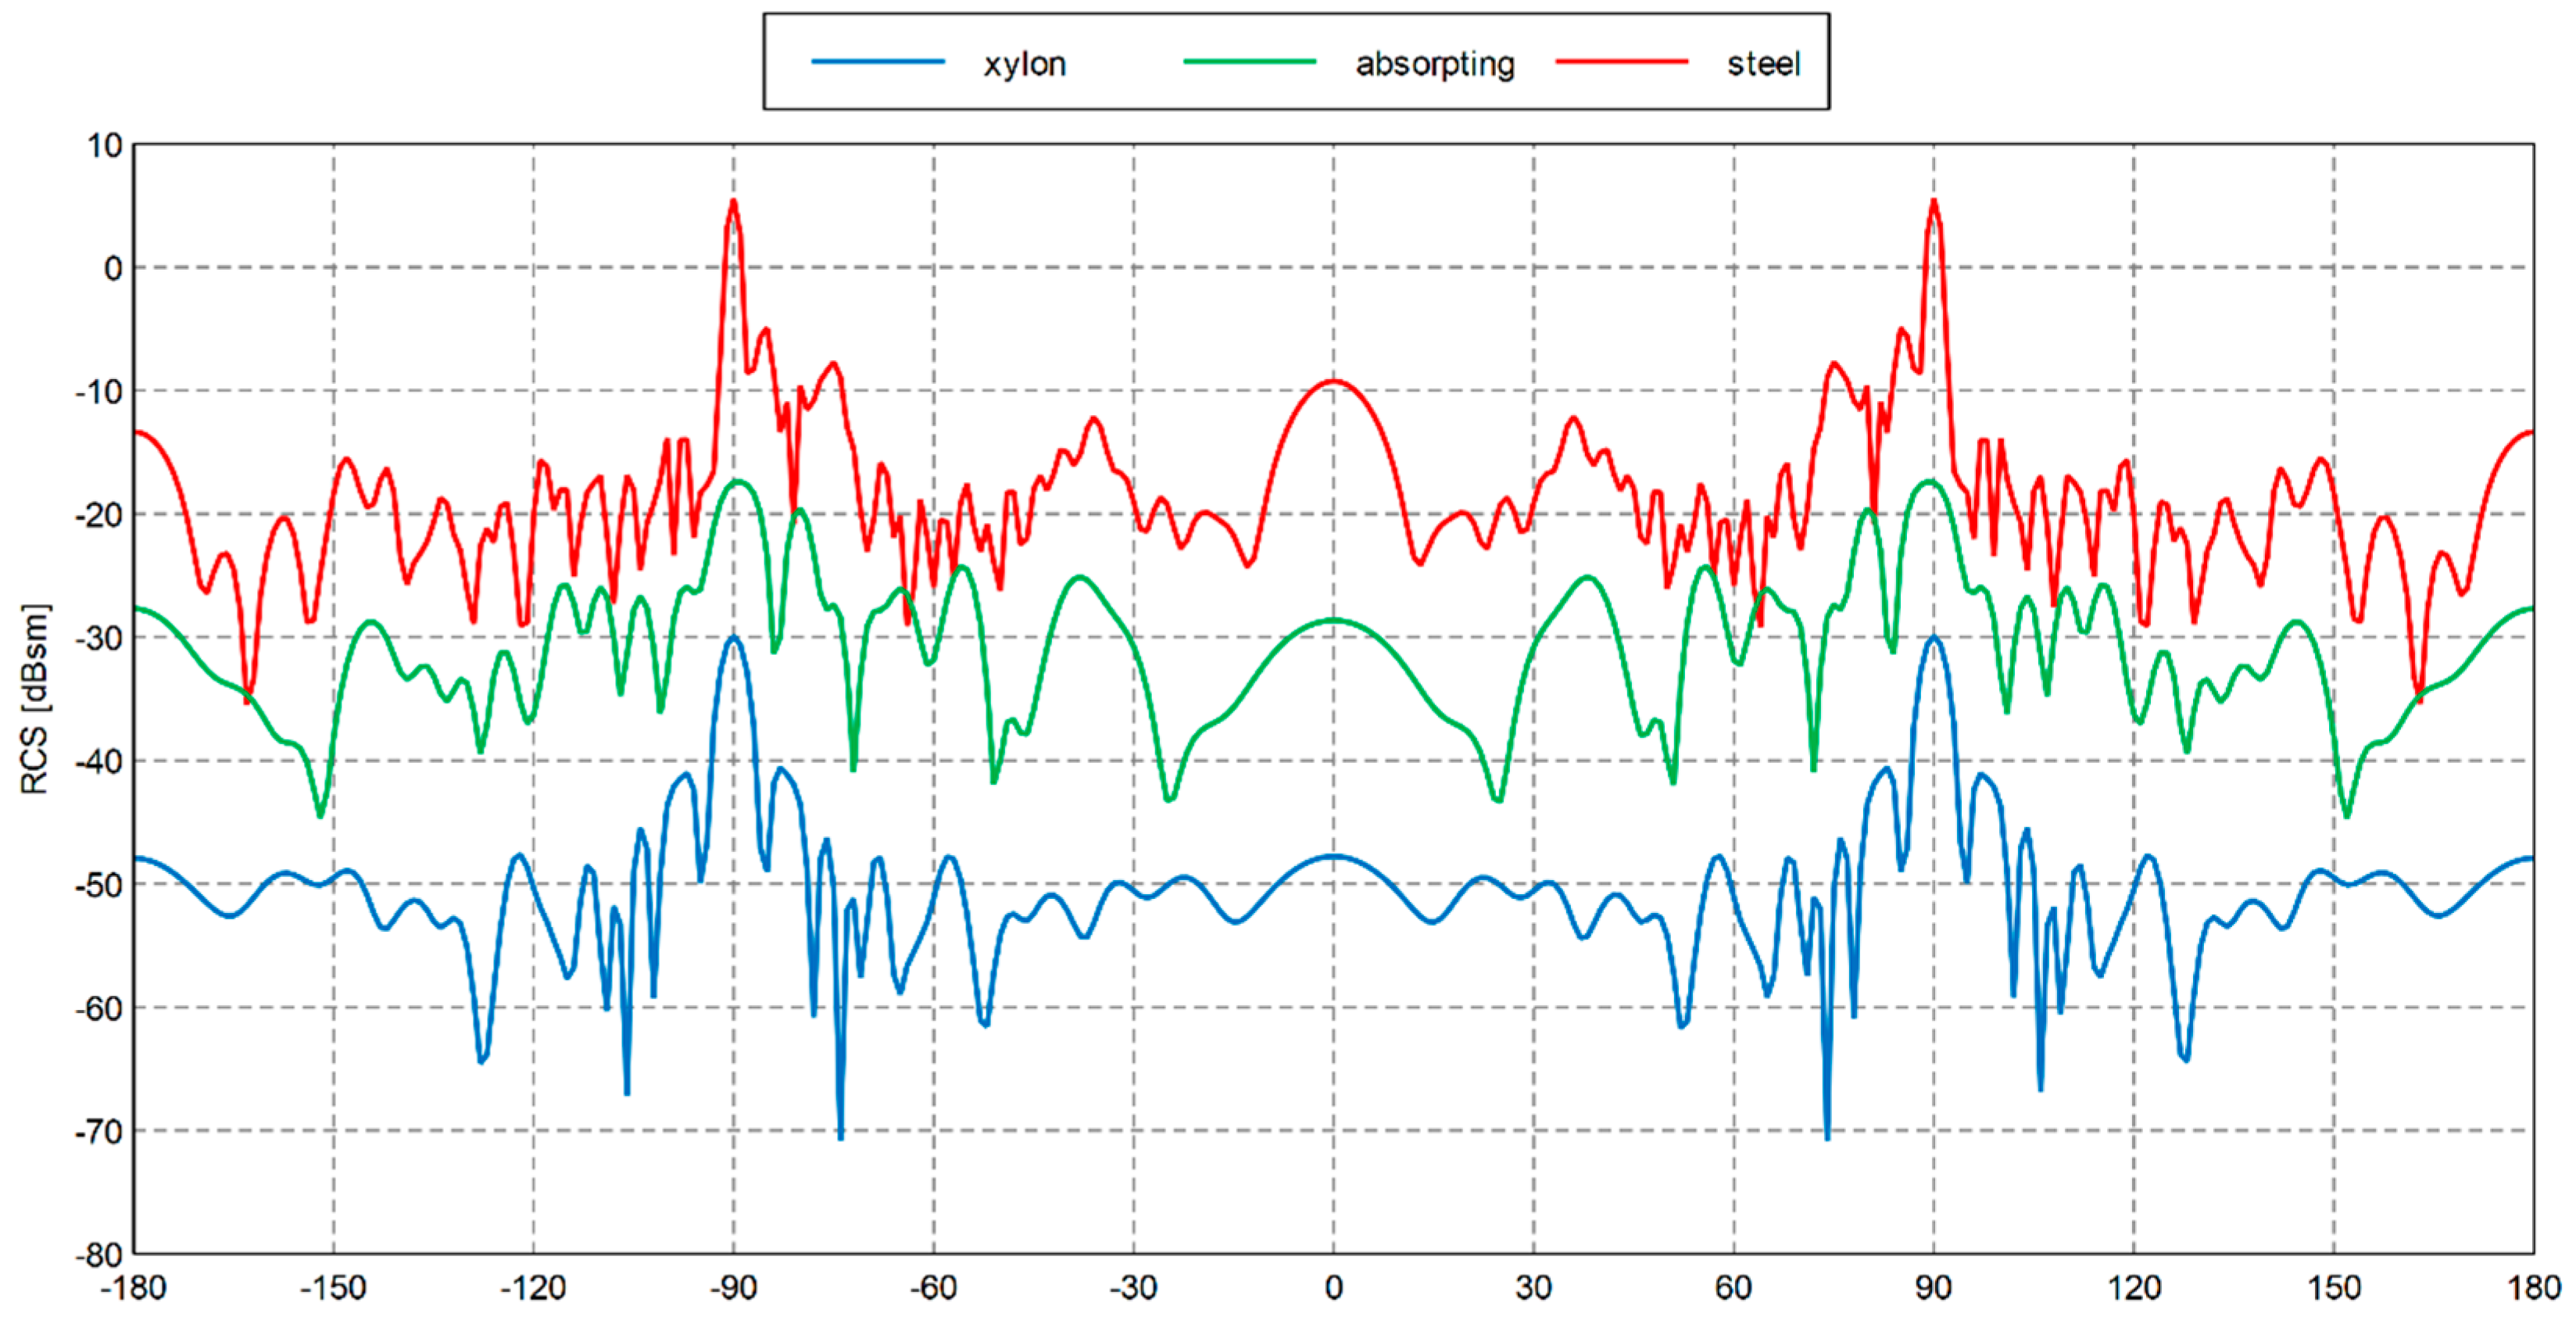
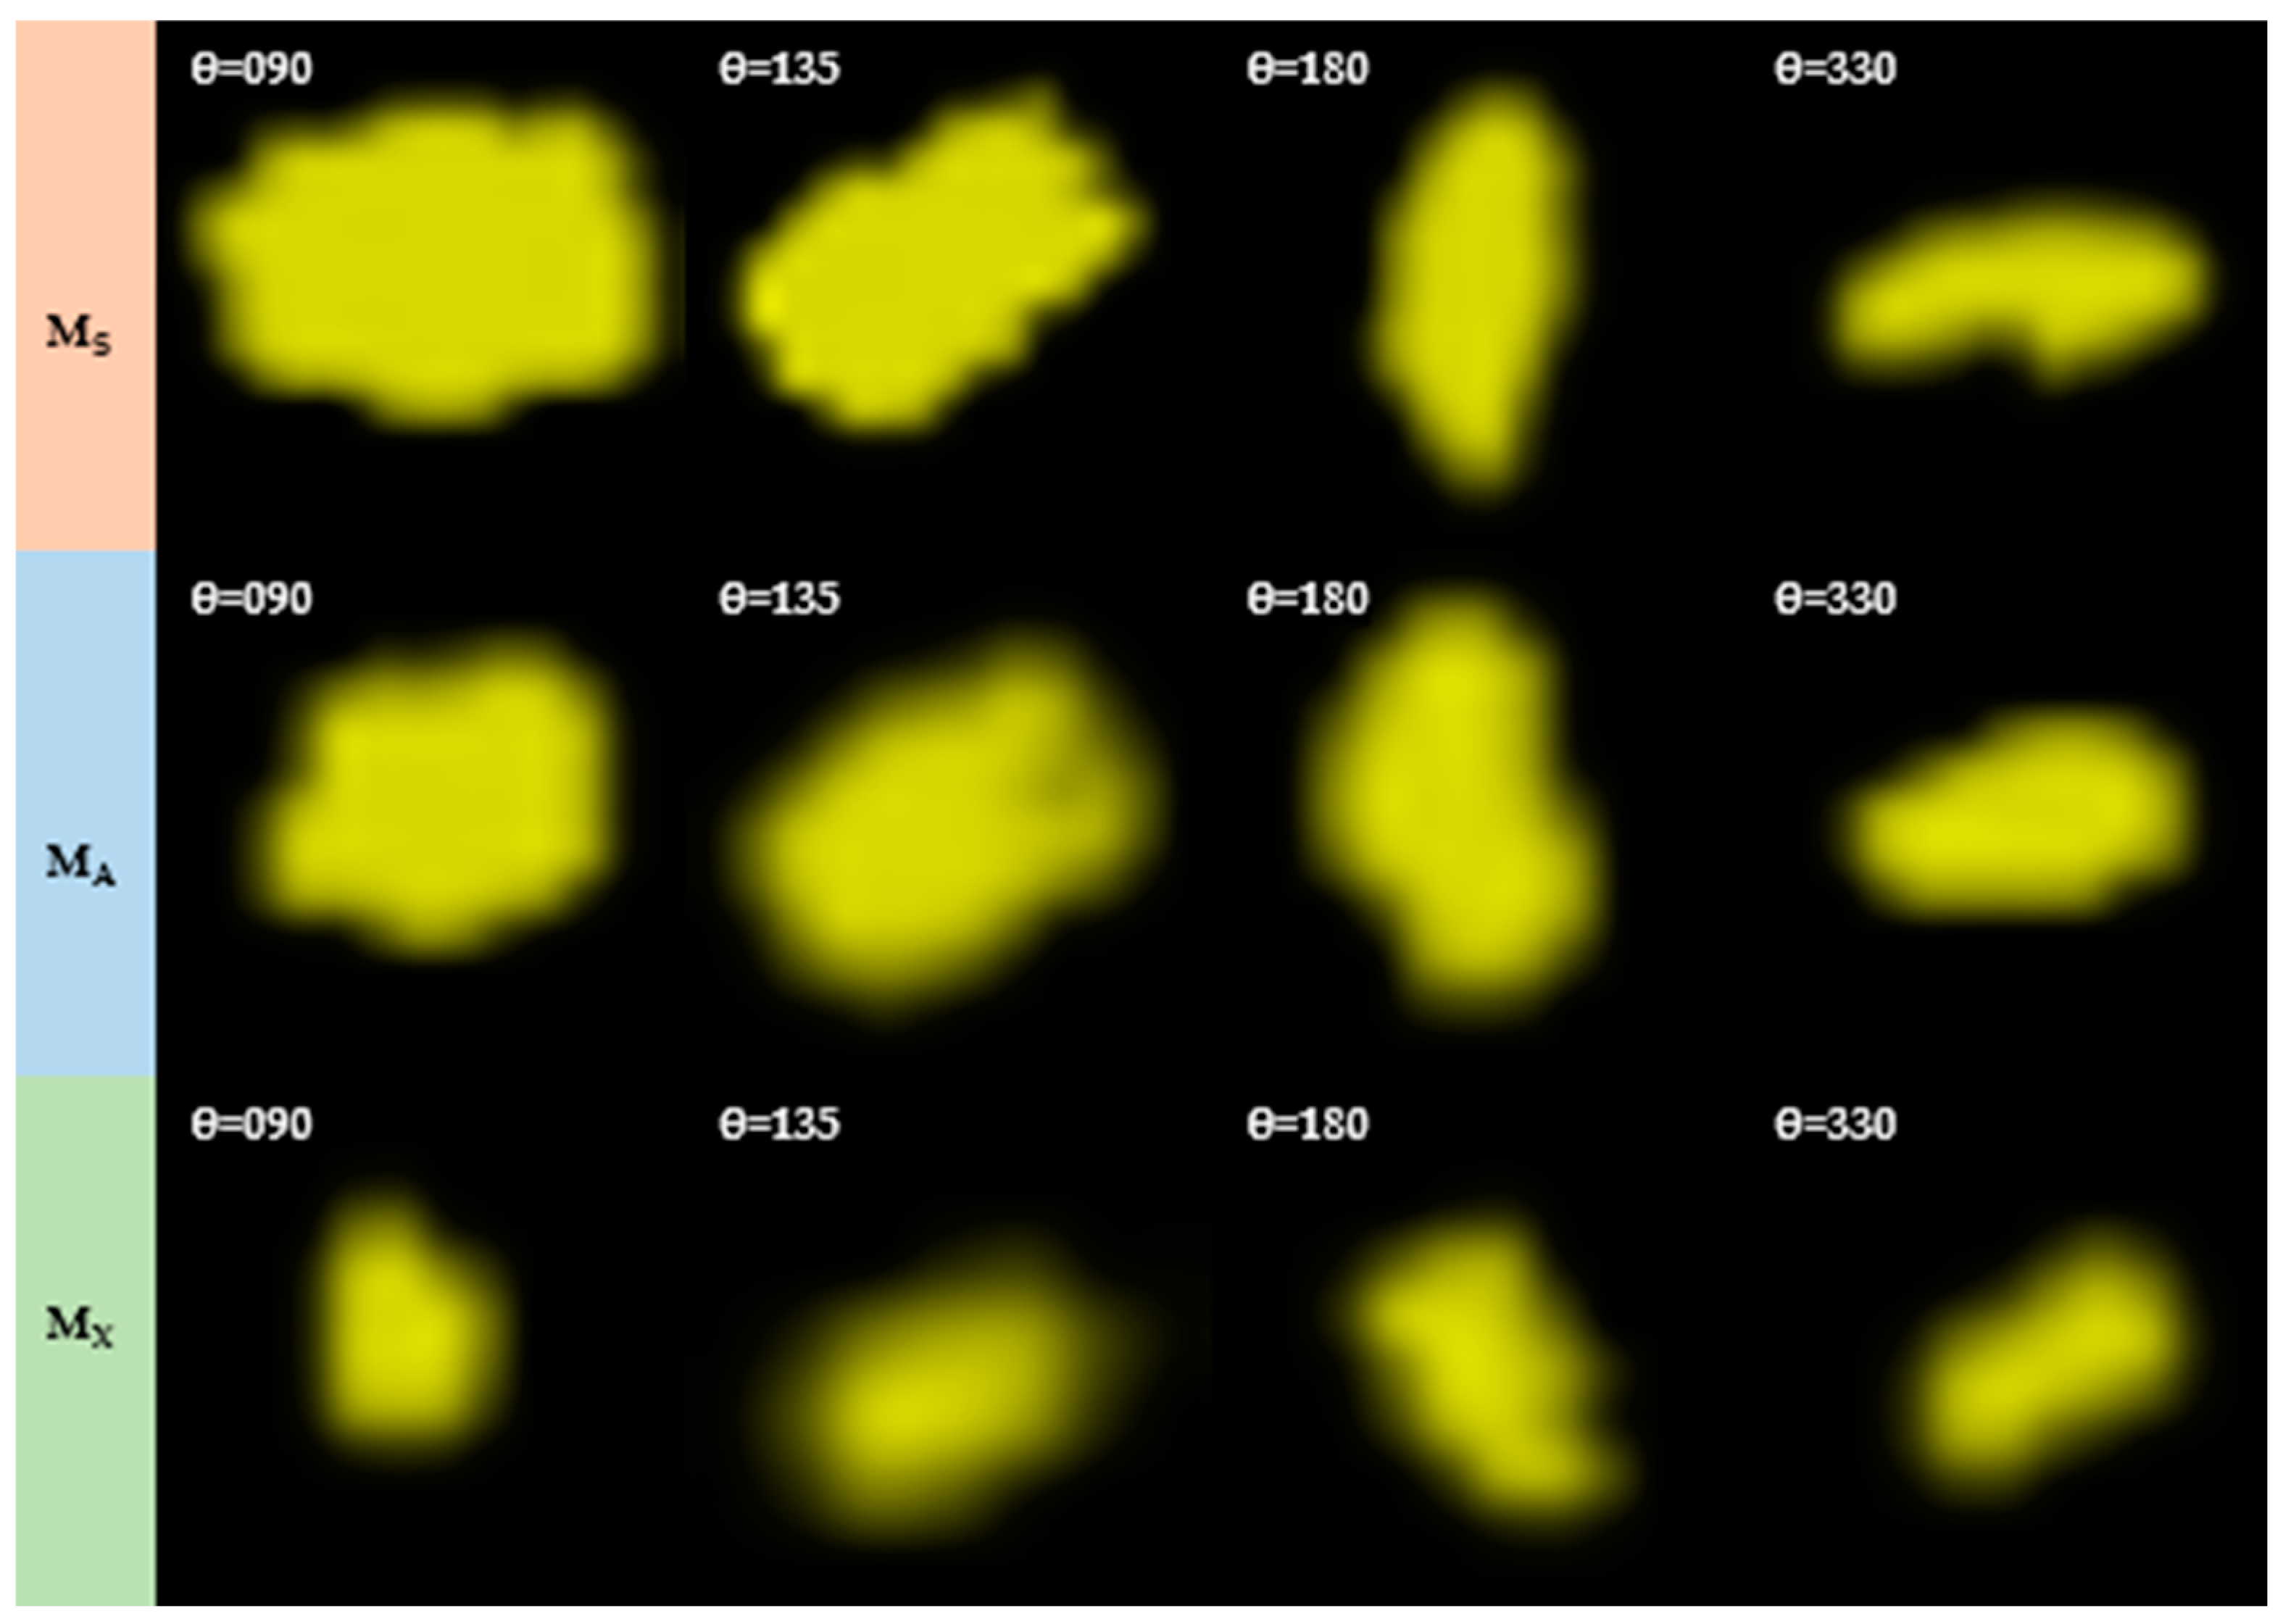
Along with the incident angle and distance, the surface material of the ship is a key factor influencing the RCS. This study examines three typical marine ship materials, steel, absorbing materials, and xylon (denoted as MS, MA, and MX, respectively), and calculates the RCS based on the material reflection parameters in Table 4. The calculation results are presented in Figure 13.
A bulk carrier was selected as the ship model, and the echo images under different materials were obtained through simulation, as shown in Figure 14.
As observed in Figure 14, the smaller the reflective characteristics of the ship’s material, the lower the clarity and completeness of the echo image. Steel ships produce the clearest echo images with the most complete contours, while ships made of absorbing materials and xylon show significant blurring and contour loss. Xylon ships, due to their extremely low reflectivity, exhibit noticeably smaller echo sizes compared to the other two types of ships.

4.3. Radar Simulator Simulation Results

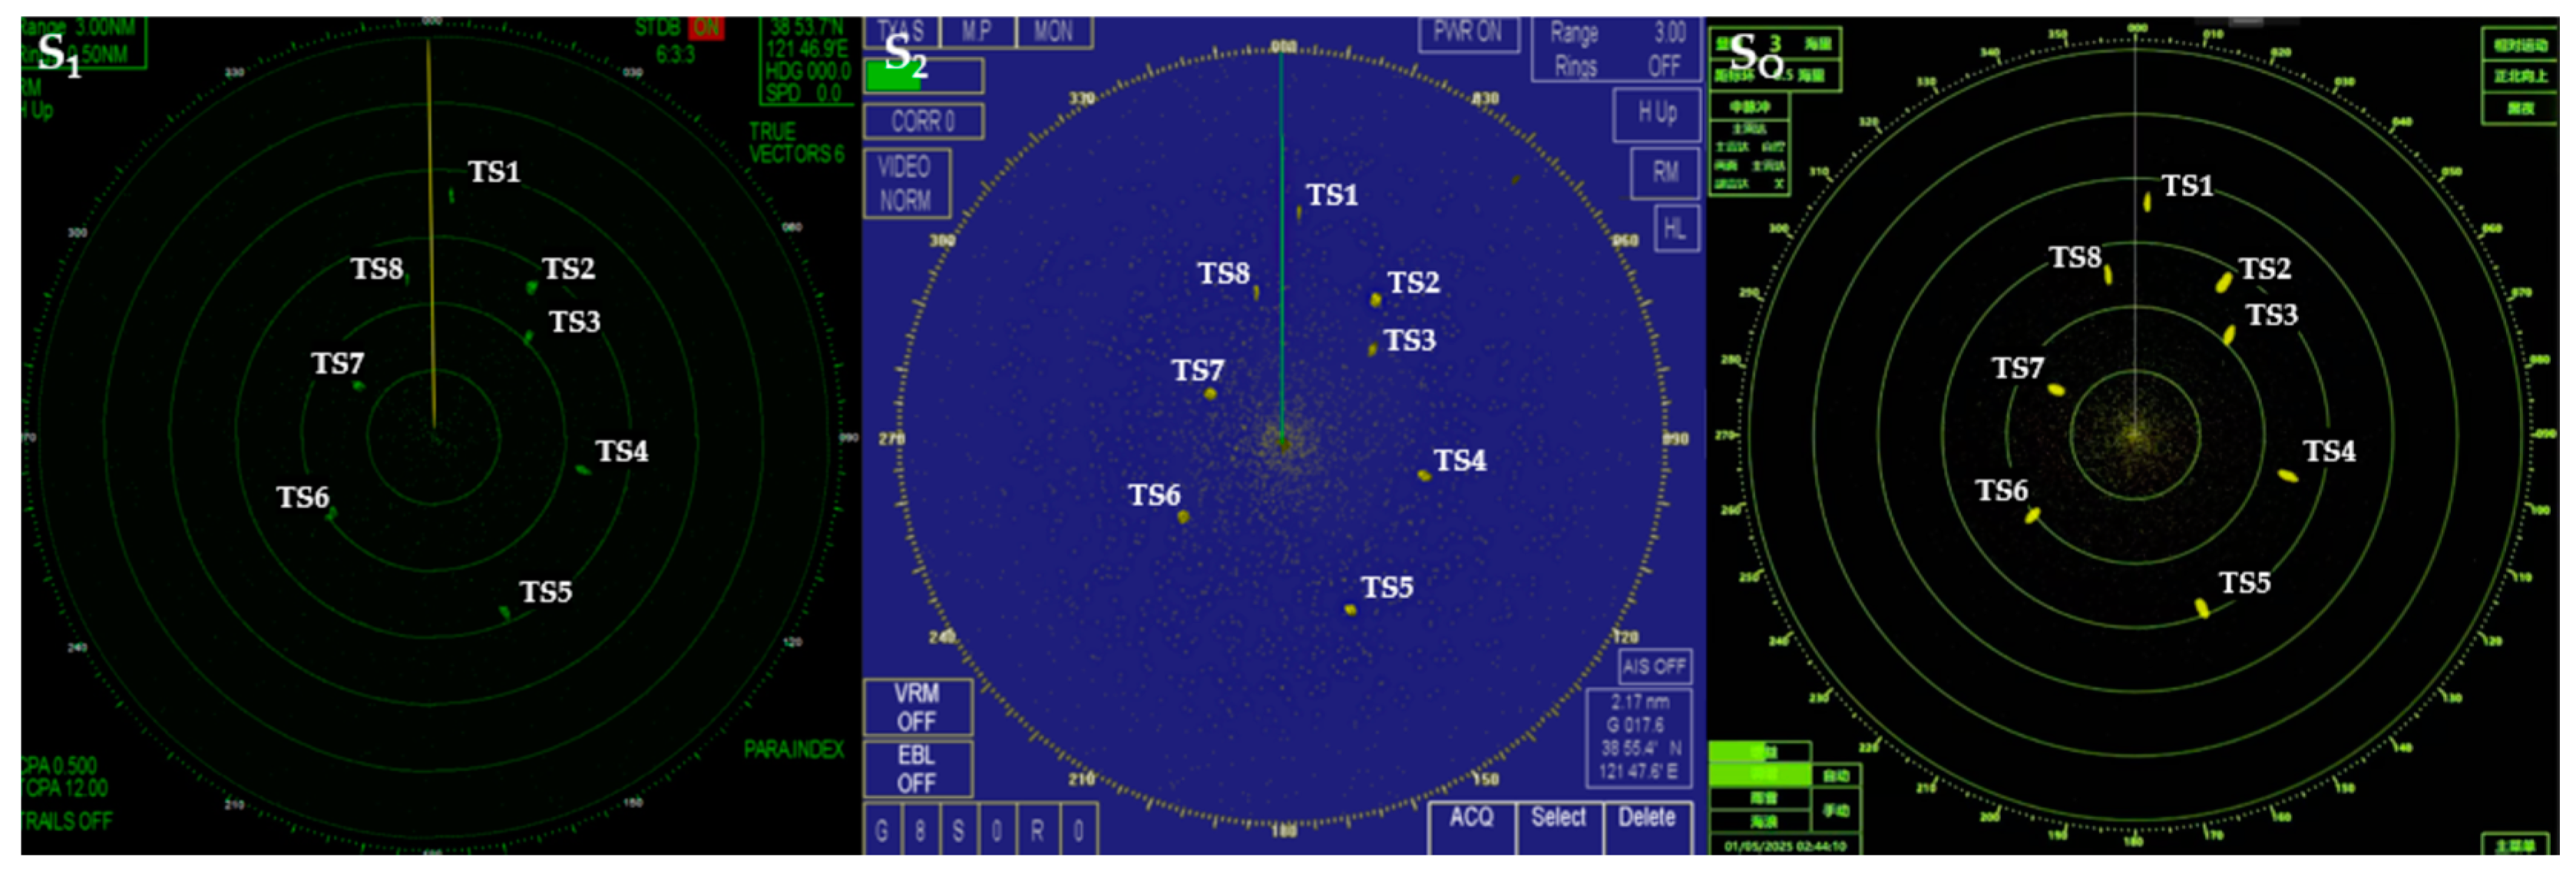
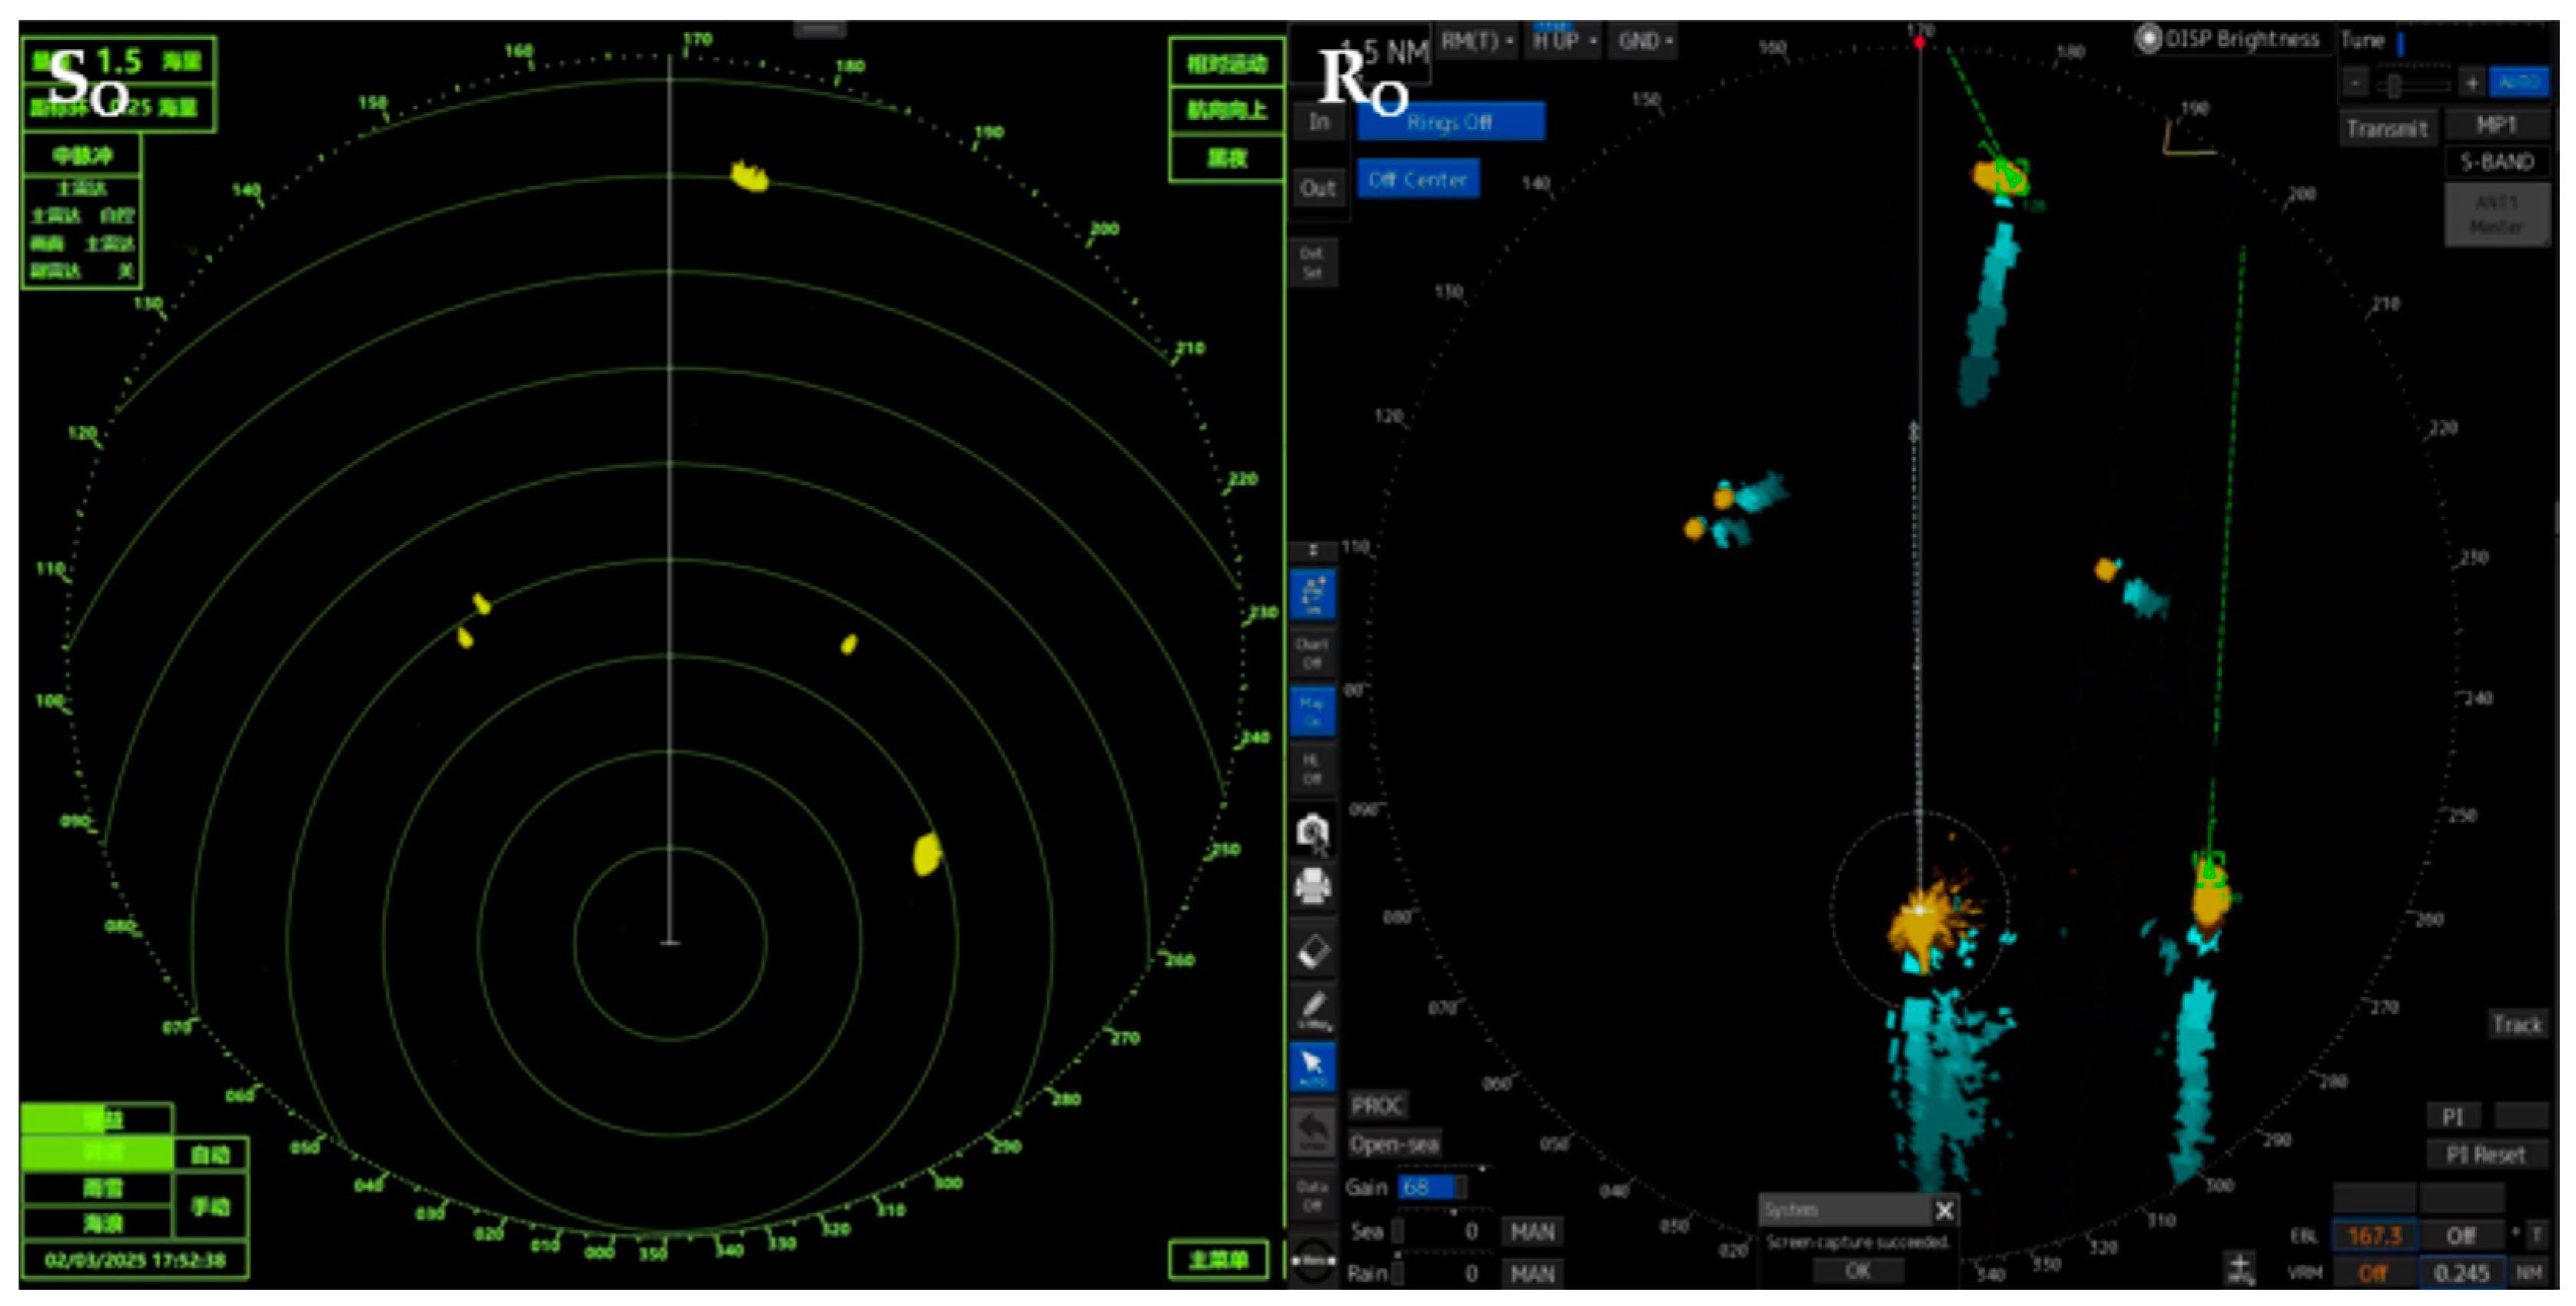
This study compares two radar simulators used in educational training and a radar simulator already used on the market with a newly developed simulator that employs the echo generation method proposed in this research. The three simulators and another radar simulator were labeled as S1, S2, SO, and RO. Target ship information was transmitted uniformly from the console to simulate echoes in the same scenario. Detailed ship information is provided in Table 5.
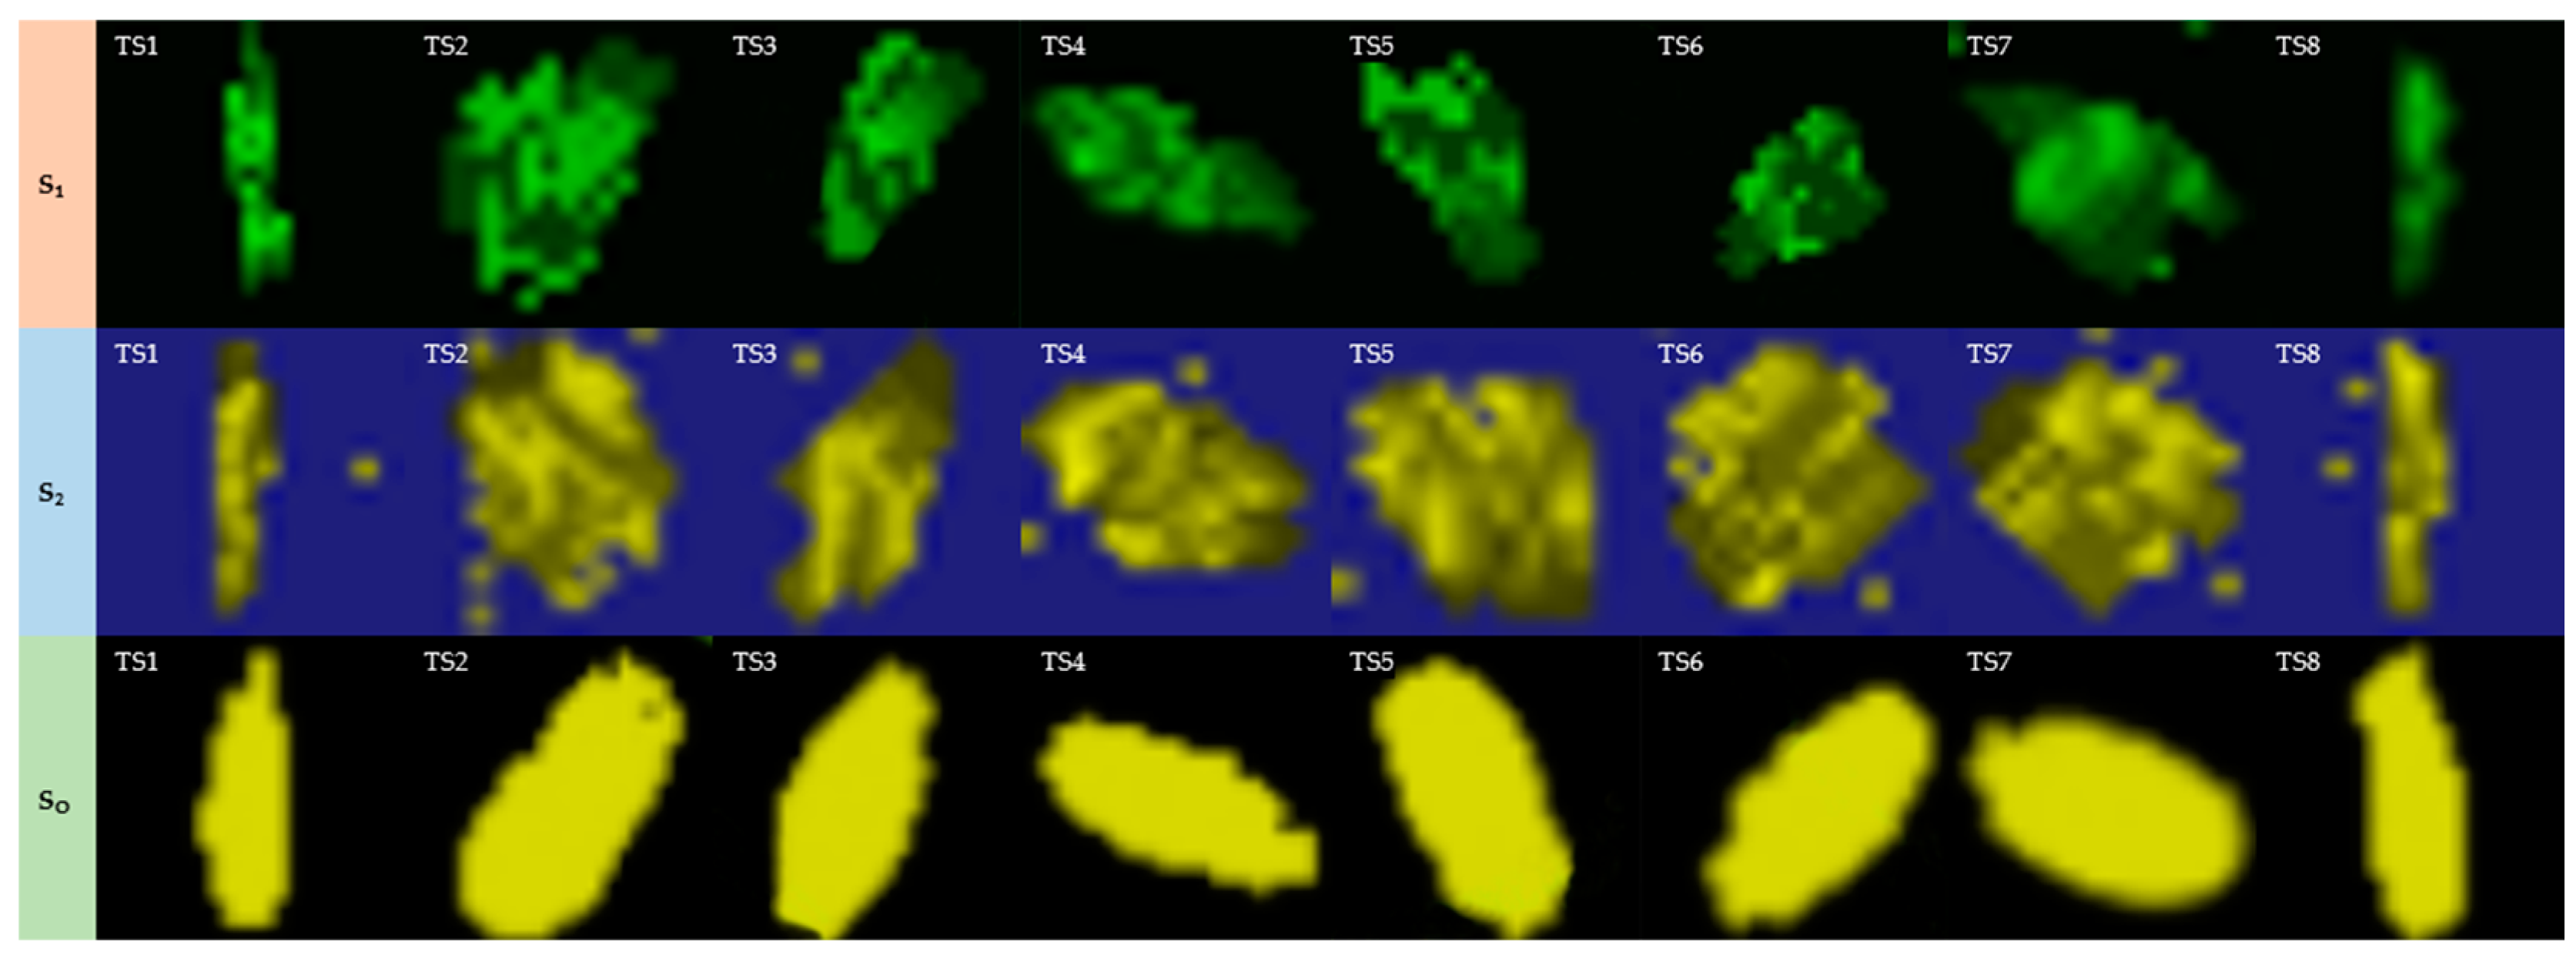
In this study, the reliability of the algorithm was verified through simulation comparison from the following two aspects. Firstly, the radar simulator using this algorithm was compared with two radar simulators that have been used for Marine education training, and the three simulators were labeled S1, S2, and SO. The three simulators all receive the information of the ship and the target ship sent by the same console, and simulate the radar echoes in the same scene. Detailed ship information is provided in Table 5. The simulation results are shown in Figure 15 and Figure 16. Then, the radar simulator using this algorithm was compared with the real radar. The real radar is denoted by RO. The real radar provides echo images and data information in a certain scene, and then the radar simulator simulates and simulates. The comparison of simulation results is shown in Figure 17. The SO simulator is a Chinese-language simulator, and the English equivalents of the non-English terms in the figure are as shown in Table 6.
Figure 15 presents Plan Position Indicator (PPI) diagrams generated by S1, S2, and SO, from left to right. Figure 15 shows magnified echo images of eight target ships, offering a closer look at the differences in echo image generation among the simulators. Figure 15 and Figure 16 reveal that the echo images generated by S1 and S2 are relatively simplistic, with irregular contours and significant omissions. Additionally, the echo images are discontinuous and exhibit cross-sectional issues. In contrast, the echo images generated using the proposed algorithm in this study better illustrate the impact of ship posture on the echoes. Under different navigation postures, the shape of the ship’s echo changes significantly. In comparison, S1 and S2 fail to fully account for changes in ship posture, resulting in uniform and static echo shapes. SO adjusts the ship posture in real time, making the echo images of each ship more realistic and dynamic under various navigation states. As can be seen from Figure 17, the radar simulator using this algorithm can better restore a certain scene of the real radar, which verifies the effectiveness of this algorithm.

5. Conclusions

This study addresses common issues of low realism and practicality in radar simulators by focusing on target ship echo images under dynamic RCS changes and successfully implementing their simulation. The echo images simulated by the proposed algorithm enhance the accuracy and practicality of radar simulators in real-world applications. This provides significant support for maritime radar training, as well as for the precise navigation and remote control of intelligent ships. The main contributions are as follows:
(1)
Dynamic RCS calculation: Using the PO method, this study calculates the RCS of typical ships, accurately reflecting their electromagnetic characteristics;
(2)
Target ship echo image simulation: An algorithm was developed for ship echo generation based on the dynamic RCS. Simulations under different incident angles, detection distances, and material properties were conducted, demonstrating the shapes and characteristics of ship echoes under varying conditions through comparative analysis;
(3)
Validation of effectiveness in practical scenarios: Compared to images simulated by existing radar simulators, the echo images generated by this algorithm better reflect the scattering characteristics of ships, with higher realism and detail fidelity.
The simulation of target ship echo images is a large-scale system engineering task. This study focuses on researching several key technologies for generating target ship echo images based on the RCS, without considering electromagnetic wave propagation effects in complex environments and sea clutter. Future studies can further explore how to incorporate these complex environmental factors into the simulation model to improve the reliability and practicality of the simulation results.

Author Contributions

Conceptualization, C.L.; methodology, C.L.; software, C.L., S.L. and X.F.; supervision X.Y. and H.R.; resources, X.Y.; writing—original draft preparation, C.L.; writing—review and editing, X.Y. and H.R.; funding acquisition, X.Y. and H.R.; formal analysis, S.L. and X.F. All authors have read and agreed to the published version of the manuscript.

Funding

This research was funded by the Natural Science Foundation of Liaoning Province of China, 2022-BS-099, and the Scientific Research Foundation of the Higher Education Institutions of Liaoning Province of China, LJKMZ20220375.

Institutional Review Board Statement

Not applicable.

Informed Consent Statement

Not applicable.

Data Availability Statement

The data that support the findings of this study are available from the corresponding author upon reasonable request.

Conflicts of Interest

The authors declare no conflicts of interest.

References

  1. Xu, Z.; Ai, X.; Zhao, F.; Liu, X.; Xiao, S. Full-Polarization Baseband Echo Simulation of Space Targets for Bistatic Radar. IEEE Geosci. Remote Sens. Lett. 2021, 18, 396–400. [Google Scholar] [CrossRef]
  2. Yu, F.; Yang, X.; Cheng, C. Study on the Radar Echo Dynamic Image Simulation. Appl. Mech. Mater. 2014, 490–491, 524–527. [Google Scholar] [CrossRef]
  3. Afonin, I.L.; Bokov, G.V. Navigators Training Software. In Proceedings of the 2007 17th International Crimean Conference-Microwave & Telecommunication Technology, Sevastopol, Ukraine, 10–14 September 2007. [Google Scholar]
  4. Zhang, C.; Fang, M.; Yang, C.; Yu, R.; Li, T. Perceptual Fusion of Electronic Chart and Marine Radar Image. J. Mar. Sci. Eng. 2021, 9, 1245. [Google Scholar] [CrossRef]
  5. Yao, H. Radar/ARPA Simulation Training System. Master’s Thesis, Dalian University of Technology, Dalian, China, 2002. [Google Scholar]
  6. Tian, J. Research and Design of Radar Simulator. Master’s Thesis, Dalian Maritime University, Dalian, China, 2008. [Google Scholar]
  7. Li, Y. The Simulation and Evaluation of JRC-JMA-9100 Series Radar. Master’s Thesis, Dalian Maritime University, Dalian, China, 2017. [Google Scholar]
  8. Che, G. Research on Radar Scattering Characteristics and Electromagnetic Imaging of Ship Target. Master’s Thesis, University of Electronic Science and Technology of China, Chengdu, China, 2023. [Google Scholar]
  9. Chen, N. Research and Realization of Marine Radar Echo Simulation. Master’s Thesis, University of Electronic Science and Technology of China, Chengdu, China, 2013. [Google Scholar]
  10. Cao, S. Marine Radar Image Simulation Based on Scene Rendering. Ph.D. Thesis, Dalian Maritime University, Dalian, China, 2018. [Google Scholar]
  11. Rahman, M.M. Capturing Transition and Non-Transition Flows with an New Shear Stress Transport Model. Chin. J. Aeronaut. 2023, 36, 121–136. [Google Scholar] [CrossRef]
  12. Zhao, Y. Study on Modeling Methods of EM Scattering from Sea Surface and Ship Target. Ph.D. Thesis, Xidian University, Xi’an, China, 2016. [Google Scholar]
  13. Liu, Y.; Jiao, J.; Wang, C.; Wang, X. FEKO Simulation Principles and Engineering Applications; China Machine Press: Beijing, China, 2017. [Google Scholar]
  14. Li, J.; Gu, Y.; Qin, Q.-H.; Zhang, L. The Rapid Assessment for Three-Dimensional Potential Model of Large-Scale Particle System by A Modified Multilevel Fast Multipole Algorithm. Comput. Math. Appl. 2021, 89, 127–138. [Google Scholar] [CrossRef]
  15. Xu, F.; Jin, Y.Q. Bidirectional Analytic Ray Tracing for Fast Computation of Composite Scattering From Electric-Large Target Over a Randomly Rough Surface. IEEE Trans. Antennas Propag. 2009, 57, 1495–1505. [Google Scholar] [CrossRef]
  16. Liao, C. Research on Nearfield Scattering Modeling of Ship on the Sea Surface Based on High-Frequency Method. Master’s Thesis, University Of Electronic Science and Technology of China, Chengdu, China, 2021. [Google Scholar]
  17. Wang, M.; Li, Y.; Cheng, Z.; Niu, L. An Improved GRECO Method for the Computation of Radar Cross Section in Near Field. Radar Sci. Technol. 2017, 15, 677–681, 686. [Google Scholar]
  18. Hu, S.; Fan, X.; He, J. Evaluation of Radar Cross Section of Trihedral Corner Reflectors Based on Improved GO/AP Method. Radar Sci. Technol. 2017, 15, 185–190. [Google Scholar]
  19. Ji, W.; Liu, P.; Guan, X.; Wang, J. Research on Electromagnetic Scattering from Large Object on Ocean Surface. Mod. Navig. 2013, 4, 362–370. [Google Scholar]
  20. Zhang, M.; Zhao, Y.; Li, J.X.; Wei, P.B. Reliable Approach for Composite Scattering Calculation from Ship over a Sea Surface Based on FBAM and GO-PO Models. IEEE Trans. Antennas Propag. 2017, 65, 775–784. [Google Scholar] [CrossRef]
  21. Zhao, Y.; Guan, W.; Ren, X.; Yang, J. Study on the Composite EM Scattering from Sea Surface with Ship Based on an Improved GO-PO Hybrid Method. Henan Sci. 2020, 38, 870–878. [Google Scholar]
  22. Dong, C.; Guo, L.; Meng, X.; Li, H. An improved go-po/ptd hybrid method for em scattering from electrically large complex targets. IEEE Trans. Antennas Propag. 2022, 70, 12130–12138. [Google Scholar] [CrossRef]
  23. Chen, L.; Yang, S.; Suo, Y.; Chen, W. Electromagnetic Scattering Simulation Analysis of Different Targets Ship Types. J. Jimei Univ. (Nat. Sci.) 2021, 26, 519–526. [Google Scholar] [CrossRef]
  24. Li, G.; Zhu, H.; Di, H. Analysis of Ship RCS Based on High-Frequency Fast Optimization Algorithm. Ship Sci. Technol. 2020, 42, 157–160. [Google Scholar]
  25. Chen, C.; Yang, F.; Hu, C.; Zhou, J. An Improved RCS Calculation Method for Power Lines Combining Characteristic Mode with SMWA. Electronics 2022, 11, 2051. [Google Scholar] [CrossRef]
  26. Chen, S.; Zhou, J.; Wu, Z. Analysis of Ship RCS Affected by Different Factors. J. Chang. Univ. Sci. Technol. (Nat. Sci. Ed.) 2017, 40, 59–63. [Google Scholar]
  27. Ji, Y.; Liu, T.; Xu, G.; Shi, Y.; Zhang, Y.; Yang, J. The target identification method for ship based on RCS statistical feature. Ship Sci. Technol. 2018, 40, 129–132. [Google Scholar]
  28. Zhang, J.; Wang, X.; Chen, Z. Research on Dynamic RCS Simulation of Radar Targets. J. Syst. Simul. 2005, 4, 834–837. [Google Scholar] [CrossRef]
  29. Zhao, T.; Dong, C.; Ren, H.; Yin, H. Dynamic RCS Simulation of a Missile Target Group Based on the High-frequency Asymptotic Method. J. Radars 2014, 3, 150–157. [Google Scholar] [CrossRef]
  30. Li, S.; Yang, X.; Ren, H.; Li, C. Design and Implementation of a Shipborne Echo Sounder Simulator Based on a Seabed Echo Scattering and Noise Model. J. Mar. Sci. Eng. 2024, 12, 1762. [Google Scholar] [CrossRef]
  31. Chen, C.; Zhang, B.; Gu, N.; Yin, F.; Tian, S. Research on Electromagnetic Scattering Simulation and Imaging Feature Analysis for Multi-material Targets. Radio Eng. 2023, 53, 781–788. [Google Scholar]
  32. Dai, Z.; Li, H.; Wang, C.; He, Y. Backscattering Statistics of Labeled Sentinel-1 Wave Mode Imagettes for Ten Geophysical Phenomena. J. Mar. Sci. Eng. 2022, 10, 1594. [Google Scholar] [CrossRef]
  33. Li, H.; Meng, X.; Guo, L.; Dong, C.; Wang, D. An Efficient Hybrid Method for Predicting RCS of Electrically Large Complex Targets. IEEE Antennas Wirel. Propag. Lett. 2024, 23, 3282–3286. [Google Scholar] [CrossRef]
  34. Ezuma, M.; Funderburk, M.; Guvenc, I. Compact-Range RCS Measurements and Modeling of Small Drones at 15 GHz and 25 GHz. In Proceedings of the 2020 IEEE Radio and Wireless Symposium (RWS), San Antonio, TX, USA, 26–29 January 2020; pp. 313–316. [Google Scholar]
  35. Zhu, X.; Yu, Z.; Qin, X.; Yang, H. Simulation and Analysis of Naval Vessel Radar Echoes Based on Dynamic RCS. Radar Sci. Technol. 2019, 17, 543–549. [Google Scholar]
  36. Lin, L. Design and Implementation of Radar Echo Simulator System. Master’s Thesis, Xidian University, Xi’an, China, 2022. [Google Scholar]
  37. Liu, T. Marine Instruments: Volume II, Ship Navigation Radar (M); Dalian Maritime University Press: Dalian, China, 2016. [Google Scholar]
  38. Merrill, S. Radar Handbook, 3rd ed.; McGraw-Hill Professional: New York, NY, USA, 2008. [Google Scholar]
  39. Huang, P.; Yin, H.; Xu, X. Radar Target Characteristics; Publishing House of Electronics Industry: Beijing, China, 2005. [Google Scholar]
  40. Wang, B.; Qi, X.; Zhou, B. An Improved Echo Simulation Method of GEO SAR. Radar Sci. Technol. 2019, 17, 198–207. [Google Scholar]
Figure 1. Target ship echo generation algorithm.
Jmse 13 00348 g001
Figure 2. Vincent formula diagram.
Jmse 13 00348 g002
Figure 3. Incident angle calculation algorithm.
Jmse 13 00348 g003
Figure 4. Electromagnetic calculation and analysis process of the target ship.
Jmse 13 00348 g004
Figure 5. Three-dimensional geometric model of the ship.
Jmse 13 00348 g005
Figure 6. Omnidirectional RCS diagram of the ship.
Jmse 13 00348 g006
Figure 7. RCS line graph of the bulk carrier.
Jmse 13 00348 g007
Figure 8. RCS line graph of the container ship.
Jmse 13 00348 g008
Figure 9. RCS line graph of the fishing boat.
Jmse 13 00348 g009
Figure 10. Echo diagrams of the bulk carrier at different angles.
Jmse 13 00348 g010
Figure 11. Echo diagrams of the container ship at different angles.
Jmse 13 00348 g011
Figure 12. Echo images of the target ship at different distances.
Jmse 13 00348 g012
Figure 13. RCS Comparison of Ships with Three Different Materials.
Jmse 13 00348 g013
Figure 14. Target ship echo images of different materials.
Jmse 13 00348 g014
Figure 15. Echo images from the different simulators.
Jmse 13 00348 g015
Figure 16. Enlarged echo image of the target ship.
Jmse 13 00348 g016
Figure 17. Comparison between the simulator and real machine.
Jmse 13 00348 g017
Table 1. Ship parameters.
Ship TypeLengthWidthHeightDraftMesh CountMesh Size
Bulk Carrier165281812.529,8601
Container2253820.81437,5801
Fishing-boat15462.468201
Table 2. Radar parameters.
NameValue
Operating Frequency9 GHz
Antenna Height15.0 m
Wavelength0.033 m
Antenna Rotation Speed2.00 r/s
Scanning Angle360°
Antenna TypePlanar Array Antenna
Gain40 dB
Maximum Power Output4 KW
Maximum Detection Range96 Nm
Table 3. Navigation information of the bulk carrier.
IDBearingDistanceHeadingIncident Angle
160°3/6/9/15240°000
2135°3/6/9/15270°045
390°3/6/9/15180°090
Table 4. Reflection characteristics of common materials.
MaterialRelative PermittivityRelative PermeabilityConductivityDensity
Steel110005.8 × 107 S/m7.8 g/cm3
Absorbing 2.5110 S/m2.0 g/cm3
Xylon3110−4 S/m1.2 g/cm3
Table 5. Ship information table.
Target IDBearingDistanceHeadingSpeed
TS11.8 Nm357°5 knots
TS230°1.35 Nm214°12 knots
TS343°1.05 Nm194°2 knots
TS4105°1.20 Nm300°4 knots
TS5159°1.42 Nm329°7 knots
TS6232°1.00 Nm35°7 knots
TS7299°0.70 Nm287°9 knots
TS8350°1.25 Nm175°5 knots
Table 6. Chinese and English comparison table.
Non-English TermsDefinition
量程Range
距标环Range ring
中脉冲Medium pulse
增益Gain
调谐Tune
雨雪Rain
海浪Sea
相对运动Relative Motion
正北向上North Up
Disclaimer/Publisher’s Note: The statements, opinions and data contained in all publications are solely those of the individual author(s) and contributor(s) and not of MDPI and/or the editor(s). MDPI and/or the editor(s) disclaim responsibility for any injury to people or property resulting from any ideas, methods, instructions or products referred to in the content.