Article

Research on the Response Characteristics of Excavation and Support in Circular Sand Soil Foundation Pit Based on Parameter Verification

1
State Key Laboratory of Mountain Bridge and Tunnel Engineering, School of Civil Engineering, Chongqing Jiaotong University, No. 66 Xuefu Avenue, Nan’an District, Chongqing 400074, China
2
China Coal Aerial Survey and Remote Sensing Group Co., Ltd., No. 216, Shenzhou Fourth Road, Chang’an District, Xi’an 710199, China
3
State Key Laboratory of Continental Dynamics, Department of Geology, Northwest University, No. 229 Taibai North Road, Beilin District, Xi’an 710069, China
4
Energy Chemical Industry, Shaanxi Energy Institute, No. 29, Middle Section of Wenlin Road, Xianyang 712000, China
5
Key Laboratory of Highway Engineering for Special Regions, Chang’an University, No. 126, Middle Section of South Second Ring Road, Beilin District, Xi’an 710064, China
*
Author to whom correspondence should be addressed.
J. Mar. Sci. Eng. 2025, 13(2), 349; https://doi.org/10.3390/jmse13020349
Submission received: 5 January 2025 / Revised: 6 February 2025 / Accepted: 11 February 2025 / Published: 14 February 2025

Abstract

:
This study is aimed at the complex deformation response characteristics of deep soil in the processes of excavation and support of round sand foundation pits. The displacement of the diaphragm wall during the excavation and support of the foundation pit was monitored in a round foundation pit project at the west anchorage of Humen Second Bridge. A full-cycle model of foundation pit excavation was established, and a new method for parameter checking based on the principle of three-factor (c, φ, E) multi-level orthogonal experimental design was proposed. Dynamic calibration parameters based on construction monitoring data were obtained. The characteristics of the uplift at the bottom of the foundation pit and the effective plastic strain of the soil before and after the steady-state seepage conditions were applied and analyzed. The most dangerous working conditions (Conditions 5–6: construction of the fourth layer of lining and excavation of the fifth layer; construction of the fifth layer of lining and excavation at the sixth layer) existed during the excavation and support of the foundation pit. The research method can provide a great practical guiding significance for covering lack of monitoring data at the construction site and early warning analysis on foundation pit excavation.

1. Introduction

Foundation pit projects have developed to be larger and deeper in size with more unique shapes, and the scale and challenges of foundation pit construction projects have gradually increased. Management of the surrounding environment has become more complex [1,2,3]. These challenges increase both the safety requirements of foundation pit construction projects and the deformation control in construction [4,5].
Many scholars have performed on-site measurement analyses [6,7] or numerical simulations of foundation pit excavation and reinforcement processes [8,9], including parameter identification research based on field measurement data [10]. For example, Farrell et al. [11] observed the responses of buildings to tunnel excavation through centrifuge modeling and field research. The soil structure interaction mechanism was determined. Zhao et al. [12] used sensitivity analysis and parameter identification technology to calibrate and verify the model based on field measurements. The mechanical behavior of soil was simulated with a hardening soil model related to small strain stiffness (HSS). Schwamb et al. [13] carried out large-scale monitoring based on actual engineering cases and studied the correction of deep displacement inclinometer data during deep well construction. This study provides reference data for the subsequent project construction. Jin et al. [14] proposed an optimized intelligent model selection method which could simultaneously identify parameters during staged excavation.
Zhou et al. [15] analyzed the influence of various parameters on multi-step excavation and used multiple adaptive regression spline functions to evaluate the sensitivities of these parameters. They also investigated the effect of supporting structure layout on soil displacement. Gao et al. [16,17] carried out finite element analysis on the excavation and support processes of circular foundation pits. The stress and deformation characteristics of the underground diaphragm wall were obtained. Bagherzadeh et al. [18] and Wang et al. [19] conducted a systematic study on the permeability, porosity, and compressibility of rock fractures encountered during the exploitation and utilization of fractured reservoir resources. The coupling characteristics of rock mass materials were explored during the research process, and the impact characteristics of pore/crack parameters on fractured reservoirs were revealed. Liu et al. [20] studied the influence of the location and method of tunnel excavation support on the deformation disturbance of adjacent foundation pits. It was proven that multi-step excavation can effectively control the deformation of the tunnel adjacent to the foundation pit. Li et al. [21] carried out foundation pit construction monitoring based on actual engineering cases. The excavation deformation law of foundation pit and its influence on surrounding buildings were studied. Fattah et al. [22,23,24] carried out the finite element analysis of the settlement and deformation of surrounding rock and soil mass during tunnel excavation and support based on actual project cases. However, seepage–stress coupling and parameter check were not addressed in it. Some other scholars have carried out theoretical researches on rock and soil stability analysis based on on-site monitoring, numerical simulation, and probabilistic inverse analysis methods [25,26].
In summary, existing investigations focus on predominantly on the ground settlement caused by foundation pit excavation and the deformation of adjacent buildings. Scholars have proposed a prediction curve for surface settlement [27,28,29,30] and a settlement model [31,32,33,34,35]. However, these models do not effectively address deep soil displacement in the context of circular foundation pit excavation. There is a lagging process between the deformation of deep soil and settlement on the ground or surrounding buildings following excavation. The characteristics of the pit bottom uplift and the effective plastic strain of the soil during the excavation of a circular foundation pit are the keys to identifying the movement law of deep soil. Moreover, parameter selection significantly influences theoretical calculations and numerical simulation results. Current methods primarily rely on probabilistic inverse analysis, yet they often lack practical applicability in field settings. Additionally, there are few parameter verification approaches that effectively bridge field monitoring and numerical simulation. Therefore, developing a novel parameter verification method and investigating the deformation response mechanism of deep soil during circular foundation pit excavation and support hold substantial theoretical and practical significance.
The west circular foundation pit of the Humen Second Bridge was used as a study case to examine deep soil deformation characteristics in a circular foundation pit. To accomplish this, dynamic construction monitoring and three-dimensional modeling analysis of the foundation pit were performed. A method for validating the numerical simulation parameters based on the deep displacement monitoring data collected from the diaphragm wall was proposed. The pore water pressure superposition calculation method was adopted to model seepage–stress coupling. This approach was used to perform a layer-by-layer analysis of the characteristics of the pit bottom uplift and the effective plastic strain of the rock and soil during the foundation pit’s excavation.

2. Material and Methods
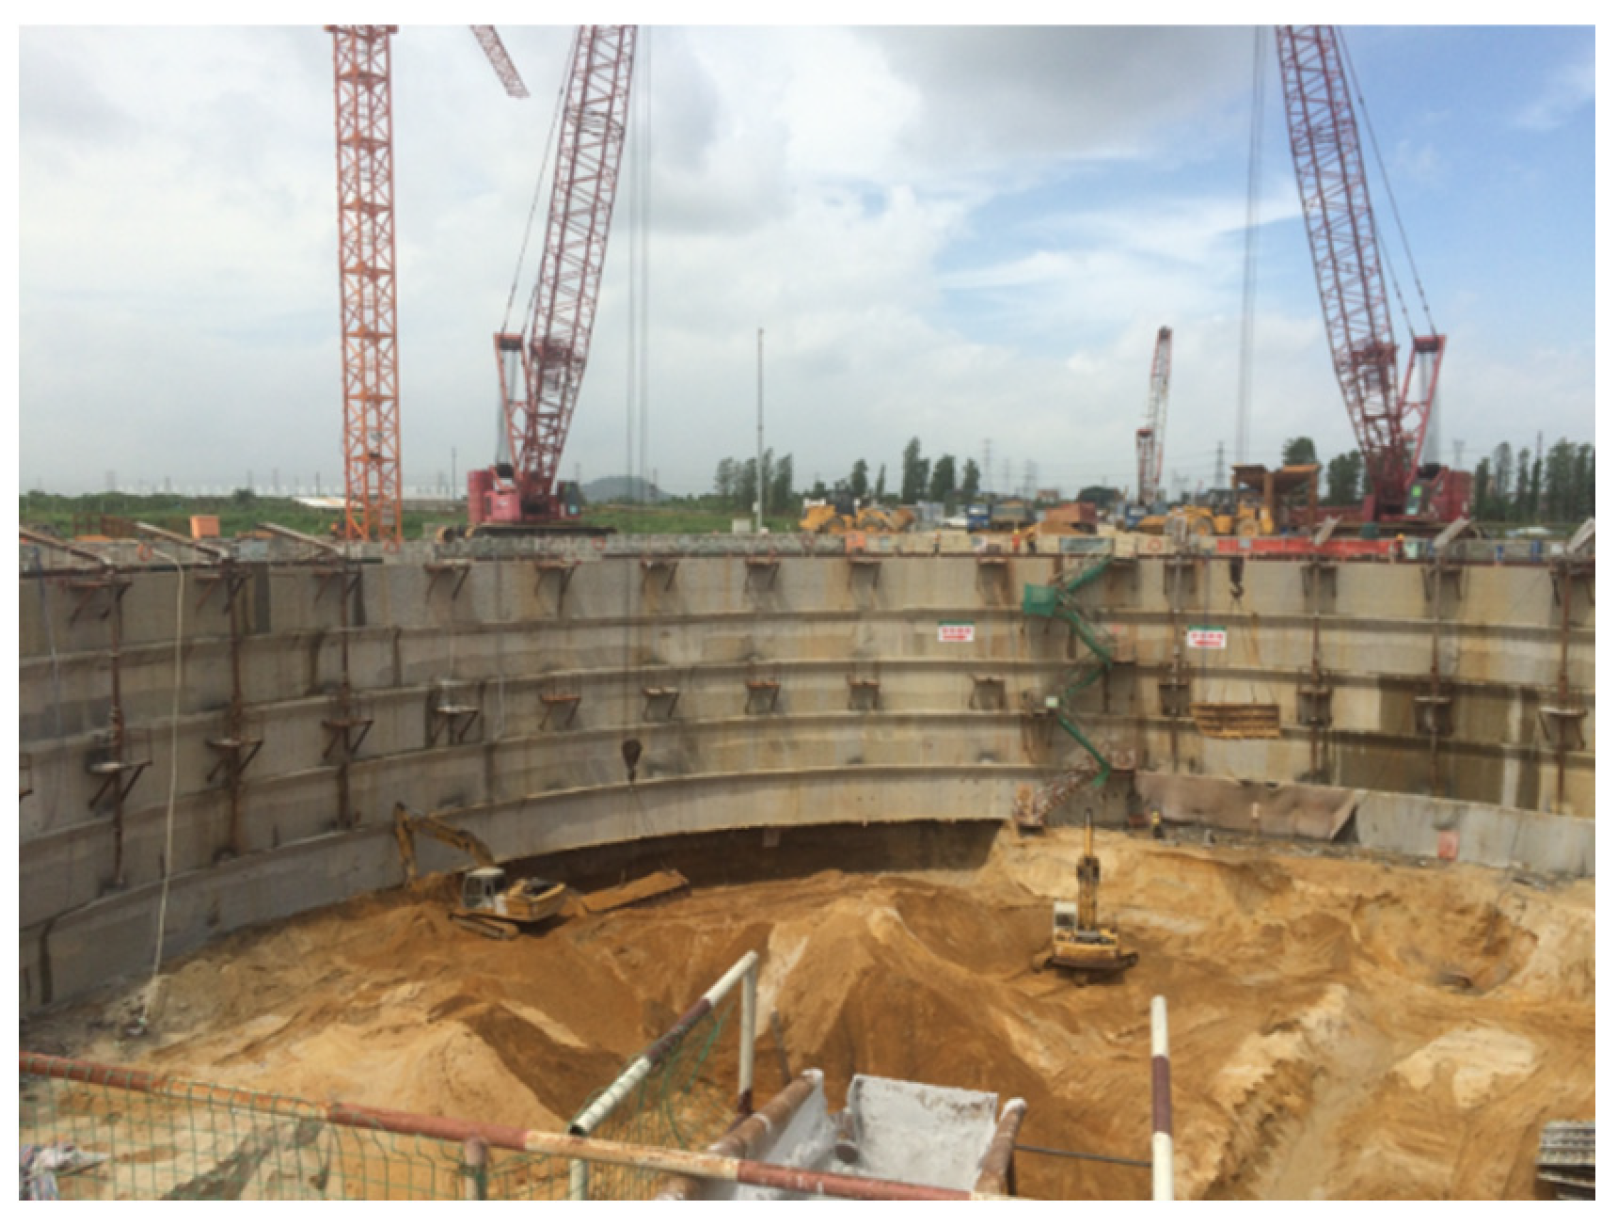
2.1. Study Area

The ground cover layer in the study area primarily consisted of Quaternary Holocene sea-land alternating facies, including silt, silty soil, sandy soil, Quaternary Pleistocene silty clay, sandy soil, and pebble soil, with a thickness ranging from 24.20 to 28.50 m. Beneath this cover, the basement layer was made up of chalk. The area’s geological composition also included mudstone from the Baihedong Formation (K1b), exhibiting uneven weathering and weathered interlayer characteristics. At depths between 32.10 and 52.00 m, stable, continuous layers of moderately and slightly weathered rocks were encountered, with some rugged rock formations extending up to 19.90 m in height (Figure 1).
Figure 1 Alt text: The figure shows the geological classification and depth position information along the direction of the bridge, drawn based on the geological data information revealed by drilling. Among them, 羊 represents strong weathered mudstone; ¥ represents middle weathered mudstone; and Ұ represents micro-weathered mudstone.
The groundwater in the study area primarily consisted of Quaternary pore-confined water, along with some bedrock fissure-confined water. Silt, silty clay, residual soil, and fully weathered rock were relatively impermeable and acted as a natural barrier to water flow, while the sand-gravel layer served as the primary water-bearing formation. The underlying mudstone contained weathered fissures.
The diaphragm wall had an outer diameter of 82.00 m and a thickness of 1.50 m, with its base embedded in argillaceous siltstone and moderately weathered mudstone. The construction of the diaphragm wall was carried out in two phases, referred to as Phase I and Phase II groove sections. Each phase comprised 27 groove sections, arranged at intervals and connected by circular locking pipes. Phase I groove sections were constructed using three-axis milling, with side groove axes measuring 2.80 m, middle groove axes measuring 1.47 m, and a total groove section axis length of 7.07 m. The angle between the side groove and the middle groove was 176.96°. Phase II groove sections also measured 2.80 m in length, with an intersection angle of 176.37° between Phase II and Phase I grooves. The total groove length was 7.07 m, with a lap length of 0.25 m between the Phase II and I trough segments. The maximum designed groove depth was 46.0 m (Figure 2).
Figure 2 Alt text: This figure was drawn based on the drilling core data and the coordinate positions of each groove section of the underground continuous wall, showing the unfolded structure of the underground continuous wall and the relationship between the positions of each stratum. The black dots in the figure represent slots 2, 15, 28, and 42 in sequence from left to right.
Following the construction of the diaphragm wall, the top-down method was used to excavate the soil and build the foundation pit lining layer by layer (Figure 3). The construction timeline for each layer was coordinated with the excavation progress. The total excavation depth reached 27 m, with each excavation and lining layer limited to a maximum height of 3 m. The inner lining was constructed from top to bottom, with a thickness of 1.5 m from 0 to 6 m depth and 2.0 m beyond 6 m. Both the top and bottom plates were 6 m thick, with core concrete filling the internal space between them (Figure 4).
Figure 3 Alt text: The figure shows the excavation of the sixth layer of soil at the construction site. At this point, the lining of the first to fifth layers has been completed, while the lining of the sixth layer has not yet been constructed.
Figure 4. Elevation of foundation pit excavation sequence along the bridge direction (unit: m).
Jmse 13 00349 g004
Figure 4 Alt text: The figure shows the excavation of each layer of the foundation pit along the direction of the bridge, the underground continuous wall, the lining, and the size and position of the foundation pit.

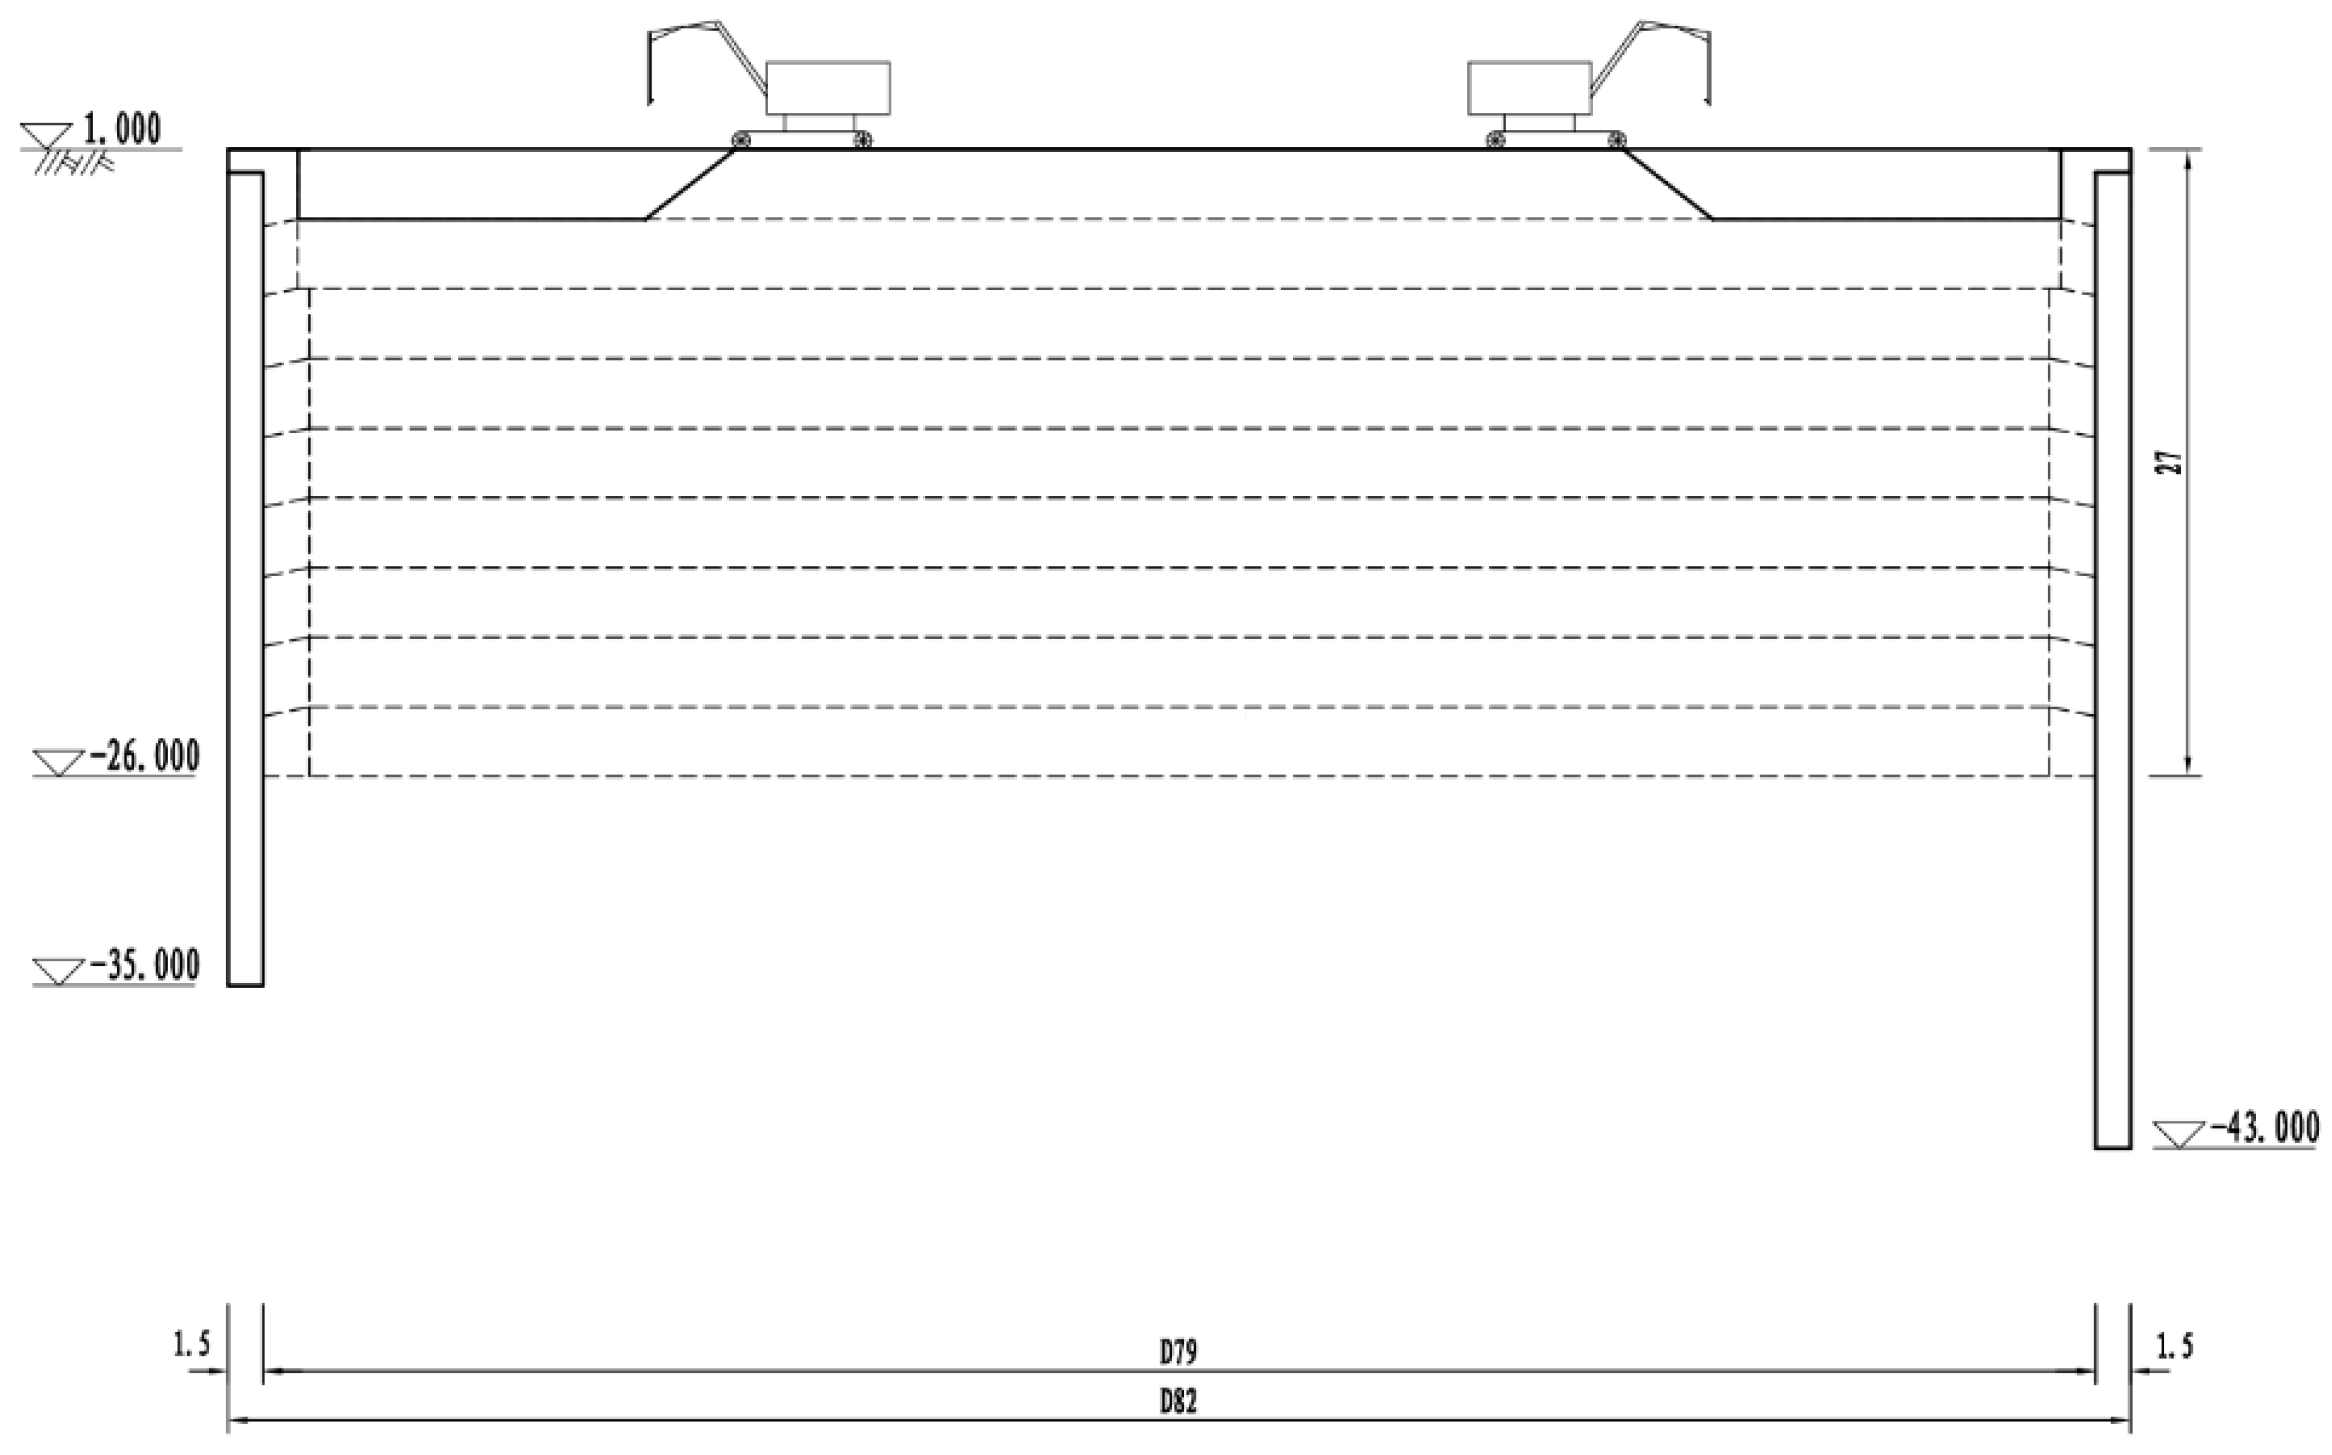
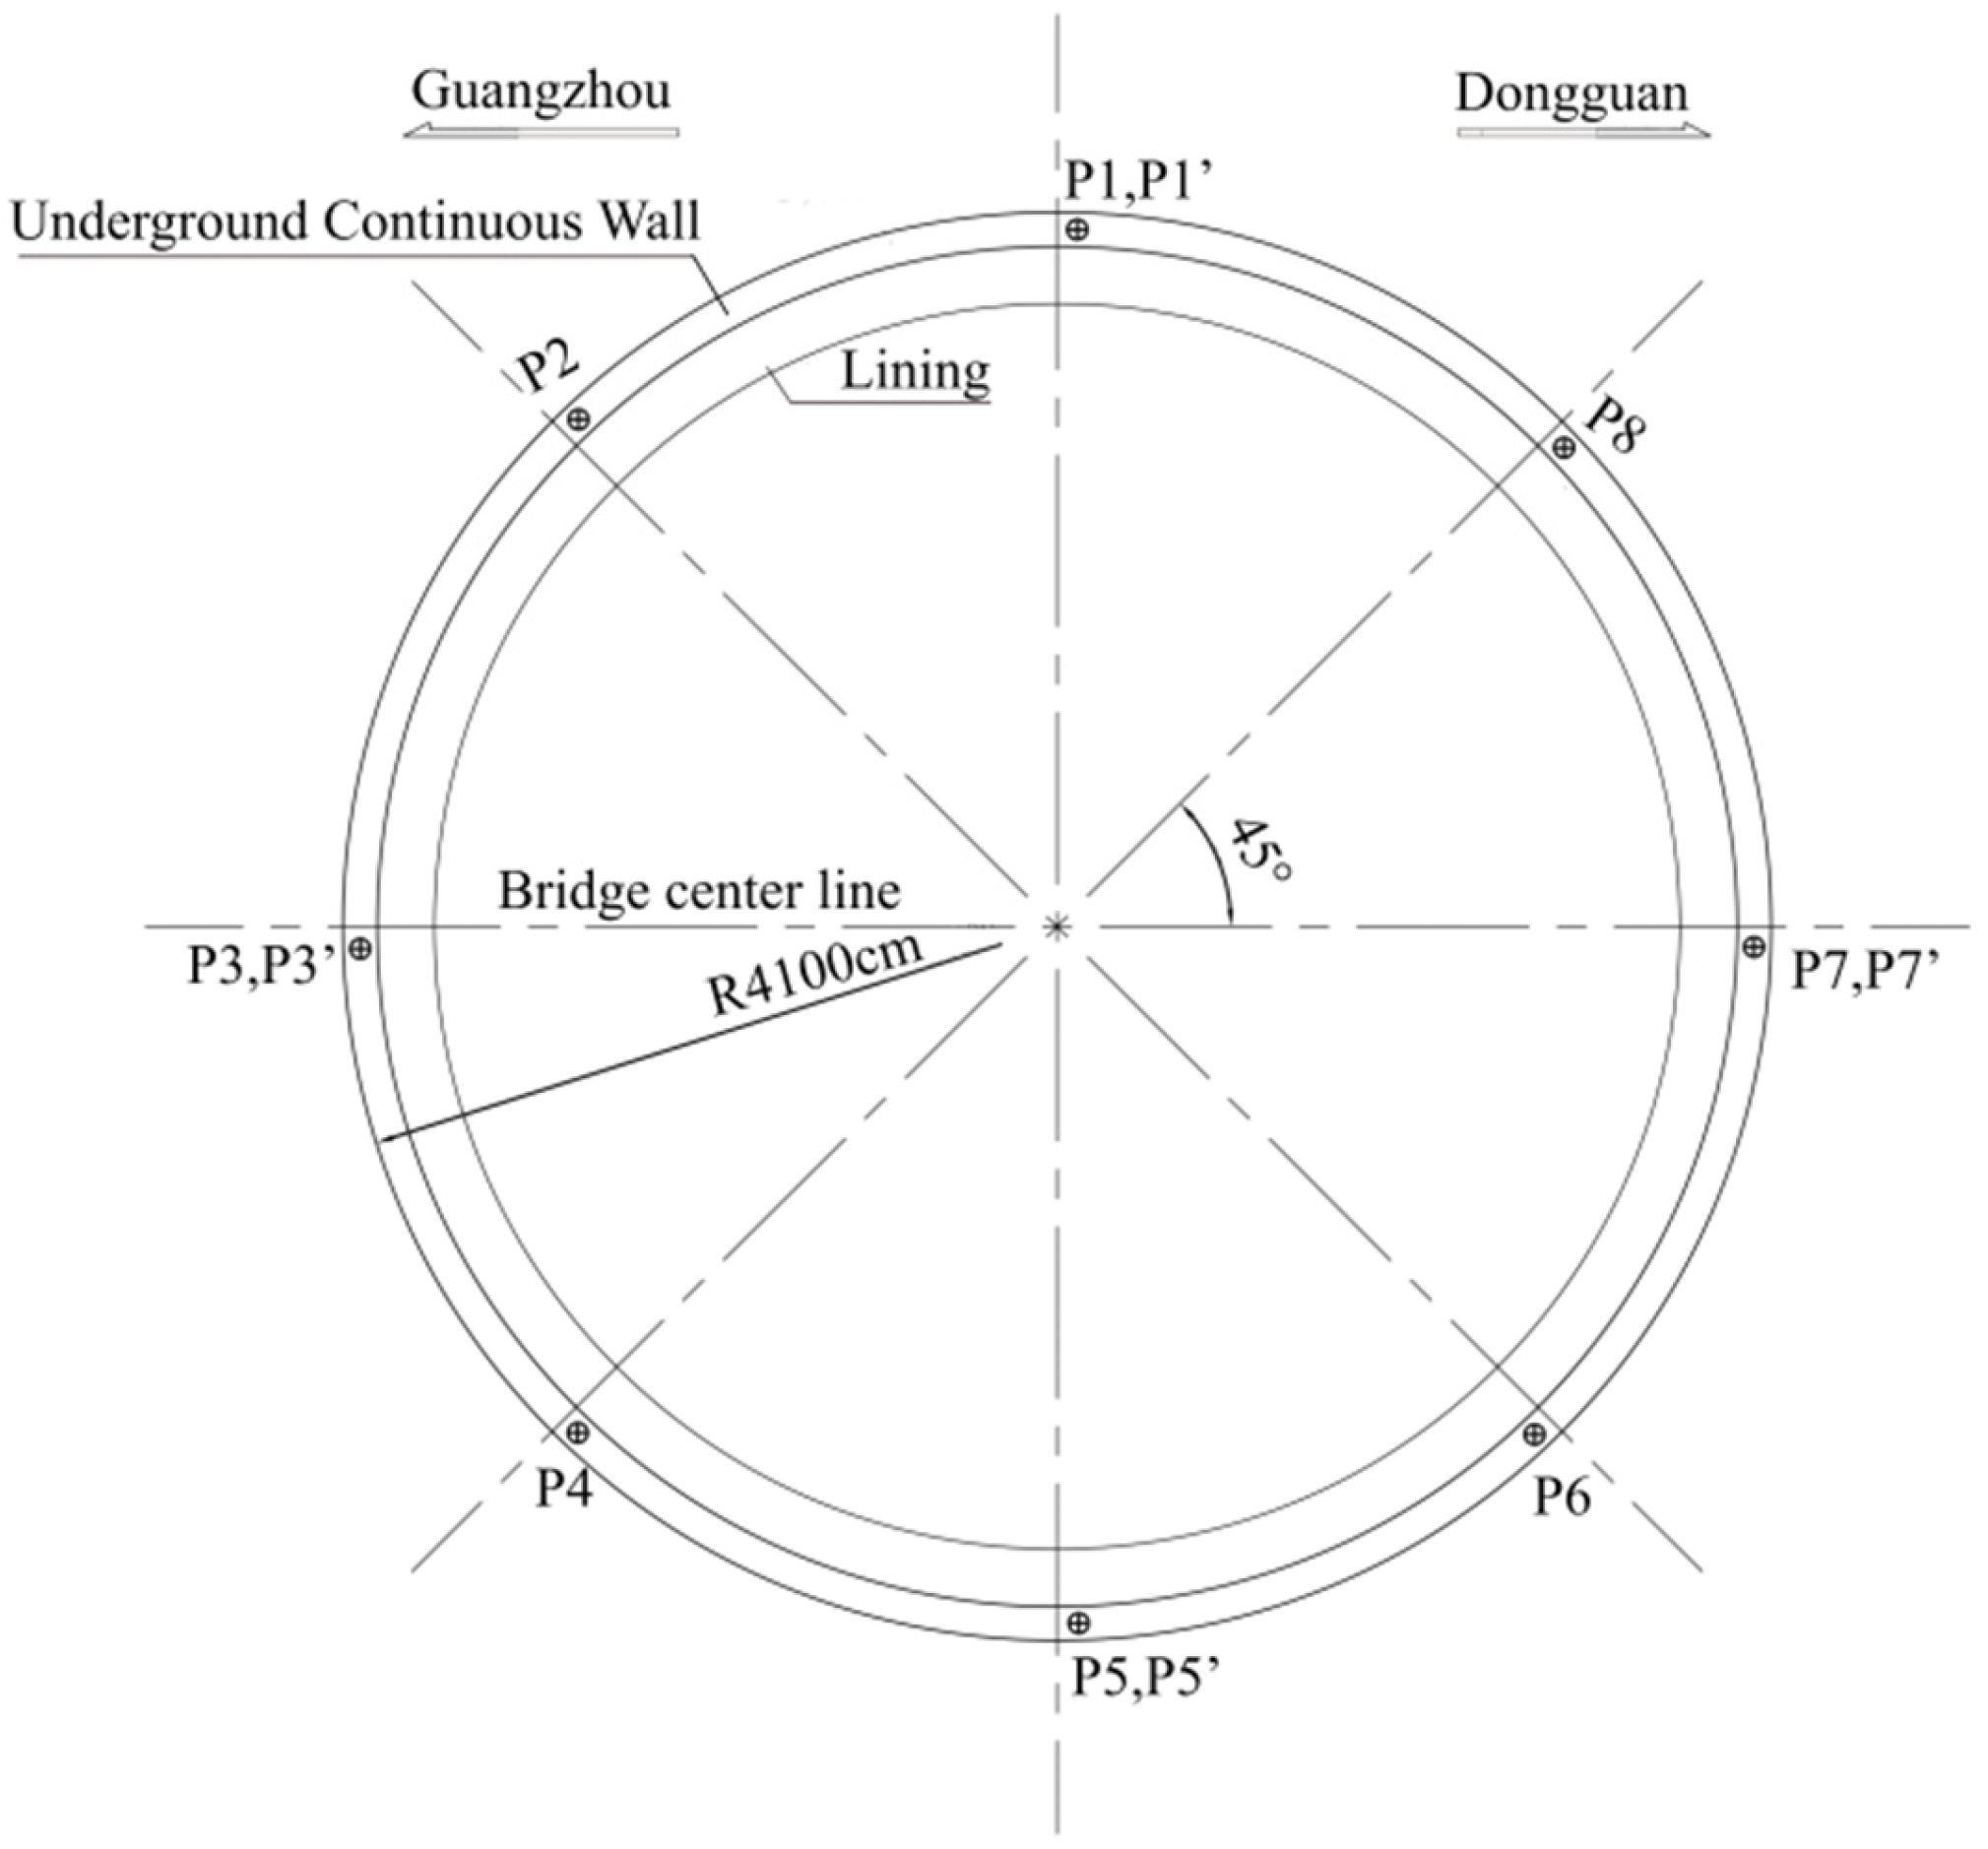
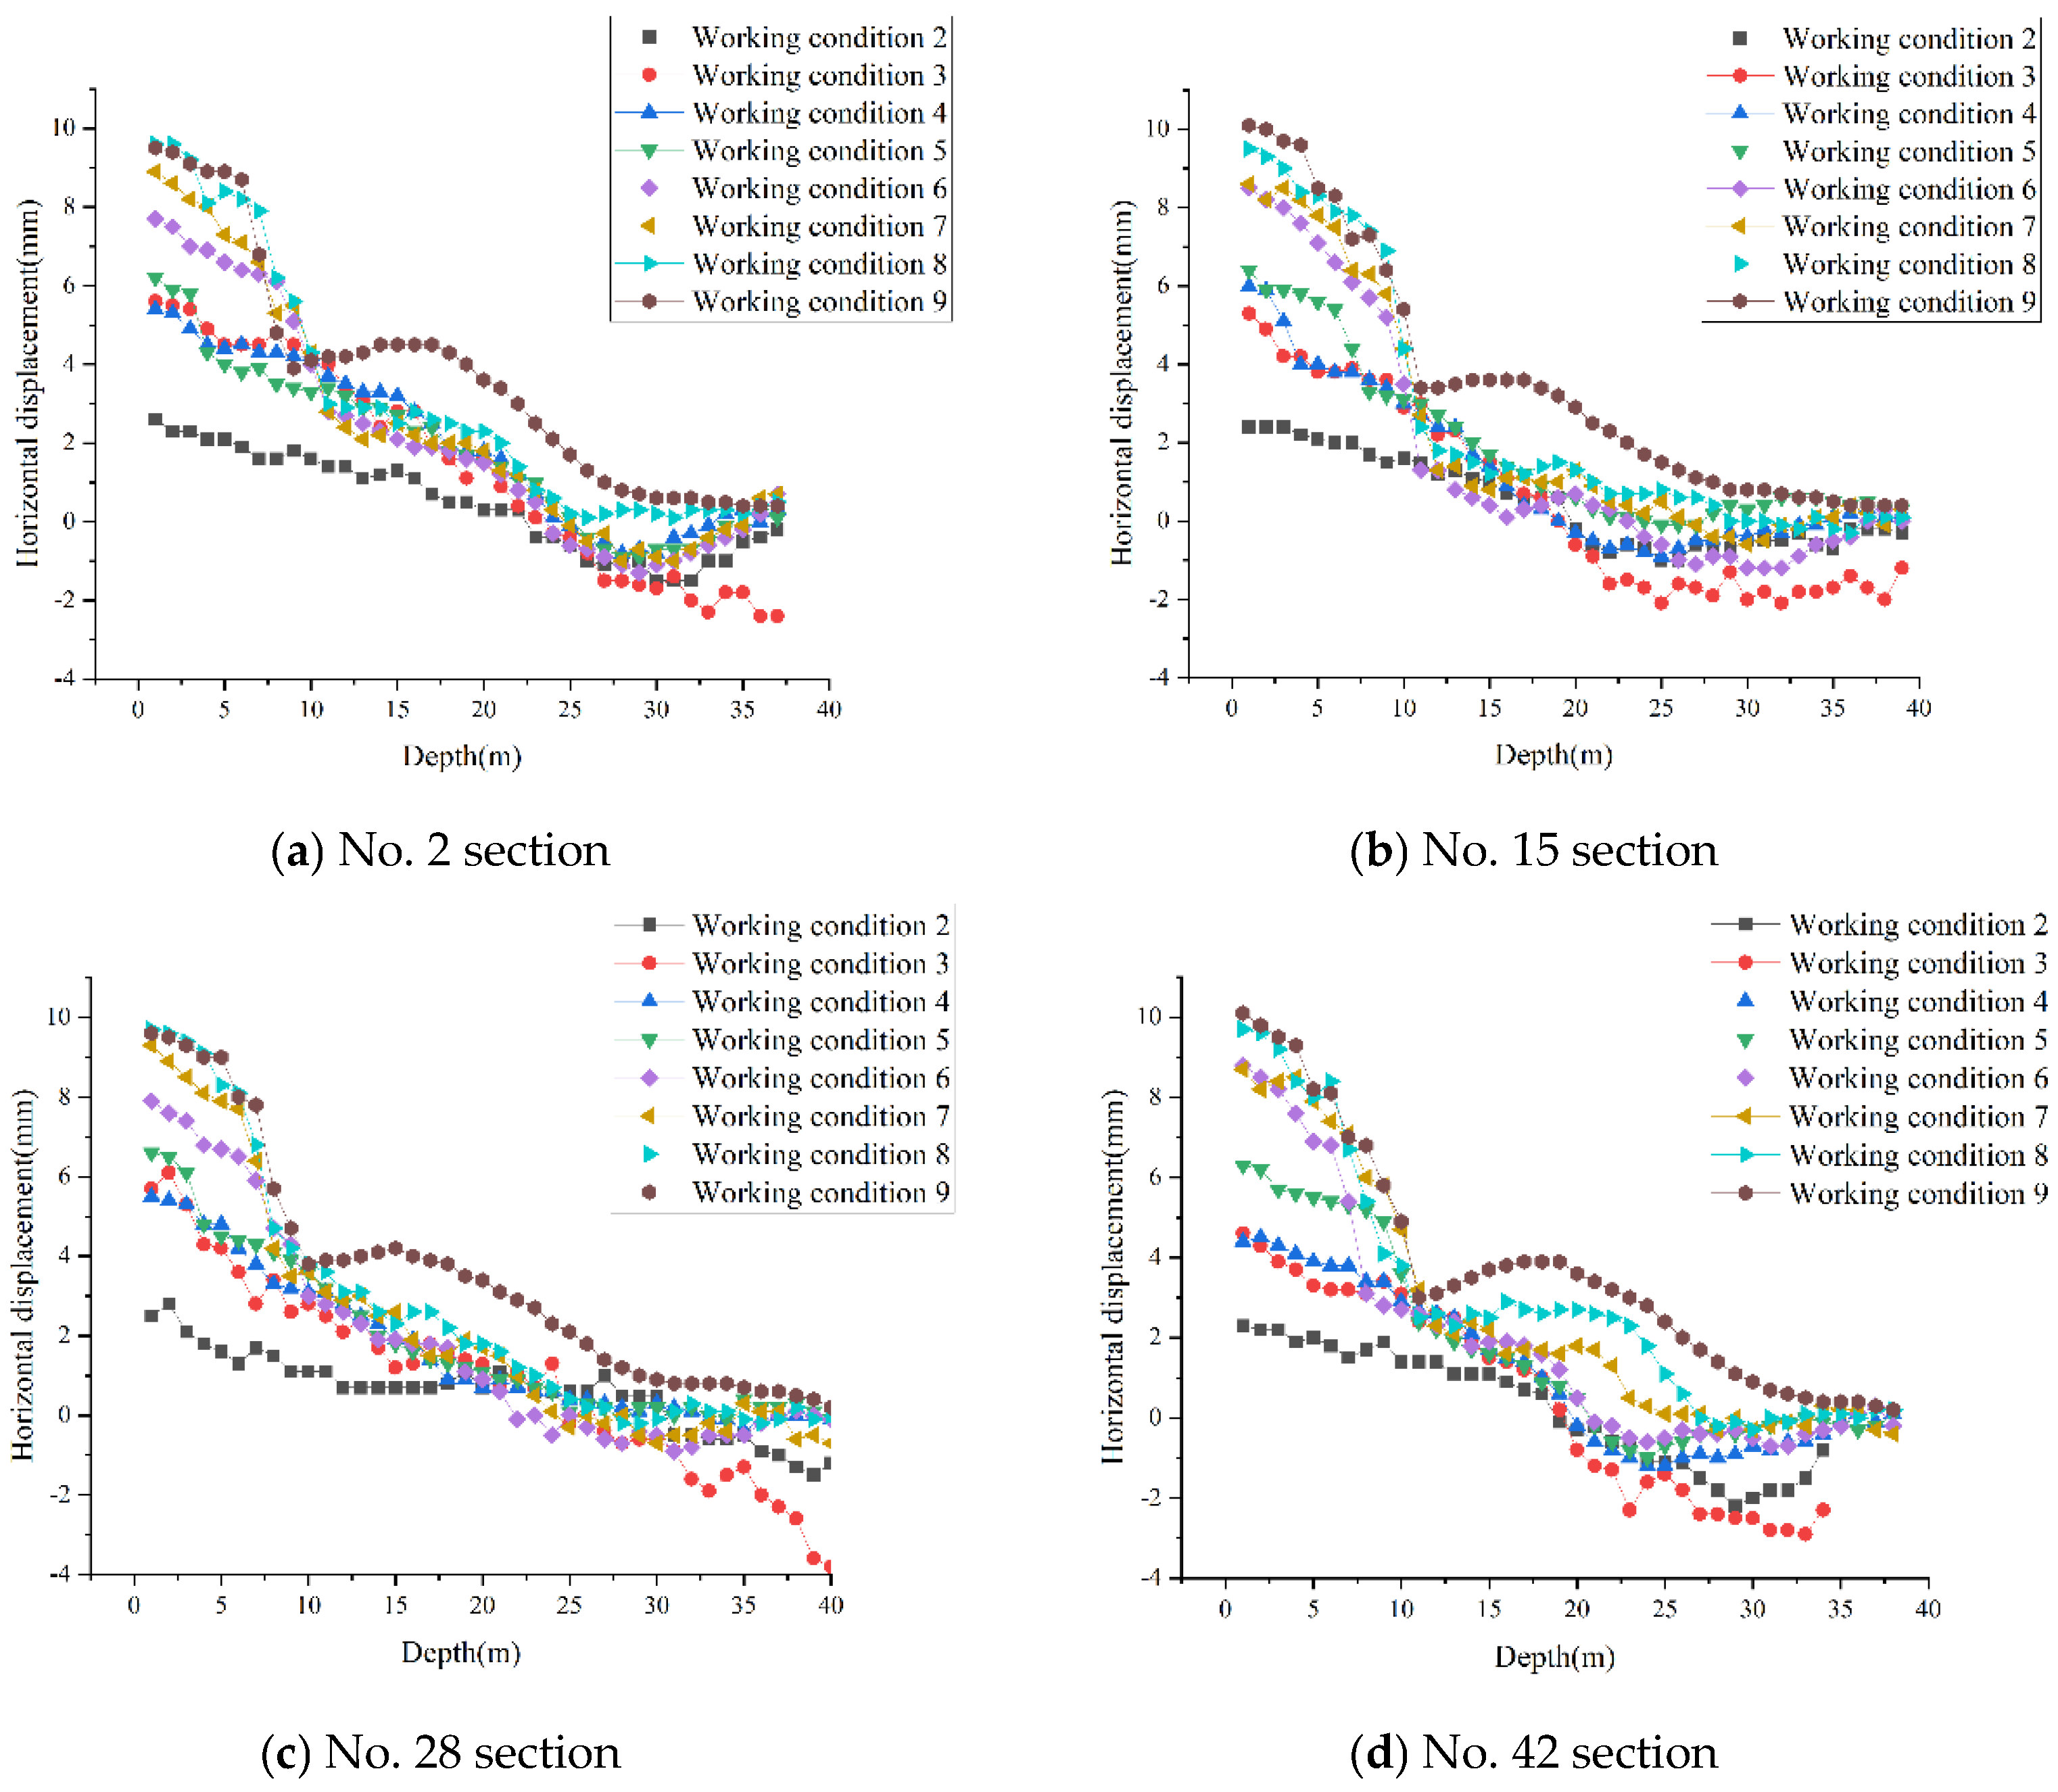
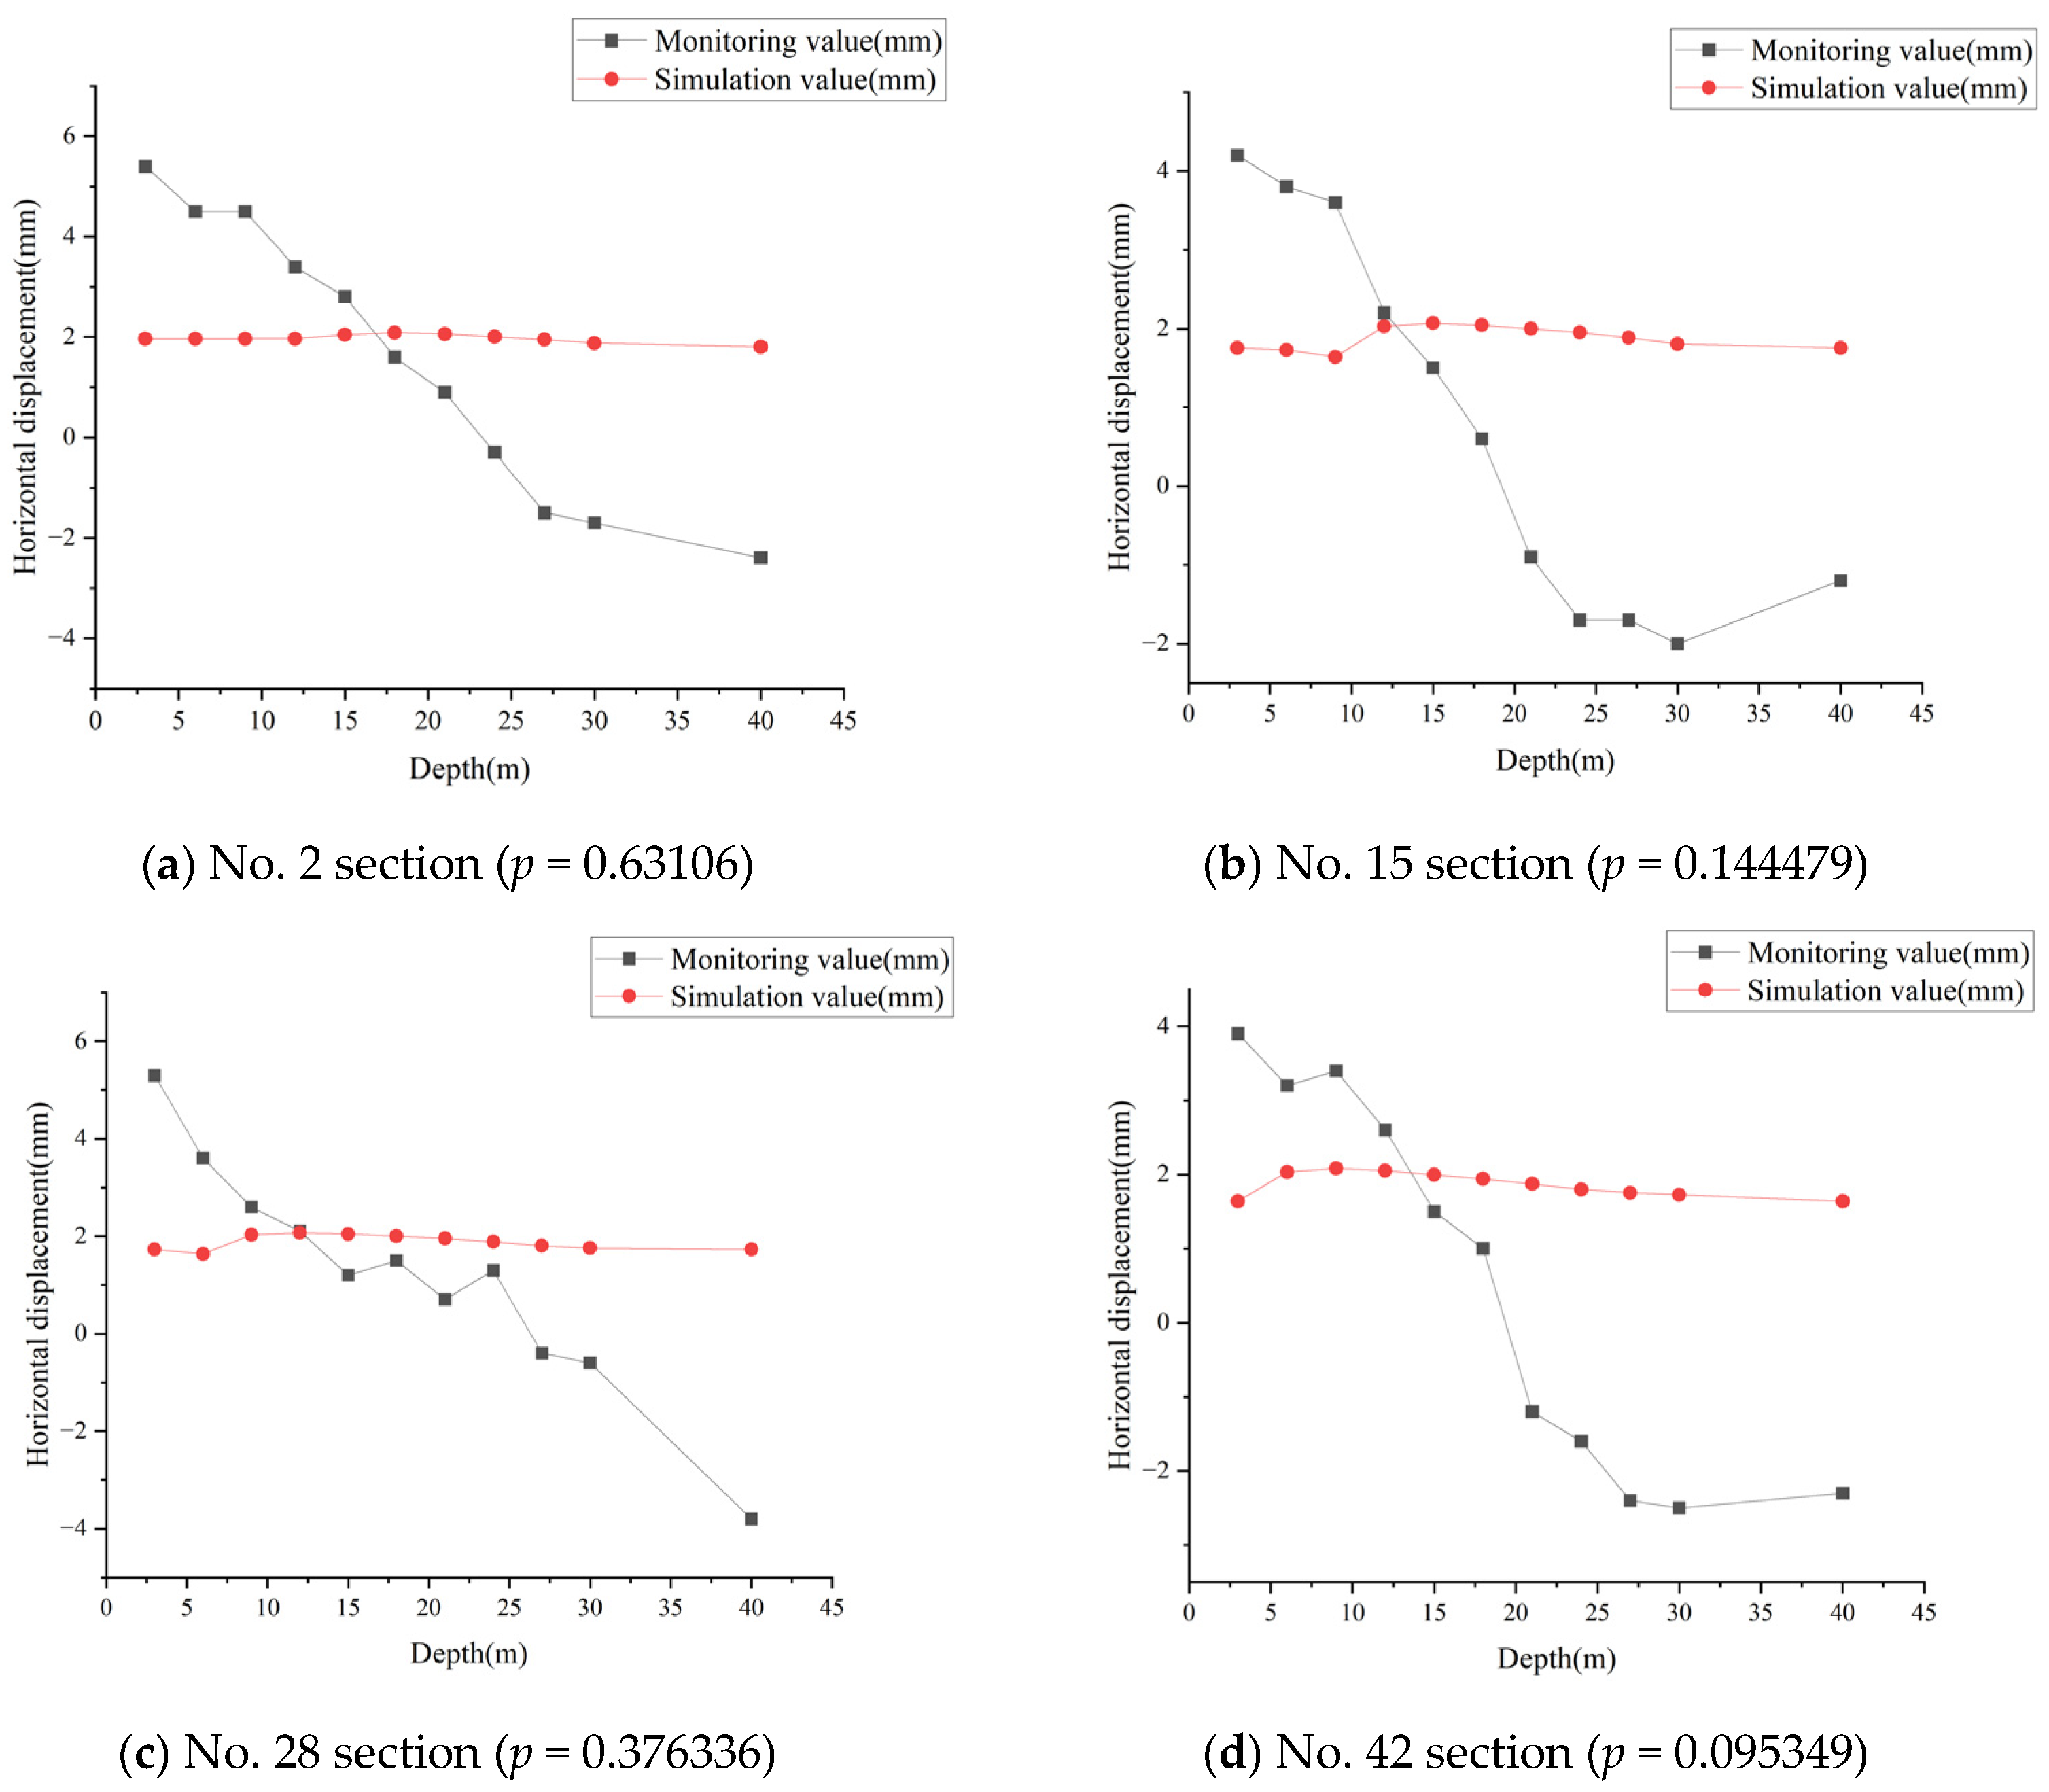
2.2. Monitoring the Horizontal Displacement of the Diaphragm Wall

A PVC plastic pipe with a diameter of 70 mm and a guide groove were embedded in the diaphragm wall to monitor the lateral displacement of the enclosure structure. Eight holes (P1–P8) were evenly distributed around the foundation pit, as shown in Figure 5. To ensure the inclinometer tubes functioned properly under the effects of high-pressure concrete, four additional inclinometer tubes were added in spare holes at P1′, P3′, P5′, and P7′, making a total of 12 inclinometer tubes.
Figure 5 Alt text: The figure shows the relationship between the installation position of the deep displacement monitoring equipment and the dimensions of the underground continuous wall structure.
During the excavation of the foundation pit, several monitoring activities were carried out, including the displacement of the diaphragm wall, ground surface displacement, and pore water pressure. However, due to challenges in installing measurement points and limitations imposed by the actual construction conditions, the displacement of the diaphragm wall was almost the only project that could collect data throughout the entire life cycle of the foundation pit. As a result, diaphragm wall displacement was chosen as the parameter verification criterion for this study.

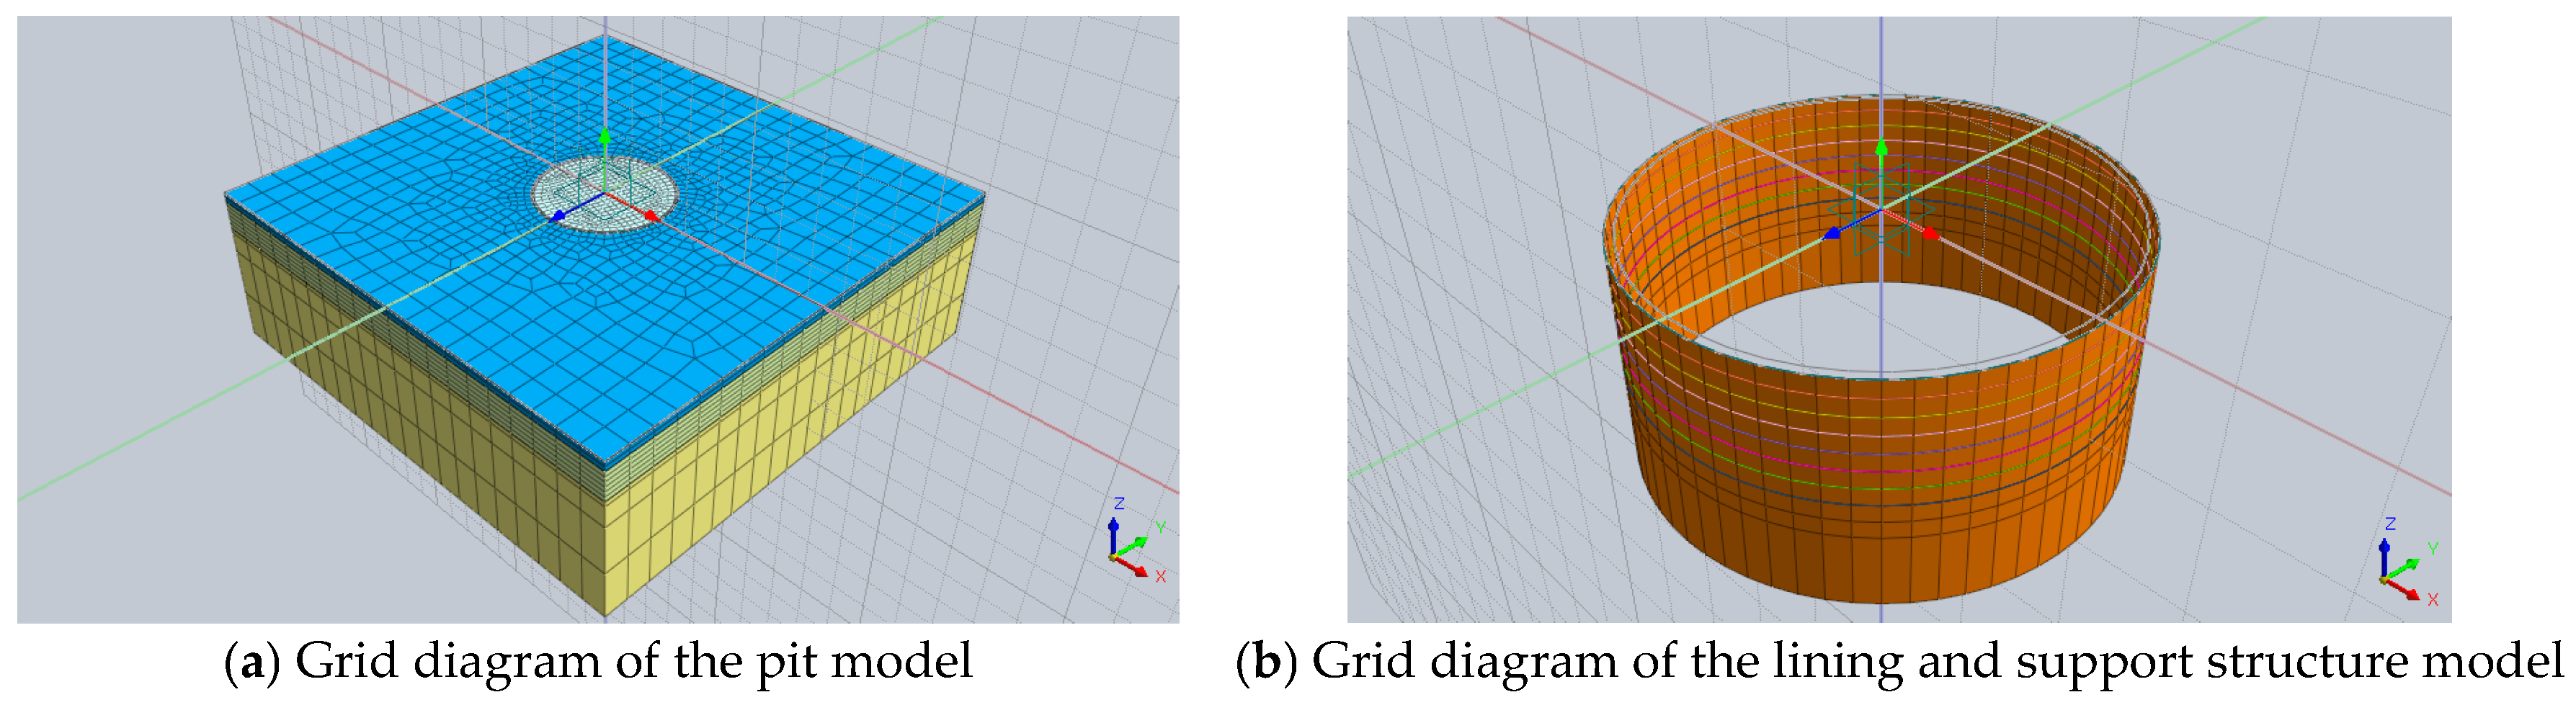
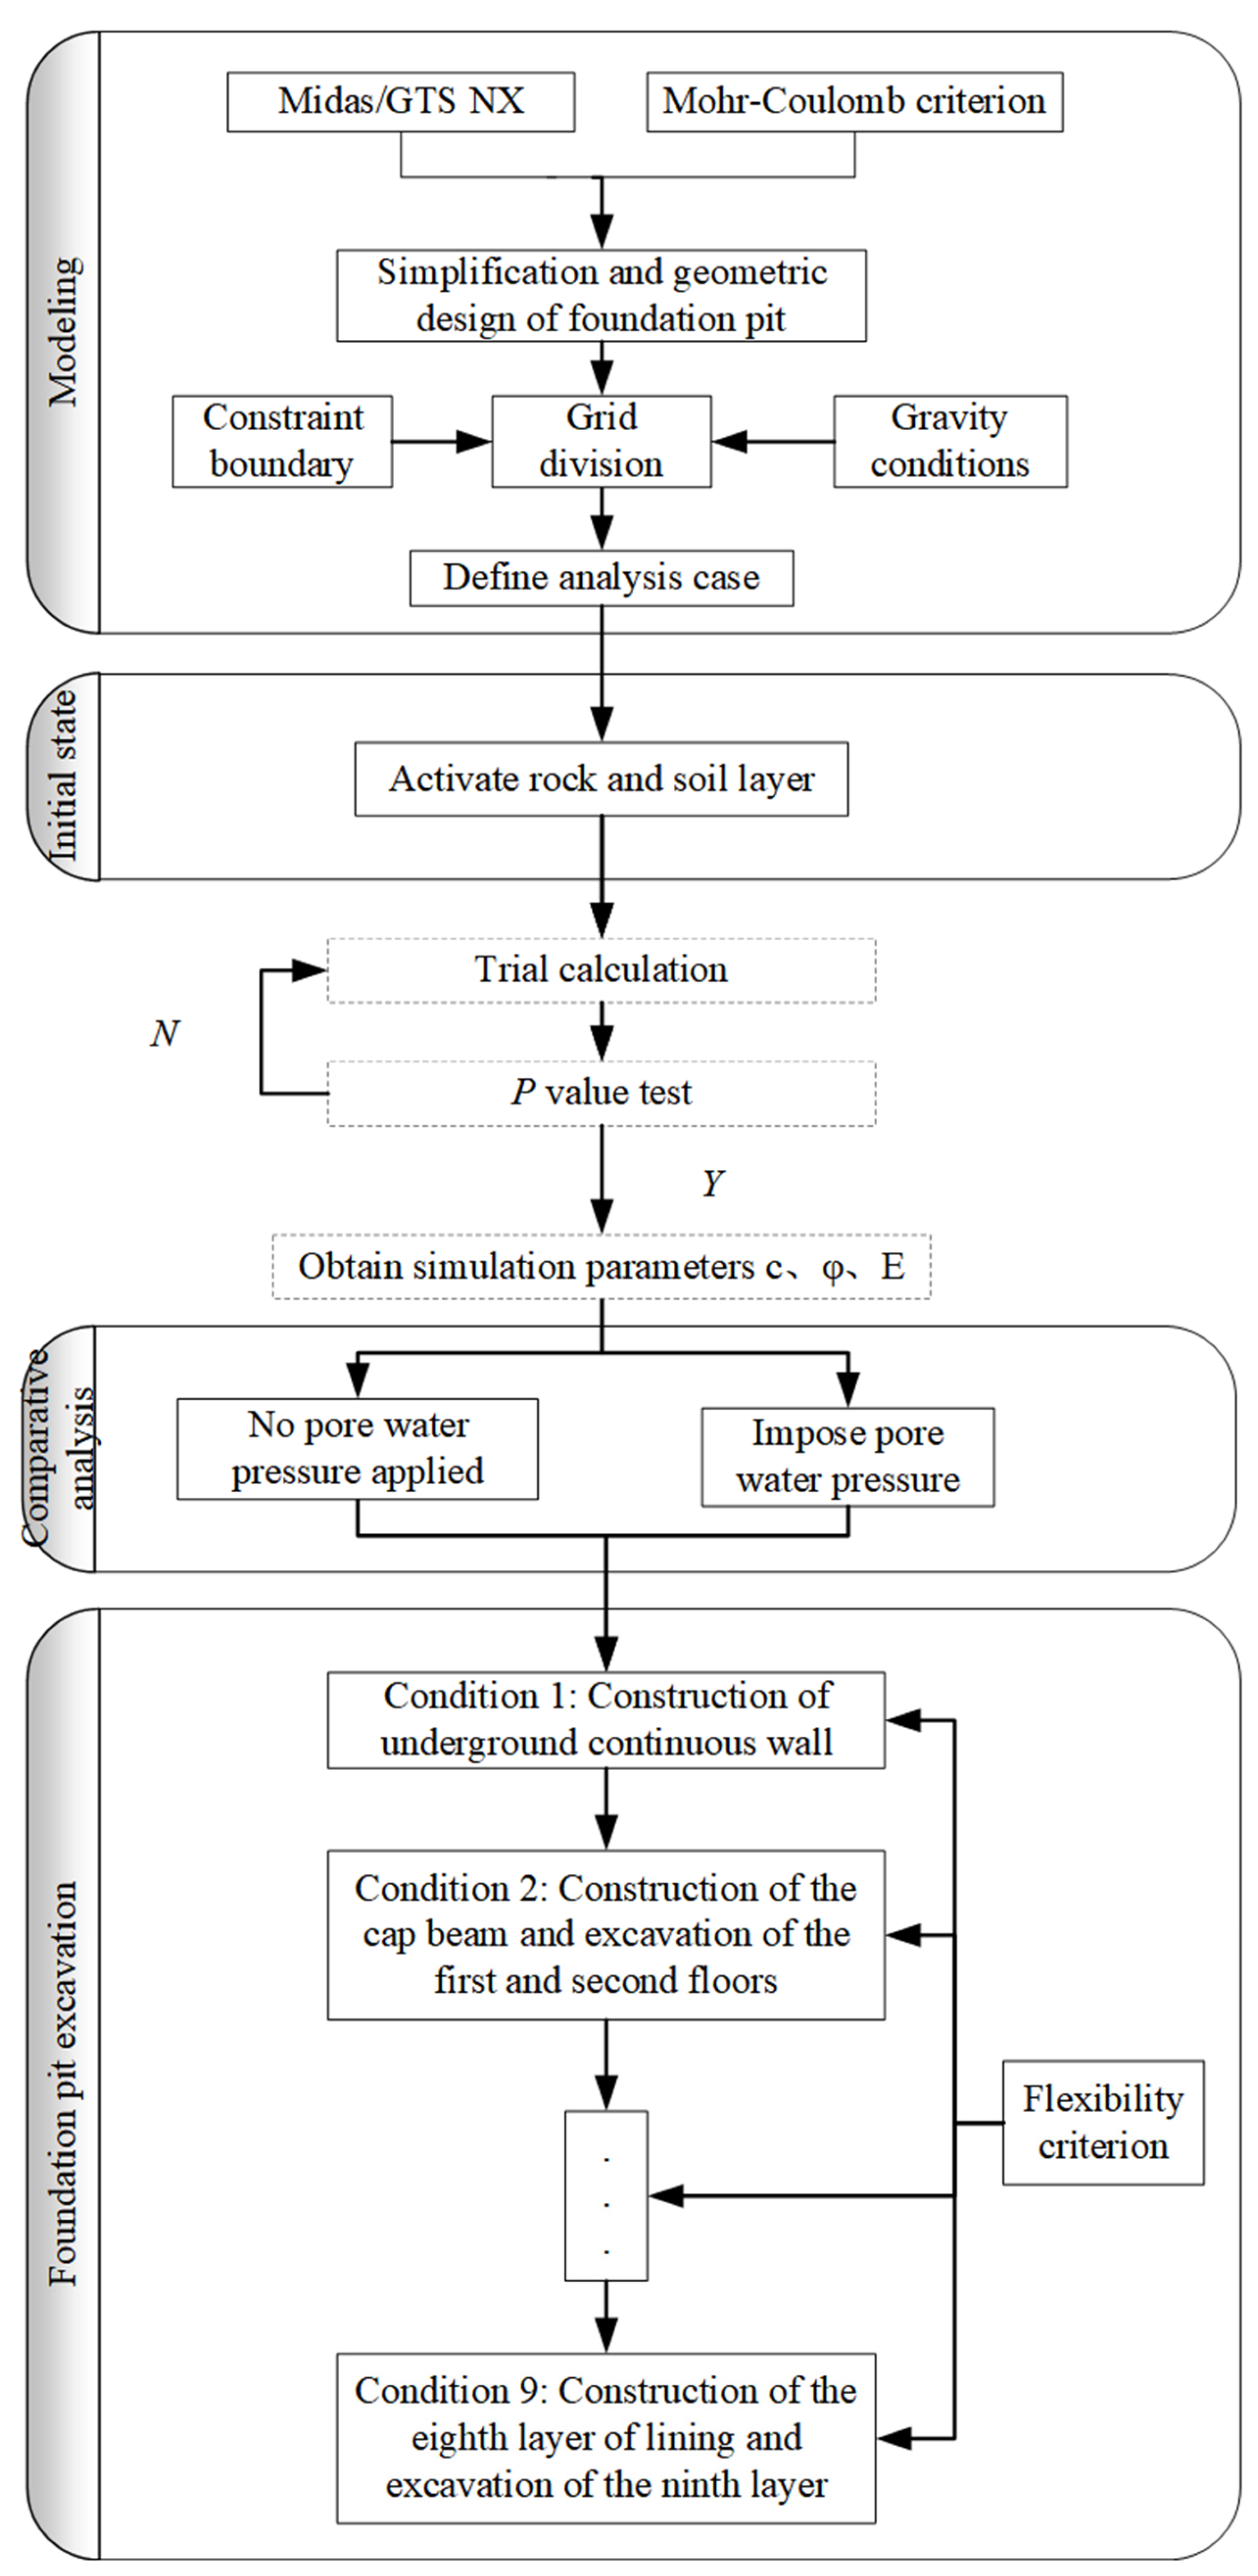
2.3. Model Design and Establishment

2.3.1. Simulation Assumptions and Regions

Midas/GTS NX (2022R1) software was used for modeling the foundation pit. Given the complex geological environment and the intricate forces and deformations involved in the excavation and support process, the following assumptions were made for the simulation:
(1) The rock-soil mass was treated as an ideal elastoplastic material, adhering to the Mohr–Coulomb strength yield criterion.
(2) The influence of groundwater and seepage flow on the foundation pit was simplified as steady-state flow.
(3) Each structural unit of the diaphragm wall and inner lining was assumed to behave as an ideally elastic material.
The design calculation model measured 300 m in length and width and 100 m in depth (Figure 6a). The soil layer of the foundation pit is shown in Table 1.
Figure 6 Alt text: The figure shows the mesh division of the computational model. Among them, Figure 6a shows the mesh division of each rock and soil layer in the model, and Figure 6b shows the mesh division of the underground continuous wall and lining.
Table 1. Classification of soil layers in foundation pits (from top to bottom).
Depth (m)Soil Layer Category
0–3silt
3–6silty clay
6–12silty sand
12–18medium sand
18–24coarse sand
24–40strong weathered mudstone
40–70middle weathered mudstone
70–100micro-weathered mudstone
The deeper end of the diaphragm wall was embedded in weathered mudstone up to 10–20 m deep (Figure 2). The foundation pit lining was 1.5 m thick from 0 to 6 m depth and 2 m thick below that.
The default contact parameters in the model included a normal stiffness scaling factor of 1 and a tangential stiffness scaling factor of 0.1. Auxiliary nodes were adjusted to eliminate internal penetration.
The rock and soil layers were defined by entity attributes within the model. The grid was divided into 10 × 10 m2 in the XY plane, while the Z-direction meshing was based on the thickness of the rock and soil layers. The lining was represented by line properties, with section dimensions of 1.5 m × 3.0 m (Figure 6b). The underground diaphragm wall was defined by plane attributes, with a thickness of 1.5 m. The reinforced concrete used in the inner lining and diaphragm wall had a thermal expansion coefficient of 1 × 10⁻⁶ and a damping ratio of 0.05. The calculation of the rock and soil layer behavior was performed under drained conditions.
Connections between the lining and diaphragm walls, as well as between the diaphragm walls and geotechnical layers, were established using the default contact parameters.

2.3.2. Model Boundary Conditions

The numerical simulation model was assigned the following boundary conditions:
(1) The left and right boundaries were constrained in the X direction, setting u = 0, where u represents displacement in the X direction, v in the Y direction, and w in the Z direction.
(2) The front and back boundaries were constrained in the Y direction, setting v = 0.
(3) The bottom boundary of the model was fully constrained, with u = 0, v = 0, and w = 0.
(4) The upper boundary of the model was a free boundary with no constraints.
(5) The initial stress was the self-weight stress of the geological formation.
The rock and soil layer mesh elements were 3D solid elements. The mesh elements of the underground continuous wall were 2D slab elements. The cap beam and lining were 1D beam elements.
The model contained a total of 15,840 units, 17,680 nodes, and 50,588 calculation equations. The overall grid division models of the foundation pit, the diaphragm wall, and the lining structure are shown in Figure 6.

2.3.3. Seepage-Stress Coupling and Process Analysis

Foundation pit engineering projects are temporary. This unique characteristic indicates that most instability, damage, and accidents occur during the construction period, especially in complex projects involving multiple processes. Therefore, determining the forces and deformations of the supporting structures in foundation pit engineering is more of a process issue than a state problem. This paper proposes a foundation pit engineering process analysis, taking into account the uncertainties of stress, deformation, and failure during the excavation and reinforcement processes.
In order to compare and analyze the excavation and support process of foundation pits before and after the application of pore water pressure, this study intends to conduct simulation calculations for three different processes: ① without considering pore water pressure calculation (Table 2), ② obtain pore water pressure through steady-state seepage calculation (Table 3), and ③ apply pore water pressure (use the pore water pressure calculated in ② as the node load applied to model ①).
The design calculation conditions for applying pore water pressure are as follows: Add the pore water pressure calculated in Table 3 as the node load to the corresponding working conditions in Table 2 for calculation.
The overall methodology flowchart of this study is shown in Figure 7.
Figure 7 Alt text: The figure shows a detailed diagram of the research content and method flow of this article. Including basic modeling theories and ideas, parameter verification methods, calculation with and without consideration of pore water pressure, and calculation steps for various construction conditions.

2.3.4. Model Parameter Validation

The calculation of the foundation pit excavation and reinforcement simulation parameters is primarily influenced by several key geotechnical factors. The selection of these parameters has been a subject of ongoing debate. Current approaches for acquiring these parameters include conducting geotechnical tests, using statistical data from similar strata, and relying on empirical data.
Each of these parameter acquisition methods has its shortcomings. The parameters obtained from geotechnical tests often differ from those in actual projects, necessitating corrections. Similarly, the statistical data method is only applicable to common strata and requires a significant accumulation of engineering data. The empirical data method is convenient but lacks rigor. More importantly, none of these methods is universally applicable. Parameters obtained through these methods cannot easily be applied to foundation pit engineering projects in special geological environments. Due to the limitations of traditional theoretical calculations and finite element analysis, it is crucial to identify a method that can use field measurement–displacement data (hereinafter referred to as monitoring values) to validate the main parameters for the simulation of foundation pit engineering projects.
Hypothesis testing is commonly employed to assess the significance of key statistics, with p-values often serving as the foundation for decision making. The p-value indicates the probability of an event occurring, and a p-value of less than 0.05 is typically considered to signify a statistically significant difference between values or groups. In the Mohr–Coulomb elastic–plastic model, the cohesion (c), internal friction angle (φ), and elastic modulus (E) of the rock mass have the most significant impact on the calculation results. Therefore, c, φ, and E were selected as the parameters to be validated in this study (Table 4: Initial Values). If the error between the simulation results and the monitoring values falls within an acceptable tolerance (p > 0.05), the physical and mechanical parameters used in the simulation model are considered reasonable. Once these parameters are validated, simulation calculations can be carried out under other working conditions.
The required Poisson’s ratio, bulk density, and permeability coefficient for the initial calculations were obtained through geotechnical tests (not included in the verification process). The elastic modulus, friction angle, and cohesive force were obtained from on-site engineering geological survey reports and preliminary research.
The underground diaphragm wall was divided into 54 trough sections. To facilitate statistical data processing, the normal horizontal displacement at corresponding depths of trough sections 2, 15, 28, and 42 was selected for analysis. Figure 8 shows the measured normal horizontal displacement at these depths.
Figure 8 Alt text: The figure shows the actual displacement of the underground continuous wall obtained from on-site monitoring in this study. Figure 8a shows the deep displacement monitoring data at slot section 2 for each working condition. Figure 8b–d show the deep displacement monitoring data at slot sections 15, 28, and 42 for each working condition, respectively.
The three-factor (c, φ, E) multi-level orthogonal experimental design principle was used to perform the trial calculation of the simulation parameters for the second working condition. Displacements of groove sections 2, 15, 28, and 42 of the diaphragm wall, obtained from the trial calculation and measured data under the second working condition, were extracted for p-value testing (Figure 9). The verified parameters under condition 2 were then used to carry out the simulation calculation and early warning analysis for condition 3. Similarly, the horizontal displacement data of groove sections 2, 15, 28, and 42 of the underground continuous wall, calculated under condition 3, were extracted and compared with the measured data for p-value verification (Figure 10). This process was repeated until the simulation calculation parameters for working condition 9 were obtained (Figure 11).
Figure 9 Alt text: The figure shows the parameter verification results of operating condition 2. Figure 9a shows the parameter verification results based on deep displacement monitoring data for the monitoring points of slot 2. Figure 9b–d show the calculation parameter verification results for the monitoring positions of slots 15, 28, and 42, respectively.
Figure 10 Alt text: The figure shows the parameter verification results of operating condition 3. Figure 10a shows the parameter verification results based on deep displacement monitoring data for the monitoring points of slot 2. Figure 10b–d show the calculation parameter verification results for the monitoring positions of slots 15, 28, and 42, respectively.
Figure 11 Alt text: The figure shows the parameter verification results of operating condition 9. Figure 11a shows the parameter verification results based on deep displacement monitoring data for the monitoring points of slot 2. Figure 11b–d show the calculation parameter verification results for the monitoring positions of slots 15, 28, and 42, respectively.
Note: The actual measurement and simulation verification results for working condition 2 are as follows: p = 0.063623 > 0.05 in section 2; p = 0.060886 > 0.05 in section 15; p = 0.084881 > 0.05 in section 28; and p = 0.055547 > 0.05 in section 42. According to the p-value analysis, the parameters obtained from the check calculation for working condition 2 were valid.

3. Results and Discussion

3.1. Simulation Parameter Selection

The simulation parameters for the diaphragm wall and lining were determined based on the specifications. Poisson’s ratio, unit weight, and permeability coefficient were selected through geotechnical tests. The elastic modulus, friction angle, and cohesion were determined by simulation trial calculation and p-value inspection. Table 5 shows the rock and soil simulation parameters verified according to the displacement monitoring data. Table 6 shows the simulation parameters for the foundation pit support structure.

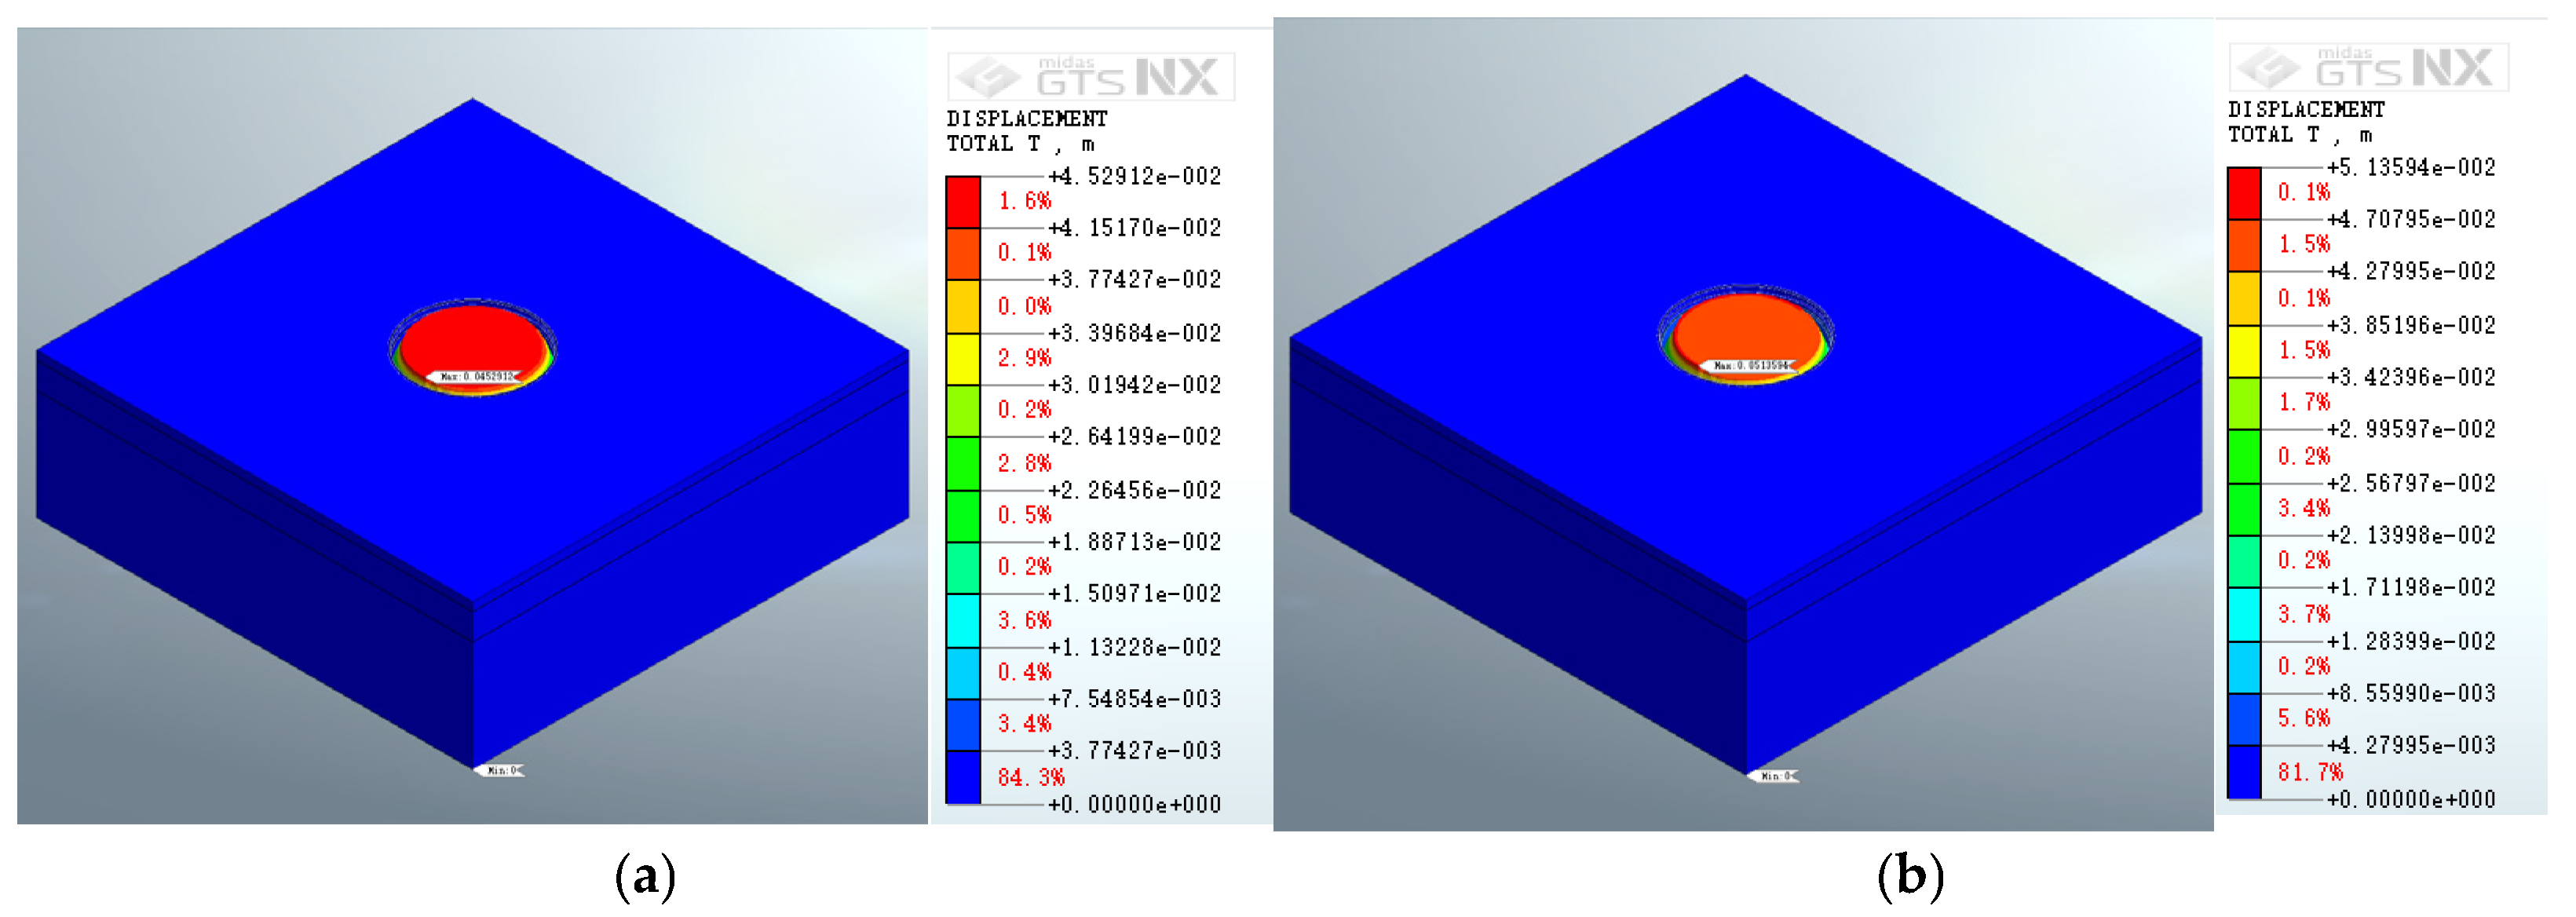
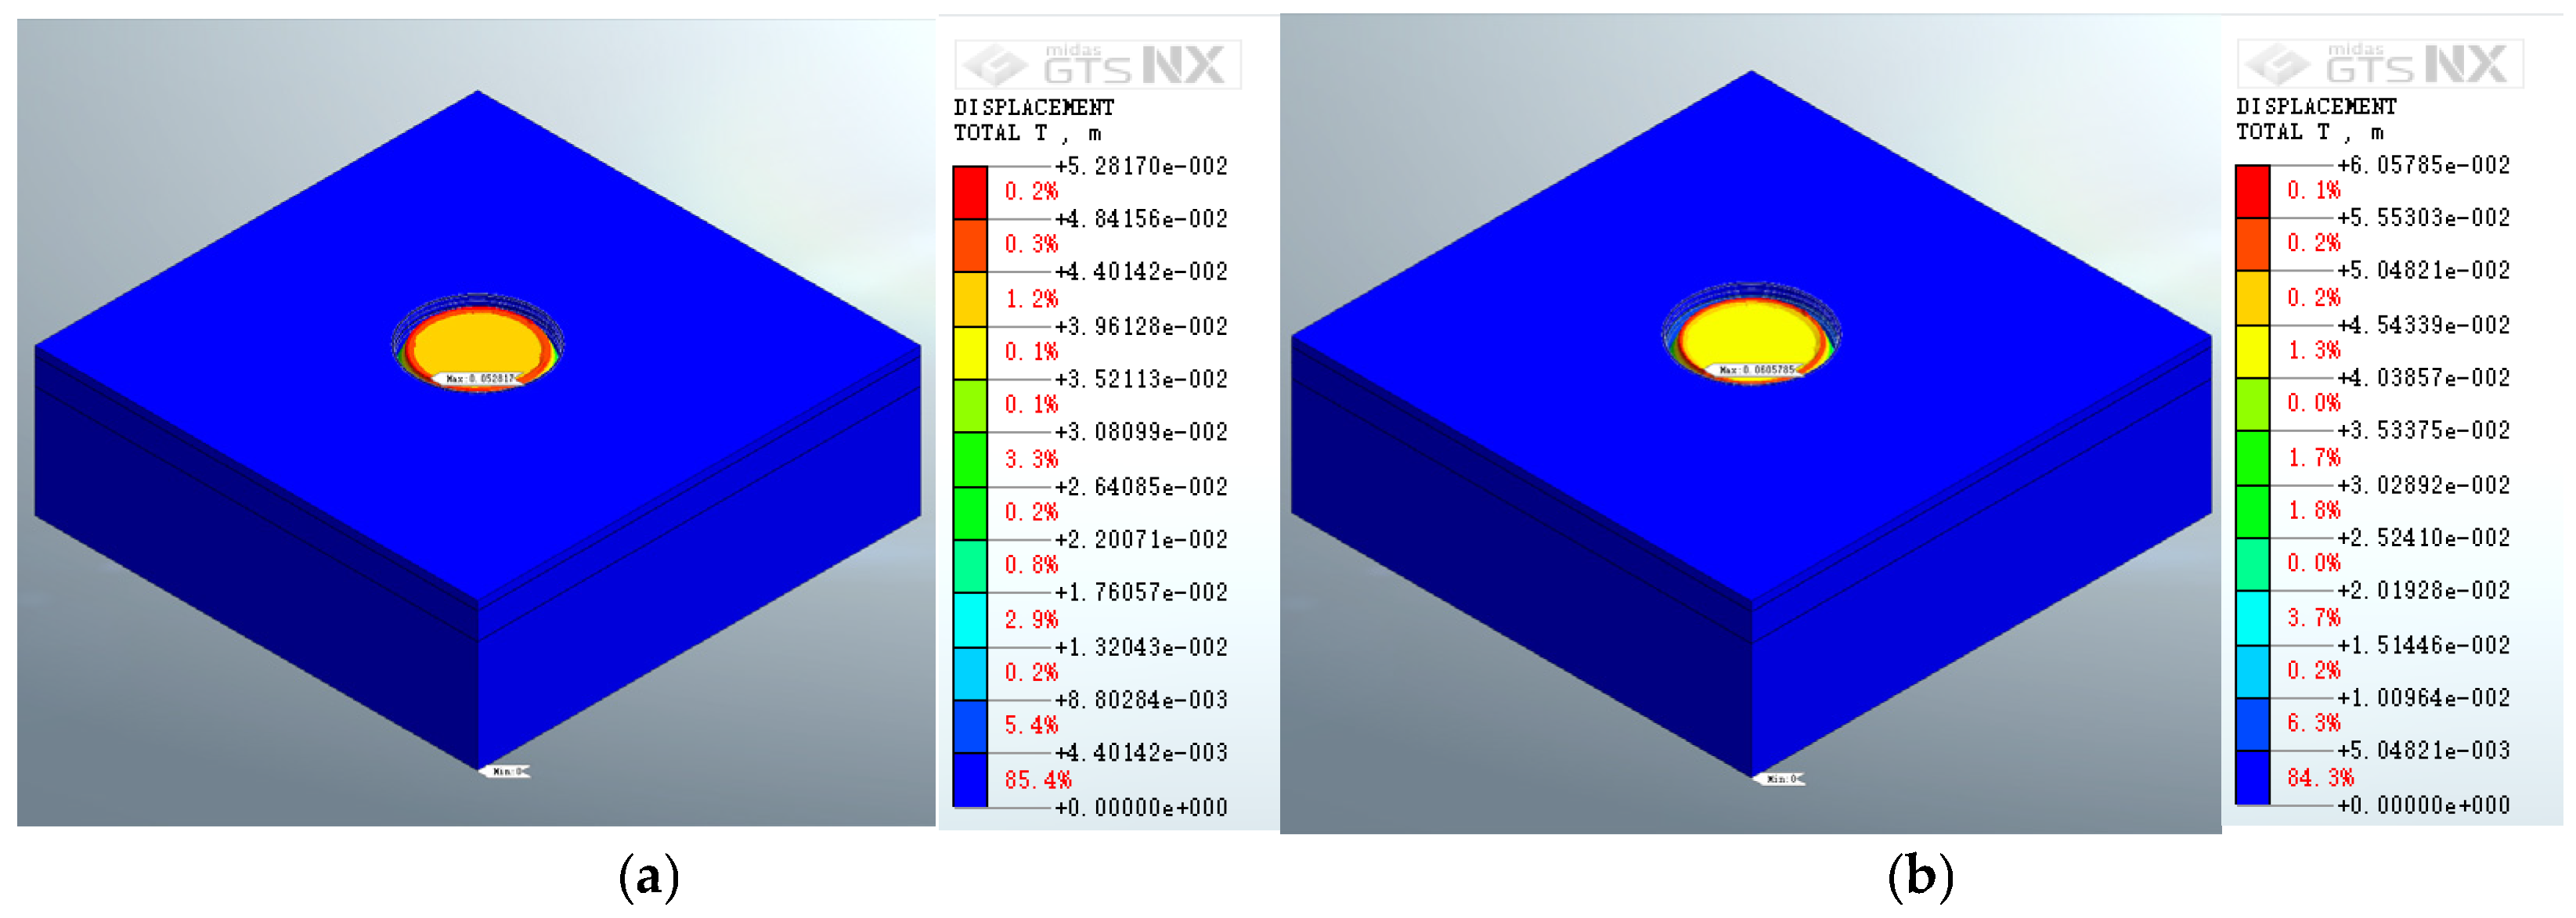
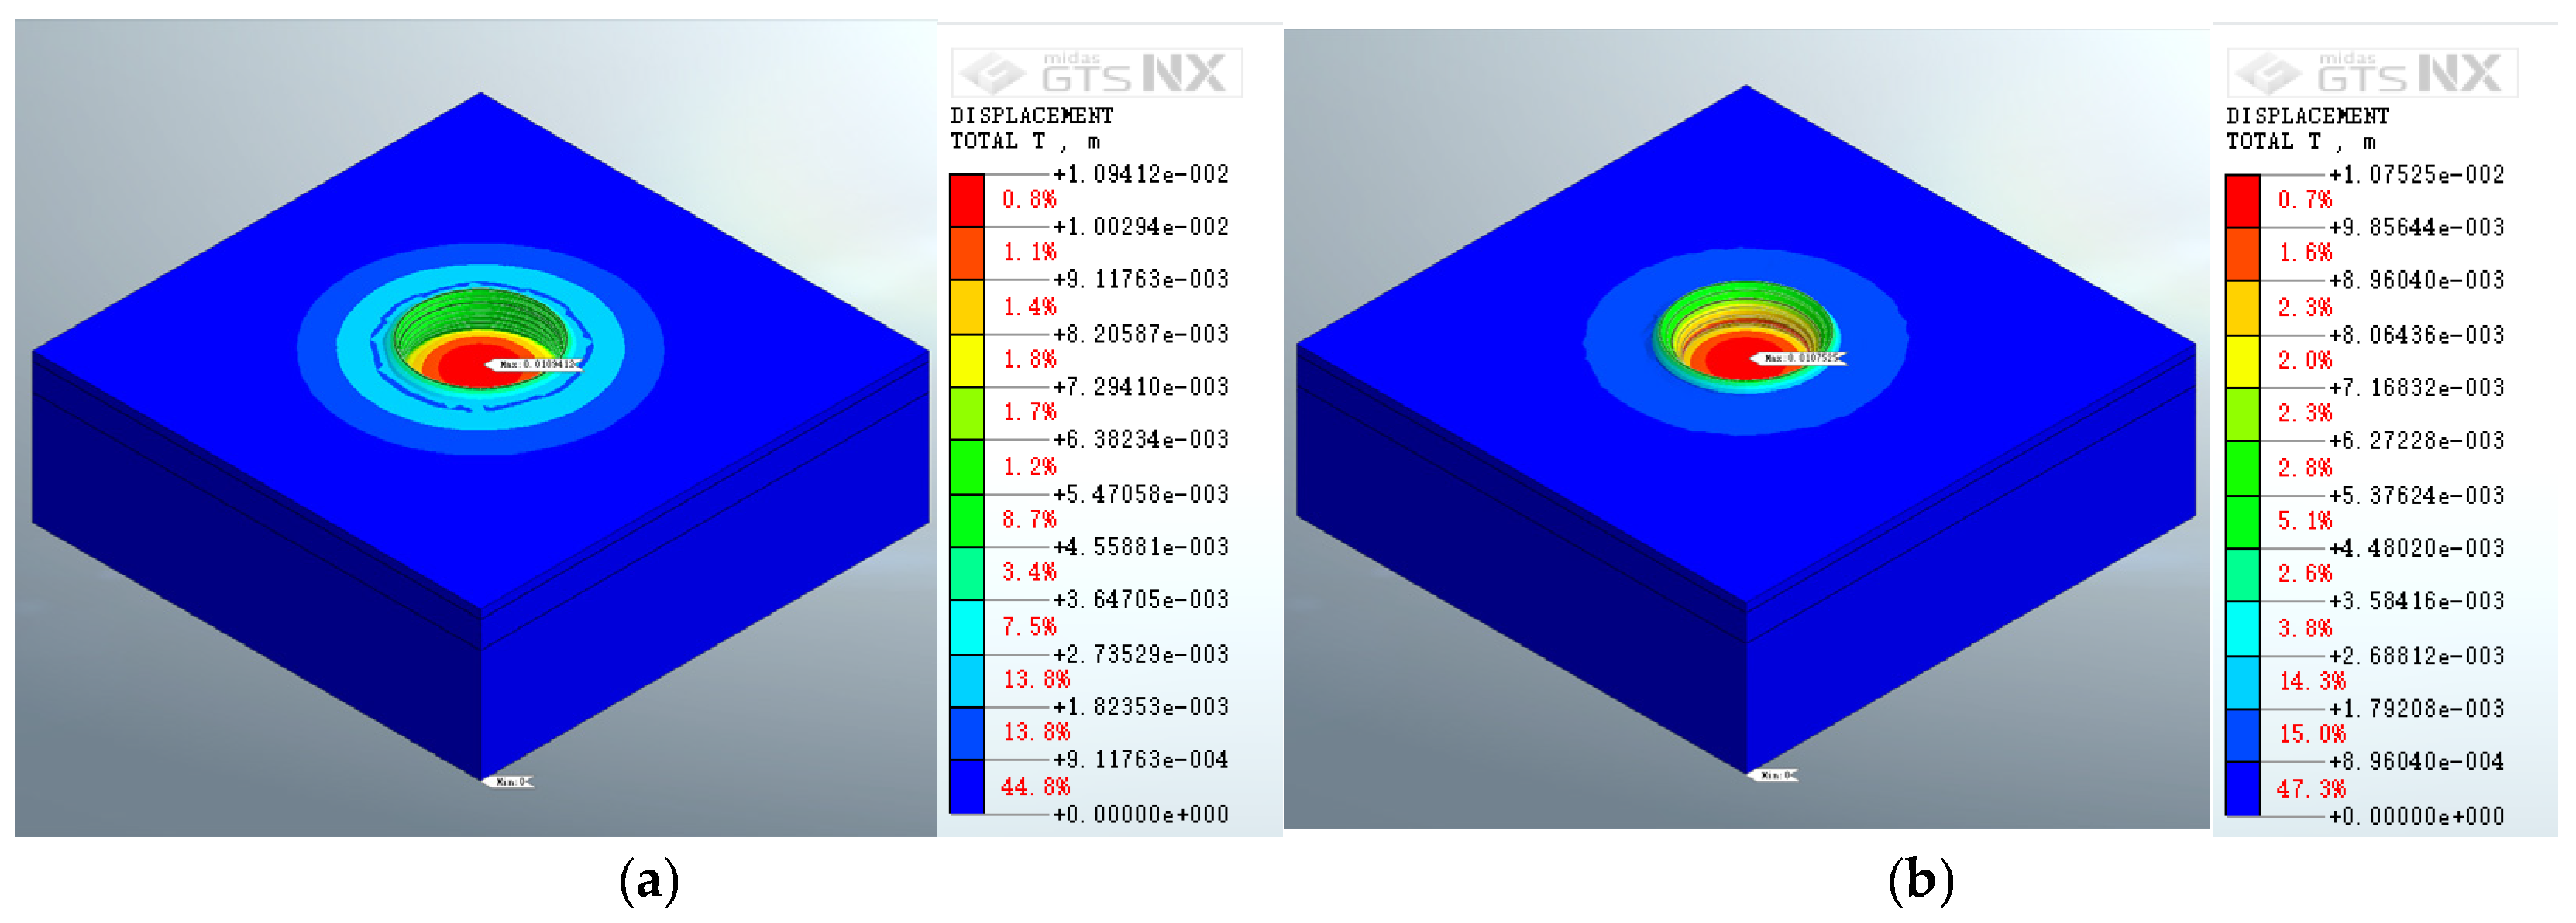
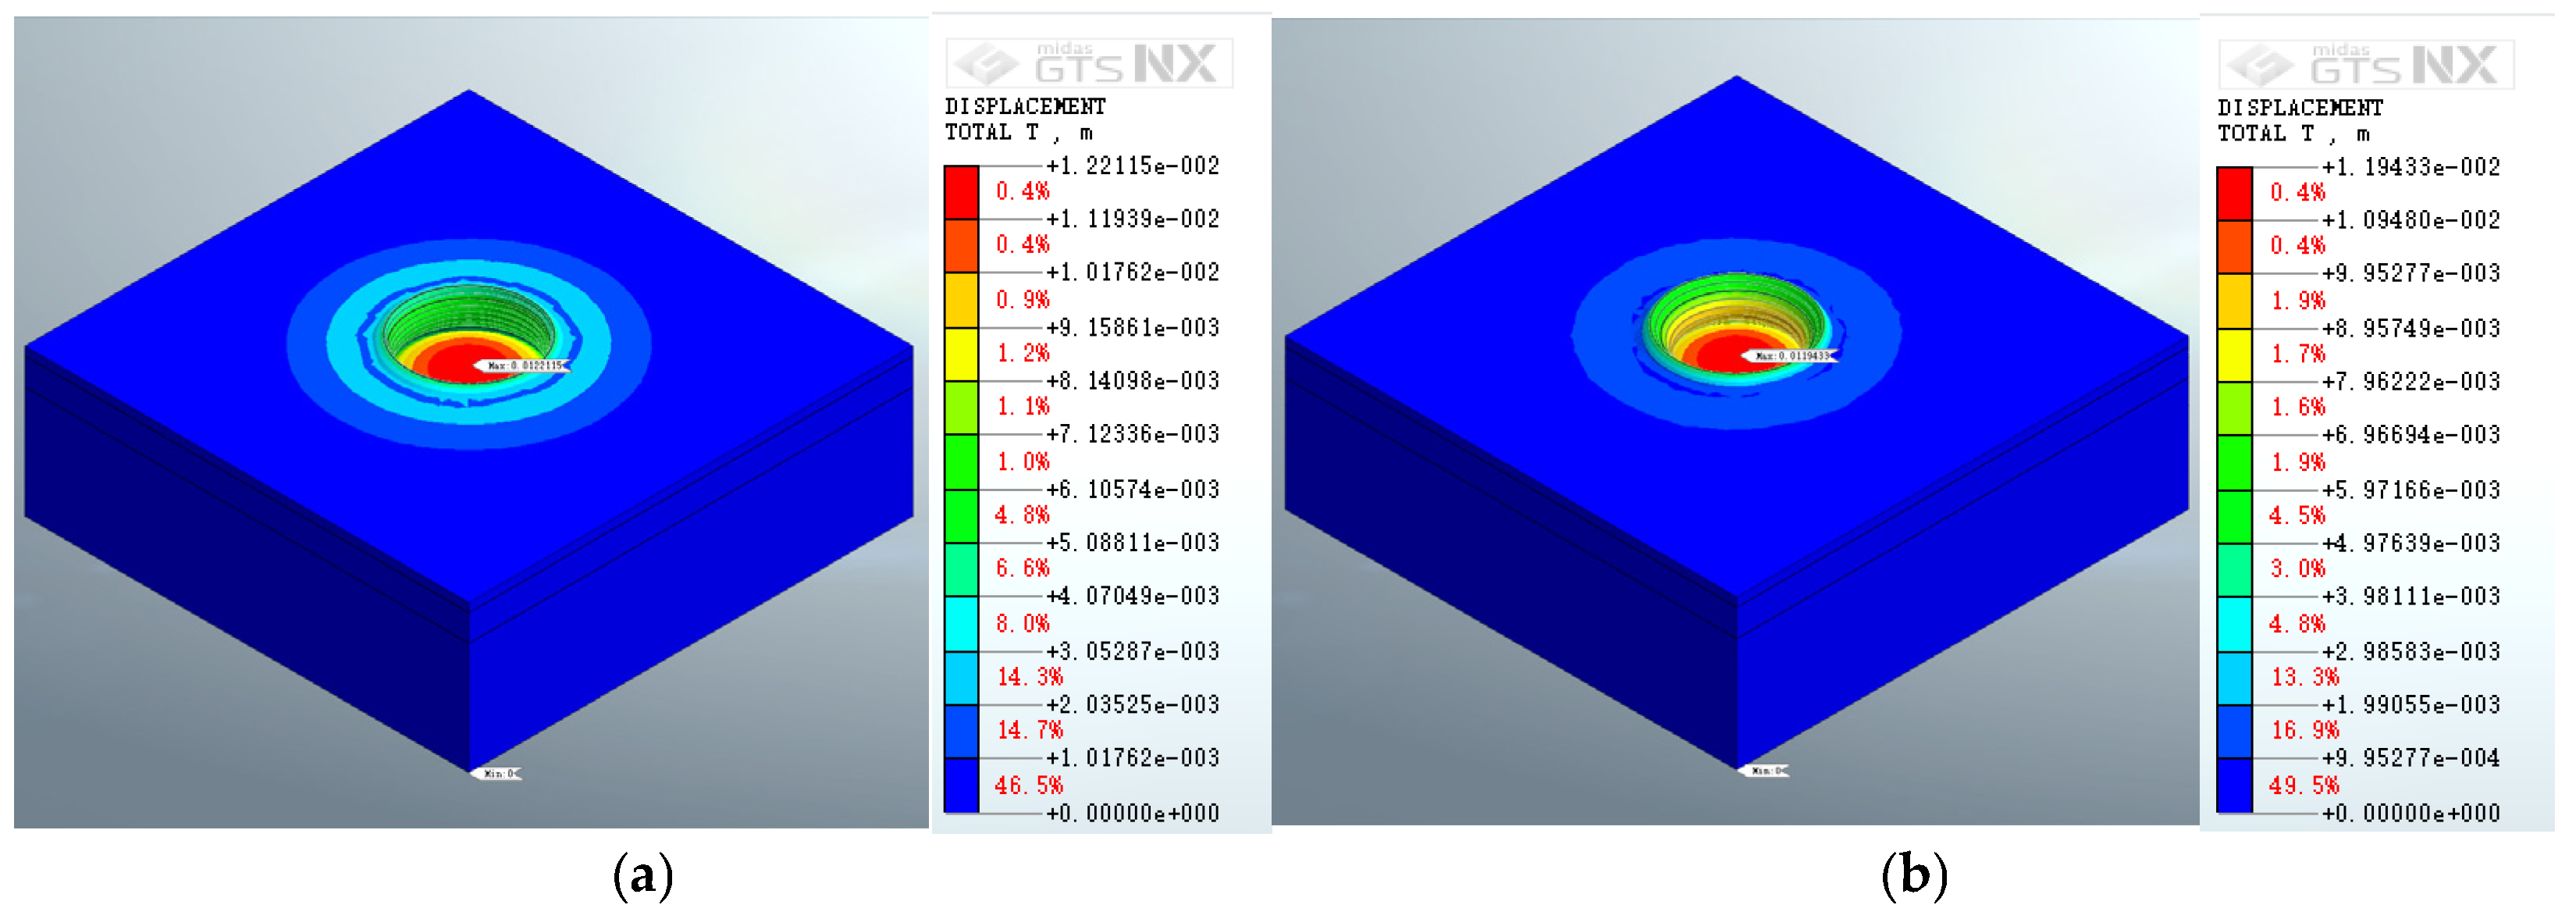
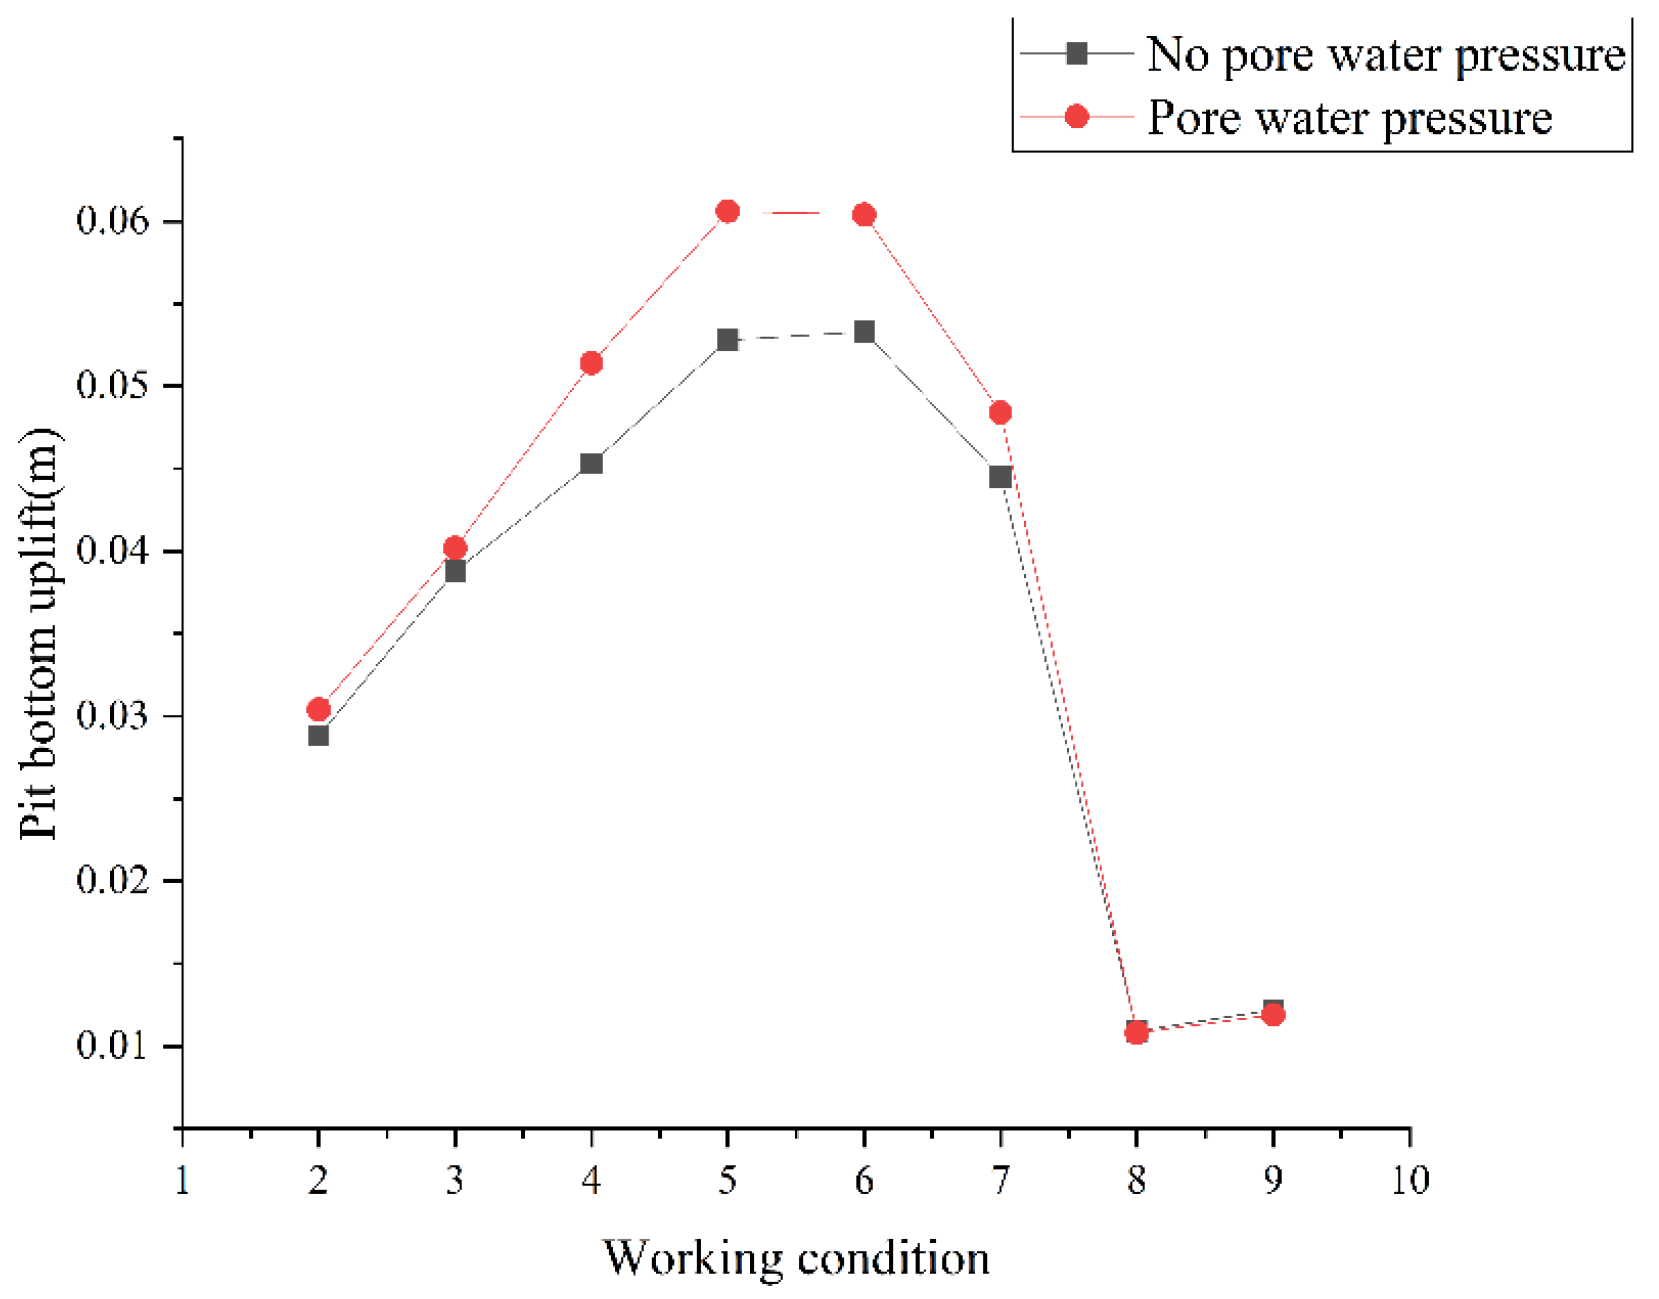
3.2. Analysis of Pit Bottom Uplift

In this section, the total displacement of the foundation pit was calculated using the check parameters mentioned above. The uplift of the foundation pit bottom was analyzed in the excavation cycle. The uplift characteristics at the bottom of the foundation pit in working conditions 2–9 before and after the adoption of steady-state seepage conditions were as follows:
Figure 12 shows the pit bottom uplift simulation results in working condition 2, where the construction of the cap beam and excavation of the first and second layers were completed. Figure 12a shows the condition in which pore water pressure was not considered. In this case, the calculated maximum pit bottom uplift was 2.88309 × 10⁻² m. Figure 12b shows the calculated pit bottom uplift considering the application of pore water pressure. After applying pore water pressure, the maximum uplift was 3.03715 × 10⁻² m. In addition, the location of the maximum uplift differed when pore water pressure was applied. However, the location was close to the center of the pit bottom in both cases. The uplift of the pit bottom was the central convex type.
Figure 13 shows the results for working condition 3. The construction of the second layer of lining and the excavation of the third were completed. When the pore water pressure was not considered, the maximum pit bottom uplift was 3.8786 × 10⁻² m. After pore water pressure was applied in the model, the maximum uplift was 4.02307 × 10⁻² m. The maximum uplift values occurred at the same location near the center of the pit bottom in both cases. The shape of the pit bottom uplift was similar to condition 2.
Figure 14 shows the simulation results for working condition 4, in which the construction of the third layer of lining and the excavation of the fourth layer of the pit were complete. The maximum pit bottom uplift without pore water pressure was 4.52912 × 10⁻² m. After pore water pressure was applied, the maximum uplift was 5.13594 × 10⁻² m. The maximum uplift values occurred at the same location near the edge of the pit bottom under both conditions. The uplift of the pit bottom showed a "ringed mountain" pattern with a convex edge and a slightly lower middle under both conditions.
Figure 15 shows the simulation results for working condition 5. The construction of the fourth layer of lining and the excavation of the fifth layer of the pit were complete. The original maximum pit bottom uplift was 5.2817 × 10⁻² m. The value was 6.05785 × 10⁻² m with pore water pressure. The maximum pit uplift again happened at the same location near the edge of the pit bottom in both cases. The shape of the uplift pattern at the bottom of the pit was similar to that in condition 4.
Figure 16 shows the simulation results for working condition 6, in which the construction of the fifth layer of lining and the excavation of the sixth layer of the pit were completed. The maximum pit bottom uplift was 5.32846 × 10⁻² m without pore water pressure. The maximum uplift was 6.03865 × 10⁻² m after applying the pore water pressure. The maximum uplift occurred in the same location near the edge of the bottom of the pit in both conditions. The distribution of the uplift at the bottom of the pit was similar to that of working condition 5.
Figure 17 shows the simulation results for working condition 7. The construction of the sixth layer of lining and the excavation of the seventh layer of the pit were completed. The original maximum pit bottom uplift was 4.44617 × 10⁻² m. After applying the pore water pressure, the maximum uplift was 4.83683 × 10⁻² m. The maximum uplift occurred at the same location near the edge of the bottom of the pit in both cases. The shape of the pit bottom uplift distribution was similar to working condition 6.
Figure 18 shows the simulation results for working condition 8, in which the construction of the seventh layer of lining and the excavation of the eighth layer of the pit were completed. When the effect of pore water pressure was not applied, the maximum pit bottom uplift was 1.09412 × 10⁻² m. The maximum uplift was 1.07525 × 10⁻² m after applying the effect of pore water pressure. The maximum uplift occurred at the same location near the center of the pit bottom in both conditions. The distribution of the pit bottom uplift returned back to the central convex type of distribution in this working condition.
Figure 19 shows the simulation results for working condition 9. The construction of the eighth layer of lining and the excavation of the ninth layer of the pit were completed. When the effect of pore water pressure was not taken into consideration, the maximum pit bottom uplift was 1.22115 × 10⁻² m. After applying the effect of pore water pressure, the maximum uplift was 1.19433 × 10⁻² m. The maximum values occurred at the same location near the center of the pit bottom in both conditions. The shape of the uplift distribution was close to that in working condition 8.
The pit bottom uplift is the quantitative judgment information of risk disasters such as mud gushing and sand gushing at the foundation pit bottom construction in adverse geological conditions. The extreme values of the bottom uplift of the foundation pit excavation conditions 2–9 were extracted for statistical analysis for the stratigraphic characteristics of the deep sandy soil layer in the west anchorage of Humen Second Bridge.
Figure 20 Alt text: The figure shows the maximum uplift value of the bottom of the foundation pit obtained from simulation calculations for each working condition. The red line represents the calculation result without applying pore water pressure; the black line represents the calculated result of applying pore water pressure.
It is shown in Figure 20 that the foundation pit bottom uplift followed an increasing then decreasing trend. The maximum value of the pit bottom uplift occurred in working condition 6 (excavation of the sixth layer), when the effect of pore water pressure was ignored, and in working condition 5 (excavation of the fifth layer), when the effect of pore water pressure was taken into consideration. The pit bottom uplift was relatively small in working conditions 8–9 (excavation of the eighth and ninth layers). Therefore, the excavation of the middle sand layer was the critical stage for preventing and controlling the pit bottom uplift.
In working conditions 5–7, the distribution of the maximum bottom uplift followed a “ring mountain” pattern, as there was a continuous distribution of the maximum uplift at a position about 5 m from the edge of the pit bottom. However, there was no uplift in the middle of the pit bottom. had A great uplift value showed in the crater area.
The locations of the maximum bottom uplift were consistent in working conditions 3–9. After considering the effect of pore water pressure, the maximum values of the bottom uplift increased in working conditions 2–7. Conversely, the maximum bottom uplifts were decreased slightly in working conditions 8–9 after considering the effect of pore water pressure. The greatest change after the addition of pore water pressure happened in condition 5, in which the increase was 14.7%. It was also shown that the weathered mudstone was less affected by the pore water pressure during the excavation of the foundation pit, whereas the sand layer was more affected by the pore water pressure.
In this section, the uplift characteristics of the foundation pit before and after the application of steady-state seepage conditions were obtained and analyzed through on-site construction monitoring and parameter verification calculations. Compared with the existing research methods (Gao et al., 2023; Gao et al., 2020), this method had overcome the problem of missing field monitoring data caused by force majeure. The deformation response mechanism of the soil at the bottom of the pit during the excavation and support of the sand circular foundation pit was revealed. Sufficient quantitative verification information for risk disasters such as mud gushing and sand gushing at the bottom of the deep sand layer foundation pit excavation had been provided.

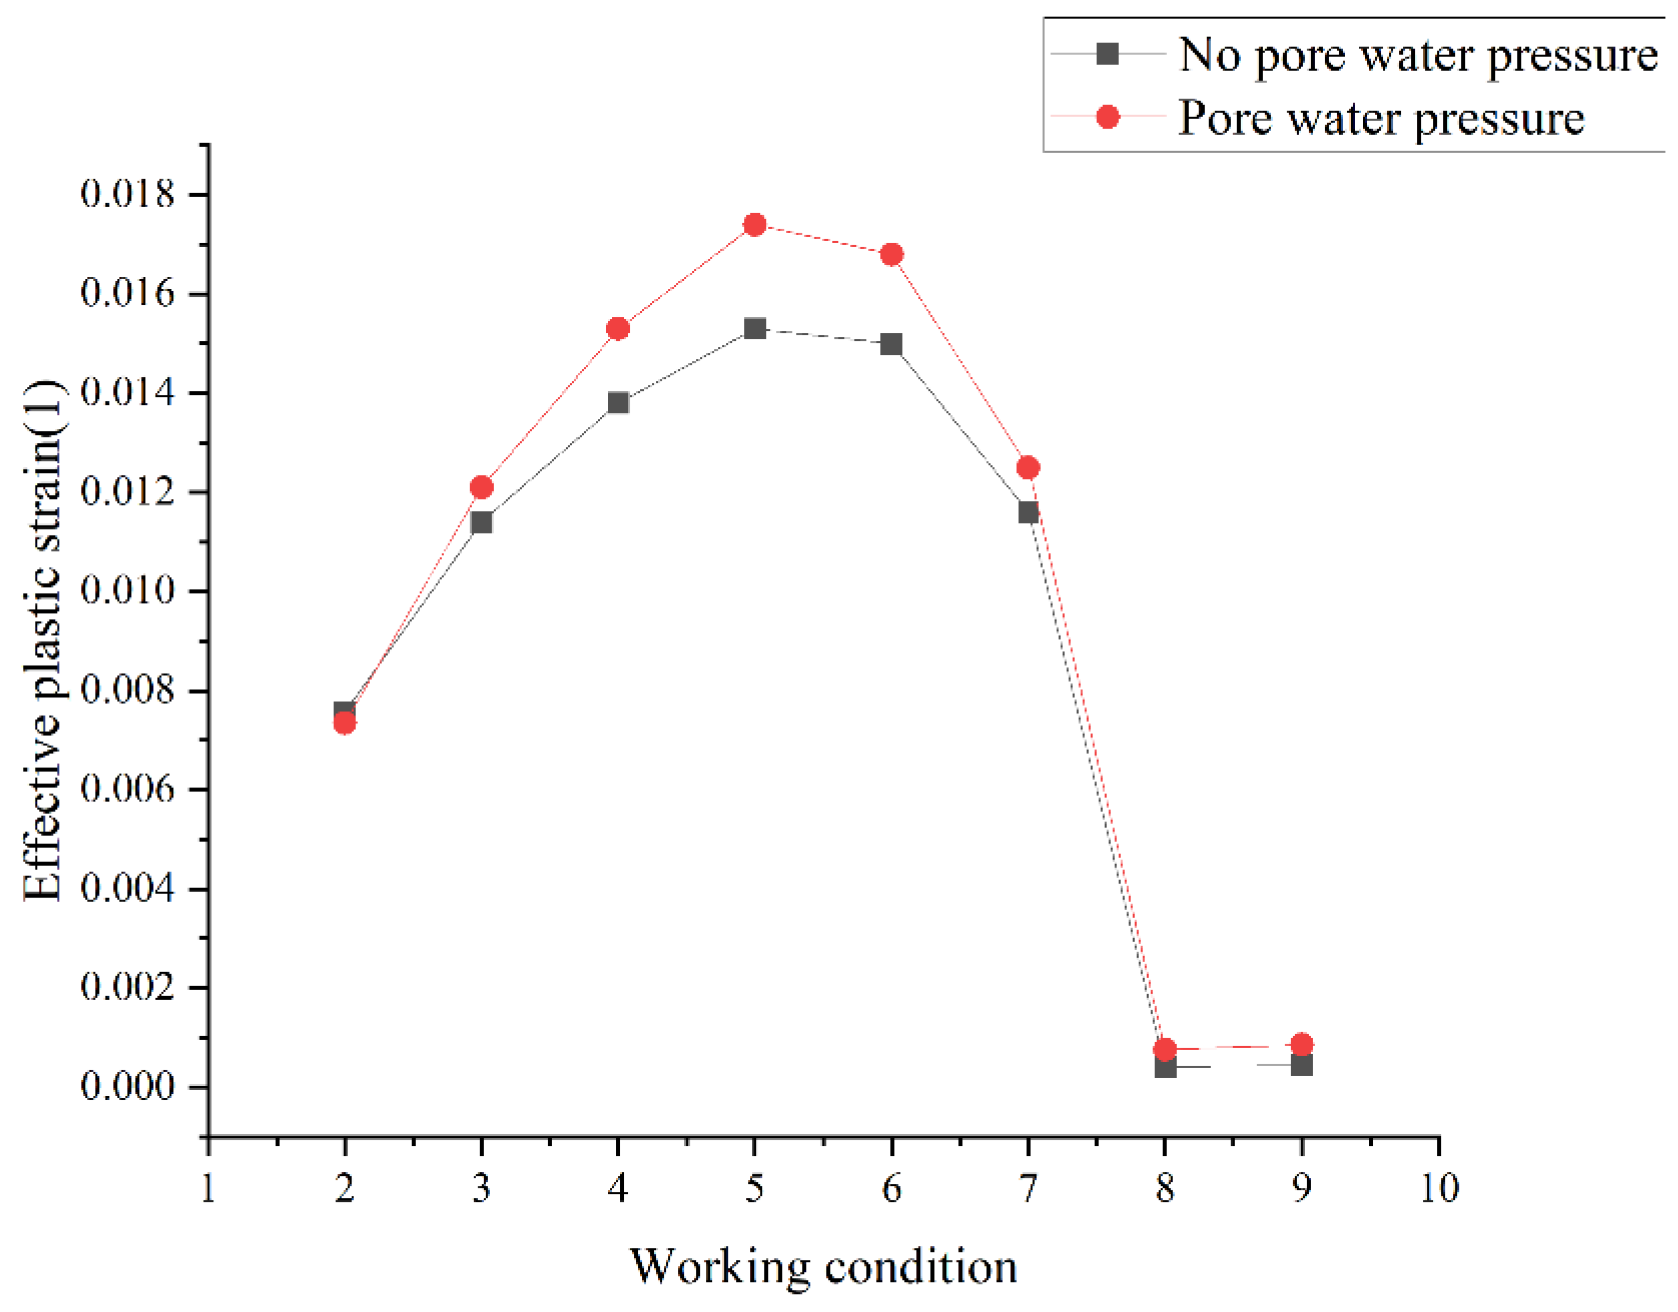
3.3. Effective Plastic Strain Analysis

The strain characteristics of the pit bottom uplift were further explored in this section. The parameters obtained from parameter checking and geotechnical tests were used to calculate the effective plastic strain of foundation pit excavation. The effective plastic strain characteristics of foundation pits before and after the application of steady-state seepage conditions in working conditions 2–9 are shown in Table 7.
Engineering risks such as pit bottom uplift, mud gushing, and sand gushing were only manifestations of foundation pit deformation and damage. However, it was the effective plastic strain that really reflected the force mechanism during the excavation and support of the foundation pit. Based on the stratigraphic characteristics of the foundation pit in the west anchorage of Humen Second Bridge, the effective plastic strain extreme value of excavation conditions 2–9 of the foundation pit was extracted, and the mechanism of the uplift of the pit bottom was analyzed.
As shown in Figure 21, the maximum effective plastic strain of the foundation pit also followed an increasing then decreasing trend. The maximum effective plastic strain occurred in working condition 5 (excavation of the fifth layer); the effective plastic strains of the foundation pit in conditions 8–9 (excavation of the eighth and ninth layers) were extremely small. Thus, the excavation of the middle sand layer was the critical stage for preventing and controlling plastic strain on the foundation pit.
Figure 21 Alt text: The figure shows the maximum effective plastic strain values obtained from simulation calculations for each working condition. The red line represents the calculation result without applying pore water pressure; the black line represents the result calculated after applying pore water pressure.
In working conditions 5–7 (excavation of the fifth to seventh layers), the distribution of the maximum effective plastic strain of the foundation pit was similar to the pit bottom uplift distribution. These conditions showed a “ring mountain” distribution, which was a circle of continuous distribution. The maximum value occurred at about 5 m from the edge of the pit bottom. This distribution showed that the deformation of the foundation pit was an intuitive manifestation of the effective plastic strain of the surrounding rock and soil. Notably, in working conditions 4–5, the effective plastic strain area changed significantly before and after considering the effect of pore water pressure.
The locations of the maximum effective plastic strain in the foundation pit remained consistent across working conditions 2 to 9. When the effect of pore water pressure was considered, the maximum strain in working condition 2 decreased, whereas in all other working conditions, the extreme values increased. The most significant change in plastic strain before and after accounting for pore water pressure was observed in working condition 9, with an increase of 91.7%. This indicates that although the weathered mudstone was less affected by pore water pressure during foundation pit excavation, it was highly sensitive to changes in pore water pressure.
In this section, the effective plastic strain analysis of the rock and soil in the foundation pit excavation conditions 2–9 was carried out. Comparing with the existing research (Liu et al., 2022; Luo et al., 2021), this study revealed the stress and deformation mechanism during the excavation and support of the circular foundation pit in the sandy soil layer. This research could be helpful to break through the early warning monitoring methods based on the analysis of sensory factors such as deformation in the existing engineering practice, and to explore the mechanical mechanism of engineering risks such as bottom uplift, mud gushing, and sand gushing during foundation pit excavation and support.

3.4. Analysis of Relationship Between Pit Bottom Uplift and Effective Plastic Strain

The uplift of the foundation pit bottom and the maximum effective plastic strain both showed an increasing trend until a certain point in the construction process. After that, these parameters showed a decreasing trend. This trend was consistent regardless of effect of pore water pressure. Thus, the key prevention and control stage of the foundation pit excavation process was the excavation of the middle sand layers, which was when the increasing trend was observed in the pit bottom uplift and the effective plastic strain was reversed.
The deformation of the foundation pit was an intuitive manifestation of the effective plastic strain of the rock and soil. During the foundation pit excavation, the uplift of the pit bottom and the effective plastic strain showed a unique, “ring-shaped mountain” distribution in the excavation of the middle sand layers. The mechanism driving the formation of this feature is unknown and will require further study.
There were significant differences between the maximum values calculated with and without the application of pore water pressure in some conditions. The greatest difference in pit bottom uplift occurred in working condition 5 (excavation of the fifth layer), where there was an increase of 14.7% after applying pore water pressure. The greatest difference in the effective plastic strain occurred in working condition 9, where there was an increase of 91.7% after the addition of pore water pressure. Finally, we found that weathered mudstone was less affected by pore water pressure overall, but it was more sensitive to changes in pore water pressure.

4. Conclusions

This research was aimed at the complex problems of analyzing the excavation and support process of a circular foundation pit in a sandy soil layer. A new method of parameter checking based on the offset data of the diaphragm wall was proposed via modeling trial calculations and monitoring data analysis. The seepage–stress coupling calculation and excavation support process analysis were carried out by using the pore water pressure superposition calculation method. The analysis results were as follows.
The uplift characteristics of the bottom of the foundation pit before and after the seepage conditions were applied and analyzed. The deformation response mechanism of the bottom soil during the excavation and support of the circular foundation pit in the sandy soil layer was revealed.
The effective plastic strain of the foundation pit was simulated and calculated, revealing the variation characteristics of the strain during the excavation and support of the circular foundation pit in the sand layer. Based on the calculation results for pit bottom uplift, the most dangerous critical working conditions for foundation pit excavation were identified.
The parameter-checking method proposed in this study is applicable to the numerical simulation of geotechnical engineering, such as foundation pit excavation, slope support and karst settlement, etc. The problem is that, although the method can overcome the lack of some monitoring data and carry out the full-cycle simulation of the project, it still relies heavily on on-site monitoring data, especially the initial calibration.

Author Contributions

Conceptualization, X.G.; Methodology, X.G. and J.L.; Software, X.G.; Validation, X.G., Y.D. and J.W.; Formal analysis, X.G.; Investigation, X.G. and X.L.; Resources, Y.B., J.W. and J.L.; Data curation, X.G. and Y.D.; Writing—original draft, X.G., X.L. and J.L.; Writing—review & editing, X.G. and J.W.; Visualization, X.G.; Supervision, Y.B. and J.L.; Project administration, X.G. and X.L.; Funding acquisition, Y.B., Y.D. and J.W. All authors have read and agreed to the published version of the manuscript.

Funding

This work was supported by the National Key Research and Development Program of China [2022YFC3002600]; and the Natural Science Foundation of Chongqing Municipality [2022NSCQ-MSX1939; 2022NSCQ-MSX1329]; and the Chongqing Municipal Education Commission Foundation [KJQN202300728]; and the Qin Chuangyuan Cited High-level Innovative and Entrepreneurial Talent Project Funding (QCYRCXM-2022-285); and the National Natural Science Foundation of China [42027806; 41630639]; and the Research on the Innovation and Entrepreneurship Model of Vocational Education in Weicheng District and Its Significant Measures to Promote High-Quality Employment for University Graduates (2024VCRK-014).

Institutional Review Board Statement

Not applicable.

Informed Consent Statement

Not applicable.

Data Availability Statement

The data that support the findings of this study are available from the corresponding author, Xuhe Gao, upon reasonable request.

Conflicts of Interest

This manuscript has not been published or presented elsewhere in part or in entirety and is not under consideration by another journal. Author Yi Dong was employed by the company China Coal Aerial Survey and Remote Sensing Group Co., Ltd. The remaining authors declare that the research was conducted in the absence of any commercial or financial relationships that could be construed as a potential conflict of interest.

References

  1. Tan, Y.; Wang, D.L. Characteristics of a large-scale deep foundation pit excavated by the central-island technique in shanghai soft clay. I: Bottom-up construction of the central cylindrical shaft. J. Geotech. Geoenviron. Eng. 2013, 139, 1875–1893. [Google Scholar] [CrossRef]
  2. Tan, Y.; Wang, D.L. Structural behaviors of large underground earth-retaining systems in shanghai. I: Unpropped circular diaphragm wall. J. Perform. Constr. Facil. 2015, 29, 04014058. [Google Scholar]
  3. Tan, Y.; Wang, D.L. Structural behaviors of large underground earth-retaining systems in shanghai. II: Multipropped Rectangular Diaphragm Wall. J. Perform. Constr. Facil. 2015, 29, 04014059. [Google Scholar] [CrossRef]
  4. Maddah, A.; Soroush, A. A Comprehensive Numerical Study on Building-Excavation Interaction. Civ. Eng. J. 2020, 6, 326–343. [Google Scholar] [CrossRef]
  5. Olia, A.S.R.; Oliaei, M.; Heidarzadeh, H. Performance of Ground Anchored Walls Subjected to Dynamic and Pseudo-Static Loading. Civ. Eng. J. 2021, 7, 974–987. [Google Scholar] [CrossRef]
  6. Xu, C.J.; Chen, Q.Z.; Wang, Y.L.; Hu, W.T.; Fang, T. Dynamic deformation control of retaining structures of a deep excavation. J. Perform. Constr. Facil. 2016, 30, 04015071. [Google Scholar] [CrossRef]
  7. Tan, Y.; Lu, Y. Responses of shallowly buried pipelines to adjacent deep excavations in Shanghai soft ground. J. Pipeline Syst. Eng. Pract. 2018, 9, 05018002. [Google Scholar] [CrossRef]
  8. Chen, R.P.; Meng, F.Y.; Li, Z.C.; Ye, Y.H.; Ye, J.N. Investigation of response of metro tunnels due to adjacent large excavation and protective measures in soft soils. Tunn. Undergr. Space Technol. 2016, 58, 224–235. [Google Scholar] [CrossRef]
  9. Guo, P.P.; Gong, X.N.; Wang, Y.X. Displacement and force analyses of braced structure of deep excavation considering unsymmetrical surcharge effect. Comput. Geotech. 2019, 113, 103102. [Google Scholar] [CrossRef]
  10. Simpson, B. Retaining structures-displacement and design. Thirty-second Rankine Lecture. Geotechnique 1992, 42, 541–576. [Google Scholar] [CrossRef]
  11. Farrell, R.; Mair, R.; Sciotti, A.; Pigorini, A. Building response to tunnelling. Soils Found. 2014, 54, 269–279. [Google Scholar] [CrossRef]
  12. Zhao, C.Y.; Lavasan, A.A.; Barciaga, T.; Zarev, V.; Datcheva, M.; Schanz, T. Model validation and calibration via back analysis for mechanized tunnel simulations-the western scheldt tunnel case. Comput. Geotech. 2015, 69, 601–614. [Google Scholar] [CrossRef]
  13. Schwamb, T.; Elshafie, M.; Soga, K.; Mair, R.J. Considerations for monitoring of deep circular excavations. Proc. Inst. Civ. Eng. Geotech. Eng. 2016, 169, 477–493. [Google Scholar] [CrossRef]
  14. Jin, Y.F.; Yin, Z.Y.; Zhou, W.H.; Liu, X. Intelligent model selection with updating parameters during staged excavation using optimization method. Acta Geotech. 2020, 15, 2473–2491. [Google Scholar] [CrossRef]
  15. Zhou, H.Z.; Zheng, G.; He, X.P.; Wang, E.Y.; Guo, Z.Y.; Nie, D.Q.; Ma, S.K. Numerical modelling of retaining structure displacements in multi-bench retained excavations. Acta Geotech. 2020, 15, 2691–2703. [Google Scholar] [CrossRef]
  16. Gao, X.; Tian, W.P.; Zhang, Z. Analysis of Deformation Characteristics of Foundation-Pit Excavation and Circular Wall. Sustainability 2020, 12, 3164. [Google Scholar] [CrossRef]
  17. Gao, X.; Tian, W.P.; Li, J.; Qi, H.; Li, S.; Zhang, Z. Research on the Stress and Deformation Characteristics of Circular Foundation Pit during Excavation in Sand Soil. Adv. Mater. Sci. Eng. 2023, 2023, 3008695. [Google Scholar] [CrossRef]
  18. Bagherzadeh, P.; Goshtasbi, K.; Kazemzadeh, E.; Mojtaba Kashef, M.; Bakhtiari, H.A. Stress-dependence of the permeability, porosity, and compressibility in fractured porous media regarding fracturing condition. Bull. Eng. Geol. Environ. 2021, 80, 5091–5110. [Google Scholar] [CrossRef]
  19. Wang, L.Y.; Zhang, Y.J. Interpreting correlations in stress-dependent permeability, porosity, and compressibility of rocks: A viewpoint from finite strain theory. Int. J. Numer. Anal. Methods Geomech. 2024, 48, 2000–2019. [Google Scholar] [CrossRef]
  20. Liu, B.; Lin, H.; Chen, Y.; Liu, J.; Guo, C. Deformation Stability Response of Adjacent Subway Tunnels considering Excavation and Support of Foundation Pit. Lithosphere 2022, 10, 7227330. [Google Scholar] [CrossRef]
  21. Li, Z. Displacement Monitoring during the Excavation and Support of Deep Foundation Pit in Complex Environment. Adv. Civ. Eng. 2021, 2021, 5715306. [Google Scholar] [CrossRef]
  22. Fattah, M.Y.; Shlash, K.T.; Salim, N.M. Effect of reduced K0 Zone on time dependent analysis of tunnels. Adv. Civ. Eng. 2011, 2011, 963502. [Google Scholar]
  23. Fattah, M.Y.; Shlash, K.T.; Al-Soud, M.M. Boundary element analysis of a lined tunnel problem. Int. J. Eng. Trans. B Appl. 2012, 25, 87–94. [Google Scholar] [CrossRef]
  24. Fattah, M.Y.; Shlash, K.T.; Salim, N.M. Prediction of settlement trough induced by tunneling in cohesive ground. Acta Geotech. 2013, 8, 167–179. [Google Scholar] [CrossRef]
  25. Luo, J.Y.; Zhang, L.L.; Zhang, H.Q.; Wei, X.; Liu, D.S.; Xu, J.B. Probabilistic model calibration of spatial variability for a physically-based landslide susceptibility model. Georisk Assess. Manag. Risk Eng. Syst. Geohazards 2022, 16, 1988986. [Google Scholar] [CrossRef]
  26. Yang, H.Q.; Zhang, L.L.; Pan, Q.J.; Phoon, K.K.; Shen, Z.C. Bayesian estimation of spatially varying soil parameters with spatiotemporal monitoring data. Acta Geotech. 2021, 16, 263–278. [Google Scholar] [CrossRef]
  27. Kim, K.Y.; Lee, D.S.; Cho, J.; Jeong, S.S.; Lee, S. The effect of arching pressure on a vertical circular shaft. Tunn. Undergr. Space Technol. 2013, 37, 10–21. [Google Scholar] [CrossRef]
  28. Schwamb, T.; Soga, K.; Mair, R.J.; Elshafie, M.Z.E.B.; Sutherden, R.; Boquet, C.; Greenwood, J. Fibre optic monitoring of a deep circular excavation. Proc. Inst. Civ. Eng. Geotech. Eng. 2014, 167, 144–154. [Google Scholar] [CrossRef]
  29. Faustin, N.E.; Elshafie, M.Z.E.B.; Mair, R.J. Case studies of circular shaft construction in London. Proc. Inst. Civ. Eng. Geotech. Eng. 2018, 171, 391–404. [Google Scholar] [CrossRef]
  30. Le, B.T.; Goodey, R.J.; Divall, S. Subsurface ground movements due to circular shaft construction. Soils Found. 2019, 59, 1160–1171. [Google Scholar] [CrossRef]
  31. Borges, J.L.; Guerra, G.T. Cylindrical excavations in clayey soils retained by jet grout walls: Numerical analysis and parametric study considering the influence of consolidation. Comput. Geotech. 2014, 55, 42–56. [Google Scholar] [CrossRef]
  32. Cho, J.; Lim, H.; Jeong, S.; Kim, K. Analysis of lateral earth pressure on a vertical circular shaft considering the 3D arching effect. Tunn. Undergr. Space Technol. 2015, 48, 11–19. [Google Scholar] [CrossRef]
  33. Chehadeh, A.; Turan, A.; Abed, F. Numerical investigation of spatial aspects of soil structure interaction for secant pile wall circular shafts. Comput. Geotech. 2015, 69, 452–461. [Google Scholar] [CrossRef]
  34. Schwamb, T.; Soga, K. Numerical modelling of a deep circular excavation at Abbey Mills in London. Géotechnique 2015, 65, 604–619. [Google Scholar] [CrossRef]
  35. Chehadeh, A.; Turan, A.; Abed, F.; Yamin, M. 2019. Lateral earth pressures acting on circular shafts considering soil-structure interaction. Int. J. Geotech. Eng. 2019, 13, 139–151. [Google Scholar] [CrossRef]
Figure 1. Stratigraphic section along the bridge direction (unit: m).
Jmse 13 00349 g001
Figure 2. Expanded view of circular underground diaphragm wall structure (unit: m).
Jmse 13 00349 g002
Figure 3. The sixth layer of soil excavation.
Jmse 13 00349 g003
Figure 5. Schematic of the setup used for deep deformation monitoring of the diaphragm wall.
Jmse 13 00349 g005
Figure 6. Calculation model.
Jmse 13 00349 g006
Figure 7. Flowchart depicting the study methodology.
Jmse 13 00349 g007
Figure 8. Measured displacement of the underground diaphragm wall.
Jmse 13 00349 g008
Figure 9. Parameter verification of working condition 2.
Jmse 13 00349 g009
Figure 10. Parameter verification of working condition 3.
Jmse 13 00349 g010
Figure 11. Parameter verification of working condition 9.
Jmse 13 00349 g011
Figure 12. Simulation of pit bottom uplift in working condition 2. (a) Working condition 2—pit bottom uplift. (b) Working condition 2—pit bottom uplift (pore water pressure applied).
Jmse 13 00349 g012
Figure 13. Simulation of pit bottom uplift in working condition 3. (a) Working condition 3—pit bottom uplift. (b) Working condition 3—pit bottom uplift (pore water pressure applied).
Jmse 13 00349 g013
Figure 14. Simulation of pit bottom uplift in working condition 4. (a) Working condition 4 pit bottom uplift. (b) Working condition 4 pit bottom uplift (pore water pressure applied).
Jmse 13 00349 g014
Figure 15. Simulation of pit bottom uplift in working condition 5. (a) Working condition 5 pit bottom uplift. (b) Working condition 5 pit bottom uplift (pore water pressure applied).
Jmse 13 00349 g015
Figure 16. Simulation of pit bottom uplift in working condition 6. (a) Working condition 6 pit bottom uplift. (b) Working condition 6 pit bottom uplift (pore water pressure applied).
Jmse 13 00349 g016
Figure 17. Simulation of pit bottom uplift in working condition 7. (a) Working condition 7 pit bottom uplift. (b) Working condition 7 pit bottom uplift (pore water pressure applied).
Jmse 13 00349 g017
Figure 18. Simulation of pit bottom uplift in working condition 8. (a) Working condition 8 pit bottom uplift. (b) Working condition 8 pit bottom uplift (pore water pressure applied).
Jmse 13 00349 g018
Figure 19. Simulation of pit bottom uplift in working condition 9. (a) Working condition 9 pit bottom uplift. (b) Working condition 9 pit bottom uplift (pore water pressure applied).
Jmse 13 00349 g019
Figure 20. Maximum uplift of the bottom of the foundation pit for different working conditions.
Jmse 13 00349 g020
Figure 21. Maximum effective plastic strain of the foundation pit for various working conditions.
Jmse 13 00349 g021
Table 2. Design calculation conditions without considering pore water pressure.
Working ConditionConstruction Steps
0Initial state
1Construction of diaphragm wall
2Construction of the cap beam and excavation of the first and second layers
3Construction of the second layer of lining and excavation of the third layer
4Construction of the third layer of lining and excavation of the fourth layer
5Construction of the fourth layer of lining and excavation of the fifth layer
6Construction of the fifth layer of lining and excavation of the sixth layer
7Construction of the sixth layer of lining and excavation of the seventh layer
8Construction of the seventh layer of lining and excavation of the eighth layer
9Construction of the eighth layer of lining and excavation of the ninth layer
Table 3. Design calculation conditions for obtaining pore water pressure through steady-state seepage calculation.
Working ConditionConstruction StepsLocation of Groundwater Head
1Completion of diaphragm wall constructionThe water head inside and outside the foundation pit is the same and level with the ground
2Completion of the excavation of the second layerthe water head outside the foundation pit is level with the ground, and the water head inside the foundation pit is at the bottom of the second layer of excavation
3Completion of the excavation of the third layerthe water head outside the foundation pit remains unchanged, while the water head inside the foundation pit is at the bottom of the third layer of excavation
4Completion of the excavation of the fourth layerthe water head outside the foundation pit remains unchanged, while the water head inside the foundation pit is at the bottom of the fourth layer of excavation
5Completion of the excavation of the fifth layerthe water head outside the foundation pit remains unchanged, while the water head inside the foundation pit is at the bottom of the fifth layer of excavation
6Completion of the excavation of the sixth layerthe water head outside the foundation pit remains unchanged, while the water head inside the foundation pit is at the bottom of the sixth layer of excavation
7Completion of the excavation of the seventh layerthe water head outside the foundation pit remains unchanged, while the water head inside the foundation pit is at the bottom of the seventh layer of excavation
8Completion of the excavation of the eighth layerthe water head outside the foundation pit remains unchanged, while the water head inside the foundation pit is at the bottom of the eighth layer of excavation
9Completion of the excavation of the ninth layerthe water head outside the foundation pit remains unchanged, while the water head inside the foundation pit is at the bottom of the ninth layer of excavation
Table 4. Initial value of geotechnical parameters.
Soil LayerElastic Modulus
(kN/m2)
Poisson’s
Ratio
Friction Angle
(°)
Cohesion
(kN/m2)
Unit Weight
(kN/m3)
Permeability Coefficient
(cm/s)
Silt10,0000.351015.41.15 × 10−6
Muddy soil30,0000.2751016.51.18 × 10−6
Fine sand60,0000.23250195.01 × 10−3
Medium sand100,0000.2425019.51.21 × 10−2
Coarse sand300,0000.2225018.83.12 × 10−2
Strong weathered mudstone1,100,0000.193045019.991.02 × 10−4
Middle weathered mudstone1,100,0000.173545020.51.14 × 10−5
Micro-weathered mudstone1,100,0000.153545020.79.71 × 10−7
Note: The simulation parameters for the underground continuous wall and lining were determined according to the specifications.
Table 5. Geotechnical parameter values.
Soil LayerElastic Modulus
(kN/m2)
Poisson’s
ratio
Friction Angle
(°)
Cohesion
(kN/m2)
Unit Weight
(kN/m3)
Permeability Coefficient
(cm/s)
Silt30000.33515.41.15 × 10−6
Muddy soil50,0000.275816.51.18 × 10−6
Fine sand80,0000.23180195.01 × 10−3
Medium sand120,0000.2425019.51.21 × 10−2
Coarse sand200,0000.2228018.83.12 × 10−2
Strong weathered mudstone500,0000.19205019.991.02 × 10−4
Middle weathered mudstone1,000,0000.173045020.51.14 × 10−5
Micro-weathered mudstone1,400,0000.153560020.79.71 × 10−7
Table 6. Mechanical parameters of foundation pit structures.
StructureElastic Modulus (kN/m2)Weight Measurement (kN/m3)Poisson’s Ratio
Diaphragm wall3.0 × 107250.2
Lining3.0 × 107250.2
Table 7. The effective plastic strain characteristics of foundation pits of working conditions 2–9.
Working ConditionNo Pore Water Pressure AppliedPore Water Pressure AppliedRegional Morphology
Maximum Value (1)PositionMaximum Value (1)Position
27.56959 × 10⁻³Bottom edge of foundation pit7.33992 × 10−3Bottom edge of foundation pitCircular distribution
31.13526 × 10⁻²Bottom edge of foundation pit1.20842 × 10−2Bottom edge of foundation pitCircular distribution
41.37693 × 10⁻²Bottom edge of foundation pit1.53166 × 10−2Bottom edge of foundation pitCircular distribution
51.53290 × 10⁻²Bottom edge of foundation pit1.73822 × 10−2Bottom edge of foundation pitCircular distribution
61.50441 × 10⁻²Bottom edge of foundation pit1.67615 × 10−2Bottom edge of foundation pitCircular distribution
71.15651 × 10⁻²Bottom edge of foundation pit1.25059 × 10−2Bottom edge of foundation pitCircular distribution
84.10912 × 10⁻⁴The junction of the fourth and fifth lining.7.58077 × 10−4The middle of the fifth lining.Circular distribution
94.47740 × 10⁻⁴The junction of the fifth and sixth lining.8.58466 × 10−4The middle of the fifth lining.Circular distribution
Disclaimer/Publisher’s Note: The statements, opinions and data contained in all publications are solely those of the individual author(s) and contributor(s) and not of MDPI and/or the editor(s). MDPI and/or the editor(s) disclaim responsibility for any injury to people or property resulting from any ideas, methods, instructions or products referred to in the content.

