Abstract
In smart ports, accurately perceiving the motion state of a ship during berthing and unberthing is essential for the safety and efficiency of the ship and port. However, in actual scenarios, the obtained data are not always complete, which impacts the accuracy of the ship’s motion state. This paper proposes a spatial visualization method to analyze a ship’s motion state in the incomplete data by introducing the GIS spatial theory. First, for the complete part under incomplete data, this method proposes a new technique named LGFCT to extract the key points of this part. Then, for the missing part under the incomplete data, this method applies the key point prediction technique based on the line features to extract the key points of this part. Note that the key points will be used to calculate the key parameters. Finally, spatial visualization and spatial-temporal tracking techniques are employed to spatially analyze the ship’s motion state. In summary, the proposed method not only spatially identifies a ship’s motion state for the incomplete data but also provides an intuitive visualization of a ship’s spatial motion state. The accuracy and effectiveness of the proposed method are verified through experimental data collected from a ship in Dalian Port, China.
1. Introduction
With the development of intelligent and automated ships, improvement in maritime transportation efficiency and safety has become a research area. Moreover, the development of modern ports is also adapting to the changes in intelligent techniques, and the safety and intelligence of ships in port are paid more attention. With the gradual increase in the size of ships, the occurrence of berthing accidents has become more frequent. According to statistics, the majority of ship collisions and grounding accidents occur in ports [1,2,3]. Therefore, it is essential to perceive the surrounding maritime conditions during the berthing and unberthing processes [4].
Currently, LiDAR equipment is widely employed to measure and analyze ships, which helps prevent collisions during the berthing and unberthing processes by obtaining information including the distance between the shoreline and the ships and their motion states [5,6,7]. However, the collected point cloud data may be incomplete due to the influence of the angle and placement position of the LiDAR device. In this case, the bow or stern becomes the only motion information available. However the completeness of ship motion information can better reflect the motion state of the entire ship, and it is crucial for ensuring the safety of both the ship and the port. Therefore, this paper proposes a method to solve the problem of the space motion state of ships with incomplete data.
Generally, the merits of this study are as follows:
- (1)
- The local geometric feature extraction technique (LGFCT) based on GIS spatial metric distribution theory is proposed to accurately extract the key points of a complete part. For a complete part under incomplete data, longitudinal segmentation is performed by setting corresponding thresholds, and then local geometric feature fitting is applied to achieve an accurate extraction of the ship’s motion state.
- (2)
- The key point prediction technique based on the line features is proposed. This technique predicts the key points for missing parts under incomplete data, and according to the key points from the complete and missing parts, the key parameters during the berthing and unberthing process are calculated.
- (3)
- Spatial visualization and spatial-temporal tracking techniques are performed for the berthing and unberthing process to obtain a ship’s motion state, which can visually and clearly visualize the ship’s trends and patterns related to time in the berthing and unberthing processes.
The rest of this paper is organized as follows. A literature review is given in Section 2. The method for spatial state analysis of a ship during the berthing and unberthing processes utilizing incomplete 3D LiDAR point cloud data is described in Section 3. The experiment and simulation scene are given in Section 4. Lastly, the results and discussion are summarized in Section 5.
2. Literature Review
With the continuous development and improvement of sensor technology, more and more high-precision sensors applied in the maritime field help with autonomous navigation by perceiving the surrounding environment. These sensors include radar, AIS, cameras [8,9], and LiDAR. However, radar has limitations in detecting objects at short distances [10], and AIS has some issues including low update rates, unpredictable error messages caused by human errors, limited availability, and not all ships being equipped with AIS devices [11,12,13]. Cameras require a high-quality imaging environment, and they are highly susceptible to adverse conditions such as rain, heavy fog, and harsh weather [14]. Due to the limitations of these devices, the detection information of ships approaching a shoreline is not accurate enough and cannot effectively assist ships with berthing and unberthing.
In contrast, LiDAR, as commonly used high-resolution imaging equipment [15], possesses a high resolution and accuracy in perceiving environments at close distances. This enables more precise target detection and tracking, making LiDAR well suited for short-range, near-field target monitoring [16]. Currently, research on the berthing and unberthing processes is mostly conducted based on complete point cloud data. Utilizing the point cloud data obtained from LiDAR, Jindal et al. [17] proposed a computer-assisted target detection and localization method in the mooring automation framework. Chen et al. [6] and Yan et al. [18] utilized a shore-based 3D laser scanner to measure the distance, approach angle, and velocity from the bow and stern of a ship to the dock for monitoring the ship’s state during the berthing process. Hu et al. [19] proposed a ship-based LiDAR-based method for estimating the berthing state of a ship. Based on LiDAR, a real-time tracking and berthing system was constructed by Chen et al. [12] and Chen and Li [20]. To realize multi-target tracking with high precision and stability for nearshore scenarios, Yao et al. [13] proposed a scheme which directly processes LiDAR point cloud data. Lin et al. [21] proposed a new data fusion framework for near-range identification. This framework involves clustering point cloud data from LiDAR into different targets and associating them with known targets, thereby achieving map construction and dynamic target tracking. Wang et al. [22] proposed a novel berthing assistance system centered around the ASV. By utilizing neural networks, Higo et al. [23] developed an automatic berthing and unberthing maneuvering system to address the trajectory tracking problem. Aside from that, Alenzi et al. [24,25] developed an advanced system which enhances the autonomy of robots in performing tasks. Xu et al. [26] presented research progress on the application of LiDAR to ecological issues. In conclusion, the research on intelligent berthing and unberthing scenarios of ships based on 3D LiDAR can mitigate disturbances caused by weather or environmental factors such that ships do not only rely on satellite navigation systems and inertial navigation systems during berthing movement. That aside, the reliability and accuracy of ship pose estimation in complex berthing and unberthing scenarios are improved.
However, due to various reasons, in practical scenarios, the acquired point cloud data may be incomplete due to missing, wrong, or inconsistent information, which will affect the accuracy of a ship’s motion state analysis. Especially for critical moments of a ship, it is necessary to accurately perceive the relationship between the ship’s surrounding environment, berthing velocity, and approach distance to avoid the occurrence of dangerous accidents. Hence, it is important to study a ship’s motion state under the incomplete data collected by LiDAR, which can propel the berthing and unberthing processes of ships toward a safer, more efficient, and intelligent direction.
Point cloud data contain information such as the position, strength, and time, and this information has rich spatial-temporal characteristics. To the best of the authors’ knowledge, there is limited research which employs geographic information system (GIS) spatial analysis technology to investigate a ship’s motion state during the berthing and unberthing processes. GIS spatial analysis techniques can effectively extract spatial features including the geographical position and distribution patterns obtained from point cloud data, providing accuracy and depth for analysis in the field of ship berthing and unberthing. Through qualitatively or quantitatively analyzing point cloud data, the characteristics and patterns of a ship’s motion state changes can be obtained, providing important support for safe and efficient intelligent berthing and unberthing [27]. Therefore, applying GIS spatial analysis theoretical techniques to point cloud data processing is of significant importance, allowing conducting comprehensive and in-depth research on a ship’s motion state.
3. Methodology
3.1. Data Preprocessing
It is necessary to perform data preprocessing operations in the analysis of a ship’s spatial motion state, which can contribute to obtaining crucial information more accurately. In this paper, a statistical filter technique is employed to filter the noise points in the acquired point cloud data [28]. Then, combined with the ship features, an improved adaptive clustering method is adopted according to the characteristics of the point cloud data, where near points are dense and far points are sparse [29,30,31]. The clustering threshold value of the method is automatically adjusted according to the characteristics of the data, thereby accurately detecting ships and coastlines, and the data about a ship’s area of interest can be extracted for the subsequent study of the ship’s motion state.
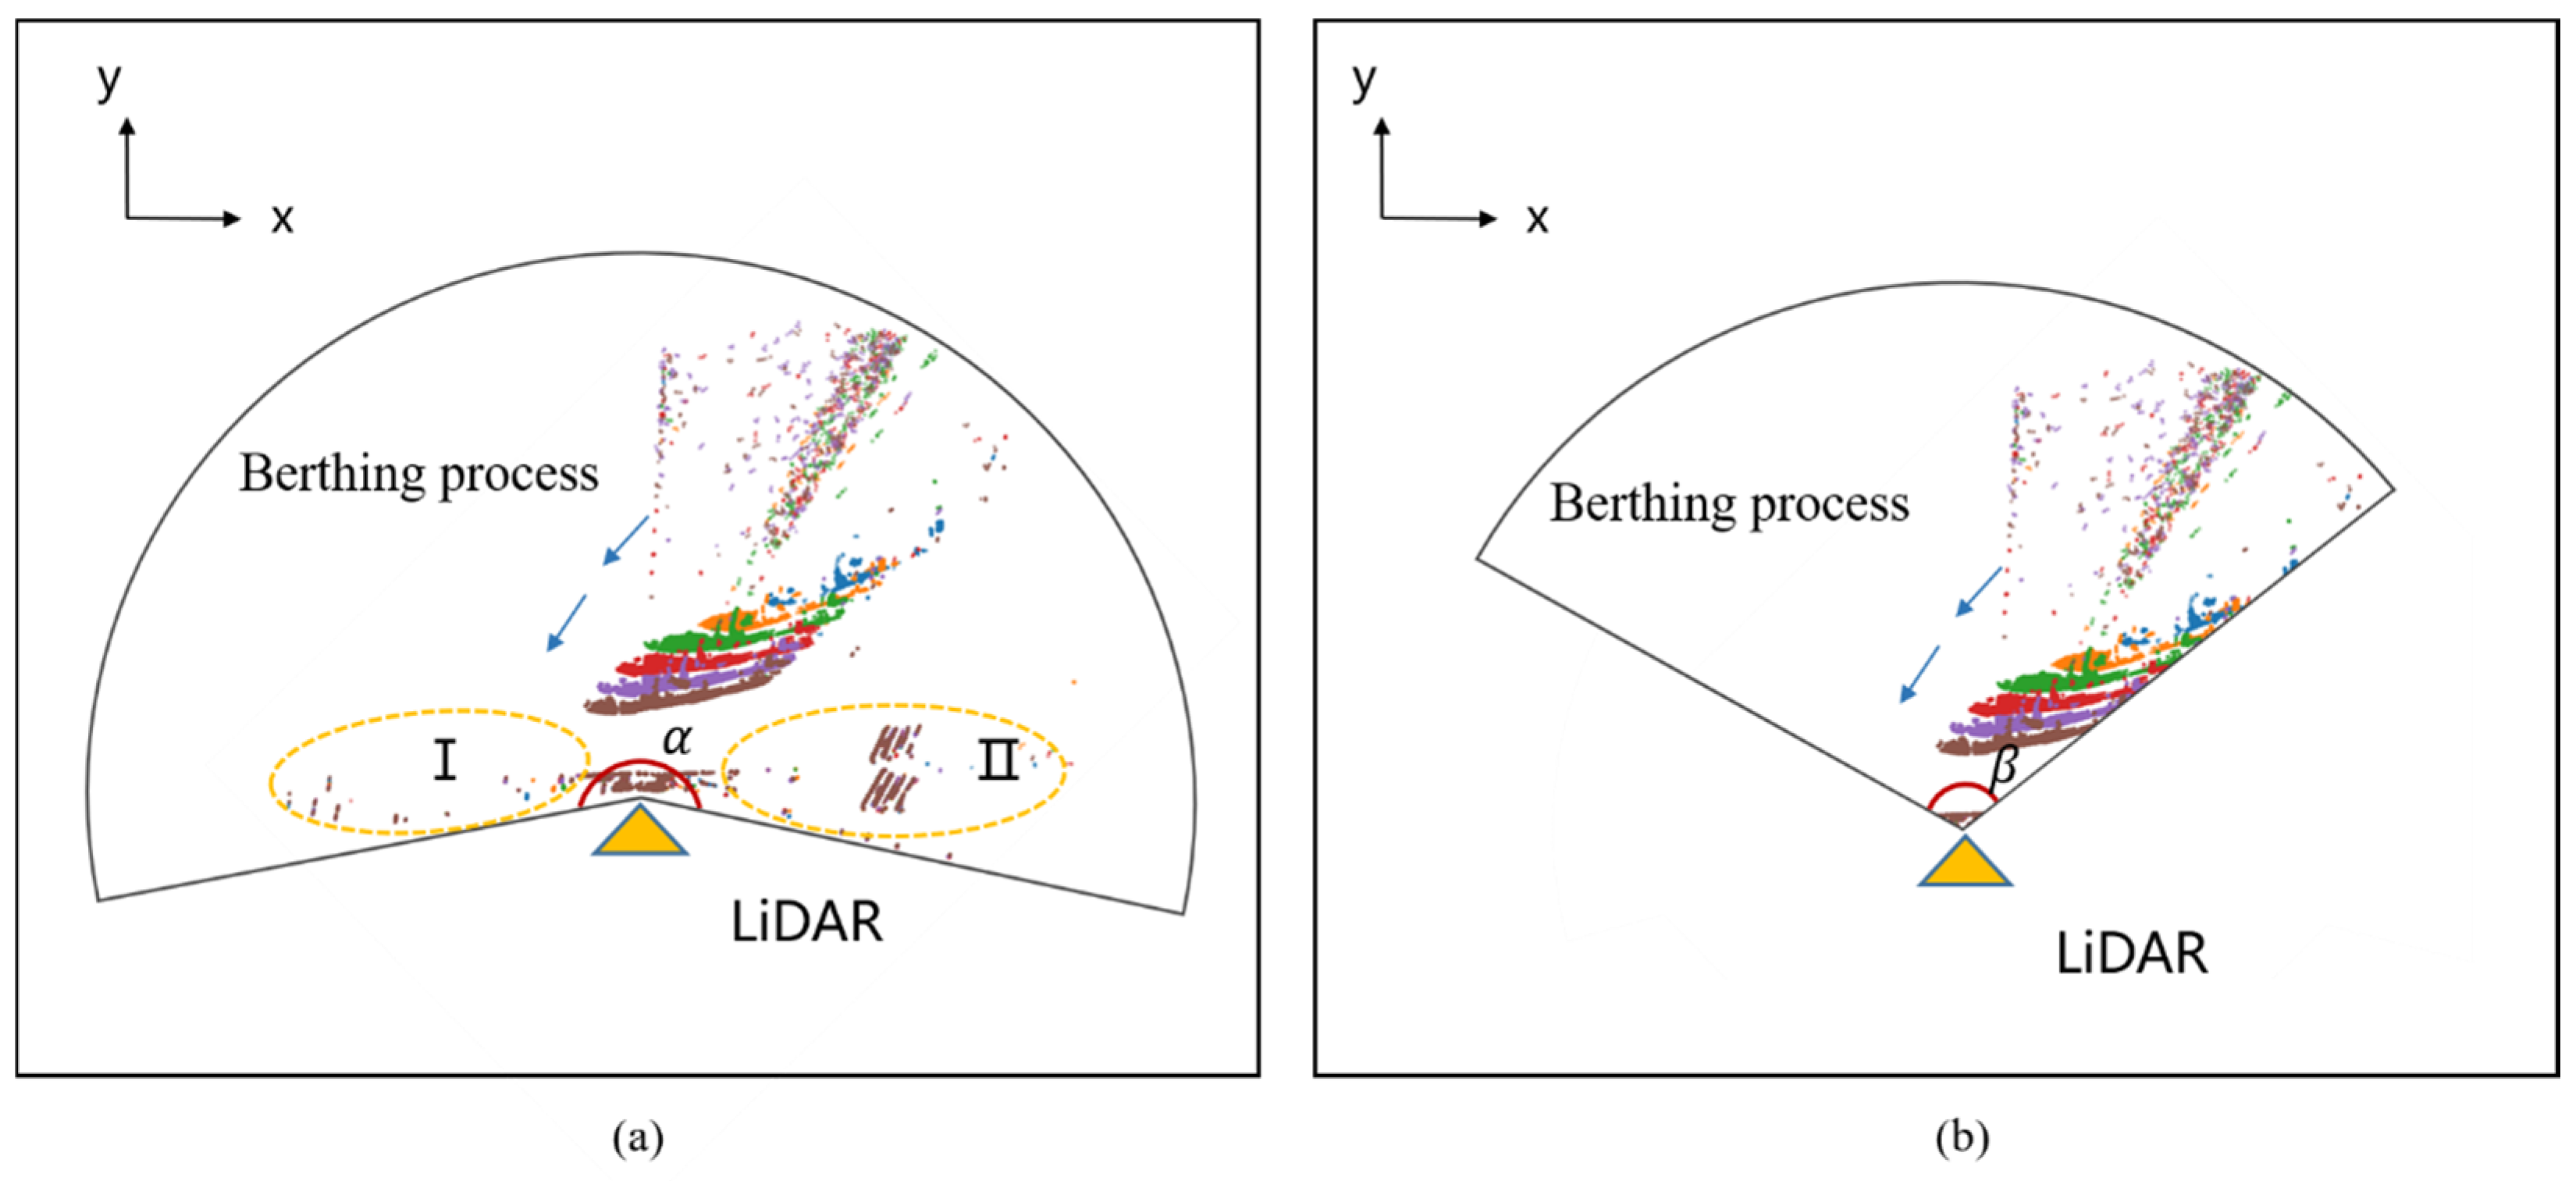
The incomplete data mentioned in this article are explained as shown in Figure 1. For the berthing process, the range of point cloud data collected was different due to the influence of the angle and placement position of the LiDAR device. It can be seen from the figure that the viewing angle range of the LiDAR device in Figure 1a was significantly larger than the angle range in Figure 1b, and thus parts I and II in Figure 1a do not appear in Figure 1b. In Figure 1a, the collected ship data, which are complete data, represent the entire vessel. In Figure 1b, the collected point cloud data, which are incomplete data, represent approximately two-thirds of the entire vessel. It can be observed that the missing data, which are defined as the missing part under incomplete data, were the stern. The visible data, which are defined as the complete part under incomplete data, were the bow and hull.
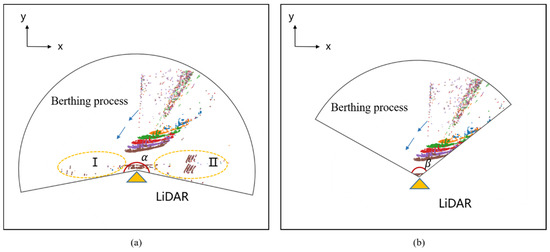
Figure 1.
Schematic diagram for a ship’s point cloud data collected by LiDAR: (a) complete data and (b) incomplete data.
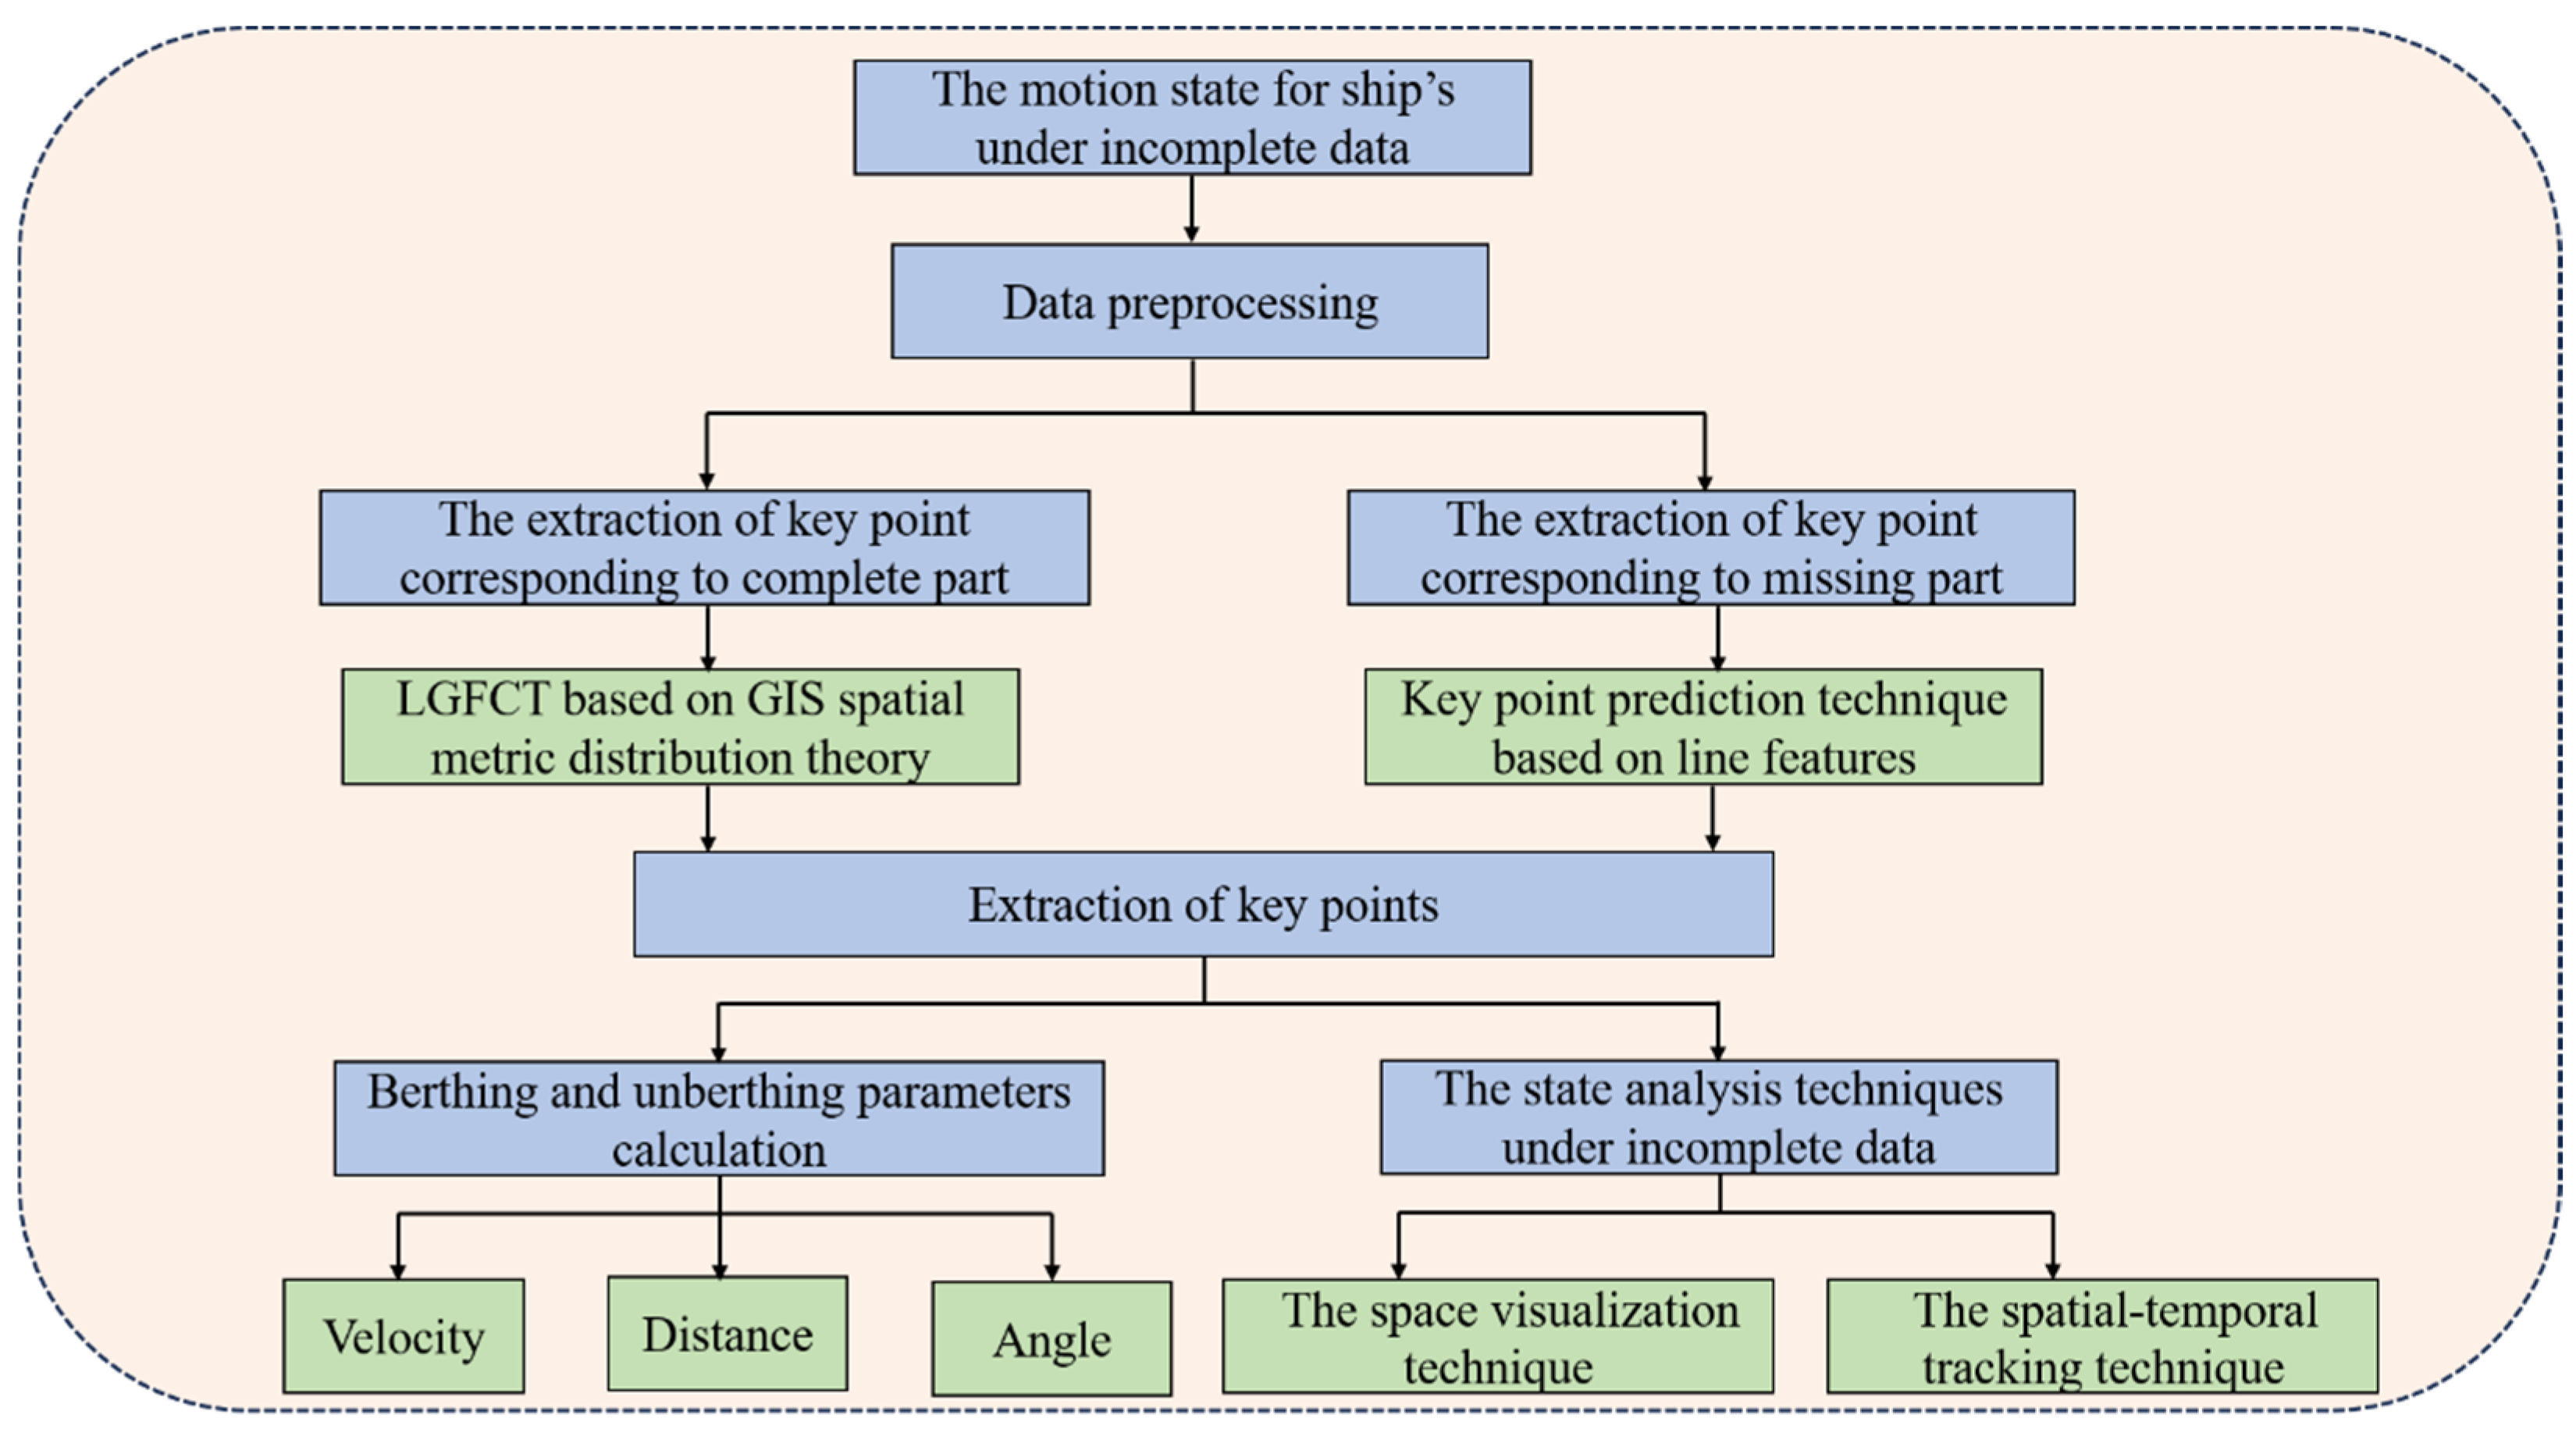
Aiming to provide a clear understanding of the methodology before delving into the details, the flowchart of the method is given in Figure 2.
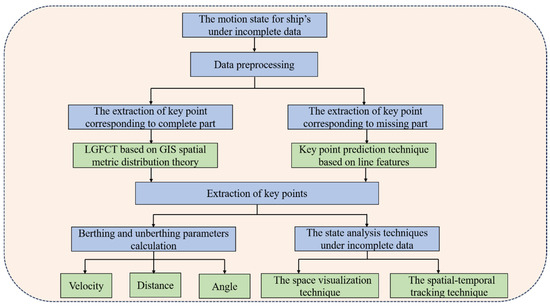
Figure 2.
The flowchart of the spatial state analysis of the ship berthing and berthing processes with incomplete data.
3.2. The Extraction of the Key Point Corresponding to the Complete Part Under Incomplete Data
Point cluster data obtained from LiDAR can be fitted into different geometric shapes based on their geometric features, which can more accurately determine the size of a ship and the directional characteristics of its motion [32]. With reference to this idea, aiming to improve positioning accuracy and avoid the influence of overfitting for the complete part under incomplete data, this paper proposes a local geometric feature extraction technique (LGFCT) on the basis of GIS spatial metric distribution theory to accurately extract the key points of the complete part data under incomplete data.
In order to better conduct local feature fitting, longitudinal segmentation is performed by setting corresponding thresholds based on the actual situation of the angle and placement position of the LiDAR device. The aim is to obtain complete parts with equal lengths from incomplete data. We must mention that the threshold for longitudinal segmentation is determined by the following three steps. (1) An arbitrary threshold is given as an initial value. (2) Two main principles are utilized to evaluate the effectiveness of the threshold. One principle is that the setting threshold can retain data which reflect the complete berthing and unberthing processes. The other principle is that the data after the longitudinal segmentation operation according to the threshold will retain as much of the entire ship as possible. (3) The threshold is determined by constantly adjusting based on the two principles. Then, while relying on generating the geometric shape of the complete part, local geometric feature fitting is applied to point cloud data processed by longitudinal segmentation. Finally, key feature points are obtained from the fitted geometric shape. It was found that the locally fitted shape is primarily determined by the geometric features of the intercepted ship parts. The following section provides a detailed introduction to the basic principles of this technique.
3.2.1. Elliptical Fitting for Point Cloud Data of a Ship’s Bow
When the complete part under the incomplete data corresponds to the ship’s bow, the ellipse shape is adopted to better fit the point cloud data of the ship’s bow due to the shape features of the longitudinal segmentation bow. It should be noted that the idea of elliptical fitting is adopted from the standard deviation ellipse of the GIS metric geographic distribution analysis method. This method involves measuring the distribution of a set of features to calculate values which represent the distribution characteristics, such as the central location, shape, orientation of the data, and feature distribution.
To measure and analyze the distribution characteristics of geographic features [33,34], the standard deviation ellipse of the GIS metric geographic distribution analysis method is used, which can characterize the center, dispersion, and directional trends of spatial geographic features by creating standard deviation ellipses or ellipsoids. Simultaneously, the long semi-axis and short semi-axis of the standard variance ellipse represent the direction and range of the data distribution, respectively. However, as shown in Figure 3a, the obtained ellipse does not fully encompass all of the data when directly applying this technique. Therefore, based on the standard variance ellipse, some improvements are required, with the aim of making all data as contained in the ellipse as possible. The modified schematic diagram is shown in Figure 3b, where the long semi-axis direction of the ellipse (orange dashed line) represents the directional distribution characteristics of the point cloud data. The specific strategy for the improvements mentioned above is introduced as follows:
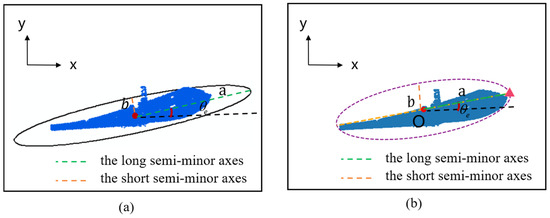
Figure 3.
Schematic diagram of the ellipse fitting technique for treating point cloud data: (a) space standard deviation ellipse technique and (b) LGFCT technique.
- (1)
- Determination of the central point
The center point of the ellipse is determined by the center point of the spatial measurement, which is the geometric center of the spatial target or the distribution center of a spatial target composed of multiple points in space. Hence, owing to the motion of the ship being studied, the center of the berthing and unberthing processes is the geometric center of the spatial target ship. For a space object with a regular shape, the center is easy to determine. For example, the center of a circular space object is the geometric center, while the center of a spatial target with a linear shape is the midpoint of its length. This study focuses on a ship’s motion state during the berthing and unberthing processes under incomplete data, where the shape of spatial targets obtained in this case are more irregular. Therefore, for a space object with an irregular shape, the geometric center can be calculated using the following formula:
where and are the horizontal and vertical coordinates of the geometric center of the irregular space target, respectively, represents the number of points in the point cloud data, and and are the horizontal and vertical coordinates of the ith point of the point cloud data in the above formula, respectively. As displayed in Figure 3b, the blue part is the point cloud data of the ship, and the red reference point O represents the center point of the point cloud data.
- (2)
- Determination of rotation angle
PCA is a commonly used method for the dimensional reduction of data, which is usually used to find the main direction of a data set. In addition, the PCA method has the advantage of reducing dimensionality, feature extraction, and noise filtering, among others. In the analysis of ship motion, the PCA method is used to determine the main direction of a ship’s point cloud data so as to obtain the rotation angle of the ship.
Therefore, according to the basic principle of principal component analysis (PCA) [35], the covariance matrix is obtained by obtaining the point cloud data and its center point, and its specific expression is
in which
Then, eigenvalue decomposition of the covariance matrix is carried out. The angle between the decomposed feature vector and the x axis, which is also the angle between the ellipse and the x axis, is referred to as the rotation angle of the point cloud data.
- (3)
- The extraction of key points
After an ellipse is created by obtaining the center point and rotation angle, the key point to be solved is at the right endpoints of the ellipse. As shown in Figure 3b, the key point of this part is the red triangle point, which can be calculated as follows:
where represents the coordinates of the center point in the ellipse, and denote the lengths of the long and short semi-minor axes, respectively, and is the rotation angle of the ellipse. A detailed description can be found in Section 3.4.
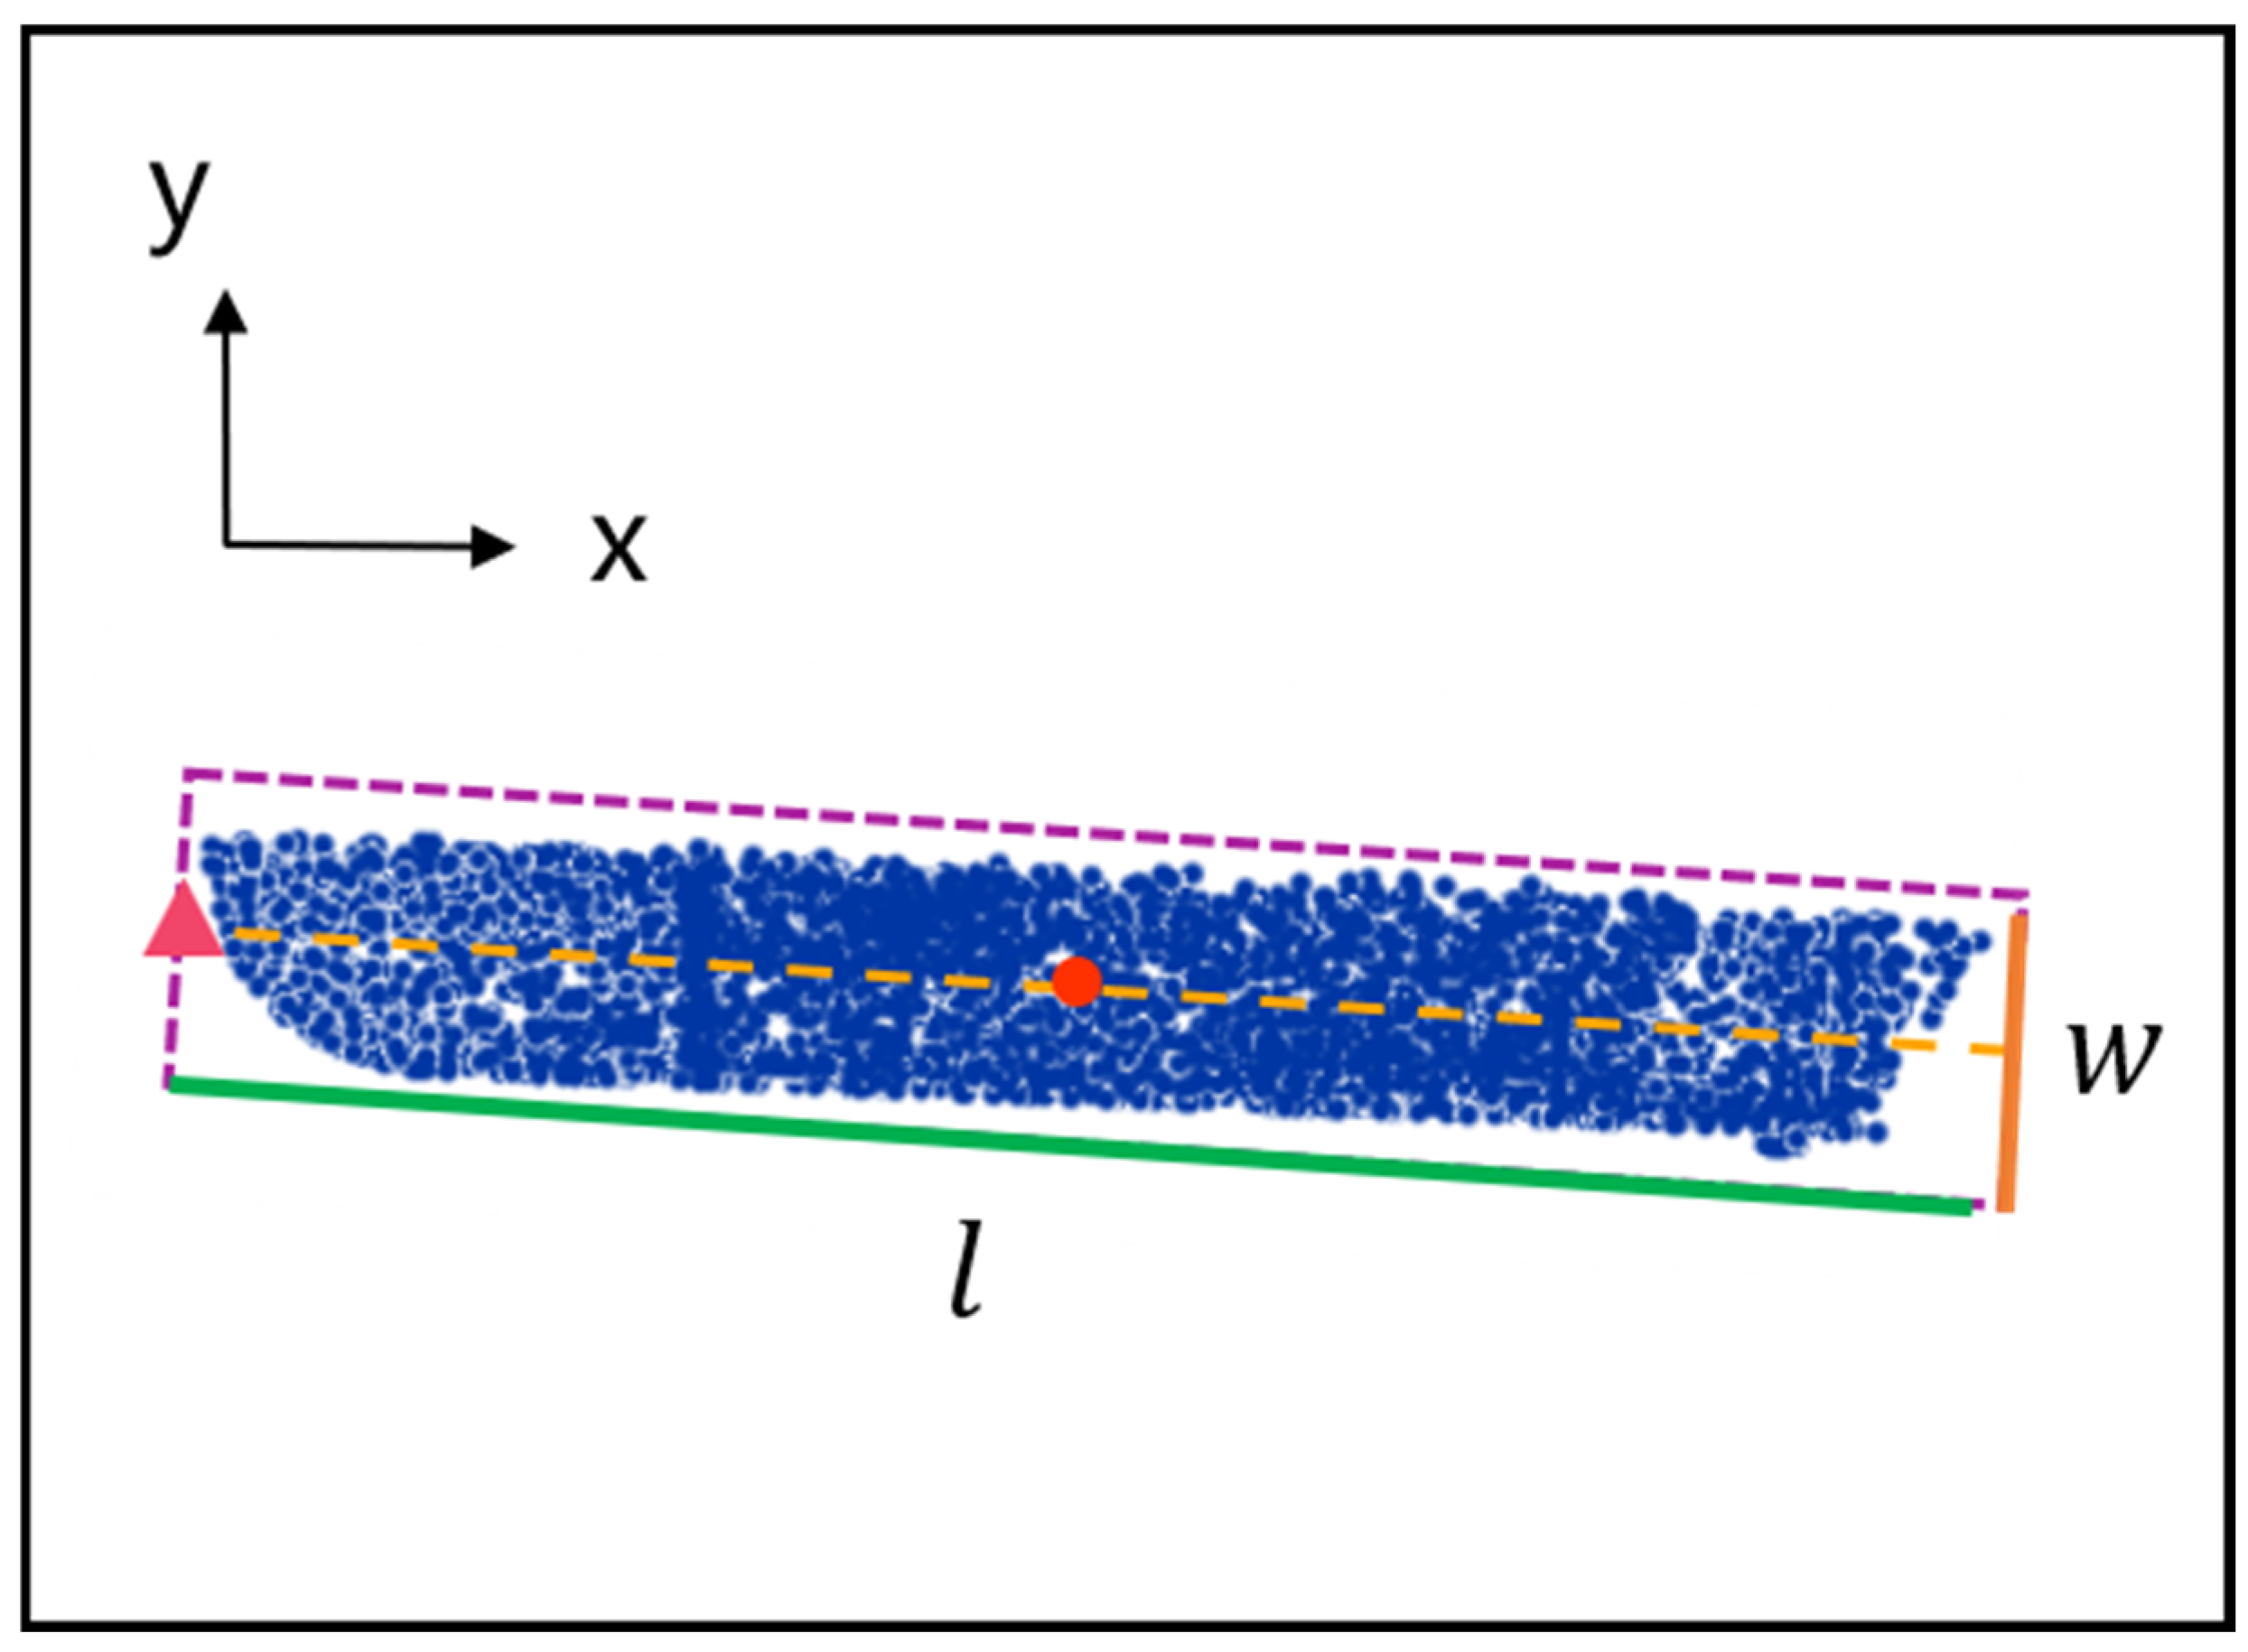
3.2.2. Rectangular Fitting of a Ship’s Stern
When the complete part under the incomplete data corresponds to the ship’s stern, the rectangular shape is adopted to better fit the point cloud data of a ship’s stern, owing to the shape features of the longitudinal segmentation stern (in Figure 4).
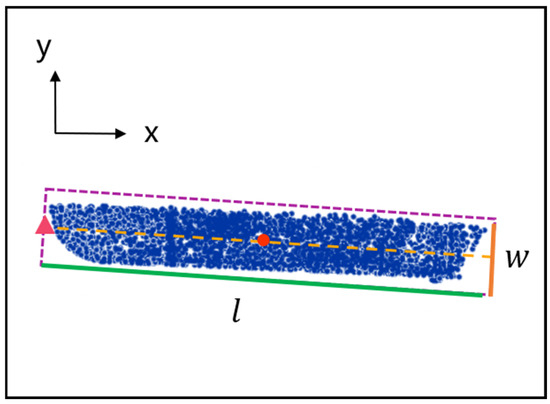
Figure 4.
Schematic diagram of the rectangular fitting technique.
Like the steps in Section 3.2.1, the angle between the rectangle and the x axis is referred to as the rotation angle of the point cloud data. At this time, the key point of the cloud data in this part can be calculated according to the following formulae:
where represents the coordinates of the center point in the rectangle, and denote the length and width, respectively, and is the rotation angle of the rectangle relative to the x axis. A detailed description can be found in Section 3.4.
3.3. The Extraction of Key Points Corresponding to Missing Parts Under Incomplete Data
In order to clearly visualize a ship’s motion process, it is important to predict the key point of the missing part under incomplete data. Therefore, this paper proposes a key point prediction technique based on line features. This technique utilizes the geometric relationships between key points obtained in Section 3.2 and the line elements representing the ship for calculation so as to obtain the key points of missing parts under incomplete data. Next, the principle of this technique will be briefly introduced:
- (1)
- The flat part of a ship’s point cloud data is cut according to the shape characteristics of the ship.
- (2)
- The line element is generated by utilizing the rotation angle of the point cloud data of the flat part calculated by the PCA method and the key points of the complete parts extracted in Section 3.2.
- (3)
- The key point of the ship’s missing part is predicted based on spatial geometric relationships. For example, with the extracted key point on one side of the ship and the slope m calculated by the rotation angle, the line equation is expressed as follows:
Then, combined with the ship’s length and the key point of the missing part, we can calculate
3.4. Calculation for Berthing and Unberthing Parameters Under Incomplete Data
Calculation of the berthing and unberthing parameters is an indispensable component for ensuring safe berthing and unberthing processes. The obtained berthing and unberthing parameters include , , , , and , in which is the distance between a ship’s bow and shoreline, is the distance between a ship’s stern and the shoreline, is the velocity between a ship’s bow and the shoreline, is the velocity between a ship’s stern and the shoreline, and is a ship’s approach or departure angle. These five parameters can be calculated by extracting the center point and rotation angle.
Figure 5 shows the schematic diagram for calculating the berthing and berthing parameters under incomplete data. In this figure, the LiDAR device on the shoreline serves as the coordinate origin, with the sector region representing its scanning range. The orange area represents the point cloud data of the bow and the point cloud data of the stern in the incomplete data. The blue point cloud data, which are marked by a solid dark blue line, represent the shoreline. The dark blue dashed line is parallel to the shoreline, and the pink dashed line represents the length of the ship. The green ellipse and rectangle represent the geometric shapes fitted to the point cloud data corresponding to the ship’s bow and stern, respectively. is the center of the point cloud data determined by longitudinal segmentation, and it is also the center of the fitted ellipse and rectangle. and are the key points related to the ship’s bow and stern, respectively. The specific calculation process is described below.
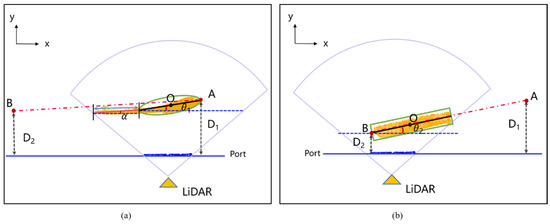
Figure 5.
Schematic diagram of berthing and unberthing parameters when the missing part is under incomplete data: (a) the missing part is the ship’s stern or (b) the missing part is the ship’s bow.
In Figure 5a, the missing part under incomplete data is the ship’s stern, and the berthing and unberthing parameters and can be calculated using the following expressions:
where , which is the long semi-axis of the ellipse, represents the distance from the center of the point cloud data to the key point A of the ship’s bow, , which is the length of the ship, denotes the distance between points A and B, is the angle between the cut point cloud data of the bow part and the shoreline, and is the angle between the flat part of the ship’s point cloud data (within the range of the blue arrow) and the shoreline.
In Figure 5b, the missing part under incomplete data is the ship’s bow, and the berthing and unberthing parameters and can be calculated using the following expressions:
where , which is one half of the long side of the rectangle, represents the distance from the center of the point cloud data to the key point B of the ship’s stern and is the angle between the cut point cloud data of the stern part and the shoreline.
That aside, it must be mentioned that the departure and approach angles in Figure 5a,b were obtained via PCA. The steps to obtain the velocity of a ship’s bow and stern relative to the shoreline are detailed as follows. First, the distance (, ) between the shoreline and a ship’s bow at adjacent moments and the distance (, ) between the shoreline and a ship’s stern at adjacent moments are obtained, and then the ratio of the difference in distance between adjacent moments and the time interval yields the velocity, which can be expressed as follows:
where denotes a certain moment, is the velocity between the shoreline and the ship’s bow, and is the velocity between the shoreline and the ship’s stern.
3.5. The State Analysis Techniques for a Ship’s Berthing and Unberthing Processes Under Incomplete Data
3.5.1. The Space Visualization Technique for a Ship’s Motion State
In order to spatially observe the motion of the entire ship, the space visualization technique was used. The spatial visualization technique can display data in space by graphical means so as to understand the structure, relationship, and pattern of data more intuitively. In this paper, the point cloud data of the ship at each moment were simplified as a line element by utilizing this technique. Then, the surface region composed of line elements was analyzed to determine the motion state of the entire ship.
We must mention that for the surface region, the reclassification technique was employed to reclassify the obtained directional attribute data in this region. Through this technique, the data were segmented into different categories or regions. This operation can change the way in which the data are expressed and help extract interesting information from the data, with the aim of perform the spatial visualization analysis better. The results obtained with the above techniques for the spatial visualization in the unberthing process can be found in Section 4.4.1.
3.5.2. The Spatial-Temporal Tracking Technique for a Ship’s Berthing and Unberthing
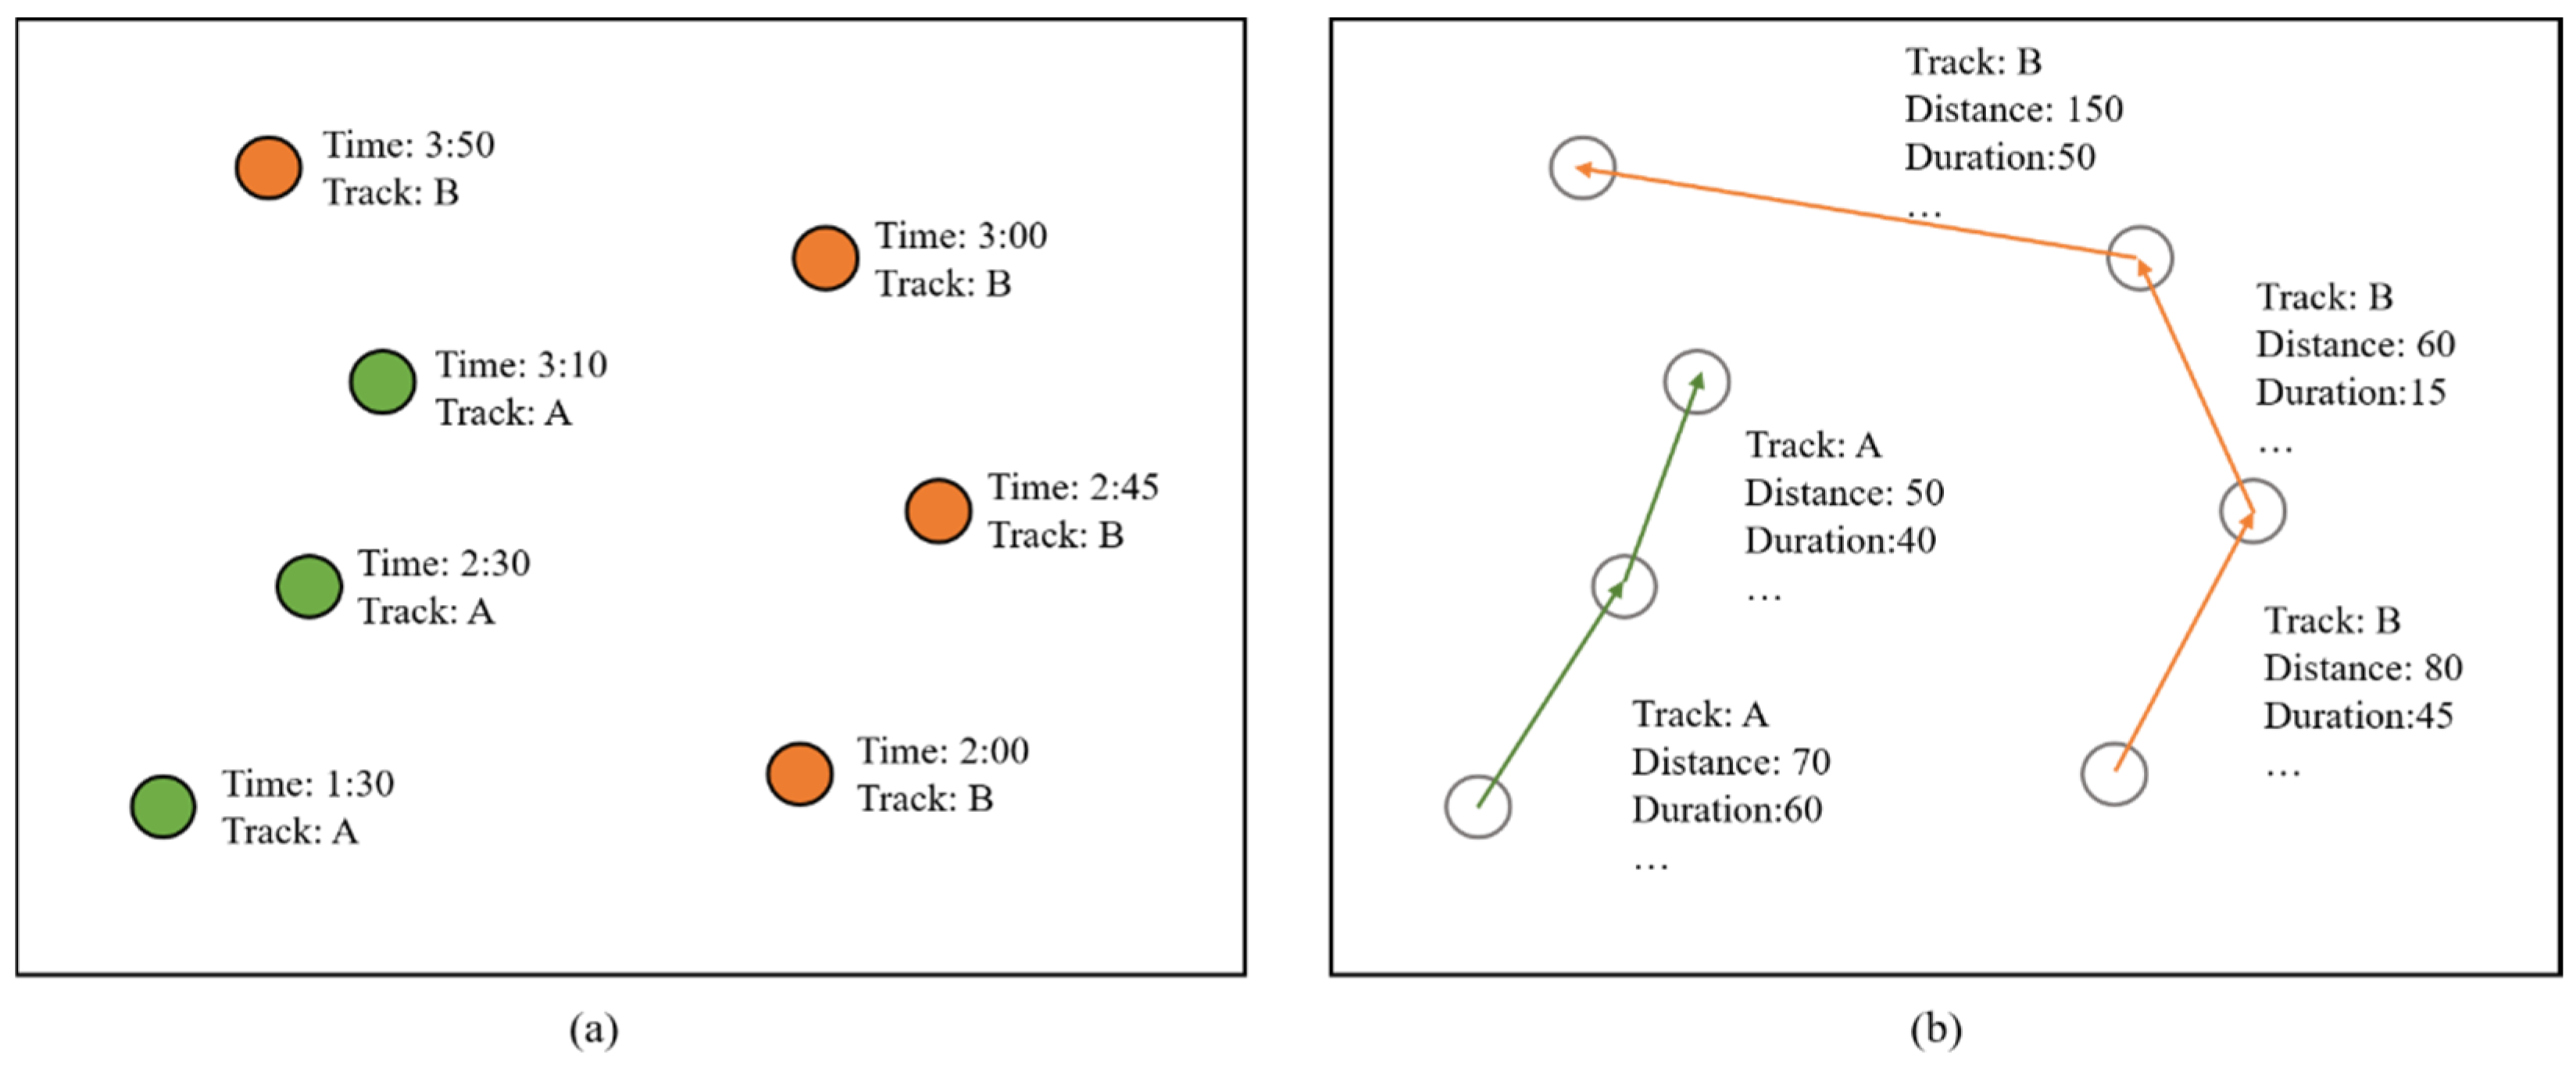
Combined with the tracking analysis technique introduced from GIS and obtained spatial geometric information (key points), further analysis for the motion state of a ship during the berthing and unberthing processes was performed. The related results are presented in Section 4.4.2. Next, the tracking analysis technique from GIS will be briefly introduced.
The tracking analysis technique is used to trace events by generating tracking layers from geographic data containing temporal information and subsequently incorporating them into layers. First, the collected data regarding the target’s position and time need to undergo preprocessing operations, including coordinate system conversion, data cleaning, and timestamp synchronization. Then, the data are tracked based on the motion characteristics, and the trajectory is plotted. Finally, the line tracking interval operation is performed. This operation calculates the attribute values (distance, duration, speed, and route) based on the differences between consecutively arranged features in the trajectory. At the same time, a new line feature class which can calculate attribute values is created to represent the tracking intervals. As shown in Figure 6a, the green point and the orange point represent point A and point B, respectively. Through the tracking analysis technique, these point data are used to generate trajectory line elements with attribute values. As shown in Figure 6b, the green trajectory line is generated from point A in different instants, while the orange trajectory line is generated from point B in different instants.
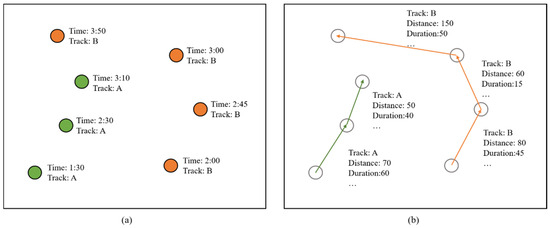
Figure 6.
Schematic diagram of the spatial-temporal tracking analysis: (a) trajectory point and (b) trajectory line.
4. Experiments and Simulations
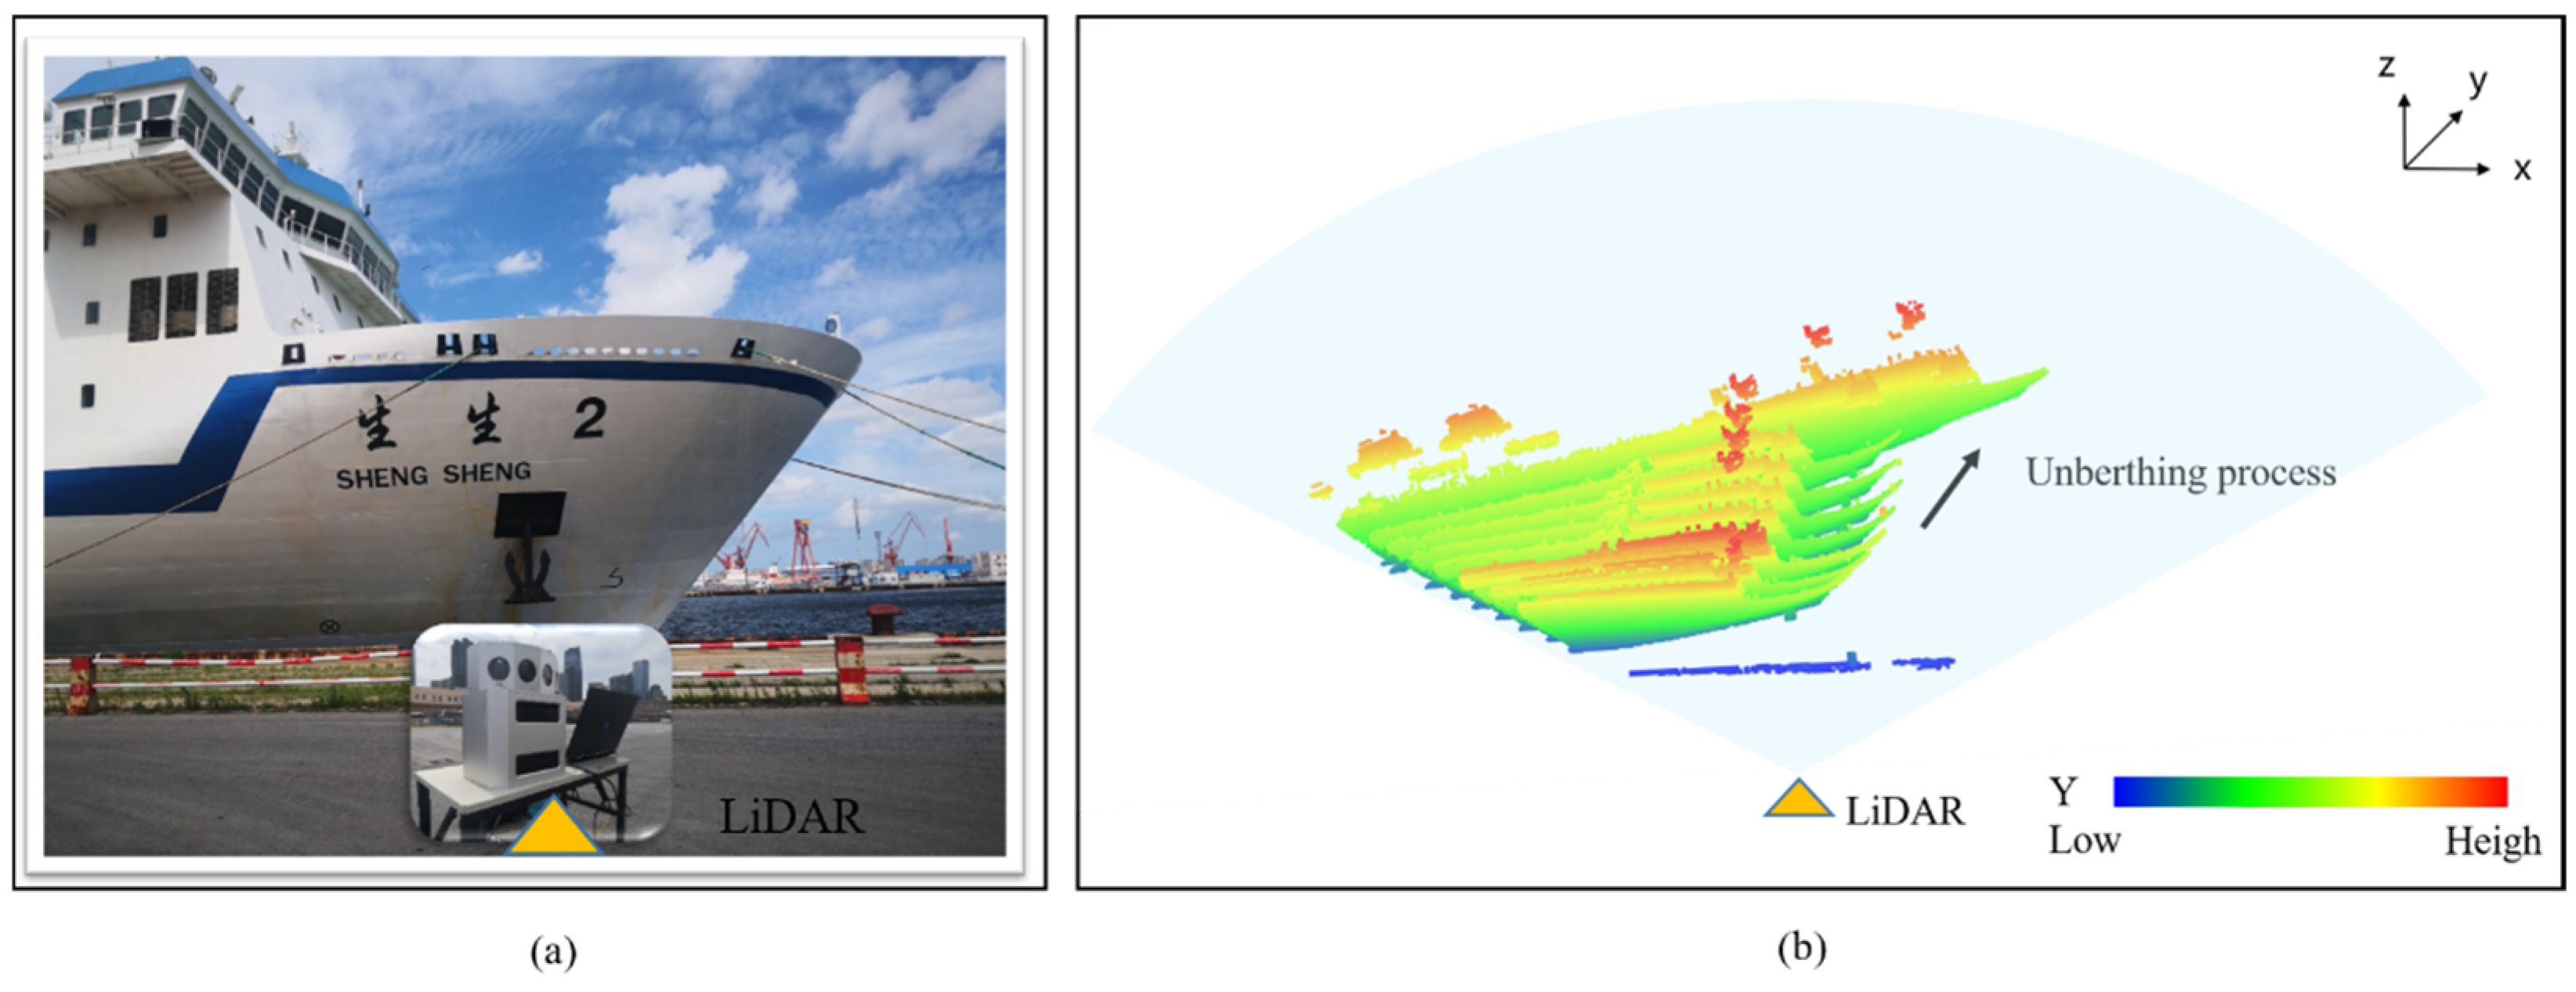
To verify the effectiveness of this method, this paper conducted experiments on the unberthing process of the ship named ShengSheng 2 at Dalian Port (Figure 7a). To avoid interference from obstacles at the front of the dock (such as protective columns or other facilities) during measurements, LiDAR equipment was placed at the front of the dock to obtain accurate measurement results. Shown in Figure 7b are the point cloud data collected during the ship’s unberthing process. It can be observed that in the point cloud data, the complete part is the ship’s bow, while the missing part is the ship’s stern.
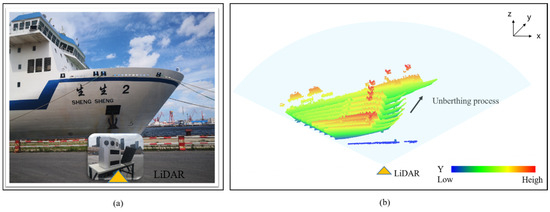
Figure 7.
The ship’s unberthing process: (a) experiment scene and (b) point cloud data.
The point cloud data for the ship’s berthing process, which were obtained through simulations, are shown in Figure 8. It is clear that in the point cloud data, the complete part is the ship’s stern, while the missing part is the ship’s bow (Figure 8b). The simulated ship point cloud data were obtained based on ship models, and then the motion trajectory was generated from the motion characteristics of the ship during the berthing process. It should be noted that the ship used for the simulation scene was different from the ship used for the real experiment. Figure 8a shows the schematic diagram of the ship’s motion process in the entire simulation scenario, where the direction of the arrow is the direction of motion.
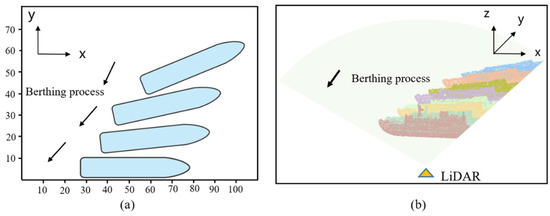
Figure 8.
The ship’s berthing process: (a) simulated scene and (b) point cloud data.
We should mention that the environmental data around the unberthing area and noise points also appeared in the acquired point cloud data. For the unberthing process in the experiment, Figure 9a,b shows the results before and after data preprocessing. It is obvious that the noise data of parts I and II were filtered out after processing. For the berthing process in the simulated data, Figure 9c,d shows the results before and after data preprocessing. It can be found that a significant reduction in data volume was helpful for subsequent calculations. It can be seen that the preprocessing of point data not only preserved the structural features of the ship as much as possible but also greatly improved computational efficiency.
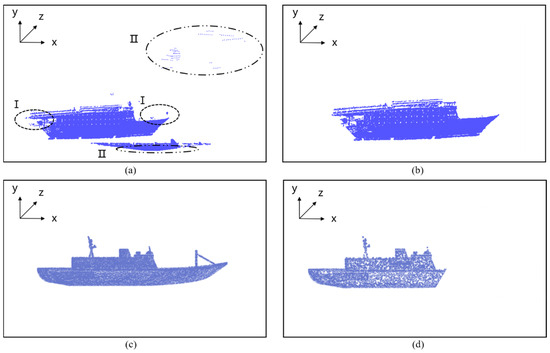
Figure 9.
Point cloud data: (a) original point cloud data in the experiment, (b) preprocessed point cloud data in the experiment, (c) original point cloud data in the simulated scene, and (d) preprocessed point cloud data in the simulated scene.
4.1. Extraction Results for the Key Points of the Complete Part Under Incomplete Data
The results for the ship’s complete part obtained by longitudinal cutting are shown in Figure 10. Subsequently, the key point of the complete part under incomplete data was extracted using the LGFCT, and then the ship’s motion state was analyzed.
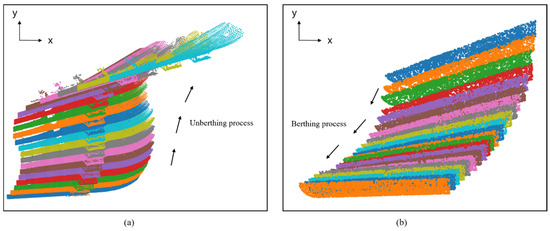
Figure 10.
Schematic diagram for the point cloud data obtained by longitudinal cutting: (a) the real experiment data for the ship’s bow and (b) the simulated data for the ship’s stern.
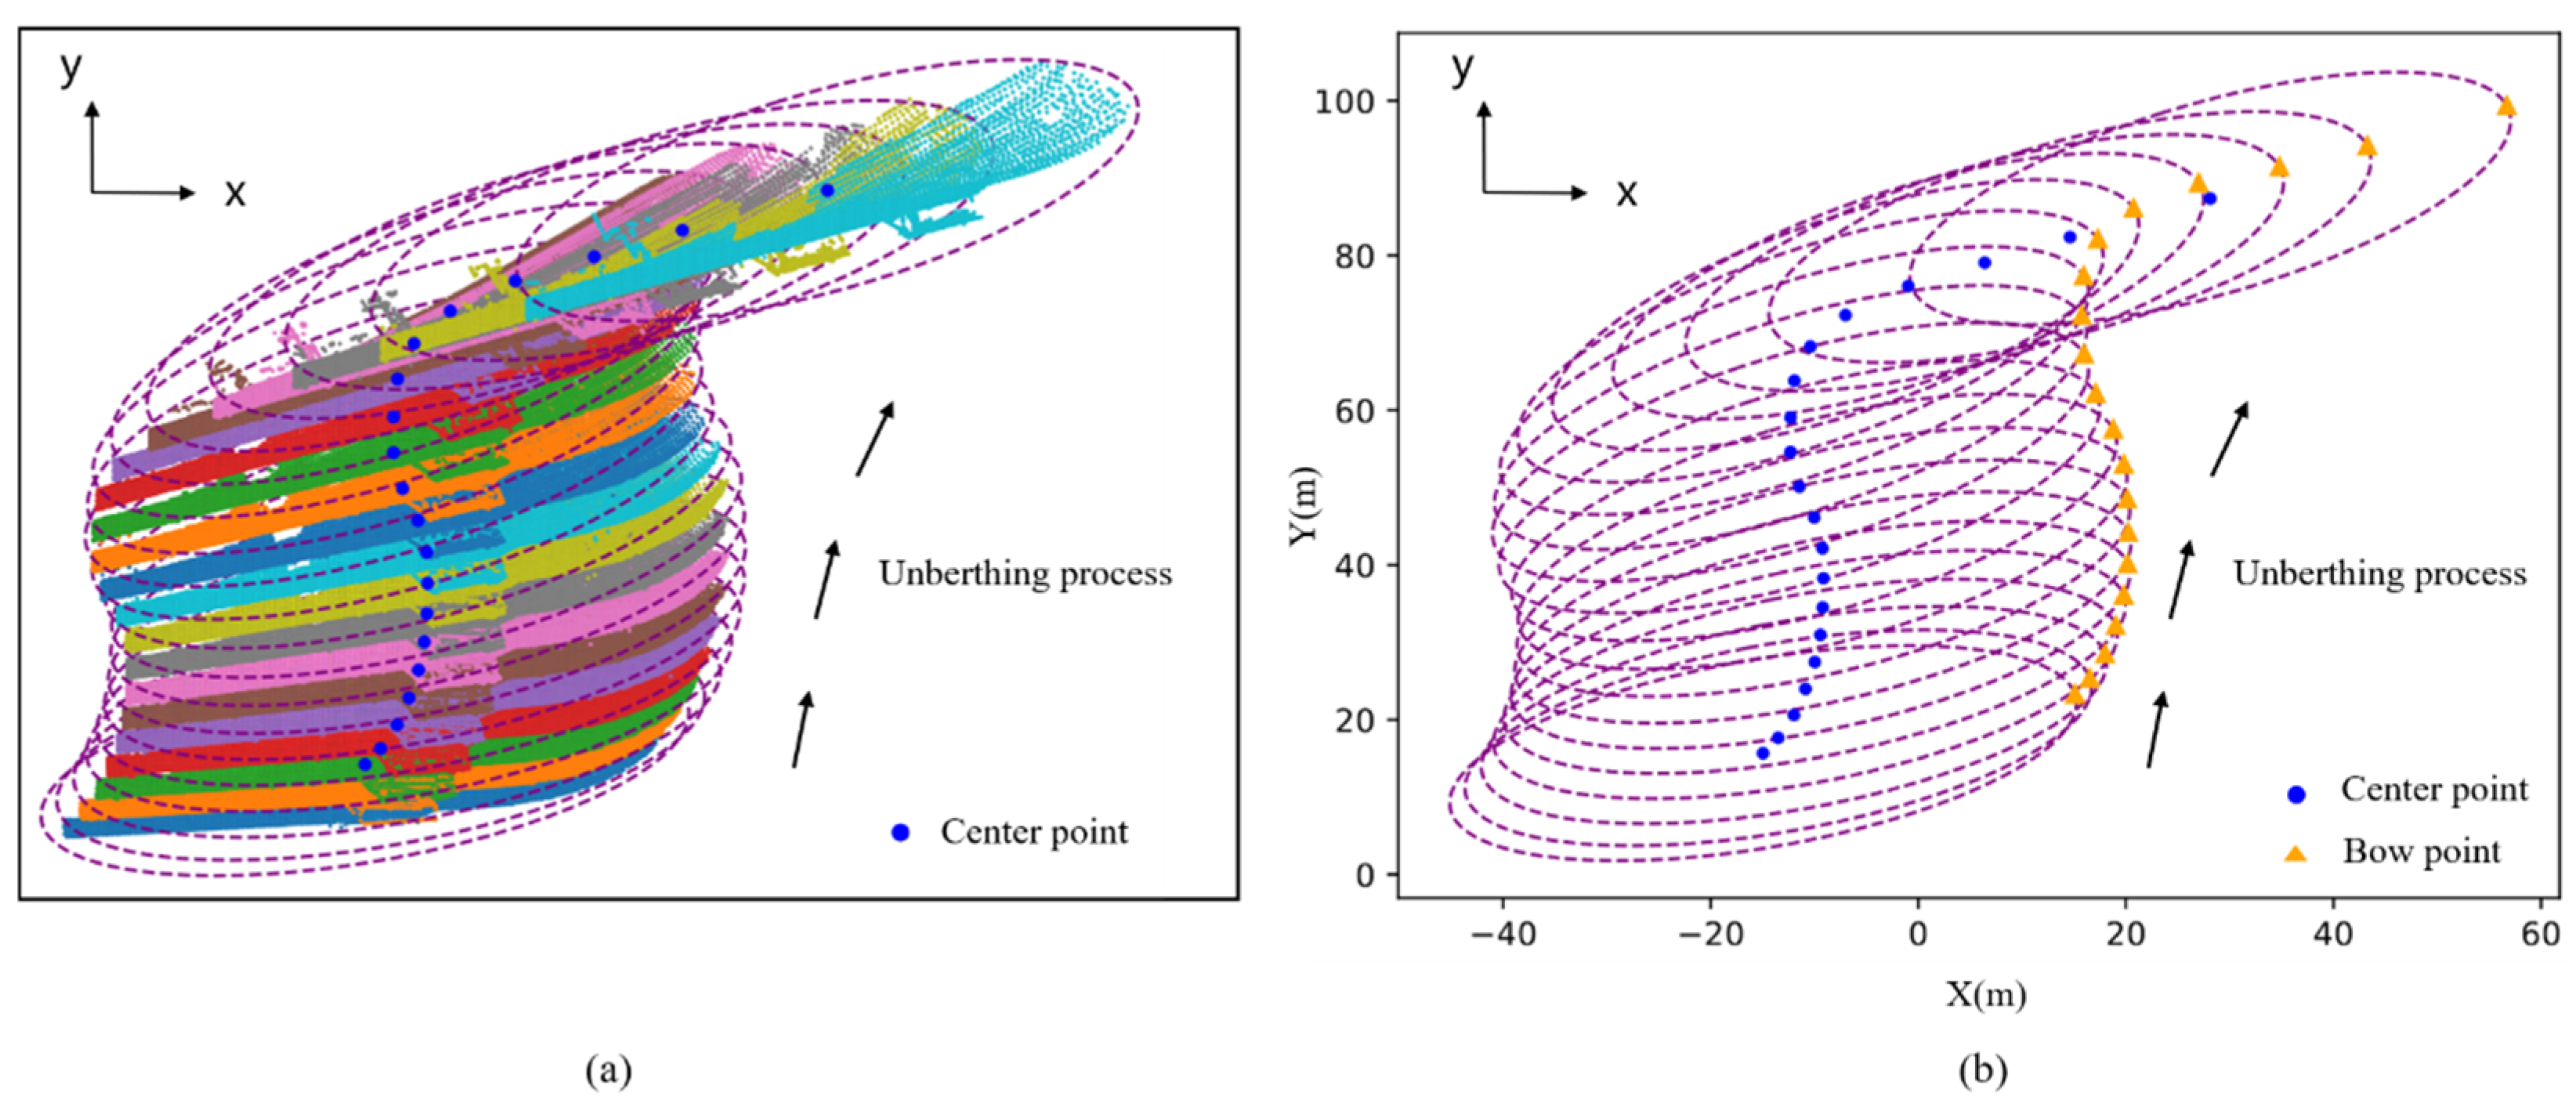
For the unberthing data obtained from the experiment, the complete part of the point cloud data was the ship’s bow. The extraction of the key points is described below. First, the center point was extracted from point cloud data processed by longitudinal segmentation. Second, based on the geometric shape in this part, the elliptical fitting was adopted to cover the point cloud data of the complete part. As shown in Figure 11, the purple elliptical bounding boxes not only indicate the position of the bow but also capture the directional characteristics of its motion. Finally, as shown in Figure 11b, the key points of the ship’s bow were extracted, where the key points are represented by the orange triangles.
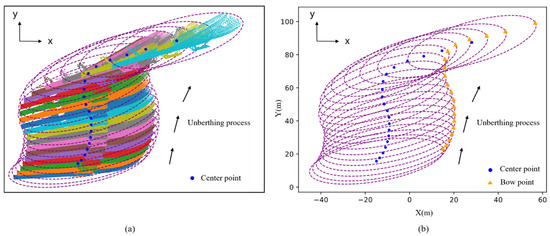
Figure 11.
Schematic diagram of the motion state with the ship’s bow as the complete part: (a) elliptical fitting and (b) the extracted key points.
According to the obtained key points, the motion state of the ship’s bow during the unberthing process was analyzed. As shown in Figure 11b, the position changes of the blue center points and orange triangles in the figure can roughly reflect such a motion process. The ship’s bow departed from the coastline with slow movement to the right and forward. At approximately 50 m away from the shoreline, the ship’s bow moved slightly to the left and then to the right, and the whole process was similar to an S shape. When the distance between the ship and the shoreline was greater than 80 m, the trend of lateral movement of the ship was quite significant, and the distance between ships also gradually increased within the same time frame.
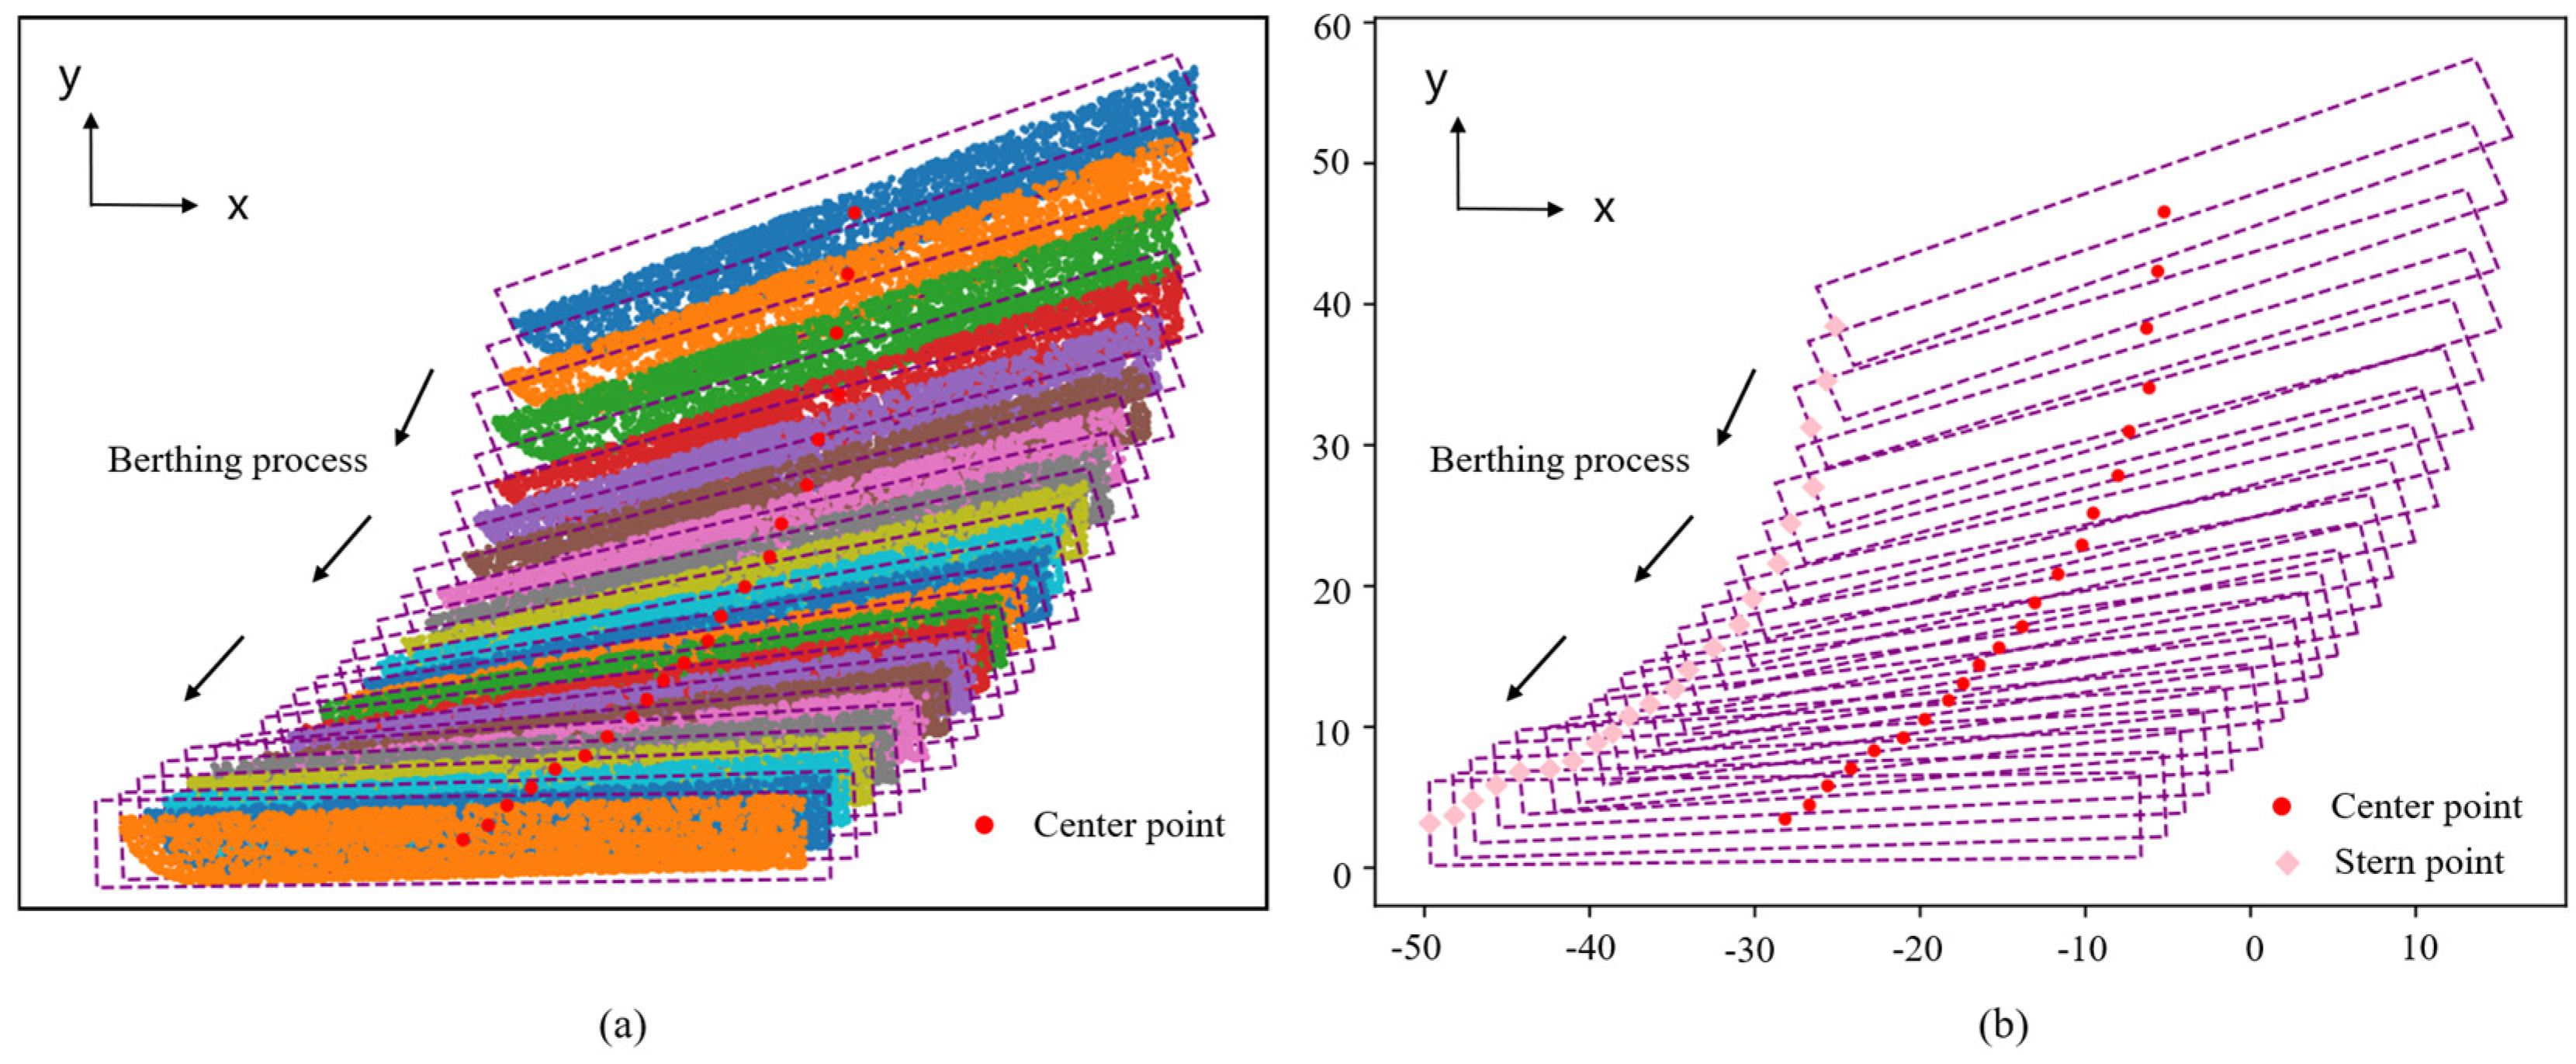
For the simulated berthing data, the complete part of the point cloud data is the ship’s stern. The extraction of the key points was carried out as follows. First, the center point was extracted from the point cloud data processed by longitudinal segmentation. Second, based on the geometric shape in this part, the rectangular fitting was adopted to cover the point cloud data of the complete part. As shown in Figure 12, the purple elliptical bounding boxes indicate the position of the bow and the directional characteristics of its motion. Finally, as shown in Figure 12b, the key points of the ship’s stern were extracted, where the key points are represented by pink diamonds.

Figure 12.
Schematic diagram of the motion state with the ship’s stern as the complete part: (a) rectangular fitting and (b) the extracted key points.
According to the obtained key points, the motion state of the ship’s stern during the unberthing process was analyzed. As shown in Figure 12b, the position changes of the blue center points and pink diamonds in the figure can roughly reflect such a motion process. The stern approached the shoreline before the bow. At a greater distance from the shoreline, the ship moved at a higher velocity, whereas at a closer distance to the shoreline, the vessel moved at an extremely low velocity. In terms of the directional characteristics, the ship’s stern moved toward the coastline on the left side in the entire process.
It is worth noting that the obtained key points of the complete part provided a reliable data foundation for subsequent parameter extraction of the missing part of the ship.
4.2. Extraction Results for Key Points of Missing Part Under Incomplete Data
To further determine the overall ship’s motion state under incomplete data, the key points in the missing part could be predicted with the key points from the complete part and the prediction technique described in Section 3.2.
For the unberthing data obtained from the experiment, the missing part of the point cloud data was the ship’s stern. The extraction of the key points was carried out as follows. First, the ship’s rotation angle was determined by the point cloud data of the relatively flat part dealing with longitudinal segmentation. To obtain more accurate calculation results, the value of the threshold should meet the need of retaining as much point cloud data from the flat part as possible when performing the longitudinal segmentation. Then, the direction of generating line elements could be determined by the obtained rotation angle. Finally, the key point of the ship’s missing parts was predicted based on the spatial geometric relationships between the key points in the complete part and the obtained rotation angle.
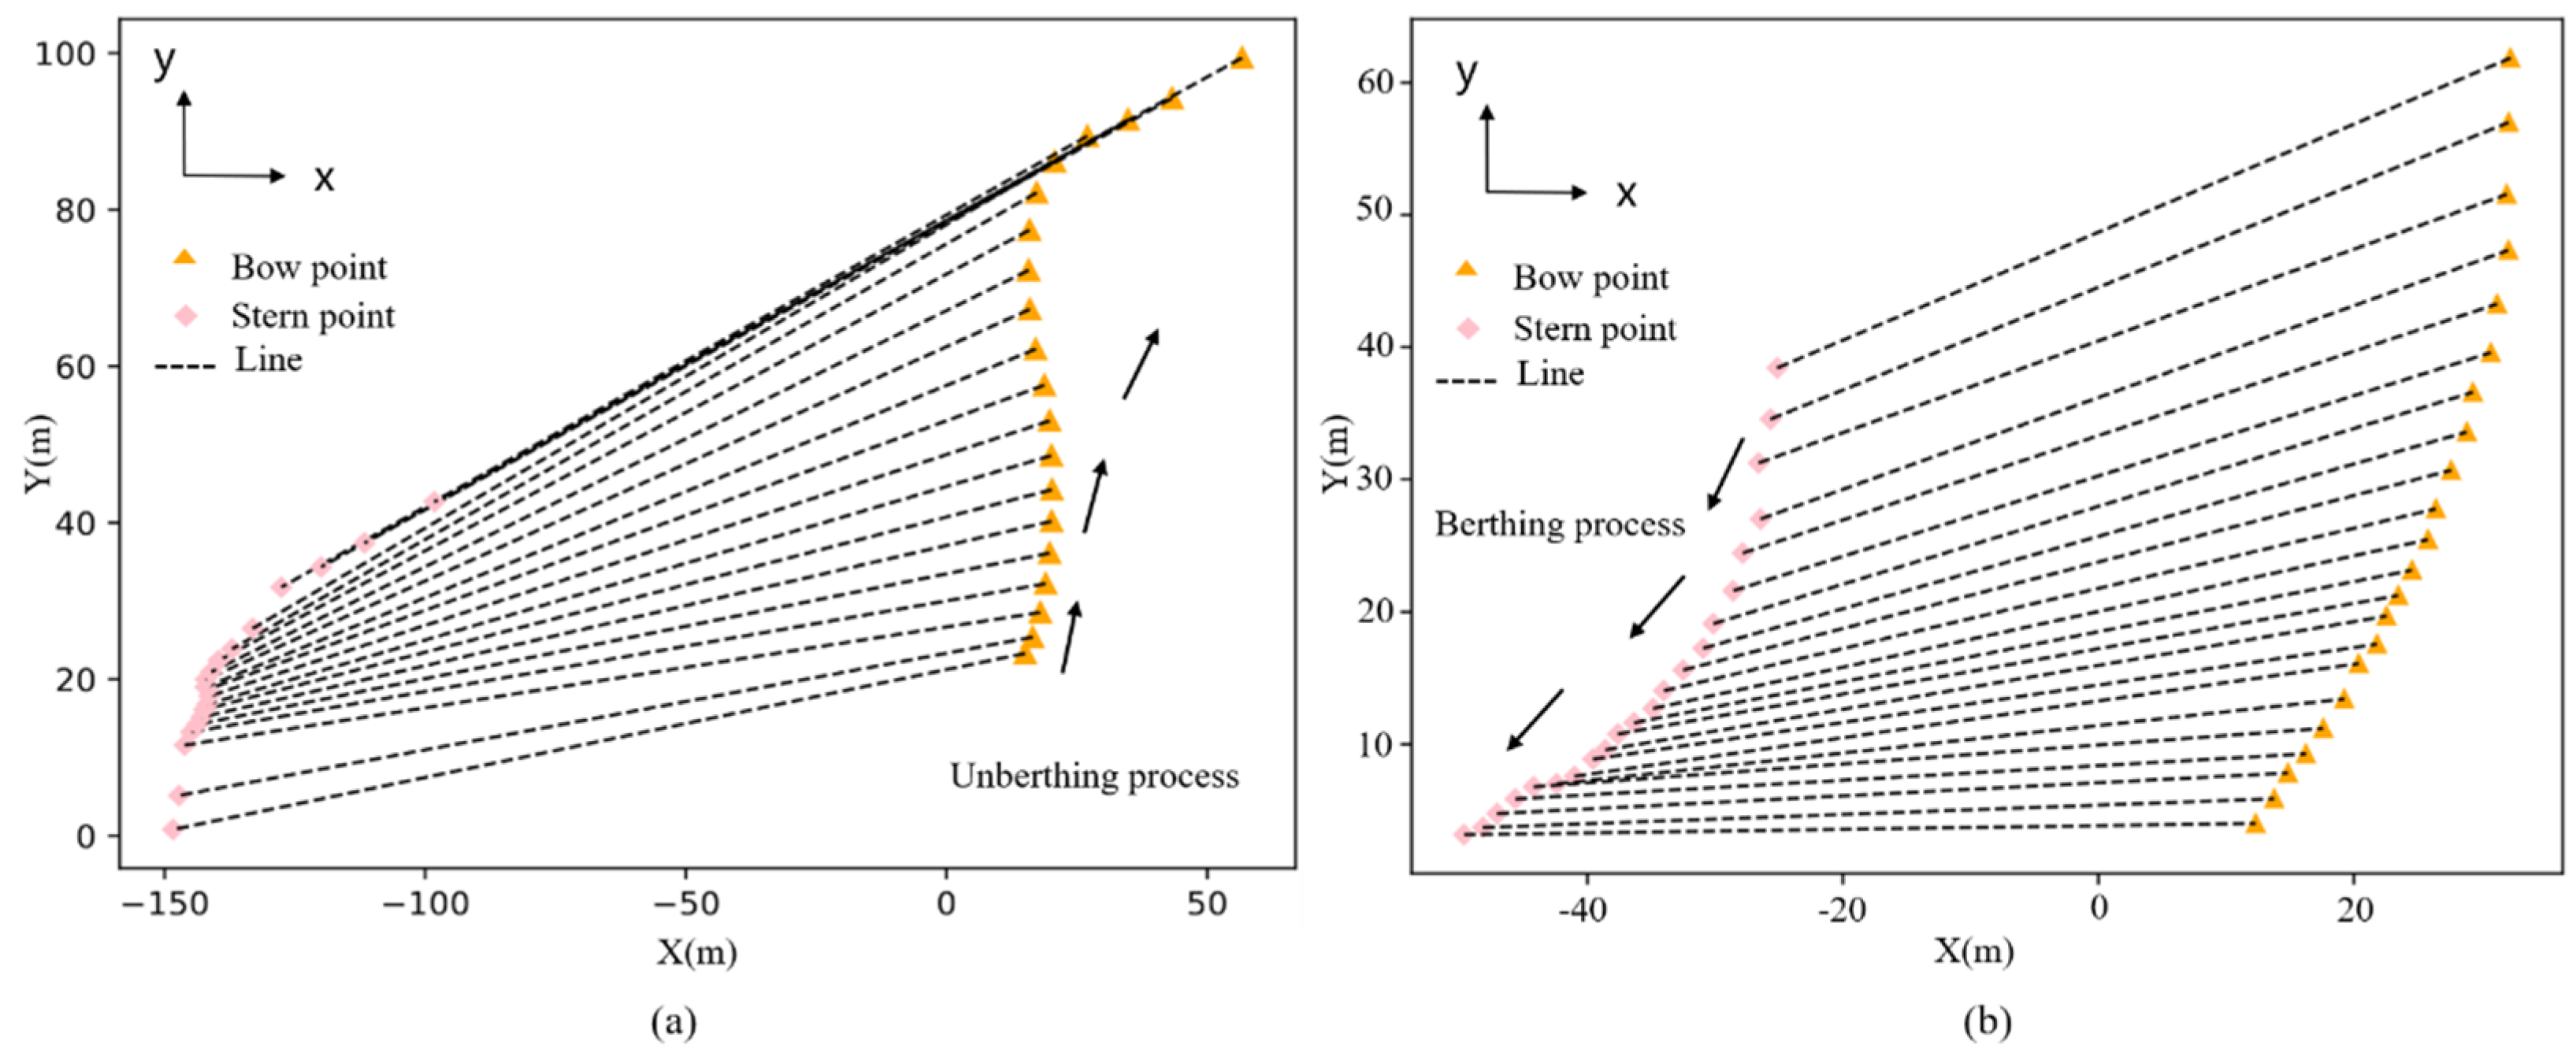
Figure 13a shows the prediction results of the key points (the pink diamond) in the missing part during the ship’s unberthing process. It is obvious that the ship’s stern moved slowly relative to the ship’s bow, indicating that the ship’s bow first left the shoreline in the unberthing process.
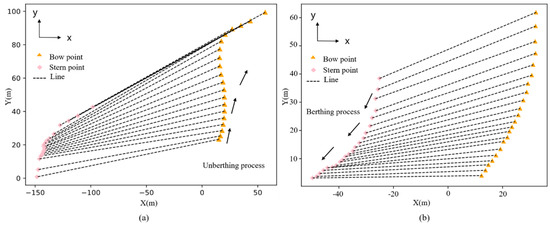
Figure 13.
Schematic diagram of the key points for the missing part: (a) the real experiment data during the unberthing process and (b) the simulated data during the berthing process.
For the simulated berthing data, the missing part of the point cloud data was the ship’s bow. The extraction of the key points was performed as follows. First, the ship’s rotation angle was determined by the point cloud data of the ship’s stern in terms of longitudinal segmentation. Then, the key points in the missing part could be predicted using the complete part’s key points obtained in Section 4.1. As shown in Figure 13b, it can be found that the ship’s stern was closer to the shoreline than the ship’s bow, indicating that the ship’s stern first approached the shoreline in the berthing process.
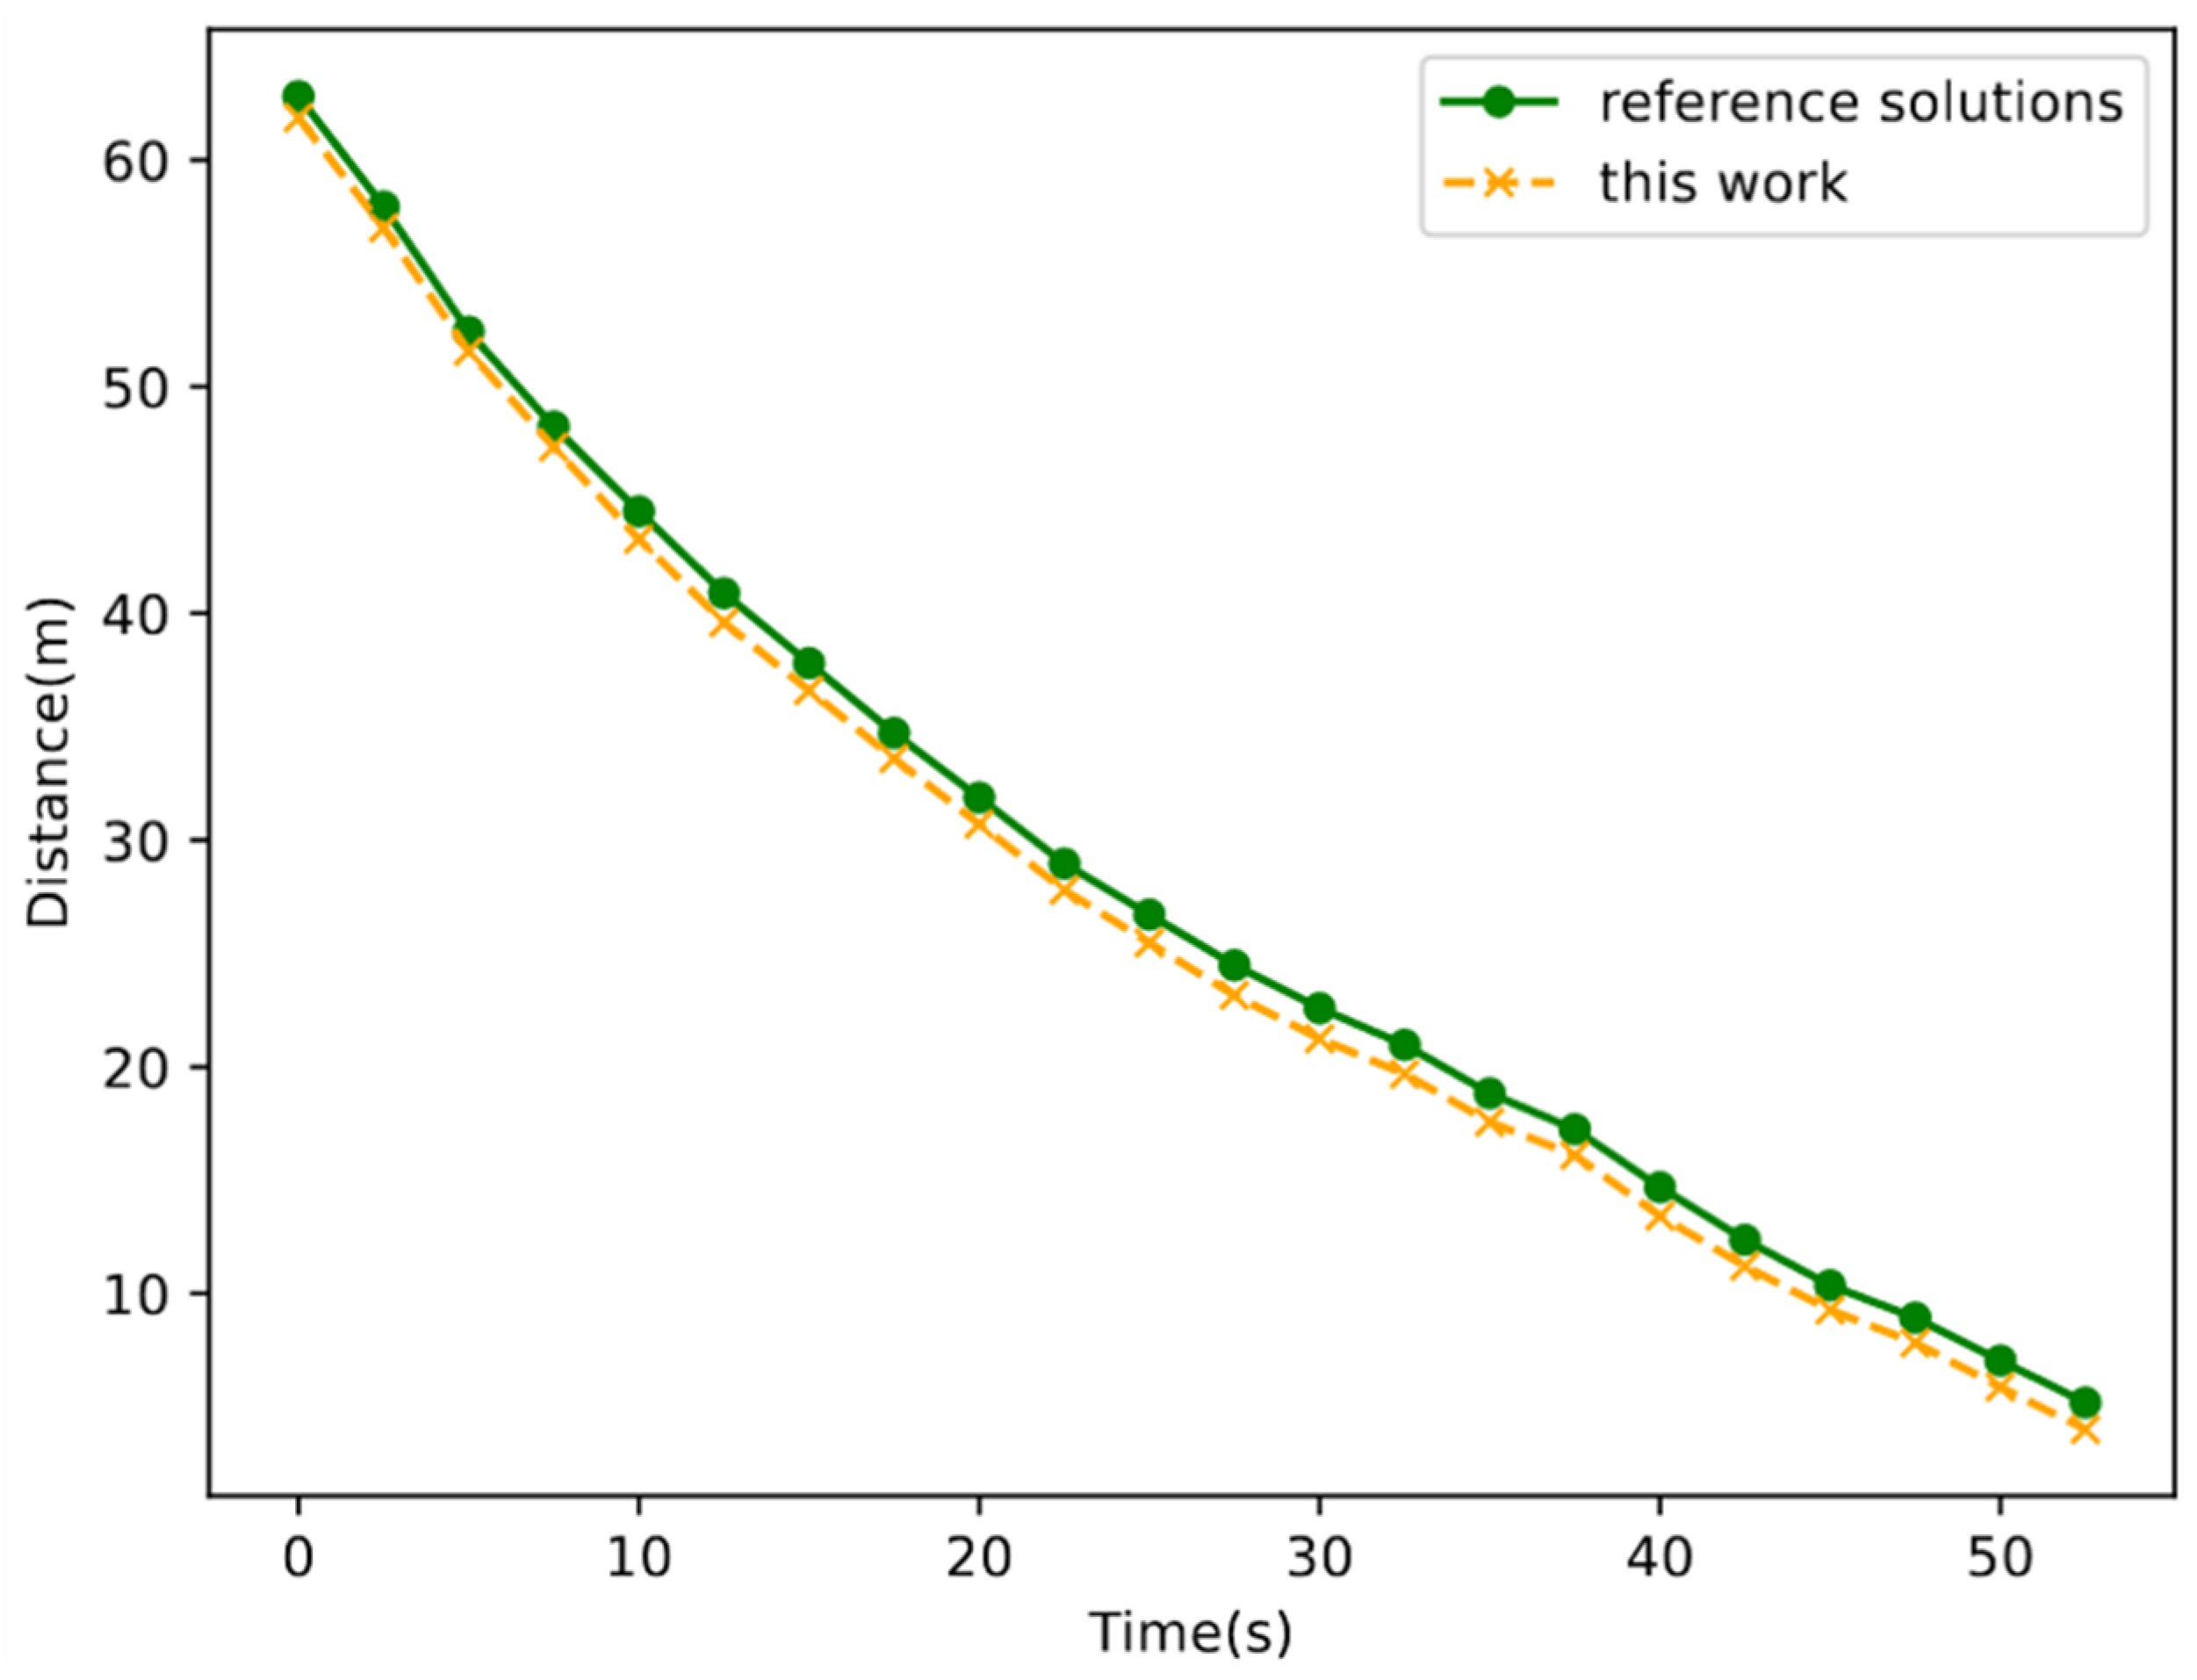
The feasibility of this method can be verified in the following way. Since the missing part in the simulation data was known, these data could be treated as reference solutions. The distance between the key points and the shoreline was calculated by the proposed method, and the results are presented in Figure 14. The RMSE value calculated for the stern data was 1.16. It is obvious that the distance obtained by the proposed method agreed well with the reference solutions, which verifies the effectiveness and accuracy of the method.
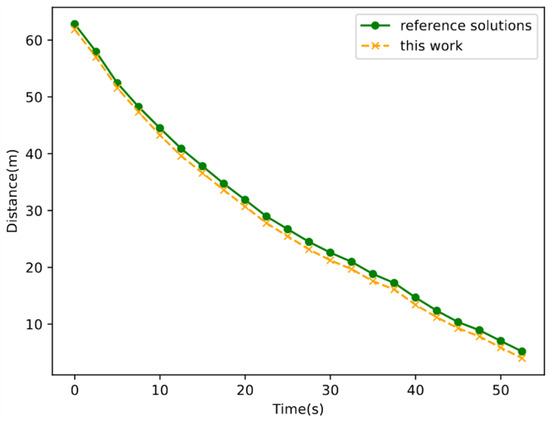
Figure 14.
Comparison between reference solutions and calculated values for the missing part in the simulated data.
Similarly, the obtained key points of the ship’s bow and stern provided a reliable data foundation for the subsequent motion state analysis of the ship.
4.3. Analysis of Dynamic Berthing and Unberthing Parameters Under Incomplete Data
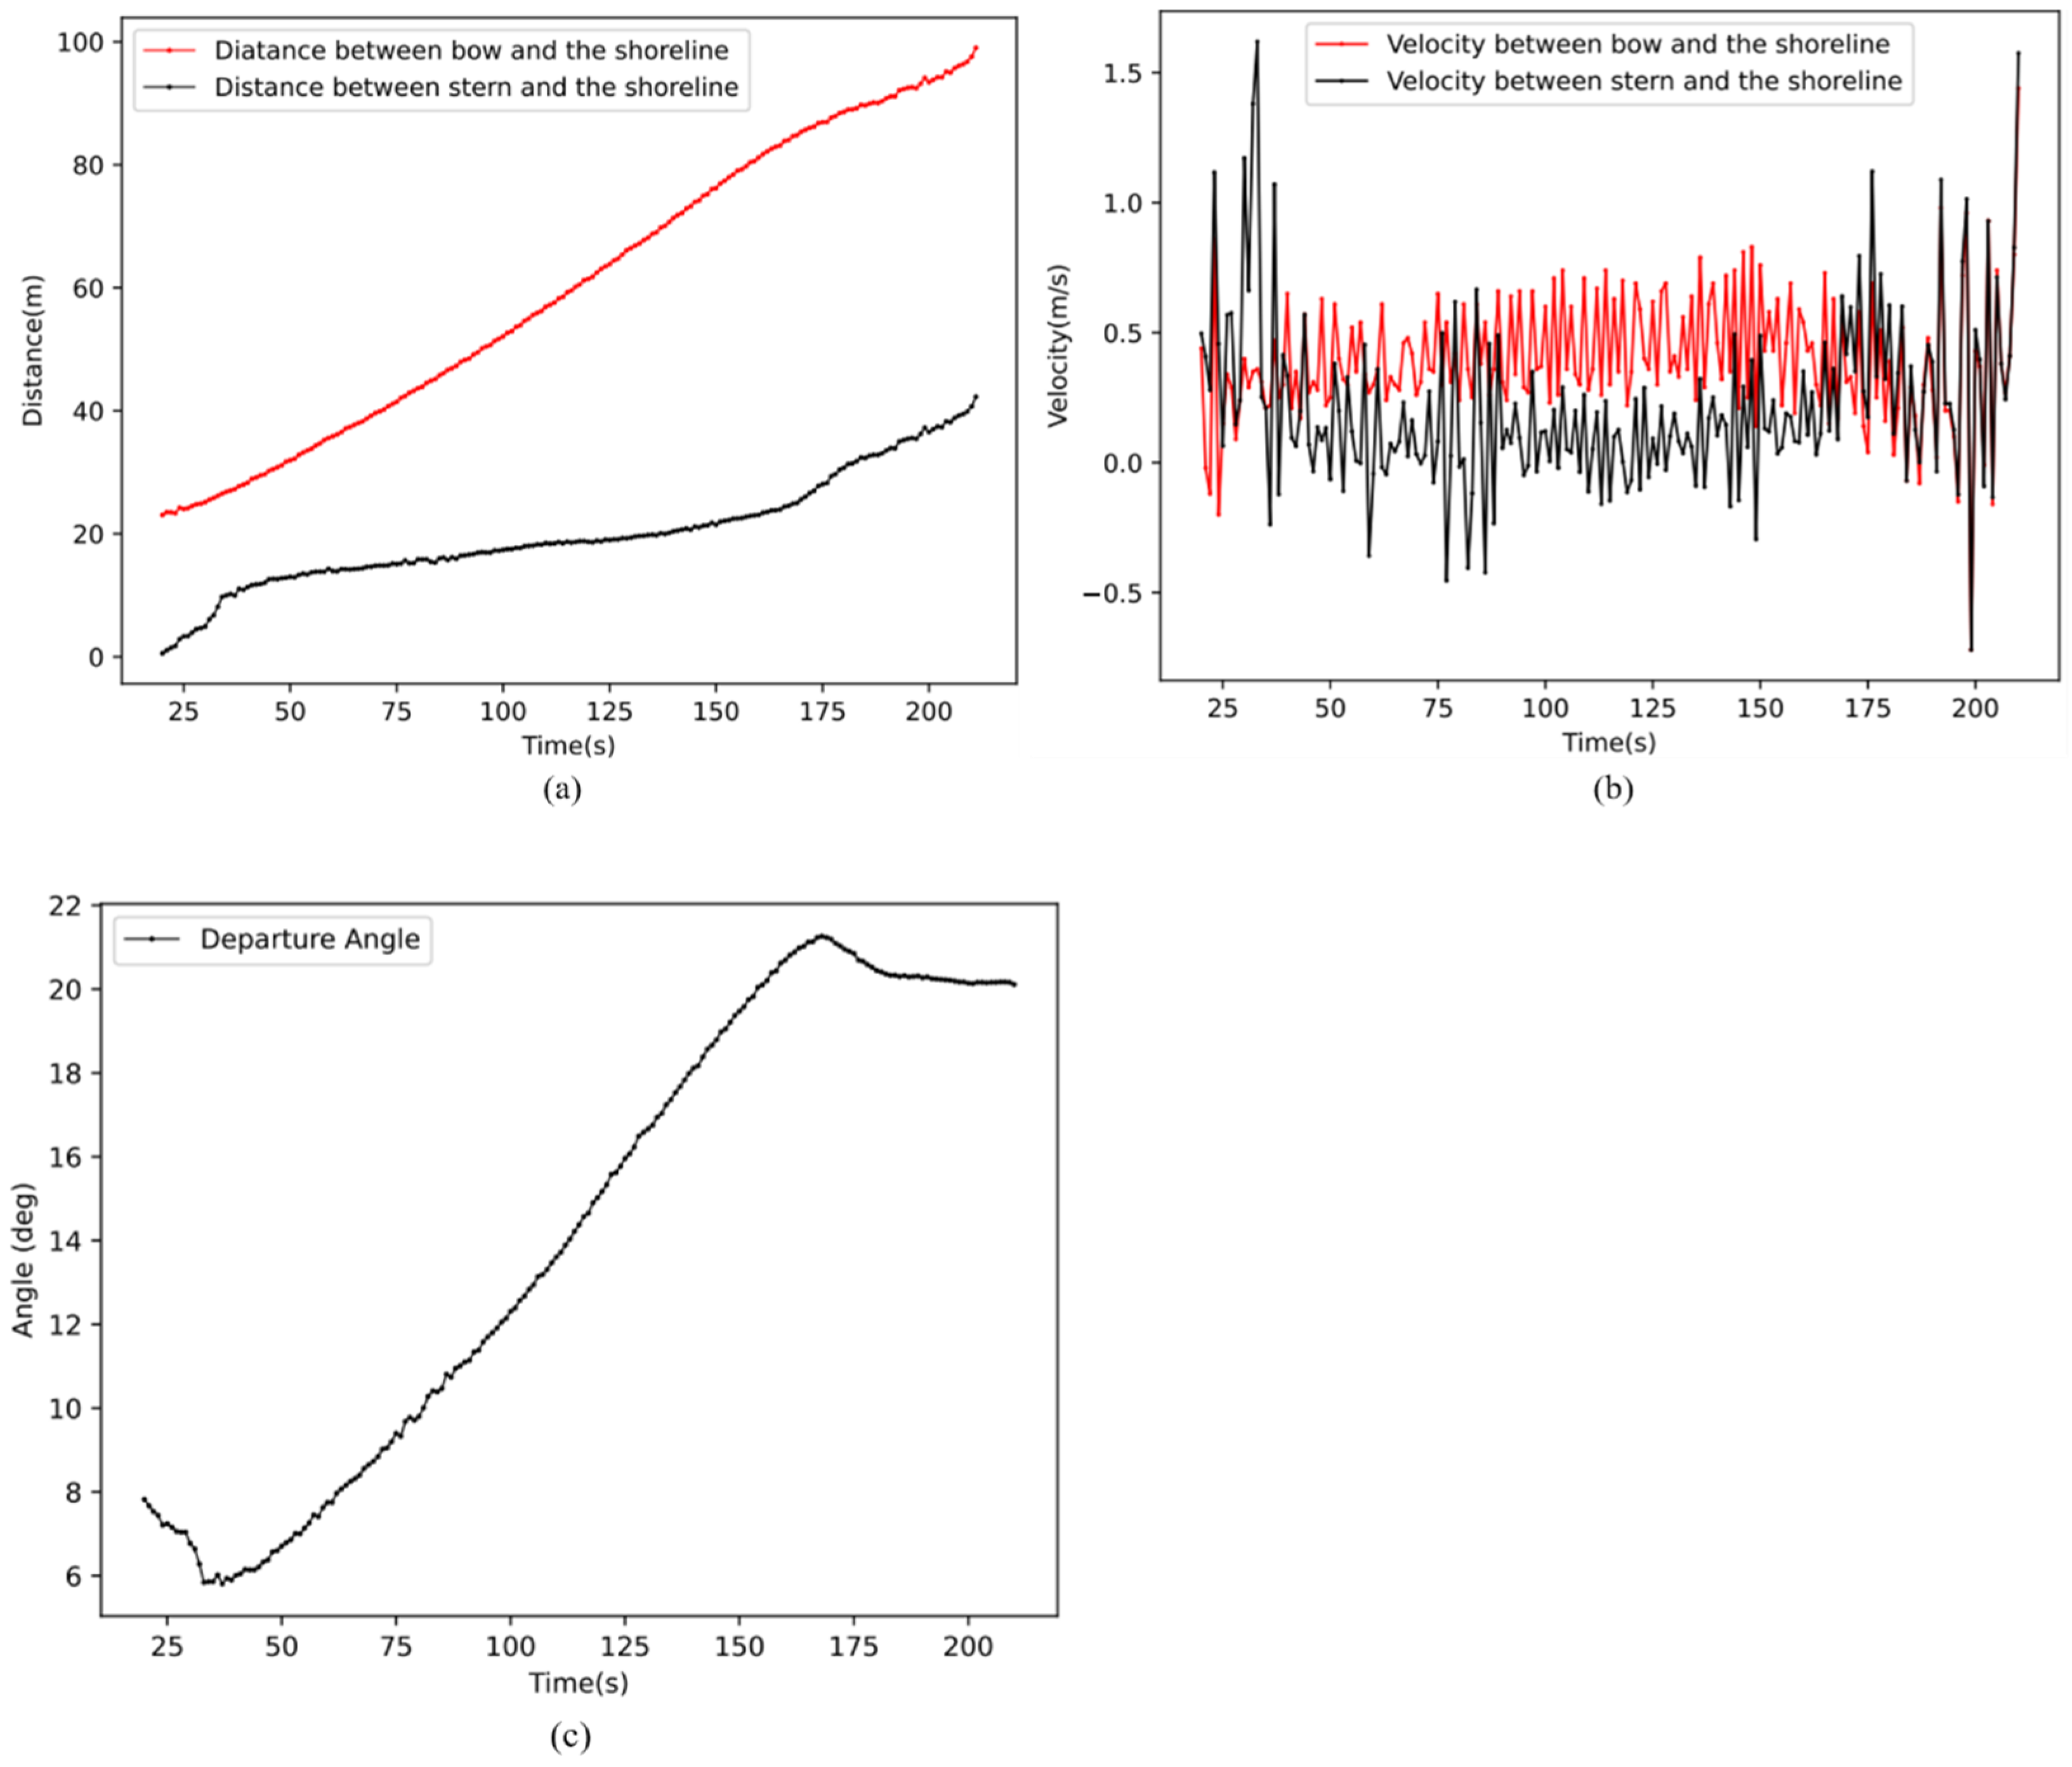
According to the key point obtained from incomplete data, the key parameters during the ship’s unberthing process could be computed using the method described in Section 3.4. Figure 15 shows the distance, velocity, and departure angle of the ship relative to the shoreline during the unberthing process.

Figure 15.
Parameters during the unberthing process: (a) distance, (b) velocity, and (c) departure angle of a ship relative to the shoreline.
Figure 15a presents the changes in the distance between the ship’s bow and stern and the shoreline during the unberthing process. It can be observed that the distance gradually increased. Figure 15b presents the changes in the ship’s velocity between the ship’s bow and stern and the shoreline during the unberthing process. It can be observed that the velocity exhibited some fluctuations in the initial stage and then exhibited relatively small fluctuations relative to the whole process. From 40 s to 165 s, the velocity of the ship’s bow was higher than that of the ship’s stern. After 165 s, the fluctuations were identical. Figure 15c presents the changes in the ship’s angle during the unberthing process. It can be observed that the angle gradually increased, and after 165 s, the angle remained almost unchanged.
By observing Figure 15b,c, it can be observed that when the angle tended to stabilize (after 165 s in Figure 15c), the red line and the black line almost overlapped (after 165 s in Figure 15b). This not only indicates that the corresponding velocity of the ship’s bow and stern were close but also suggests that at this stage, the bow and stern of the ship were in a relatively stable state of motion.
4.4. Analysis of a Ship’s Motion State During Berthing and Unberthing Under Incomplete Data
4.4.1. Spatial Visualization Analysis of a Ship’s Motion State
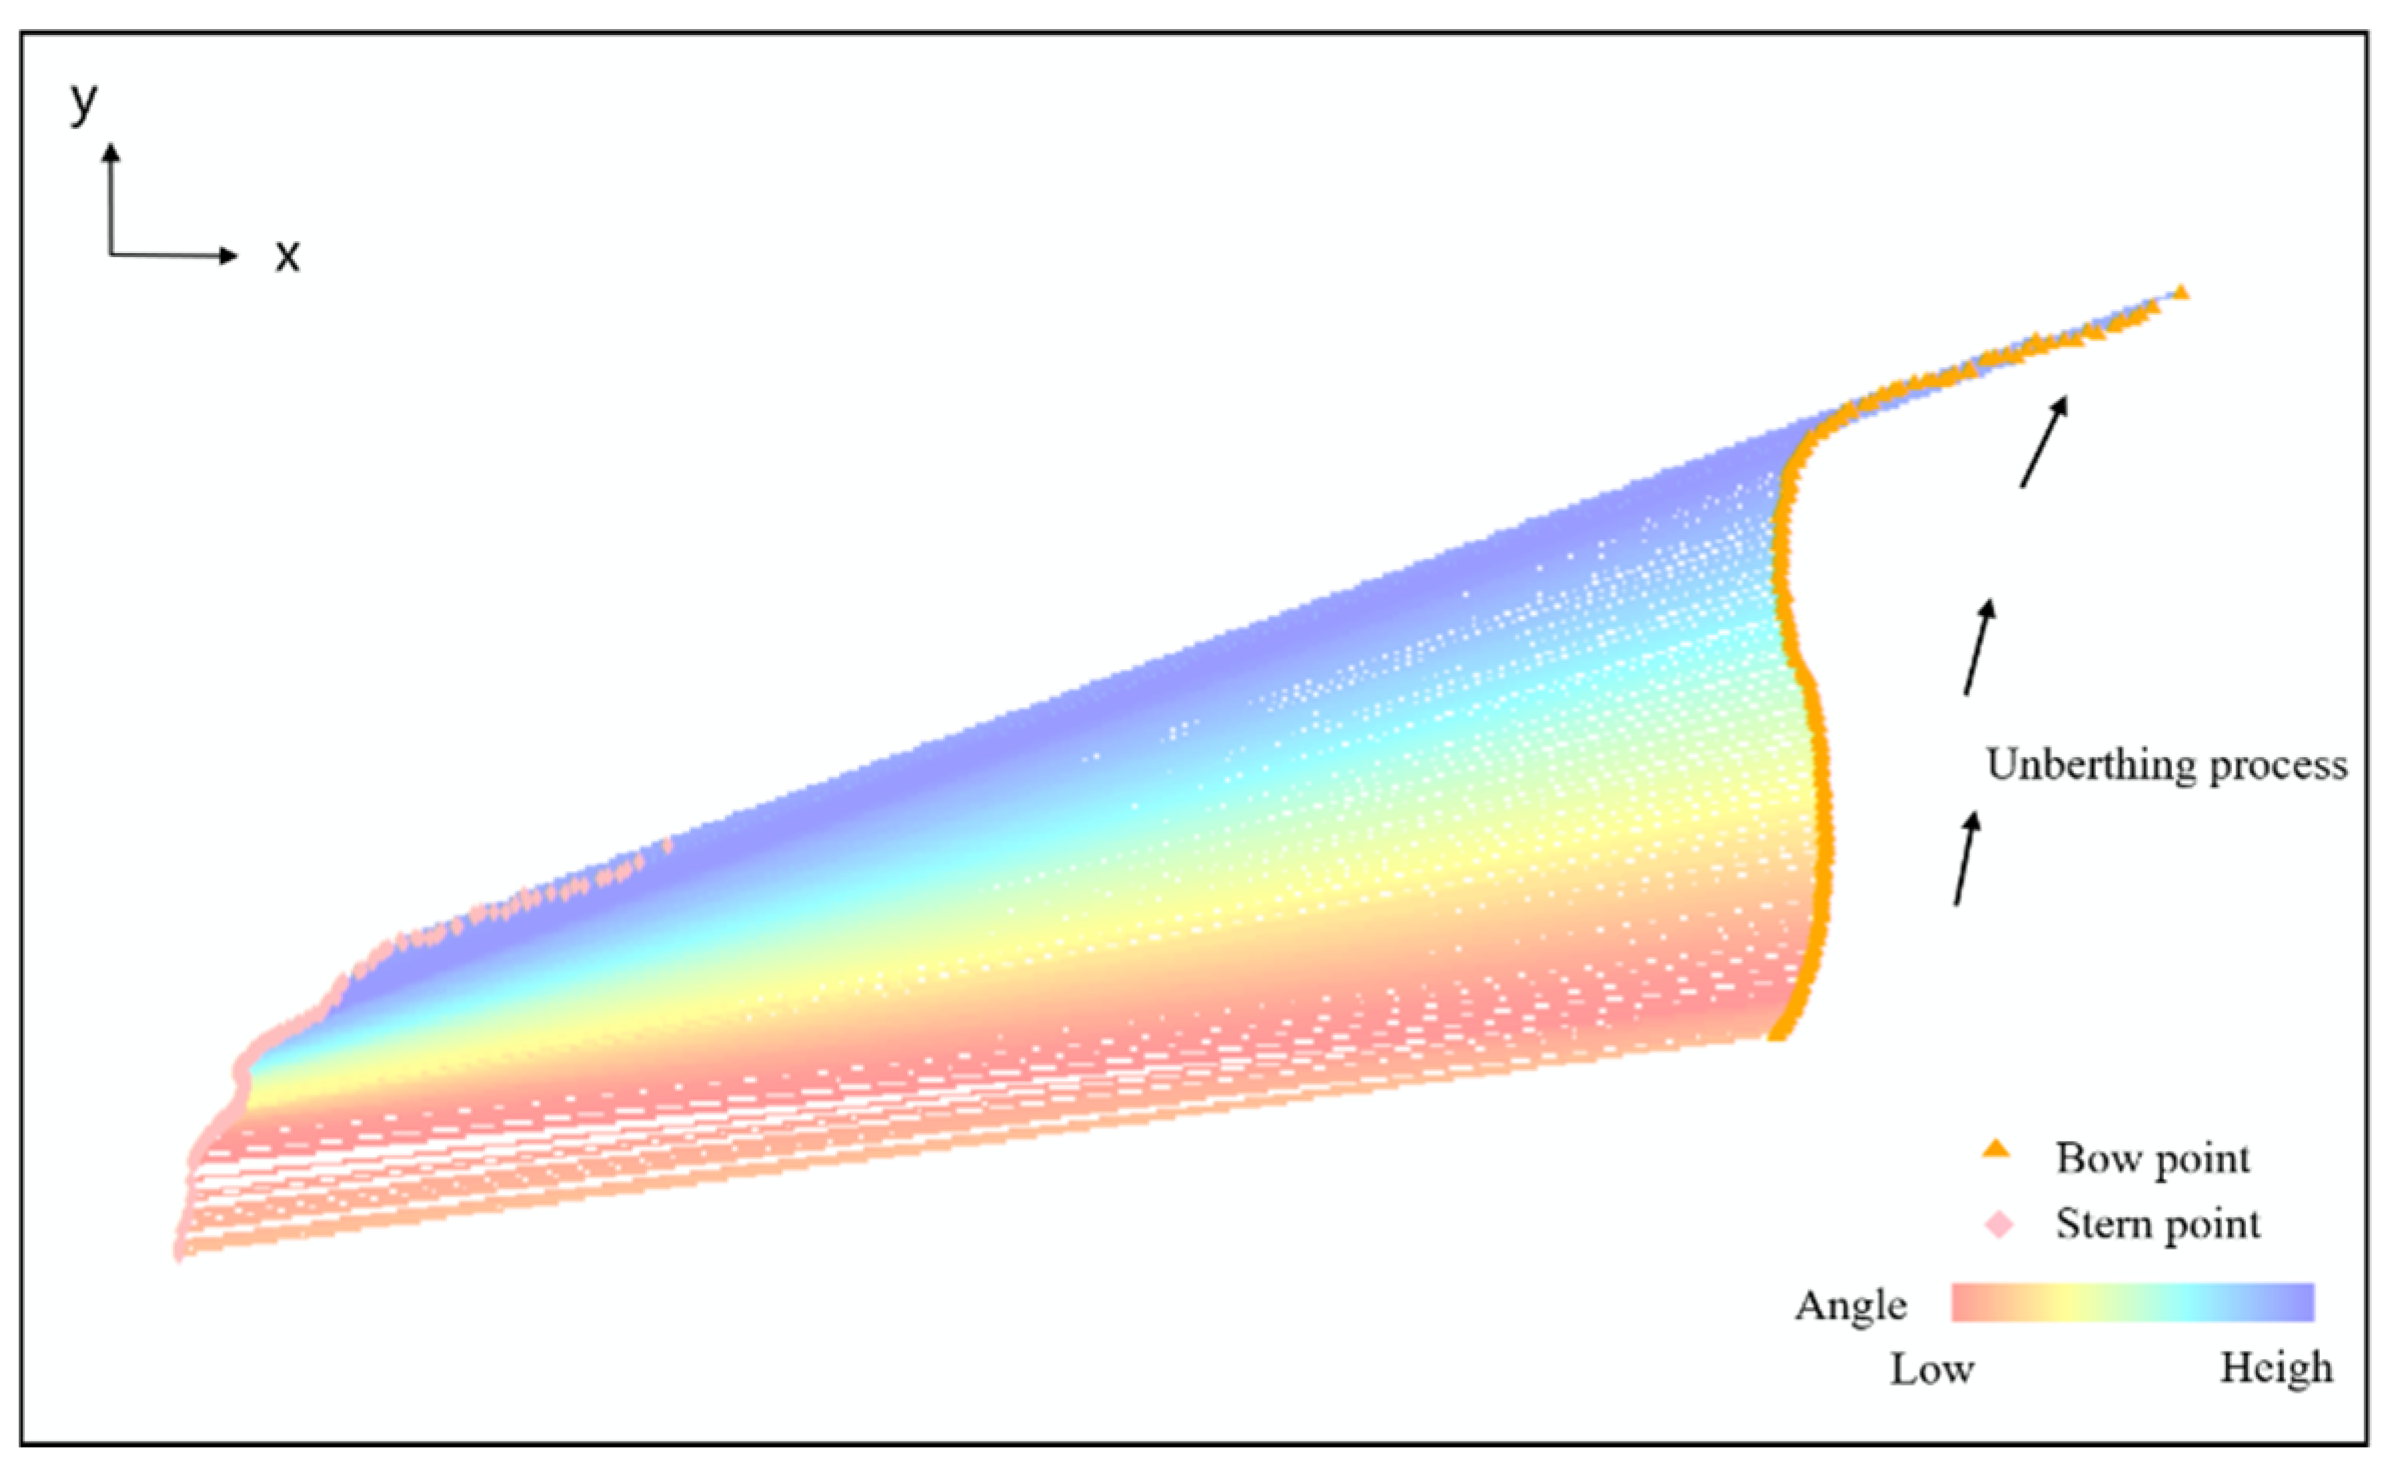
To spatially visualize an entire ship’s motion process and obtain the motion state during the berthing and unberthing processes, this paper employed real experimental data as an example to conduct spatial visualization analysis of the ship’s motion state.
In Figure 16, the orange triangles are the key points of the ship’s bow, the pink diamonds are the key points of the ship’s stern, and the colored area is the line element representing the ship’s characteristics. When examining the feature of the departure angle, it can be seen that during the entire unberthing process, the angle of the ship was quite small in the beginning stage and then gradually increased, reflecting that this process was at an unberthing state. In addition, the spatial visualization characteristics can also be seen in Figure 16. The ship, represented by the line element, can be more accurate and intuitive compared with the ship represented by a single point.
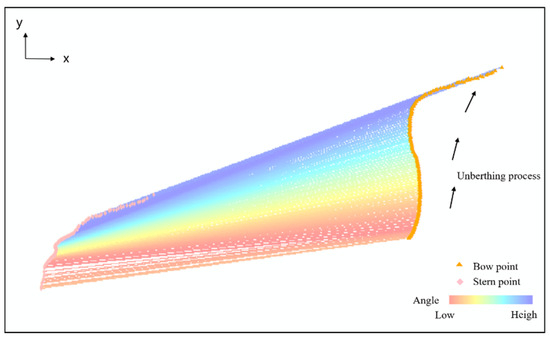
Figure 16.
Spatial visualization results for the line elements representing a ship.
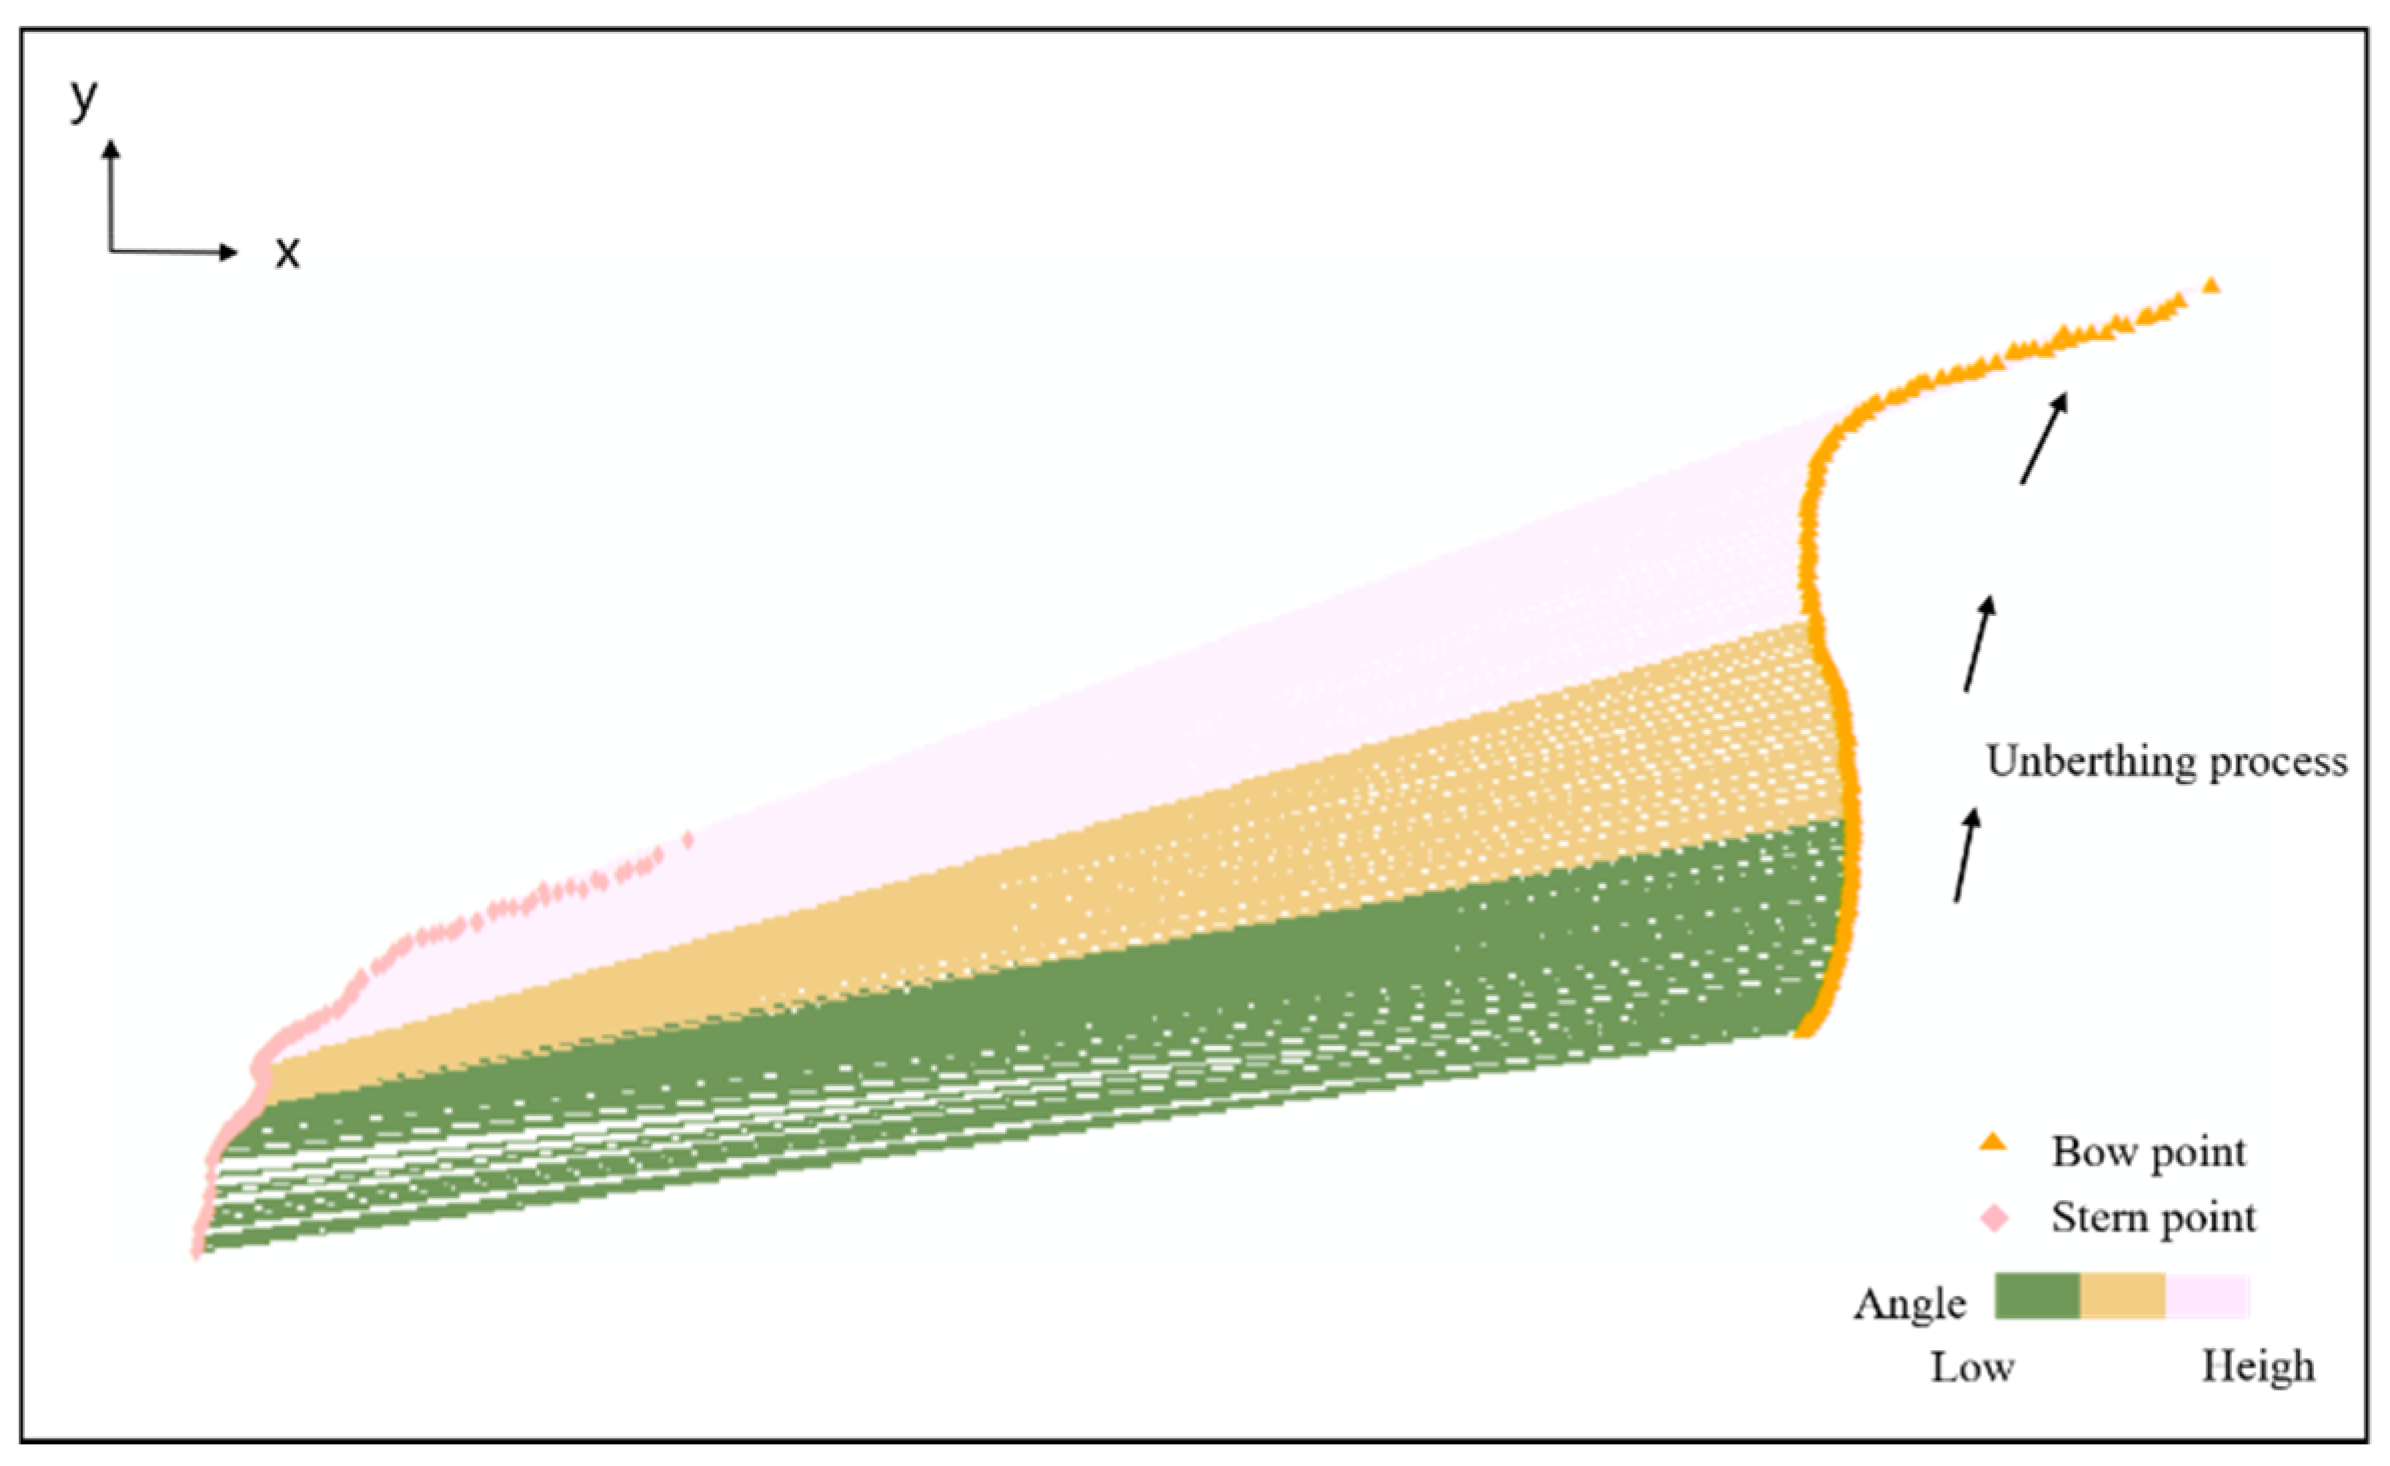
However, the complex color transitions in Figure 16 make it difficult to rapidly extract crucial information, and thus it was necessary to perform further processing. Therefore, Jenks natural breaks classification in the GIS reclassification technique was used to divide the spatial rasterized line elements into three stages. As shown in Figure 17, the first stage is the green region, where the angle most slowly changed. The second stage is the orange region. The third stage is depicted by the pink region, where the angle most quickly changed. The reclassification result is helpful for focusing on high-risk stages more directly. For example, during the unberthing process, the ship in the first stage (the green region) was closer to the shoreline at this time, indicating that it needed to be given more attention.
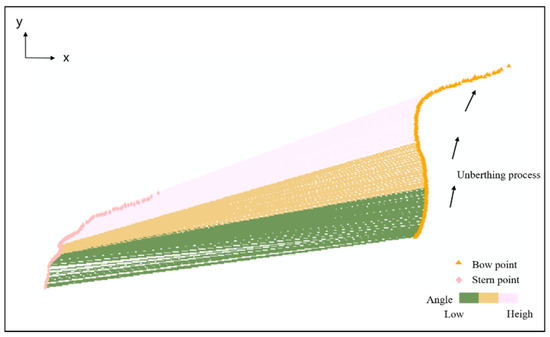
Figure 17.
Spatial visualization results for the line elements representing a ship after the reclassification process.
4.4.2. Analysis of the Spatial-Temporal Tracking Technique for Ship Berthing and Unberthing
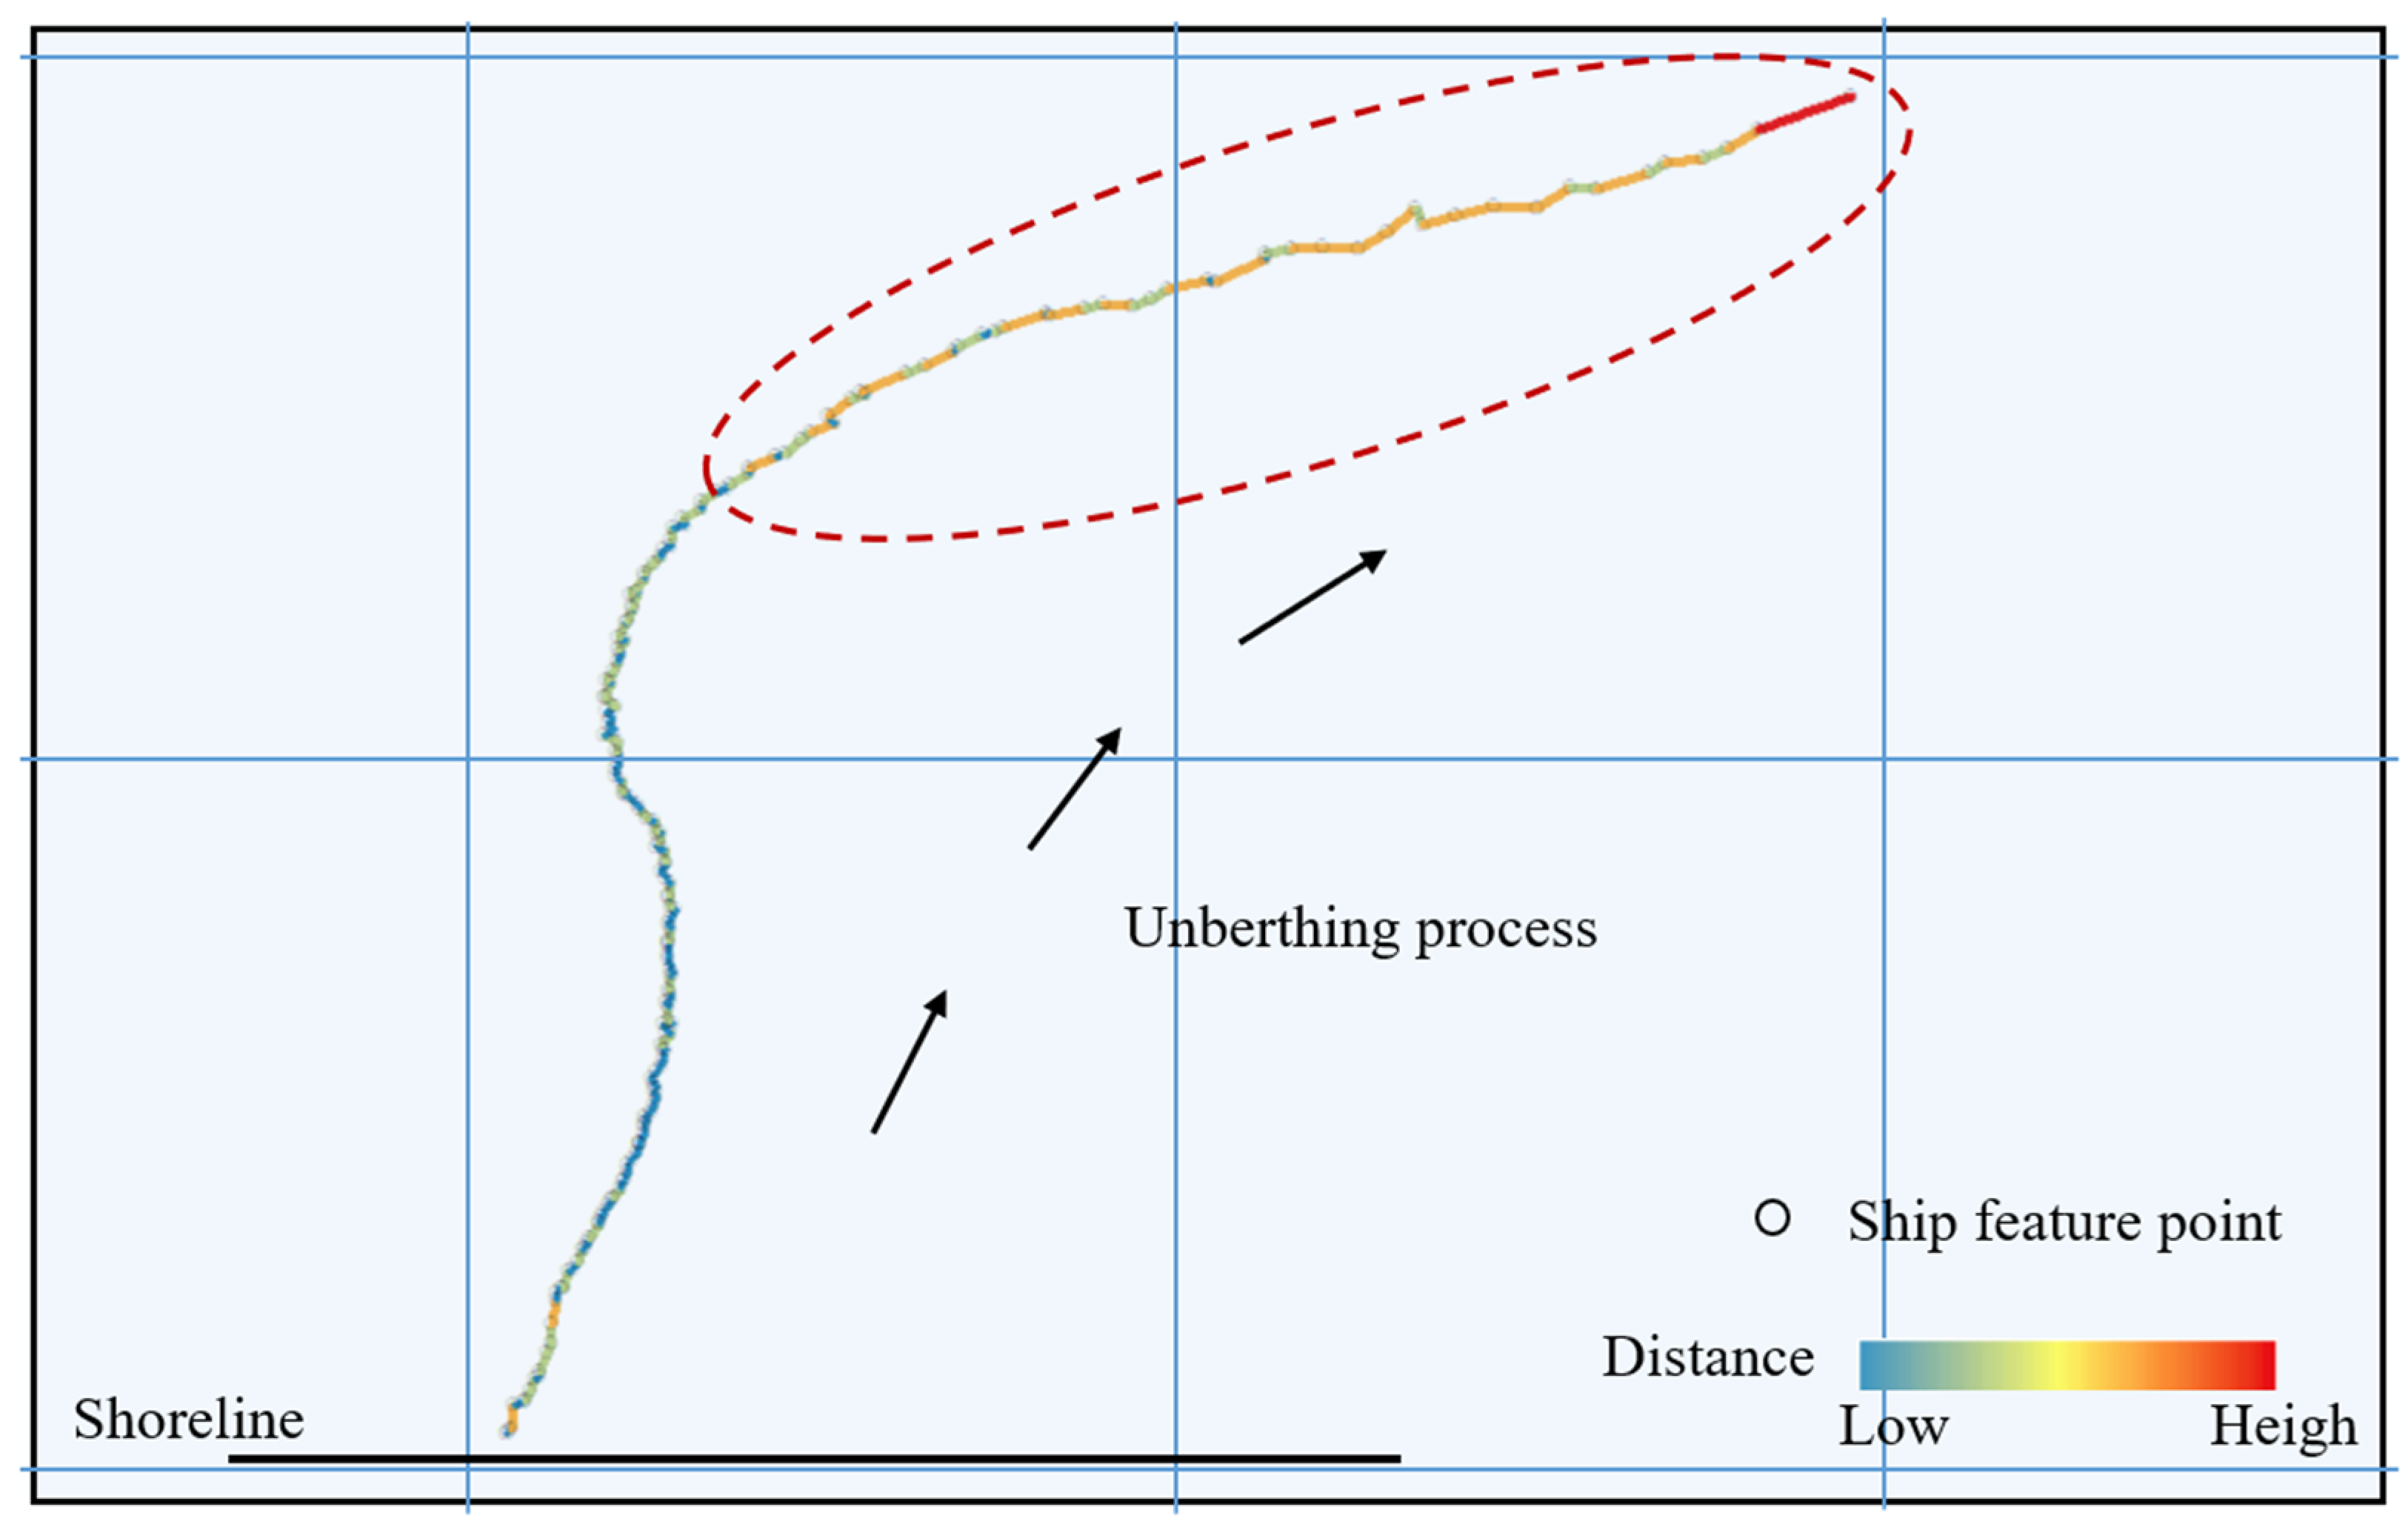
The point cloud data obtained from LiDAR scanning can be regarded as a series of spatial pixels evolving over time, and each frame of point cloud data possesses corresponding spatial-temporal feature attributes. Therefore, based on the acquired key points of a ship’s bow and stern, the ship’s tracking analysis was conducted using the spatial-temporal tracking technique described in Section 3.5.2. In this technique, the midpoint of a ship’s bow and stern key points, which is also the midpoint of the line element, is utilized to represent the entire ship feature and is assigned the corresponding attribute values. Then, this midpoint is called the ship’s feature point.
Based on the spatial-temporal relationship characteristics, a tracking layer of a ship’s feature points is established, which can provide a more intuitive and clear visualization of a ship’s motion state changes and analyze a ship’s feature points. As shown in Figure 18, the spacing values between its trajectory points were small at the initial time, indicating the ship moving at a low velocity. While the ship moved to the red dashed line area (around 150 s), the spacing values between its trajectory points were large, indicating the ship’s moving with a high velocity.
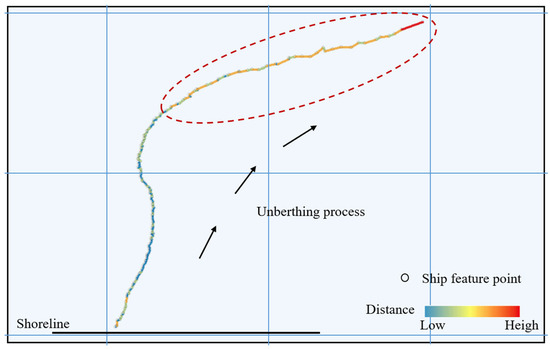
Figure 18.
The spatial-temporal tracking results for the unberthing process.
Note that the spatial-temporal tracking results during the ship’s unberthing process matched well with the key parameters, which reflects the fact that by combining the spatial-temporal tracking results, the unberthing state of ships can be spatially visualized more intuitively and clearly. During the berthing and unberthing processes, the technique helps discover and analyze a ship’s trends and patterns related to time and also reflects the collision risk between ship and shoreline, greatly avoiding the occurrence of accidents.
5. Conclusions
In this paper, by introducing the GIS spatial theory analysis technique, a spatial visualization method was proposed to analyze the spatial motion states of ships during the berthing and unberthing processes with incomplete data. This paper contains three main features. Firstly, the key points of a complete ship part were extracted with the LGFCT. The ellipsoidal or rectangular bounding boxes fitted by the LGFCT characterize the motion state of a ship’s complete part, aiming to achieve an accurate extraction of the motion state of the point cloud data for that part. Secondly, the key point prediction technique based on line features was proposed. This technique can predict the key points of a missing part, and then the key parameters can be calculated by key points belonging to the complete part and missing part. Thirdly, spatial visualization analysis was conducted to analyze the obtained line element features, which can directly reflect a ship’s motion state in space. At the same time, the spatial-temporal tracking technique was applied to achieve a ship’s trends and patterns related to time during the berthing and unberthing processes. The accuracy and feasibility of the proposed method were verified through an experiment conducted on the ship named ShengSheng 2 at Dalian Port, China.
By adopting the advantages of GIS spatial theoretical techniques, the proposed method analyzes the acquired incomplete data and obtains a ship’s motion state during the unberthing process. However, by combining the theoretical principles of GIS and spatial geometry relationships, this paper merely provides a simple analysis of a ship’s motion state in the berthing and unberthing processes with incomplete data. In future work, a more in-depth investigation can be conducted by introducing GIS spatial analysis techniques to analyze a ship’s motion state based on multiple LiDAR set-ups during the berthing and unberthing processes. The goal is to achieve more precise state analysis, enhancing the safety, efficiency, and intelligence of the berthing and unberthing processes.
Author Contributions
Conceptualization, funding acquisition, project administration, and supervision, Y.L.; conceptualization, data curation, formal analysis, writing—original draft, and writing—review and editing, T.-Q.W. All authors have read and agreed to the published version of the manuscript.
Funding
This work was supported by the National Key R&D Program of China (2023YFB4302300), National Natural Science Foundation of China (52471375), Fundamental Research Funds for the Central Universities (3132023507), and Dalian High-Level Talent Innovation Program (2022RG02).
Institutional Review Board Statement
Not applicable.
Informed Consent Statement
Not applicable.
Data Availability Statement
The LiDAR data used to support the findings of this study cannot be shared at this time as the data also form part of an ongoing study.
Conflicts of Interest
The authors declare no conflicts of interest.
References
- Frittelli, J. Ship navigation in harbors: Safety issues. In CRS Report for Congress; Congressional Research Service: Washington, DC, USA, 2008. [Google Scholar]
- Trzuskowsky, A.; Hoelper, C.; Abel, D. ANCHOR: Navigation, routing and collision warning during operations in harbors. IFAC-PapersOnLine 2016, 49, 220–225. [Google Scholar] [CrossRef]
- Liao, Y.; Jia, Z.; Zhang, W.; Jia, Q.; Li, Y. Layered berthing method and experiment of unmanned surface vehicle based on multiple constraints analysis. Appl. Ocean Res. 2019, 86, 47–60. [Google Scholar] [CrossRef]
- Guo, Z.; Qiang, H.; Xie, S.; Peng, X. Unsupervised knowledge discovery framework: From AIS data processing to maritime traffic networks generating. Appl. Ocean Res. 2024, 146, 103924. [Google Scholar] [CrossRef]
- Perkovic, M.; Gucma, M.; Luin, B.; Gucma, L.; Brcko, T. Accommodating larger container vessels using an integrated laser system for approach and berthing. Microprocess. Microsyst. 2017, 546, 106–116. [Google Scholar] [CrossRef]
- Chen, C.; Li, Y. Ship berthing information extraction system using three-dimensional light detection and ranging data. J. Mar. Sci. Eng. 2021, 9, 747. [Google Scholar] [CrossRef]
- Mentjes, J.; Wiards, H.; Feuerstack, S. Berthing assistant system using reference points. J. Mar. Sci. Eng. 2022, 10, 385. [Google Scholar] [CrossRef]
- Mizuchi, Y.; Ogura, T.; Kim, Y.; Hagiwara, Y.; Choi, Y. Vision-based markerless measurement system for relative vessel positioning. IET Sci. Meas. Technol. 2016, 10, 653–658. [Google Scholar] [CrossRef]
- Zhang, X.; Wang, C.; Jiang, L.; An, L.; Yang, R. Collision-avoidance navigation systems for maritime autonomous surface ships: A state of the art survey. Ocean Eng. 2021, 235, 109380. [Google Scholar] [CrossRef]
- Elkins, L.; Sellers, D.; Monach, W.R. The Autonomous Maritime Navigation (AMN) project: Field tests, autonomous and cooperative behaviors, data fusion, sensors, and vehicles. J. Field Robot. 2010, 27, 790–818. [Google Scholar] [CrossRef]
- Harati-Mokhtari, A.; Wall, A.; Brooks, P.; Wang, J. Automatic identification system (AIS): Data reliability and human error implications. J. Navig. 2007, 60, 373–389. [Google Scholar] [CrossRef]
- Chen, C.; Li, Y.; Wang, T. Real-time tracking and berthing aid system with occlusion handling based on LiDAR. Ocean Eng. 2023, 288, 115929. [Google Scholar] [CrossRef]
- Yao, Z.; Chen, X.; Xu, N.; Gao, N.; Ge, M. LiDAR-based simultaneous multi-object tracking and static mapping in nearshore scenario. Ocean Eng. 2023, 272, 113939. [Google Scholar] [CrossRef]
- Chen, X.; Xu, X.; Yang, Y.; Huang, Y.; Chen, J.; Yan, Y. Visual ship tracking via a hybrid kernelized correlation filter and anomaly cleansing framework. Appl. Ocean Res. 2021, 106, 102455. [Google Scholar] [CrossRef]
- Xu, G.; Zhang, Y.; Wan, J.; Xu, K.; Chen, P.; Ma, Y. Application of High-Resolution Three-Dimensional Imaging Lidar. Acta Optica Sinica 2021, 41, 1628002. [Google Scholar]
- Liu, D.; Zhang, J.; Jin, J.; Dai, Y.; Li, L. A new approach of obstacle fusion detection for unmanned surface vehicle using dempster-shafer evidence theory. Appl. Ocean Res. 2022, 119, 103016. [Google Scholar] [CrossRef]
- Jindal, M.; Jha, A.; Cenkeramaddi, L.R. Bollard segmentation and position estimation from lidar point cloud for autonomous mooring. IEEE Trans. Geosci. Remote Sens. 2021, 60, 5700909 . [Google Scholar] [CrossRef]
- Yan, X.; Liu, Z.; Li, Y.; Liu, Y.; Zhou, Y. Ship berthing dynamic monitoring technology based on laser 3D vision. Laser Infrared 2016, 46, 1452–1458. [Google Scholar]
- Hu, B.; Liu, X.W.; Jing, Q.F.; Lyu, H.G.; Yin, Y. Estimation of berthing state of maritime autonomous surface ships based on 3D LiDAR. Ocean Eng. 2022, 251, 111131. [Google Scholar] [CrossRef]
- Chen, C.; Li, Y. Real-time tracking and dynamic berthing information extraction system with 2D LiDAR data. Ocean Eng. 2023, 276, 114181. [Google Scholar] [CrossRef]
- Lin, J.; Koch, L.; Kurowski, M.; Gehrt, J.J.; Abel, D.; Zweigel, R. Environment perception and object tracking for autonomous vehicles in a harbor scenario. In Proceedings of the 2020 IEEE 23rd International Conference on Intelligent Transportation Systems (ITSC), Rhodes, Greece, 20–23 September 2020; pp. 1–6. [Google Scholar]
- Wang, H.; Yin, Y.; Jing, Q.; Cao, Z.; Shao, Z.; Guo, D. Berthing assistance system for autonomous surface vehicles based on 3D LiDAR. Ocean Eng. 2024, 291, 116444. [Google Scholar] [CrossRef]
- Yuhei Higo, Masaki Sakano, Hiroki Nobe, Hirotada Hashimoto Development of trajectory-tracking maneuvering system for automatic berthing/unberthing based on double deep Q-network and experimental validation with an actual large ferry. Ocean Eng. 2023, 287, 115750. [CrossRef]
- Alenzi, Z.; Alenzi, E.; Alqasir, M.; Alruwaili, M.; Alhmiedat, T.; Alia, O.M.D. A Semantic Classification Approach for Indoor Robot Navigation. Electronics 2022, 11, 2063. [Google Scholar] [CrossRef]
- Alqobali, R.; Alnasser, R.; Rashidi, A.; Alshmrani, M.; Alhmiedat, T. A Real-Time Semantic Map Production System for Indoor Robot Navigation. Sensors 2024, 24, 6691. [Google Scholar] [CrossRef] [PubMed]
- Xu, D.; Wang, H.; Xu, W.; Luan, Z.; Xu, X. LiDAR Applications to Estimate Forest Biomass at Individual Tree Scale: Opportunities, Challenges and Future Perspectives. Forests 2021, 12, 550. [Google Scholar] [CrossRef]
- Wang, T.; Li, Y.; Chen, C. Spatial state analysis of ship during berthing and unberthing process based on 3D LiDAR. Ocean Eng. 2023, 288, 116067. [Google Scholar] [CrossRef]
- Zhao, Q.; Gao, X.; Li, J.; Luo, L. Optimization Algorithm for Point Cloud Quality Enhancement Based on Statistical Filtering. J. Sens. 2021, 2021, 1–10. [Google Scholar] [CrossRef]
- Pugliese, R.; Konrad, T.; Zweigel, R.; Abel, D. Object detection and potential field based trajectory planning on LiDAR 3D-point clouds for autonomous vehicles in uncertain environments. In Proceedings of the Accepted in ION GNSS+ 2019, Institute of Navigation, Miami, FL, USA, 16–20 September 2019; pp. 2622–2636. [Google Scholar]
- Liu, Z.; Li, Q.; Mei, S.; Huang, M. Background Filtering and Object Detection with Roadside LiDAR Data. In Proceedings of the 2021 4th International Conference on Electron Device and Mechanical Engineering (ICEDME), Guangzhou, China, 19–21 March 2021; pp. 296–299. [Google Scholar]
- Shi, X.; Zhang, X.; Lv, J.; Zhu, Y. Lidar-based Adaptive Pedestrian Pose Segmentation Method. In Proceedings of the 2022 IEEE International Conference on Real-time Computing and Robotics (RCAR), Guiyang, China, 17–22 July 2022; pp. 444–449. [Google Scholar]
- Lin, J.; Campa, G.; Framing, C.E.; Gehrt, J.J.; Zweigel, R.; Abel, D. Adaptive shape fitting for LiDAR object detection and tracking in maritime applications. Int. J. Transp. Dev. Integr. 2021, 5, 105–117. [Google Scholar] [CrossRef]
- Gao, S.; Liu, Y.; Zhou, Y.; Min, Z. Spatial Distribution of Construction Waste Recycling Facilities. Sens. Mater. 2020, 32, 3975–3990. [Google Scholar] [CrossRef]
- Wang, N.; Fu, X.; Wang, S. Spatial-temporal variation and coupling analysis of residential energy consumption and economic growth in China. Appl. Energy 2022, 2022, 309. [Google Scholar] [CrossRef]
- Yuan, C.; Yu, X.; Luo, Z. 3D point cloud matching based on principal component analysis and iterative closest point algorithm, 2016. In Proceedings of the 2016 International Conference on Audio, Language and Image Processing (ICALIP), Shanghai, China, 11–12 July 2016; pp. 404–408. [Google Scholar]


Disclaimer/Publisher’s Note: The statements, opinions and data contained in all publications are solely those of the individual author(s) and contributor(s) and not of MDPI and/or the editor(s). MDPI and/or the editor(s) disclaim responsibility for any injury to people or property resulting from any ideas, methods, instructions or products referred to in the content. |
© 2025 by the authors. Licensee MDPI, Basel, Switzerland. This article is an open access article distributed under the terms and conditions of the Creative Commons Attribution (CC BY) license (https://creativecommons.org/licenses/by/4.0/).