Abstract
Sea transportation plays a vital role in global trade, and studying the impact of emergencies on global sea transportation is essential to ensure the stability of trade. At present, the conflict between Palestine and Israel has attracted extensive attention worldwide. However, there is a lack of specific research on the impact of conflict on shipping, particularly on global shipping costs. By using the global vessel trajectory data of tankers from the Automatic Identification System (AIS) and taking the global sea transportation of large tankers as an example, this paper quantifies and visualizes the changes in global sea transportation before and after conflicts from a data-driven perspective. Firstly, the complete vessel trajectory, as well as the port of departure and the port of destination are extracted. Then, from the perspective of shipping cost and vessel traffic flow, we evaluate the vessel traffic flow changes caused by the conflict by using the route distance to replace the shipping costs and quantify the cost increase for the relevant countries caused by the vessel detour based on the shipping cost increment index. The research results show that after the outbreak of the conflict, the number of vessels passing through the Red Sea area has decreased significantly. About 3.1% of global vessels were affected, with global sea transportation costs of large tankers increasing by about 0.0825%. This study takes the Israeli–Palestinian conflict as an example and analyzes the impact of emergencies on the global sea transportation situation of tankers based on AIS data. The research results reveal the characteristics of international shipping to a certain extent and provide guidance for global sea transportation route planning.
1. Introduction
Sea transportation is susceptible to interference from various factors, such as the meteorological environment, economic development [1], laws and policies [2,3], environmental protection requirements, wars and conflicts, emergencies, etc. As the bond of global economy and trade, sea transportation is related to the prosperity of international trade and is also an important guarantee for global energy transportation security [4,5]. According to the United Nations Conference on Trade and Development (UNCTAD), more than 80% of the global trade volume depends on global shipping networks. International events may cause changes in the capacity of ports to deliver cargo and the original shipping routes, so as to affect the stability of sea transportation. Therefore, it is of great significance to develop targeted methods to assess the impact of specific international events.
Shipping suspension is a serious problem facing current sea transportation [6]. Since the outbreak of the Israeli–Palestinian conflict, vessels passing through the Red Sea have been frequently attacked, and the vessels that have been affected and suspended account for over 50% of the global container shipping market share. The conflict also has an impact on the global shipping industry and the global economy, bringing great difficulties and risks to container vessels carrying ocean shipping on the Asia–Europe route. At present, studies on the impact of the Israeli–Palestinian conflict mainly focus on global food security [7], oil prices, and other aspects [8,9], while there are few studies on the impact of the conflict on sea transportation. By studying the impact of the Israeli–Palestinian conflict on goods flow, trade routes, and shipping costs related to sea transportation, it is helpful to understand its internal mechanism, which is important to mitigate its impact on the global shipping industry.
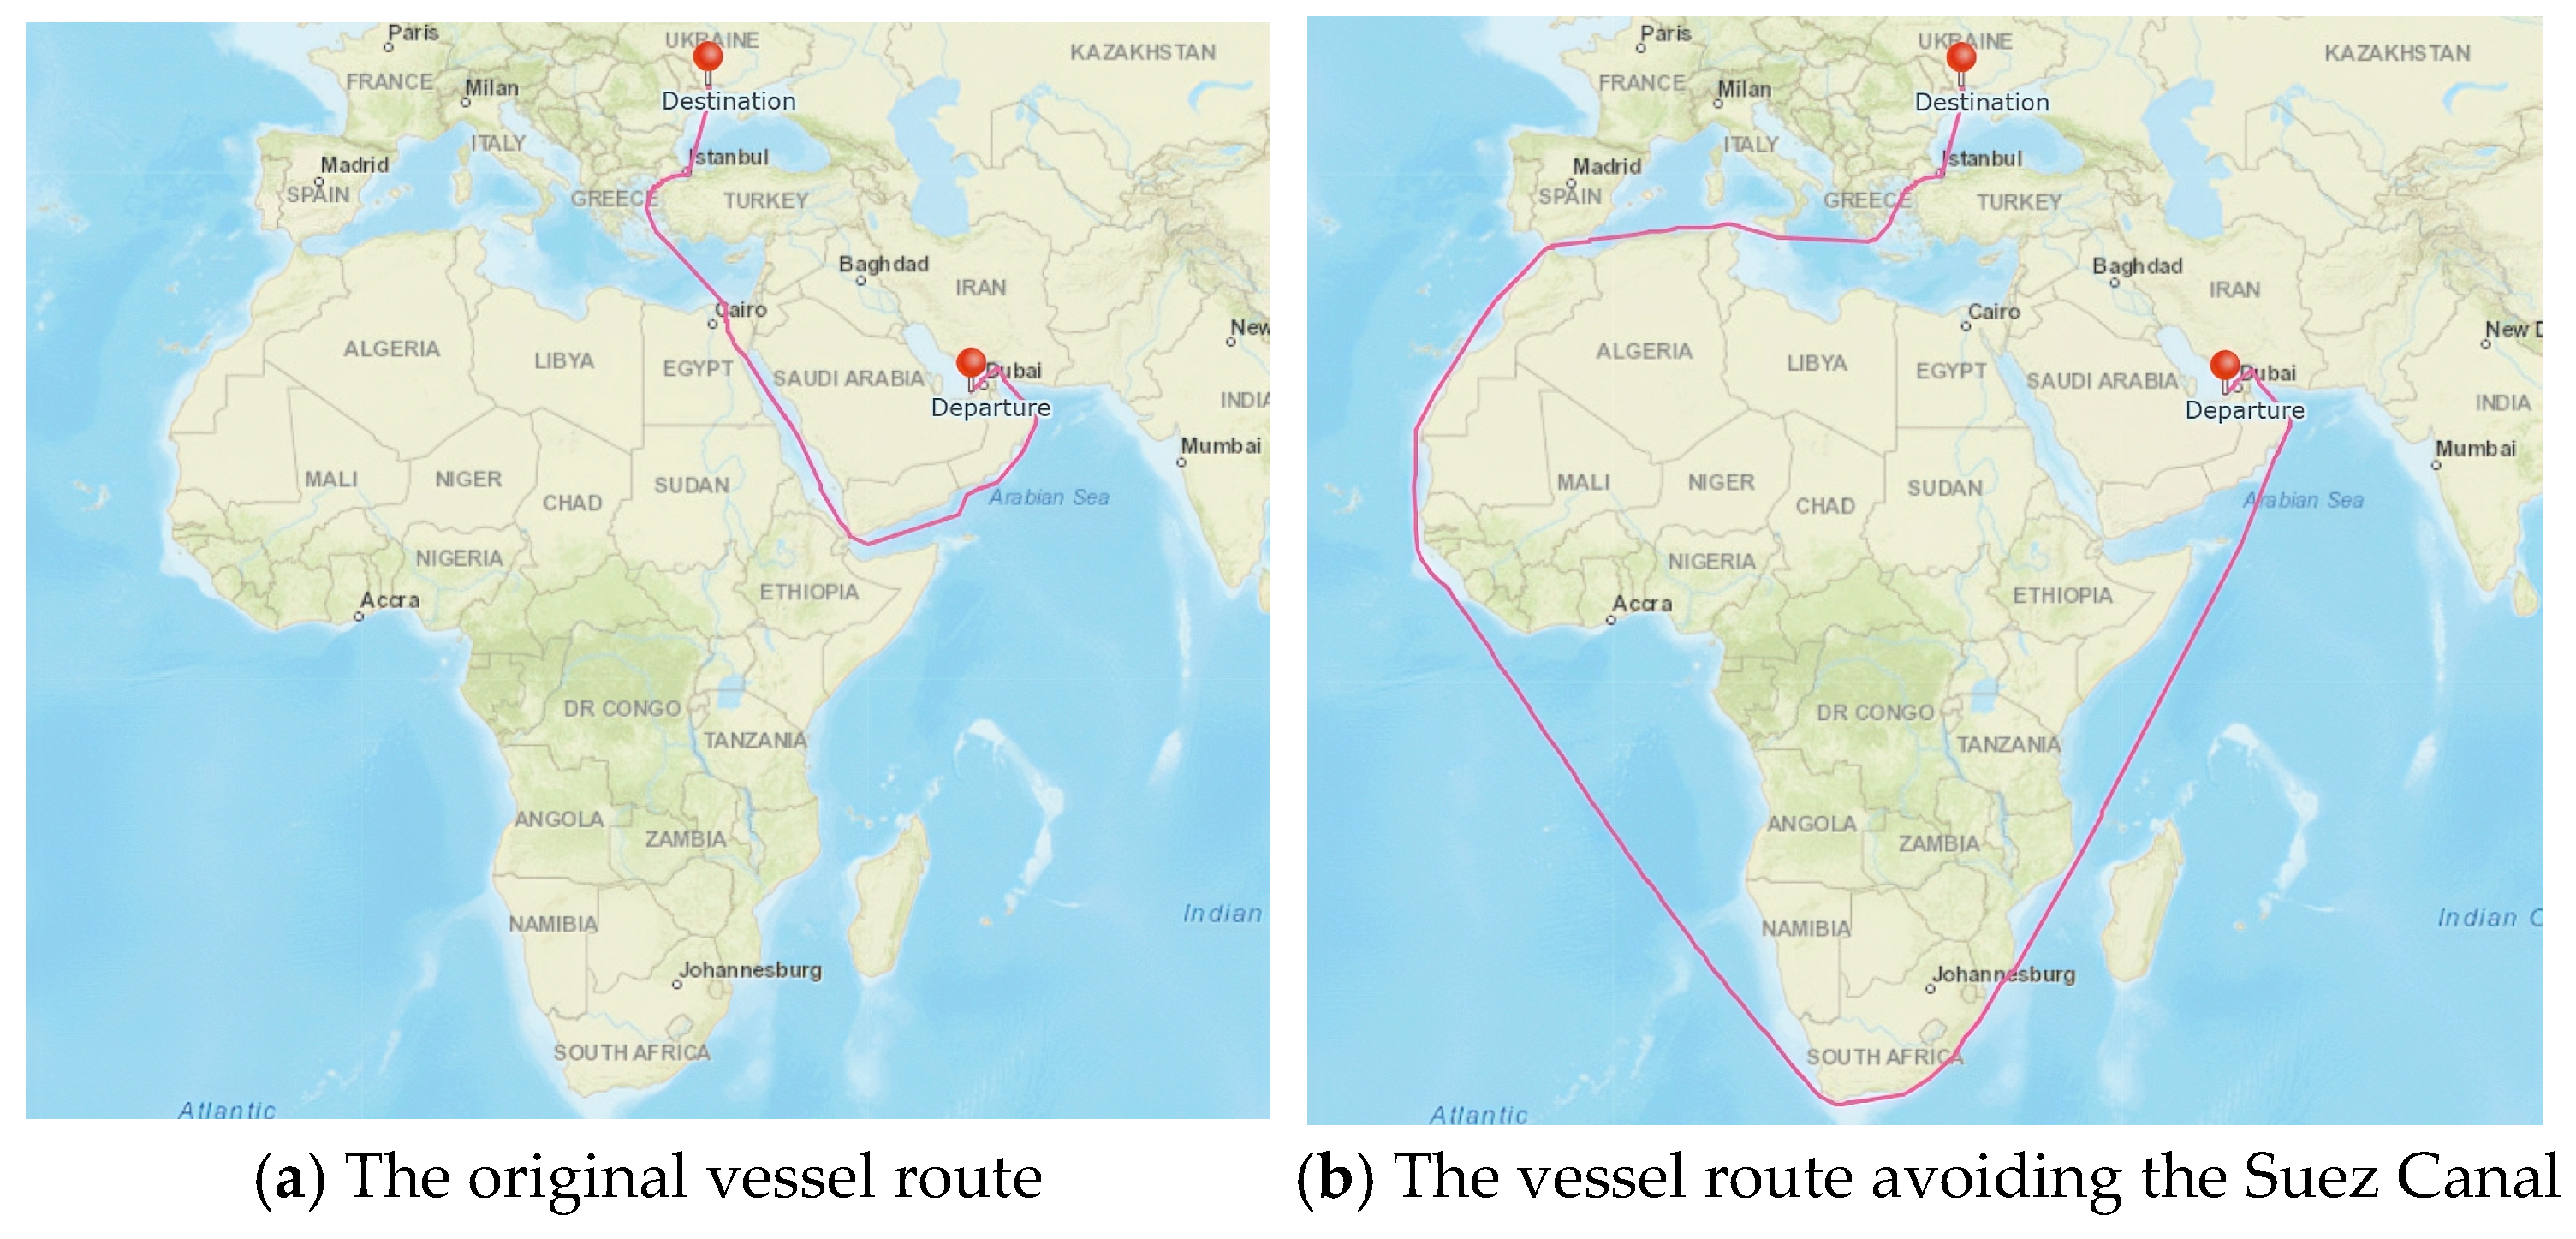
The sea transportation cost is positively correlated with the route distance of vessels, and an increase in route distance usually means an increase in fuel cost, time cost, and possibly insurance cost. From a macro point of view, due to the control of the Houthi movement in the Red Sea area during the Israeli–Palestinian conflict, the risk of disruption to international shipping has greatly increased. In the absence of alternative routes, vessels have no choice but to avoid conflict zones for safety reasons, which will undoubtedly increase shipping costs significantly. Figure 1 shows the changes in vessel routes transporting cargoes from the port of Abu Dhabi to the port of Odessa before and after the conflict, with Figure 1a representing the original vessel route and Figure 1b representing the vessel route avoiding the Suez Canal. As can be seen in Figure 1, the route distance has increased significantly compared to the pre-conflict routes. Our paper focuses on the analysis of vessel detours, shipping cost changes, and other aspects to assess the impact of the Israeli–Palestinian conflict on global sea transportation.
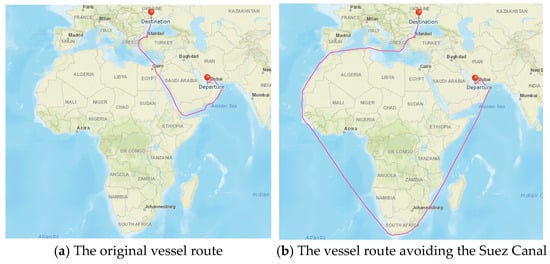
Figure 1.
Changes in vessel routes from the port of Abu Dhabi to the port of Odessa.
The rest of this paper is organized as follows. In Section 2, we provide a literature review on global shipping trade analysis and sea transportation situation analysis. In Section 3, we describe the methodology of data preprocessing and vessel trajectory extraction. In Section 4, we introduce the situation analysis methodology of sea tanker transportation from two aspects: shipping cost and traffic flow. In Section 5, we take the Israeli–Palestinian conflict events as the time node, experimentally analyze the changes in the sea tanker transportation situation before and after the conflict, and give the experimental results. In Section 6, we discuss and summarize the research.
2. Related Works
2.1. Analysis of Global Shipping Under the Impact of Emergencies
Some studies have analyzed the impact of emergencies on the international shipping industry. Cho et al. [10] use dynamic computational general equilibrium (CGE) models and the trade–cargo–container conversion method to analyze the impact of the Sino–US trade friction, global protectionism, and the closure of international institutions on international trade and global sea transportation. Combining expert experience, Ilyas et al. [11] designed 64 factors to assess risk in a comprehensive way and analyzed the impact of the outbreak of COVID-19 on the global shipping industry and supply chain. Shepard and Pratson [12] studied the impact of piracy activities in the Strait of Hormuz on energy export security from the aspects of transportation cost, transportation time, and transportation volume. Steinbach and Office [13] modeled and analyzed the global trade reallocation effect caused by the Russia–Ukraine conflict and quantified the degree of trade disruption and diversion caused by the Russia–Ukraine conflict. Yang and Sun [14] mainly conducted an in-depth analysis on the vulnerability of the Maritime Silk Road (MSR) shipping network in an emergency. By constructing the shipping network of MSR and analyzing its characteristics, four indicators are selected to measure its vulnerability, and the impact of random emergencies and deliberate attacks on the shipping network status is simulated. To and Lee [15] studied the impact of COVID-19 on the global transportation industry. They selected the data between 2005 and 2019 to construct a seasonal autoregressive integrated moving average model and then estimated the impact of COVID-19 on freight volume based on the difference between the monthly predicted value and the real value. Sercan [16] analyzed the impact of the Russia–Ukraine conflict on the maritime trade and logistics corridor in the Black Sea, using the Turkish Strait, which connects the Black Sea ports to global markets, as an example, analyzing wartime shipping data and Turkish-facing maritime trade statistics to assess possible alternative transportation modes and trade routes.
2.2. Analysis of Data-Driven Sea Transportation Situation
The vessel positioning signal data generated by the Automatic Identification System (AIS) are some of the most important maritime big data, and aim to automatically provide other vessels or maritime authorities with information such as vessel location, vessel type, and identity. AIS can be used to obtain vessel activity information with temporal and spatial characteristics and marine attributes around the world, providing data support for vessel trajectory analysis, vessel traffic flow analysis, maritime supervision, and other studies.
In recent years, there has been an increasing number of studies about data-driven sea transportation, which mainly focus on AIS data. In terms of transportation capacity, Fang et al. [17] studied the impact of international events on global sea transportation based on AIS data, proposed a spatio-temporal analysis framework to measure the similarity of shipping trends before and after international events, and analyzed the impact of the India–Pakistan conflict in 2015 on the global transportation of containers, tankers, and bulk carriers. Peng et al. [18] built a global container transportation network based on arrival and departure data of global container vessels from 2013 to 2022, studied the cargo transportation of container vessels between ports in the global shipping network, and analyzed the influence dissemination mode of more than 1000 container transportation ports around the world by using the port influence dissemination maximization model to understand the reasons for the formation of port influence advantage. In terms of maritime traffic resilience, Zaman et al. [19] analyzed the shipping environment and characteristics of the Strait of Malacca, and analyzed the possible risks and challenges of shipping in the Strait of Malacca based on AIS data. Fan et al. [20] abstracted ports as key nodes of sea transportation, evaluated the resilience of key nodes of sea transportation channels from the aspect of the key nodes’ ability to absorb and resist external interference and resilience, and built a safety resilience evaluation index system of key nodes of sea transportation channels to further evaluate the stability of the entire shipping network. Using monthly time-series data from January 2007 to March 2021 as the data source, Chu [21] used GARCH and VAR models to study three explanatory variables (crude oil prices, China Containerized Freight Index, and Baltic Dry Index), and further analyzed the volatility and hysteresis effects of Taiwan’s sea transportation.
From the above review, although there are abundant studies on global sea transportation, few studies regard local or global maritime trade and transportation as a whole and analyze the impact of conflict on it from the perspective of navigation cost. Our paper combines quantitative assessment and qualitative analysis to study the impact of the Israeli–Palestinian conflict on global sea transportation in a data-driven way. Combined with the process of the Israeli–Palestinian conflict, this paper takes the global vessel trajectories since the conflict as the research object based on the AIS large data set. Firstly, the vessel trajectories before and after the conflict are compared and analyzed, the cumulative detour distance is calculated, and the shipping cost increment index is introduced and used to calculate the increase in shipping costs for each country. Furthermore, by analyzing the changes in the flow of import and export vessels in various countries before and after the conflict, the severity of the impact of the conflict on global sea transportation can be measured and evaluated.
3. Methodology for Processing Trajectory Data of Oil Tankers
3.1. Data Preprocessing
According to the regulations of the International Convention for Safety of Life at Sea of the International Maritime Organization (IMO), since 31 December 2004, all vessels engaged in international shipping of 300 gross tons and above, cargo vessels engaged in non-international shipping of 500 gross tons and above, and passenger vessels regardless of tonnage should install the AIS system [22]. The AIS can automatically provide static information, dynamic information, and shipping-related information (horizontal plane, destination, estimated time of arrival, etc.) to shore stations, other vessels, and satellites equipped with AIS. In this way, the AIS can be used for vessel monitoring and tracking.
Vessel types include passenger vessels, cargo vessels, tugs, high-speed vessels, tankers, etc. There are about 120,000 large vessels that can be tracked around the world. The ocean transportation of oil-dominated commodities mostly relies on large tankers, so this study mainly focuses on large tankers used for global energy transportation at sea. The AIS data used in our study can be divided into a static information table and a dynamic information table, which record the attribute information of the vessel itself and the dynamic information of the vessel’s activities, respectively. The specific fields are shown in Table 1 and Table 2.

Table 1.
Field descriptions of AIS dynamic information table.
Table 2.
Field descriptions of AIS static information table.
The data preprocessing is mainly for the research needs of the global shipping situation analysis to deal with the data redundancy and errors in AIS data. Due to the occasional instability in the signal sending and receiving process, there may be problems such as null values, missing coordinates, and nonstandard data in AIS data, so it is necessary to carry out data preprocessing. In this paper, we use the AIS data of global large tankers before and after the Israeli–Palestinian conflict, which can be preprocessed through data compression, data cleaning, data mapping, and abnormal data processing.
3.1.1. Data Compression
AIS data record latitude and longitude with a frequency accurate to seconds, and a vessel completing a complete sea voyage may generate tens of thousands of dynamic data. This paper focuses on global shipping trends rather than the behavior patterns of single vessels, so the AIS data can be compressed to reduce the amount of data while maintaining the integrity of the route. In this paper, we adopt the tile-based compression technique [23], which divides the water area into square tiles with the same latitude and longitude intervals. When there are consecutive points of trajectory falling in the same tile, only one representative point is retained. Existing studies show that describing vessel trajectory with only representative trajectory points does not significantly reduce the accuracy of the vessel trajectory analysis [24]. The tile interval used in our paper is 0.01 degrees, which can compress the volume of data by about 5 to 10 times.
3.1.2. Data Cleaning
Firstly, we reduced the data dimensions. Our paper focuses on the changes in the shipping situation and only needs to retain some vessel information fields (MMSI, name, vessel_type, lon, lat, sog, cog, nav_status, DT_Pos_Utc) and vessel shipping information (dest, eta) so as to reduce the data dimension. Then, we delete the data with missing key fields. This paper focuses on the analysis of the global shipping situation, which needs to make use of location and time data to conduct a spatio-temporal correlation analysis. Therefore, vessel position data as well as time data are indispensable data items, so the records with null values for latitude, longitude, and timestamp can be directly removed. Finally, we remove redundant data from static information. AIS generates dynamic position data as well as static data at each sampling, and most of the information in the static data does not change for the same vessel; so, there is a lot of redundancy in the static data. Duplicate fields in the static information can be removed based on the vessel’s name and MMSI, thus eliminating redundant information.
3.1.3. Data Mapping
The AIS device of a vessel sends static and dynamic data in the form of messages. Only by mapping the dynamic information and static information can AIS data be used for analysis. Both the dynamic and static information of AIS data contain MMSI fields, which can be used to conduct data mapping.
3.1.4. Abnormal Data Processing
The vessel trajectory data record the continuous trajectory points of a vessel over a period of time. Under normal circumstances, the difference between the longitude and latitude of adjacent trajectory points are small, but abnormal data usually refer to the situation of longitude and latitude drift in dynamic data, which will lead to sudden changes in the longitude and latitude values of trajectory points. In this way, abnormal trajectory points can be eliminated. In this paper, the threshold of longitude and latitude differences between adjacent trajectory points is set to 1.5°. If the difference in the longitude or latitude of adjacent trajectory points is greater than this threshold, the trajectory points in the later order will be regarded as abnormal data.
3.2. Vessel Trajectory Generation Based on DBScan Algorithm
For sea transportation, there are many vessel trajectories between ports, reflecting the intercommunication between countries. The vessel positions in the original AIS data are stored as geographic coordinates, and the extraction and generation of the vessel trajectories is the basis for the analysis and calculation of the trajectories. In the existing literature, vessel trajectory extraction algorithms are mainly divided into three categories: grid-based algorithms [25], clustering-based algorithms [26], and statistics-based algorithms [27]. Among them, the clustering-based algorithm measures the similarity between the trajectory points by analyzing the vessel’s movement pattern and trajectory feature information and then clusters the trajectory points with higher similarity to realize the extraction of routes. The algorithm can effectively extract trajectories in a large number of trajectory points, has good efficiency and effect, and is the common trajectory extraction algorithm at present.
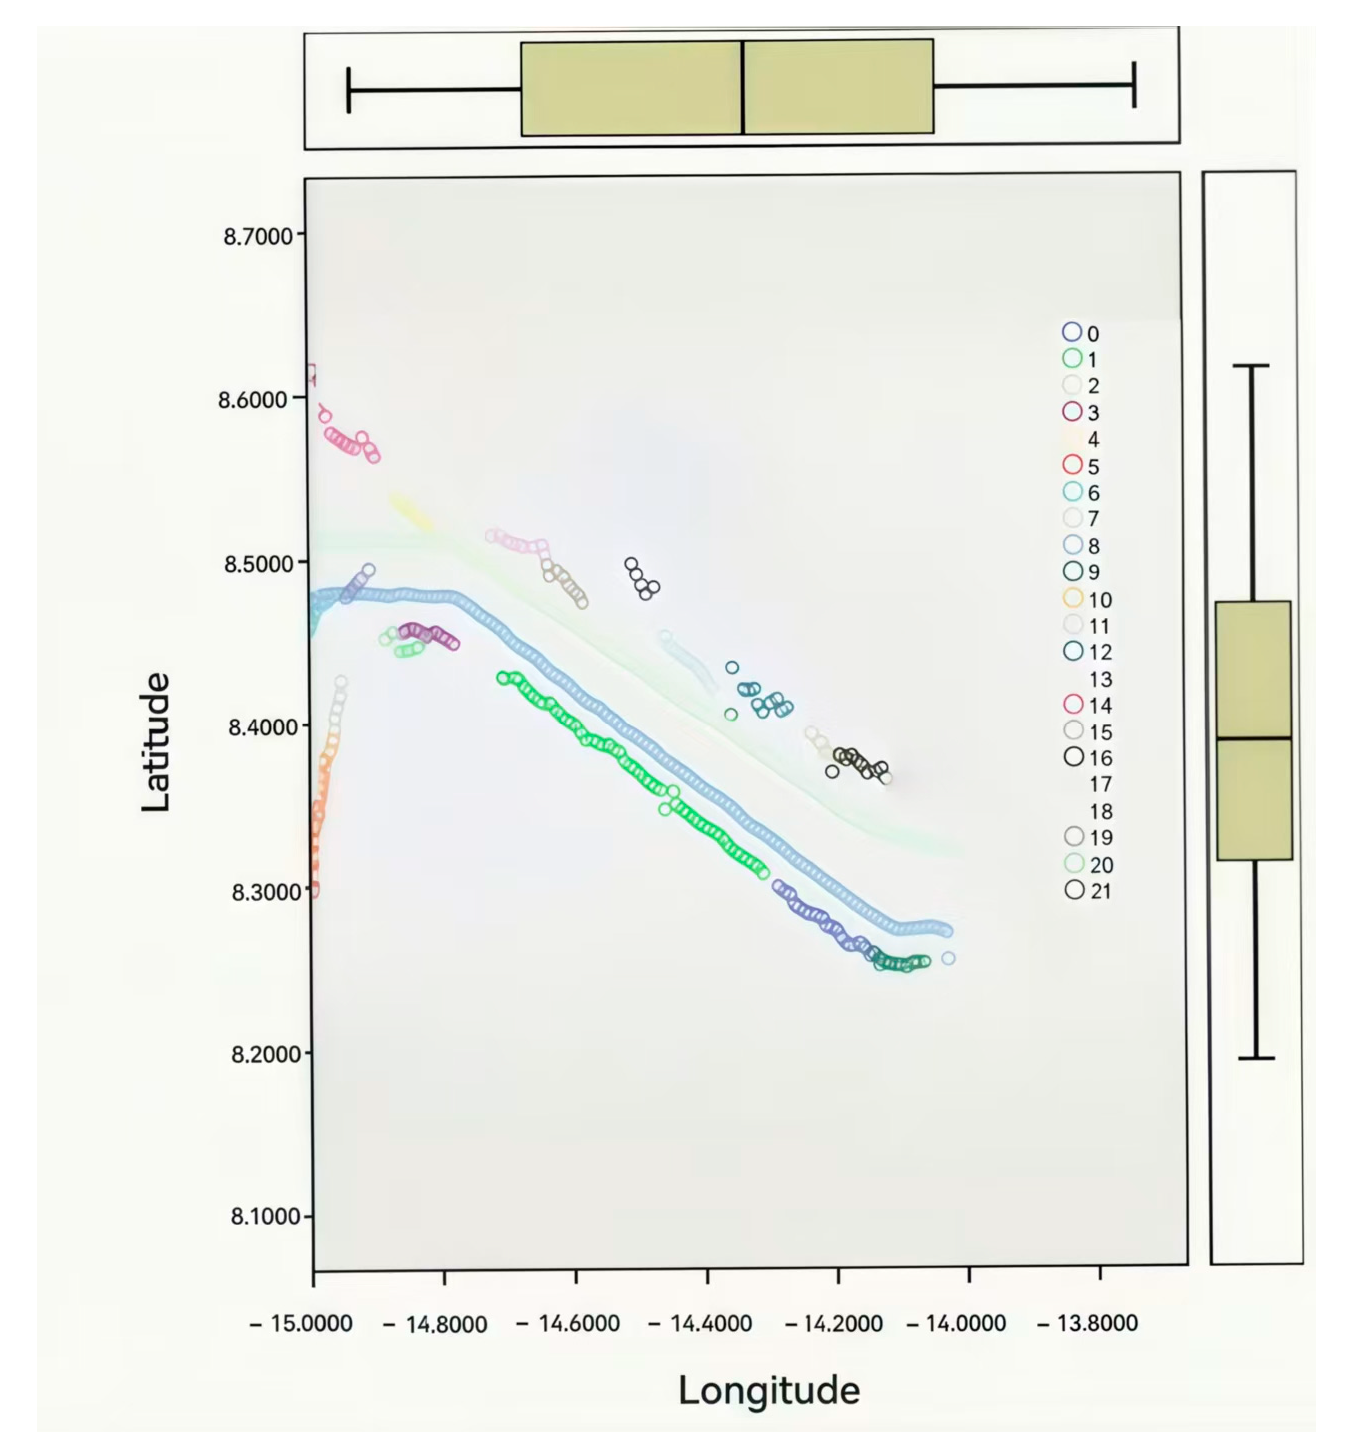
Density-based clustering is an important branch of clustering algorithms, and traditional density-based clustering only measures the similarity of data from a spatial perspective. In this paper, drawing on the idea of Liu et al. [28], the density-based spatial clustering of applications with noise (DBSCAN) algorithm is used for vessel trajectory points clustering. Since this paper mainly considers the macro scale and the volume of large oil tankers, the clustering radius of 0.3 nautical miles and the minimum clustering points of 50 are selected when the DBSCAN algorithm is applied, based on which two non-spatial factors, namely, speed over ground (sog) and course over ground (cog), are used to further eliminate abnormal trajectory points, so as to realize vessel trajectory extraction. Based on the above algorithm, the AIS data of the coastal waters near the west coast of Africa are used to conduct vessel trajectory extraction, and the results are shown in Figure 2.
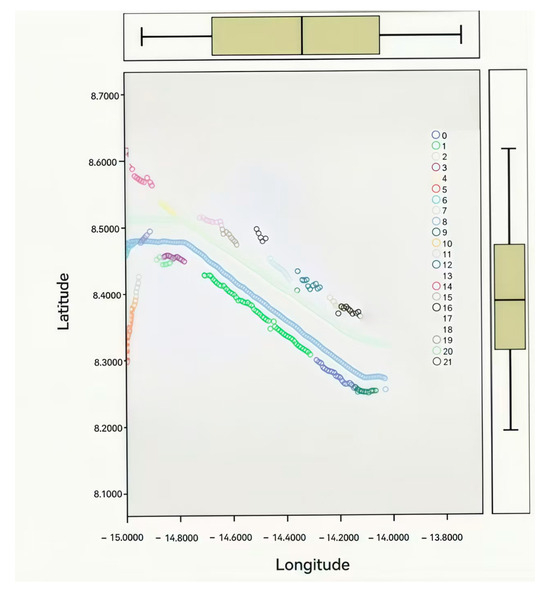
Figure 2.
Vessel trajectory extraction results of the proposed algorithm of this paper.
4. Methodology for Analyzing Transportation Situation of Oil Tankers
4.1. Analysis of Changes in Shipping Cost
For sea transportation, the shipping cost includes fixed and variable costs. Fixed costs are the fixed operating costs of each vessel, while variable costs are the costs of the vessel on the route from the port of departure to the port of destination, including fuel consumption, port charges, and storage charges. In most cases, the ports of departure and destination of a vessel have already been determined and generally will not change. However, in some cases, oil tankers may depart without a destination, and their destination ports are not fixed. They may sell crude oil during shipping, and when the vessel completes the sale of crude oil at a certain port, the port will become its port of destination. In either case, the factors affecting changes in the shipping cost come mainly from fuel consumption. In fact, the shipping cost related to the fuel consumption of oil tankers is affected by a variety of factors. In addition to the shipping distance and fuel price fluctuations, there are also tank purging, tank inerting, and sometimes heating of cargo (Aframax tanker), etc. Considering that this paper mainly focuses on the Israeli–Palestinian conflict, vessels will choose to make significant detours to avoid risks. Therefore, compared with other factors, the increase in shipping distance caused by detours is one of the factors most affected by the conflict. In this context, changes in fuel consumption are mainly determined by changes in shipping distance and are positively correlated with the shipping distance. In the modeling process in aviation and navigation, shipping time is also often used to estimate fuel consumption [29]; so, our paper draws on this idea to replace shipping distance with shipping time to assess the change in shipping cost.
For a complete voyage, once the starting point and the end point are determined, the shipping route and distance are relatively fixed. Therefore, it can be considered that the variation of shipping time is largely caused by temporary factors (such as weather or emergencies), and the shipping time of a vessel in the same route fluctuates due to the influence of temporary factors. This paper measures the impact of temporary factors on the vessel during shipping by calculating the change in the shipping time before and after the Israeli–Palestinian conflict, where the shipping time refers to the time required for a vessel to navigate from the port of departure to the port of destination. The change in the shipping time can be represented by the difference between the shipping time of a single shipping and the average shipping time on the corresponding route.
To calculate the changes in shipping time, it is necessary to extract the complete vessel trajectory. In the original AIS data, only the information of the port of arrival is available, without the information of the port of departure. Based on the MMSI of a vessel, this paper filters out the trajectory data belonging to the same vessel, sorts them in ascending order according to the timestamp, extracts the latitude and longitude corresponding to the starting timestamp, and compares them with the pre-established port information table to obtain the information on the port of departure. In this way, we can determine the port of departure, the port of arrival, and the shipping time of each shipping event. Because the vessel may dock at a port for some reason (such as loading and unloading cargo, refueling, replenishing supplies, etc.), or stay at sea for a period of time due to the weather and other reasons, it is not accurate to replace the shipping time solely based on the time difference between the beginning and end of the shipping of the vessel. It is necessary to further exclude the stopping time and calculate the actual shipping time of the vessel. In this paper, based on the characteristics of the vessel trajectory, the threshold is set to recognize the berth trajectory segment. In Section 4.1, vessel trajectories have been extracted through trajectory clustering, and each vessel trajectory can be represented as a set of sequential trajectory points , where represents the trajectory point of the vessel at time . , where and represent the position of the vessel at time , and is the speed of the vessel at time . When the speed of the vessel tends to 0, the vessel can be considered to be in a stopping state. However, since the vessel cannot achieve complete stillness in water, it is generally considered to be in a stopping state when the speed of the vessel is less than 1 knot. At the same time, in order to accurately identify the stopping trajectory point, the stopping time threshold and the stopping distance threshold are further set. Considering the length of the vessel and the characteristics of the vessel’s stopping activity, is set to 1.5 times the length of the vessel, and is set to 2 h. Then, all the vessel trajectory points in set T are traversed and , with speed less than 1 knot, is extracted. Further, the distance d and time difference t between and its subsequent points are calculated. When the conditions are met at the same time, the current vessel trajectory is recorded and calculated backwards successively until the last trajectory point that meets the conditions is obtained. The corresponding time of the last trajectory point is recorded and the time difference between it and the starting point of the stopping section is calculated. The actual shipping time of the vessel is obtained by subtracting the stopping time from the total shipping time.
To further verify whether the shipping time has changed significantly before and after the conflict, statistical tests are used to compare the shipping time of vessels on each route before and after the conflict. We select the time interval before and after the conflict (time interval and time interval ) and use a dual population t-test to test the differences between the two time intervals. The formula for the t-test is as follows.
where represents the t-test value on a certain route (starting point is O and ending point is D), represents the mean value of the data, represents the mean value of the data in time interval , represents the mean value of the data in time interval , represents the variance of the data, represents the variance of the data in time interval , and represents the variance of the data in time interval . and represent the number of shipping events in the two sets of data, respectively. The basic assumption of a T-test is that the sample mean of the dataset follows a normal distribution, or the sample size is large enough to justify its use based on the central-limit theorem. To verify this requirement, this paper applies the Kolmogorov–Smirnov test, which is used to verify whether the set of shipping costs for vessels over a period of time conforms to a normal distribution . The results show that 87.0% of the shipping cost distribution conforms to the normal distribution (p < 0.05), which meets the requirements of the basic assumption of the t-test.
When selecting data samples for the T-test, statistical intervals are also a factor to consider. If the time interval is too short, the data are easily affected by short-term sudden factors such as the weather, and the selected samples may be not sufficient to draw statistical conclusions. On the contrary, if the time interval is too long, the data are easily affected by seasonal climate change, changes in import and export policies of various countries, and so on. In this paper, we conduct statistical analysis at monthly intervals to eliminate the impact of short-term emergencies such as weather and piracy. The data from one month before and after the conflict (the data of August and November) are selected and recorded in the dataset, and the boxplot shown in Figure 3 can be formed by the t-test. The figure shows the changes in the trajectory of tankers from Saudi Arabia to Germany before and after the conflict, and it can be observed that there has been a certain increase in their shipping time.
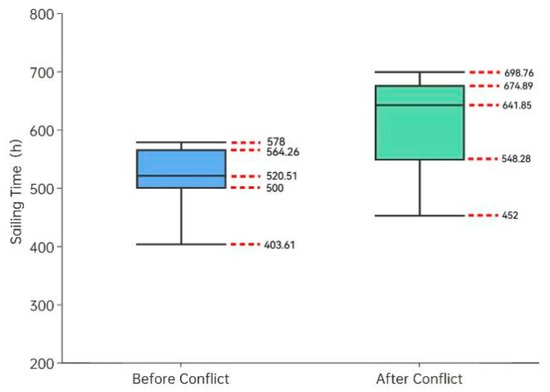
Figure 3.
Boxplot of shipping time before and after the Israeli–Palestinian conflict.
4.2. Shipping Cost Increment Index for Various Countries
In the process of the Israeli–Palestinian conflict, shipping restriction policies and import and export trade policies are formulated by various countries. This section focuses on countries and extracts trajectories with significant changes in shipping cost (i.e., shipping time) before and after the conflict. The shipping cost increment index is designed to calculate the cumulative increment in shipping costs for each country, so as to characterize the degree of impact of the Israeli–Palestinian conflict on sea transportation. In Section 4.1, information such as the port of departure, the port of arrival, and shipping time has been extracted. This section further matches the port information with the country to which the port belongs, obtaining the departure and destination countries of each vessel, and then calculates the shipping cost increment for each country. The calculation formula is as follows:
where represents the shipping cost of vessel on a certain trajectory OD before the conflict (as described in Section 4.1, shipping cost is replaced by shipping time), and similarly, represents the shipping cost of vessel on the trajectory OD after the conflict. and represent the number of vessels on a certain trajectory during the corresponding time period before and after the conflict, respectively, and represents the total number of trajectories in country during a certain time period. represents the shipping cost increment index for country during the corresponding time period before and after the conflict; the unit is hour. The average shipping time of vessels during a certain period on trajectory OD can be obtained by dividing the sum of shipping costs of all vessels during a certain period on trajectory OD by the total number of vessels in this period of time. In Formula (2), the difference between the average shipping time of vessels during a certain period before and after the conflict reflect the change in the average shipping time of vessels on the trajectory OD. By multiplying the difference with the number of vessels of the trajectory OD in a certain period after the conflict, the total change in shipping time of all vessels on trajectory OD after the conflict can be obtained. Furthermore, by adding up the total changes in shipping time of all trajectories in a country, the shipping cost increment index for a country after the conflict can be obtained. For example, this section selects AIS data corresponding to a time period of one month before and after the conflict (August and November). If the calculated shipping cost increment index for a certain country is 50 h, it indicates that all vessels related to this country need to spend an additional 50 h of shipping time within one month after the conflict to avoid crossing blocked sea areas.
4.3. Analysis of Global Tanker Flow
After the outbreak of the Israeli–Palestinian conflict, multiple attacks occurred in the Red Sea, leading to several international shipping companies announcing the suspension of the Red Sea route. The Bab-el-Mandeb Strait, as the southern estuary of the Red Sea, is a major international trade route between Europe and Asia, with approximately 20% of global oil transportation related to this route. In order to analyze the changes in the maritime traffic situation caused by the conflict, our paper takes the Bab-el-Mandeb Strait as the experimental area. By extracting the trajectories of vessels that intersect with the Bab-el-Mandeb Strait area, the traffic flow of vessels passing through this area can be analyzed.
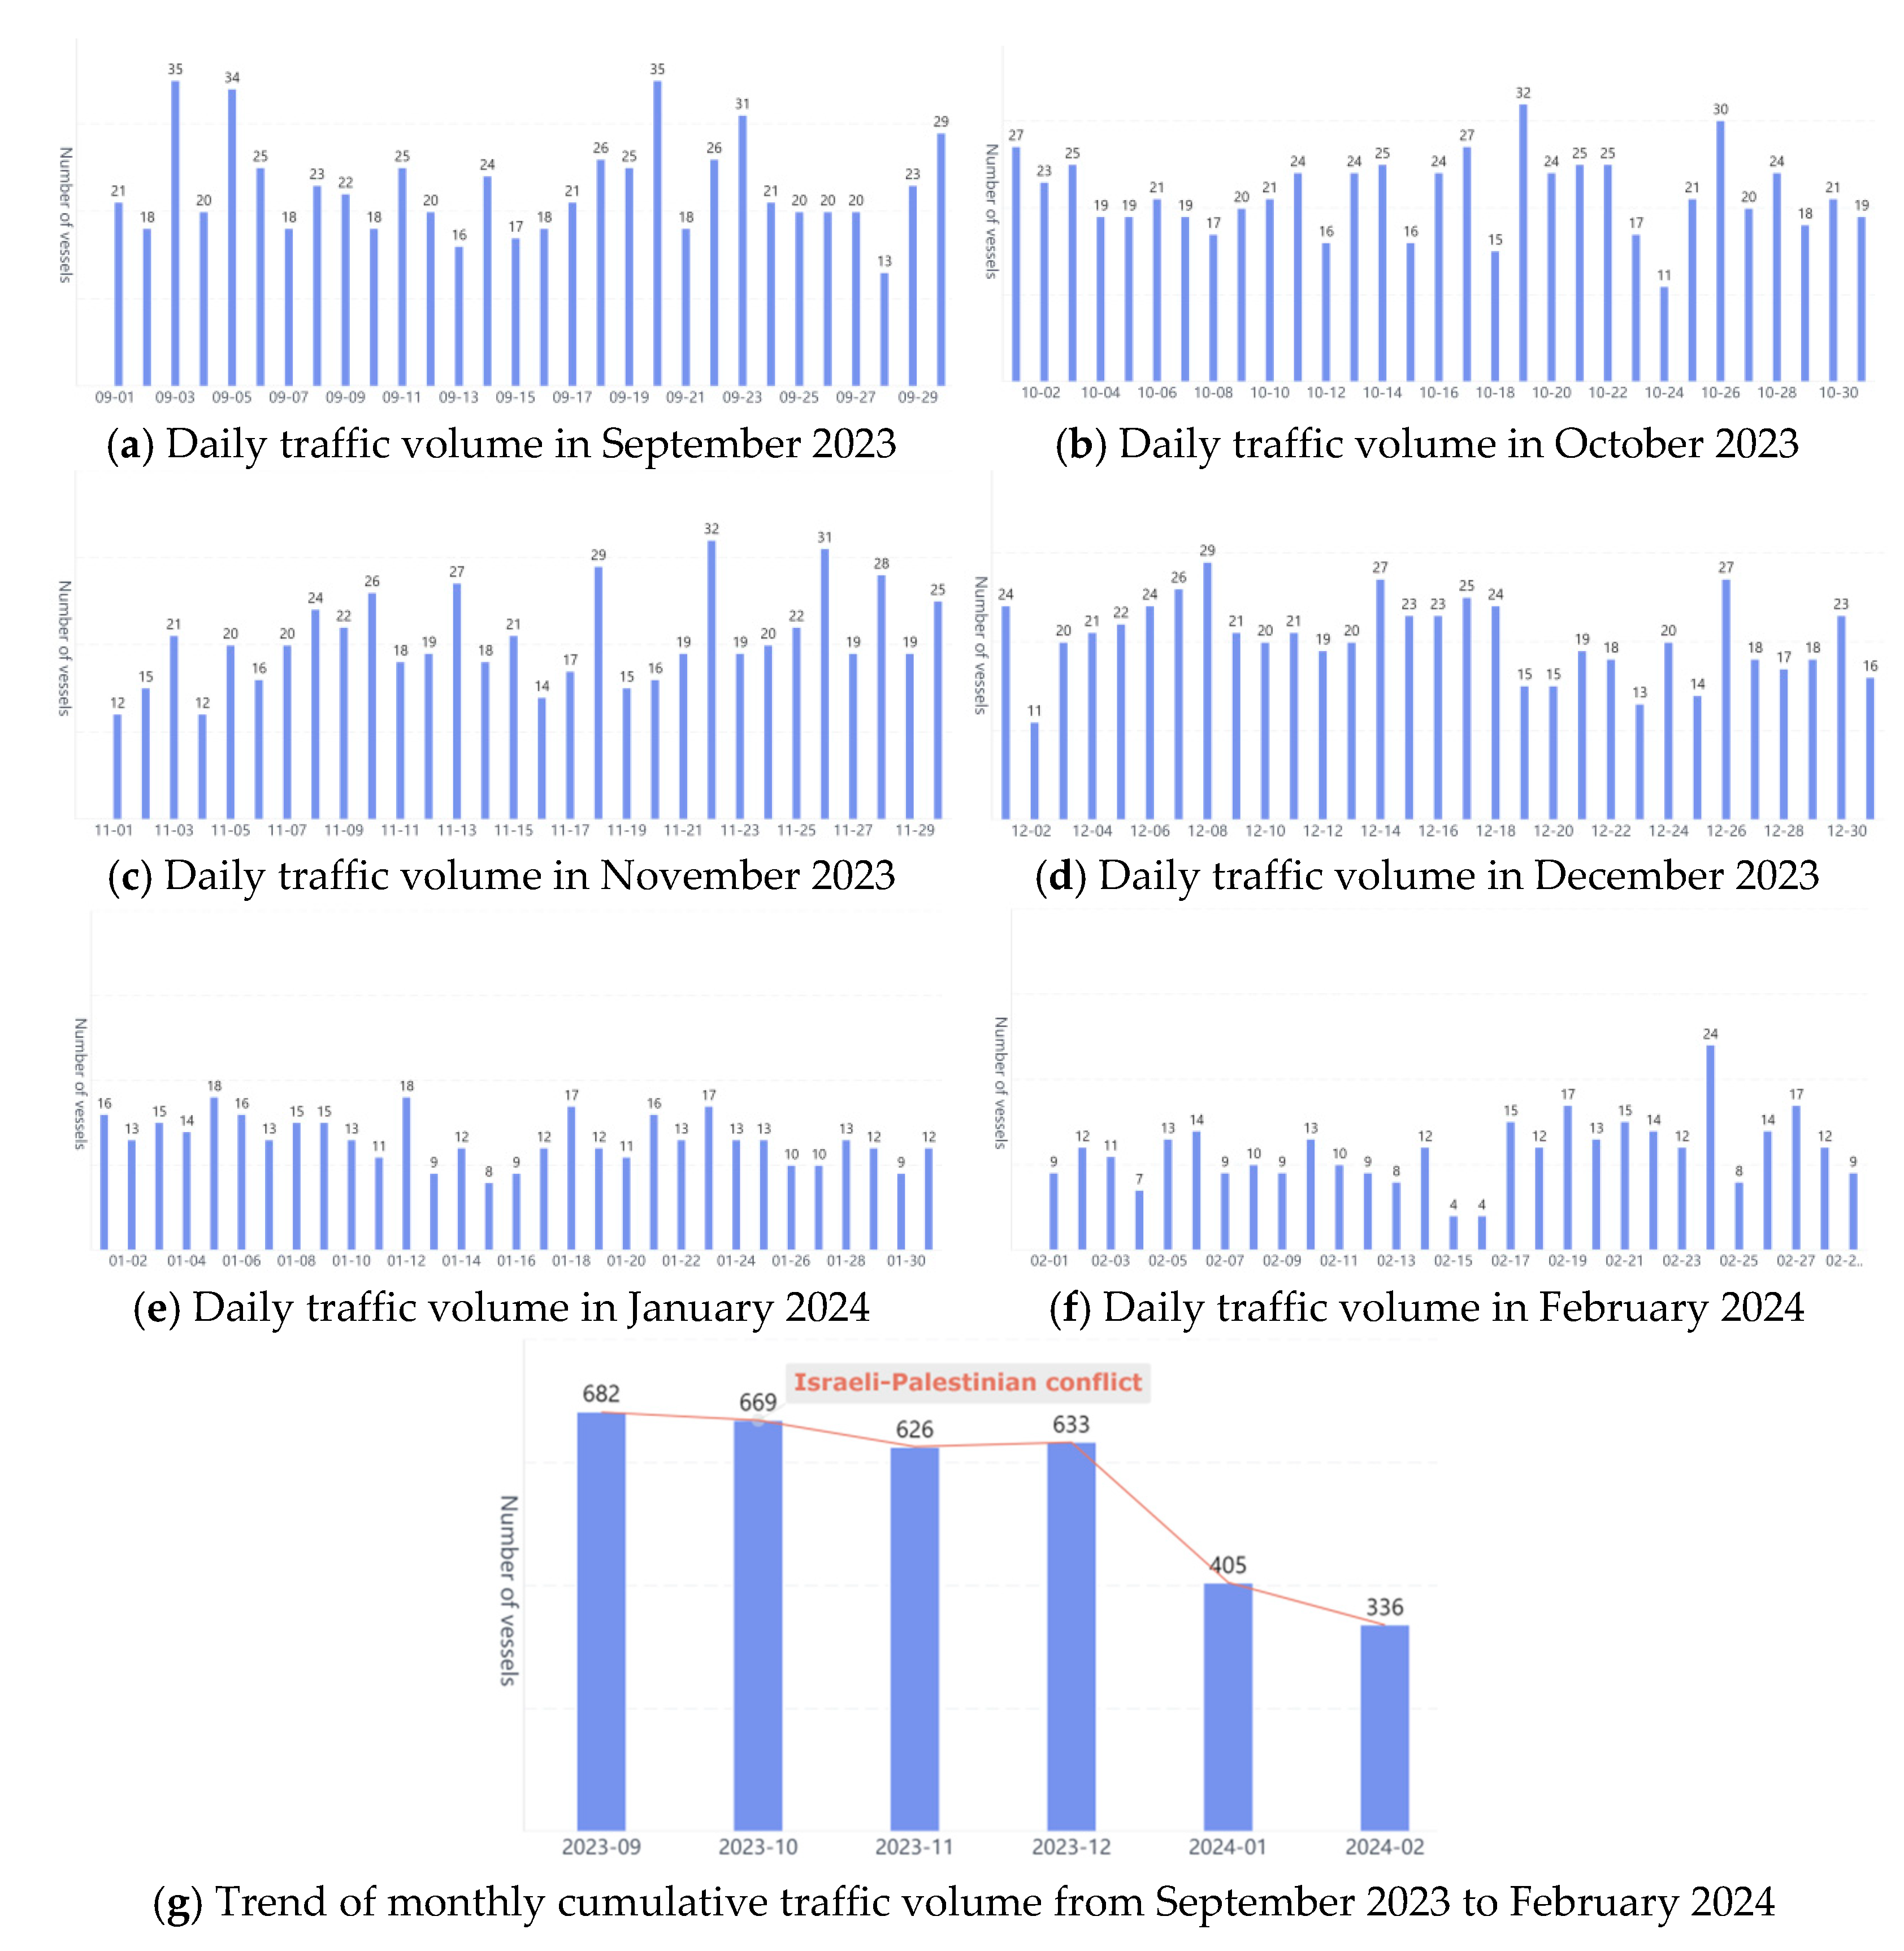
We calculate the changes in the traffic flow of vessels passing through the Bab-el-Mandeb Strait during the conflict period (from September 2023 to February 2024), with the outbreak of the conflict in October 2023 as the center. The daily and cumulative monthly traffic volumes are shown in Figure 4. In this figure, (a)–(f) show the daily vessel traffic flow from September 2023 to February 2024, respectively. In order to more intuitively reflect the changes in vessel traffic flow, the vertical axis is set on a unified scale. In the figure, the horizontal axis represents the date, and the vertical axis represents the number of vessels passing through the Bab-el-Mandeb Strait on that day, and the corresponding number of vessels per day is marked in text form above the column. The change in the height of the column in the bar chart shows the temporal changes in the number of vessels passing through the Bab-el-Mandeb Strait. It can be seen that since the outbreak of the conflict, the number of vessels passing through the Bab-el-Mandeb Strait has begun to decrease. Panel (g) shows the total monthly vessel traffic flow from September 2023 to February 2024. Combined with the line chart, we can clearly see the changes in the number of vessels passing through, especially in January 2024, when the traffic flow on this route had significantly decreased, from more than 600 to over 400. Based on the actual situation in January, that the United Kingdom, the United States, and other countries had carried out strikes on the Houthi movement, the security situation in the Red Sea area had further deteriorated, thereby affecting the normal passage of vessels.
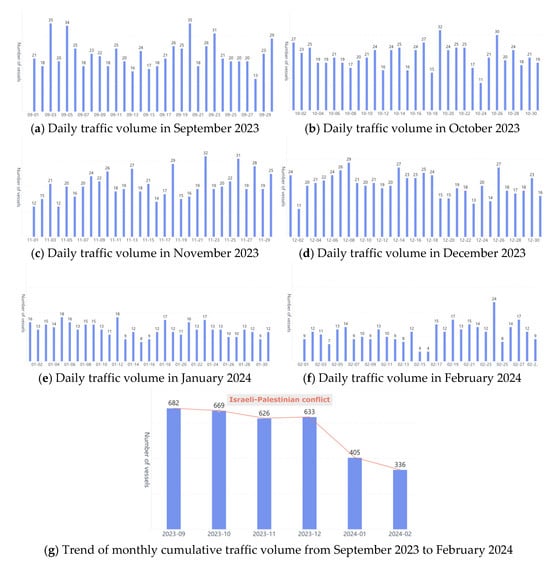
Figure 4.
Changes in the traffic volume of oil tankers passing through the Bab-el-Mandeb Strait before and after the conflict.
5. Analysis of Results
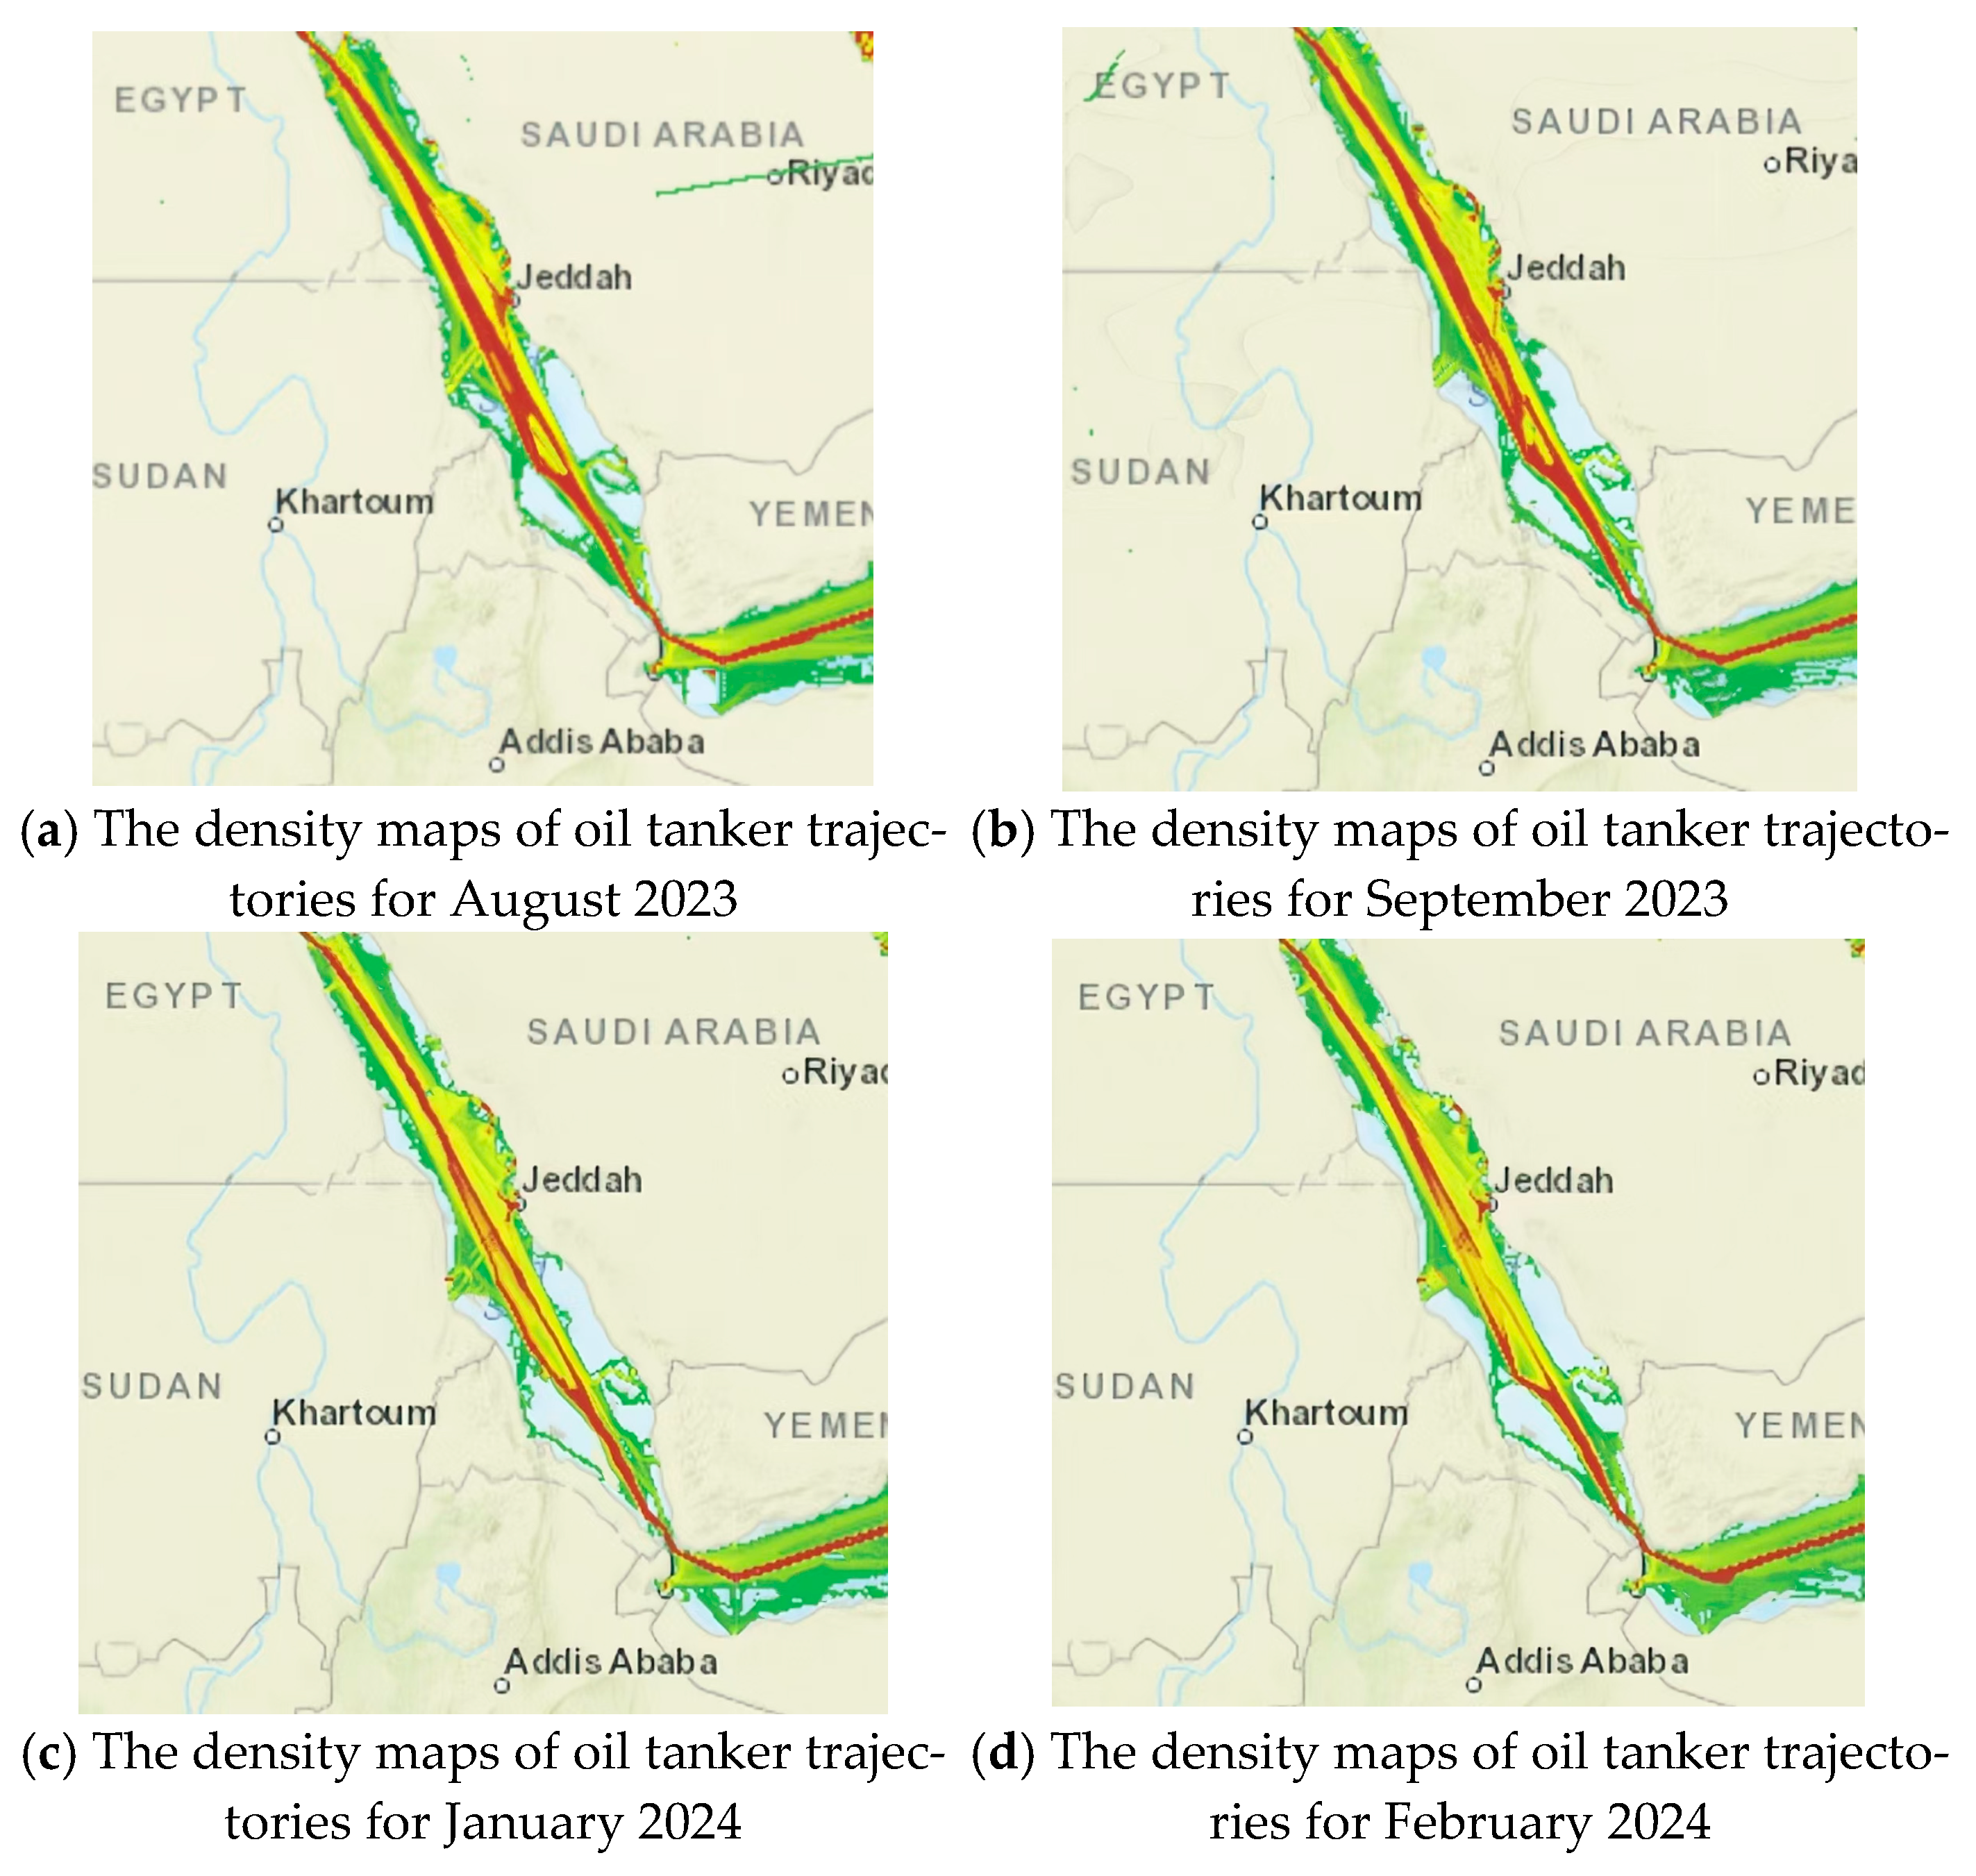
Our paper quantitatively evaluates the impact of the Israeli–Palestinian conflict on global tanker sea transportation from a data-driven perspective. The AIS data of global tankers from August 2023 to February 2024 are taken as the original data, from which the dynamic trajectory data of tankers are extracted as experimental analysis data, about 45 million per month. In order to measure the impact of the conflict on global sea transportation from a macro perspective, our paper firstly takes the tanker AIS data of two months before and after the conflict, and draws the trajectory density map, as shown in Figure 5. Figure 5 compares the density maps of tanker trajectories in the Red Sea for August and September 2023 and January and February 2024. In the figure, the color change indicates the density of tankers passing through the area. From green to red, the darker colors indicate the density of the tankers, and the vice versa, the lighter colors indicate a relatively small number of tankers. It can be found from the figure that the conflict has brought a certain impact on sea transportation in the Red Sea. As these areas are close to the conflict site, the density of AIS trajectory decreases to a certain extent. On this basis, starting from the national dimension, this paper takes the tanker as the statistical object, determines the increased shipping cost by calculating the cumulative detour increment, so as to evaluate the severity of the impact of the conflict on the import and export trade of each country. Meanwhile, in order to further analyze the impact of the conflict on the global shipping situation, the changes in the import and export flow of tankers in each country were calculated.
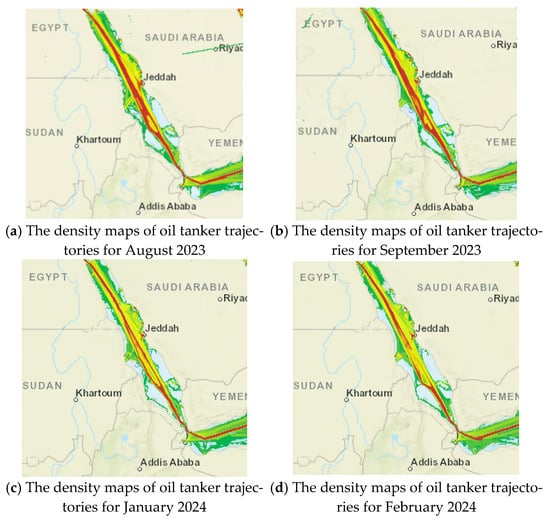
Figure 5.
The density maps of oil tanker trajectories for August and September 2023, as well as January and February 2024.
5.1. Changes in Shipping Costs of Tankers
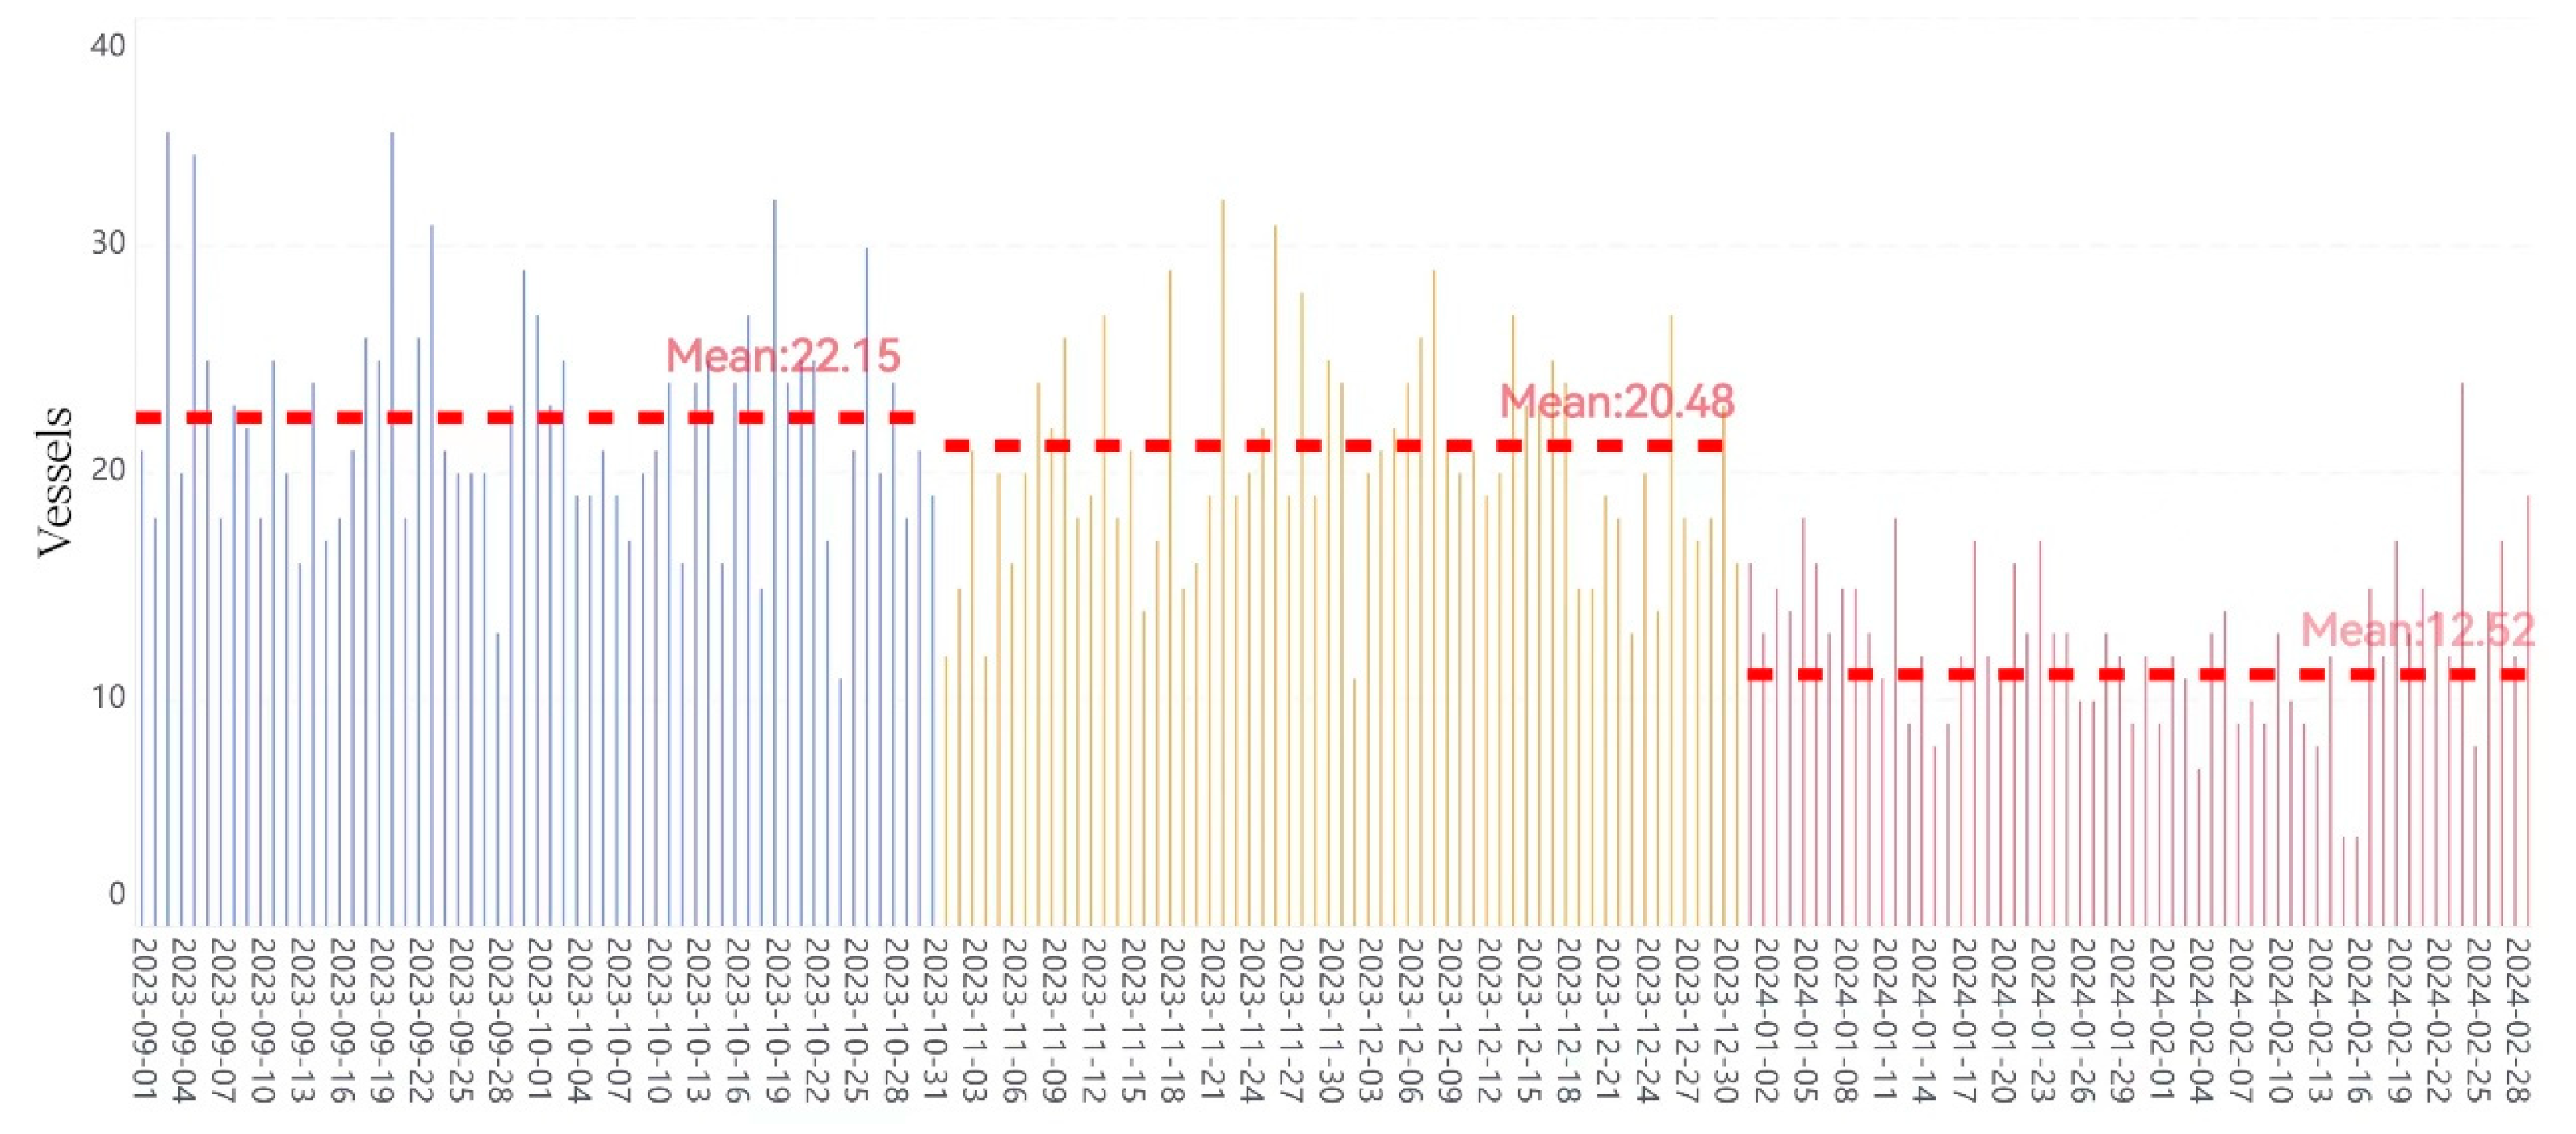
Vessels departing from the major oil-producing countries in the Middle East, such as Saudi Arabia, Iraq, and the United Arab Emirates, have destinations in European countries as well as North America. After the outbreak of the Israeli–Palestinian conflict, due to the Houthis’ control over the Red Sea area, vessels had to choose to detour, which, to some extent, had an impact on the sea transportation of oil and goods from the Middle East to Europe and North America. The north part of the Red Sea is the Suez Canal, and the south part of the Red Sea is the Bab-el-Mandeb Strait. Before the Houthi movement attacked the area, about 12% of global cargo and about 10% of global crude oil sea transportation routes crossed the Suez Canal. Due to the threat of the Houthi movement, some vessels chose to detour through the Cape of Good Hope in Africa, avoiding the Red Sea area, resulting in a significant extension of routes. Taking the shipping from the Port of London in the UK to the Mumbai Port in India as an example, compared with the route through the Suez Canal, the distance of the route through the Cape of Good Hope increases by about 7000 KM, and the time increases by about 10 days. The increase in shipping distance leads to an increase in fuel costs, time costs, and potential insurance costs (the maritime transportation insurance cost consists of the value of the goods and the premium rate, among which the premium rate is determined according to the type of goods, mode of transportation, transportation route, and other factors. In the case where the type of goods and mode of transportation are fixed, changes in the transportation route will lead to changes in the cost of maritime transportation insurance), resulting in an increase in shipping costs. Figure 6 shows the vessel traffic flow in the Bab-el-Mandeb Strait before and after the conflict. It can be seen that from the outbreak of the Israeli–Palestinian conflict in October 2023 to the blockade of the Bab-el-Mandeb Strait in December 2023, the vessel traffic flow in the area shows a significant downward trend. It means that global sea transportation has inevitably been impacted by the conflict.
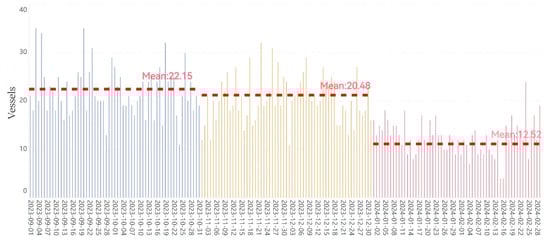
Figure 6.
Chart of the change in the vessel traffic flow in the Bab-al-Mande Strait before and after the Israeli–Palestinian conflict.
By conducting statistical tests on the difference in shipping times before and after the conflict, it can be found that about 3.1% of the global vessels were affected and about 1.3% of vessels experienced a significant increase in shipping costs, with global sea transportation costs of large tankers increasing by about 0.0825%. It can be expected that as the conflict escalates, the number of affected vessels may continue to increase, and the shipping costs will also continue to rise.
In this paper, the shipping cost increment of a country (or region) is defined as the sum of the shipping cost increment of the vessels related to the country, and Table 3 lists the five countries (or regions) with the largest shipping cost increments.
Table 3.
Top 5 countries (or regions) most affected by the Israeli–Palestinian conflict.
Western European countries such as Germany and France import a large part of their oil from the Middle East, and the geographical location of these countries determines that most of their oil transportation routes pass through the Suez Canal. So, they are greatly affected by the Israeli–Palestinian conflict. Moreover, due to the long distance of these routes, even if only a small number of vessels change their routes, the total shipping time will increase significantly. As a major party to the conflict, multiple ports in Israel have been severely affected. Ashkelon Port is even temporarily closed, and its geographical location is extremely important for oil transportation. Meanwhile, the impact of the conflict has forced a number of vessels related to Israel to detour to avoid passing through the conflict zone. Taking the oil transportation route from the Abu Dhabi Port to Israel as an example, the shipping time of the original route is about 265.16 h, but after the detour, the shipping time increases by about 996.41 h. Part of Spain’s oil imports also come from Middle East countries, but due to its distance from the Middle East, only a small amount of oil is transported through the Suez Canal. In recent years, Spain has started to import more oil from Latin America to meet its domestic energy demand, so the increase in shipping time of vessels related to Spain is relatively low. For the United States, there are multiple different shipping routes available for sea transportation between it and the Middle East, so even if the Suez Canal route is temporarily closed, its overall shipping costs are not seriously affected. In addition, China has many sources of oil imports, among which Russia has long been an important source of oil imports for China. Through the transportation of China–Russia crude oil pipelines, oil can be stably supplied from Russia to China. Therefore, the increase in shipping costs in China is relatively small.
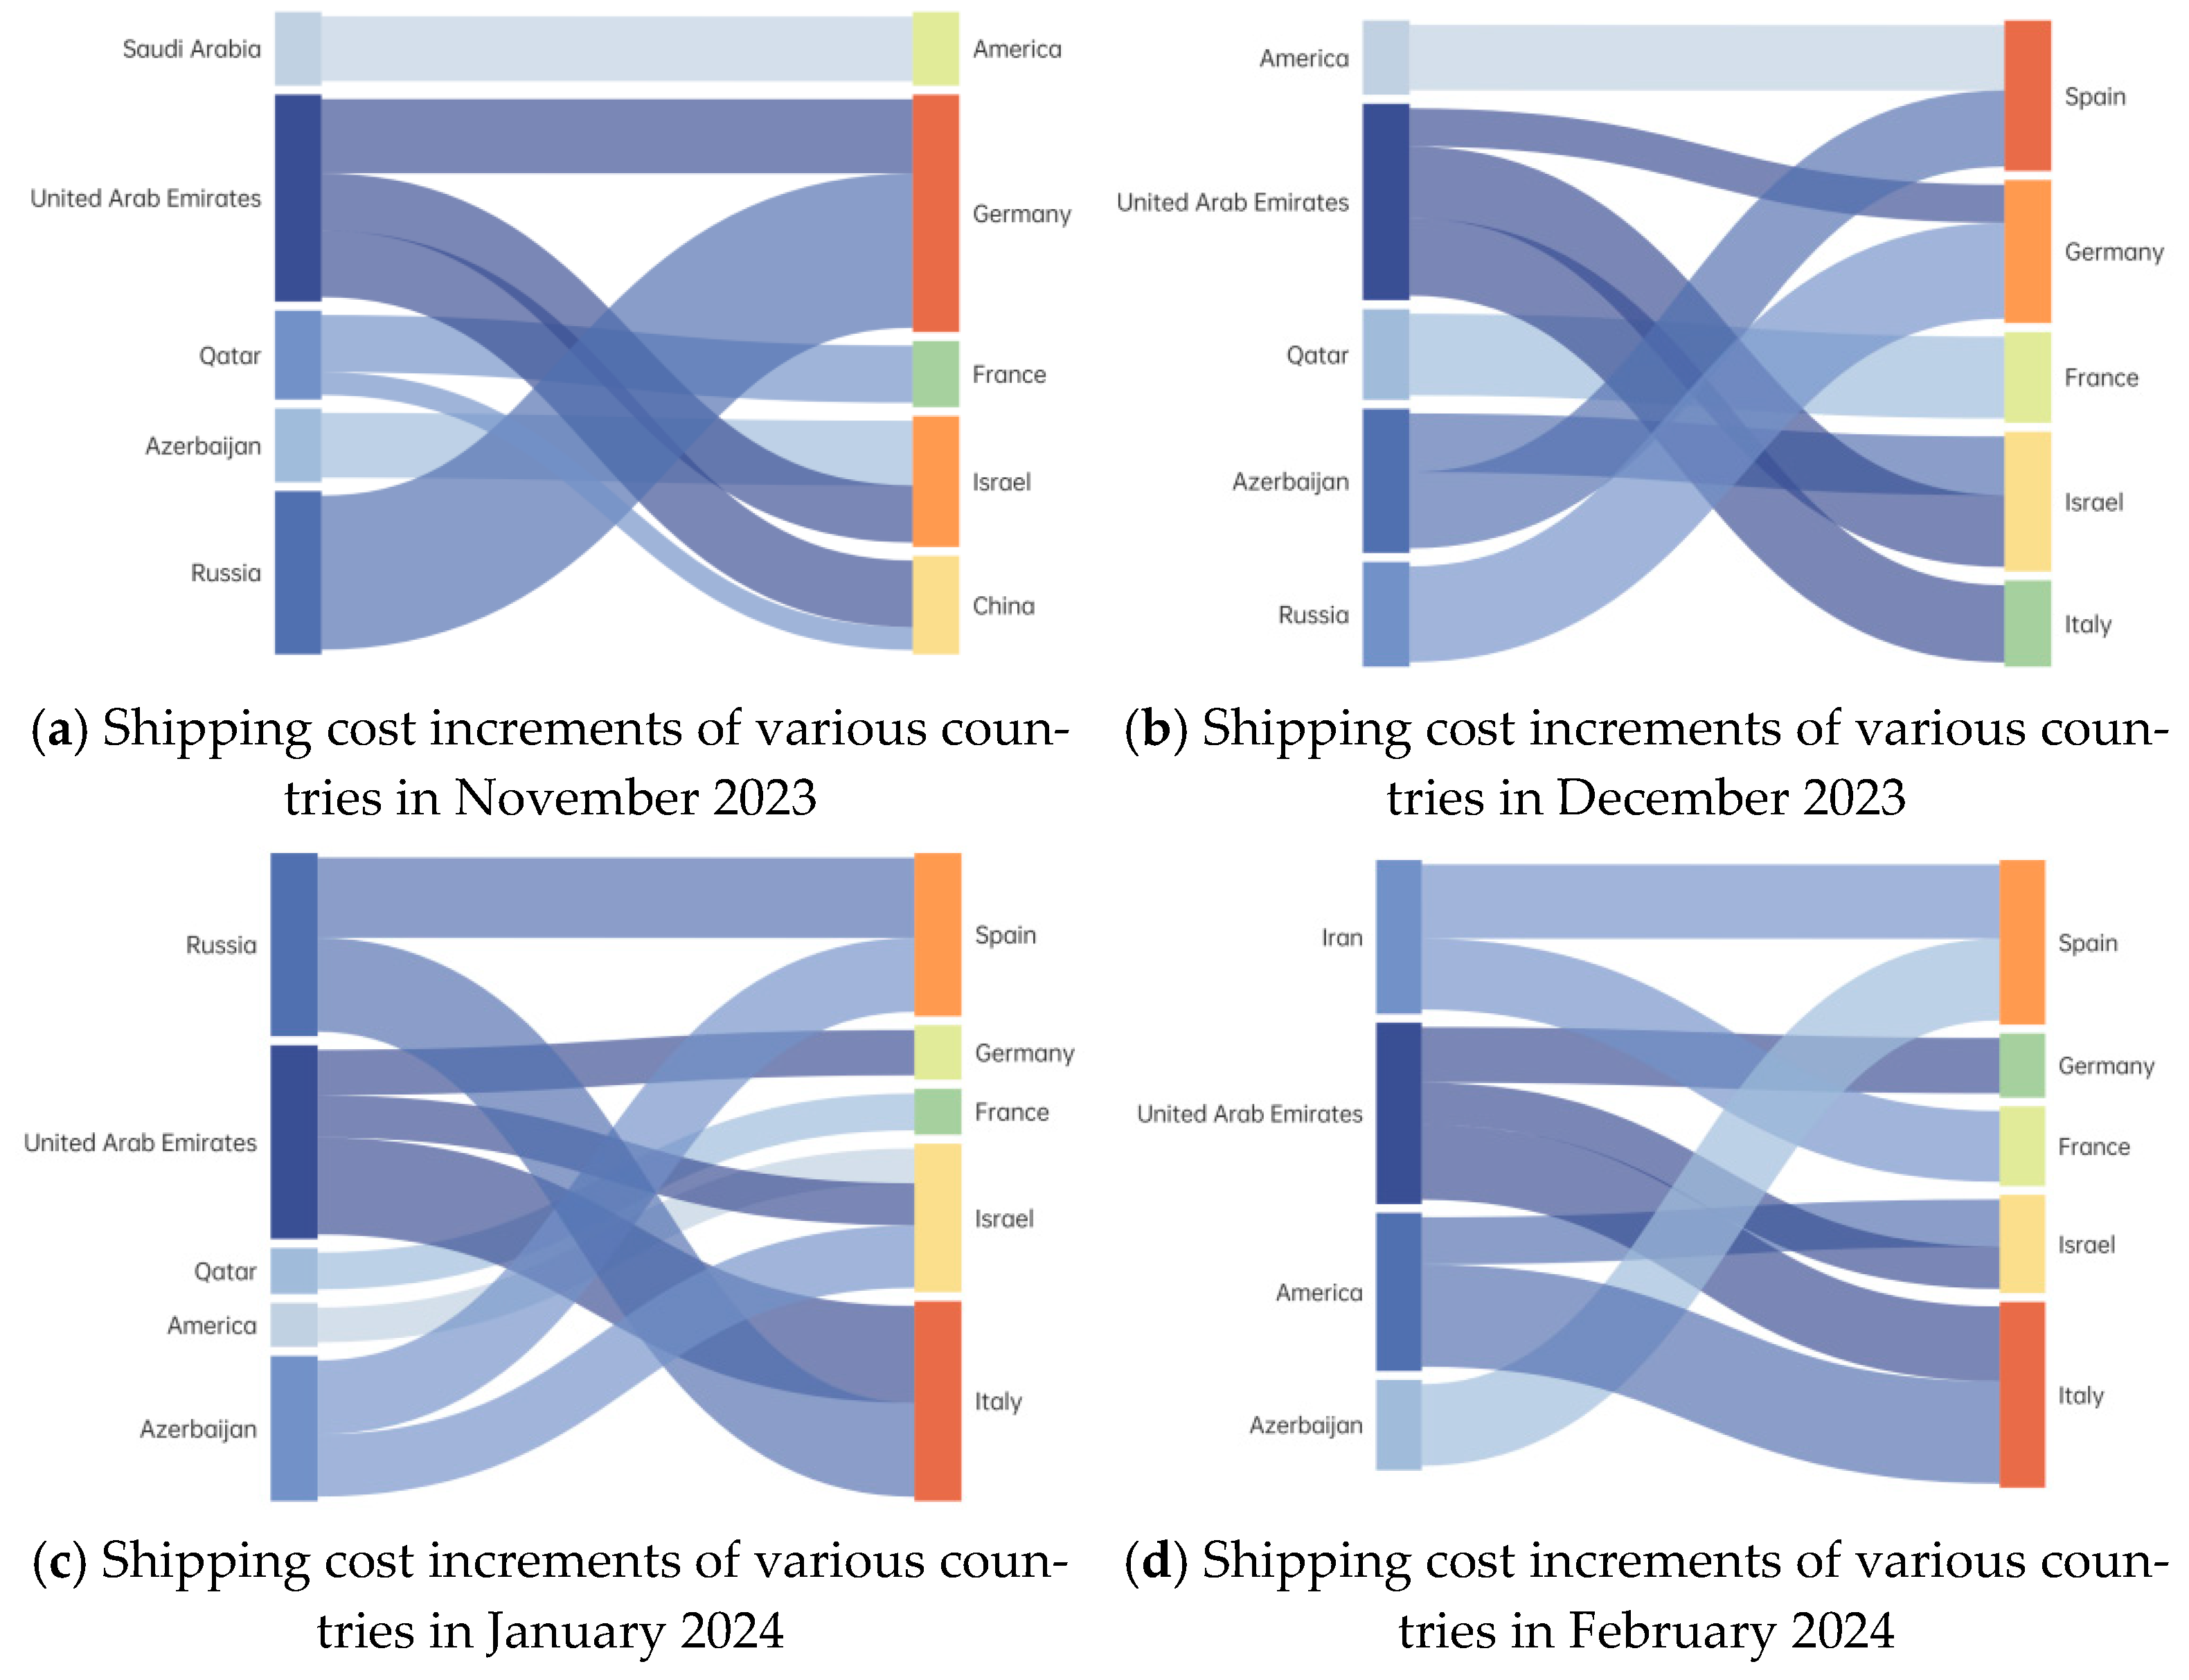
Furthermore, taking several important oil exporting countries as examples, our paper draws Sankey diagrams of the shipping cost increments of various countries, as shown in Figure 7. On the left side of the Sankey diagram are the oil exporting countries, and on the right side are the oil importing countries. The different colors of the streamlines indicate the oil trade between different countries. The wider the streamline, the larger the cost increment of oil trade between countries, which can reflect the impact of shipping costs between countries to a certain extent.
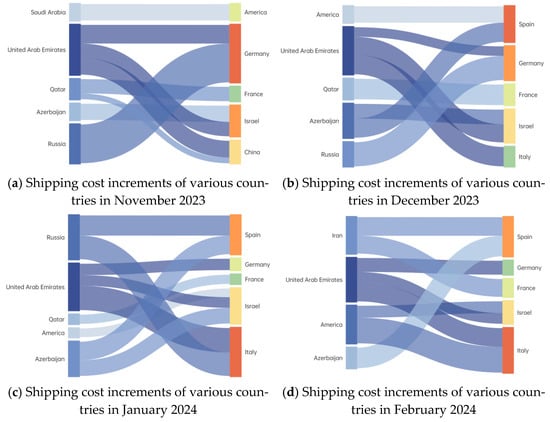
Figure 7.
Sankey diagrams of the shipping cost increments of various countries.
5.2. Changes in Sea Traffic Flow
As the conflict continues to escalate, a number of shipping companies, including Maersk Line (Copenhagen, Denmark), Hapag Lloyd (Hamburg, Germany), CMA CGM SHIPPING CO., LTD. (Marseille, France), British Petroleum (London, British), and Mediterranean Shipping Company S.A (Geneva, Switzerland), announced in December 2023 that they would suspend all their vessel routes passing through the Red Sea, resulting in a sharp decline in vessel traffic flow in the Red Sea. In this paper, the routes with significantly reduced vessel traffic flow and their corresponding departure port countries are extracted, which mainly include the United Arab Emirates, Kuwait, Saudi Arabia, Iraq, America, and Russia. Figure 8 shows the monthly changes in the number of crude oil export vessels by country, with the horizontal axis representing the month and the vertical axis representing the country, the square table represents the number of crude oil export tankers from a certain country in the current month, with colors ranging from red to blue and from dark to light indicating the number of vessels from high to low. The total number of crude oil tankers in the current month is displayed in text form in the corresponding table to provide a more intuitive display of the changes in the number of tankers. It can be found from the figure that with November 2023 as the time node, many countries, especially important international crude oil exporters, have seen a significant decline in the number of crude oil export vessels before and after the conflict. However, the change in vessel traffic flow does not always tend to decrease. For example, the number of tankers in countries such as America has increased, which may be related to the policies of crude oil import and export.
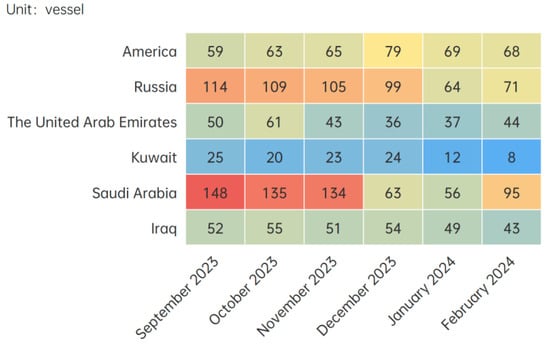
Figure 8.
Changes in crude oil transportation flow of various countries from September 2023 to February 2024.
6. Discussion and Conclusions
Our paper mainly studies the impact of the Israeli–Palestinian conflict on global sea transportation (taking tankers as an example). Compared with other modes of transportation, sea transportation, especially global sea transportation, has a long time span and is easily affected by factors such as the geographical environment and national policies. To assess quantitatively the impact of the specific event of the Israeli–Palestinian conflict, we take large oil tankers as the research object and take the complete trajectory of each vessel as the statistical unit. The shipping time and distance of a vessel largely depend on the origin and destination. Therefore, this paper firstly extracts the vessel trajectory, the port of departure, and the port of destination from the AIS trajectory data. Then, we take one month as the statistical period to try to cover the complete time period of the vessel trajectories while minimizing the impact of other short-term factors, such as extreme weather and climate change. Finally, in order to calculate the detour and the changes in shipping cost caused by the Israeli–Palestinian conflict, this paper uses the shipping time instead of the shipping distance to represent the shipping cost, so as to eliminate the impact of cost changes caused by uncertain factors such as transportation modes, insurance costs, and tank cleaning. Based on this hypothesis, any significant change in shipping costs before and after the conflict can be considered to be caused by conflict-induced vessel detours, rather than other uncertainties.
Under the influence of the Israeli–Palestinian conflict, port closures and route blockades force vessels to choose longer routes, resulting in changes in shipping distances and increased shipping costs. For international shipping, detours occur mostly for vessels passing through the Red Sea area. This paper quantitatively evaluates the impact of the conflict on tanker transportation in each country and makes statistical evaluations of the tanker transportation in each country by month, and then analyzes the changes in sea transportation traffic flow caused by the conflict. At the same time, the cumulative increment of the shipping cost for each country is calculated through the shipping cost increment index to assess the economic losses suffered by countries in the shipping field due to conflicts. The research results of this paper indicate that after the Israeli–Palestinian conflict, the overall volume of oil tanker transportation between ports worldwide has shown a downward trend, especially for vessels passing through the Red Sea area, which is greatly affected by the conflict, and the number of oil tankers passing through the Red Sea area has greatly decreased. The conflict has led to a reduction of at least 11.3% in the number of large oil tankers worldwide, and many countries, especially major international crude oil exporters, have been affected to some extent by the conflict. As the conflict continues to escalate, some tanker owners are concerned that vessels may be attacked in the relevant waters, which may further reduce or suspend shipping activities in some regions, resulting in a sustained decrease in global oil tanker traffic flow. About 1.3% of the world’s vessels have experienced significant increases in shipping costs, with the escalation of conflicts forcing 6.23% of the world’s vessels to detour, and the shipping cost of large tankers increasing by about 0.0825% worldwide. The shipping cost for each country depends mainly on its geographical location and its degree of dependence on oil trade with other countries. Therefore, some countries, especially those in the Middle East, as major oil exporters in the world, have significantly reduced the number of vessels exporting crude oil. Asia is a major oil importer in the Middle East, and the risk of oil supply disruptions caused by the Israeli–Palestinian conflict may directly affect Asia’s energy security. It can be predicted that as long as the Red Sea area is at risk, the vessels passing through this area are likely to have to choose detours, which may lead to port congestion, lack of capacity, freight rise, delays in crude oil transportation schedules, and other chain reactions, and may further affect the stability of the crude oil supply chain and the supply and demand balance of the global crude oil market.
Compared with other methods, our research focuses on vessel detours caused by the conflict, and from the perspective of global sea crude oil transportation, takes large oil tankers as the object to study the impact of emergencies on global crude oil trade. We have analyzed the increase in shipping distance, shipping costs, and changes in traffic flow caused by vessel detours, which can, to some extent, evaluate the impact of the conflict on the economies and crude oil trade of various countries, reveal the impact of the conflict on global oil tanker transportation, and provide support for further analysis of crude oil import and export, as well as maritime crude oil trade. Meanwhile, the analytical idea of our paper has a certain universality and can be extended to the analysis of the sea transportation and maritime trade of various types of vessels.
However, there are still limitations in this study. On one hand, this study only considers the impact of shipping distance on shipping costs, but in actual shipping, the ocean-going consumption of tankers may lead to the increase in temporary costs such as tank purging, inerting, washing, and so on, and changes in insurance costs will also have an impact on shipping costs. However, the changes in these uncertainty factors will not be reflected in the AIS data attributes. On the other hand, although our paper tries to avoid the influence of other factors on vessel detours, in fact, there are still some changes in routes that are not caused by the conflict, resulting in slight fluctuations between the results of our paper and the actual values. In the future, we will consider various factors that result in changes in shipping costs, and further improve the shipping cost calculation model, so as to more accurately analyze the global sea crude oil transportation.
Author Contributions
Conceptualization, X.C. and B.Z.; methodology, B.Z. and H.L.; validation, R.Z. and L.Y.; investigation, Y.Z.; resources, R.Z.; writing—original draft preparation, B.Z.; writing—review and editing, X.C.; visualization, B.Z.; supervision, X.C.; project administration, L.Y. All authors have read and agreed to the published version of the manuscript.
Funding
This research is supported by the National Natural Science Foundation of China under Grant number of 42371438.
Institutional Review Board Statement
Not applicable.
Informed Consent Statement
Not applicable.
Data Availability Statement
The data supporting the findings of this study can be found at https://www.shipdt.com/shipdt/#/index/dataApi, which accessed on 20 May 2024.
Conflicts of Interest
The authors declare no conflicts of interest.
References
- Wang, C.; Kim, Y.S.; Kim, C.Y. Causality between logistics infrastructure and economic development in china. Transp. Policy 2021, 100, 49–58. [Google Scholar] [CrossRef]
- Cariou, P.; Lindstad, E.; Jia, H. The impact of an eu maritime emissions trading system on oil trades. Transp. Res. Part D Transp. Environ. 2021, 99, 102992. [Google Scholar] [CrossRef]
- Lagouvardou, S.; Psaraftis, H. Implications of the eu emissions trading system (ets) on european container routes: A carbon leakage case study. Marit. Transp. Res. 2022, 3, 100059. [Google Scholar] [CrossRef]
- Kotzampasakis, M. Intercontinental shipping in the european union emissions trading system: A ‘fifty-fifty’ alignment with the law of the sea and international climate law? Rev. Eur. Comp. Int. Environ. Law 2023, 32, 29–43. [Google Scholar] [CrossRef]
- Keppler, N. Russian invasion left mariners in harm’s way, stressed supply chains. Prof. Mar. J. Marit. Ind. 2022, 38–41. Available online: https://professionalmariner.com/article/russian-invasion-left-mariners-in-harms-way-stressed-supply-chains/ (accessed on 20 May 2024).
- Li, B.; Lu, J.; Li, J. Evaluation of Emergency Guarantee Capability of Key Nodes in Maritime Transport Based on Improved Copula Function. J. Transp. Syst. Eng. Inf. Technol. 2020, 20, 20–25. [Google Scholar]
- Tang, Y.S.; Yu, G.Q.; Liu, S.X. Reshaping the global security order and China’s security governance in the Middle East. West Asia Afr. 2024, 4, 3-26159. [Google Scholar]
- Shu, X.L.; Zou, J.T. Implications of the Israeli-Palestinian conflict for the Middle East and international energy security. Technol. Econ. Petrochem. 2024, 40, 1–5. [Google Scholar]
- Wang, L.C.; Li, S.X.; Gao, Z.G. The Israeli-Palestinian conflict: Causes, Effects, and Solutions. Int. Econ. Rev. 2024, 1, 1–22. [Google Scholar]
- Cho, J.; Hong, E.K.; Yoo, J.; Cheong, I. The impact of global protectionism on port logistics demand. Sustainability 2020, 12, 1444. [Google Scholar] [CrossRef]
- Ilyas, M.; Jin, Z.; Ullah, I.; Abbas, A.J. Investigation of Risk Factors Influencing the Safety of Maritime Containers Supply Chain: In the Period of the Pandemic. Sustainability 2023, 15, 8803. [Google Scholar] [CrossRef]
- Shepard, J.U.; Pratson, L.F. Maritime piracy in the strait of hormuz and implications of energy export security. Energy Policy 2020, 140, 111379. [Google Scholar] [CrossRef]
- Steinbach, S. The Russia-Ukraine war and global trade reallocations. Econ. Lett. 2023, 226, 111075. [Google Scholar] [CrossRef]
- Yang, Y.; Sun, L. Vulnerability analysis of maritime silk road shipping network under port emergencies. Int. J. Shipp. Transp. Logist. 2023, 18, 364–382. [Google Scholar] [CrossRef]
- To, W.M.; Lee, P.K.C. The COVID-19 impacts on air transport—A case study of Hong Kong. Int. J. Shipp. Transp. Logist. IJSTL 2023, 16, 256–276. [Google Scholar] [CrossRef]
- Sercan, E. The early impact of the Russia-Ukraine war on seaborne trade and transportation in the Black Sea. Int. J. Shipp. Transp. Logist. IJSTL 2024, 18, 305–323. [Google Scholar]
- Fang, Z.; Yu, H.; Lu, F.; Feng, M.; Huang, M. Maritime network dynamics before and after international events. Acta Geogr. Sin. 2018, 28, 20. [Google Scholar] [CrossRef]
- Peng, P.; Poon, J.P.; Cheng, S.; Dong, Y.; Yang, Y.; Lu, F. Container port influence: A spatial diffusion analysis of global transshipments. Marit. Policy Manag. 2023, 1–18. [Google Scholar] [CrossRef]
- Zaman, M.B.; Kobayashi, E.; Wakabayashi, N.; Maimun, A. Risk of navigation for marine traffic in the malacca strait using AIS. Procedia Earth Planet. Sci. 2015, 14, 33–40. [Google Scholar] [CrossRef]
- Fan, H.W.; Chang, Z.; Wang, C. Influencing factors and evaluation of safety resilience of key nodes in maritime transportation channels. J. Shanghai Marit. Univ. 2022, 43, 40–46. [Google Scholar]
- Chu, H.C. Crude oil prices, container freight rates and dry bulk freight rates: Are there short-term and long-term effects on seaborne exports from taiwan? Int. J. Shipp. Transp. Logist. IJSTL 2023, 17, 451–468. [Google Scholar]
- Xiao, Z.; Fu, X.; Zhang, L.; Goh, R.S.M. Traffic pattern mining and forecasting technologies in maritime traffic service networks: A comprehensive survey. IEEE Trans. Intell. Transp. Syst. 2020, 21, 1796–1825. [Google Scholar] [CrossRef]
- Varlamis, I.; Kontopoulos, I.; Tserpes, K.; Etemad, M.; Soares, A.; Matwin, S. Building navigation networks from multi-vessel trajectory data. Geoinformatica 2021, 25, 69–97. [Google Scholar] [CrossRef]
- Zhang, Y.Q.; Shi, G.Y.; Li, S. Compression algorithm of ship trajectory based on online directed acyclic graph. J. Traffic Transp. Eng. 2020, 20, 227–236. [Google Scholar]
- Wu, L.; Xu, Y.; Wang, Q.; Wang, F.; Xu, Z. Mapping Global Shipping Density from AIS Data. J. Navig. 2017, 70, 67–81. [Google Scholar] [CrossRef]
- Han, P.; Yang, X. Big data-driven automatic generation of ship route planning in complex maritime environments. Acta Oceanol. Sin. Engl. Ed. 2020, 39, 113–120. [Google Scholar] [CrossRef]
- Xiao, F.; Ligteringen, H.; Gulijk, C.V.; Ale, B. Comparison study on ais data of ship traffic behavior. Ocean Eng. 2015, 95, 84–93. [Google Scholar] [CrossRef]
- Liu, B.; Souza, E.N.D.; Matwin, S.; Sydow, M. Knowledge-based clustering of ship trajectories using density-based approach. In Proceedings of the 2014 IEEE International Conference on Big Data (Big Data), Washington, DC, USA, 27–30 October 2014. [Google Scholar]
- Ng, H.K.; Chen, N.Y. Aircraft trajectory optimization and contrails avoidance in the presence of winds. J. Guid. Control Dyn. 2010, 34, 1577–1583. [Google Scholar]


Disclaimer/Publisher’s Note: The statements, opinions and data contained in all publications are solely those of the individual author(s) and contributor(s) and not of MDPI and/or the editor(s). MDPI and/or the editor(s) disclaim responsibility for any injury to people or property resulting from any ideas, methods, instructions or products referred to in the content. |
© 2025 by the authors. Licensee MDPI, Basel, Switzerland. This article is an open access article distributed under the terms and conditions of the Creative Commons Attribution (CC BY) license (https://creativecommons.org/licenses/by/4.0/).