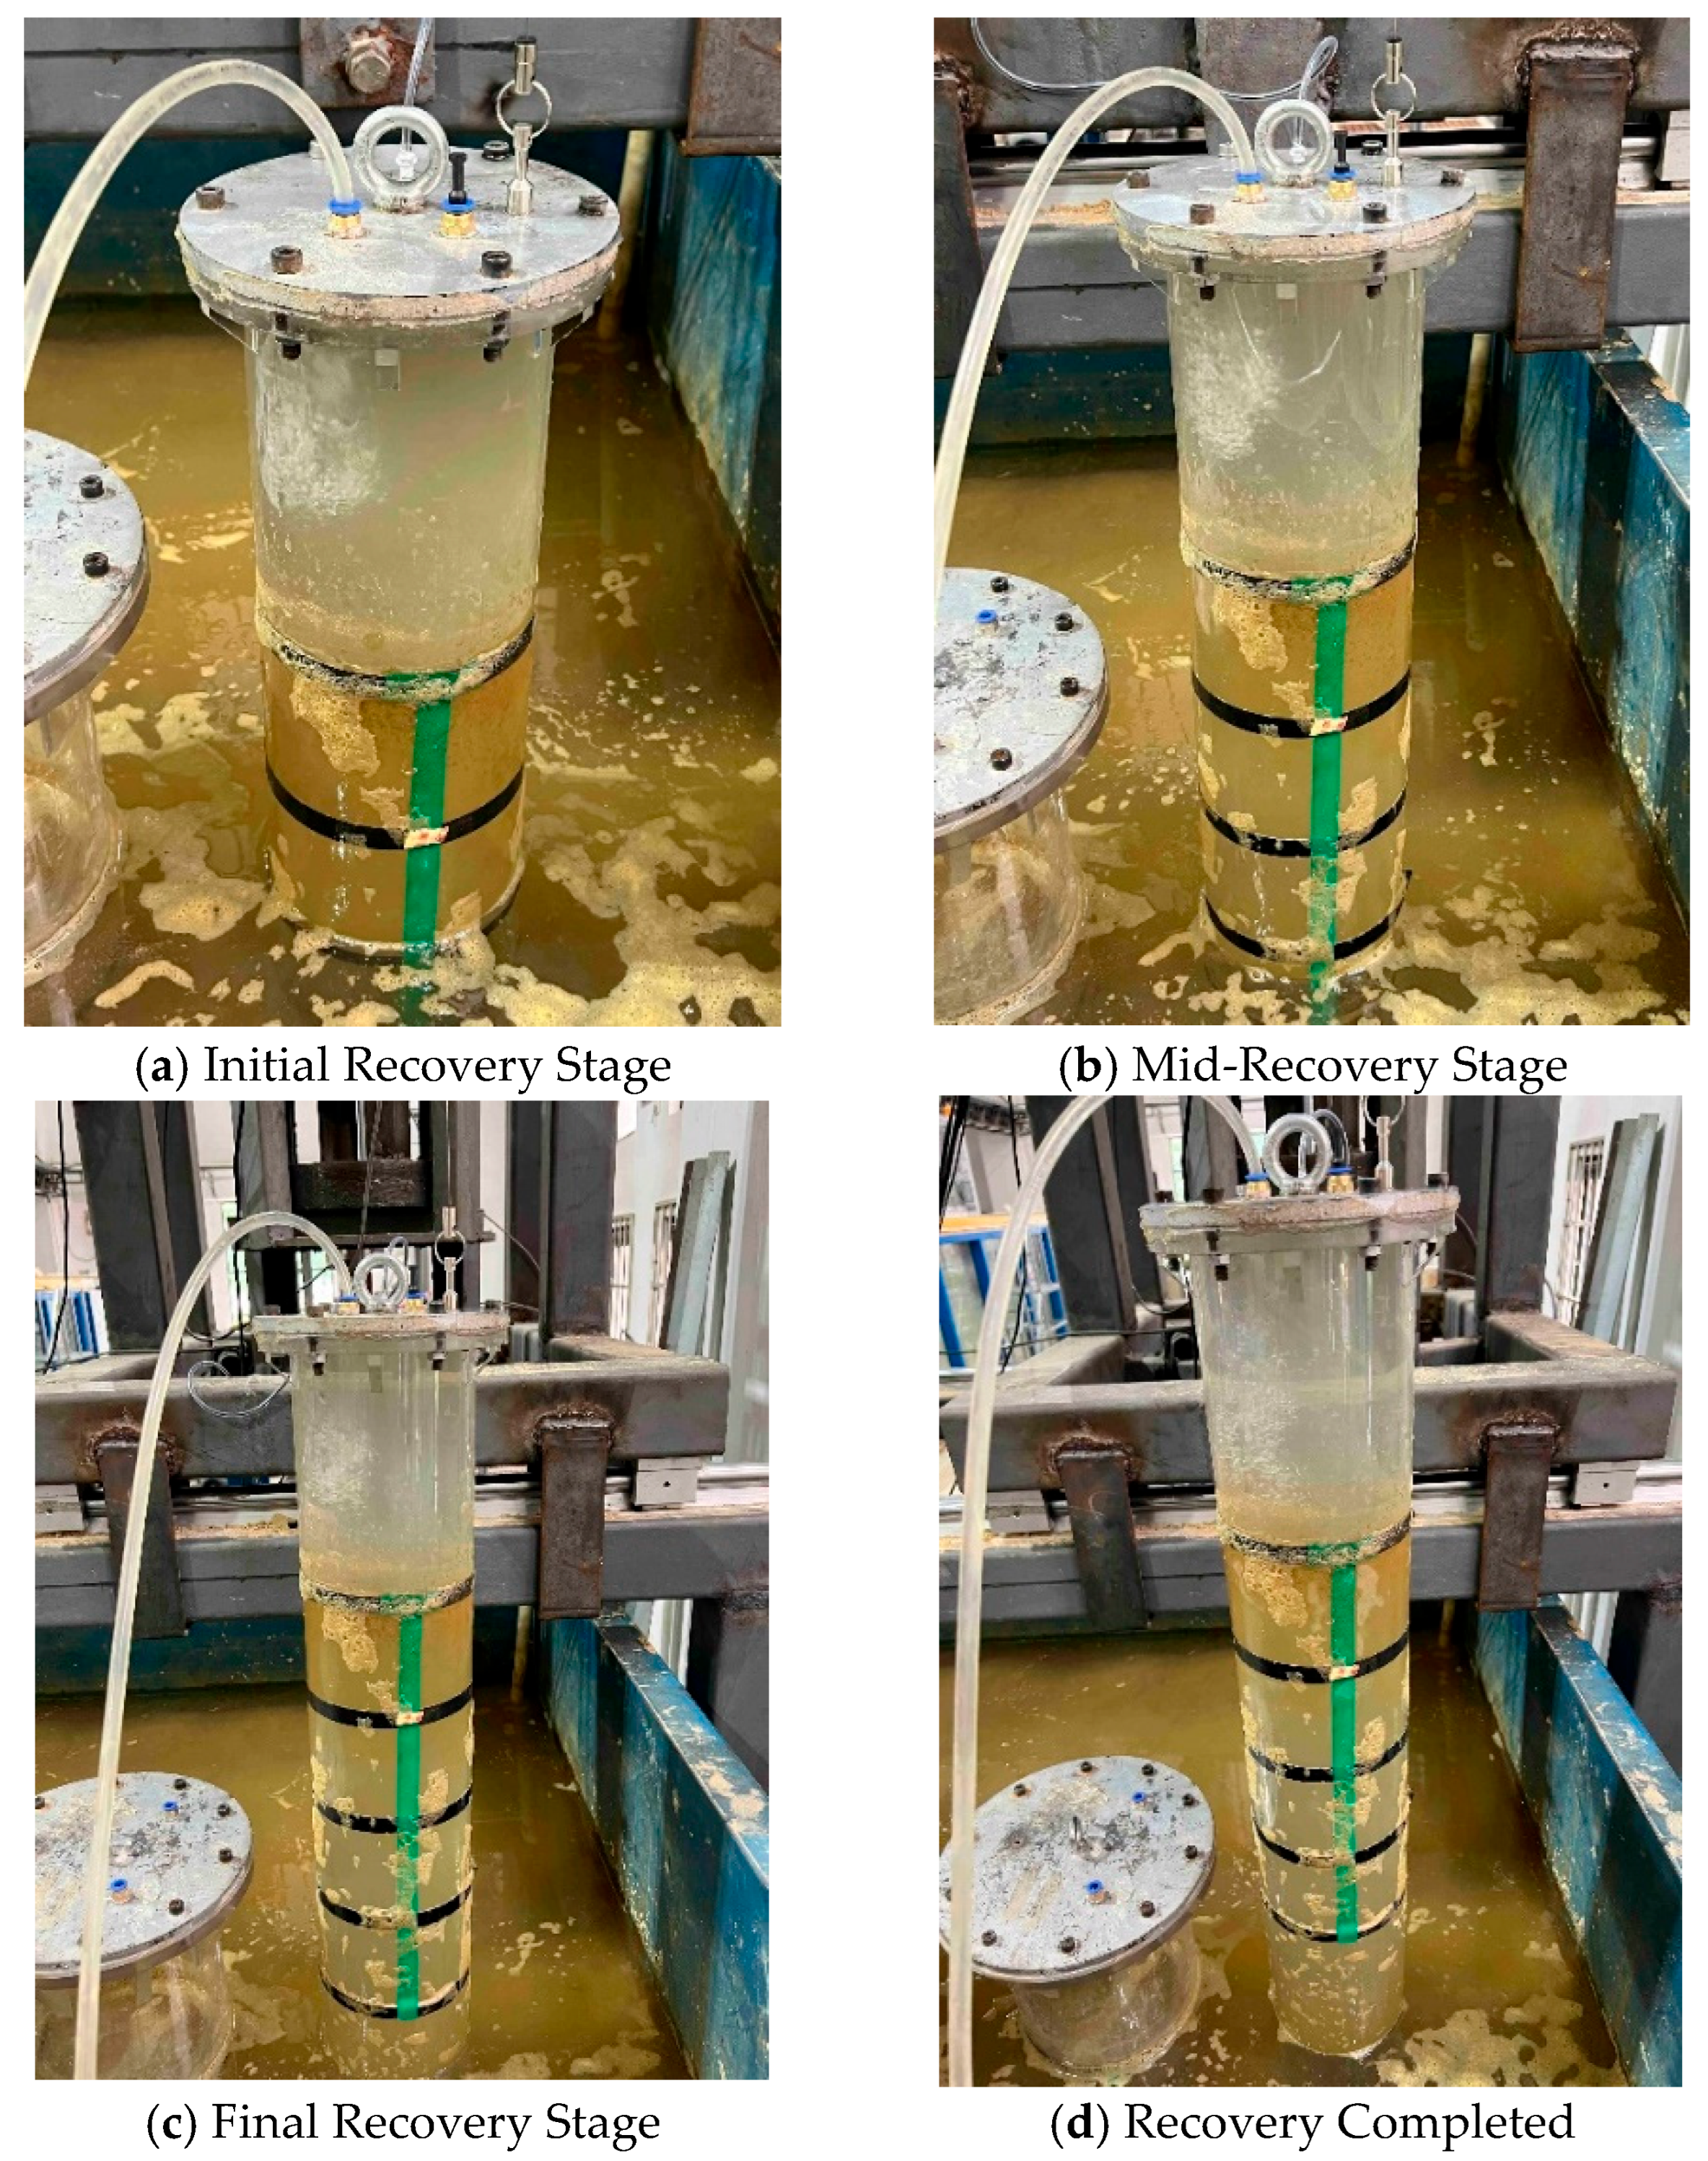
3.2.1. Analysis of Pile Recovery Curves Under Different Water Injection Rates
To investigate the influence of water injection rate on the pile recovery process, a comparative study was conducted using pile models with diameters of 25 cm and 20 cm and an embedment depth of 80 cm. Six distinct test conditions with different injection rates were designed: Slow (4 L/min), Medium (6 L/min), Fast (8 L/min), Slow-to-Fast (4 L/min switching to 8 L/min midway), Fast-to-Slow (8 L/min switching to 4 L/min midway), and Medium rate with a mid-process dwell (a 5 min pause during recovery at 6 L/min). The analysis was divided into four groups for comparison: Group 1 compared the Slow, Medium, and Fast rates; Group 2 compared the Slow-to-Fast sequence with the constant Slow rate; Group 3 compared the Fast-to-Slow sequence with the constant Fast rate; and Group 4 compared the Medium rate with a dwell to the constant Medium rate.
As shown in
Figure 10a, all three test conditions exhibited a distinct initial phase of pressure accumulation, with the rate of pressure increase becoming significantly steeper at higher injection rates. Under the slow injection condition (4 L/min), the pressure rose gradually from near 0 kPa to a peak of approximately 36.1 kPa, with the turning point toward pressure decrease occurring after more than 30 s. In contrast, under the medium injection rate (6 L/min), the pressure peaked at 50.4 kPa within about 9.7 s. All three curves subsequently entered a pressure release phase marked by a rapid decline. The rate of pressure drop was influenced by the injection rate: the fast injection case showed the steepest descent slope and prominent short-term fluctuations, whereas the slow injection condition exhibited a smoother and more stable pressure decrease with minimal fluctuations, indicating superior process stability.
Figure 10b shows that higher water injection rates lead to earlier initiation of pile uplift and faster lifting speeds. Under the fast injection condition (8 L/min), the pile was uplifted from 0 to 0.60 m within approximately 300 s, compared to about 500 s for the medium-rate condition. In contrast, the slow injection condition required nearly 2600 s to approach the maximum displacement (~0.65 m). The displacement–time curves for the fast and medium-rate conditions maintained a relatively constant slope, suggesting an approximately uniform uplift process. The slow injection curve, however, displayed a “gentle initially then steep later” trend, indicative of a gradual overcoming of frictional resistance before transitioning to steady uplift.
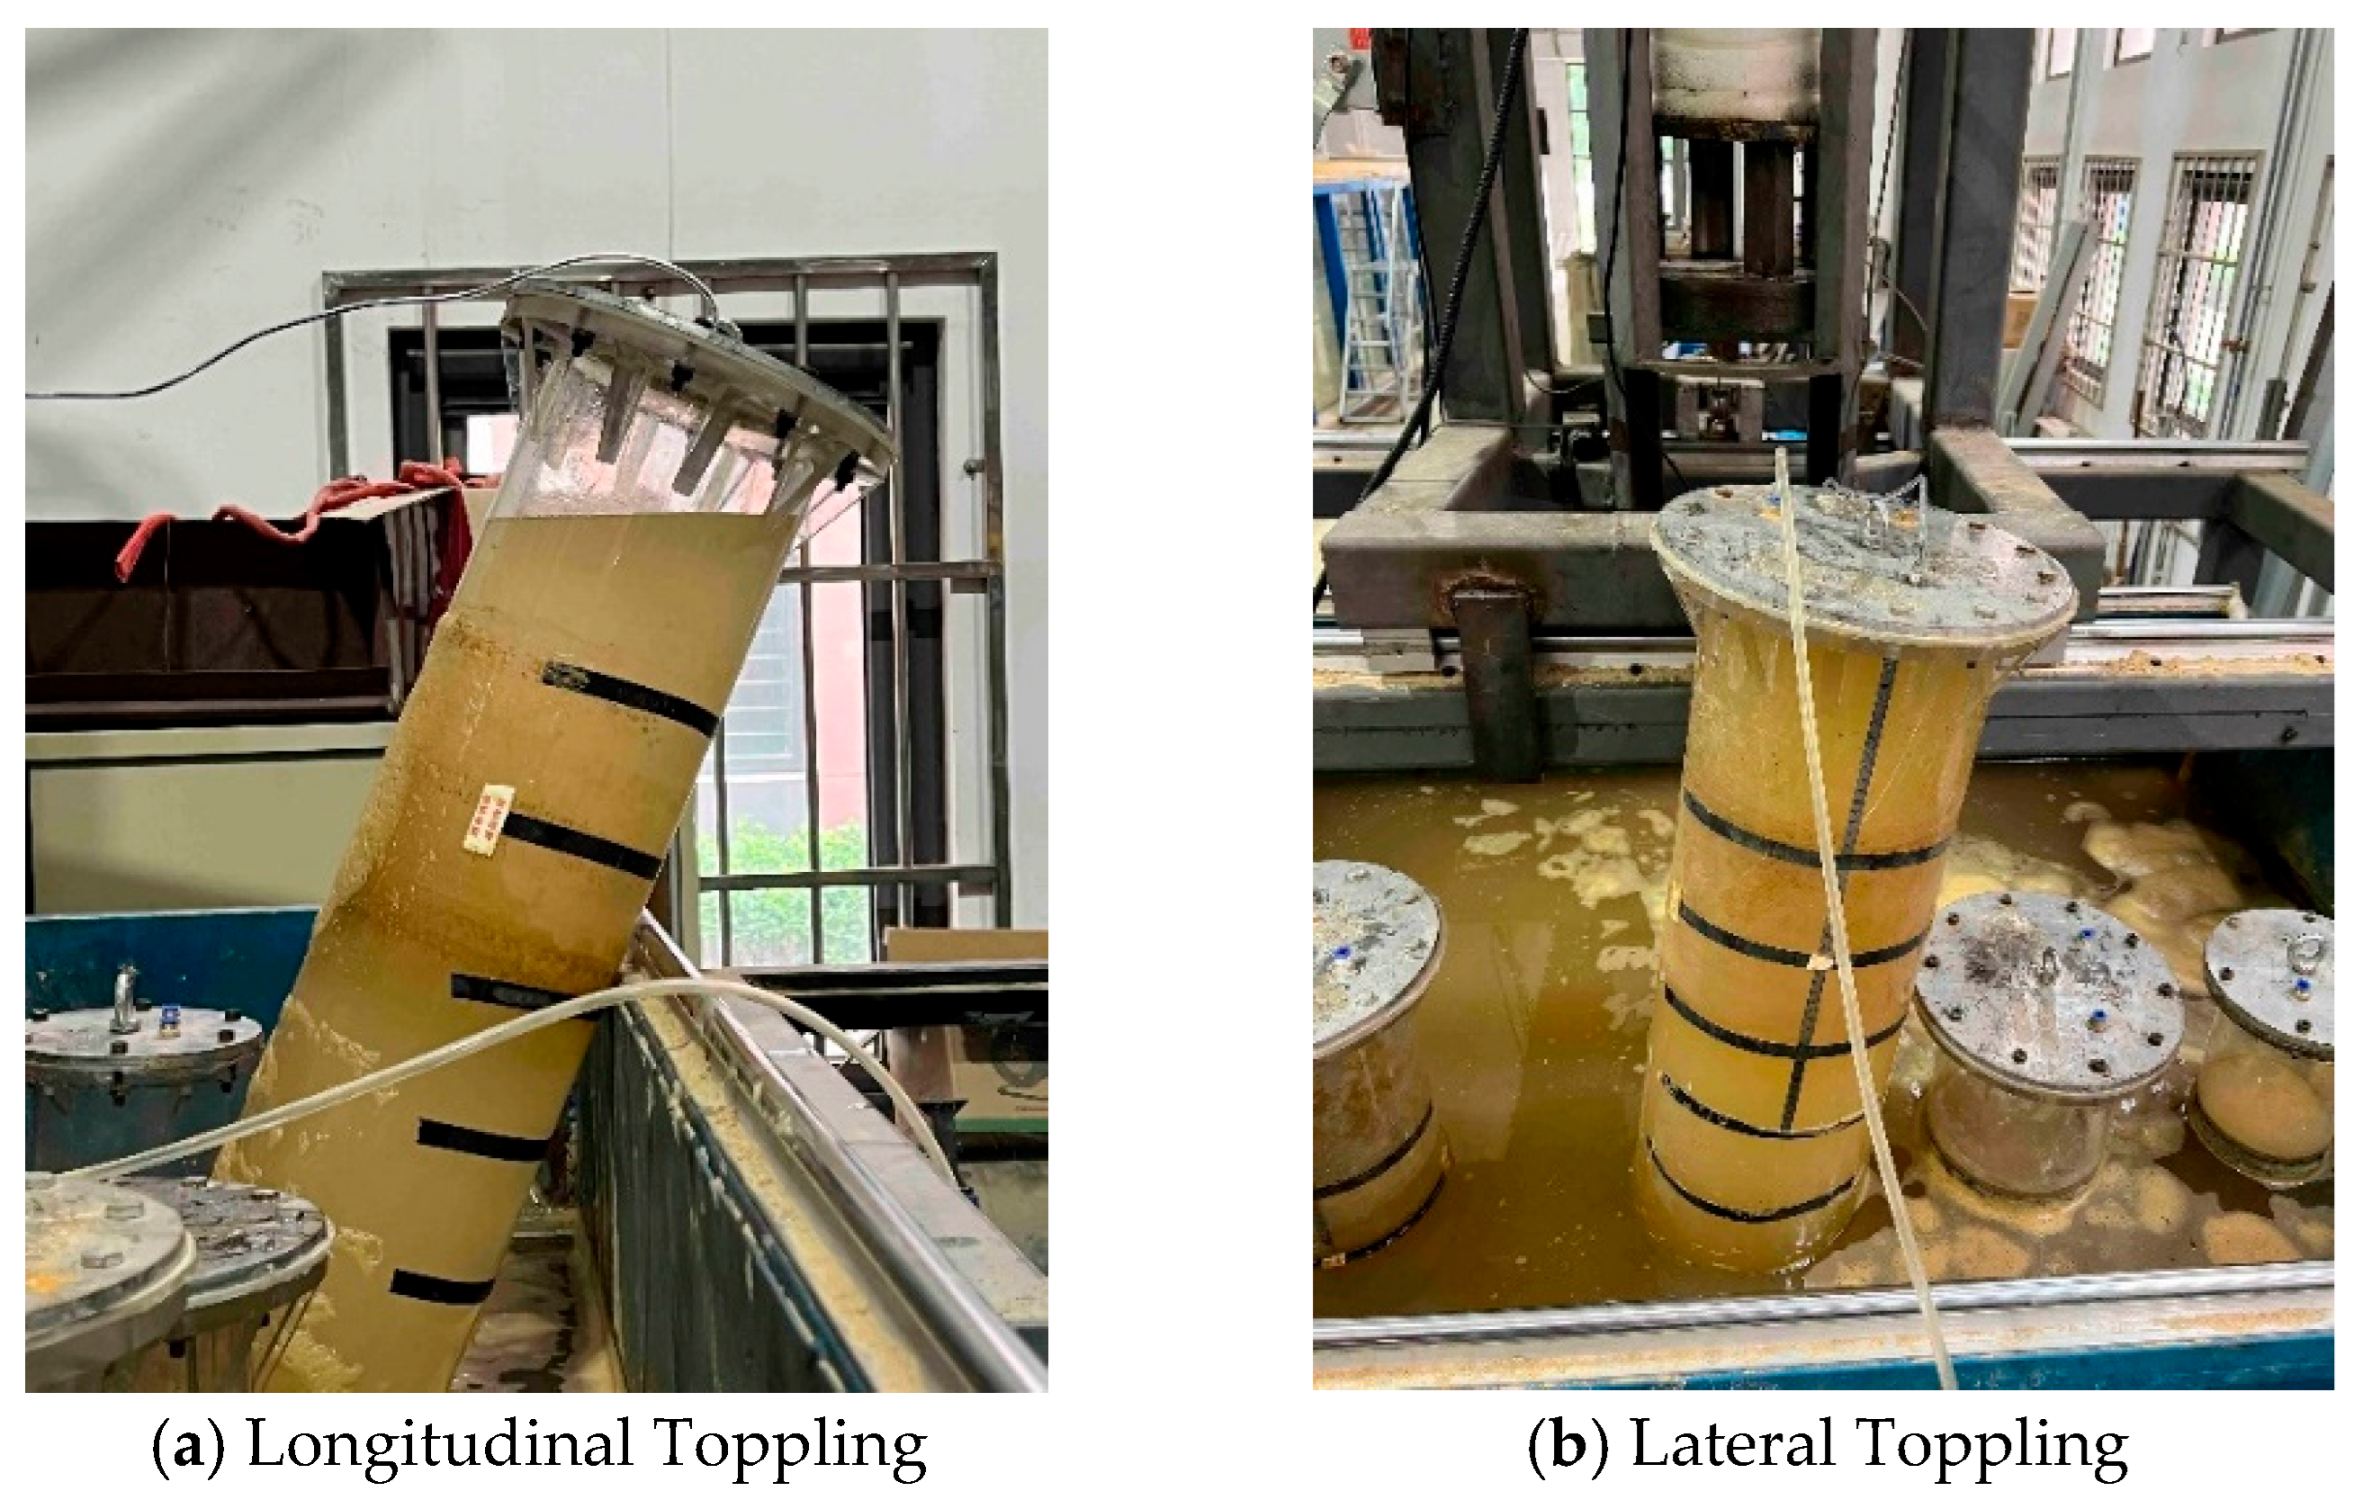
In both the medium (6 L/min) and fast (8 L/min) injection rate scenarios, the displacement-time curves revealed a particular phenomenon: as the pile approached full extraction (at around 0.60 m displacement), the curve showed a brief decline, indicating a slight rebound of the pile. Although the rebound magnitude was only about 12 cm, this drop remained noticeable towards the final stage of recovery. From an engineering perspective, the following measures are recommended for the near-complete extraction phase: avoid abruptly stopping water injection or allowing a sudden pressure release; maintain an adequate safety pressure margin to ensure the uplift force remains sufficient; incorporate guiding structures to prevent instability induced by eccentric disturbances; and if rebound occurs, analyze pressure data to determine whether it originates from pile–soil interaction or equipment-induced disturbance.
As shown in
Figure 10c, all three curves show a decrease in pile pressure with increasing uplift displacement. As the uplift force progressively overcomes and dissipates the shaft resistance, the pressure declines accordingly. The fast injection case exhibits the steepest initial slope in the pressure–displacement curve, reflecting the most pronounced pressure release per unit displacement and highly effective pressure-driven movement—though this is accompanied by more significant fluctuations. In contrast, the slow injection condition shows the gentlest decline slope and a smooth, continuous curve, suggesting a more gradual and stable uplift process with continuous mechanical response. Notably, the three curves converge at approximately 0.50 m displacement, indicating that beyond this point, the pile approaches full separation from the soil matrix. Thereafter, the uplift force acts consistently across all cases, and further displacement is governed primarily by gravitational and inertial forces.
As shown in
Figure 11, the pressure–time curves during the initial phase all exhibited a distinct linear increase under the three injection rates. Consistent with the injection rates, the fast-injection case (8 L/min) showed a rapid pressure rise from 0 to approximately 48.9 kPa in about 12 s. The medium-rate case (6 L/min) reached a similar pressure level in approximately 9.7 s, whereas the slow-injection case (4 L/min) required about 43 s to exceed the critical pressure of 36.1 kPa. In all cases, an abrupt change in slope occurred within the critical pressure range (approximately 36–55 kPa), indicating the onset of pile movement.
Figure 11b shows that the displacement–time curves are characterized by “delayed initiation followed by accelerated ascent.” Under all test conditions, pile displacement remained negligible in the initial phase, indicating that the critical shaft resistance had not yet been overcome. Once the initiation pressure was reached, displacement increased rapidly. The fast-injection case (8 L/min) exhibited noticeable displacement at approximately 35 s, reflecting a high uplift velocity after initiation. The medium-rate case (6 L/min) began moving at around 52 s, with a moderate curve slope, while the slow-injection case (4 L/min) showed delayed initiation until nearly 85 s, together with the lowest uplift rate. These results confirm that although the injection rate does not significantly alter the magnitude of the initiation pressure, it substantially affects the time required to reach the initiation condition.
As shown in
Figure 11c, the pressure–displacement curves further illustrate the relationship between the release of uplift force and the upward movement of the pile. All three curves follow a characteristic pattern of “sharp rise followed by an abrupt drop”: as pressure gradually increases to approximately 36–50 kPa, pile initiation occurs with corresponding displacement, after which the pressure decreases rapidly. This behavior indicates that the uplift force generated by water injection into the sealed pile accumulates until a critical threshold is reached, triggering upward movement accompanied by an instantaneous release of internal pressure.
As shown in
Figure 12a, under the slow-rate condition, the internal pile pressure increased gradually from 0 kPa, reaching a peak of approximately 35 kPa at around 17 s, followed by a sustained and gradual decline, eventually stabilizing between 5 and 10 kPa toward the end of the test. The pressure curve remained overall smooth with minor fluctuations, indicating good stability. In the “slow-to-fast” condition, the initial pressure trend closely mirrored that of the slow-rate case, confirming similar mechanical states prior to the rate change. However, after the injection rate was increased at 480 s, the pressure curve exhibited a sharp transition, accompanied by significantly enhanced fluctuations and a markedly accelerated decline rate. The pressure dropped below 10 kPa by approximately 550 s, descending much faster than in the slow-rate condition. This phenomenon indicates that a sudden increase in the injection rate after the uplift force has overcome the frictional resistance leads to a rapid release of the internal pressure and an intensified pile response, thereby increasing the disturbance within the system.
As shown in
Figure 12b, the displacement-time curve under the slow-rate condition demonstrates a steady, nearly linear increase in pile displacement over time. The total displacement reached approximately 0.48 m at 1000 s, with no abrupt jumps or stagnation observed throughout the process. In contrast, the “slow-to-fast” condition exhibited a similar displacement trend during the initial phase, reaching about 0.25 m at approximately 480 s. Following the switch in injection rate, the pile experienced a jump-like ascent, where the displacement rapidly increased to about 0.52 m within a short period. This was immediately followed by a distinct rebound, causing the displacement curve to exhibit discontinuous behavior with a notable drop. This indicates that an abrupt increase in injection rate, while accelerating the release of uplift force, also introduces significant instability to the pile. This instability is likely attributable to factors such as local scouring at the pile base or eccentric uplift during the accelerated phase. The ‘jump-like’ ascent following the sudden increase in injection rate is a critical instability mode. This behavior is likely triggered by progressive seepage failure at the pile–soil interface. The rapid injection does not allow for steady-state seepage to establish. Instead, it induces a high hydraulic gradient that exceeds the critical value for soil stability, leading to liquefaction or piping in the surrounding sand. This sudden loss of shear strength over a significant portion of the pile shaft results in a dramatic, uncontrolled release of the stored strain energy in the system, propelling the pile upward in a jump.
As shown in
Figure 12c, under the slow-rate condition, a stable inverse correlation between pressure and displacement is observed, characterized by a gradual pressure decrease accompanied by a progressive displacement increase. This pattern represents a typical recovery process driven by uplift force. In contrast, the “slow-to-fast” condition exhibits an abrupt change in the pressure-displacement relationship at the transition point. Here, the pressure decreases rapidly within a short duration while the displacement demonstrates significant fluctuations. The curve reveals a distinct rebound segment, presenting an anomalous phenomenon where a single displacement value corresponds to multiple pressure readings. This indicates the emergence of a non-monotonic response segment in the system following the rate transition. Although pile uplift initiates, the internal water pressure fails to decrease in a synchronized and stable manner, resulting in an unstable recovery system.
As shown in
Figure 13a, significant differences emerge in the pressure-time curves between the two test conditions during the final recovery phase. Within the selected late-stage recovery interval, the internal pressure in the slow-rate condition was maintained within a range of 16–20 kPa, exhibiting a gradual decline with minor fluctuations and stable pressure release. In contrast, following the increase in injection rate to 8 L/min in the slow-to-fast condition, the pressure demonstrated an accelerated release trend, rapidly decreasing from 17 kPa to below 11 kPa between 500 and 540 s. The rate of pressure decline was markedly higher than that observed in the slow-rate condition. Concurrently, the pressure oscillation frequency increased, and the waveforms became more frequent, indicating that the pile was subjected to a state of heightened disturbance. This further demonstrates that a sudden increase in injection rate accelerates the release of internal water pressure, leading to destabilization of the pile.
As shown in
Figure 13b, the displacement increased much more rapidly under the slow-to-fast condition than under the slow-rate condition. Between 500 and 580 s, displacement in the slow-rate condition rose only marginally from about 0.28 m to 0.32 m. In contrast, under the slow-to-fast condition, it surged from approximately 0.30 m to 0.50 m, nearly doubling within the same period. The displacement curve maintained a stable upward trend without abrupt jumps or rebounds, indicating that despite intensified pressure fluctuations after the rate increase, the pile continued to ascend steadily. This suggests that increasing the injection rate accelerates recovery, though at the expense of system stability.
Figure 13c shows that during the late recovery stage, both test conditions exhibited broadly similar pressure–displacement trends, characterized by a progressive pressure decrease with increasing displacement. The magnitude and slope of this decrease were largely consistent, indicating continuous release of uplift force and stable pile ascent during this phase. Neither curve showed significant abrupt changes, hysteresis, or nonlinear rebound. Subtle local differences were nevertheless observed: in the slow-to-fast condition, the pressure was slightly lower and decreased more smoothly, with only minor fluctuations, suggesting a more concentrated release of uplift force and quicker dissipation of internal pressure and disturbance energy after the rate increase. By contrast, the slow injection condition exhibited more pronounced and irregular high-frequency oscillations in pressure.
Notably, although the transition to fast injection initially induced considerable disturbance in pressure release, the system quickly re-entered a stable pressure release phase thereafter. Close examination of the pressure–displacement curves shows that their shapes became similar in the later stage, with the slow-to-fast condition even displaying slightly lower fluctuation amplitudes. This indicates that the pile regained mechanical equilibrium after a brief disturbance. Thus, the instability triggered by the abrupt injection rate change is transient and non-persistent. Provided that neither soil seepage failure nor pile instability occurs, the pressure–displacement relationship can maintain continuity through the final recovery stage.
As shown in
Figure 14a, under the fast-rate condition, the internal pile pressure rapidly increased to a peak value (approximately 40 kPa) during the initial phase, followed by significant fluctuations and a rapid pressure release. The pressure dropped below 0 kPa within 250 s, indicating a highly disturbed state characterized by unstable pressure release, which corresponds to the pile being rapidly uplifted and separated from the soil within a short duration. In contrast, the pressure-time curve of the “fast-to-slow” condition closely matched that of the fast-rate case in the early stage, with a slightly higher peak exceeding 50 kPa and a marginally slower initial release rate. However, after switching to the slow injection rate, the rate of pressure decline decreased noticeably. The overall pressure release process became more stable, with the pressure maintaining within a range of 10–15 kPa for an extended period. Furthermore, the amplitude of curve fluctuations reduced substantially, indicating that the pile entered a more controlled and stable uplift phase.
As illustrated in
Figure 14b, the displacement characteristics of both conditions during the initiation stage were similar, with the pile rapidly rising to approximately 0.3 m within 0–125 s. Subsequently, the recovery curves diverged significantly: in the fast-rate condition, the displacement curve exhibited a distinct rebound after reaching about 0.52 m. In the “fast-to-slow” condition, although the displacement growth rate slowed, it continued to increase steadily to approximately 0.46 m without any rebound, demonstrating well-controlled pile recovery. This indicates that a high injection rate can rapidly initiate pile uplift, but the associated rapid pressure release and fluid impact may easily lead to pile instability. Reducing the injection rate in the later stage provides an effective cushioning effect, prolonging the release process of the uplift force and thereby enhancing recovery stability. The rebound observed in the displacement-time curve as the pile nears full extraction (e.g.,
Figure 10b) indicates a momentary reversal of the net uplift force. This ‘pressure rebound’ mechanism can be explained by the inertial dynamics of the system and fluid–structure interaction. During rapid uplift, the pile’s momentum may momentarily carry it beyond the position where the uplift force and resistance are balanced. Subsequently, the internal pressure, which is rapidly decreasing due to the expanded chamber volume, becomes insufficient to support the pile’s weight and remaining friction, causing a slight downward settlement. Furthermore, a temporary vacuum or negative pressure can develop beneath the pile tip if water replenishment is delayed, pulling the pile slightly backward.
As shown in
Figure 14c, under the fast-rate condition, the pressure reached a peak of approximately 40 kPa and subsequently decreased rapidly with displacement. Although a relatively high fluctuation frequency was observed, the overall decreasing process remained monotonic and continuous without significant anomalous segments, indicating a strong linear correlation between pressure and displacement. In contrast, while the pressure release in the fast-to-slow condition was initially more gradual and the curve appeared smoother, abnormal pressure fluctuations emerged near the 0.4 m displacement point. These fluctuations manifested as distinct short-term peaks and troughs, disrupting the continuity of the curve. This phenomenon suggests that after the reduction in injection rate, the pile may have been subjected to disturbances such as local backflow of water at the pile base, which prevented effective release of hydraulic pressure beneath the pile and consequently caused pressure oscillations within the pile cavity.
As shown in
Figure 15a, under the fast-rate condition, the pile underwent rapid pressure release during the initial phase (approximately 120–160 s), followed by a gradual reduction that stabilized near 10 kPa. Although this stabilization was brief, pronounced fluctuations persisted afterward, with frequent oscillations indicating significant dynamic disturbance during high-rate recovery. In contrast, the fast-to-slow condition exhibited a notably smoother pressure release, especially after the injection rate was reduced to 4 L/min. The rate of pressure decline slowed markedly, and fluctuation amplitudes gradually diminished. Between 160 s and 220 s, the pressure decreased steadily and stabilized around 15 kPa, indicating that lowering the injection rate effectively mitigated late-stage disturbances and enhanced process stability.
As illustrated in
Figure 15b, under the fast-rate condition, the pile uplift velocity was high between 120 s and 160 s, with displacement increasing rapidly until it approached 0.55 m, after which the ascent rate slowed. However, due to dynamic disturbances and rapid pressure release, the recovery process appeared relatively unstable. The fast-to-slow condition displayed similar initial behavior, with a high displacement growth rate. When the displacement approached 0.3 m and the injection rate was switched to 4 L/min, the displacement growth rate decreased significantly. Subsequent displacement progression remained stable, without abrupt acceleration or stagnation, demonstrating that reducing the injection rate in the later phase resulted in a more controlled and stable uplift process.
As shown in
Figure 15c, under the fast-rate condition, pressure decreased rapidly with increasing displacement, accompanied by strong fluctuations with significant amplitude and oscillatory behavior. These fluctuations further confirm the presence of non-negligible dynamic disturbances during rapid pile recovery, such as localized effects at the pile base. In contrast, the pressure–displacement relationship in the fast-to-slow condition was more stable. Although pressure declined rapidly in the initial phase, the decrease became more gradual, and fluctuation amplitudes reduced substantially after the injection rate was lowered. This indicates improved synchronization between the release of the internal uplift force and pile displacement, leading to a more controlled and stable force-release process.
As shown in
Figure 16a, under the continuous medium-rate injection condition, the pressure increased rapidly to its maximum value (approximately 47 kPa) during the initial phase (0–25 s), then decreased at a relatively fast rate and stabilized by around 200 s, exhibiting a smooth declining trend. This indicates that continuous medium-rate injection enables rapid release of the uplift force while maintaining good pile stability with minimal pressure fluctuations. In contrast, under the medium-rate condition with a mid-process dwell—where water injection was interrupted for 5 min during the middle phase (approximately 100–400 s)—a noticeable pressure recovery was observed, suggesting that injection interruption destabilizes the uplift force release process.
As illustrated in
Figure 16b, pile displacement under the continuous medium-rate condition showed a relatively stable upward trend. The displacement increased rapidly in the initial phase, reaching approximately 0.49 m by 300 s, followed by a slight rebound. Overall, the uplift process demonstrated good stability with no significant disturbances. For the medium-rate condition with a mid-process dwell, displacement also increased rapidly initially but plateaued during the dwell period (approximately 100–400 s). After injection resumed, displacement continued to increase, although the final recovery displacement was slightly less than that achieved under continuous injection.
As shown in
Figure 16c, the pressure–displacement curve for the continuous medium-rate condition displays a gradual and relatively uniform pressure decrease with increasing displacement. The relationship remains stable throughout, showing a smooth negative correlation without significant abrupt changes. By contrast, the curve for the medium-rate condition with a mid-process dwell exhibits considerable fluctuations, including a distinct pressure rebound near the 0.2 m displacement point. This behavior is attributed to the interruption of water injection during the dwell period. The subsequent resumption of injection affected the pile’s uplift behavior, leading to a less stable pressure–displacement relationship than under continuous injection.
As shown in
Figure 17a, the pressure under the continuous medium-rate injection condition demonstrates a stable declining trend during the later recovery phase between approximately 150–200 s, decreasing from 20 kPa to about 10 kPa without significant fluctuations, indicating a stable recovery process. In contrast, the pressure variation in the medium-rate condition with a mid-process dwell was noticeably affected by the 5 min interruption. Following the dwell period, the pressure exhibited marked oscillations with values fluctuating considerably, ultimately dropping below 10 kPa.
Figure 17b illustrates that under the continuous medium-rate condition, the pile displacement initiated from approximately 0.2 m and gradually increased over time, reaching about 0.35 m at 200 s. The near-linear progression of displacement indicates a stable uplift process without significant rebound. The displacement pattern in the medium-rate condition with a mid-process dwell was generally similar to that observed under continuous injection.
As depicted in
Figure 17c, under the continuous medium-rate condition, the pressure gradually decreased with increasing displacement. Starting at approximately 18 kPa, the pressure declined steadily as displacement progressed. The consistent negative correlation between pressure and displacement throughout the process indicates stable release of the uplift force during water injection, with no substantial fluctuations occurring during pile uplift.
3.2.2. Analysis of Pile Recovery Curves Under Different Embedment Depths
To investigate the influence of embedment depth on the pile recovery process, tests were conducted under a medium-rate water injection condition of 6 L/min, with pile embedment depths set at 60 cm, 70 cm, and 80 cm, respectively. The pressure-time, displacement-time, and pressure-displacement curves from the recovery process were analyzed, as detailed below:
As shown in
Figure 18a, the internal pressure under all three embedment depths increased rapidly during the initial stage, followed by an overall declining trend, though differences were observed in both peak values and the subsequent pressure descent. Under the 80 cm embedment condition, the peak internal pressure reached approximately 82 kPa, with the descent phase lasting about 400 s and accompanied by noticeable fluctuations and disturbances. The 70 cm embedment condition yielded a peak pressure of about 48 kPa, exhibiting a relatively gentler decline and smaller fluctuation amplitude. The 60 cm embedment condition resulted in the lowest peak pressure, around 28 kPa, with the shortest descent duration and the most stable pressure release process. These characteristics are closely related to the internal pile structure and variations in recovery resistance. As water was injected through the top cap, the internal structure comprised, from top to bottom, a water column overlying a submerged sand layer. The applied water pressure initially acted on the upper part of the sand layer. At greater embedment depths, the thicker internal sand layer provided increased resistance to rapid water penetration and disturbance, promoting greater pressure accumulation in the water column and resulting in a sharper pressure rise and a higher peak value.
As shown in
Figure 18b, under the 60 cm embedment condition, the pile reached its maximum displacement of approximately 0.40 m at around 230 s, representing the shortest total recovery time and the highest uplift velocity. This indicates that shallowly embedded piles experience relatively lower uplift resistance, enabling the water-induced uplift force to effectively elevate the pile. A slight rebound was observed in the final stage, though its magnitude was limited. For the 70 cm embedment condition, the time required to reach maximum displacement increased to approximately 300 s, with the maximum displacement measuring about 0.49 m. Compared to the 60 cm condition, the uplift response was slower. A displacement rebound also occurred in the later phase, suggesting a brief secondary adjustment between the internal uplift force and soil resistance after initial equilibrium was attained. Under the 80 cm embedment condition, the uplift process required a considerably longer duration, with pressure release persisting for nearly 400 s and the maximum displacement reaching 0.61 m. The displacement rate gradually decreased during the later stage of ascent, demonstrating that deeply embedded piles are subject to more significant shaft friction and base suction, making it more difficult for the uplift force to rapidly mobilize the pile.
As shown in
Figure 18c, under the 60 cm embedment condition, the pressure-displacement curve exhibits a strong linear trend and relatively smooth progression. The pressure decreases steadily with increasing displacement, indicating strong synchronization between the release of the uplift force and the actual pile movement. The curve for the 70 cm embedment condition also shows a declining trend but demonstrates increased fluctuations during the middle and final stages. Particularly near the 0.4 m displacement point, the slope of pressure decrease slightly diminishes, with minor undulations appearing in certain displacement ranges, suggesting greater influence from resistance forces. The curve for the 80 cm embedment condition reveals a multi-stage characteristic of steep decline–fluctuation–stabilization–further descent. The initial phase shows rapid pressure reduction while the pile uplift response lags significantly, indicating that despite substantial release of uplift force, the pile’s movement is hindered by strong uplift resistance. During the middle to late stages, the curve displays plateau segments and high-frequency disturbances, reflecting considerable instability in the pile behavior.
Comparison of the three curves reveals that with increasing embedment depth, pressure and displacement exhibit a steeper negative correlation. This indicates reduced displacement generation per unit of pressure released, where the instantaneous effect of uplift force release translates less effectively into actual displacement. This phenomenon is particularly evident in the 80 cm embedment case, where pressure decrease substantially precedes displacement growth. Conversely, the pressure-displacement curve for the 60 cm condition approximates a straight line, demonstrating strong synchronization between uplift force release and displacement increase.
As shown in
Figure 19a, the internal pressure increased rapidly during the initial phase under all test conditions, with each pile reaching its respective peak value within a short time. The peak pressure exhibited a clear positive correlation with embedment depth: approximately 82 kPa for the 80 cm depth, 48 kPa for the 70 cm depth, and 28 kPa for the 60 cm depth. This trend indicates that greater embedment depth enhances the confinement of the internal sand column, impeding water penetration after top-injection and resulting in more significant pressure accumulation. After peaking, the pressure curves for all conditions displayed high-frequency fluctuations of varying intensity, reflecting an unstable dynamic adjustment process within the pile–soil system during initial recovery. The fluctuation range was largest for the 80 cm condition, varying between approximately 50 kPa and 70 kPa, whereas the 60 cm condition remained relatively stable, between 22 kPa and 26 kPa. These observations suggest that deeper embedment increases the susceptibility to sustained and intense negative pressure disturbances during initial recovery, indicating greater extraction resistance.
Figure 19b shows that the displacement–time curves for all three conditions exhibited approximately linear growth, though the rates varied with embedment depth. The 60 cm condition achieved the fastest recovery, reaching a displacement of 0.20 m within the first 100 s, compared to approximately 0.16 m for the 70 cm condition and 0.15 m for the 80 cm condition. This demonstrates that increased embedment depth enhances resistance to pile movement, delaying uplift initiation and reducing recovery efficiency. The slightly later initiation observed in the 70 cm condition may be attributed to a denser soil–pile interface specific to that test.
As illustrated in
Figure 19c, the pressure-displacement curves for all conditions demonstrated a negative correlation during the initial stage: as the pile was uplifted and displacement increased, the internal pressure gradually decreased. The 60 cm condition showed the gentlest pressure decline with minimal fluctuations, indicating that water could rapidly penetrate the soil layer in shallowly embedded piles to release pressure. In contrast, the 80 cm condition exhibited a steeper pressure decrease accompanied by significant disturbances, with the curve characterized by clustered peaks, suggesting a vigorous “adhesion-release” process between the pile and soil during initial uplift. The 70 cm condition displayed intermediate characteristics in both pressure decline magnitude and fluctuation frequency.
In summary, greater embedment depth requires overcoming stronger peripheral resistance during initial uplift, leading to more pronounced extraction disturbances. In contrast, shallowly embedded piles transition more readily into a stable recovery state, characterized by milder pressure variations and reduced fluctuations.
3.2.3. Analysis of Pile Recovery Curves Under Different Dwell Times
To investigate the influence of dwell time on the pile recovery process, a slow water injection rate of 4 L/min was selected. The recovery process under standard conditions was compared against a scenario where the pile was subjected to a 12 h dwell period prior to recovery. The pressure-time, displacement-time, and pressure-displacement curves from both conditions were analyzed, as detailed below:
As shown in
Figure 20a, both conditions exhibit a rapid pressure increase to a peak, followed by a continuous decay. The peak pressure was slightly higher for the 12 h dwell condition (approximately 37.5 kPa) than for the standard condition (36.1 kPa). During the early release phase, however, the pressure declined more steeply in the dwell condition, dropping from 30 kPa to 20 kPa around the 400 s mark, indicating more efficient pressure release. This disparity became more pronounced in the middle to late stages. After 1800 s, the pressure stabilized at around 15 kPa in the standard condition, while it decreased to approximately 11 kPa in the dwell condition, with a smoother decline and reduced fluctuations.
Figure 20b shows that the displacement increased steadily in the initial phase for both conditions before approaching a plateau, with differences in the final magnitude and growth rate. The total uplift displacement reached about 0.54 m for the dwell condition, compared to only 0.49 m for the standard condition—a difference of nearly 5 cm. The displacement rate was consistently higher in the dwell condition, demonstrating a clear advantage before 1200 s. This suggests that the pile–soil frictional or suction resistance was significantly weakened, allowing for more efficient conversion of the uplift force into displacement. Furthermore, the displacement curve for the dwell condition was smoother and more continuous, whereas the standard condition exhibited multiple plateaus after 1600 s, indicating persistent resistance in the final recovery stage.
The pressure-displacement relationship for both conditions, shown in
Figure 20c, displays a distinct negative correlation, confirming continuous pressure reduction during uplift. This relationship also reveals a segmented pattern. In the initial phase (displacement < 0.15 m), the pressure was lower under the dwell condition, suggesting higher pressure release efficiency after the prolonged dwell. In the later stage (displacement > 0.15 m), however, the pressure in the dwell condition exceeded that of the standard condition. This phenomenon can be explained by two competing mechanisms initiated during the dwell period: (1) the formation of fine seepage channels, which facilitated efficient water infiltration and pressure release at the start of injection, and (2) particle settlement and pore compaction in the upper and middle sand layers due to prolonged water presence, which increased soil strength and density. Consequently, although the initial drainage channels enhanced early-stage efficiency, the strengthened soil matrix and diminished water replenishment capacity in later stages generated greater resistance to pile recovery.
As shown in
Figure 21a, under the 12 h dwell condition, the internal pile pressure increased rapidly during the initial phase, reaching a peak value slightly higher than that under the standard condition. Subsequently, during the pressure release stage, the pressure curve exhibited higher-frequency fluctuations, with values varying between 20 and 38 kPa. In comparison, the standard condition showed a similar fluctuation frequency but a smaller amplitude, primarily within the 25–35 kPa range. This suggests that the dwell period promoted further sand consolidation, leading to a denser soil structure.
Figure 21b shows that under both conditions, pile displacement increased in a step-like manner over time, reflecting the intermittent uplift behavior induced by water injection. Notably, the displacement growth rate was significantly higher under the 12 h dwell condition. Within the first 200 s, displacement reached approximately 0.055 m in the dwell case, compared to only 0.027 m in the non-dwell case—an increase of about 103%. This indicates that the dwell period allowed sufficient time for water to form drainage channels through the sand. As a result, during initial injection, water could penetrate the soil more efficiently and reach the pile bottom, accelerating pressure release and facilitating faster uplift.
As illustrated in
Figure 21c, within the small initial displacement range (0–0.05 m), pressure fluctuations under the dwell condition were more intense, with frequent alternations between high and low amplitudes. However, the difference between the maximum and minimum pressure values did not differ significantly from that in the non-dwell condition, indicating a higher fluctuation frequency but a similar overall magnitude of disturbance.
3.2.4. Analysis of Pile Recovery Curves Under Different Cross-Sectional Dimensions
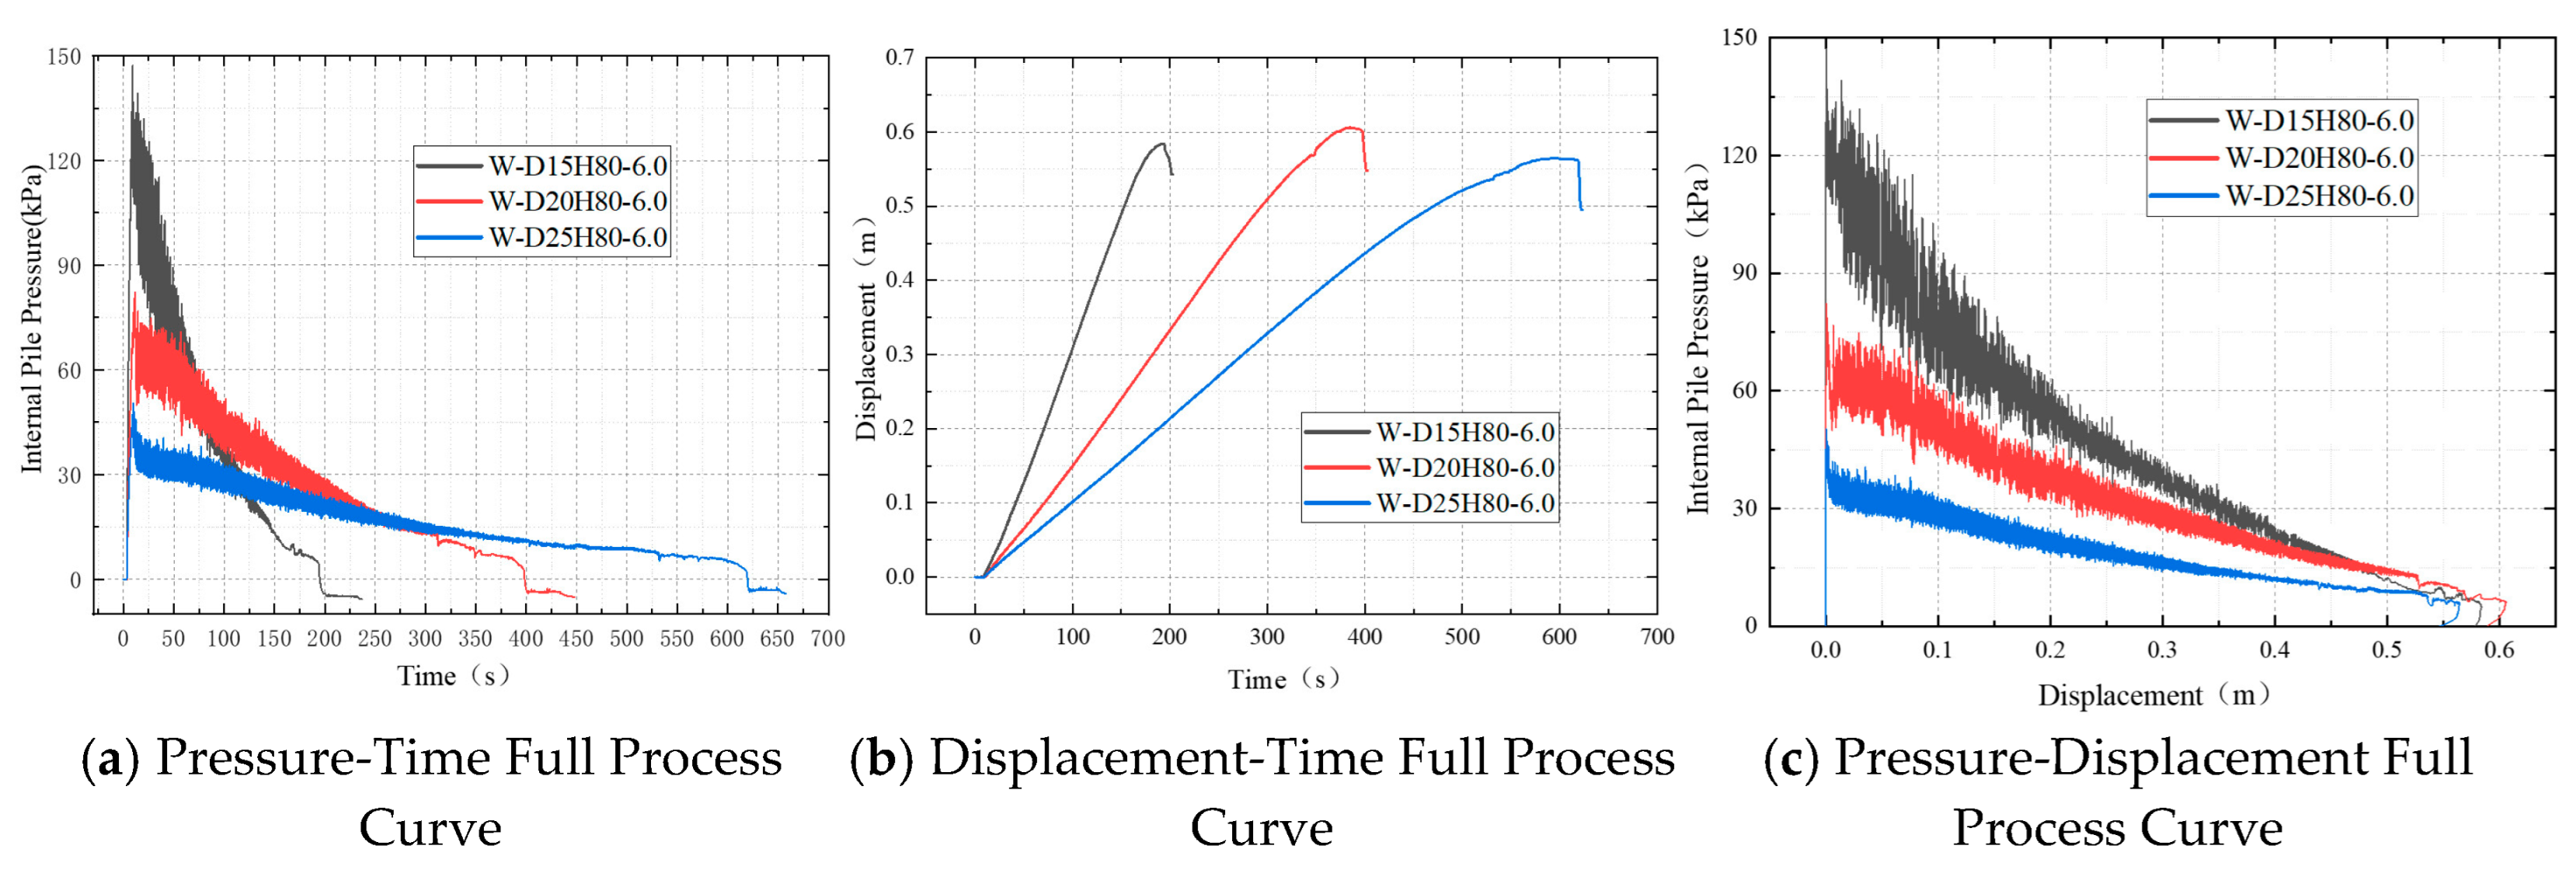
To investigate the influence of cross-sectional size on the pile recovery process, tests were conducted under a medium water injection rate of 6 L/min, using piles with diameters of 15 cm, 20 cm, and 25 cm. The pressure-time, displacement-time, and pressure-displacement curves from the recovery process were analyzed, as detailed below:
As shown in
Figure 22a, all three cross-sectional sizes reached their peak pressure rapidly during the initial recovery phase, with the peak value increasing significantly as the cross-sectional dimension decreased. The 15 cm diameter pile exhibited the highest peak pressure of approximately 147 kPa, followed by the 20 cm and 25 cm diameter piles at 82 kPa and 50 kPa, respectively. This trend indicates that smaller cross-sectional areas experience greater negative pressure per unit area. Subsequently, the pressure curves began to decrease, with the rate of descent diminishing as the pile diameter increased. The pressure in the 15 cm diameter pile dropped to 0 kPa within approximately 200 s, while the 20 cm and 25 cm diameter piles required about 400 s and 625 s, respectively, for complete pressure release. These results demonstrate that although larger diameter piles require lower peak pressures for uplift, the recovery process is more gradual and prolonged.
Figure 22b shows that the displacement curves for all three pile sizes initially followed an approximately linear upward trend, but the total time required for complete recovery varied considerably. The 15 cm diameter pile reached an uplift displacement of 0.58 m in only 185 s, whereas the 20 cm and 25 cm diameter piles required approximately 385 s and over 600 s to attain displacements of 0.61 m and 0.56 m, respectively, confirming that larger cross-sectional dimensions prolong the recovery duration. Additionally, all three piles exhibited slight displacement rebound in the final recovery stage, with the rebound amplitude increasing with pile diameter. For instance, the maximum rebound displacement of the 25 cm diameter pile reached nearly 0.070 m, significantly exceeding the values of 0.040 m and 0.057 m observed for the 15 cm and 20 cm diameter piles, respectively. This behavior can be attributed to the more extensive disturbance zone around larger diameter piles during the later uplift stage, where water backflow generated forces opposing the uplift direction. Furthermore, the greater self-weight and stronger inertia of larger diameter piles make them more susceptible to the combined effects of water-induced disturbance and gravity during the final pressure release phase, leading to more substantial displacement rebound.
As shown in
Figure 22c, the pressure-displacement curves for all three test conditions exhibit a clear negative correlation, with pressure gradually decreasing as the pile is uplifted. The 15 cm diameter pile shows the most pronounced pressure decline, with the steepest curve slope, indicating the highest pressure release efficiency per unit displacement. However, this configuration also experienced the strongest disturbances during recovery, characterized by high-frequency pressure fluctuations. In contrast, the 25 cm diameter pile exhibits a more gradual pressure reduction, with significantly reduced fluctuation amplitude and frequency. Under identical water injection conditions, increasing the pile diameter promotes a more continuous pressure release process, thereby enhancing pile stability. Regarding disturbance patterns, the high-frequency fluctuations in the 15 cm diameter pile may be attributed to its smaller cross-section, which concentrates water flow and limits the dissipation of disturbance energy. The considerably lower fluctuation amplitude in the 25 cm diameter pile suggests that larger diameters facilitate the development of a more continuous and stable pressure release pathway.
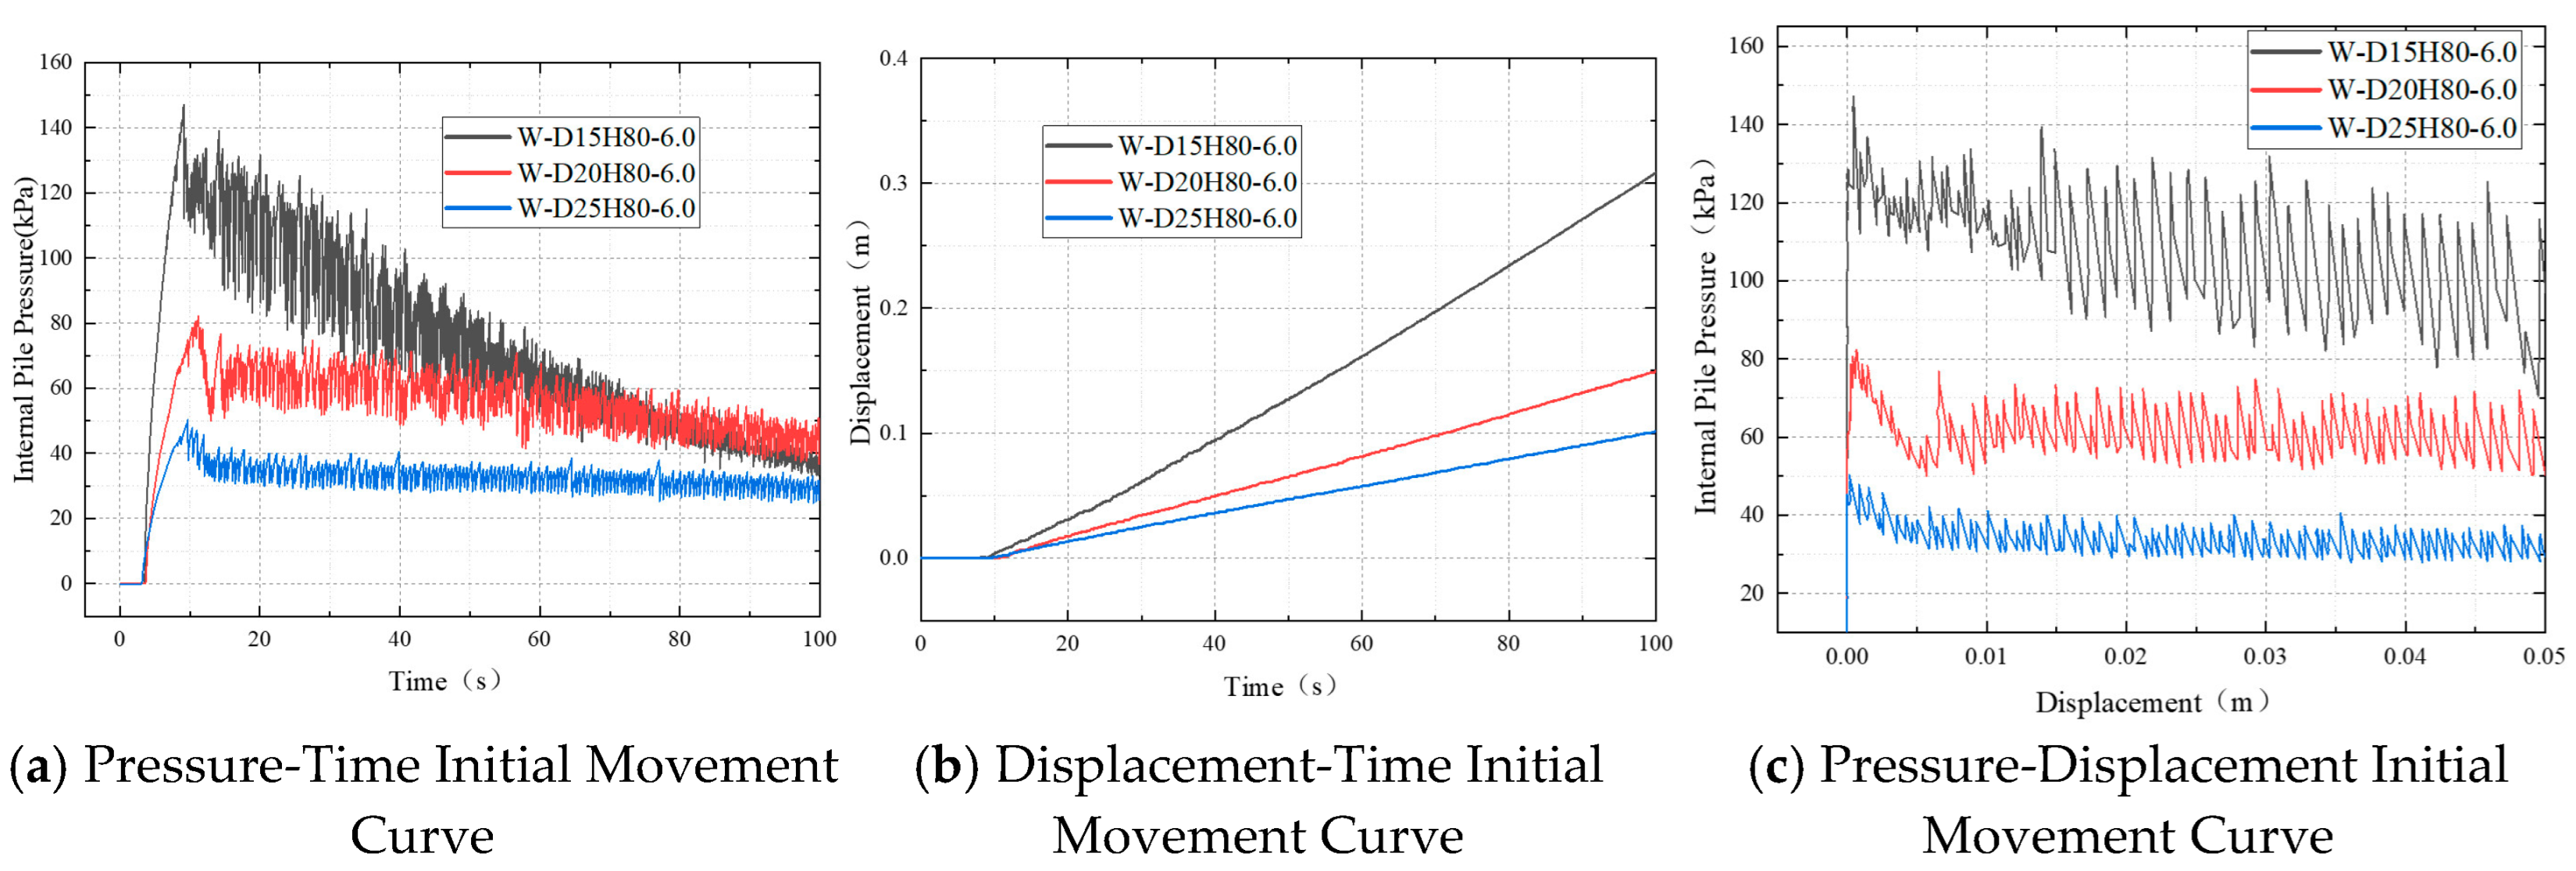
As shown in
Figure 23a, the internal pressure of piles with three different diameters rapidly increased to their peak values during the initial phase, followed by a fluctuating decrease phase. Significant differences exist in the maximum pressure values corresponding to different pile diameters: the 15 cm diameter pile reached a peak pressure of approximately 147 kPa, the 20 cm diameter pile 82 kPa, and the 25 cm diameter pile only 50 kPa. This indicates that smaller cross-sectional sizes require higher critical pressure to overcome resistance during the initiation phase. Furthermore, as the diameter increases, the amplitude of pressure fluctuations decreases markedly, with the 25 cm diameter pile demonstrating particularly stable oscillation patterns. This suggests that the larger internal volume of bigger-diameter piles acts as a volumetric buffer, allowing for more uniform pressure accumulation and effectively dampening fluctuations caused by disturbances (e.g., stick-slip motion). Furthermore, the larger cross-sectional area allows the pressure to average out localized soil inhomogeneities, preventing the formation of high-pressure zones that cause instability. Conversely, the confined space within smaller-diameter piles makes the pressure release process more susceptible to localized effects and thus prone to severe fluctuations.
As shown in
Figure 23b, the displacement of all three pile diameters during the initiation phase follows an approximately linear growth trend, but the displacement growth rate decreases significantly with increasing pile diameter. Observation of the curves reveals that within the first 100 s, the 15 cm diameter pile achieved a displacement of approximately 0.31 m, compared to about 0.15 m for the 20 cm diameter pile and only 0.10 m for the 25 cm diameter pile. This demonstrates that larger-diameter piles, due to their greater embedded volume and higher sidewall friction, experience reduced effectiveness of the uplift force provided per unit water injection volume, resulting in slower initial uplift velocities.
As shown in
Figure 23c, within the minor displacement range of 0–0.05 m, the pressure-displacement curves for all three pile diameters demonstrate a consistent pattern: reaching the initiation pressure first, followed by a rapid pressure drop and subsequent entry into a fluctuating phase. It is noteworthy that the 15 cm diameter pile exhibits a substantial pressure decrease during the initiation stage, accompanied by significant high-frequency fluctuations, indicating a more intense pressure release and stronger disturbance during startup. In contrast, the 25 cm diameter pile displays the most gradual pressure decline with displacement and the smallest fluctuation amplitude, demonstrating superior overall stability. These observations further confirm that piles with larger cross-sectional dimensions, due to their greater internal volume and more uniform water pressure distribution, are less prone to forming localized high-pressure zones during water-injection uplift. Consequently, they exhibit more stable pressure fluctuations and a more controllable pressure release process. Conversely, smaller-diameter piles are more susceptible to disturbances, resulting in more dramatic pressure variations and relatively poorer stability.

