Article

Experimental Research on Petrophysical, Geomechanical Features, and Fracture Behaviors of Organic-Rich Marine Shale

1
Hubei Key Laboratory of Oil and Gas Exploration and Development Theory and Technology (China University of Geosciences), Wuhan 430074, China
2
Key Laboratory of Tectonics and Petroleum Resources (China University of Geosciences), Ministry of Education, Wuhan 430074, China
3
State Key Laboratory of Deep Geothermal Resources (China University of Geosciences), Wuhan 430074, China
4
Faculty of Oil, Gas and Renewable Energy, Department of Exploration and Production, University of Kinshasa, Kinshasa P.O. Box 127, Democratic Republic of the Congo
*
Authors to whom correspondence should be addressed.
J. Mar. Sci. Eng. 2025, 13(12), 2245; https://doi.org/10.3390/jmse13122245
Submission received: 2 October 2025 / Revised: 7 November 2025 / Accepted: 11 November 2025 / Published: 25 November 2025
(This article belongs to the Topic Advanced Technology for Oil and Nature Gas Exploration)

Abstract

Longmaxi shale is one of major and earliest shale gas formations in China, which hosts significant reserves and produces substantial amounts of natural gas. A thorough understanding of how mineral composition and geomechanical properties govern fracture initiation and propagation in the Longmaxi shale is therefore essential in designing hydraulic fracturing operations. In this study, nine core samples from different layers of the Longmaxi shale in Well A at Sichuan Basin were collected and a series of experiments were conducted, including X-ray diffraction, triaxial and uniaxial compression tests, brittleness index assessment, scanning electron microscopy, and nuclear magnetic resonance. Results reveal that samples from layers S6–S9 are rich in clay minerals, whereas layers S1–S5 are dominated by siliceous minerals. From the top to the bottom of the reservoir, a noticeable increase presents in total organic carbon (TOC), porosity, natural gas content, and silica mineral proportion. Young’s modulus shows a positive correlation with silicon mineral content but a negative correlation with clay content. Under high-stress conditions, shale with low quartz content tends to exhibit ductility, which inhibits fracture propagation. Quantitative models were established to predict brittleness and interpret the mechanical behavior of marine shale reservoirs.

1. Introduction

The development of shale gas resources plays a vital role in alleviating global energy scarcity, with marine facies shales like the Longmaxi Formation in South China representing key targets for exploration. These marine shales typically formed in deep-water, anoxic shelf environments, where high biogenic productivity and limited bottom water circulation facilitated the enrichment and preservation of organic matter, leading to the development of organic-rich strata with significant gas potential [1,2,3]. In general, the depositional environment of marine shales, particularly in deep- to semi-deep-water settings, critically influences their mineral composition and properties. Shale is classified as an unconventional reservoir rock characterized by diverse phases, isotropy, scales, and varying compositions [4]. Additionally, shale exhibits notable anisotropy due to its bedding structure [5]. The anisotropic characteristics of shale rock are essential for the development of intricate fracture networks, the propagation of hydraulic fractures, and the stability of wellbore connections [3,6,7]. In the case of bedded shale, the properties of deformation and the initiation and propagation of cracks are significantly affected by bedding planes that possess poor cementation forces and great compressibility. Furthermore, uncontrolled hydraulic cracks along prominent or previously unidentified faults may trigger seismic events. Consequently, a comprehensive understanding of the hydraulic fracturing behavior of bedded shale is crucial for successful reservoir reconstruction. Research on the hydraulic fracturing of bedded shale is particularly significant as it involves the processes of crack initiation, propagation, and interaction [8,9,10,11]. The process of extracting shale gas through hydraulic fracturing entails the excavation and alteration of shale located several kilometers underground, where it may experience significant fracturing and compression. The shale’s resistance to compression is crucial in the study of rock fracture mechanics and is intricately associated with fracture failure. A precise assessment of the characteristics of a targeted shale reservoir is essential for multiple facets of field operations. Nevertheless, variations in the sedimentary history and diagenetic environment among various shale formations can lead to considerable differences in the mechanical features of shale reservoirs at different sampling sites.
In light of the aforementioned points, researchers have conducted numerous quasi-static loading experiments to evaluate the deformation characteristics and mechanical properties of organic-rich marine shale under various stress conditions [8,9,10,11,12] and coring orientations [13,14]. It is crucial to highlight that most of these investigations did not take into account the impact of reservoir production or the dynamic mechanical response of the rock as the effective stresses were continuously modified, leading to a more complex deformation of the rock formation [15,16]. This phenomenon can be replicated in laboratory settings through different loading techniques used to evaluate the mechanical properties of organic-rich marine shale gas reservoirs [4]. The deformation processes and geomechanical features of materials such as mudstone, salt rock, and marble, etc., under the conditions of cyclic loading and unloading stress have been previously examined [17,18,19,20,21,22,23]. Niandou et al. [24] performed cyclic loading and triaxial compression tests on the Tournemire shale, examining its mechanical anisotropy and revealing that the failure mode of shale is anisotropic, significantly influenced by the level of confining pressure and the direction of the applied load. In a separate study, Wang et al. [25] employed acoustic emission monitoring to investigate the Longmaxi shale formation, focusing on how stress and bedding paths affect the opening and spread of cracks during loading process. The researchers observed that applying load to the specimens parallel to the bedding plane resulted in the formation of shear cracks, whereas applying load perpendicular to the bedding direction led to the prevalence of tensile cracks [25,26]. Yang et al. [27] performed uniaxial cyclic loading experiments on various specimens with differing bedding plane angles from the Longmaxi shale formation. Their findings indicated that as the angle between the applied load direction and the bedding increases, the complexity of fracture morphology also increases. Utilizing Corten Dolan’s methodology on fatigue and cumulative damage resulting from cyclic loading, Xu et al. [28] developed a predictive equation for fatigue damage based on the rock’s residual strength and various influencing factors. Also, Guo et al. [29] conducted a study on the mechanical properties of shale samples sourced from the Longmaxi Formation, examining the effects of cyclic loading. Their findings indicated that the loading conditions could influence the bedding planes and subsequently affect the fatigue life of the specimens.
It is widely recognized that the depositional diagenesis and environment influence the rock fabric and mineral composition of shale formations. Consequently, researchers have categorized minerals, such as QFP (quartz, feldspar, pyrite), carbonates (dolomite, calcite, siderite, anhydrite), and clay, along with their effects on the mechanical features of shale specimens [30,31,32,33]. Research indicates that a clay and TOC content ranging from 30 to 40 wt.% serves as the threshold for microstructural deformations [34], variations in flow characteristics [35], and changes in elastic features [32,36], thereby demonstrating that mineralogy influences the mechanical response of rock. In light of the changes in effective stress resulting from production, and the impact of these mineral components on the fracturing and elastic features of shales, triaxial–uniaxial loading emerges as a valuable method for examining the mechanical response of formations under various experimental conditions. This study involved the selection of Longmaxi shale core specimens (S1, S2, S3, S4, S5, S6, S7, S8, and S9) from different layers of Well A, Sichuan Basin (Figure 1), China, with varying mineral compositions and thermal maturity, as identified through a series of mineralogical, geochemical, and petrophysical analyses, which were then subjected to triaxial–uniaxial loading tests. We first perform TOC content testing and XRD mineral component analysis. Together, scanning electron microscopy, high-pressure mercury injection experiments, and nuclear magnetic resonance have been utilized to characterize the microstructure of deep shale. Throughout the loading process, observations of volumetric strain, axial stress, and axial strain were gathered. The study analyzed the stress responses, fracture, and deformation characteristics of shale at various loading rates, as well as the correlation between elastic feature and loading rate. The fracture characteristics at different strain rates were particularly emphasized. Finally, in conjunction with the relevant context of shale gas development, the potential applications were explored and discussed, offering insights useful for shale gas extraction.

2. Geological Background

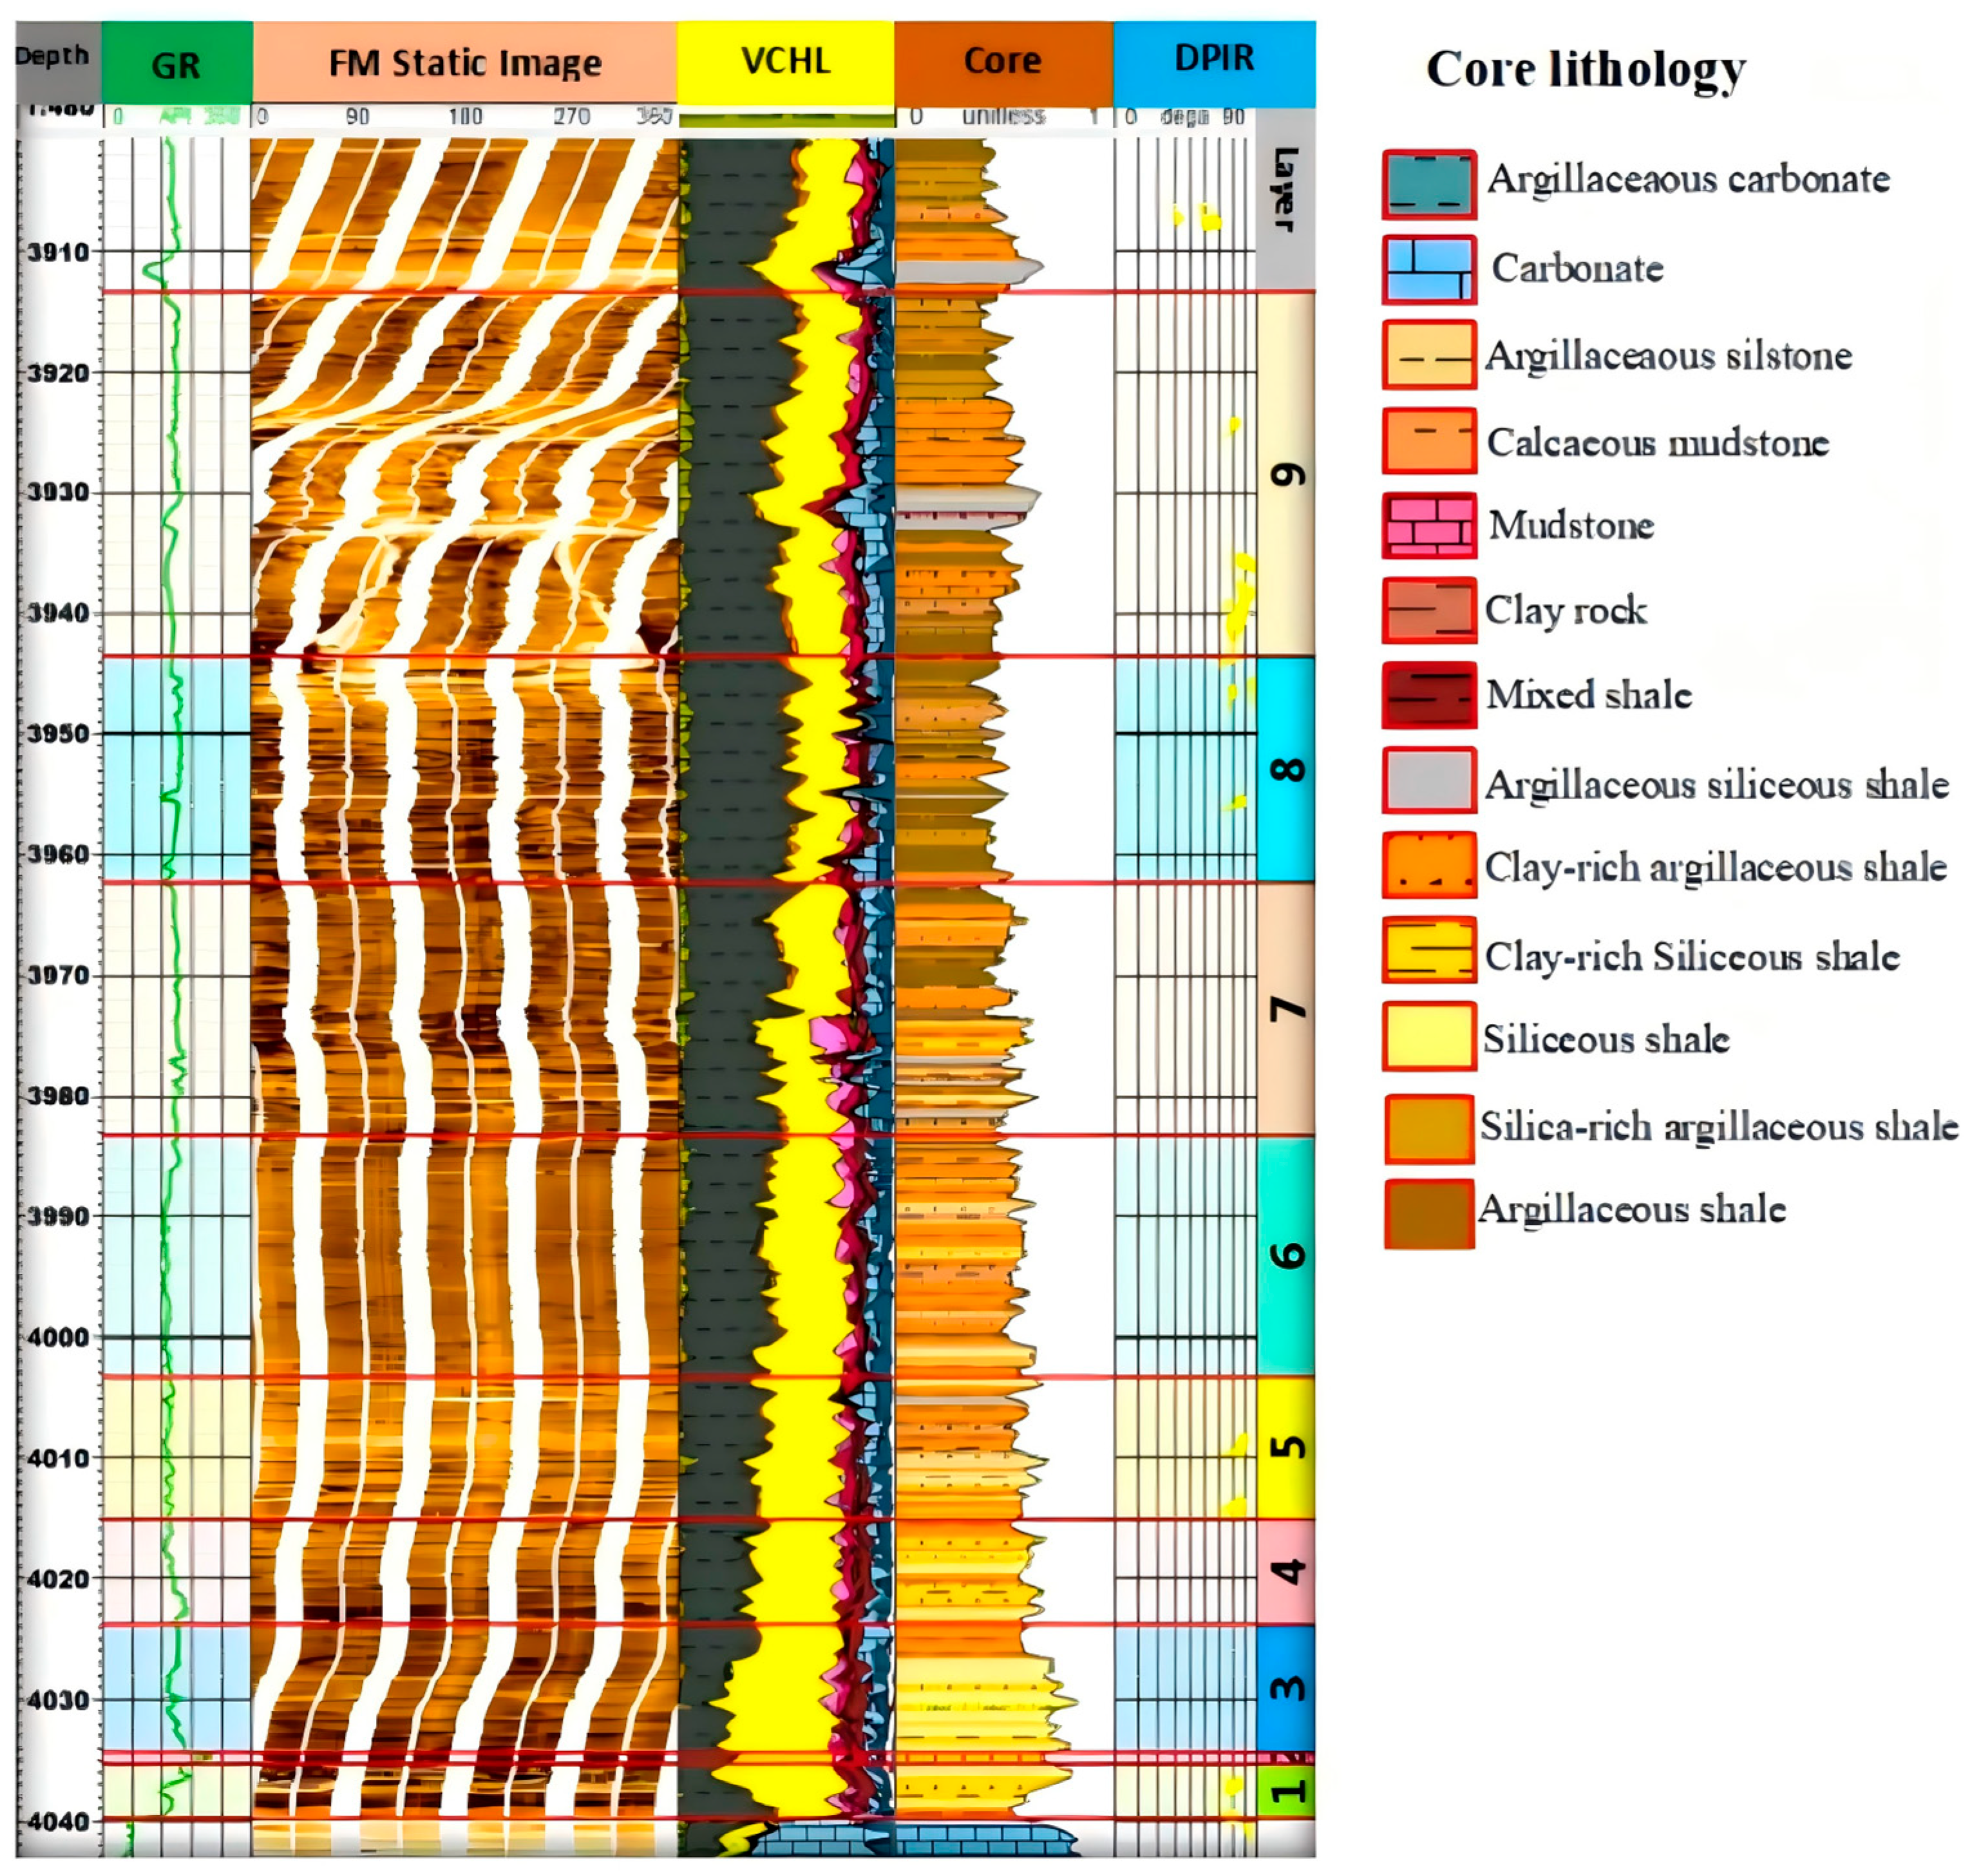
One of China’s tectonically most stable basins is the Sichuan basin. It is rich in gas and oil, with gas and oil occurrences found in a variety of stratigraphic levels ranging from the Cretaceous to the Upper Neoproterozoic [39]. The Sichuan basin, a foreland basin encircled by tectonic fold belts and mountains, has undergone multiple tectonic events since the Late Triassic [40,41]. The Wufeng–Longmaxi Formation in the area is buried 4000–4500 m deep. The marine shale reservoirs in this area have good conditions for preservation, and both macro- and microstresses are stable. The Longmaxi Formation is 334.80 m thick on average and is further subdivided into three sections vertically. From bottom to top, they are the first, second, and third sections of the Longmaxi Formation [3,42]. Black silty shale and black carbonaceous, with a dark color and fine grain size, make up the majority of the Longmaxi Formation. Also, planktonic graptolites fossils are abundant in this lithofacies [38]. The degree of graptolite development gradually increases from top to bottom. The pyrite has a higher degree of development, increasing from top to bottom, mostly in the form of strips and spots. The Wufeng Formation is 4.50 m thick and its lithology is gray-black carbonaceous siliceous shale. The formation of pores within organic matter is believed to be facilitated by the development of thermal maturity, as suggested by Slatt and Abousleiman [43]. Well A was drilled into the Longmaxi Formation with a thickness of 92.8 m, which was further divided vertically into nine small layers ①–⑨ (Figure 2). According to Jarvie et al. [44] and Slatt and Abousleiman [43], the development of thermal maturity is thought to promote the formation of pores within the organic matter. According to Zhou et al. [40] and Tuzingila, R.M. et al. [3], the Wufeng–Longmaxi shale in Fuling is stratified into three distinct intervals—Layers ①–⑤, ⑥–⑦, and ⑧–⑨—primarily due to vertical heterogeneity in shale quality, organic matter composition, and depositional environments, which are largely controlled by sea level fluctuations and redox conditions. The highest-quality lower section (Layers ①–⑤) was deposited in a deep-water, anoxic environment during a marine transgression, favoring the exceptional preservation of organic matter and the accumulation of biogenic silica, resulting in high TOC, superior porosity, and the highest gas content. In contrast, the overlying sections (Layers ⑥–⑨) formed during a period of sea level highstand and subsequent regression, characterized by more oxygenated conditions and increased terrigenous input, which led to higher clay content, lower organic matter, and reduced reservoir quality. Furthermore, submarine paleogeography and bottom currents contributed to the strong lateral heterogeneity observed, particularly in the transitional Layers ⑥–⑦. This vertical zonation is critical for identifying “sweet spots,” with the organic-rich and silica-rich lower member (Layers ①–⑤) being the primary target for shale gas exploration and production.

3. Materials and Methods

3.1. Sample Selection and Preparation

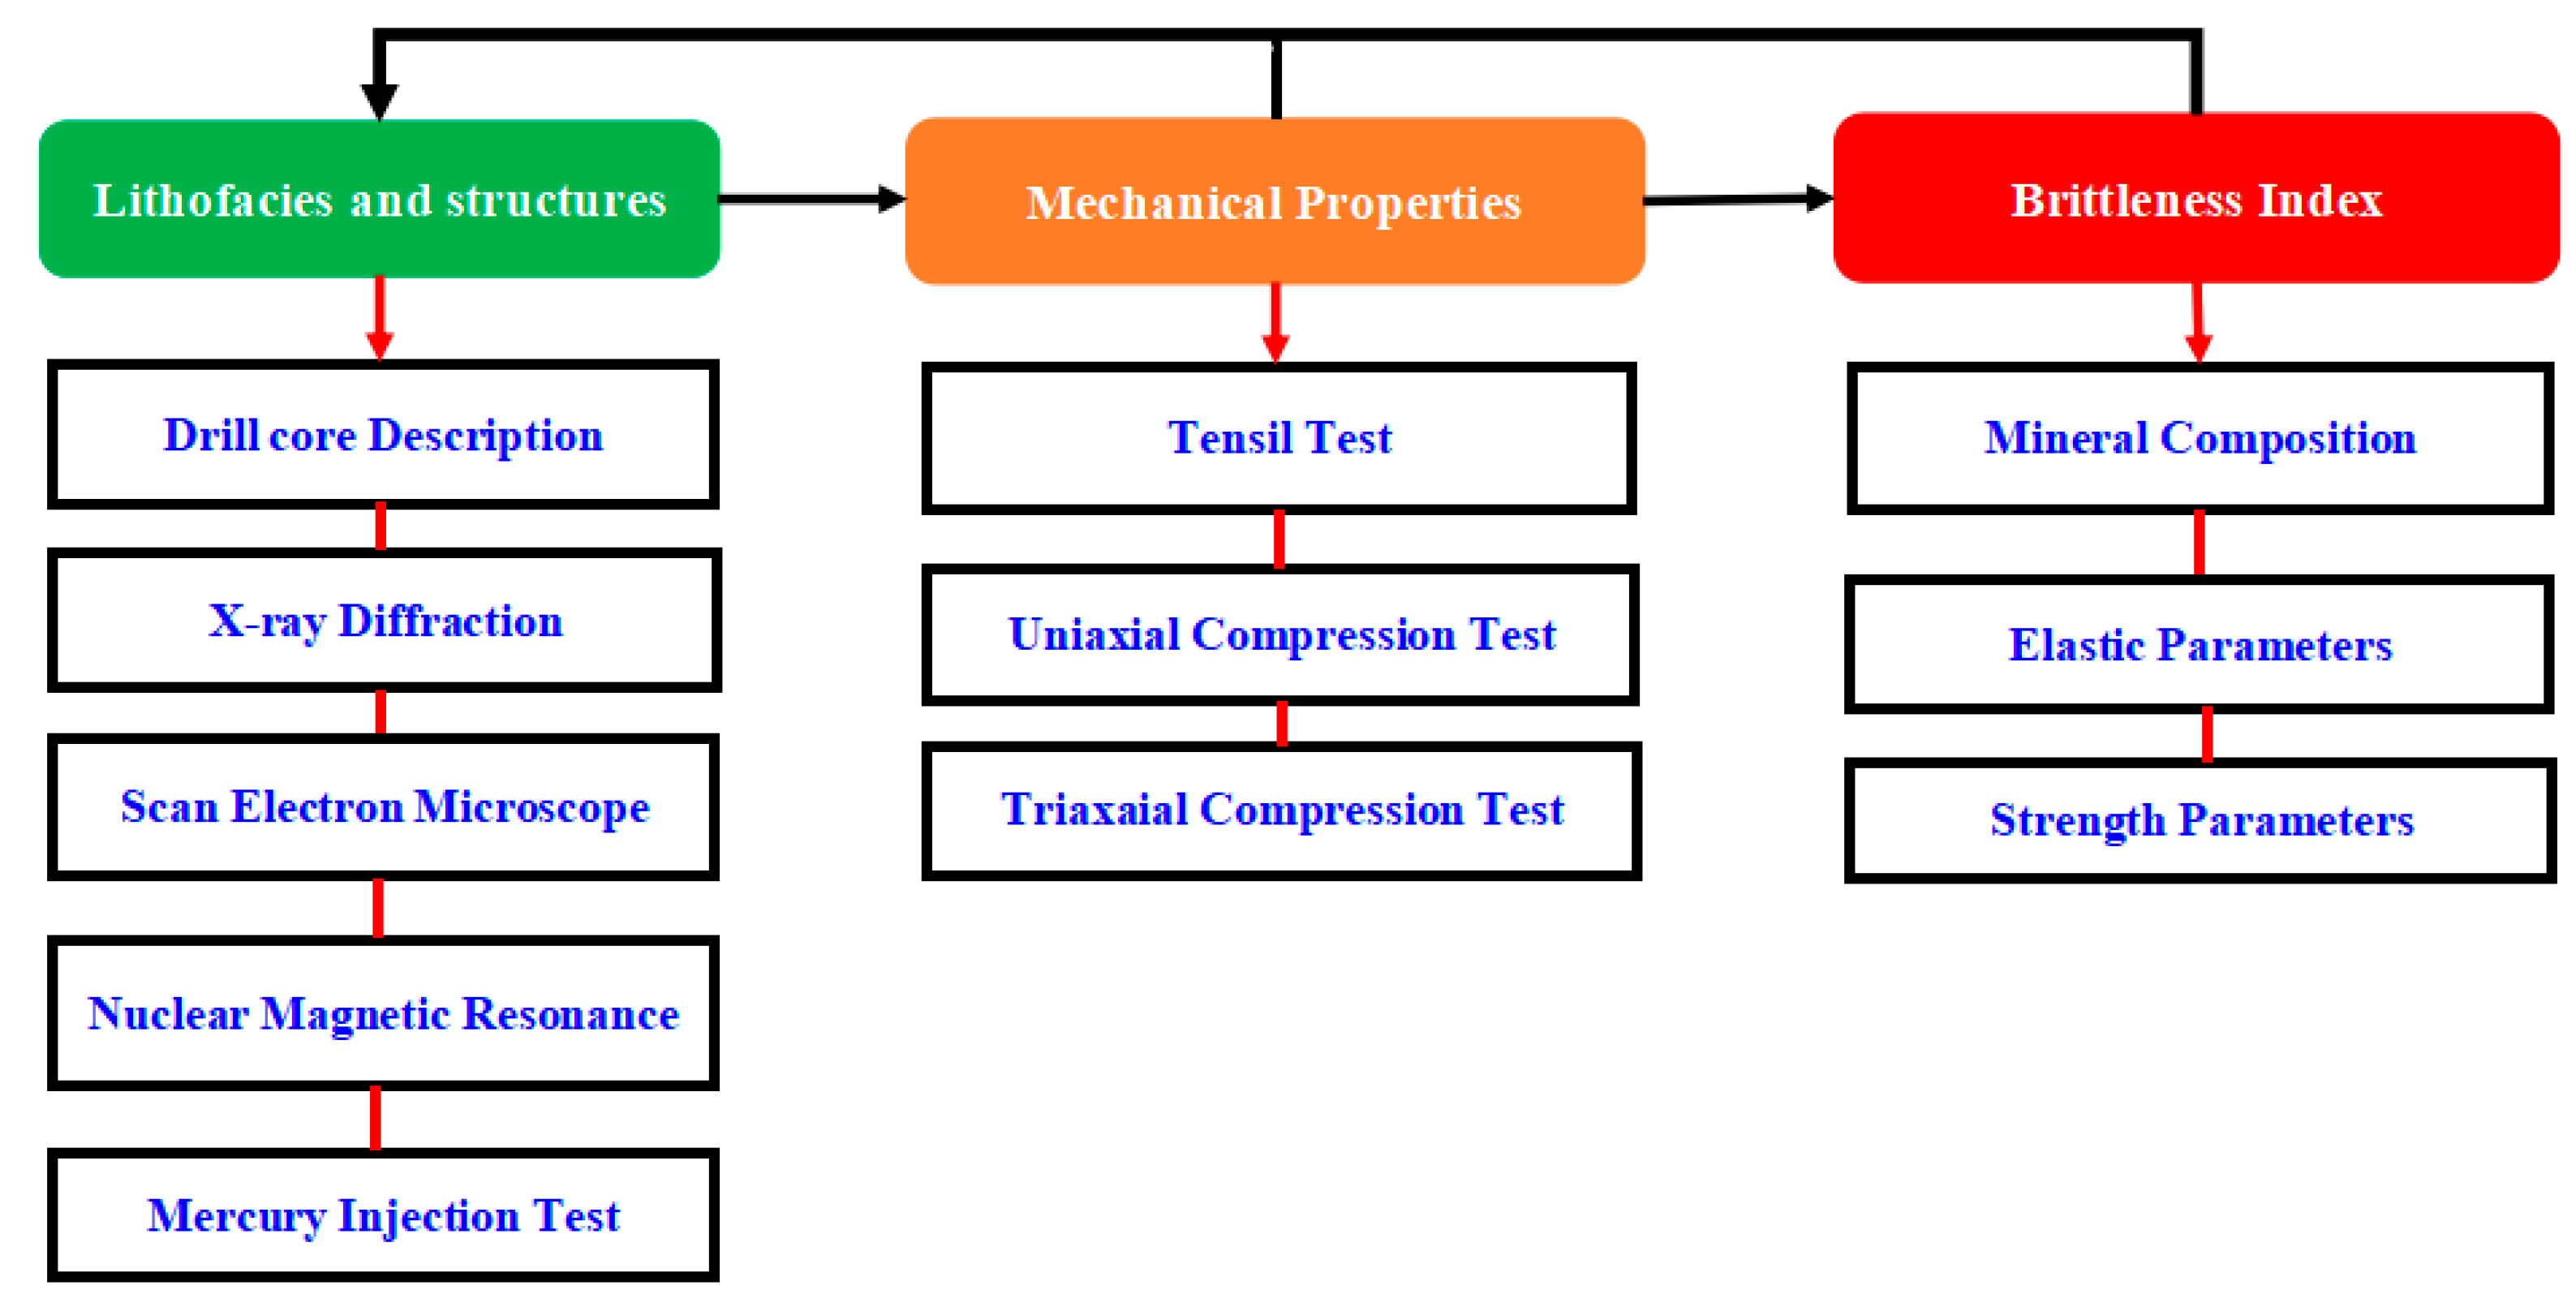
Based on the core, well logging, physical properties, geochemistry, mineralogy, and other data collected in the early stage, representative organic-rich marine shale samples from different sub-layers of the Longmaxi Formation in Well A were selected, and mineralogy and geochemistry tests were first carried out. For this study, nine core specimens of organic-rich marine shale (S1, S2, S3, S4, S5, S6, S7, S8, and S9) from the upper (S8 and S9), middle (S6 and S7), and lower members (S1, S2, S3, S4, and S5) of the Longmaxi Formation in Well A, Sichuan Basin, China, were employed. After comprehensive macroscopic specimen descriptions, using a drill bit that was coated with diamonds, large specimens were drilled either parallel to the bedding or perpendicular to the bedding (for rock mechanical tests). The materials were also cut using a diamond saw. It was necessary to use cylindrical plugs with a 50 mm length and 25 mm diameter for uniaxial compression experiment. The parallelism of the upper and lower surfaces of the specimen was controlled within a tolerance of 0.05 mm, while the surface flatness achieved a precision level of 0.02 mm. The machining accuracy of all specimens complies with the requirements recommended by the International Society for Rock Mechanics (ISRM). After that, the samples were mechanically polished using sandpaper with grit sizes ranging from 1200 to 2000, and then they were smoothed with aluminum oxide suspension polishing fluid (grain sizes of 0.25 μm and 2 μm). A cylindrical plug with a length of 10–30 mm and a diameter of 28.5 mm served as the material for mercury injection porosimetry (MIP), in order to measure the porosity of the specimens, or sawed into small rectangular strips with a water-cooled saw for light microscopy and to prepare the sample materials for SEM investigation after the plugs were prepared, in order to characterize directly the type and morphology of organic and inorganic pores. The residual tiny parts were ground to a 100–200 µm diameter (powder) for XRD in order to reveal the specimen’s mineral assemblages. Organic petrology analysis and Rock-Eval 6 pyrolysis were combined to determine the geochemical properties of shale specimens. By heating specimens to specific temperatures without oxygen, utilizing Rock-Eval pyrolysis, we assessed the thermal properties (maturity and TOC content) and origin of organic matter. The technical scheme of the research content of the paper is as follows (Figure 3). As the experiment’s methods of composition and microstructures are commonly used, this section only introduces the mechanical test methods and associated brittleness index calculation methods.

3.2. Experimental Principle and Instruments

3.2.1. Mineral, Geochemical, and Petrophysical Tests

(1)
X-ray diffraction (XRD) analysis: The powder samples were treated with a 10.0% hydrogen peroxide solution for one hour to eliminate any impurities that may have been introduced during the sample preparation process. Finally, the mineral particles underwent filtration and were rinsed with deionized water, followed by drying in an electronic oven at 100 °C for 12 h prior to testing. XRD measurements were conducted using a Bruker D8 Advance XRD apparatus (Bruker AXS GmbH, Karlsruhe, Germany) with Cu-Kα radiation operating at 40 mA.
(2)
Scanning electron microscopy (SEM) analysis: The small block specimen surface was smoothed to achieve a uniform finish using dry emery paper, and was coated with carbon, which serves as a conductive layer for scanning electron microscopy (SEM). The SEM scanning tests were conducted using a FEI Nova400 Scanning Electron Microscope (FEI Company, Hillsboro, OR, USA).
(3)
Nuclear Magnetic Resonance (NMR) analysis: Nuclear magnetic resonance experimental instrument model, Neumed MesoMR12-060H-I (Suzhou Niumag Analytical Instrument Co., Ltd., Suzhou, China), was used to analyze the pore structure by collecting the internal nuclear magnetic signals of the sample. The fluid used in this experiment was deionized water. The samples used in the test and the mercury injection experiment were taken from the same core. Before the test, the samples were prepared into 1 cm3.
(4)
Mercury Injection Test: this test used an Autopore IV mercury porosimeter (Micromeritics Instrument Corporation, Norcross, GA, USA), which is a 60,000 psi porosimeter that can measure the pore diameter range from 360 μm to 3 nm. All samples undergo a vacuum stage to ensure that all in situ fluids are evacuated before mercury is introduced into the testing cell. During the mercury injection process, the volume of mercury introduced is quantified by measuring the capacitance change in the penetrometer stem.
(5)
Geochemical analysis: The vitrinite reflectance was measured using a microphotometer MSP200 (J&M Analytik AG, Essen, Germany). Multiple measurement points were collected to compute the average thermal maturity. The TOC content was determined with a LECO CS230 carbon/sulfur analyzer (LECO Corporation, St. Joseph, MI, USA). Inorganic carbon was removed from shale powders finer than 100 mesh using hydrochloric acid, prior to pyrolysis at 540 °C. The microphotometer (MSP200) was employed again to assess the vitrinite reflectance. In order to determine the average thermal maturity, multiple measurement points were collected. Before assessing vitrinite reflectance, kerogen samples were extracted from the shale specimens through Soxhlet extraction and acid treatments. Following the Chinese industry standard (SY/T6940-2013), gas content testing was performed using FCG006 and FCG009 (BESD Technology, Beijing, China). The experiment was conducted at a formation temperature of 60°. The analytical gas, residual gas, and lost gas contents were combined to calculate the total gas content of the shale.

3.2.2. Triaxial–Unixial Compression Test Experiment

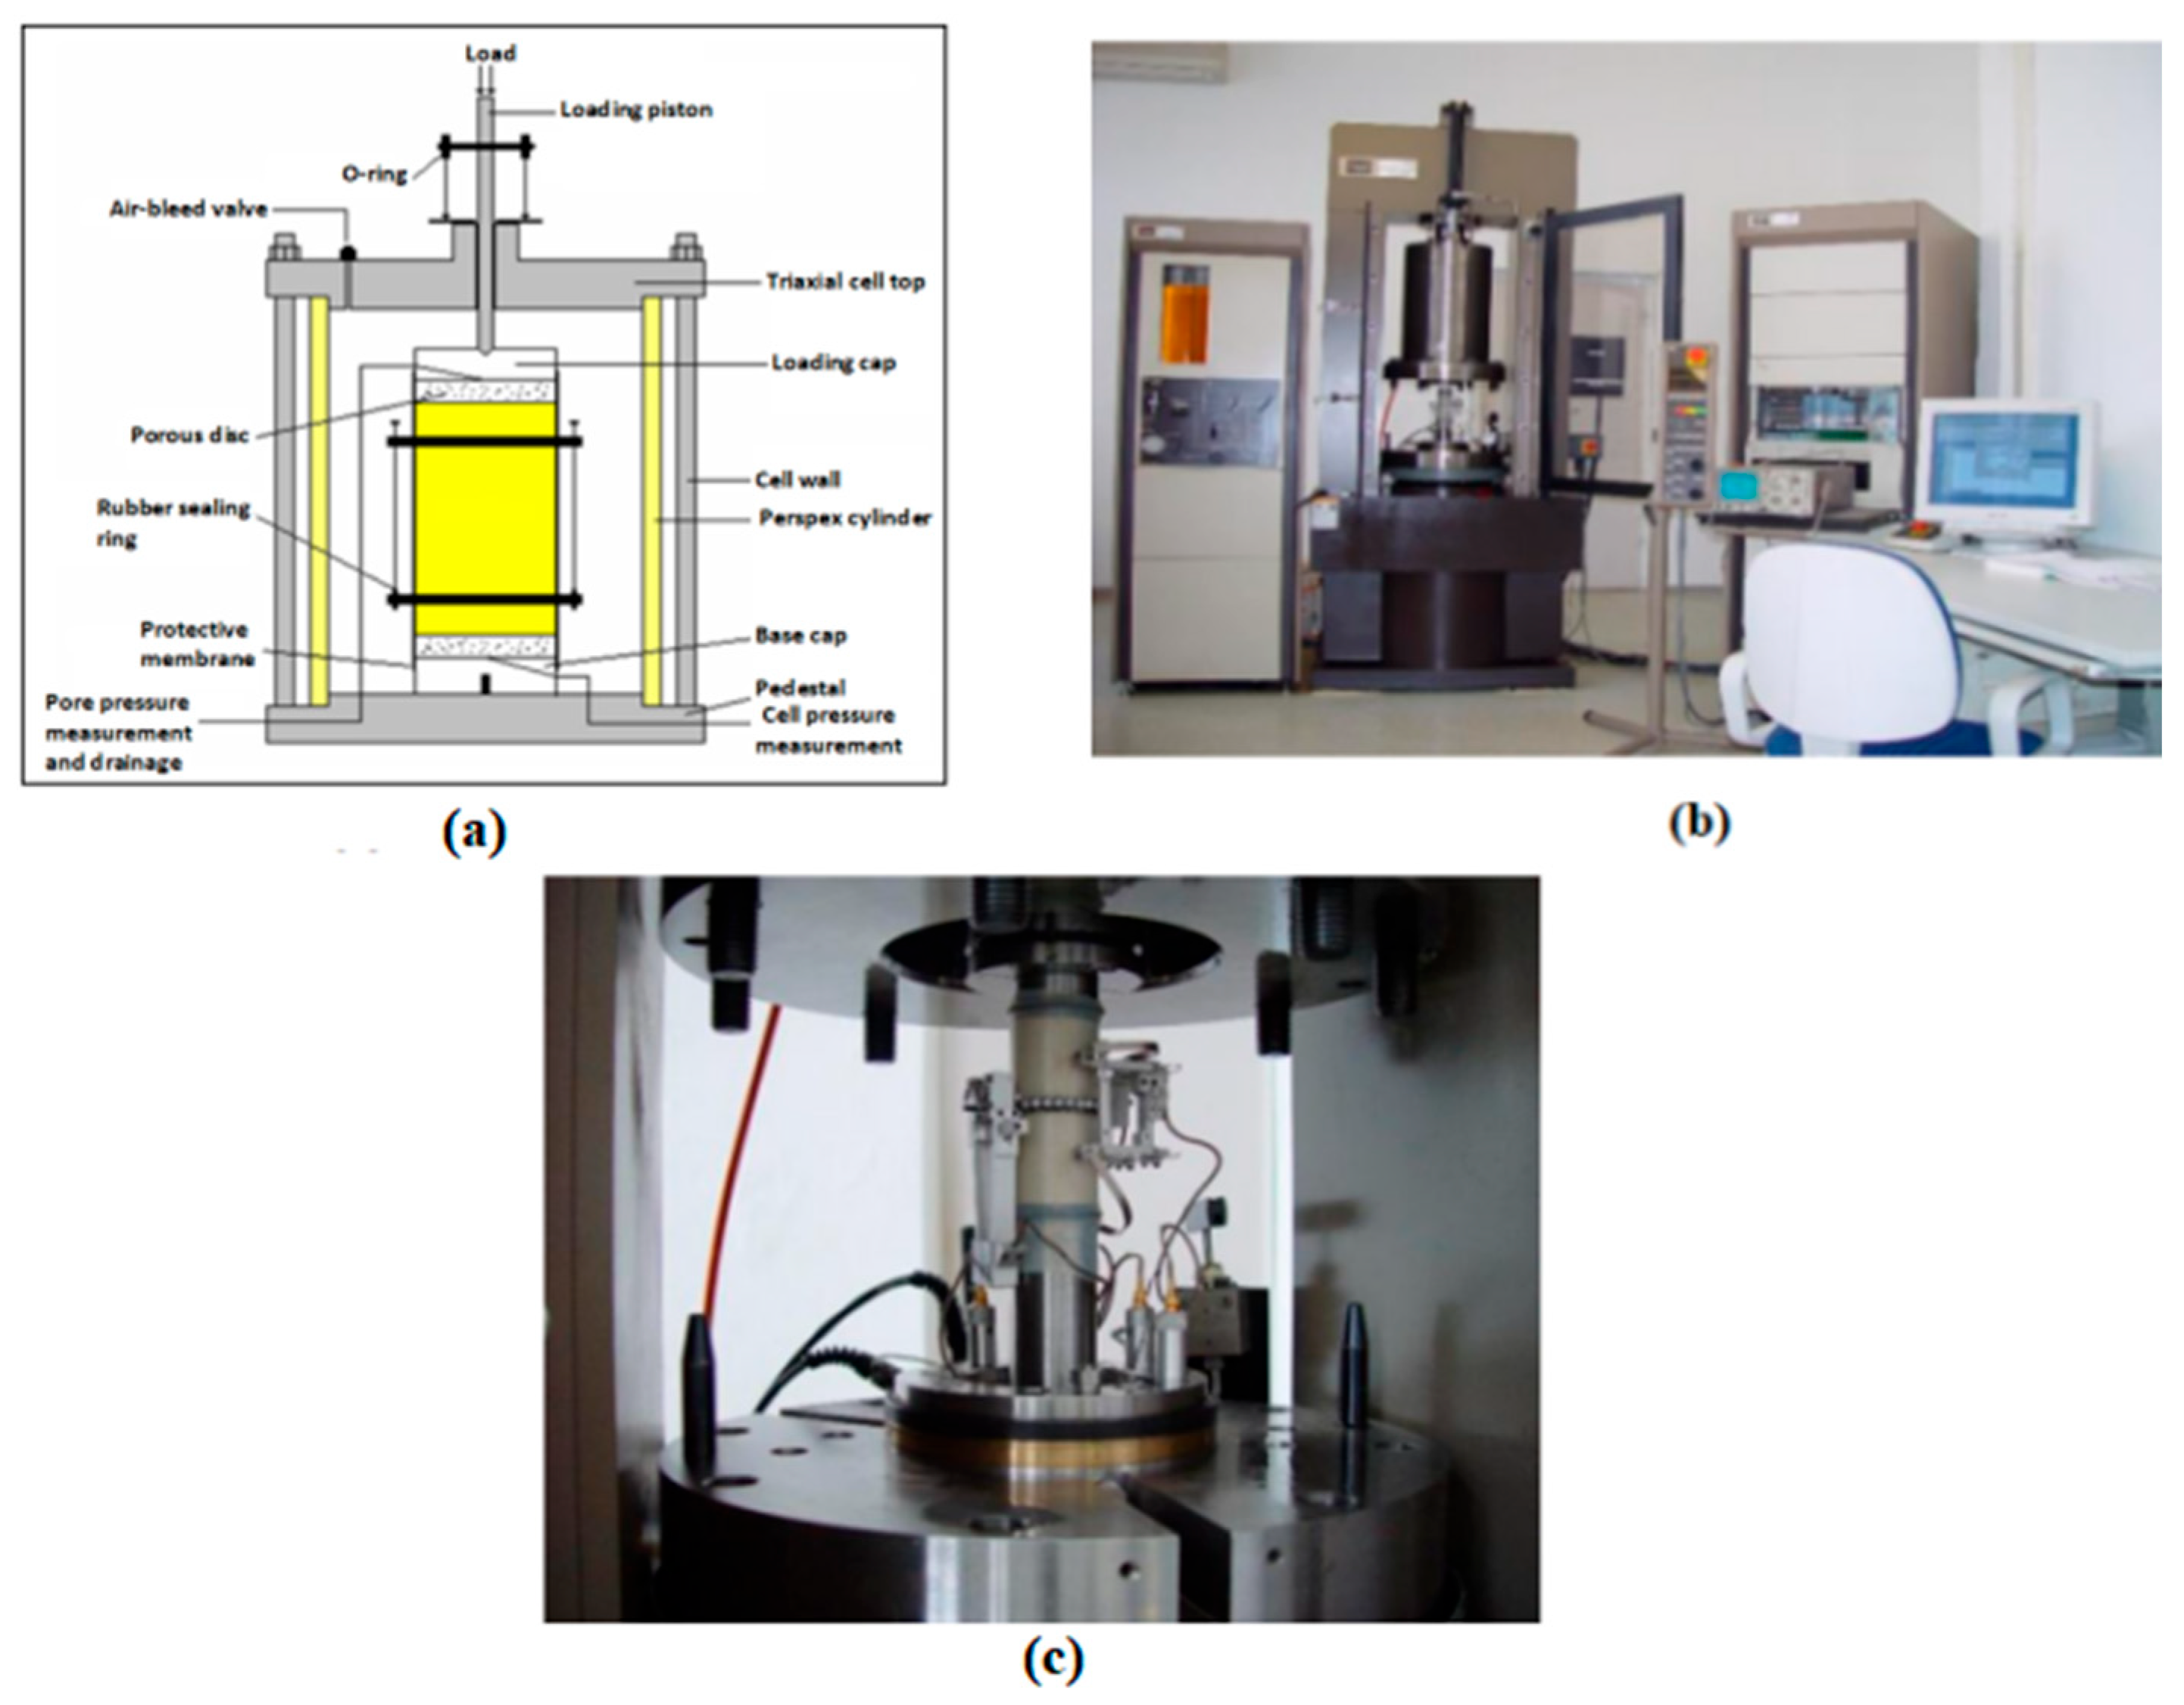
According to the different combinations of triaxial stress, rock triaxial tests are divided into true triaxial tests ( σ 1 > σ 2 > σ 3 ) and conventional triaxial tests ( σ 1 > σ 2 = σ 3 ). Since the instruments used in true triaxial tests are complex in structure, cumbersome in operation, and have a low success rate, this study mainly uses conventional triaxial tests with lateral isobaric pressure. The experimental principle is shown in Figure 4a. The main standards referenced in this experiment are: the National Standard of the People’s Republic of China, “Engineering Rock Test Method Standard” (GB/T50266-2013), “Rock Test Procedure for Water Conservancy and Hydropower Engineering” (SL264-2016), issued by the Ministry of Water Resources of the People’s Republic of China, and the American Society for Testing and Materials triaxial test standard ASTMD2664-04. The experimental equipment for measuring rock mechanical properties is the MTS815.03 pressure test system (MTS Systems Corporation, Eden Prairie, Minnesota, USA), as shown in Figure 4b. The experimental control accuracy is as follows: pressure 0.01 MPa; liquid density 0.01 g/cm3; and deformation 0.001 mm.
When formulating a conventional triaxial test plan for rock, the maximum lateral pressure should first be determined based on engineering needs and rock characteristics. In the absence of special requirements, the maximum lateral pressure can be predicted using the following method:
σ 3 = 10 6 ρ g H α P p
where σ 3 represents maximum lateral pressure, MPa; ρ is the block density of overburden, kg/m3; H depicts the sampling depth, m; α is the poroelastic coefficient, dimensionless; and P p represents the pore pressure, MPa. During the axial loading process, the ultimate axial stress corresponding to the rock failure under different pressure measurement conditions is the compressive strength of the sample, and the relationship is as follows:
σ 1 = F S
where σ 1 is ultimate axial stress, MPa; F represents the ultimate failure load, N; and S depicts the cross-sectional area of specimen, m2.
Also, the slope of the straight line segment is the elastic modulus, calculated according to Formula (3), the corresponding Poisson’s ratio is calculated according to Formula (4), and the rock deformation modulus is calculated according to Formula (5), as follows:
E = σ b σ a ε a b ε a a
μ = ε c b ε c a ε a b ε a a
E 50 = σ 50 ε 50
In the formulae, E represents the elastic modulus of rock, MPa; µ is Poisson’s ratio of rock, dimensionless; E 50 depicts the deformation modulus of rock, MPa; σ a is the stress value at the starting point of the straight line segment on the stress–strain curve, MPa; σ b depicts the stress value at the end point of the straight line segment on the stress–strain curve, MPa; ε a a represents the axial strain value corresponding to stress σ a ;   ε a b represents the axial strain value corresponding to stress σ a ; ε c b represents the radial strain value corresponding to stress σ b ; σ 50 represents the stress value when the rock compressive strength is 50%; and ε 50 is the longitudinal strain value when the stress is σ 50 .
Further information regarding this experimental apparatus can be found in earlier research [4,13].

4. Results

4.1. Microstructure Characteristics of Organic-Rich Marine Shale Reservoir with Different Lithofacies

4.1.1. Shale Mineral Components and Geochemical Characteristics

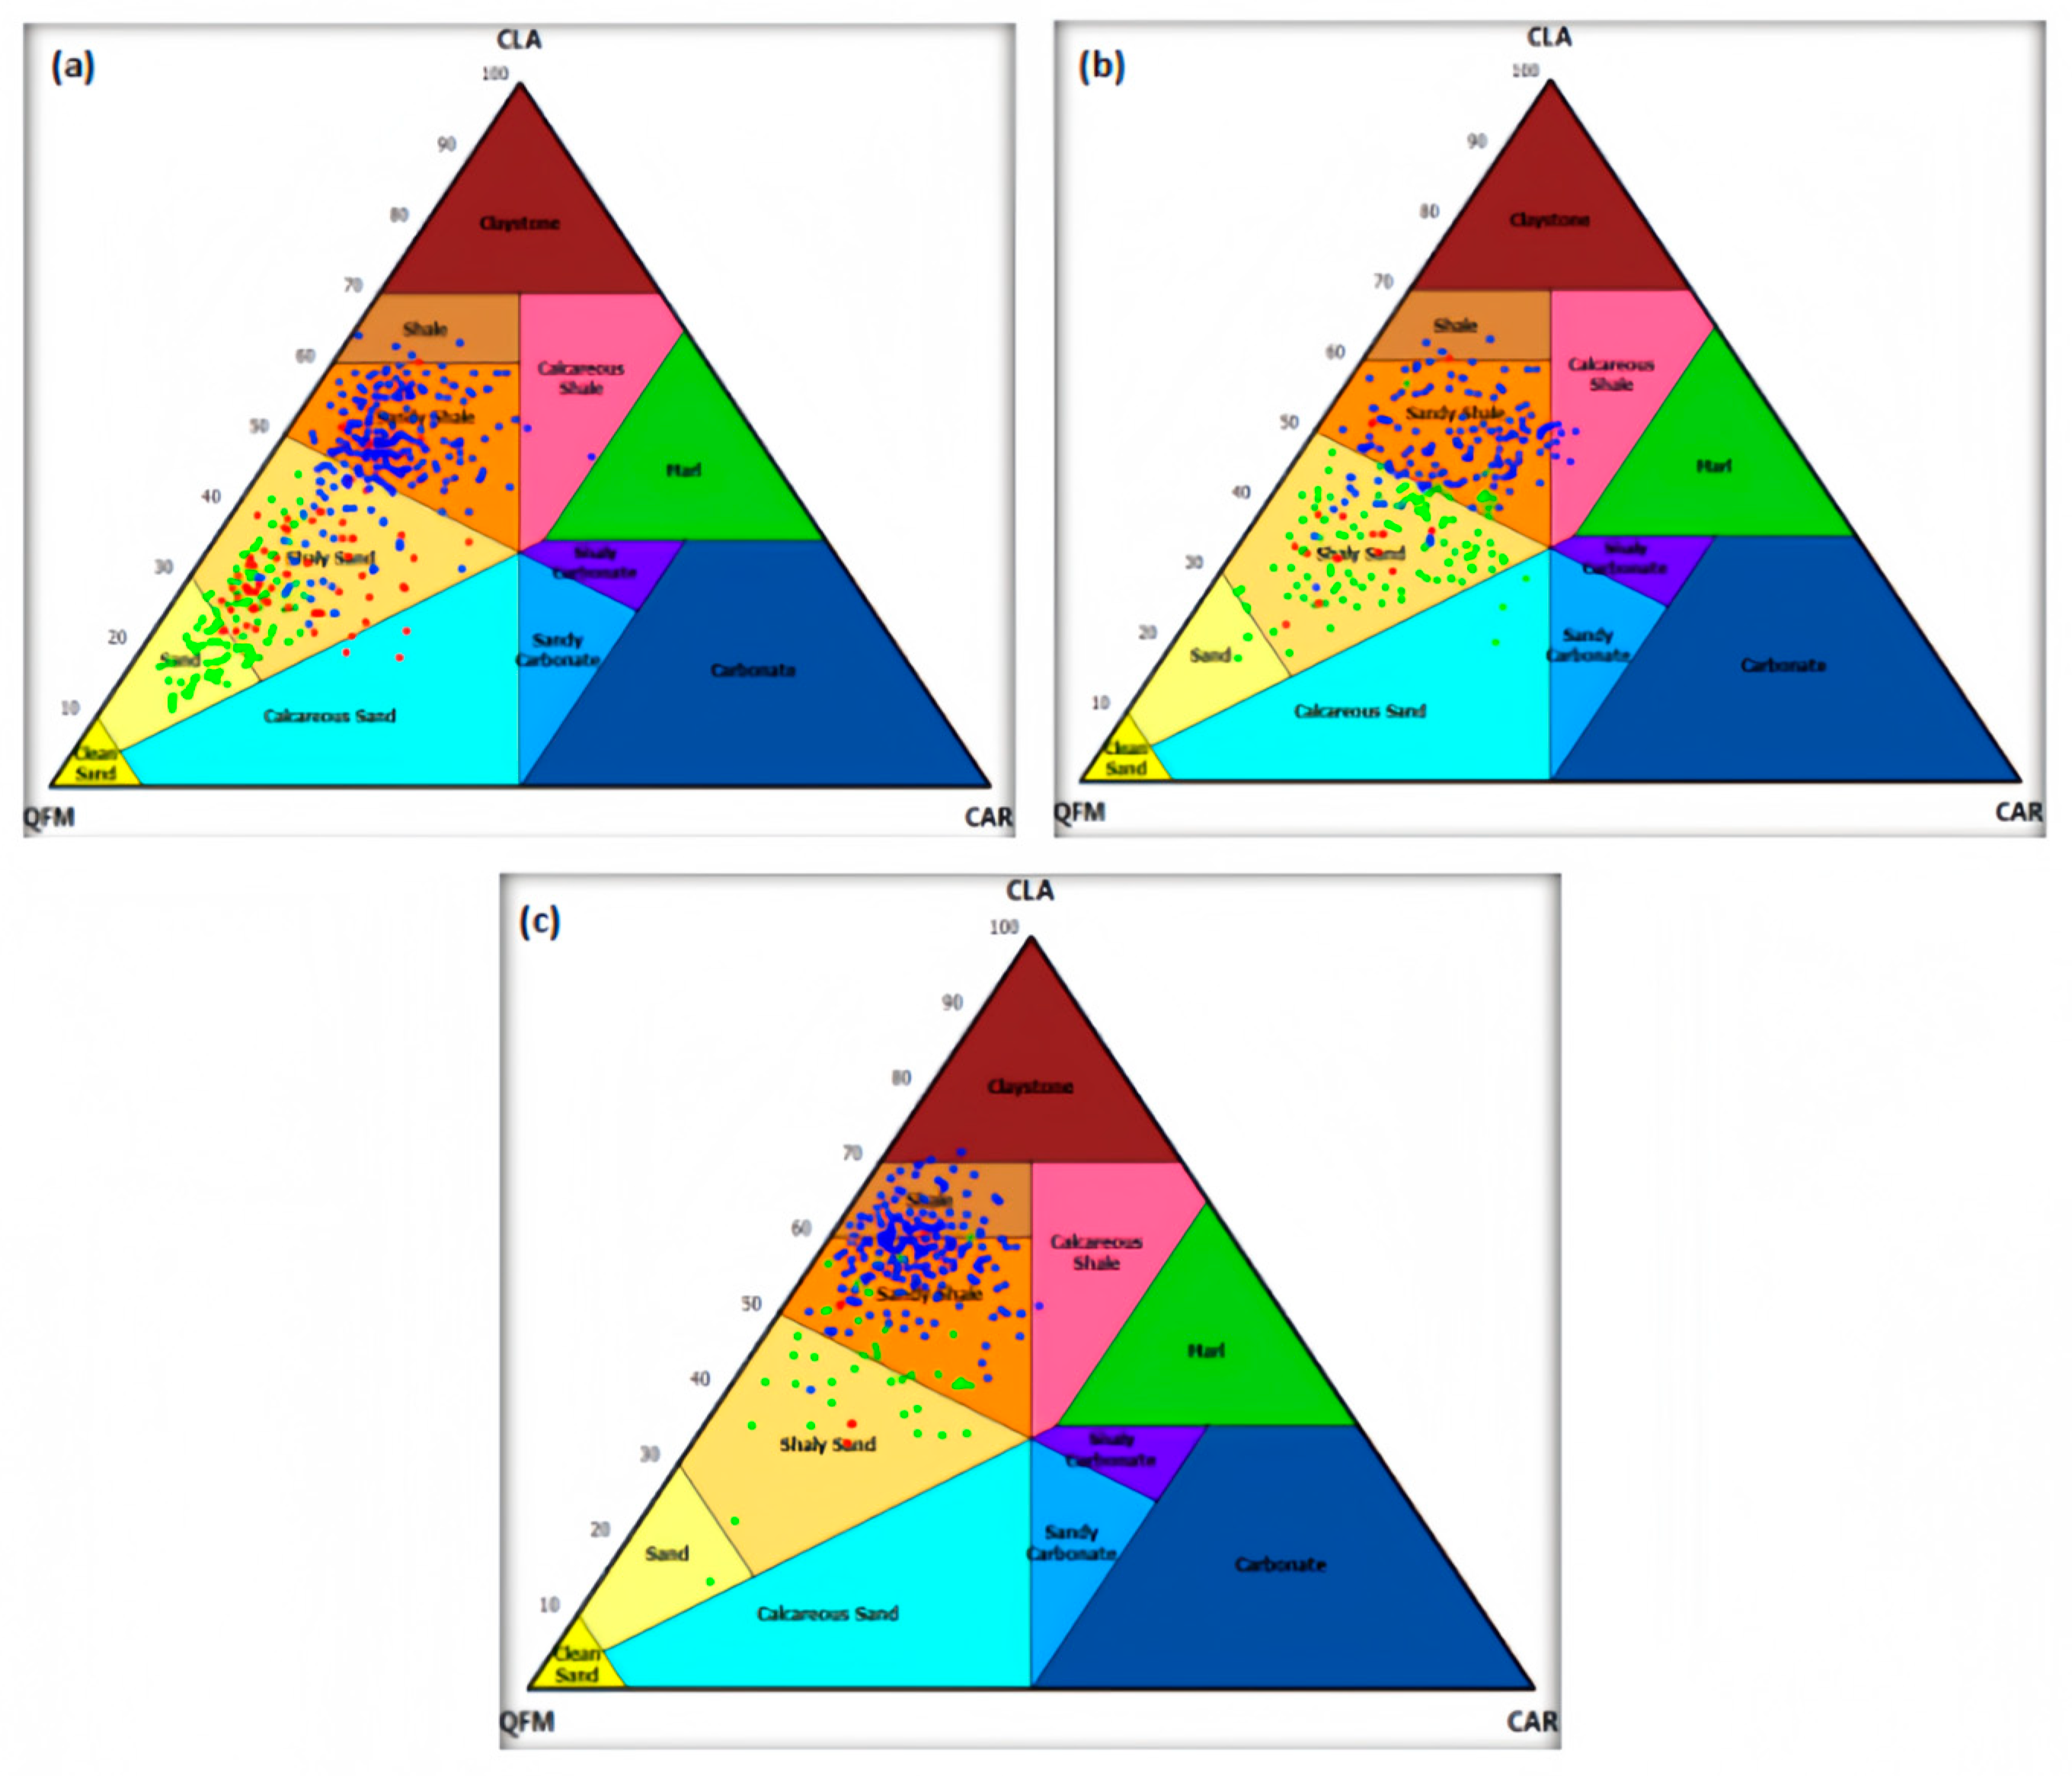
Based on the type of reservoir identified in the Well A (see Figure 2), three core samples (S2, S6, and S8, retrieved, respectively, from the depths 4036, 4002, and 3981 m; see more detail in Table 1) have been selected to represent the results of our research. According to the quantitative X-ray diffraction analysis results of the whole rock in Well A (Figure 5 and Table 1), the silica content of Layers ①–⑨ in Well A is 29.08–55.35%, with an average of 40.86%, the carbonate content is 6.87–12.72%, with an average of 10.57%, and among Layers ①–⑤, the siliceous content is relatively high, with an average of 47.66%. The quantitative X-ray diffraction analysis results of clay minerals show that the clay content of Layers ①–⑨ is 31.43–51.57%, with an average of 44.02%; the clay content of Layers ①–⑤ is lower, 31.43–43.46%, with an average of 38.43%. The clay minerals in the Longmaxi Formation shale layers (Layers ①–⑨) are mainly composed of an illite–smectite mixed layer, followed by illite, and chlorite is the least common; the content of chlorite has a gradually decreasing trend from top to bottom (Figure 5). The results of the X-ray diffraction analysis indicate that the silicon mineral content in the Longmaxi shale exhibits a gradual increase from the top to the bottom, while the clay mineral content demonstrates a gradual decrease in the same direction. A high concentration of clay minerals was observed in samples S6 and S8, with an estimated average of 41.8 and 44.02, respectively, while sample S2 showed a high concentration of siliceous minerals, with an estimated average of 54.68. According to the test results, the organic matter type of the Longmaxi Formation mud shale in Well A is mainly type I, with a vitrinite reflectance of 2.70~2.95%. It is an over-mature evolution stage. According to the TOC test results of 131 cores from Well A, the TOC of the Longmaxi shale shows a gradual increasing trend from top to bottom. The TOC of Layers ①~⑨ is 2.23~4.35, of which the TOC content of Layers ①~⑤ is generally higher, ranging from 2.77~4.35%, with an average of 2.93% (Figure 5). The mercury injection porosimetry (MIP) test showed that the porosity of the S8 sample is 3.28%, with 2.64 of Ro, and the TOC is 2.73%, while the calculated porosity in the S6 specimen is 3.68, the TOC is 2.47%, and Ro = 2.02%. The TOC, Ro, and porosity in the S2 sample are, respectively, 4.5%, 2.49%, and 5.41%. We noticed a significant increase in the TOC, porosity, and proportion of natural gas content from the top to the bottom of the reservoir. Encouraging results were observed particularly in the lower member (①–⑤ layers) of the reservoir. According to Loucks et al. [45], shales that are high in organic materials are generally considered to be appropriate for the extraction of petroleum and gas.

4.1.2. Shale Pore Structure Characteristics

(1)
Scanning Electron Microscopy (SEM) Results
The Longmaxi organic-rich marine shale with different lithofacies or layers was analyzed through scanning electron microscopy. The microscopic pores of rock were observed, and the pore types were divided into three categories: organic pores, inorganic pores, and microcracks. The organic pores in the Longmaxi Formation shale are mainly developed in organic matter. The pore shapes include elliptical pores, irregular polygonal, and polyangular pores. There are differences in development and shape. Organic pores are relatively developed in carbon-rich siliceous shale, and the pore shapes are mostly nearly elliptical and polygonal (Figure 6a). The organic pores in medium-carbon organic mixed shale are relatively poorly developed, and the pore shapes are mostly polygonal and polyangular pores with low organic matter (Figure 6b). The organic pores are relatively undeveloped in low-carbon clayey shale, and organic pores exist in an isolated manner (Figure 6c). The inorganic pores inside shale are mainly intergranular pores developed between inorganic mineral particles and intragranular pores inside mineral particles. The intergranular pores inside shale mainly include pores between inorganic mineral particles (Figure 6d), interlayer pores of clay minerals (Figure 6e), strawberry pyrite intercrystalline pores (Figure 6f), etc. Within mineral particles, the intragranular pores are mainly pores formed inside mineral particles through dissolution or particle development. The dissolution pores are mainly formed by the dissolution of carbonate minerals and a small amount of feldspar, and are mostly elliptical or irregular in shape (Figure 6g). The nano- to micron-scale microcracks are mainly developed in the Fuling area. The causes of microcracks are diverse. They can be divided into lamination joints formed by sedimentation (at the weak mechanical side of lithology changes), and diagenesis. There are several types of shrinkage cracks formed by clay minerals and microcracks formed by hydrocarbon generation and expulsion (mostly developed at the edges of organic matter and inorganic mineral particles) [46,47]. Microfractures can be observed in shales of different lithofacies and are an important part of the deep shale reservoir space (Figure 6h,i).
(2)
Nuclear Magnetic Resonance (NMR) Results
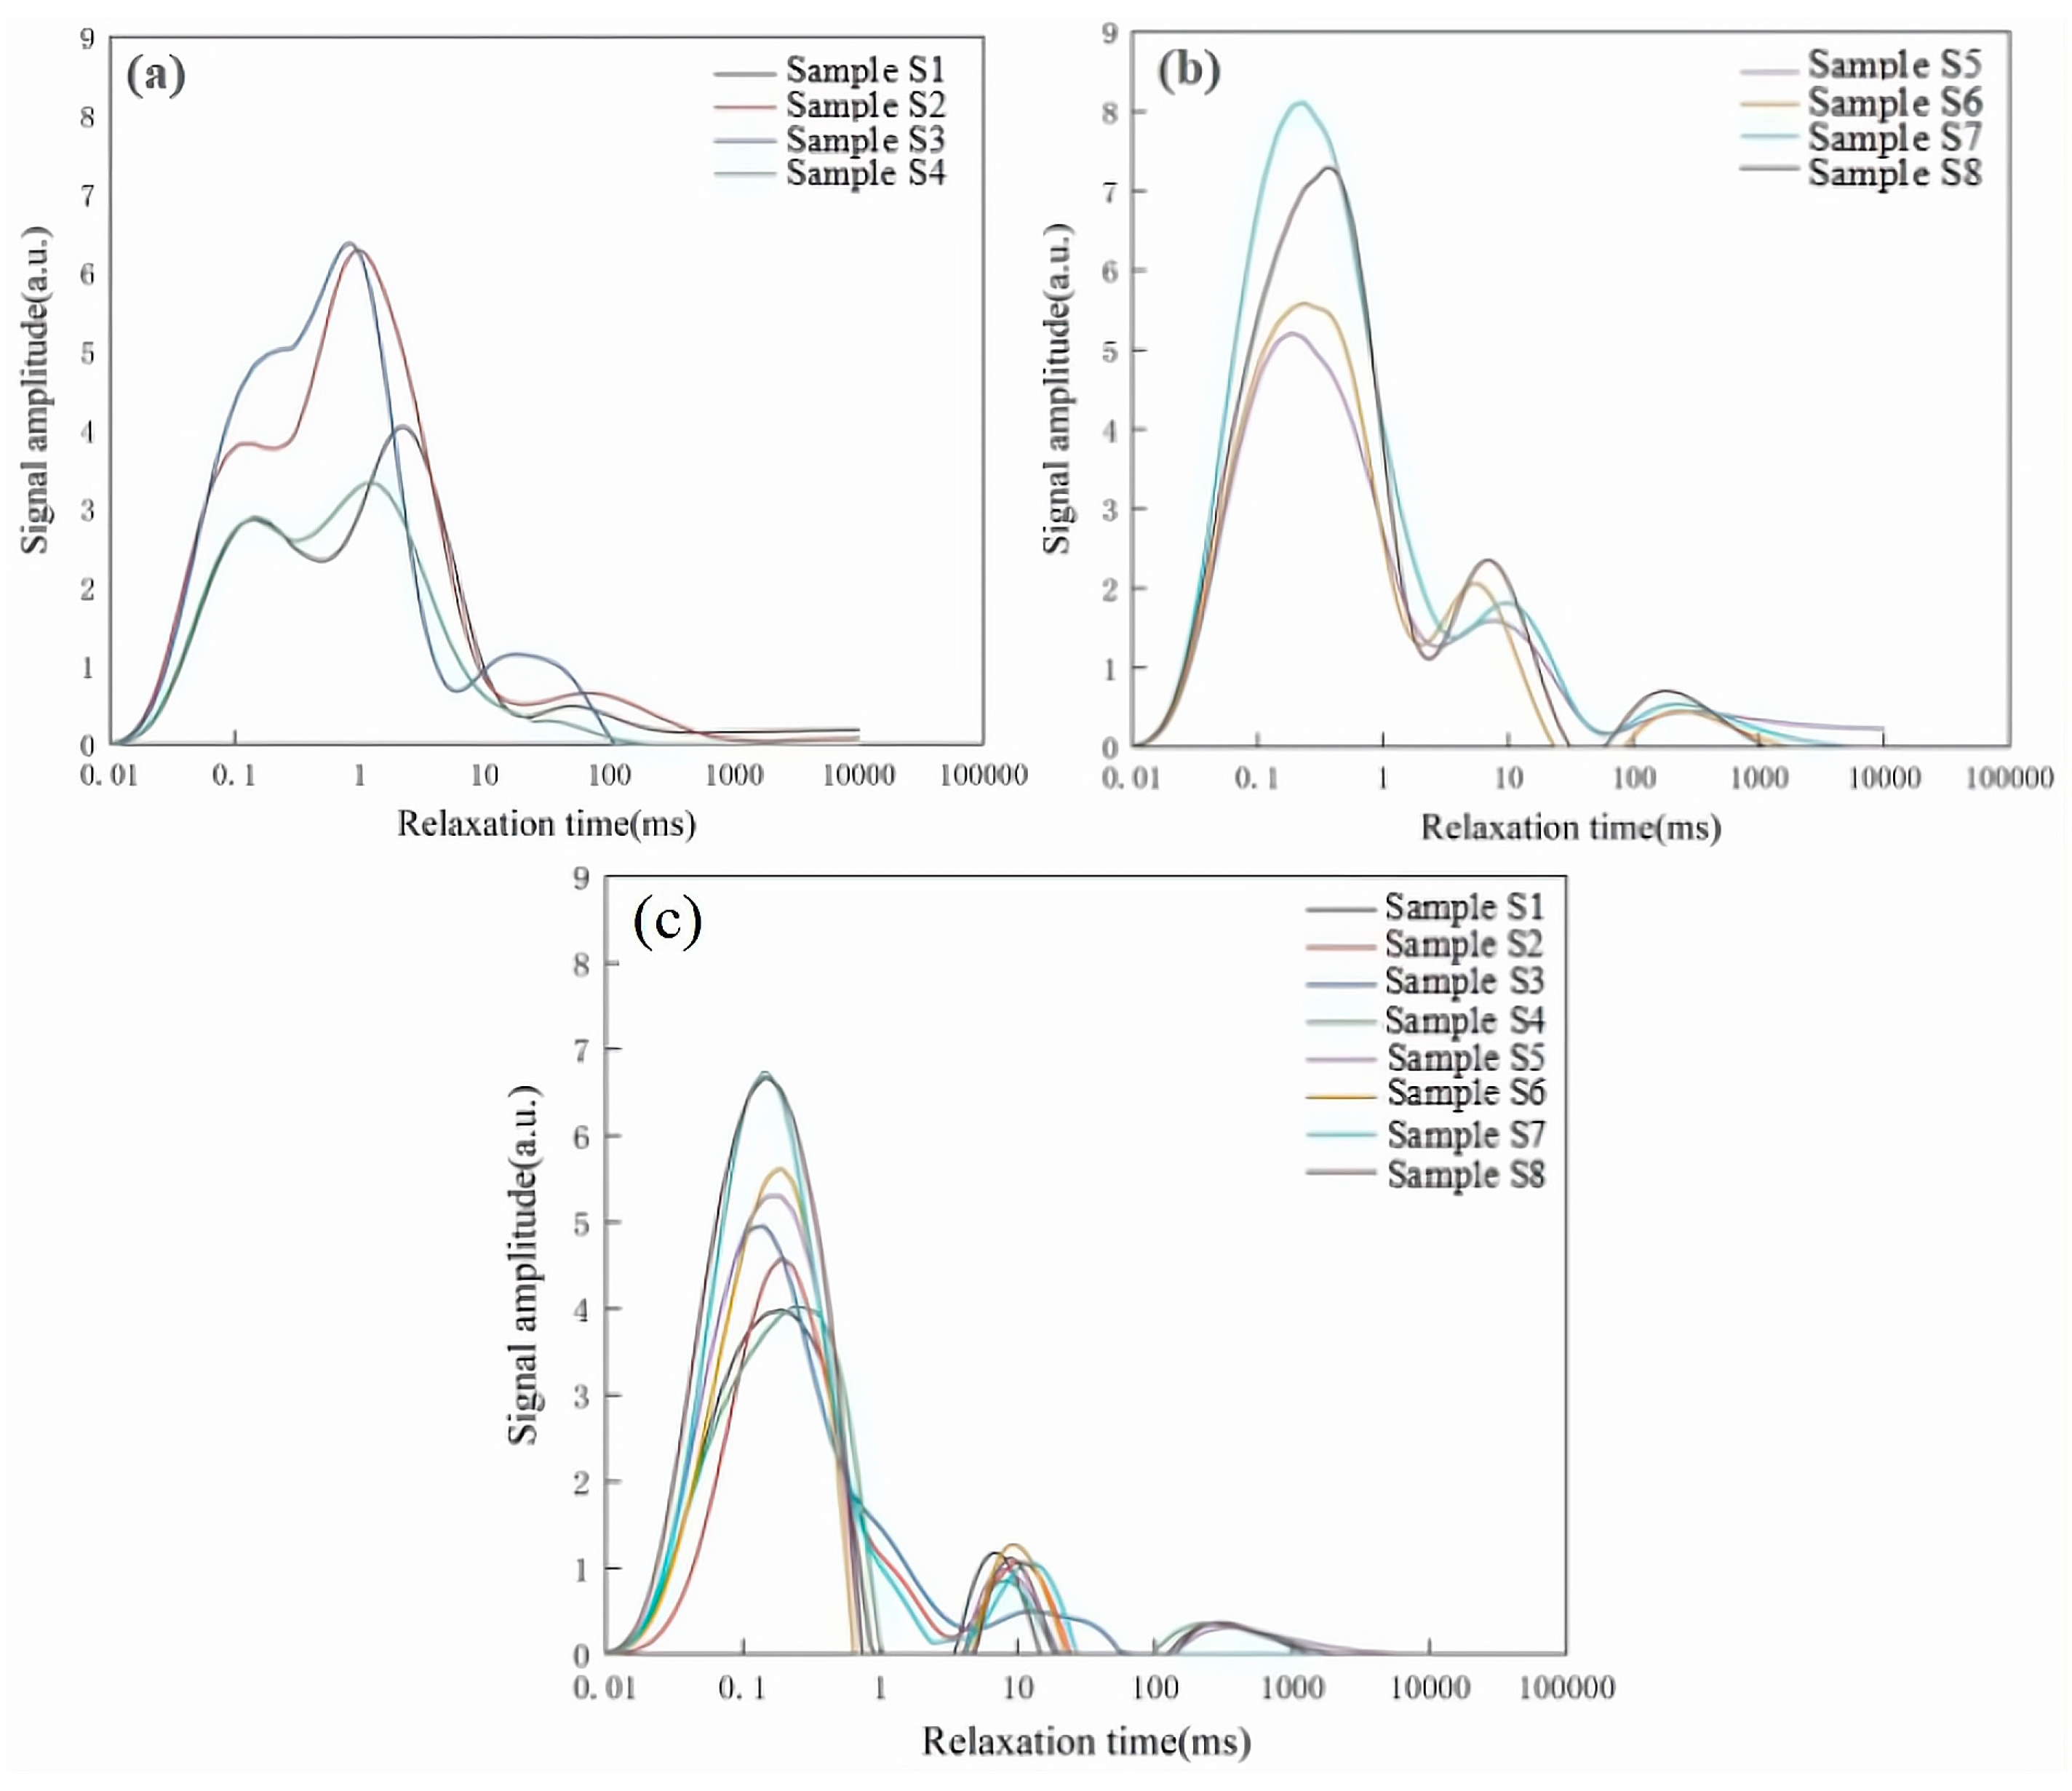
According to the scanning electron microscope results, there are mostly nano- and micron-scale pores inside the shale, and different methods have limited accuracy in characterizing the pore structure of shale. Therefore, this paper uses also the nuclear magnetic resonance method to characterize the pore structure of organic-rich marine shale, and the NMR T2 spectrum was calibrated using the pore size distribution obtained by high-pressure mercury porosimetry. Through the analysis of the NMR T2 spectra of the shale in the Longmaxi Formation in the study area, it was found that the T2 spectra in the dry samples all showed obvious “three peaks” characteristics (Figure 7c). An analysis of the occurrence status of water in different types of pores in shale shows that since the pores generated during the hydrocarbon generation and expulsion process of organic matter contain very little water, only a small amount of adsorbed water may adhere to the internal functional groups of kerogen. The surface of clay mineral particles in shale is highly hydrophilic, and the internal bound water cannot be completely removed even under drying conditions. Analyzing the T2 spectrum development characteristics of shale after saturation (Figure 7a,b), it is found that the T2 spectra of shale with different layers (lithofacies) are different. In the lower member (dominated by siliceous mineral; the main peak is identified in Figure 7a), we noted that the mesopores are more developed, while in the middle and upper member (Figure 7b), the mesopores and micropores are relatively developed.

4.2. Influence of Mineral Component on Elastic Parameter Characteristics and Brittleness Index

The brittleness index (BI) based on elastic parameters is widely used in actual shale fracturing development sites to characterize the fracability of rock masses; different expressions for BI have been proposed by considering characteristics of brittleness performance [41,48,49,50,51]. A single brittleness index obviously cannot establish the relationship between elastic parameters and mineral content. Therefore, this study examines the correlation between elastic parameters and mineral content. Here, we use the most convenient method, which considers the mineralogical compositions of organic-rich marine shale. According to Jarvie et al. [44], the BI is expressed as follows:
B I = Q Q + C A + C L
where Q is the weight content of quartz mineral, CA is the weight content of carbonate minerals, and CL is the weight of clay minerals. For samples group of S2, S6, S8, mineral composition based BI could be calculated, noted as BI1. Besides, a Brittleness index based on stress-strain curves are shown in Table 2, noted as BI2. From the data results, the brittleness evaluation index can better reflect the actual brittle fracture situation of Longmaxi organic-rich marine shale. For the S2 sample, the overall brittleness index is relatively high, about 2.19–3.50; the brittleness index of S6 and S8 shale samples is relatively low, with a brittleness index between 1.96 and 2.97. This brittleness index can better indicate the brittleness differences in Longmaxi organic-rich marine shale with different lithofacies due to different mechanical properties. Earlier findings suggested that the brittleness of the shale played a crucial role in stimulation, leading to the formation of a fracture network that resulted in elevated gas flow rates. In comparison to one of the most productive wells in the Barnett shale formation, which has a brittleness index (BI) exceeding 0.45, the Longmaxi shale exhibits a comparable BI, indicating a satisfactory level of fracability.
We additionally illustrate the progression of elastic modulus in relation to the increasing content of silicon and clay minerals in Figure 8. Our observations indicate a positive correlation between Young’s modulus and silicon mineral content (Figure 8a): as the silicon mineral content rises, the elastic modulus experiences a significant increase. Conversely, we have identified a negative correlation between clay mineral content and Young’s modulus, where an increase in clay content leads to a reduction in Young’s modulus (Figure 8b). This phenomenon may be attributed to the weakening effect on the mineral bond caused by phyllosilicate minerals. In order to further substantiate this hypothesis, we compiled data from various types of shale, including Barnett, Fort St. John, Hayesville, Eagle Ford, and Woodford, as referenced in previous studies [30,52]. The findings indicate a strong correlation, demonstrating that the elastic modulus diminishes as the phyllosilicate content rises.
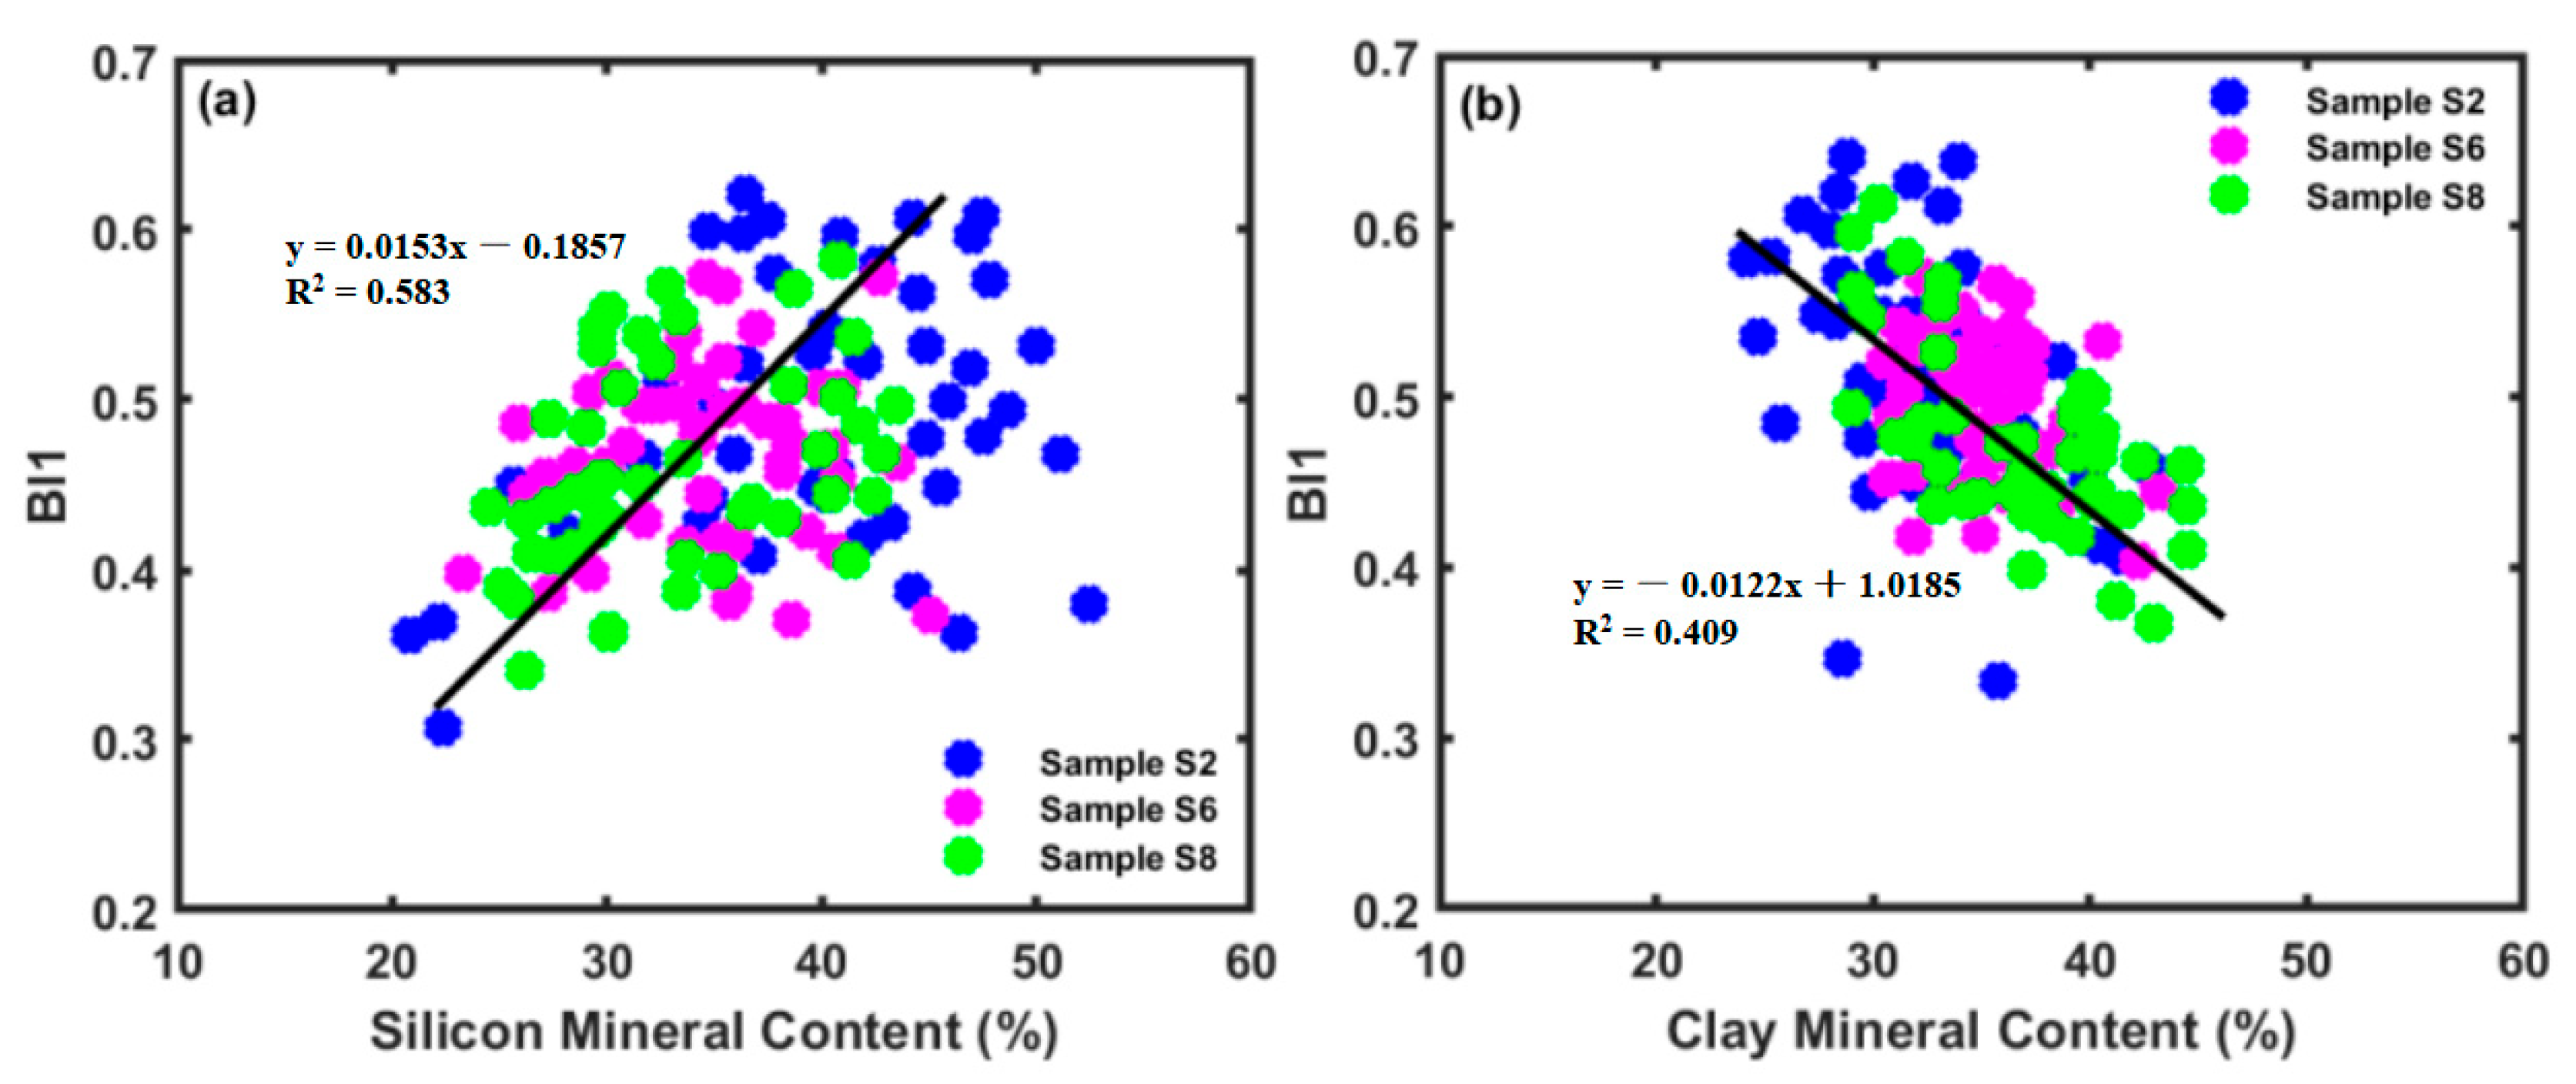
Additionally, we illustrated the progression of the brittleness index in relation to the increasing content of silicon and clay minerals in Figure 9. Our analysis revealed a positive correlation between the brittleness index and silicon mineral content (Figure 9a), indicating that as the silicon mineral content increases, the brittleness index also significantly rises, with an R2 value of 0.58. We observed an inverse correlation between the content of clay minerals and the brittleness index (Figure 9b). An increase in clay content leads to a reduction in the brittleness index, with an R2 value of 0.40. The presence of significant amounts of tectosilicate and carbonate minerals, which contribute to a higher brittleness index, facilitates the formation of hydraulic fractures, potentially resulting in fracture networks. Experimental findings demonstrate that the mineralogical composition of shale is crucial in influencing both macroscopic and microstructural geomechanical properties, including triaxial strength, tensile strength, uniaxial compressive strength, and elastic modulus. The Longmaxi shale contains numerous microfractures and organic pores enriched with phyllosilicate minerals, which serve as storage sites for shale gas and facilitate connections between hydraulic fractures, thereby improving matrix permeability. Additionally, shale with a higher concentration of phyllosilicate minerals exhibits reduced uniaxial compressive strength, tensile strength, elastic modulus, and triaxial strength.

4.3. Geomechanical Features Results

4.3.1. Uniaxial Compressive Strength Characteristics of Organic-Rich Shale

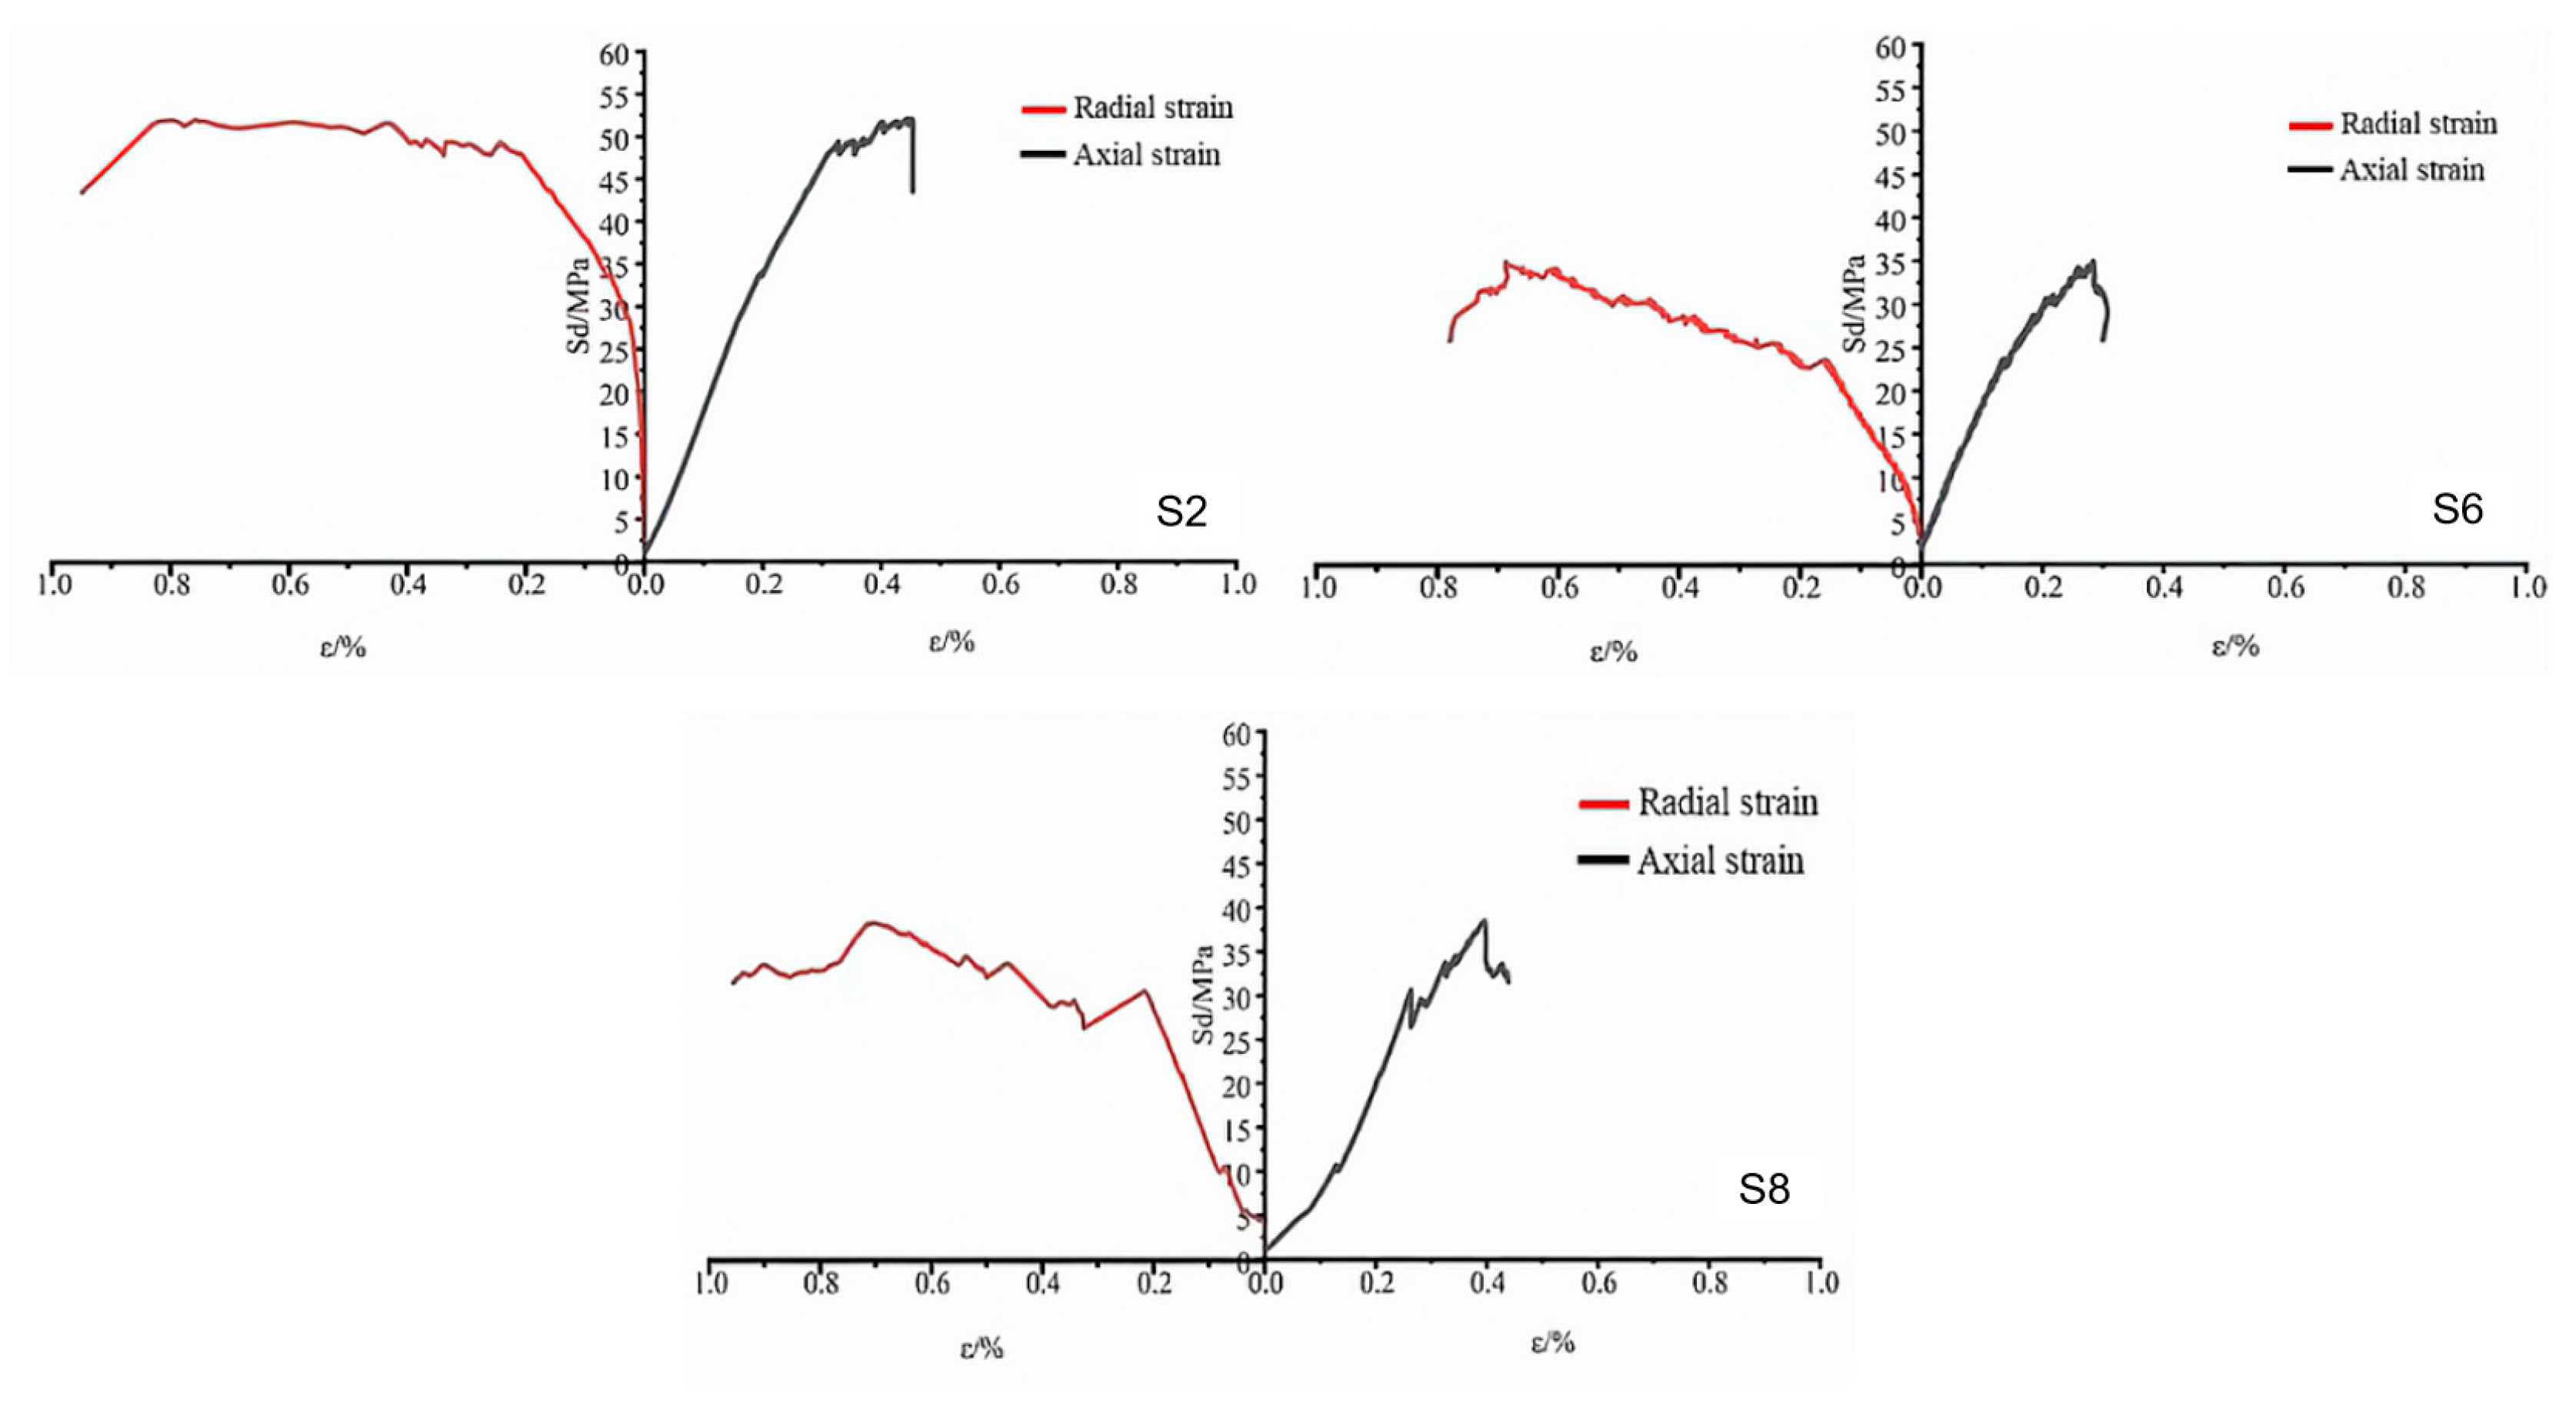
Figure 10 depicts the stress–strain curves from the uniaxial compression tests conducted on S8, S6, and S2 shale samples, each exhibiting varying bedding angles. Upon reviewing the results of the uniaxial compression experiments, it was noted that the compaction phase is not distinctly observable. This observation contrasts with findings from micromechanical experiments [53]. Notably, only the S8 sample (siliceous shale, as shown in Figure 10) demonstrates some compaction characteristics. This phenomenon may be associated with the relatively soft component present in clay samples. Furthermore, 5 samples from layer 2 was tested in Brazilian tensile experiment, from which it is observed that the tensile strength of shale samples with differing bedding angles varies, demonstrating clear anisotropic properties (Table 3). Through calculation and the processing of experimental data, the tensile strengths of deep shale with inclination angles of 0°, 30°, 45°, 60°, and 90° are 6.19 MPa, 13.67 MPa, 11.50 MPa, 9.01 MPa, and 7.13 MPa, respectively.

4.3.2. Triaxial Compression Characteristics of Organic-Rich Shale Under the Coupling Effect of Temperature and Pressure

Triaxial compression tests were conducted using the MTS equipment on core organic-rich shale samples at confining pressures ranging from 20 to 80 MPa and temperatures between 40 and 100 °C. Generally, we selected one group of samples in each member to represent our results (sample S2 from Layer ② of the lower member, sample S6 from Layer ⑥ of the middle member, and the sample S8 from Layer ⑧ of upper member; see Figure 1). The triaxial compression properties of the test specimens chosen to demonstrate our experiment study are shown in Table 4, and come from various Longmaxi organic-rich marine shale components.
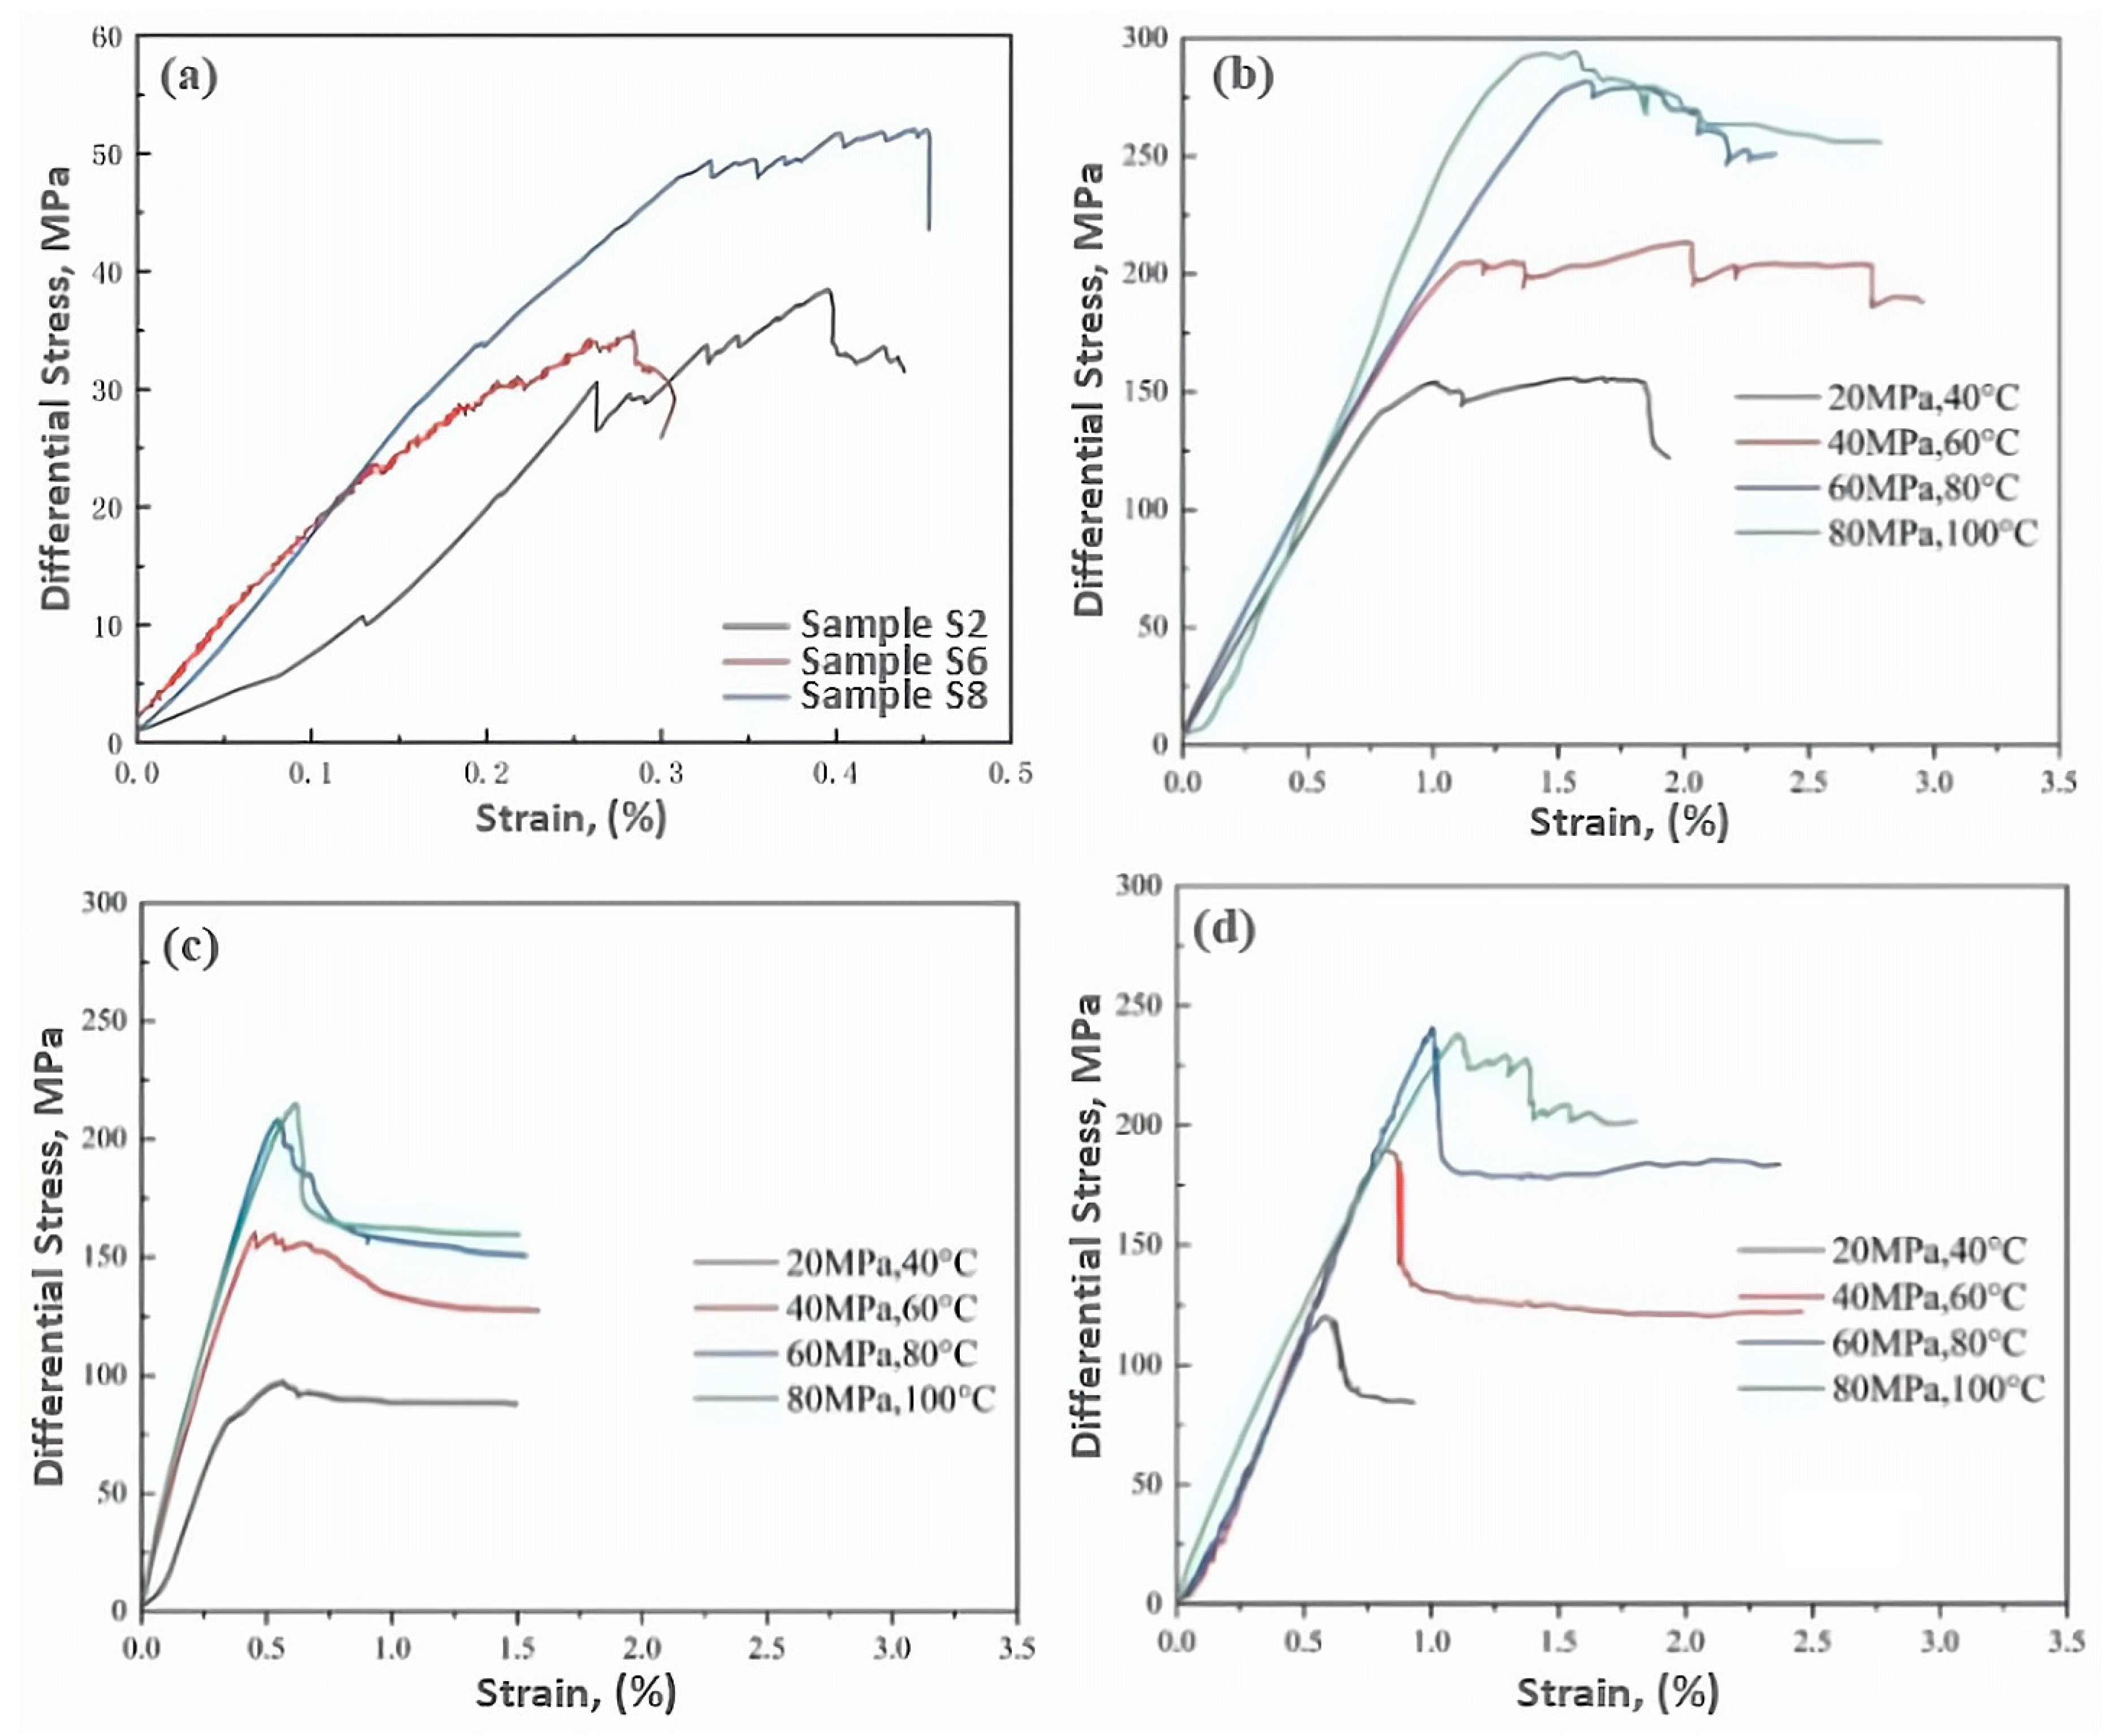
Figure 11 presents the stress–strain curves from the triaxial compression tests conducted on S2, S6, and S8 shale samples. The results indicate that all samples demonstrate a transition from semi-brittle to brittle behavior. In the case of brittle deformation, the rock undergoes minimal inelastic strain before a sudden failure occurs. Conversely, semi-brittle rocks display a more pronounced non-linear hardening leading up to the peak stress, followed by a gradual weakening of strain until stable residual stress is reached. The samples characterized by lower porosity and a predominance of clay (S8 and S6) exhibited semi-brittle failures, whereas the carbonate-rich sample (S2) showed a distinctly brittle failure. As illustrated in Figure 11b–d, the stress–strain curves exhibit distinct brittle plastic characteristics under identical axial stress conditions. Consequently, an analysis of the stress–strain curves suggests that the rock matrix possesses significant rigidity characteristics, indicated by a high elastic modulus, which prevents noticeable plastic deformation prior to failure.
Additionally, the triaxial deformation behavior of Longmaxi organic-rich shale is significantly affected by the pressure, particularly within the range of 20 to 80 MPa (Figure 11, and Table 4 and Table 5). As the confining pressure increases, the stress–strain curves transition from exhibiting the post-peak strain weakening at lower pressures to demonstrating nearly steady state deformation at elevated pressures. An examination of the compressive strength properties of various Longmaxi organic-rich shale samples indicates that both compressive strength and peak strain increase with rising temperature and pressure, as illustrated in Figure 11. Nevertheless, the overall magnitude of change diminishes progressively with increasing temperature and pressure. A comparison of three samples from different geological members reveals that specimen S8, sourced from the upper member and primarily composed of clay-rich siliceous shale, demonstrates a high damage strength, making it more susceptible to cracking, as shown in Figure 11d. This aligns with the micro-scale crack propagation mechanism, indicating that the relative proportions of siliceous and clay minerals significantly affect the mechanical features of organic-rich shale. Therefore, understanding the mineral composition of organic-rich shale is crucial for assessing its elastic characteristics. The lithology notably influences the compressive strength of organic shale. Among the samples analyzed, S2, which consists of siliceous shale, exhibits the highest overall compressive strength at 373.7 MPa when subjected to conditions of 80 MPa and 100 °C (Figure 11b). In comparison, the compressive strengths of S6 (Figure 11c) and S8 (Figure 11d) are recorded at 295.2 MPa and 314.11 MPa, respectively. This indicates that the presence of hard mineral particles, such as quartz, significantly affects the strength of the rock.
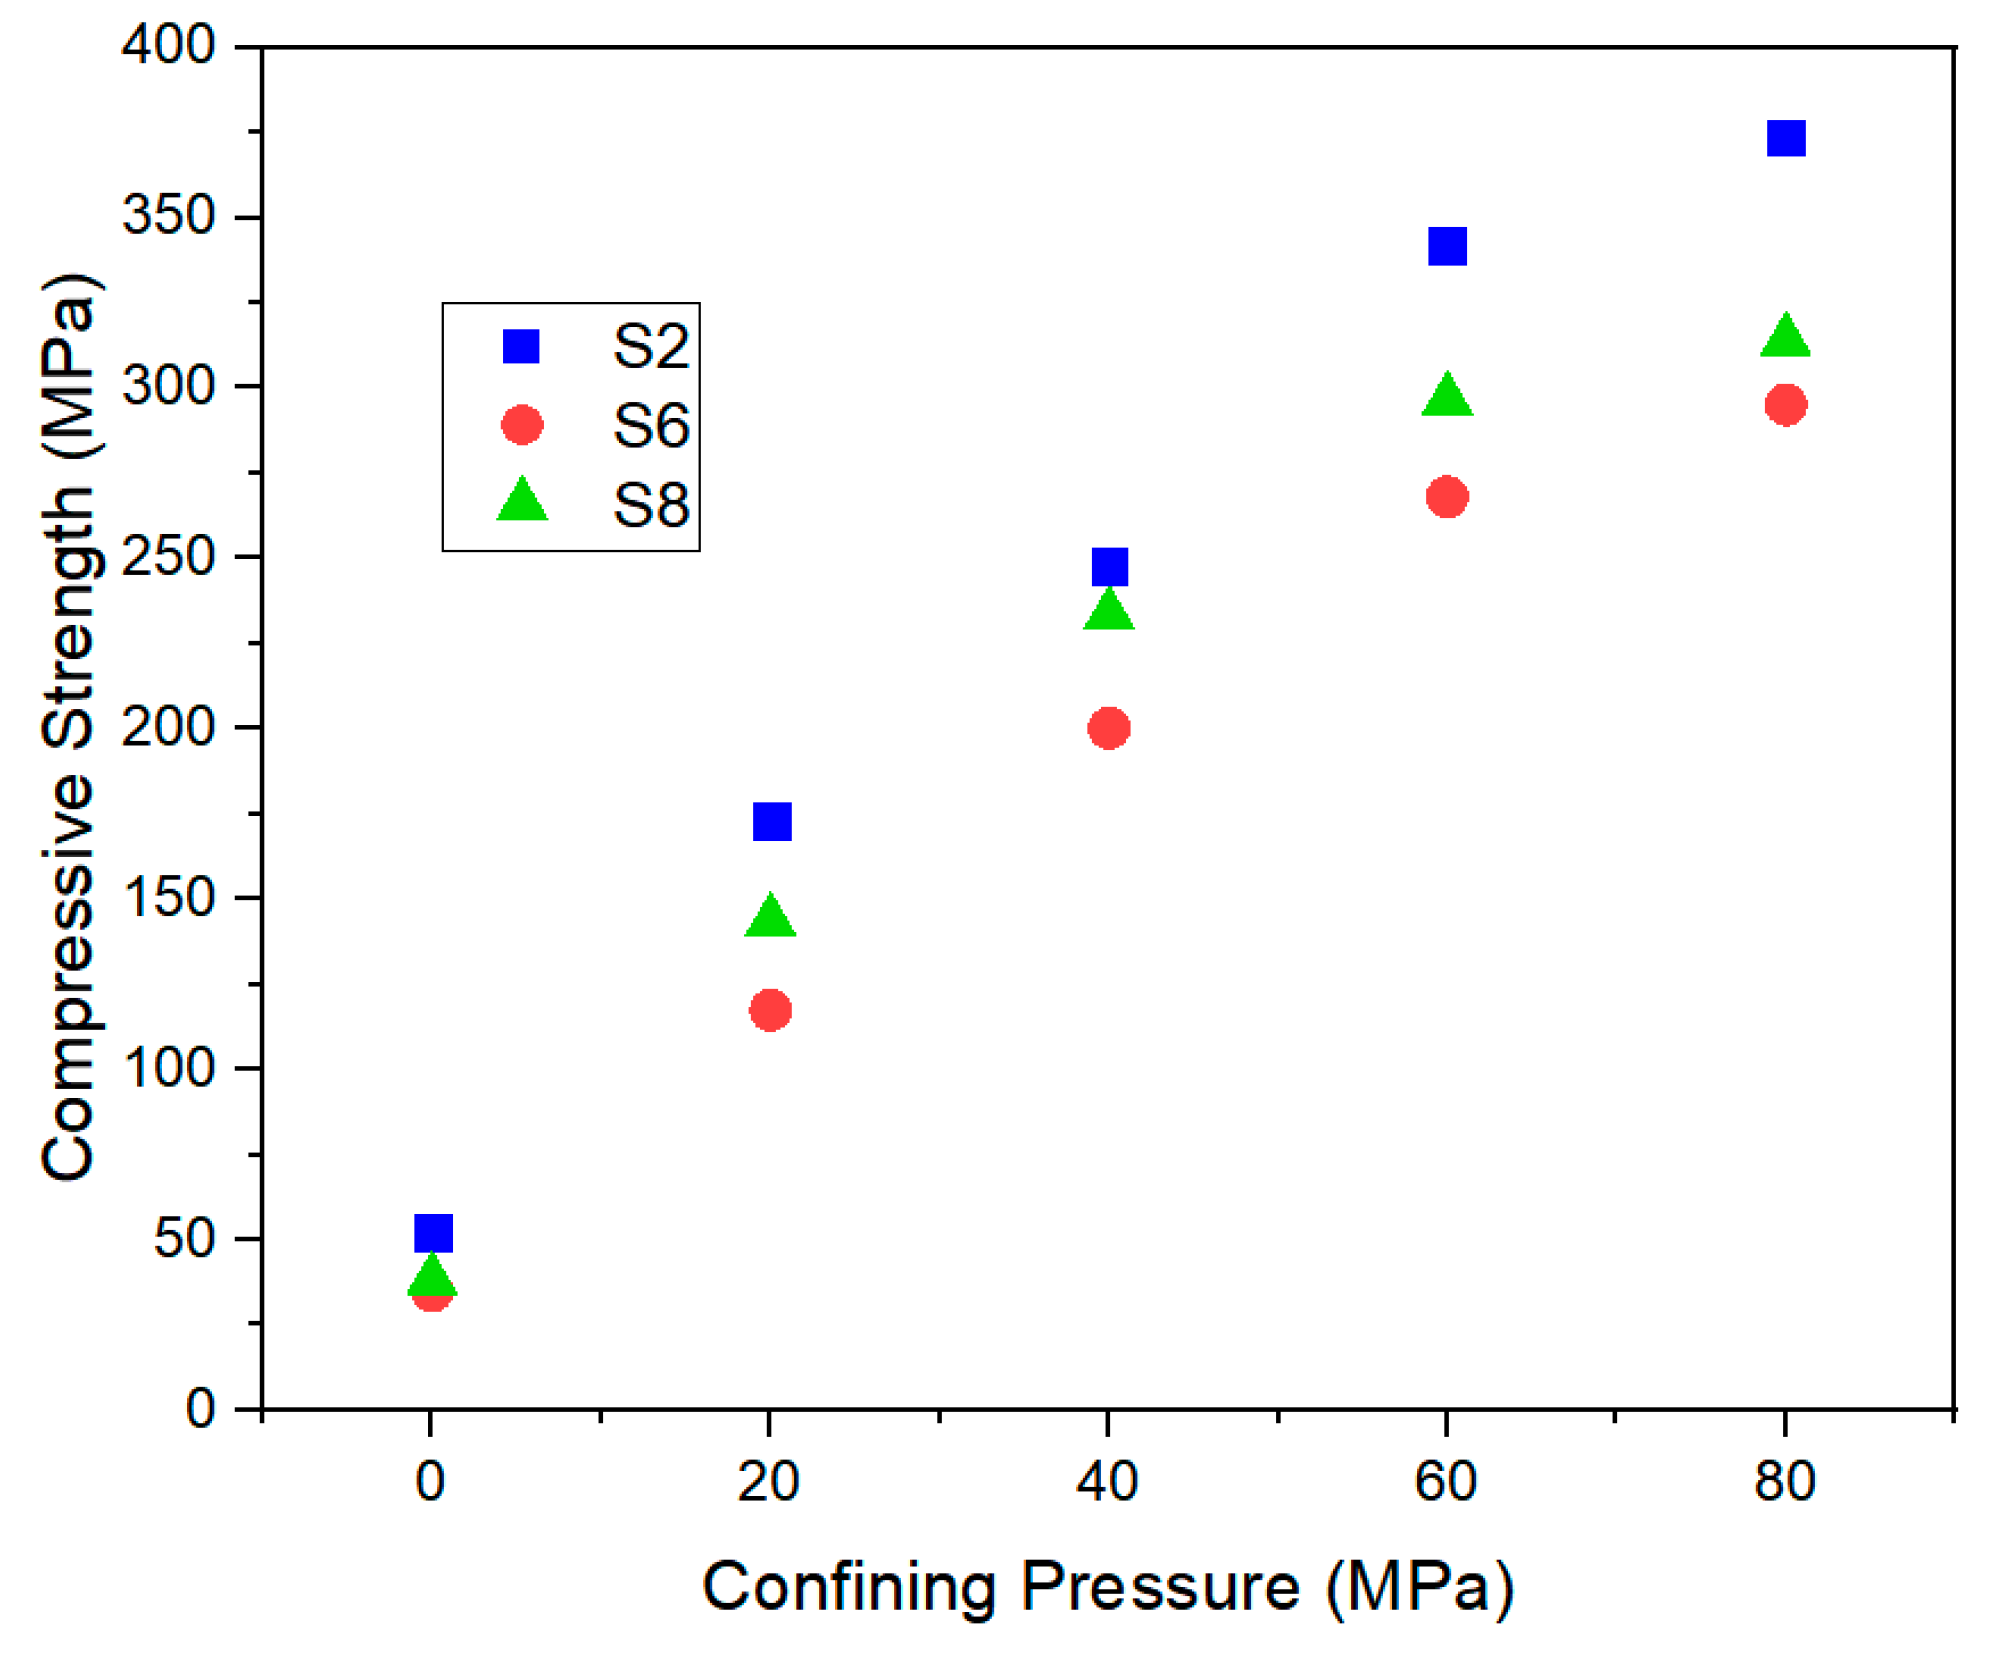
As detailed in Table 5, Young’s modulus for various shale samples from different layers, derived from the stress–strain curve obtained during the experiment, ranges from 17.92 GPa to 46.11 GPa. Furthermore, the maximum uniaxial compressive strengths for S2, S6, and S8 are 52.03 MPa, 34.95 MPa, and 38.43 MPa, respectively (Table 5). Figure 12 illustrates the correlation between confining stress and peak triaxial strength. As confining stress increases, the peak triaxial strength rises across three types of organic-rich shale specimens. The Longmaxi shale’s computed Poisson’s ratio and Young’s modulus are comparable to those found in other shale formations [54]. Young’s modulus values in the Carynginia and Kockatea shales of the Perth Basin range from 2.9 × 10⁶ psi (20 GPa) to 7.3 × 10⁶ psi (50.3 GPa), while Poisson’s ratio values range from 0.24 to 0.32, according to Labani and Rezaee [55]. According to Singh et al.’s [56] investigation, which aligns with the Mohr–Coulomb strength criteria, our observation presented in Figure 12 is fitted with a linear model. This finding is also in agreement with the outcomes regarding Young’s modulus, indicating that as clay content increases, the triaxial compression strength decreases. In conclusion, the Longmaxi shale exhibits greater tectosilicate mineral contents, elastic modulus, and strength features when compared to laboratory findings from other prosperous production regions in the USA, such as the Hayesville shale and Barnett shale [4,57,58,59,60].

4.4. Failure Mode of Different Organic-Rich Shale Samples Under the Coupling Effect of Temperature and Pressure

4.4.1. Triaxial Failure Mode Analysis

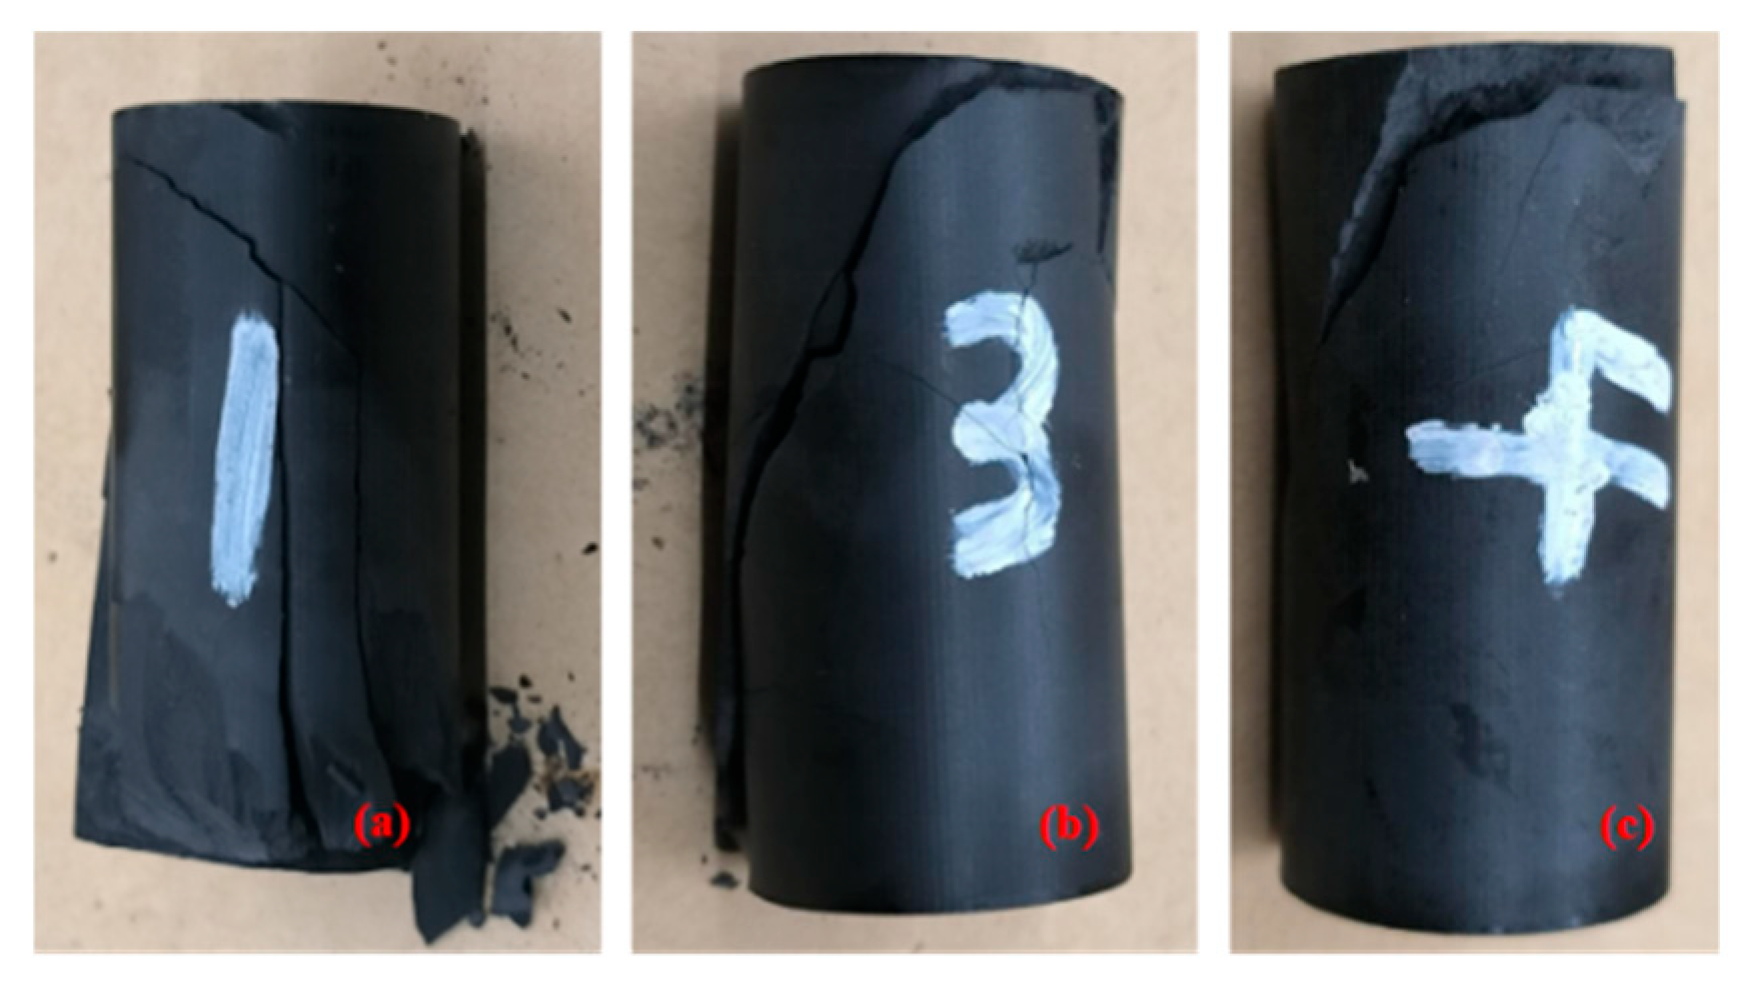
The failure behavior of shale subjected to triaxial confining pressure is significantly affected by the additional confining pressure relative to uniaxial compression. Figure 13a–c depict the failure patterns of the rock in various bedding orientations, revealing that a parallel bedding direction tends to exhibit a clear shear fracture alignment with the bedding. Following the fracture, the crossbedding progressively extends downward until the sample ultimately fractures. The surface of the shale bedding and the presence of microcracks are established, and these inherently weak surfaces influence the failure outcomes during testing, leading to the destruction of the crack surface in the bedding direction and resulting in multiple splitting failures, referred to as cross conjugate fractures. Figure 13a illustrates that triaxial fractures aligned with the vertical bedding open along the two bedding planes, creating parallel bedding conjugate fractures, with significant damage observed at the base of the rock sample and a pronounced end effect at the bottom. Figure 13b,c illustrate that when the included angle is 90° relative to the vertical bedding, the rock sample predominantly experiences shear failure at an angle aligned with the bedding direction, resulting in double shear failure within each laminated block. In terms of failure effects, the splitting failure is more comprehensive compared to the shear plane failure mode, leading to a greater number of failure structures. It is essential for the rock surface to possess adequate strength and exhibit poor homogeneity. Under loading conditions, the sample experiences an increase in coordinate deformation, leading to a rise in the number of microcracks in the local area. Conversely, a higher degree of homogeneity results in greater deformation resistance of the rock sample, leading to fewer microcracks, reduced energy dissipation, increased strength, and enhanced plasticity. During field drilling and fracturing operations, it is observed that most cores exhibit parallel bedding. The mode of rock failure is primarily evident in the direction of bedding displacement, suggesting that the bedding plane present in the shale reservoir leads to significant changes in strength and deformation anisotropy. For instance, during hydraulic fracturing, the fracturing fluid penetrates the bedding plane, resulting in a tendency to fracture the bedding while making it challenging to create network fractures.

4.4.2. Uniaxial Failure Mode Analysis

Figure 14 illustrates the failure modes of rock samples subjected to uniaxial conditions in both vertical and parallel bedding orientations within this region. The figure indicates that the S8, S6, and S2 shale samples exhibit relatively uncomplicated fractures following uniaxial loading, with a limited number of interlaced fractures present. Sample S2, which failed under uniaxial compression testing, showed conventional longitudinal failure lines. However, samples S6 and S8 showed a shear failure mode rather than uniaxial compression failure modes. This finding suggests that the fracture mode of shale is influenced by its own loading conditions. The fracture patterns observed in the three shale samples are varied, featuring few conjugate and simple shear fractures. The S2, S6, and S8 samples display fractures that are oriented parallel to the bedding planes. The presence of these natural weak planes influences the ultimate failure of the sample, facilitating the initiation and propagation of cracks along these planes. Numerous macroscopic cracks are observable along the bedding layers. The failure mode of the S2 sample (Figure 14a) following uniaxial loading is predominantly extensional, exhibiting a higher fracture density, which may be attributed to the relatively uniform structure or matrix of the calcareous shale. Additionally, the S6 and S8 shale specimens (Figure 14b,c) develop a limited number of simple shear fractures. The vertical orientation of the bedding rock surface creates shear joint interactions with the bedding, influenced by bedding shear, which do not reach the base of the rock. The lower half of the rock exhibits minimal crack propagation, with the sample predominantly displaying single shear failure. In conditions of reduced pressure and temperature, the fractures within organic-rich shale become more intricate post-failure, presenting a failure pattern characterized by interwoven low-angle shear joints. Under elevated pressure and temperature conditions, the failure characteristics of organic-rich shale are relatively straightforward, exhibiting a singular shear fracture at a specific angle. The influence of lithofacies on the failure mode is not pronounced, and the failure modes of organic-rich shale across various lithofacies demonstrate considerable consistency. Organic-rich shale from the same strata displays distinct brittleness traits when subjected to uniaxial compression, with its primary failure mode being splitting failure, and the damage strength of samples S6 and S8 is notably low.
Indeed, after the application of triaxial and uniaxial test experiments in our study, we can list some strengths and weaknesses that we have identified, which can obviously differentiate them from one another. We observed that the uniaxial compression test serves as a positive indicator of the resistance in formation, facilitates the direct assessment of rock strength, and analyzes of wellbore stability; the uniaxial compression test supplies uniaxial compressive stress data. However, with UCT, we noted also that the distribution of stress during testing is not uniform. The uniaxial stress exposure of the samples may lead to an underestimation of the unconfined compressive strength (UCS). Also, the evaluated elastic moduli do not accurately reflect the elastic feature of the confined specimen. According to the triaxial compression experiment, we noted that TCT aids the examination of how the anisotropy of rock strength is impacted by the fault plane’s direction. Also, the TCT helps to estimate failure variables and elastic modulus in reservoir during pressure and stress simulations. However, we also noted that large volumes of rock samples are necessary to apply the TCT, which is not always accessible.

4.4.3. Failure Mode of Deep Shale Under the Coupling Effect of Temperature and Pressure

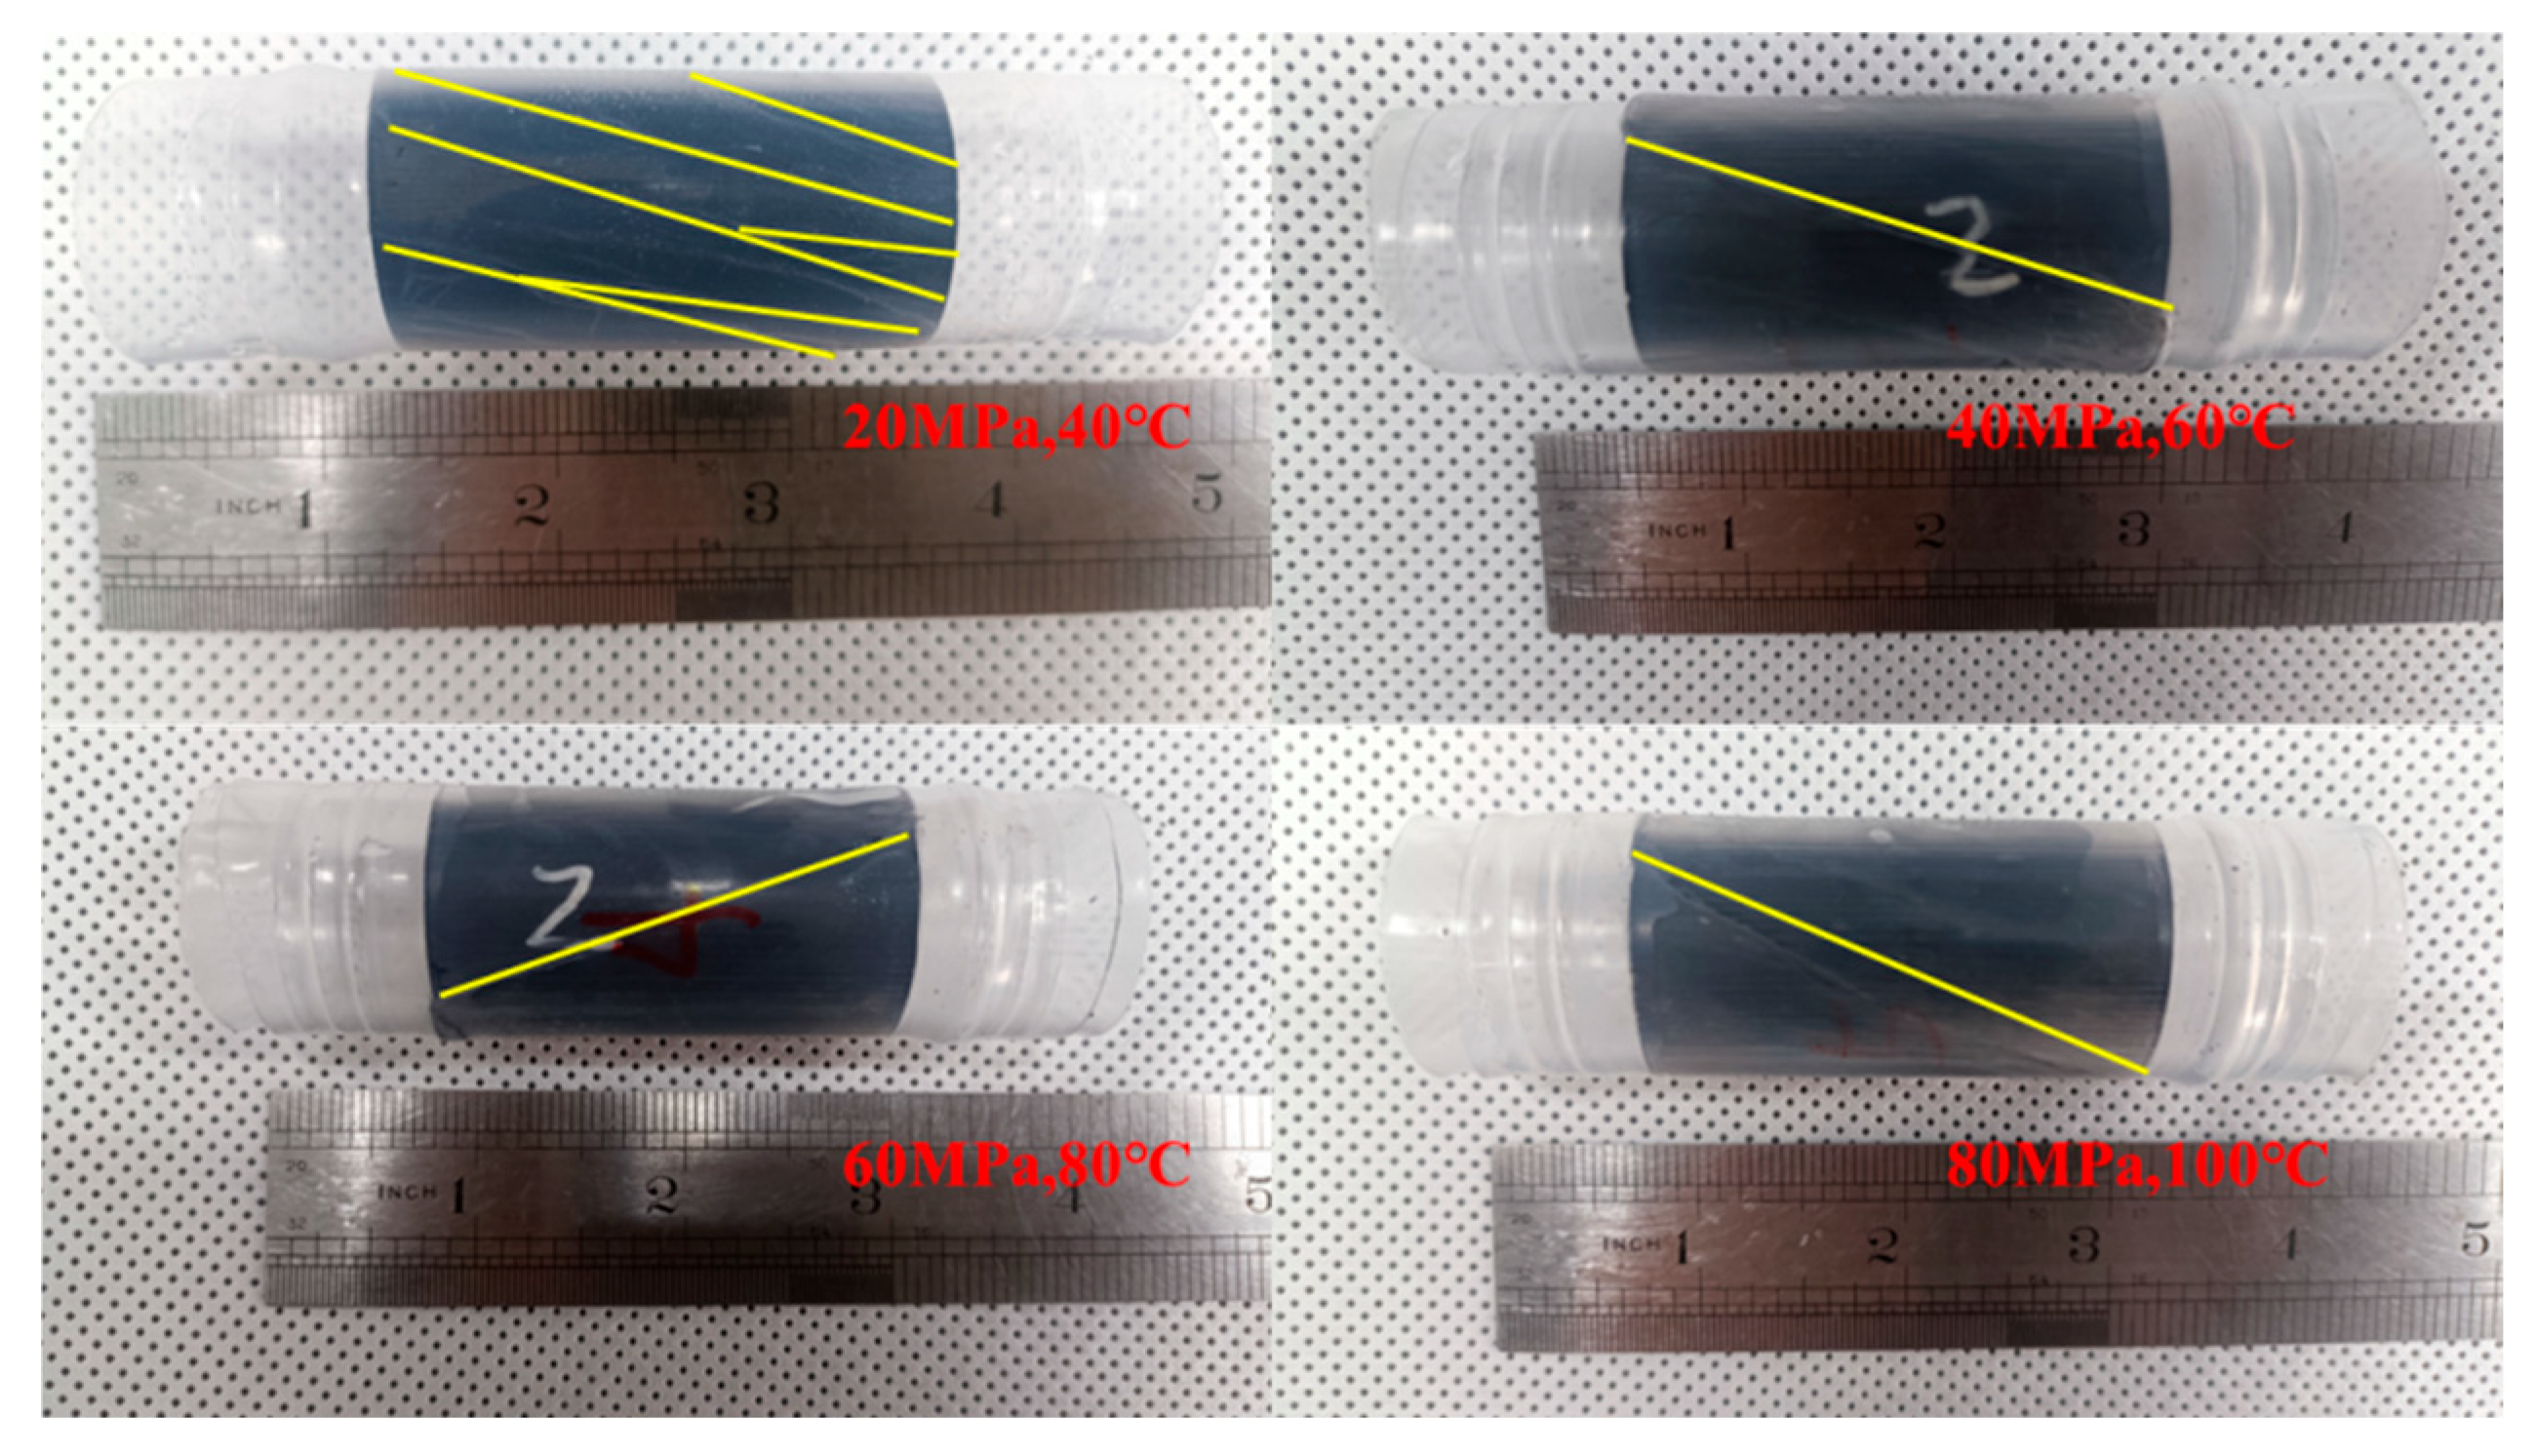
The failure characteristics of deep shale were summarized and analyzed. The failure mode of Longmaxi shale in the Fuling area during compression tests under different experimental conditions was mainly shear failure that penetrated the shale matrix (Figure 15). Under lower temperature and pressure conditions, the fractures in deep shale are more complex after failure, showing a failure form of intertwined low-angle shear joints. Under higher temperature and pressure conditions, the failure form of deep shale is relatively simple, showing a single shear fracture at a certain angle. The control effect of lithofacies on the failure mode is not obvious, and the failure modes of deep shale with different lithofacies have good consistency.
Based on this, the fracture criteria of deep shale can be analyzed. According to the characteristics of shear failure of shale samples in the experiment, consider using the M-C criterion to analyze its failure mechanism, as follows:
τ = σ t a n φ + c
In the formula, σ is the normal stress, MPa; τ is the shear strength, MPa; c is the cohesion force, MPa; and φ is the internal friction angle, (°). According to Mohr’s circle theory of stress, the following relationship is satisfied between normal stress and shear strength:
σ = σ 1 + σ 3 2 + σ 1 σ 3 2 c o s   2 θ
τ = σ 1 σ 3 2 s i n   2 θ
By drawing Mohr’s circle of the rupture strength of deep shale samples under different confining pressure conditions, and by using the geometric method to fit the equation coefficients of the M-C criterion, the shear stress at the rupture location can be determined. The intercept of the tangent line is the cohesion of the deep shale, and the inclination angle of the tangent line is the internal friction angle. As shown in Figure 16a through to Figure 16c, in the range of 60 MPa and 80 °C, deep shale conforms to linear failure characteristics. However, under high confining pressure conditions, the stress in Mohr’s circle deviates to a certain extent. Analysis based on the post-peak stress–strain curve shows that the deep shale still exhibits brittle failure under the coupling effect of temperature and pressure, but generally has a certain residual strength, indicating certain ductility characteristics. In siliceous shale, as the post-peak strain increases, the post-peak stress exhibits a step-by-step drop feature, indicating that small-scale damage can still occur under certain pressure conditions, and secondary cracks can occur within it. In mixed shale and clayey shale, as the post-peak strain increases, the residual strength is maintained within a certain range, and the brittle fracture after the peak point is affected. Therefore, the lithofacies characteristics of deep shale play an important role in its strength. When evaluating the brittleness of deep layers that require fracturing development, the controlling role of lithofacies must be fully considered.

5. Conclusions

This work focused on the microstructures, mineralogical compositions, geochemical and geomechanical characteristics, and petrophysical properties of organic-rich shale, and their impact on the initiation and spread of fractures in organic-rich shale. From this research investigation, we can infer the following conclusions:
  • Generally, the study on Well A demonstrated that based on variations in rock properties such as lithology, graptolite distribution, and rock resistivity, the Longmaxi shale is divided into three members. The results of the X-ray diffraction analysis indicated that the upper member is much more dominated by clay minerals while the lower member is dominated by the concentration of siliceous minerals. The silicon mineral concentration shows a steady rise from the upper layers to the lower layers, whereas the clay mineral concentration reveals a consistent decline in the same direction. Nanopores are prevalent, and elevated thermal maturities contribute to substantial gas storage capacity. A notable rise in total organic carbon, porosity, and the percentage of natural gas content was observed from the upper to the lower sections of the reservoir. Particularly promising results were noted in the lower member (Layers ①–⑤) of the reservoir.
  • The study of the geomechanical features confirmed that the elastic modulus, triaxial strength, brittleness index, the uniaxial compressive strength, and tensile strength of the Longmaxi shale exhibit significant variation as a result of differing mineralogical compositions. The elevated proportion of clay minerals reduce the triaxial strength, uniaxial compressive strength, brittleness index, and elastic modulus.
  • These characteristics increase the likelihood of forming fracture networks during hydraulic fracturing process. The presence of well-defined bedding planes will have a considerable impact on the propagation of hydraulic fractures, ultimately altering the distribution of the fracture network. The breakdown of the rock sample during triaxial–uniaxial compression loading primarily took place after the peak stress was attained, leading to the failure and rupture of the sample.
  • Nevertheless, we determined that triaxial–uniaxial compression loading represents a fracturing process in which gradual damage initiates upon reaching a specific stress threshold. The damage accumulates, ultimately leading to the failure of the samples at their maximum stress point. We recognized that this stress threshold varies for each group of samples, according to their mineral compositions. Also, the failure mechanisms observed in various shale specimens predominantly manifest as shear and extensional fractures.
  • Currently, more advanced simulation approaches to track the multi-field coupling effect throughout fracture initiation and growth is crucial to further understand and uncover the mechanism of crack initiation and growth. However, we believe that experimental study must be conducted in addition to these simulation approaches, to validate the outcomes of modeling.

Author Contributions

Conceptualization, L.K. and R.M.T.; methodology, R.M.T.; validation, R.M.T.; formal analysis, R.M.T.; investigation, L.K. and R.M.T.; resources, L.K.; data curation, R.M.T.; writing—original draft preparation, R.M.T.; writing—review and editing, L.K., R.S.L., S.J. and Z.W.; visualization, R.M.T.; supervision, L.K.; project administration, L.K.; and funding acquisition, L.K. All authors have read and agreed to the published version of the manuscript.

Funding

The authors thank the sponsorship by the Natural Science Foundation of Hubei Province (Grant No. 2023AFB110). The authors thank the Chinese Scholarship Council for their support. This study was funded by the National Science Foundation of China (Grant Nos. 42130803, 42072174, 52274044) and Jianghan Oilfield of SINOPEC Group.

Data Availability Statement

The raw data supporting the conclusions of this article will be made available by the authors on request.

Conflicts of Interest

There is no conflict of interest declared by the authors. Nothing in this article suggests that any of the authors conducted any research on humans or animals. Every single participant that was a part of the study provided informed consent.

Abbreviations

The following abbreviations are used in this manuscript:
XRD X-ray Diffraction
TOCTotal Organic Carbon
ISRMInternational Society for Rock Mechanics
MTSMaterials Triaxial Test Standard
MIPMercury Injection Porosimetry
SEMScanning Electron Microscopy
NMRNuclear Magnetic Resonance
BIBrittleness Index
UCSUnconfined Compressive Strength
UCTUniaxial Compression Test
TCTTriaxial Compression Test

References

  1. Chang, C.; Zoback, M.D.; Khaksar, A. Empirical relations between rock strength and physical properties in sedimentary rocks. J. Petrol. Sci. Eng. 2006, 51, 223–237. [Google Scholar] [CrossRef]
  2. Benson, S.M.; Cole, D.R. CO2 sequestration in deep sedimentary formations. Elements 2008, 4, 325–331. [Google Scholar] [CrossRef]
  3. Tuzingila, R.M.; Kong, L.; Koy Kasongo, R. Experimental Techniques and Rock Physics Modeling to Study the Effects of Mineral Content and Thermal Maturation on Elastic Properties of the Organic-Rich Shale: Case Study of the Longmaxi Formation. SPE J. 2025, 30, 1884–1905. [Google Scholar] [CrossRef]
  4. Tuzingila, R.M.; Kong, L.; Koy Kasongo, R. A review on experimental techniques and their applications in the effects of mineral content on geomechanical properties of reservoir shale rock. Rock Mech. Bull. 2024, 3, 100110. [Google Scholar] [CrossRef]
  5. Ma, Y.; Pan, Z.; Zhong, N.; Connell, L.D.; Down, D.I.; Lin, W.; Zhang, Y. Experimental study of anisotropic gas permeability and its relationship with fracture structure of Longmaxi Shales, Sichuan Basin, China. Fuel 2016, 180, 106–115. [Google Scholar] [CrossRef]
  6. Wang, X.; Shi, F.; Liu, H.; Wu, H.A. Numerical simulation of hydraulic fracturing in orthotropic formation based on the extended finite element method. J. Nat. Gas Sci. Eng. 2016, 33, 56–69. [Google Scholar] [CrossRef]
  7. Douma, L.A.N.R.; Regelink, J.A.; Bertotti, G.; Boersma, Q.D.; Barnhoorn, A. The mechanical contrast between layers controls fracture containment in layered rocks. J. Struct. Geol. 2019, 127, 103856. [Google Scholar] [CrossRef]
  8. Liu, J.X.; Liu, W.; Yang, C.H.; Huo, L. Experimental study on mechanical properties of mud shale under different strain rates. Rock Soil Mech. 2014, 35, 3093–3100. (In Chinese) [Google Scholar]
  9. Li, Q.; Chen, M.; Jin, Y.; Wang, F.P. Experimental research on failure modes and mechanical behaviors of gas-bearing shale. Chin. J. Rock Mech. Eng. 2012, 31 (Suppl. S2), 3763–3771. [Google Scholar]
  10. Diao, H. Rock mechanical properties and brittleness evaluation of shale reservoir. Acta Petrol. Sin. 2013, 29, 3300–3306. [Google Scholar]
  11. Chen, T.; Feng, X.; Zhang, X.; Cao, W.D.; Fu, C.J. Experimental study on mechanical and anisotropic properties of black shale. Chin. J. Rock Mech. Eng. 2014, 33, 1772–1779. [Google Scholar]
  12. Jia, Y.; Tang, J.; Lu, Y.; Lu, Z. Laboratory Geomechanical and Petrophysical Characterization of Longmaxi Shale Properties in Lower Silurian Formation, China. Mar. Pet. Geol. 2021, 124, 104800. [Google Scholar] [CrossRef]
  13. Zhang, Y.; Liu, J.; Mao, H.; Huo, L.; Hou, Z.K. Anisotropic experimental study on mechanical properties of shale under uniaxial compression. Met. Mine 2015, 44, 33–37. [Google Scholar]
  14. Jia, C.; Chen, J.; Guo, Y.; Yang, C.H.; Xu, J.B.; Wang, L. Research on mechanical behaviors and failure modes of layer shale. Rock Soil Mech. 2013, 34 (Suppl. S2), 57–61. [Google Scholar]
  15. Chen, Y.; Watanabe, K.; Kusuda, H.; Kusaka, E.; Mabuchi, M. Crack growth in Westerly granite during a cyclic loading test. Eng. Geol. 2011, 117, 189–197. [Google Scholar] [CrossRef]
  16. Xiao, J.; Ding, D.; Jiang, F.; Xu, G. Fatigue damage variable and evolution of rock subjected to cyclic loading. Int. J. Rock Mech. Min. Sci. 2010, 47, 461–468. [Google Scholar] [CrossRef]
  17. Dubey, R.K.; Gairola, V.K. Influence of structural anisotropy on the uniaxial compressive strength of pre-fatigued rocksalt from Himachal Pradesh, India. Int. J. Rock Mech. Min. Sci. 2000, 37, 993–999. [Google Scholar] [CrossRef]
  18. Qiu, S.; Feng, X.; Xiao, J.; Zhang, C. An experimental study on the pre-peak unloading damage evolution of marble. Rock Mech. Rock Eng. 2014, 47, 401–419. [Google Scholar] [CrossRef]
  19. Zhang, J.; Zhou, S.; Xu, X.; Fang, L. Evolution of the elastic properties of a bedded argillite damaged in cyclic triaxial tests. Int. J. Rock Mech. Min. Sci. 2013, 58, 103–110. [Google Scholar] [CrossRef]
  20. Gatelier, N.; Pellet, F.; Loret, B. Mechanical damage of an anisotropic porous rock in cyclic triaxial tests. Int. J. Rock Mech. Min. Sci. 2002, 39, 335–354. [Google Scholar] [CrossRef]
  21. Xie, R.; Zhou, W.; Liu, C.; Yin, S.; Radwan, A.E.; Lei, W.; Cai, W. Experimental investigation on dynamic and static rock mechanical behavior, failure modes, and sequences of frequent interbedded sand and shale reservoirs. Interpretation 2022, 10, SF23–SF36. [Google Scholar] [CrossRef]
  22. Mustafa, A.; Tariq, Z.; Mahmoud, M.; Radwan, A.E.; Abdulraheem, A.; Abouelresh, M.O. Data-driven machine learning approach to predict mineralogy of organic-rich shales: An example from Qusaiba Shale, Rub’ al Khali Basin, Saudi Arabia. Mar. Pet. Geol. 2022, 137, 105495. [Google Scholar] [CrossRef]
  23. Sohail, G.M.; Radwan, A.E.; Mahmoud, M. A review of Pakistani shales for shale gas exploration and comparison to North American shale plays. Energy Rep. 2022, 8, 6423–6442. [Google Scholar] [CrossRef]
  24. Niandou, H.; Shao, J.F.; Henry, J.P.; Fourmaintraux, D. Laboratory investigation of the mechanical behaviour of Tournemire shale. Int. J. Rock Mech. Min. Sci. 1997, 34, 3–16. [Google Scholar] [CrossRef]
  25. Wang, M.; Tan, C.; Meng, J.; Yang, B.; Li, Y. Crack classification and evolution in anisotropic shale during cyclic loading tests by acoustic emission. J. Geophys. Eng. 2017, 14, 930–938. [Google Scholar] [CrossRef]
  26. Wang, M.; Xiao, L. The b-value analysis of bedded shale under cyclic loading tests. J. Geophys. Eng. 2018, 15, 1291–1299. [Google Scholar] [CrossRef]
  27. Yang, B.; Xue, L.; Wang, M.; Li, Y. Study on damage-fracture of shale based on the energy principle. J. Basic Sci. Eng. 2018, 26, 997–1004. [Google Scholar]
  28. Xu, D.; Yuan, X.; Wu, J.; Fan, L.; Yang, X.; Tang, Y.; Zhang, J. Optimal design of cumulative shale gas hydraulic fracturing process based on rock fatigue damage theory. Integr. Ferroelectr. Int. J. 2019, 200, 99–107. [Google Scholar] [CrossRef]
  29. Guo, Y.; Yang, C.; Wang, L.; Xu, F. Effects of cyclic loading on the mechanical properties of mature bedding shale. Adv. Civ. Eng. 2018, 2018, 8985973. [Google Scholar] [CrossRef]
  30. Sone, H.; Zoback, M. Mechanical properties of shale-gas reservoir rocks—Part 1: Static and dynamic elastic properties and anisotropy. Geophysics 2013, 78, D381–D392. [Google Scholar] [CrossRef]
  31. Loucks, R.G.; Reed, R.M.; Ruppel, S.C.; Hammes, U. Spectrum of pore types and networks in mudrocks and a descriptive classification for matrix-related mudrock pores. AAPG Bull. 2012, 96, 1071–1098. [Google Scholar] [CrossRef]
  32. Tuzingila, R.M.; Kong, L.; Koy Kasongo, R. Contribution of Anisotropic Features of an Organic-Rich Shale Gas Reservoir on Hydraulic Fracturing. J. Energy Eng. 2025, 151, 04025042. [Google Scholar] [CrossRef]
  33. Tuzingila, R.M.; Kong, L.; Koy Kasongo, R. Investigation of the Mineral Content and Geomechanical Behaviors of Shale Gas Reservoirs after CO2 Injection Using Rock Physics Modeling. Int. J. Geomech. 2025, 25, 04025217. [Google Scholar] [CrossRef]
  34. Revil, A.; Grauls, D.; Brevart, O. Mechanical compaction of sand/clay mixtures. J. Geophys. Res. 2002, 107, 2293. [Google Scholar] [CrossRef]
  35. Crawford, B.R.; Faulkner, D.R.; Rutter, E.H. Strength, porosity, and permeability development during hydrostatic and shear loading of synthetic quartz-clay fault gouge. J. Geophys. Res. Solid Earth 2008, 113, 1–14. [Google Scholar] [CrossRef]
  36. Kohli, A.H.; Zoback, M.D. Frictional properties of shale reservoir rocks. J. Geophys. Res. Solid Earth 2013, 118, 5109–5125. [Google Scholar] [CrossRef]
  37. Yang, R.; Hao, F.; He, S.; He, C.; Guo, X.; Yi, J.; Hu, H.; Zhang, S.; Hu, Q. Experimental investigations on the geometry and connectivity of pore space in organic-rich Wufeng and Longmaxi shales. Mar. Pet. Geol. 2017, 84, 225–242. [Google Scholar] [CrossRef]
  38. Chen, L.; Lu, Y.; Jiang, S.; Li, J.; Guo, T.; Luo, C. Heterogeneity of the lower Silurian Longmaxi marine shale in the southeast Sichuan Basin of China. Mar. Pet. Geol. 2015, 65, 232–246. [Google Scholar] [CrossRef]
  39. Ling, K.; He, J.; Pei, P.; Wang, S.; Ni, X. Comparisons of Biot’s Coefficients of Bakken Core Samples Measured by Three Methods. In Proceedings of the 50th US Rock Mechanics/Geomechanics Symposium, Houston, TX, USA, 26–29 June 2016; American Rock Mechanics Association: Westminster, CO, USA, 2016. [Google Scholar]
  40. Zhou, H.; Wei, L.; Wang, T.; Wang, Y.; Pang, H.; Zhang, T. Evaluation method of Weirong deep shale gas reservoir and its application. Pet. Reserv. Eval. Dev. 2021, 11, 42–49. [Google Scholar]
  41. Chen, Y.; Jin, Y.; Chen, M.; Yi, Z.; Zheng, X. Quantitative evaluation of rock brittleness based on the energy dissipation principle, an application to type II mode crack. J. Nat. Gas Sci. Eng. 2017, 45, 527–536. [Google Scholar] [CrossRef]
  42. Liu, H.; Lai, B.; Chen, J. Unconventional spontaneous imbibition into shale matrix: Theory and a methodology to determine relevant parameters. Transp. Porous Media 2016, 111, 41–57. [Google Scholar] [CrossRef]
  43. Slatt, R.M.; Abousleiman, Y. Merging Sequence Stratigraphy and Geomechanics for Unconventional Gas Shales. Lead. Edge 2011, 30, 274–282. [Google Scholar] [CrossRef]
  44. Jarvie, D.M.; Hill, R.J.; Ruble, T.E.; Pollastro, R.M. Unconventional shale-gas systems: The Mississippian Barnett Shale of north-central Texas as one model for thermogenic shale-gas assessment. Am. Assoc. Petrol. Geol. Bull. 2007, 91, 475–499. [Google Scholar] [CrossRef]
  45. Loucks, R.G.; Reed, R.M.; Ruppel, S.C.; Jarvie, D.M. Morphology, genesis, and distribution of nanometer-scale pores in siliceous Mudstones of the Mississippian Barnett shale. J. Sediment. Res. 2009, 79, 848–861. [Google Scholar] [CrossRef]
  46. Shao, X.-H.; Pang, X.-Q.; Li, M.-W.; Li, Z.-M.; Zhao, Y. Hydrocarbon Generation from Lacustrine Shales with Retained Oil during Thermal Maturation. Pet. Sci. 2020, 17, 1478–1490. [Google Scholar] [CrossRef]
  47. Qin, Z.; Liu, Z.; Liu, C.; Zhu, X.; Steel, R.J.; Tian, H.; Wang, K.; Song, Z. Experimental Study on the Development Characteristics and Controlling Factors of Microscopic Organic Matter Pore and Fracture System in Shale. Front. Earth Sci. 2021, 9, 773960. [Google Scholar] [CrossRef]
  48. Tuzingila, R.M.; Kong, L.; Li, C.; Wang, Z.; Landu, C.Z. Impact of Rock−ScCO2 Interaction on Shale Features and Its Implication in CO2 Geological Storage and Fracturing: Review and Perspectives. Energy Fuels 2025, 39, 18311–18349. [Google Scholar] [CrossRef]
  49. Song, C.; Elsworth, D.; Zhi, S.; Wang, C. The influence of particle morphology on microbially induced CaCO3 clogging in granular media. Mar. Georesources Geotechnol. 2019, 39, 74–81. [Google Scholar] [CrossRef]
  50. Song, C.; Elsworth, D. Strengthening mylonitized soft-coal reservoirs by microbial mineralization. Int. J. Coal Geol. 2018, 200, 166–172. [Google Scholar] [CrossRef]
  51. Zhang, D.; Ranjith, P.G.; Perera, M.S.A. The brittleness indices used in rock mechanics and their application in shale hydraulic fracturing: A review. J. Petrol. Sci. Eng. 2016, 143, 158–170. [Google Scholar] [CrossRef]
  52. Abousleiman, Y.; Tran, M.; Hoang, S. Geomechanics field and laboratory characterization of Woodford shale: The next gas play. In Proceedings of the SPE Annual Technical Conference and Exhibition, Anaheim, CA, USA, 11–14 November 2007. [Google Scholar]
  53. Rozhko, A.Y.; Kim, S.; Mews, K.S.; Lozovyi, S.; Holt, R.M. Manifestation of Negative Microfracture Compressibility Due to Capillarity in Tight Rocks at Partial Saturation with Free Gas’. Rock Mech. Rock Eng. 2024, 57, 9121–9143. [Google Scholar] [CrossRef]
  54. Aoudia, K.; Miskimins, J.L.; Harris, N.B.; Mnich, C.A. Statistical analysis of the effects of mineralogy on rock mechanical properties of the Woodford shale and the associated impacts for hydraulic fracture treatment design. In Proceedings of the 44th US Rock Mechanics Symposium and 5th US–Canada Rock Mechanics Symposium, Salt Lake City, UT, USA, 27–30 June 2010; p. 11. [Google Scholar]
  55. Labani, M.M.; Rezaee, R. The importance of geochemical parameters and shale composition on rock mechanical properties of gas shale reservoirs: A case study from the Kockatea Shale and Carynginia Formation from the Perth Basin, Western Australia. Rock Mech. Rock Eng. 2015, 48, 1249–1257. [Google Scholar] [CrossRef]
  56. Singh, M.; Raj, A.; Singh, B. Modified Mohr-Coulomb criterion for non-linear triaxial and polyaxial strength of intact rocks. Int. J. Rock Mech. Min. Sci. 2011, 48, 546–555. [Google Scholar] [CrossRef]
  57. Bowker, K.A. Barnett shale gas production, Fort Worth basin: Issues and discussion. AAPG Bull. 2007, 91, 523–533. [Google Scholar] [CrossRef]
  58. Buller, D.; Hughes, S.; Market, J.; Petre, E.; Spain, D.; Odumosu, T. Petrophysical evaluation for enhancing hydraulic stimulation in horizontal shale gas wells. In Proceedings of the SPE Annual Technical Conference and Exhibition Florence, Florence, Italy, 19–22 September 2010. [Google Scholar]
  59. Mullen, J. Petrophysical characterization of the eagle ford shale in south Texas. In Proceedings of the Canadian Unconventional Resources and International Petroleum Conference, Calgary, AB, Canada, 19–21 October 2010. [Google Scholar]
  60. Valter, C.; Alda, M.; Maurizio, M.; Elio, R.; Roberto, G.; Andrea, O. Gas shale reservoir characterization: A North Africa case. In Proceedings of the SPE Annual Technical Conference and Exhibition, Florence, Italy, 19–22 September 2010. [Google Scholar]
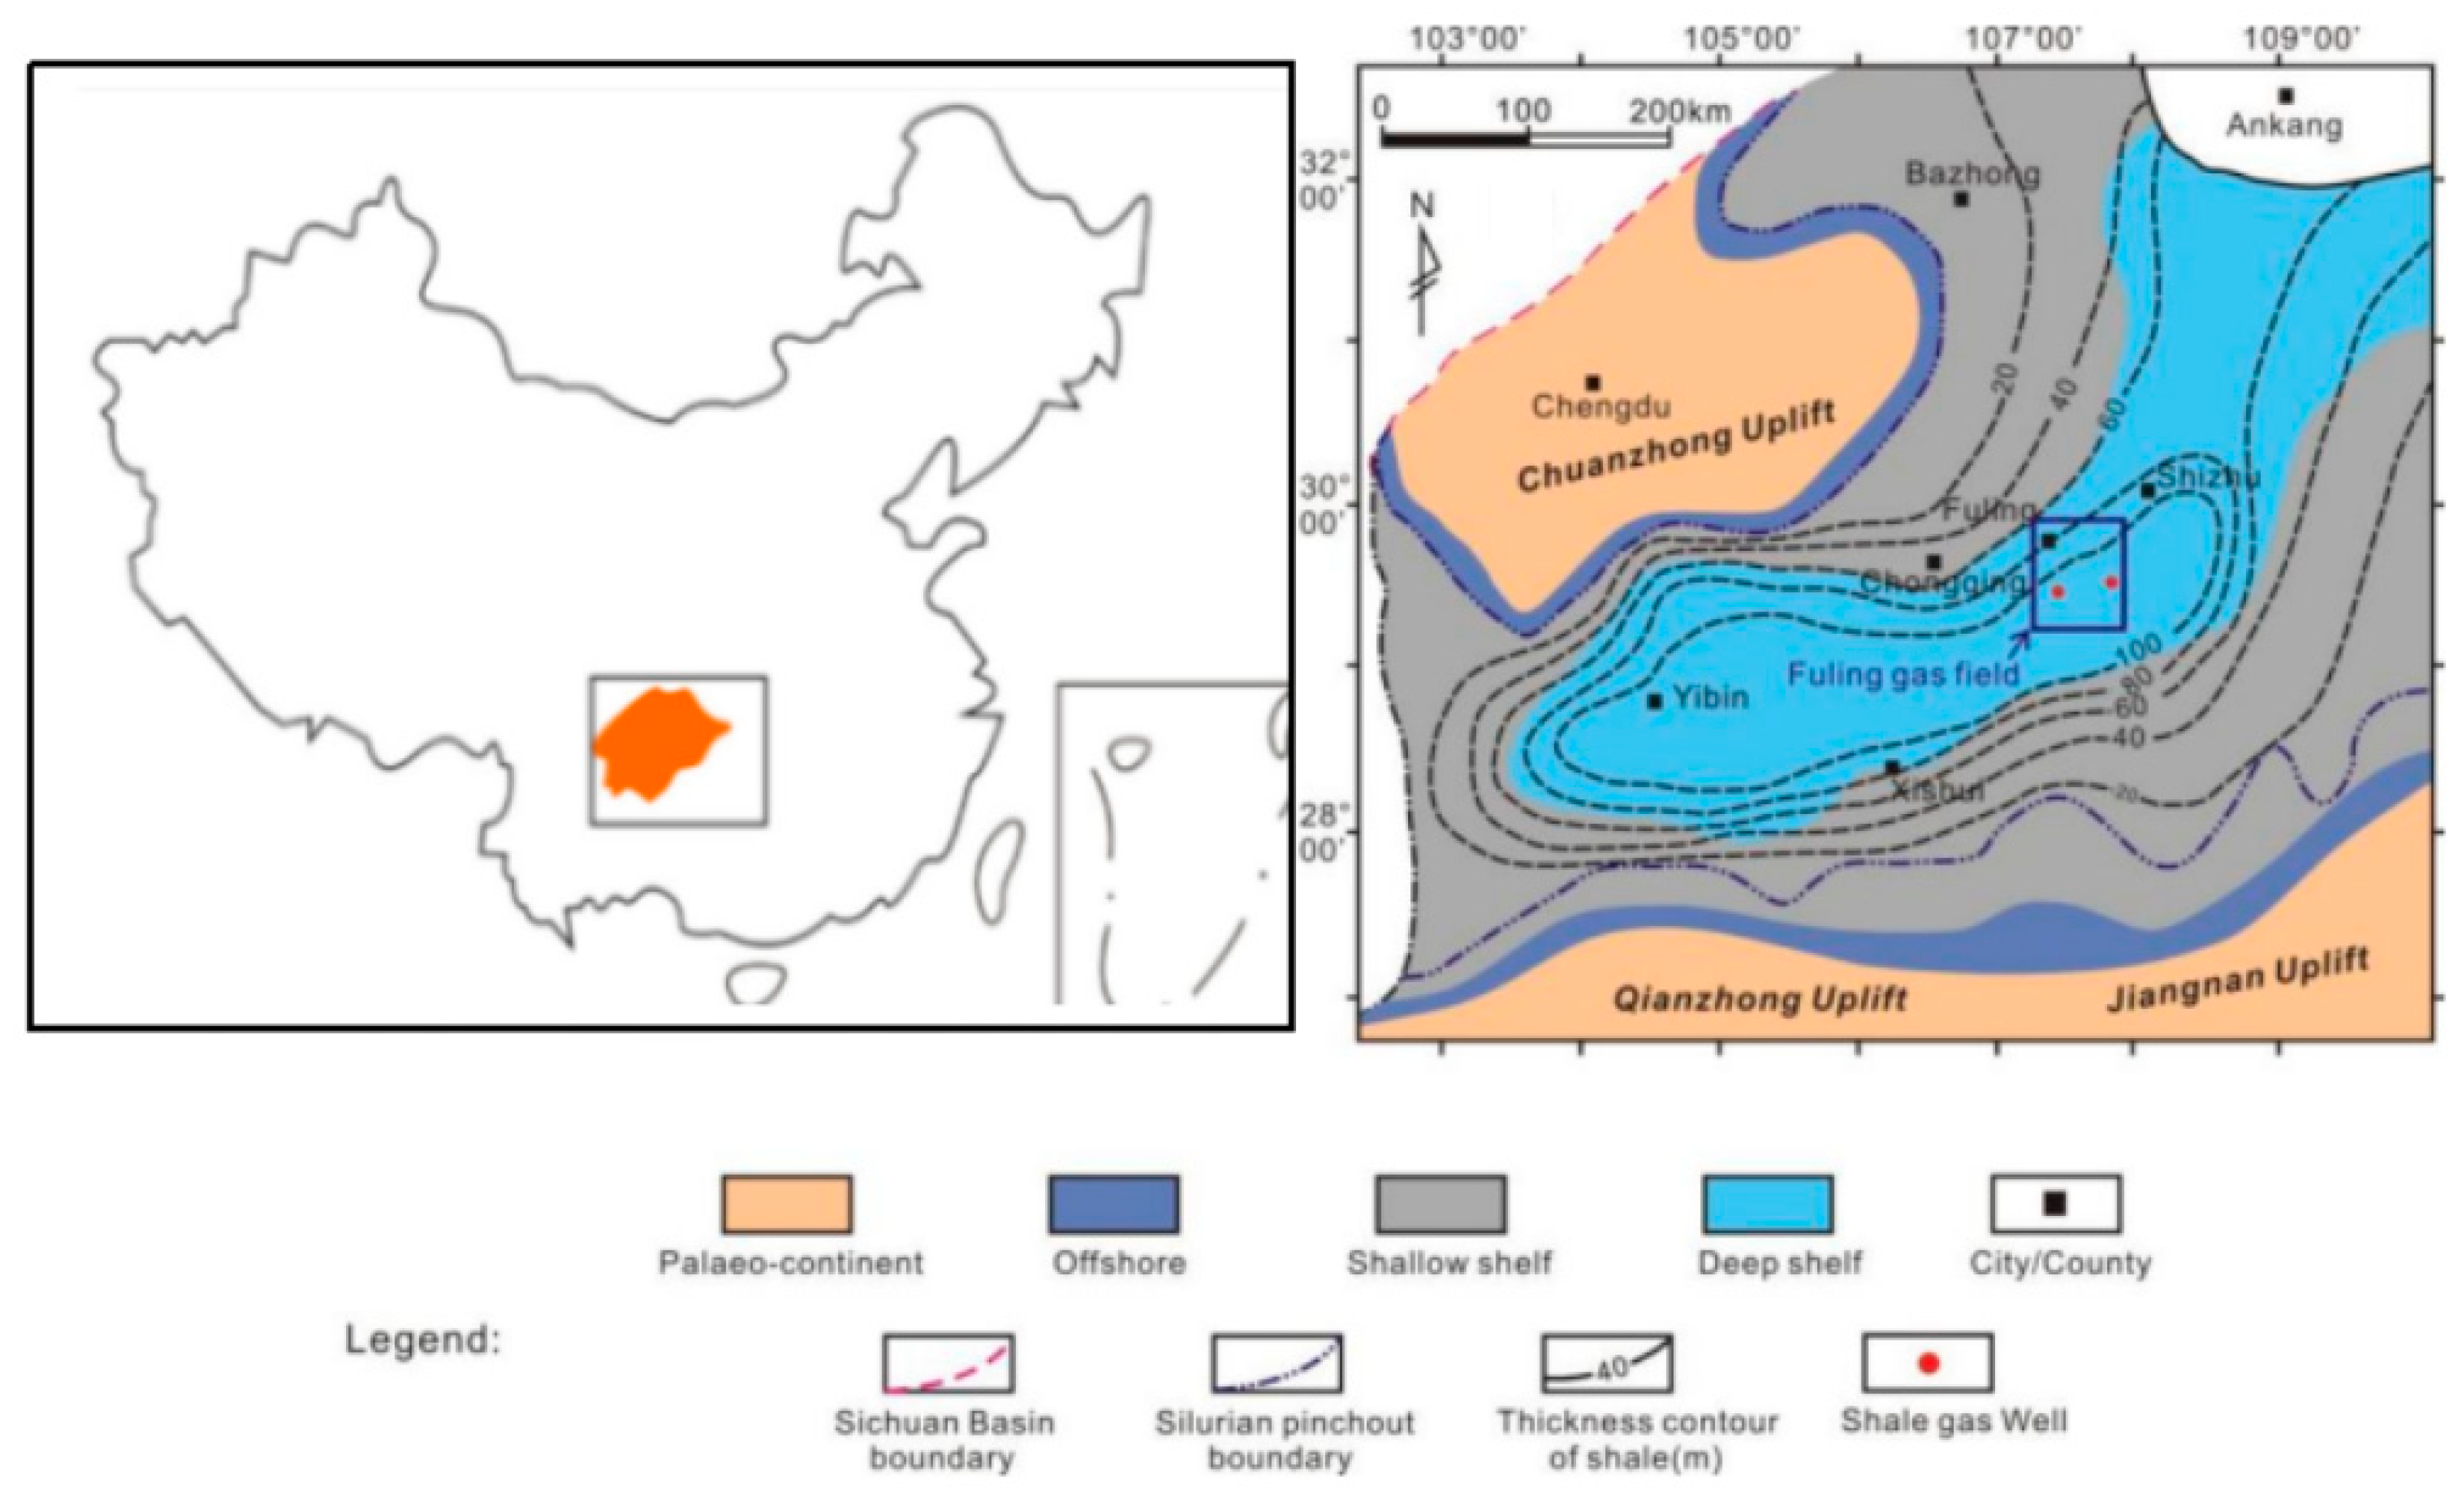
Figure 1. Isopach map and sedimentary environment of the Longmaxi shales in the Sichuan Basin (modified after Rui et al. [37] and Chen et al. [38]).
Jmse 13 02245 g001
Figure 2. Stratigraphic column of the Longmaxi shale in Well A.
Jmse 13 02245 g002
Figure 3. Technical scheme of the research content in this paper.
Jmse 13 02245 g003
Figure 4. (a) Schematic diagram of triaxial experiment; (b) MTS815.03 triaxial rock mechanics test system; and (c) triaxial rock mechanics experiment.
Jmse 13 02245 g004
Figure 5. Different ternary diagrams of the mineral content of selected samples from Well A: (a) sample S2; (b) sample S6; and (c) sample S8.
Jmse 13 02245 g005
Figure 6. SEM image of Well A. Picture (a) shows organic pores in siliceous shale; picture (b) shows organic pores in mixed shale; picture (c) shows organic pores in clayey shale; and picture (d) shows intergranular pores, picture (e) shows the interlayer pores of clay minerals; Picture (f) shows the intercrystal pores of pyrite; Picture (g) shows the pores within mineral particles; Pictures (h,i) show micron-scale micro-cracks.
Jmse 13 02245 g006
Figure 7. NMR T2 spectrum of different organic-rich shale samples from Well A, after being saturated with water: (a) shows signal amplitude of different samples from Longmaxi lower member; (b) shows signal amplitude of different samples from Longmaxi middle and upper members. (c) Original NMR analysis T2 spectrum of different samples from Well A after being saturated with water.
Jmse 13 02245 g007
Figure 8. Relationship between Longmaxi shale mineral content and Young’s modulus: (a) relationship between silicon mineral content and Young’s modulus; (b) relationship between clay mineral content and Young’s modulus.
Jmse 13 02245 g008
Figure 9. Relationship between Longmaxi shale mineral content and brittleness index: (a) relationship between silica content and brittleness index; (b) relationship between clay content and brittleness index.
Jmse 13 02245 g009
Figure 10. Uniaxial compressive stress–strain curve of organic-rich shale of sample S2, S6, S8 of Well A.
Jmse 13 02245 g010
Figure 11. Stress–strain curve of organic-rich shale from different layers of Well A. (a) Uniaxial compressive strength characteristics of different specimens from Well A; (b) stress–strain curve of sample S2; (c) stress–strain curve of sample S6; and (d) stress–strain curve of sample S8.
Jmse 13 02245 g011
Figure 12. The relationship between confining stress and compressive strength for three types of organic-rich shale specimens.
Jmse 13 02245 g012
Figure 13. Triaxial failure model of different organic-rich shale samples from different layers of Well A: (a) sample S2; (b) sample S6; and (c) sample S8.
Jmse 13 02245 g013
Figure 14. Uniaxial failure model of different organic-rich shale samples from different layers of Well A: (a) sample S2; (b) sample S6; and (c) sample S8.
Jmse 13 02245 g014
Figure 15. Failure model of Longmaxi deep shale in Well A under different temperature and pressure conditions.
Jmse 13 02245 g015
Figure 16. Mohr’s circle of Longmaxi deep shale stress in Well A. (a) Sample S2; (b) S6; and (c) S8.
Jmse 13 02245 g016
Table 1. Quantitative analysis results of petrophysical, geochemical, and XRD features of collected organic-rich shale.
Depth (m)Layer NumberSampleMineral Content (wt.%)TOC (%)Phi (%)Total Gas Content, m3/t
CarbonateQuartz-FeldpClay
3956S99.2743.1547.842.323.392.1
3981S89.5245.5244.022.733.282.5
3994S710.6849.4442.602.232.823.0
4002S610.4449.0741.82.473.683.1
4012S510.8051.7643.62.774.013.8
4022S410.7053.3838.433.354.574.9
4030S311.5259.5229.403.844.535.7
4036S210.9259.2626.334.505.417.6
4041S114.3748.9229.144.355.394.9
Table 2. Brittleness evaluation parameter results based on stress–strain curve.
SampleConfining Pressure (MPa)Temperature (°C)Σma (MPa)Σmin (MPa)ε1 (%)Εmin (%)Εmax (%)BI2
S202052.0345.110.30.430.543.50
2040153.1125.40.671.011.873.02
4060208.1186.50.771.352.072.37
6080281.8247.30.891.682.552.19
80100293.7255.60.931.562.662.51
S602034.9525.890.150.290.322.46
204097.490.360.250.60.681.91
4060160.2137.060.320.681.051.96
6080208.1162.100.250.561.381.83
80100215.2170.110.290.61.511.95
S802038.4332.060.230.390.442.97
2040123.7390.400.240.540.712.14
4060192.51143.40.350.720.882.42
6080236.60191.60.410.871.122.14
80100234.11201.30.51.131.431.99
Table 3. Brazilian splitting experimental results.
Sample NumberΘ (°)Peak Load (kN)Damage Displacement (mm)Diameter (mm)Tensile Strength (MPa)
106.080.46256.19
23013.410.672513.67
34511.290.592511.50
4608.840.53259.01
5906.990.53257.13
Table 4. Sample information and test results of Longmaxi shale samples from lower, middle, upper layers of Well A.
ParametersSample
S2S6S8
Mass/g65.9162.8965.93
Diameter/mm24.6124.6224.80
Length/mm51.6548.7951.32
Density2.682.712.66
Longitudinal wave speed m/s434044354138
Shear wave speed m/s282130153015
Confining pressure/MPa202020
Compressive strength/MPa153.197.4123.73
Elastic modulus/GPa18.9722.6320.05
Poisson’s ratio0.1410.1840.119
Uniaxial compressive strength (MPa)52.0334.9538.43
Table 5. Triaxial mechanical parameters results of organic-rich shale samples from different layers of Well A.
SampleConfining Pressure (MPa)Temperature (°C)Axial Deviatoric Stress (MPa)Resistant to Stress Strength (MPa)Yang’s Modulus (GPa)Poisson’s Ratio
S202052.0352.0317.920.125
2040153.1173.118.970.141
4060208.1248.121.470.126
6080281.8341.821.030.161
80100293.7373.721.910.135
S602034.9534.9518.970.112
204097.4117.422.630.184
4060160.2200.242.780.282
6080208.1268.146.110.263
80100215.2295.245.790.249
S802038.4338.4314.580.105
2040123.73143.7320.050.119
4060192.51233.7322.680.109
6080236.60296.6022.960.107
80100234.11314.1125.120.143
Disclaimer/Publisher’s Note: The statements, opinions and data contained in all publications are solely those of the individual author(s) and contributor(s) and not of MDPI and/or the editor(s). MDPI and/or the editor(s) disclaim responsibility for any injury to people or property resulting from any ideas, methods, instructions or products referred to in the content.