1. Introduction
Vector thrusters can achieve flexible steering and positioning by changing the direction of thrust and have been widely applied in various fields such as fighter jets and rockets [
1]. For instance, various thrusters designed by researchers like Kadiyam [
2] and Desai [
3] can effectively realize vector propulsion functions. In recent years, with the increasing complexity and diversity of Autonomous Underwater Vehicle (AUV) mission requirements, vector thrusters have also gradually become a promising underwater navigation technology worthy of exploration. This technology achieves thrust vectorization by altering the direction and magnitude of the AUV’s thrust [
4]. However, current underwater vector thrusters often suffer from complex structures and poor engineering applicability. According to the structural characteristics of vector thrusters, the propeller, drive shaft, and steering mechanism within the propulsion system exhibit highly coupled dynamic interactions. The complex pulsating forces generated by the propeller can cause vibrations in the drive shaft and steering mechanism. In turn, the vibration of the steering mechanism affects the thrust characteristics, which then alters the propeller’s pulsating forces. A feedback mechanism with an enhancing effect is formed among these three components, which is a mechanism that must be clarified in the application and hydrodynamic calculation of vector thrusters.
When a vector thruster is in operation, the propeller attached to the drive shaft typically undergoes complex spatial motion. This is because, on one hand, the steering mechanism inevitably possesses a certain degree of stiffness, causing the drive shaft to oscillate spatially while rotating around its own centerline under unbalanced excitation. On the other hand, the propeller usually operates in a non-uniform flow field (even with a uniform inflow, the whirling of the drive shaft can lead to flow field non-uniformity), and the pulsating forces on the propeller blades also cause spatial vibration of the drive shaft. Predicting the hydrodynamic performance of a propeller with complex three-dimensional motion is a challenging task. Currently, there is a scarcity of literature on the hydrodynamic performance prediction of marine propellers with complex motion. The few available studies investigate the hydrodynamic performance of propellers with simple forms of motion. For example, Tao [
5] used potential flow theory to approximate the hydrodynamic performance of a propeller undergoing heaving motion caused by waves. Yu [
6] numerically analyzed the hydrodynamic performance of a heaving propeller using CFD (Fluent). Similarly, Huang [
7] performed a comparable study also employing Fluent. Guo [
8] experimentally studied the hydrodynamic performance of a propeller with heaving motion. Politis [
9,
10] predicted the hydrodynamic performance of a heaving propeller using an unsteady boundary element method. Kinnas [
11,
12] also used an unsteady boundary element method to predict the hydrodynamic performance of a propeller undergoing heaving, longitudinal, or torsional vibrations. In all these studies, the propeller’s motion is relatively simple, generally limited to a single translational form. However, for a propeller moving with a vector thruster, its trajectory is complex due to its six spatial degrees of freedom, and coupling phenomena exist between these different degrees of freedom [
13]. Therefore, existing methods are effective for parallel-type vectorable thrusters, but their applicability may be limited when dealing with other types of vectorable thrusters.
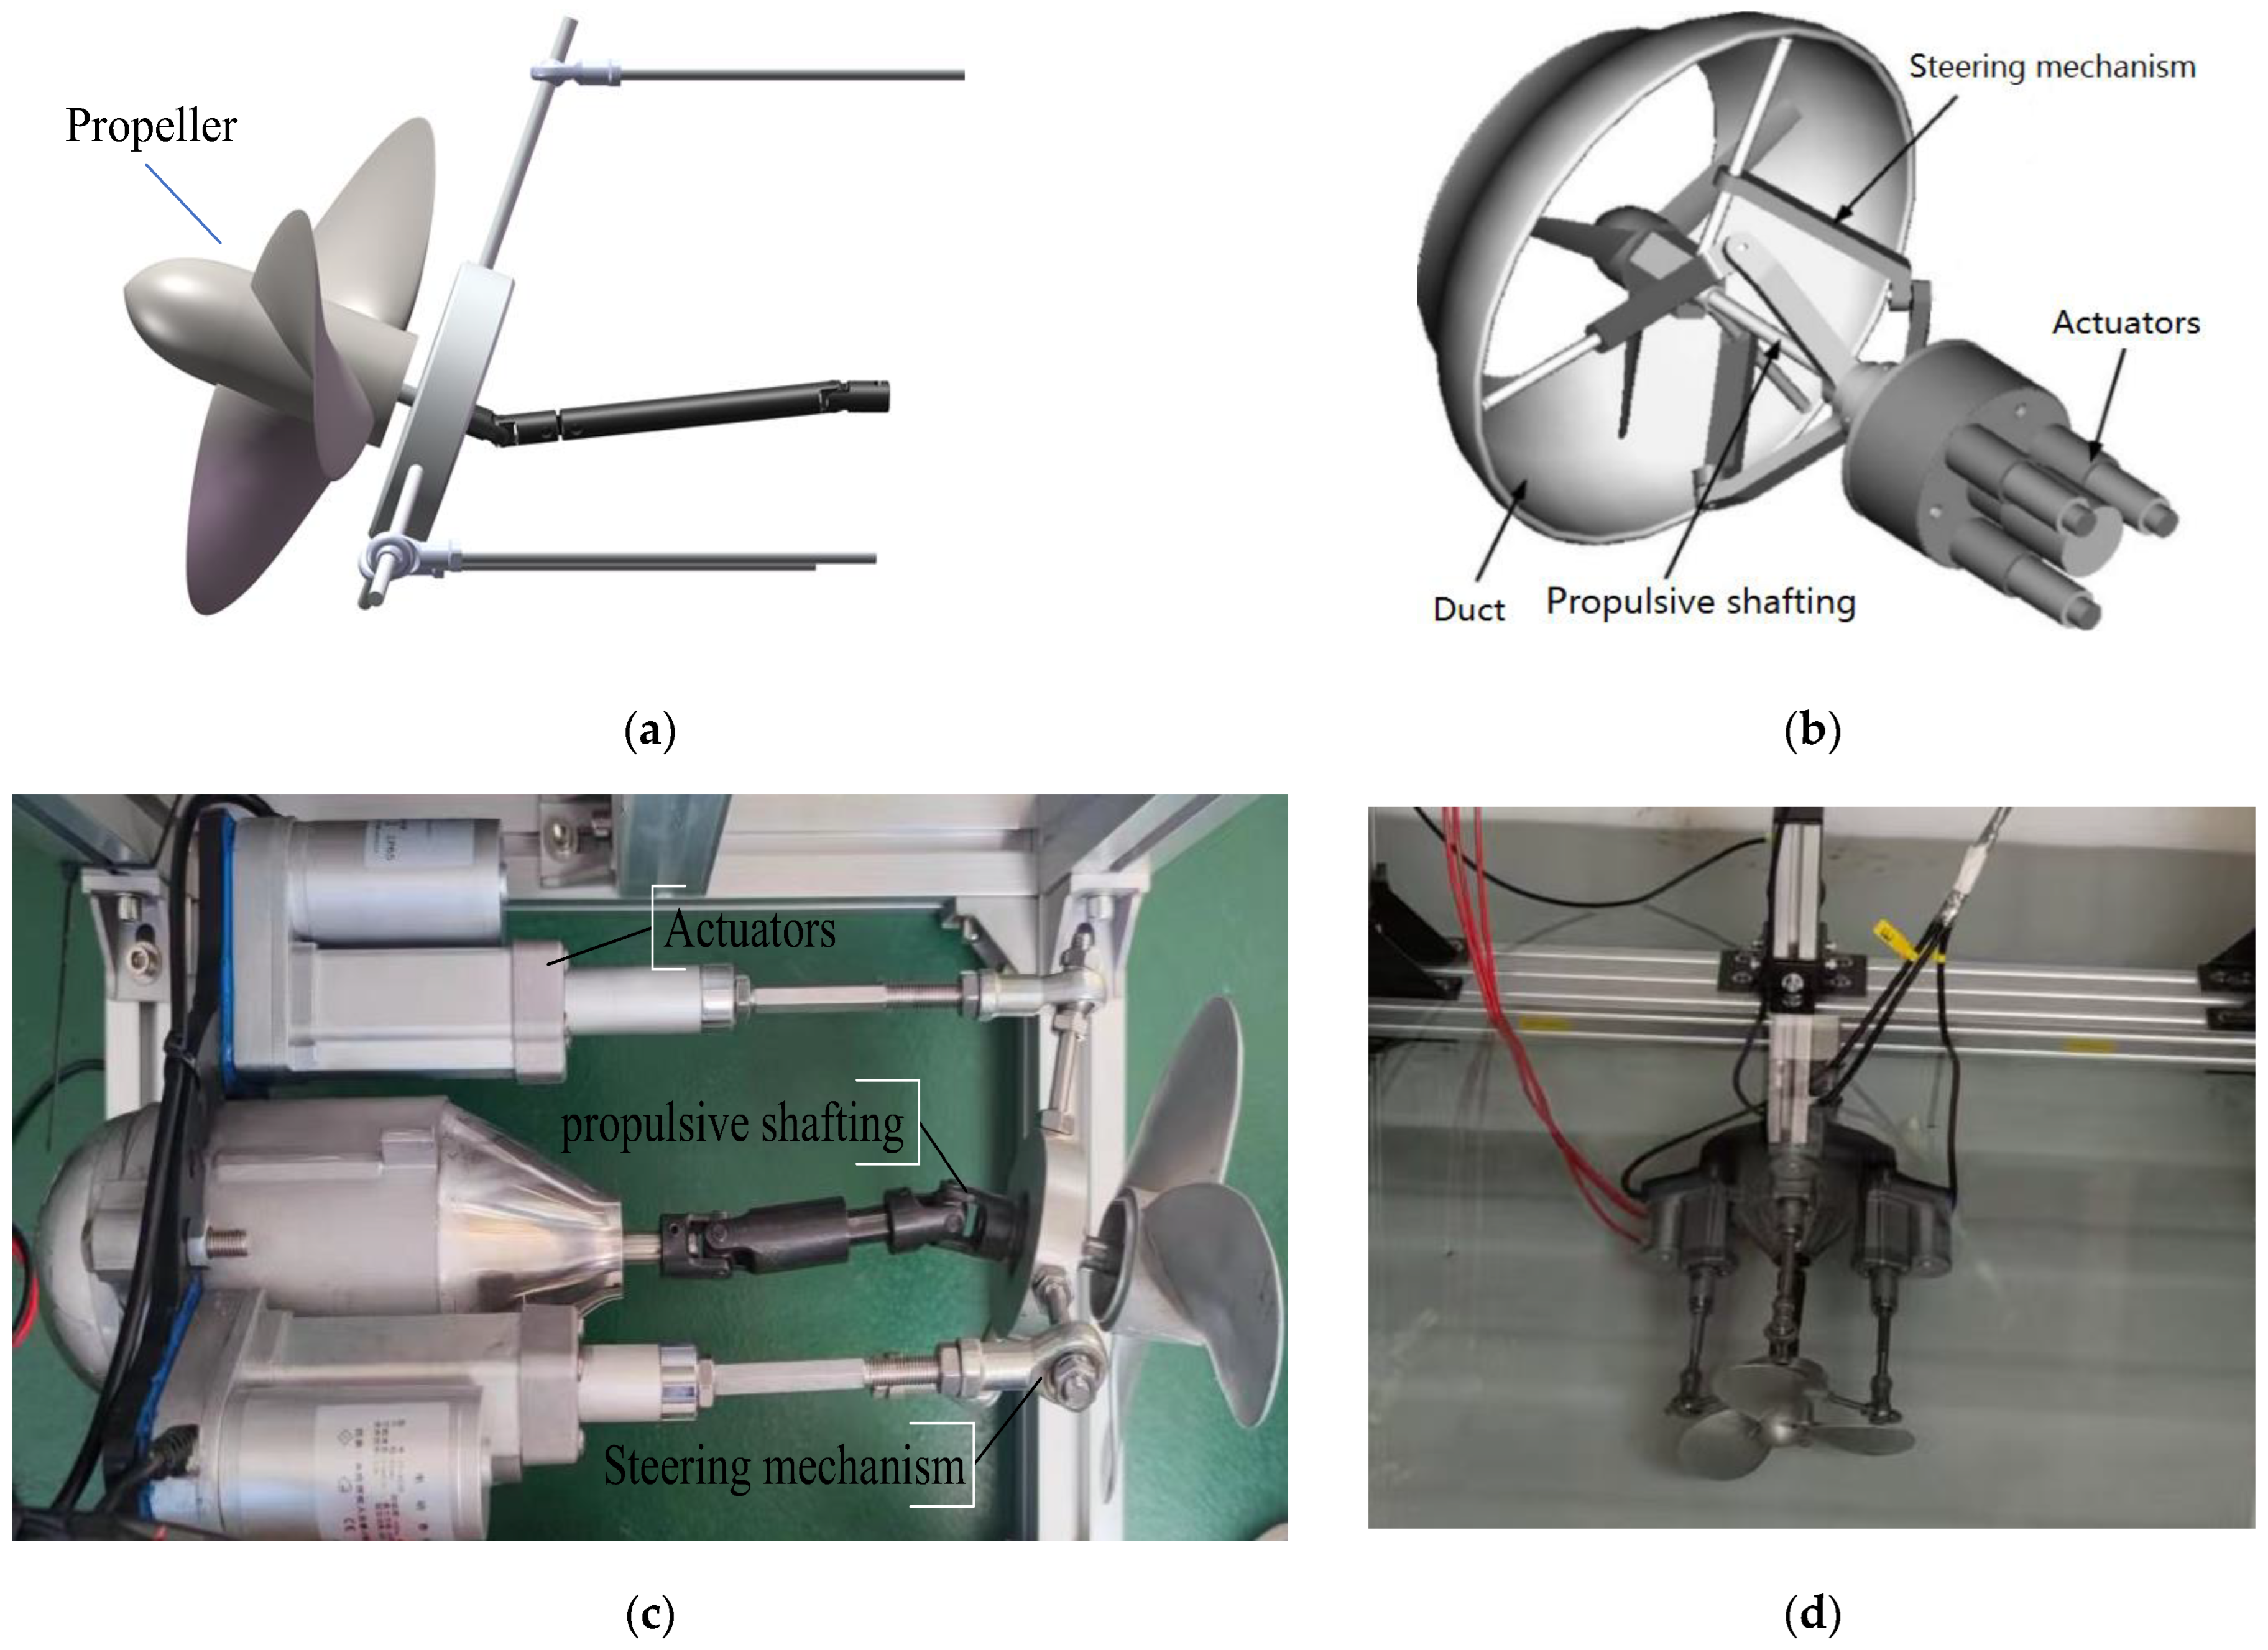
To this end, this paper designs a vector propulsion device based on the parallel steering mechanism and the universal joint. When this device operates, electric push rods change the propeller’s orientation, allowing the propeller to form a conical working space with a vectoring range of up to 30 degrees. This paper employs a comprehensive approach of mechanical structural analysis, numerical calculation, and experimental methods to observe the thrust characteristics of this vector thruster under different operating conditions, providing theoretical support for the performance optimization and practical application of vector propulsion systems in complex marine environments. The paper is organized as follows:
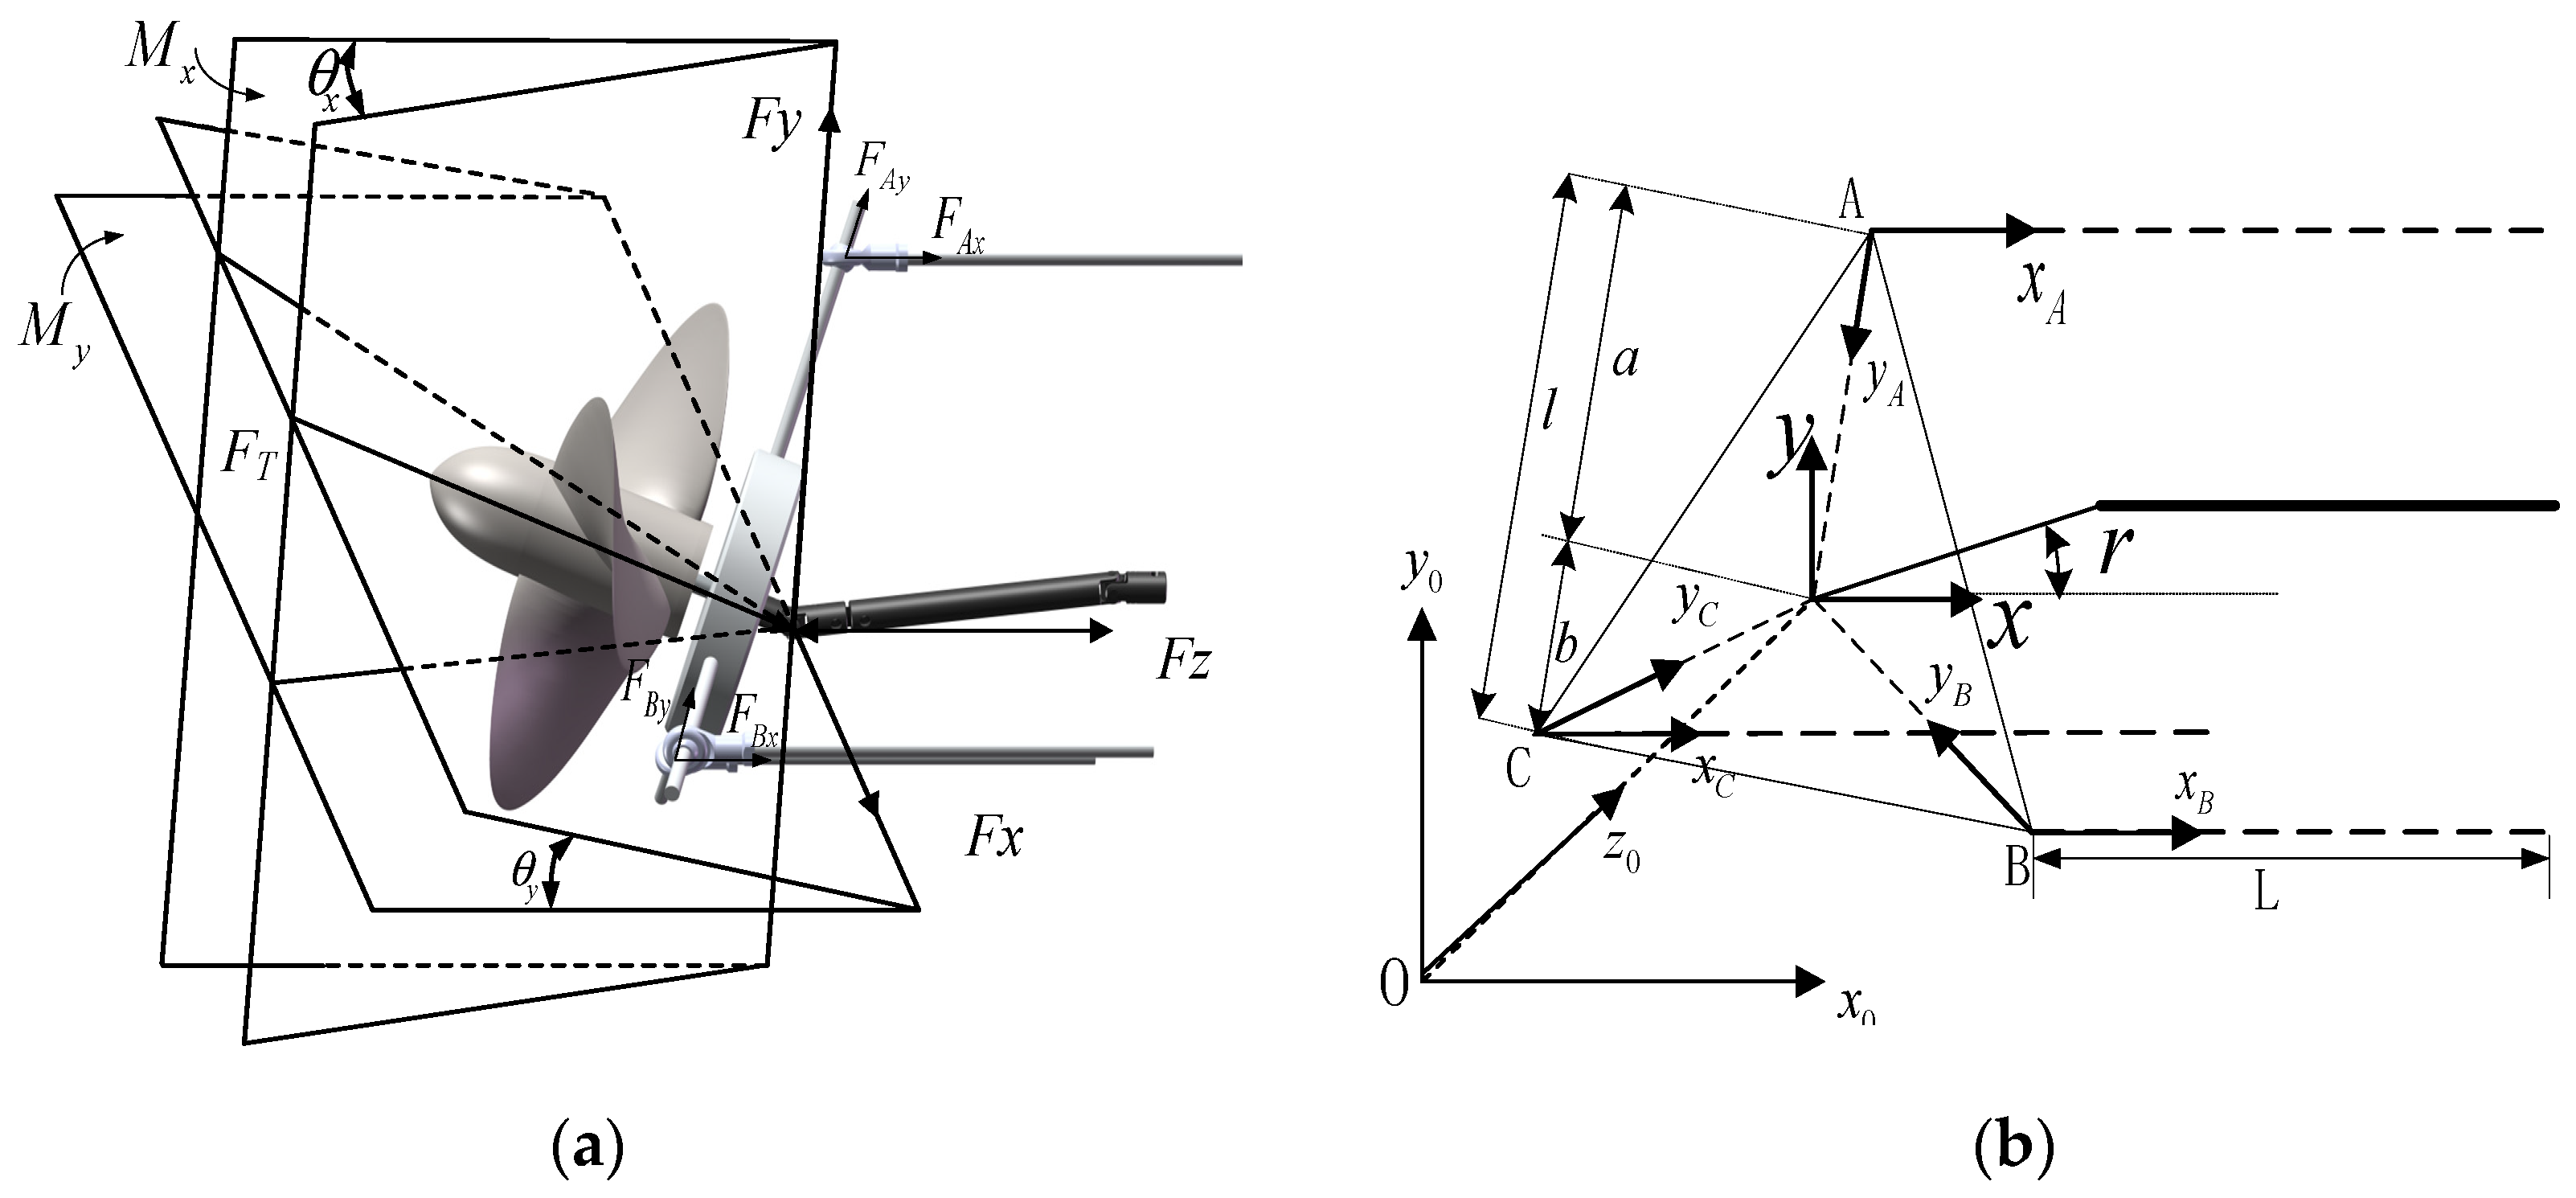
Section 2 establishes the thrust model of the vector thruster based on its mechanical structural analysis.
Section 3 constructs a simulation model using computational fluid dynamics (CFD). Furthermore, comprehensively considering factors such as inlet flow velocity and propeller inclination angle, numerically simulates the pressure on the propeller blade surface and the propeller wake field, and calculates the thruster’s open water performance.
Section 4 tests the propulsion performance using an underwater dynamic test rig, compares and analyzes the experimental results with theoretical calculations, and presents the thrust characteristics of the vector thruster under different operating conditions.
Section 5 provides the conclusions of the entire paper.
3. Hydrodynamic Performance Calculation at Different Attitudes
3.1. Flow Equations
In CFD simulations, the fluid flow process is simulated by solving the Navier–Stokes (N-S) equations. The governing equations include the continuity equation and the momentum conservation equation, as follows [
16]:
where
is the fluid density;
is the dynamic viscosity of the fluid;
(
,
) are the time-averaged velocity components along the three coordinate directions; and
is the turbulent Reynolds stress term.
To effectively capture the complex flow characteristics pertinent to this study, such as boundary layer dynamics and small-scale turbulent structures, we adopted the Baseline (BSL) Shear Stress Transport (SST)
turbulence model. This model is particularly suitable for our application as it synergistically combines the advantages of the standard
model in resolving near-wall flows with the robustness of the
model in the far-field, ensuring stable and reliable calculations [
17]. Regarding the specific implementation and setup, all simulations were conducted using the pressure-based solver in ANSYS Fluent (Version 2024). The model was implemented with standard wall functions for the near-wall treatment, and the discretization of pressure and momentum equations was set to the Second Order and Second Order Upwind scheme, respectively, to ensure solution accuracy.
3.2. Computational Domain and Meshing
When constructing the fluid domain to account for the propeller’s rotational effects, the computational domain is divided into three regions: an inner rotating domain enclosing the propeller, an intermediate transition domain, and an outer stationary domain. The Multiple Reference Frame (MRF) approach is employed to simulate the propeller’s rotation with appropriate rotational parameters specified. Boundary conditions include a velocity inlet (with flow velocity determined by the propeller’s advance coefficient), a pressure outlet with default conditions, and no-slip walls for all structural surfaces and side boundaries. Domain interfaces are established to enable both mesh information transfer between the rotating and intermediate domains and fluid communication between the intermediate and outer stationary domains.
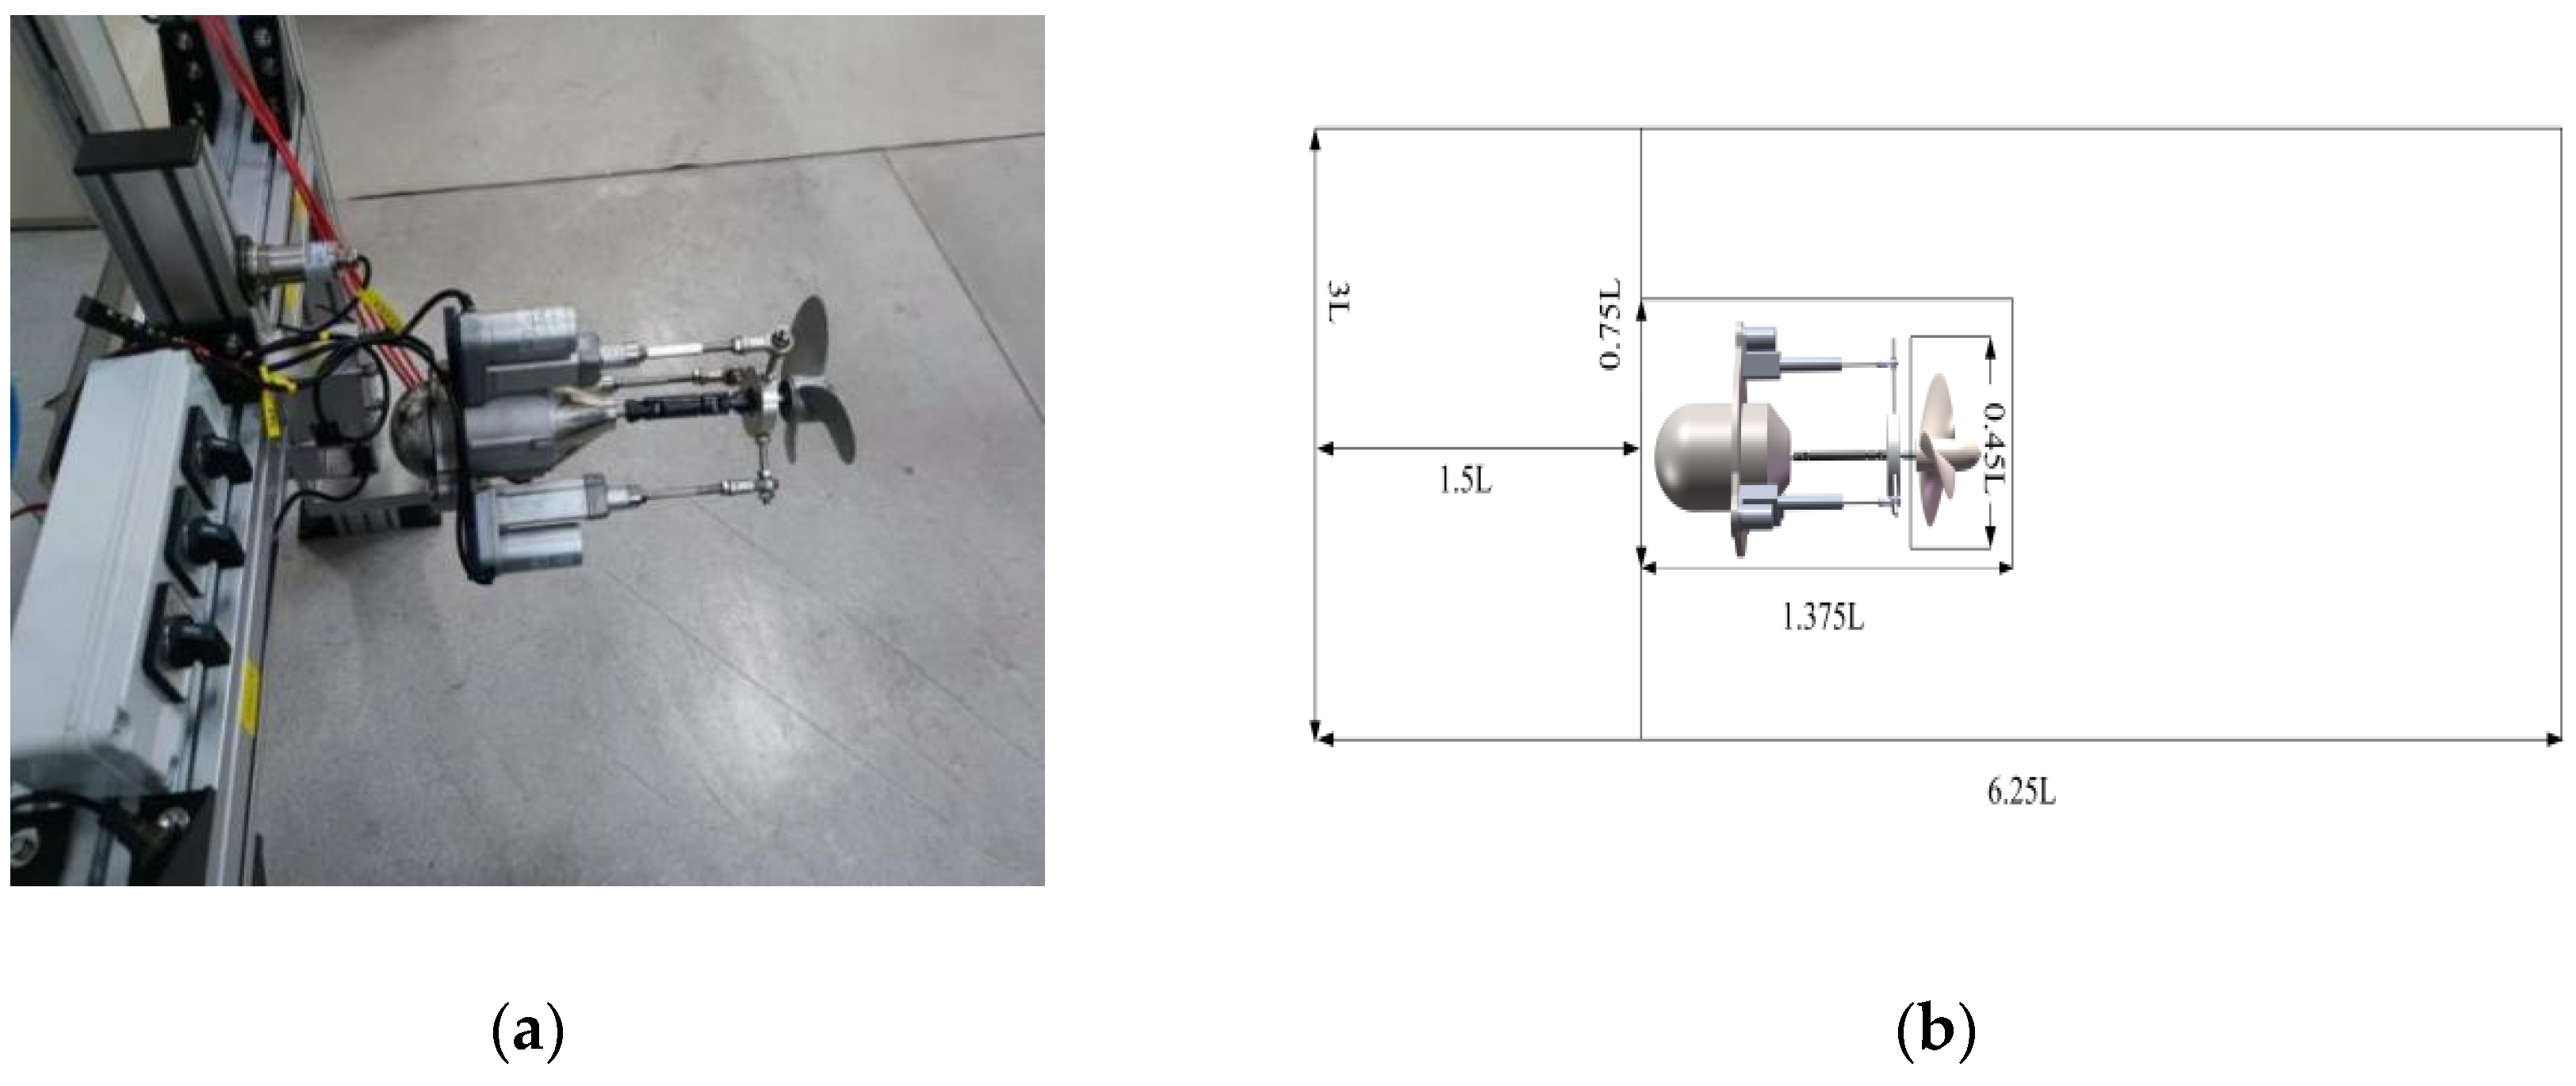
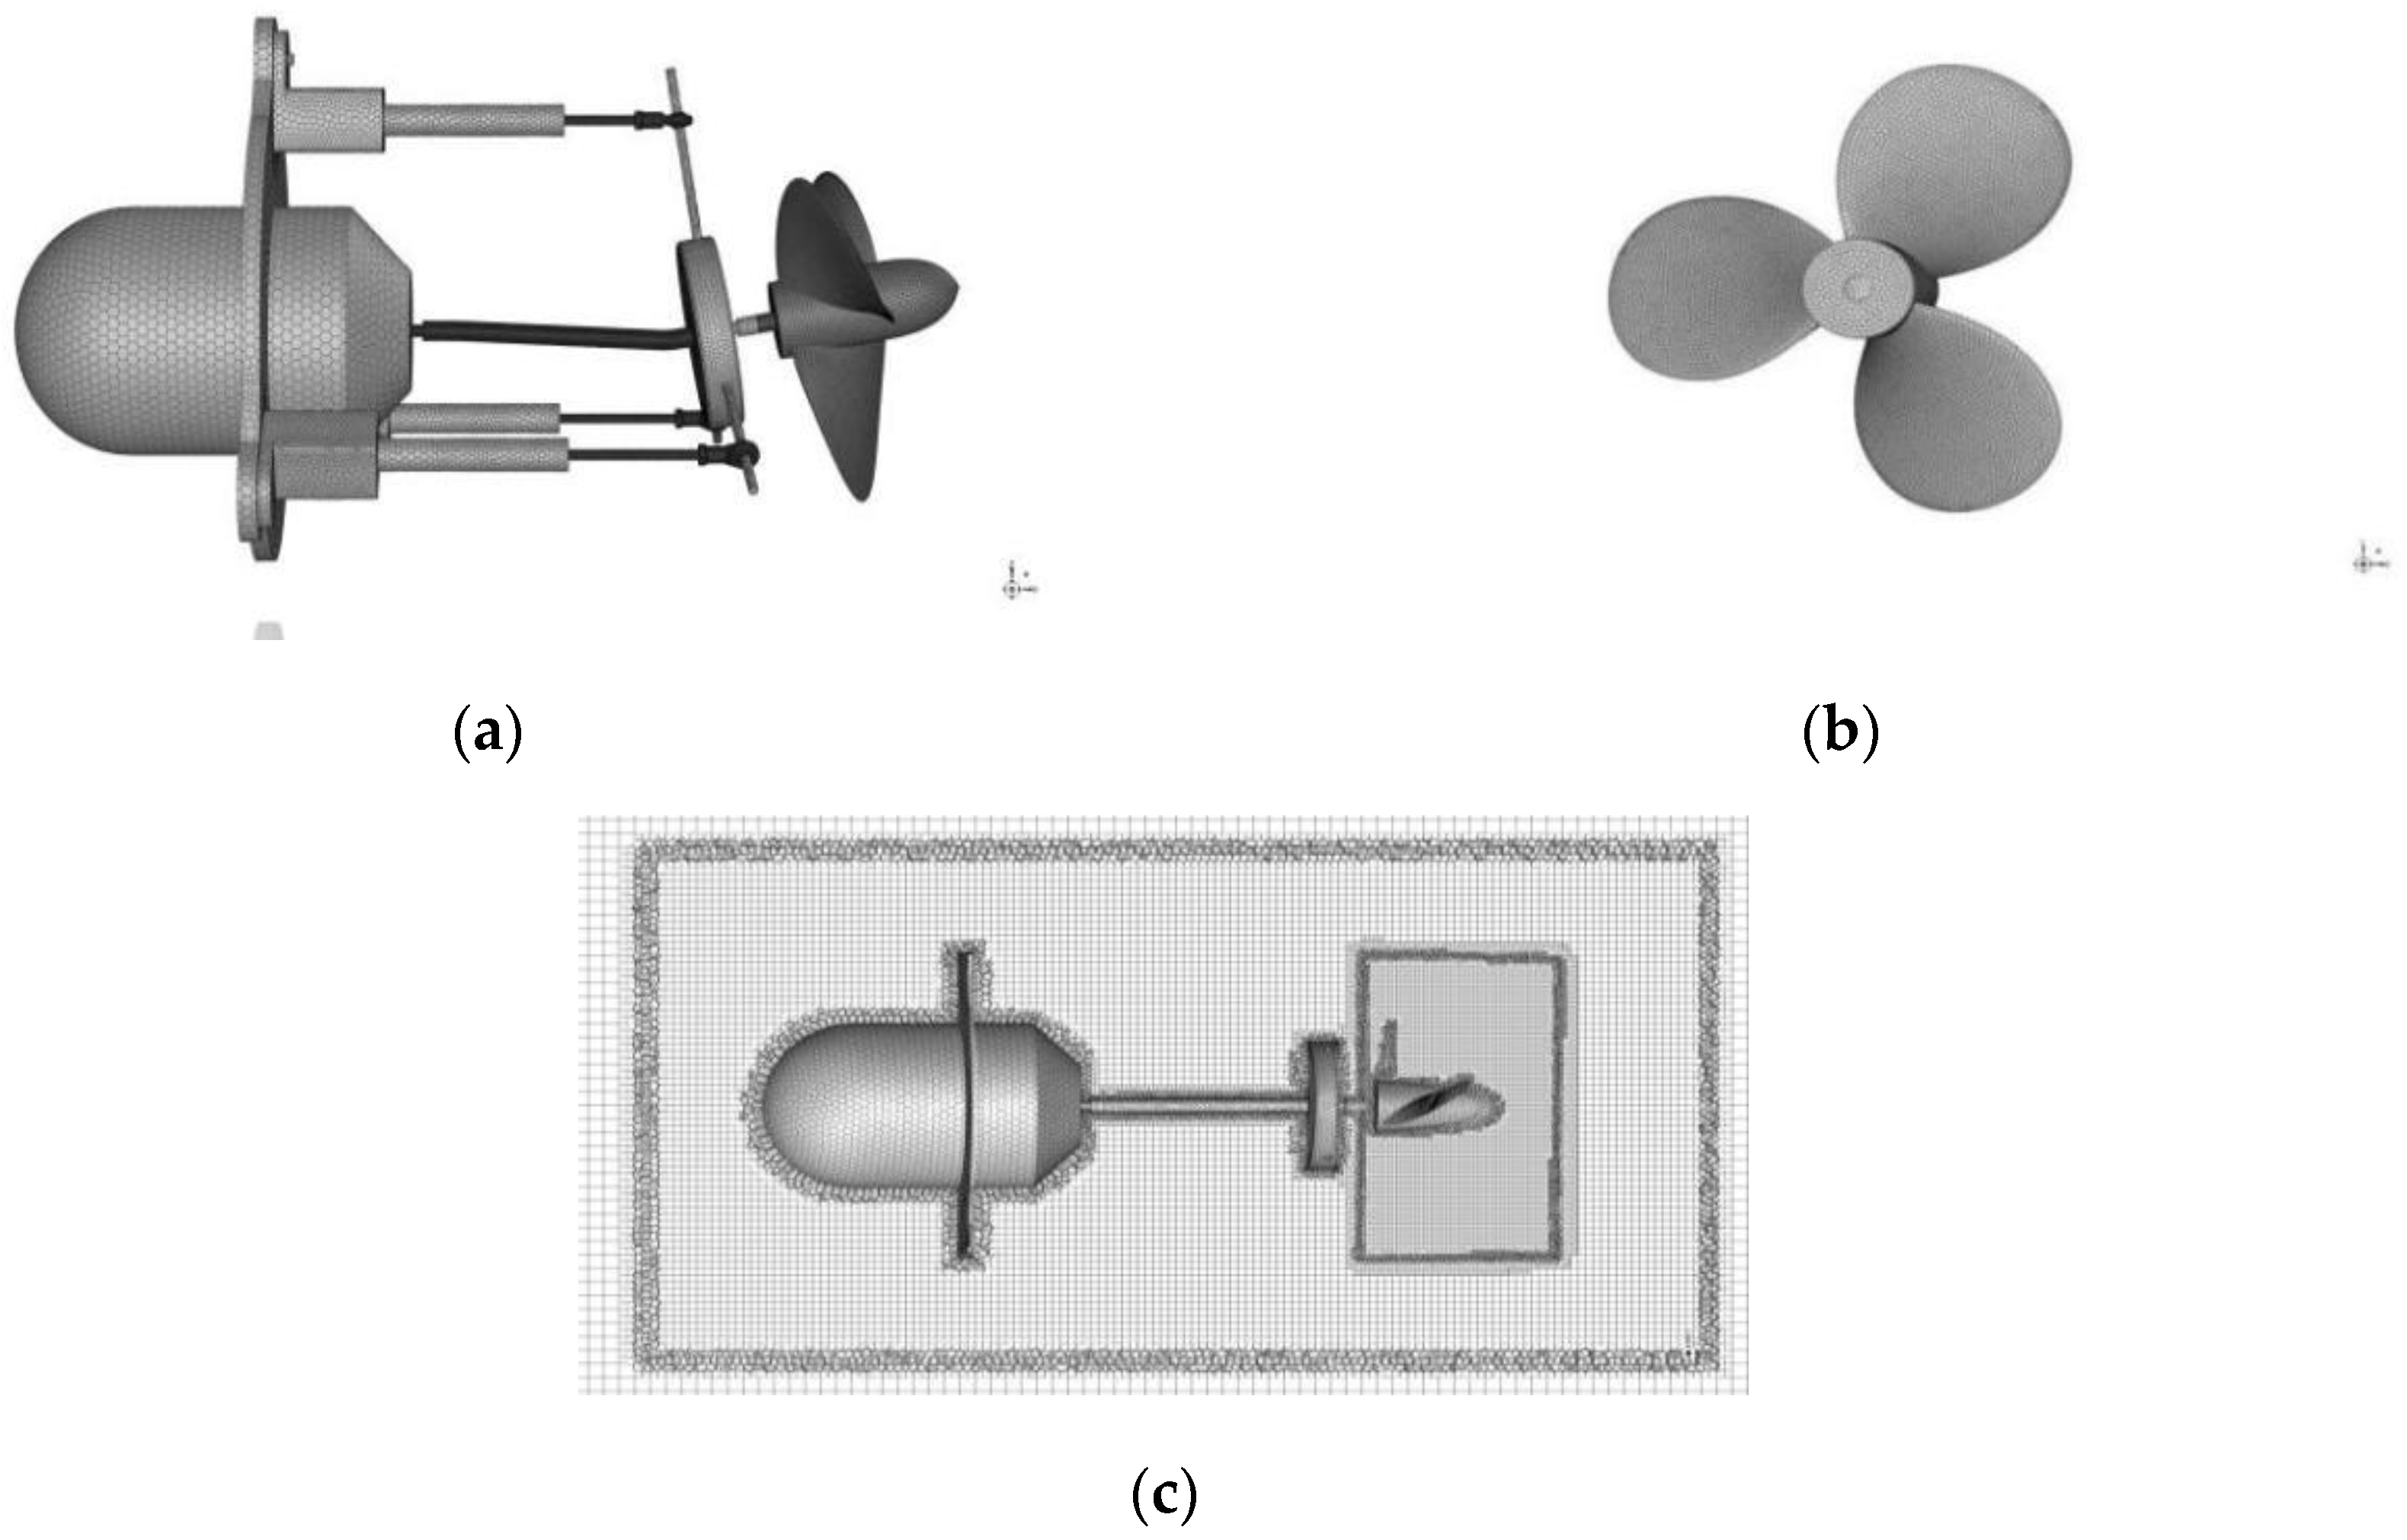
To ensure computational accuracy, the computational domain is set up with geometric features identical to the physical model. The physical model and the simulation model are distributed as shown in
Figure 4. Based on the standard physical model and coordinate system for marine craft [
18], the relevant parameters for the vector thruster can be established. Key model parameters are summarized in
Table 1.
The distance from the water inlet to the front of the thruster is 1.5 L; the distance from the outlet boundary to the rear of the thruster is 3.375 L; the side is a symmetry plane; and the diameter is 3 L. Here, L is the total length of the thruster. The cylindrical diameter of the medium-sized computational domain is 0.75 L and its length is 1.375 L. The diameter of the rotating domain is 0.45 L and its length is 0.25 L.
Due to the different mesh sizes in the three computational domains, we use a combination of structured and unstructured grids for meshing based on the complexity. Since the propeller is thin at the blade tips, leading edge, and trailing edge, it is difficult to handle with a structured grid. Therefore, unstructured grids are used for the small and medium-sized computational domains. The outermost stationary domain is a regular cylinder, for which a structured grid is used. The thin areas at the propeller’s leading edge are locally refined to obtain a more accurate flow field around the propeller. To facilitate local refinement, different surfaces of the thruster are grouped and named. Local refinement is applied in areas where poor quality mesh might be generated, such as the spherical bearing surfaces at the ends and the thin rods. The meshed thruster and propeller surface mesh and volume mesh are shown in
Figure 5.
Furthermore, the change in simulation results is checked by varying the mesh density within the computational domain to determine if a grid-independent solution has been reached. When the Reynolds number is
, a global size of 0.02 m is set, and four sets of grids with local refinement sizes of 0.0026 m, 0.0020 m, 0.0018 m, and 0.0016 m are used to calculate the propeller thrust. The number of grid cells is shown in
Table 2.
Taking the maximum grid number G4 as a reference, the relative values of propeller thrust under different mesh densities are compared. It is found that the calculation results, except for G1, do not differ significantly, with relative propeller thrust values of 0.23%, 0.03%, and 0.02%. To reduce the computer’s running time and improve the convergence speed of the numerical simulation, we use the grid with a mesh size of 0.002 m (G2) for the simulation calculations.
3.3. Analysis of Propeller Pressure Characteristics
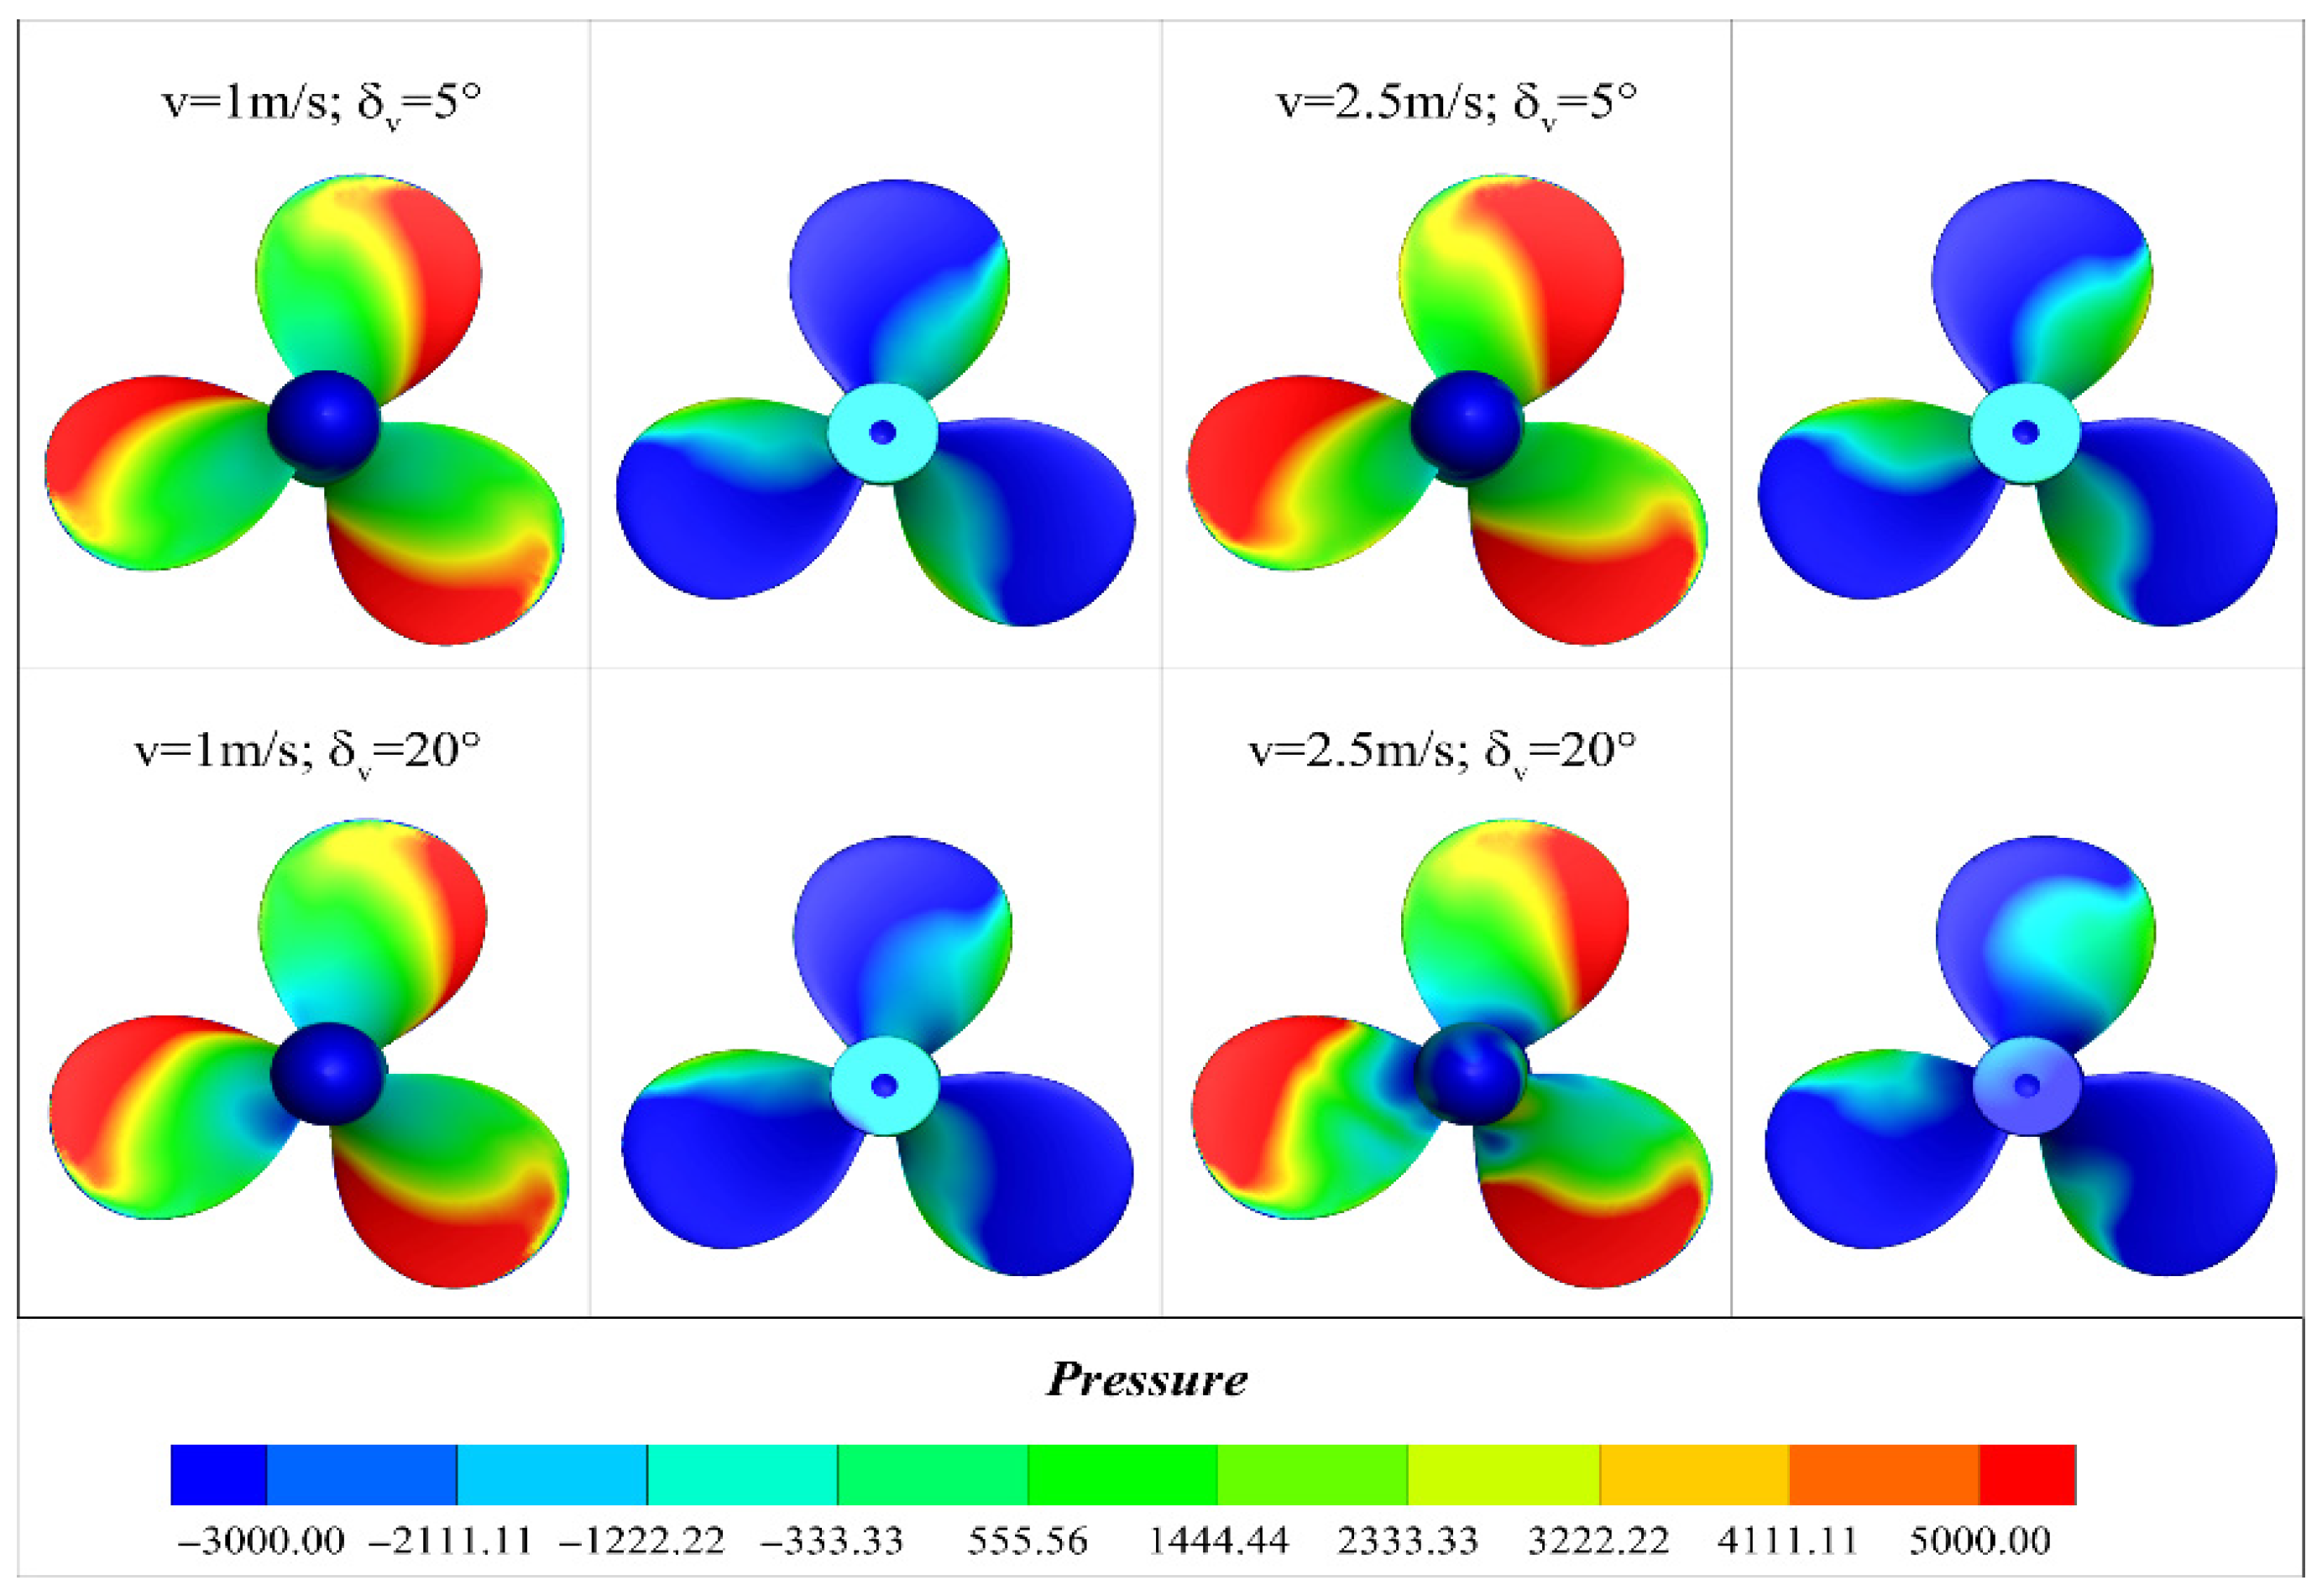
For the pressure analysis, the propeller surface and the side surfaces of the large computational domain were modeled as stationary no-slip walls. Two different flow velocities, corresponding to distinct advance coefficients, along with two inclination angles were considered in the boundary condition setup. A velocity inlet boundary condition, with the flow velocity defined by the advance coefficient, was applied at the inlet, while a standard pressure outlet condition was used at the outlet. The pressure distribution obtained from the numerical simulation is presented in
Figure 6.
As can be seen in
Figure 6, the high-pressure zone on the pressure side of the propeller is mainly distributed on the leading and trailing edges, reaching its maximum value at the leading edge. The low-pressure zone is mainly located at the hub and blade root, reaching its peak high pressure at the blade tip. As the inlet velocity increases, the propeller experiences more extensive high-pressure and low-pressure zones. At lower speeds, the low-pressure area at the hub is larger.
When the inclination angle increases, the low-pressure zone shifts from the center to the side. This shift in the low-pressure zone, on one hand, leads to an asymmetrical pressure distribution, generating a lateral thrust component. On the other hand, it changes the cavitation characteristics of the thruster, causing the inception point of cavitation to migrate from the blade tip to the side of the pressure face, thereby increasing the cavitation volume. Therefore, it is necessary to further observe the wake characteristics.
3.4. Analysis of Wake Characteristics
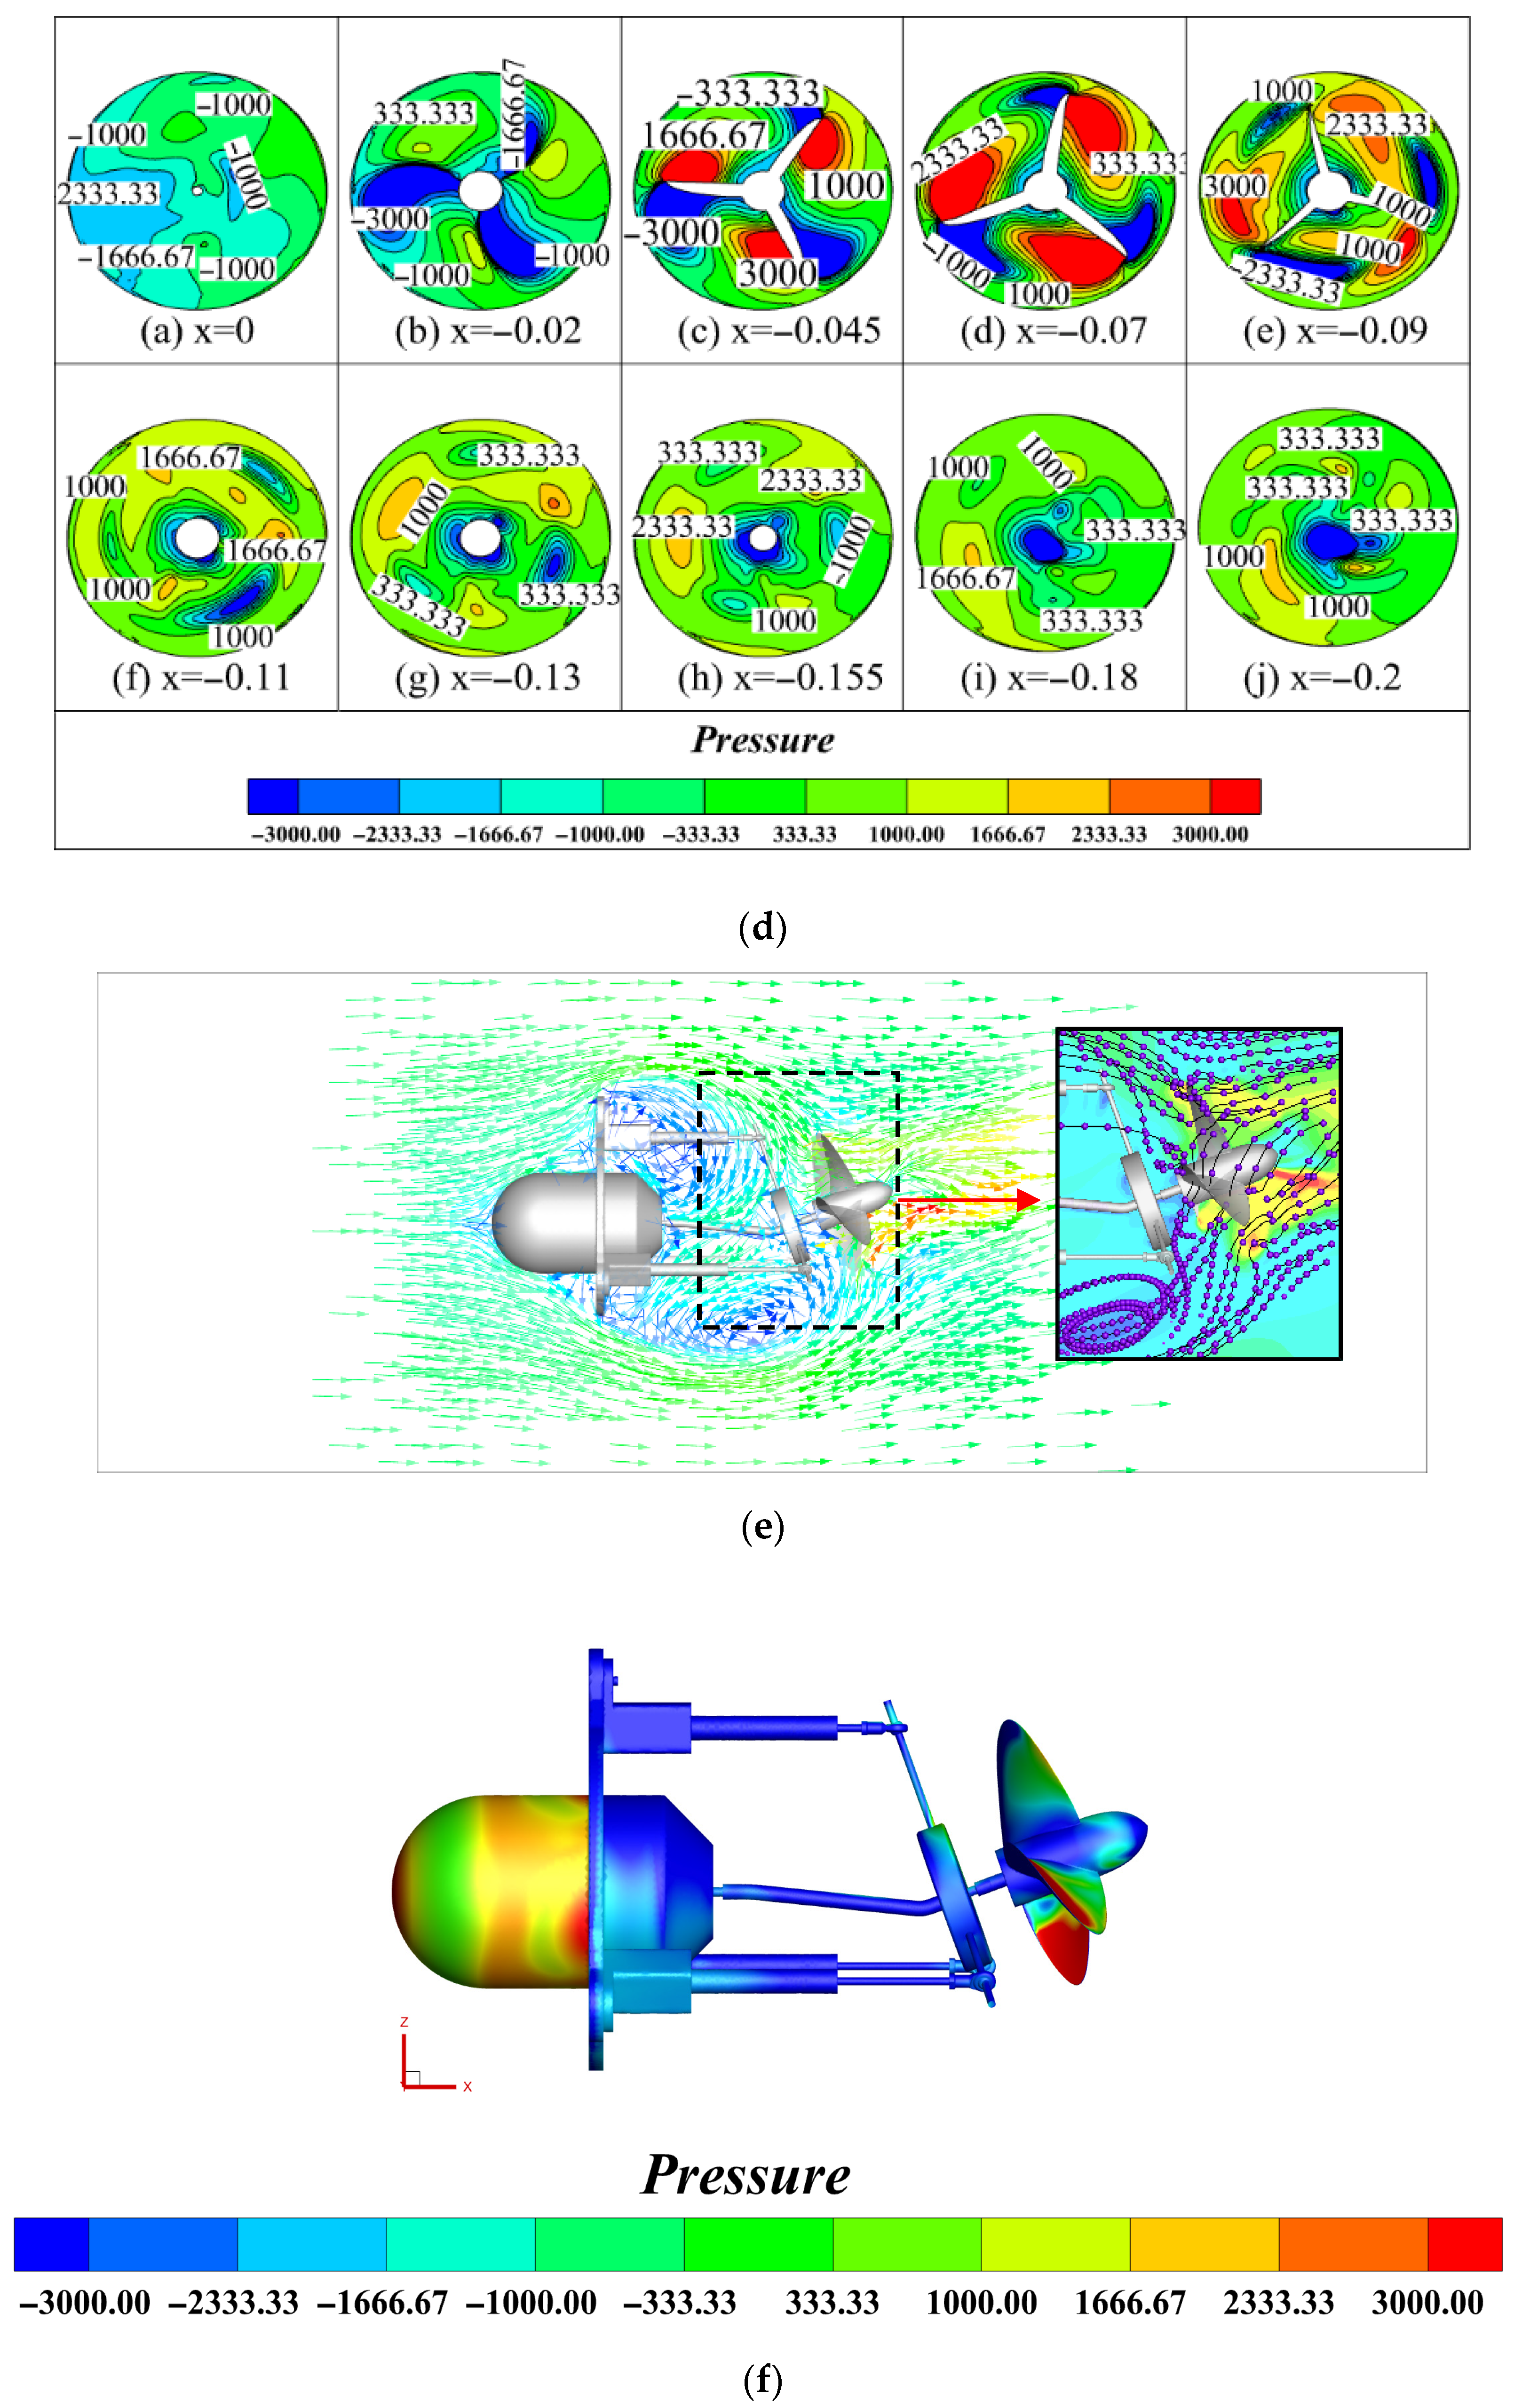
To observe the wake characteristics, several equidistant monitoring planes were set up behind the propeller. The resulting propeller flow field distribution is shown in
Figure 7. It can be seen that the pressure difference on both sides of the propeller blades is greatest, and a significant wake begins to form at a distance of −0.02 m from the hub. The central part of the wake field exhibits a propeller shape and has lower pressure. As the wake plane moves further from the hub, the pressure around the propeller blades first increases and then decreases, with the positive pressure on the blades reaching a peak at −0.07 m. After −0.09 m, the pressure begins to gradually decrease, and from −0.11 m onwards, the pressure distribution in the region far from the hub becomes increasingly uniform.
Comparing
Figure 7a,d, it is found that the larger the inclination angle, the smaller the pressure difference around the propeller blades, with positive pressure being the dominant part. When the inclination angle is small, the pressure around the hub is uniformly distributed along the surface. However, as the inclination angle increases, the pressure distribution around the hub becomes uneven. The presence of low-pressure zones in the wake will cause cavitation and vortex phenomena. Taking the cross-section at −0.09 m as an example, when the tilt angle increases from 10 deg to 20 deg, a low-pressure zone of −3000 Pa appears in the wake, and a similar phenomenon is observed at the −0.13 m cross-section. The bursting of bubbles and vortices in the low-pressure zone cause turbulence in the water flow, which will lead to insufficient thruster force and affect the overall propulsion efficiency.
A comparison between
Figure 7b,e reveals significant flow field evolution with increasing yaw angle. At smaller yaw angles, the thruster generates thrust predominantly aligned with the propeller axis, while larger yaw angles produce more vortices and irregular flow structures in the rear and peripheral regions, leading to complex boundary layer flow with localized negative thrust or reverse vortex patterns. Furthermore, the pressure distribution observed in
Figure 7c,f demonstrates that the suction side consistently maintains lower pressure than the pressure side across different inclination angles, creating the essential pressure differential for thrust generation. As inclination increases, the deepening color of pressure contours on the mechanism surface indicates progressive pressure reduction. This expanding low-pressure zone promotes cavitation and vortex formation, whose subsequent collapse and development disrupt flow patterns, ultimately diminishing thrust output and adversely impacting overall propulsion efficiency.
3.5. Open Water Performance Calculation
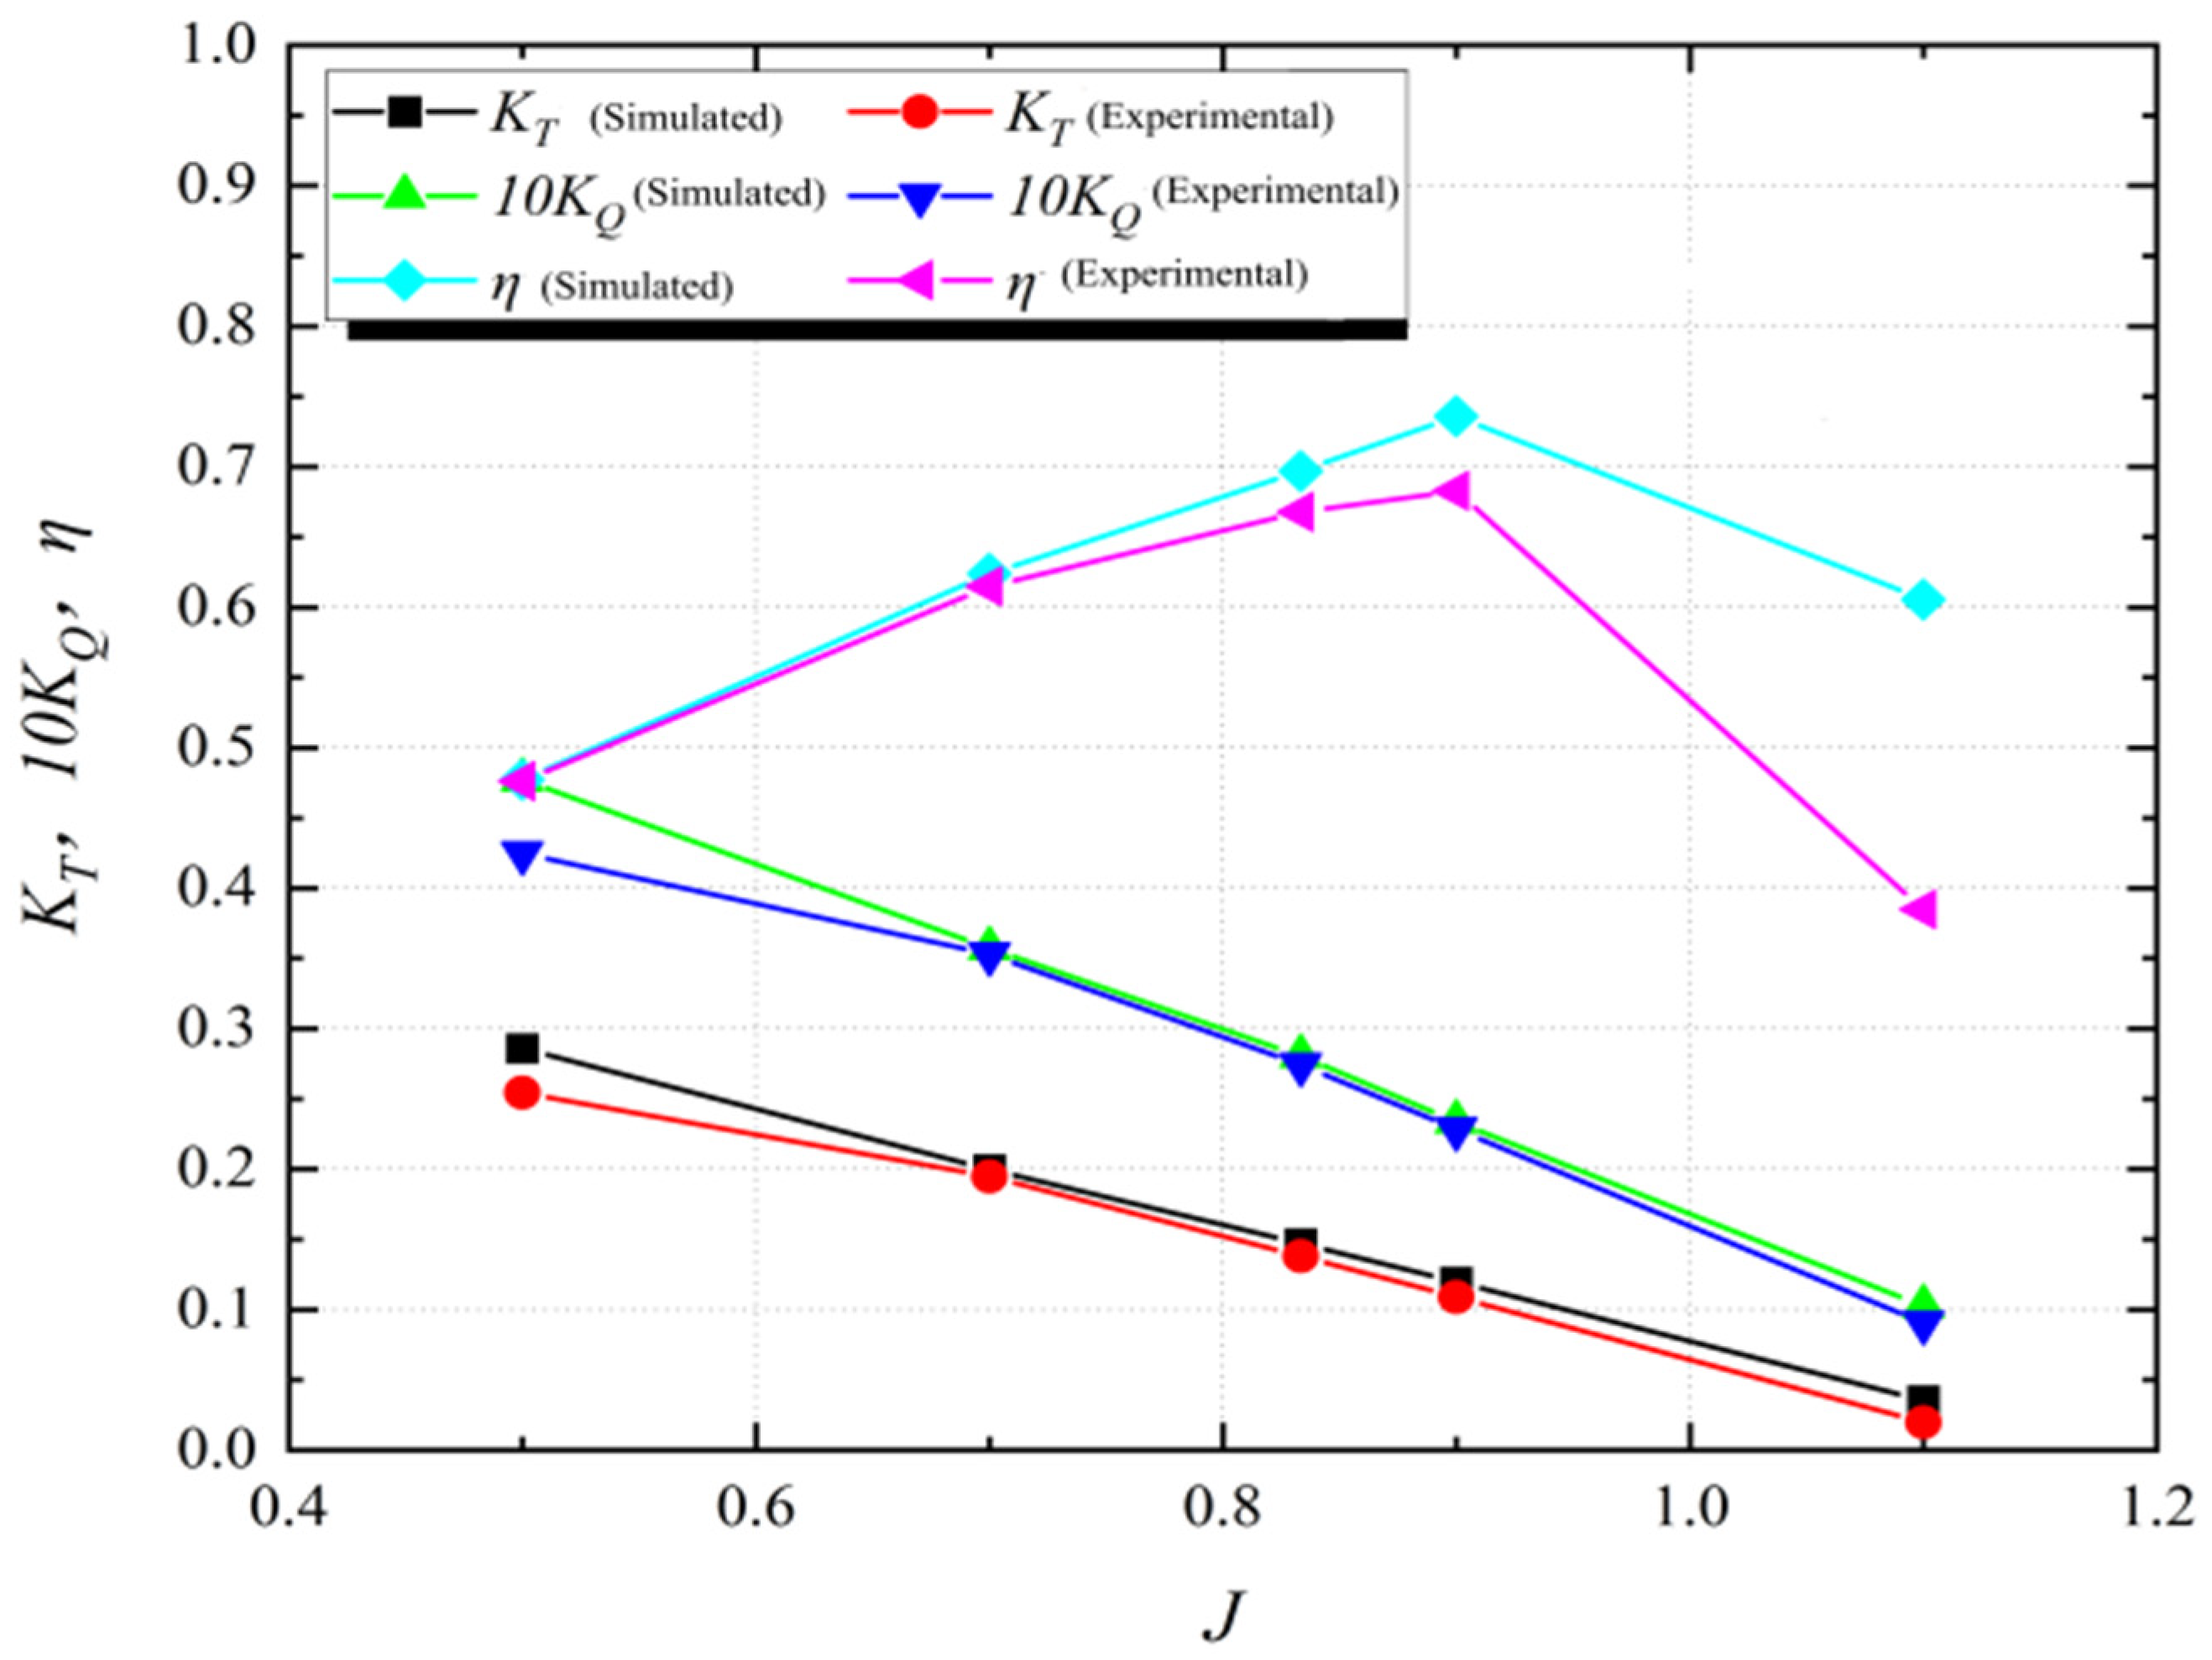
The open-water performance of the propeller at 0° inclination angle was initially calculated. As the characteristic curves and experimental data for this propeller have been publicly available through tests conducted at the Maritime Research Institute Netherlands (MARIN) [
17], the numerical simulation results were compared and analyzed against this benchmark data, as shown in
Figure 8.
Figure 8 demonstrates that when the advance coefficient (J) is below 0.9, the experimental data and numerical results show good agreement with minor errors. However, as J exceeds 0.9, the discrepancy gradually increases due to the significantly enhanced complexity of the flow field under high advance speed conditions. This deviation can be attributed to two main factors: first, the increasing flow separation and enhanced turbulence and vortex dissipation effects under high J conditions, which present challenges for numerical simulations in resolving such transient flow features [
19]; second, the thinning boundary layer and increased velocity gradient in the near-wall region at high inlet velocities, which reduce the simulation accuracy for wall shear stress and flow separation [
20,
21].
It should be noted that the steady-state MRF approach employed in this study, while suitable for predicting time-averaged hydrodynamic coefficients, has inherent limitations in capturing true transient phenomena. The flow instabilities under high J conditions are therefore inferred from steady-state flow structures rather than directly simulated as time-evolving events. Nevertheless, within the design operating range of the vector thruster (corresponding to low-to-medium J values), the simulation model demonstrates sufficient accuracy for the comparative analysis presented in this study. The thrust and torque coefficients maintain a consistent relationship with the advance coefficient within this operational range, and these values will be utilized for comparison with various inclination angle conditions in subsequent sections.
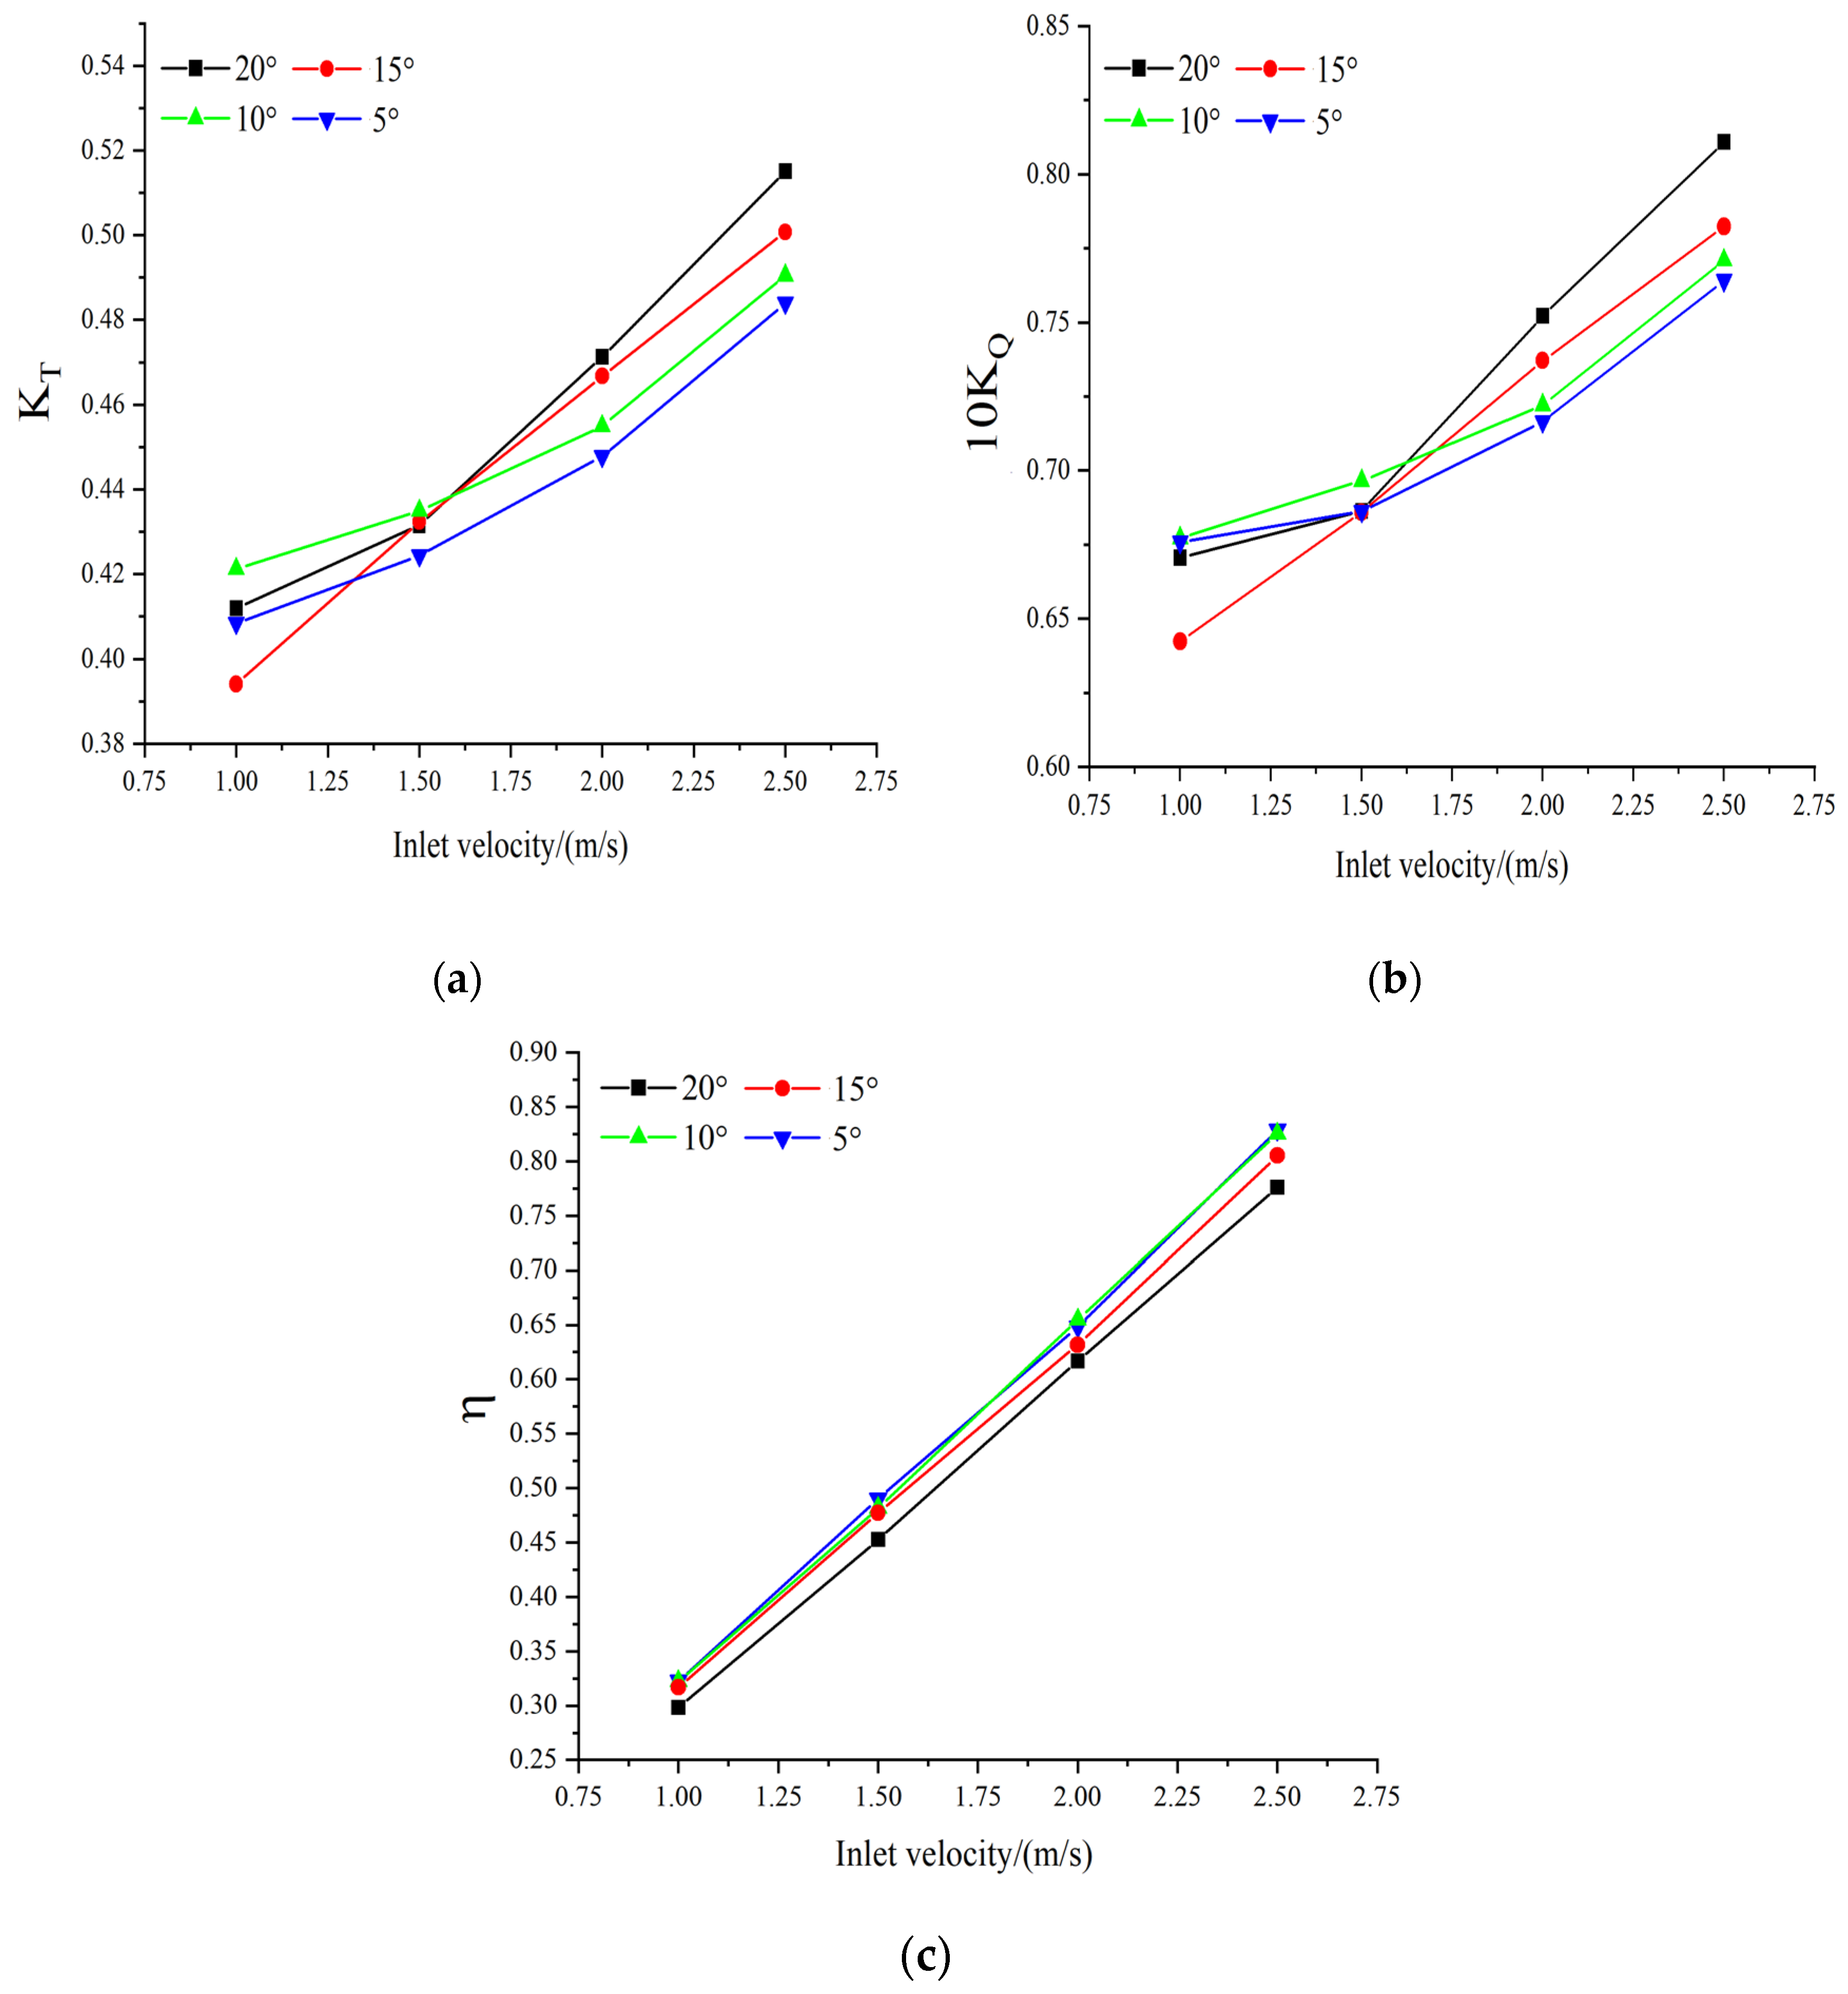
The propeller inclination angles were set to 5°, 10°, 15°, and 20°, and the inlet velocities were set to 1 m/s, 1.5 m/s, 2 m/s, and 2.5 m/s for CFD simulation calculations. Based on the formula for the propeller advance coefficient , the values were calculated to be 0.5, 0.7, 0.833, 0.9, and 1.1.
Based on the thrust, torque, and hydrodynamic efficiency data obtained from the simulations, the hydrodynamic performance curves of the propeller at different angles were plotted, as shown in
Figure 9.
As observed in
Figure 9a, the thrust exhibits a monotonic increase with the inclination angle for velocities of 2.0 m/s and above. At 1.5 m/s, however, a notable deviation occurs: the thrust rises as the yaw angle increases from 5 to 10 degrees but subsequently declines. This trend suggests a reduction in vortices and drag within the propeller wake field. It should be noted that these conclusions are based on a limited set of data points due to computational constraints.
In
Figure 9b, the variation pattern of the torque coefficient is basically similar to that of the thrust coefficient. After the inlet velocity exceeds 1.8 m/s, the torque coefficient at the same inlet velocity also increases with the increase in the inclination angle. This is because the change in the propeller blade angle causes the angle of contact between the water flow and the blades to increase, generating a larger lateral force and moment. At the same time, the increase in the inclination angle makes the flow field asymmetrical, which is consistent with the conclusion analyzed in
Section 3.2. For 1.5 m/s, the torque coefficient exhibits irregular variations. This specific behavior is likely attributed to more pronounced blockage effects in the test tank under this particular combination of velocity and inclination angle, or potentially due to a transition in flow separation characteristics.
In
Figure 9c, the difference in the hydrodynamic efficiency of the propeller at various inclination angles is small. At larger inclination angles, the change in the blade’s angle of attack causes a slight decrease in efficiency. Based on the comparison of the three hydrodynamic coefficients discussed above, it can be observed that all coefficients exhibit certain variations with the inclination angle, which is consistent with the findings from the wake characteristics analysis. Therefore, by integrating this hydrodynamic analysis with the mechanical analysis presented in
Section 2.3, more accurate values can be derived, though experimental validation remains necessary.
4. Dynamic Thrust Analysis Based on a Test Rig
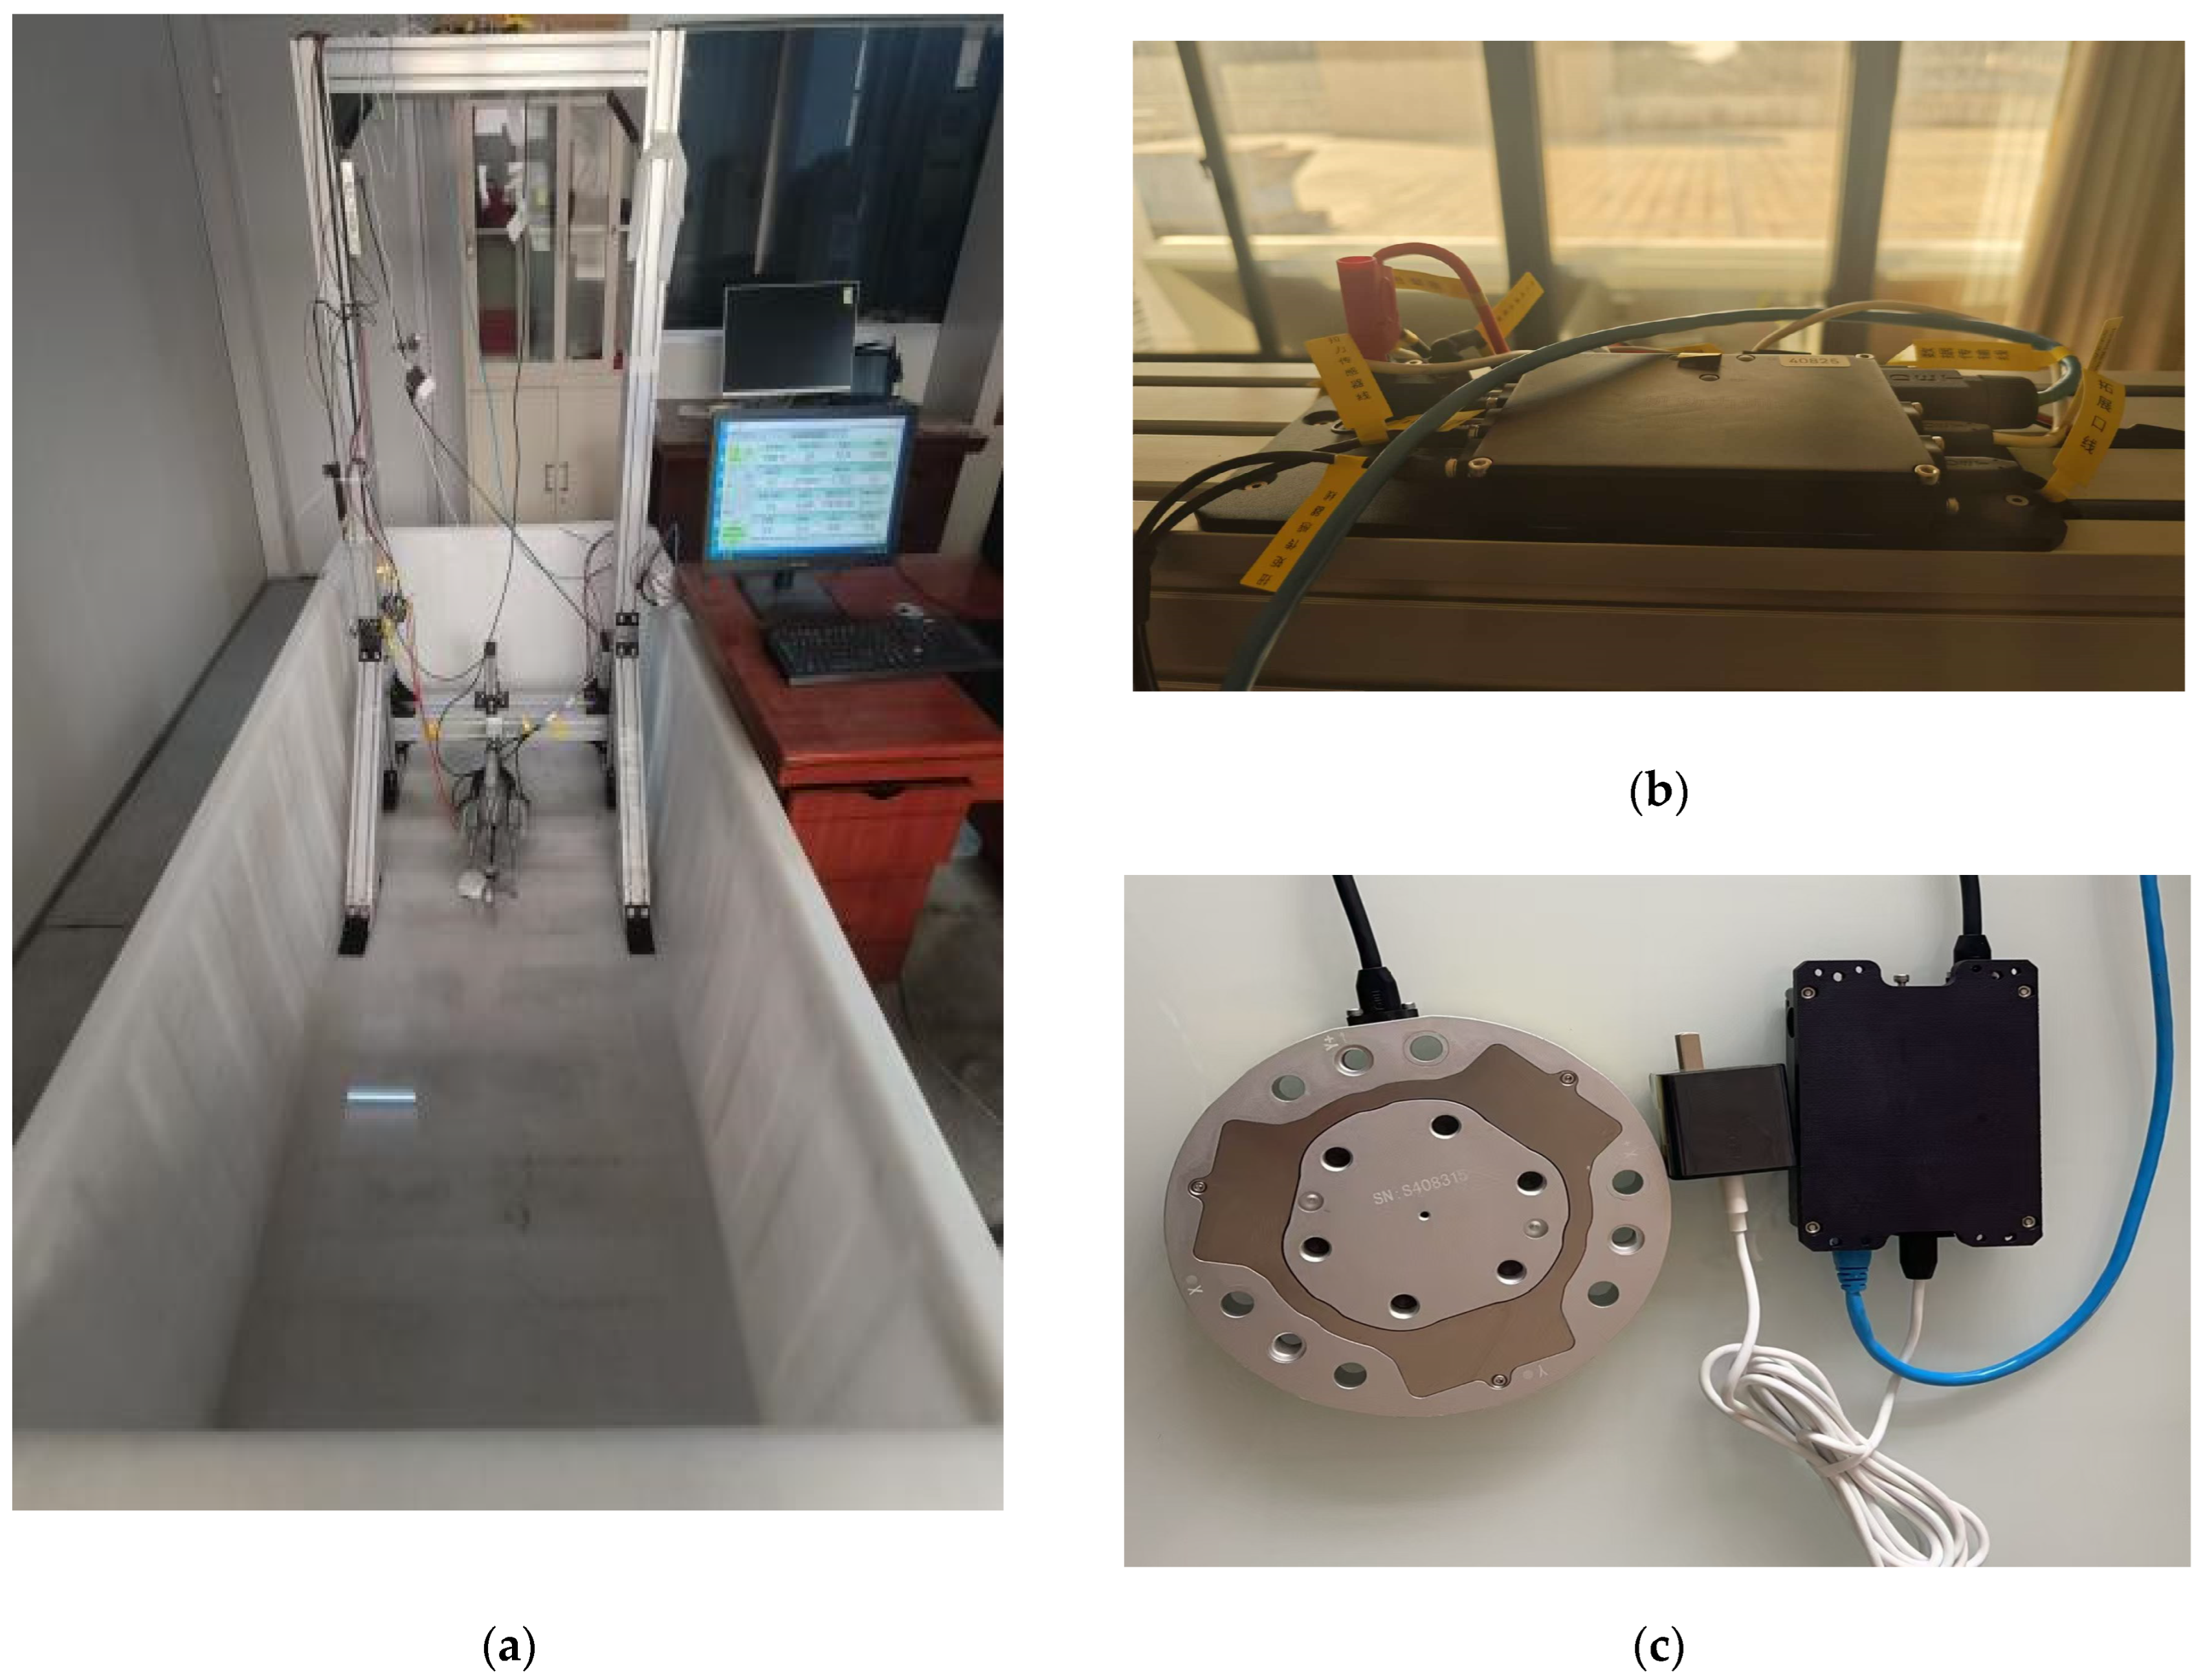
The constructed vector thrust test rig is shown in
Figure 10. The test rig is equipped with force sensors, torque sensors, speed sensors, vibration sensors, and other equipment to record data such as the thruster’s thrust, torque magnitude, and propeller speed in real-time. The thrust measurement uses a three-component force system that can measure longitudinal force, vertical force, and pitching force along the x, y, and z axes of the coordinate system. The effective thrust, defined as the axial component (Fx) of the total thrust vector, can be directly obtained from this measurement system.
The test bench employs a DET G10 three-axis force sensor (Shenzhen Quanxiang Power Technology Co., Ltd., Shenzhen, China) shown in
Figure 10. When subjected to external tension and torque, the sensitive element of the sensor deforms under force, causing minute changes in its electrical resistance. These subtle resistance variations are then converted into electrical signals via a Wheatstone bridge circuit. Subsequently, the electrical signals undergo amplification, filtering, and conversion. The converted electrical signals are transmitted to the control system or display for monitoring and analyzing the magnitude of the tension. Cross-talk between measurement channels is compensated in real-time using a transformation matrix obtained from the sensor’s factory calibration. Specifically, after the data acquisition system (DAQ interface) reads the raw voltage signals from each channel, it automatically multiplies them by this matrix, directly outputting decoupled three-axis force components. This method is derived by fitting calibration data from a series of standard loads based on the least squares approach, effectively eliminating inter-axis interference. This tension sensor has 3 channels, with an accuracy error of ±0.1% ±30 g, a tension resolution of 0.001 kg, and an internal data update frequency of up to 100 Hz, enabling it to meet the testing standards for underwater vector thrusters.
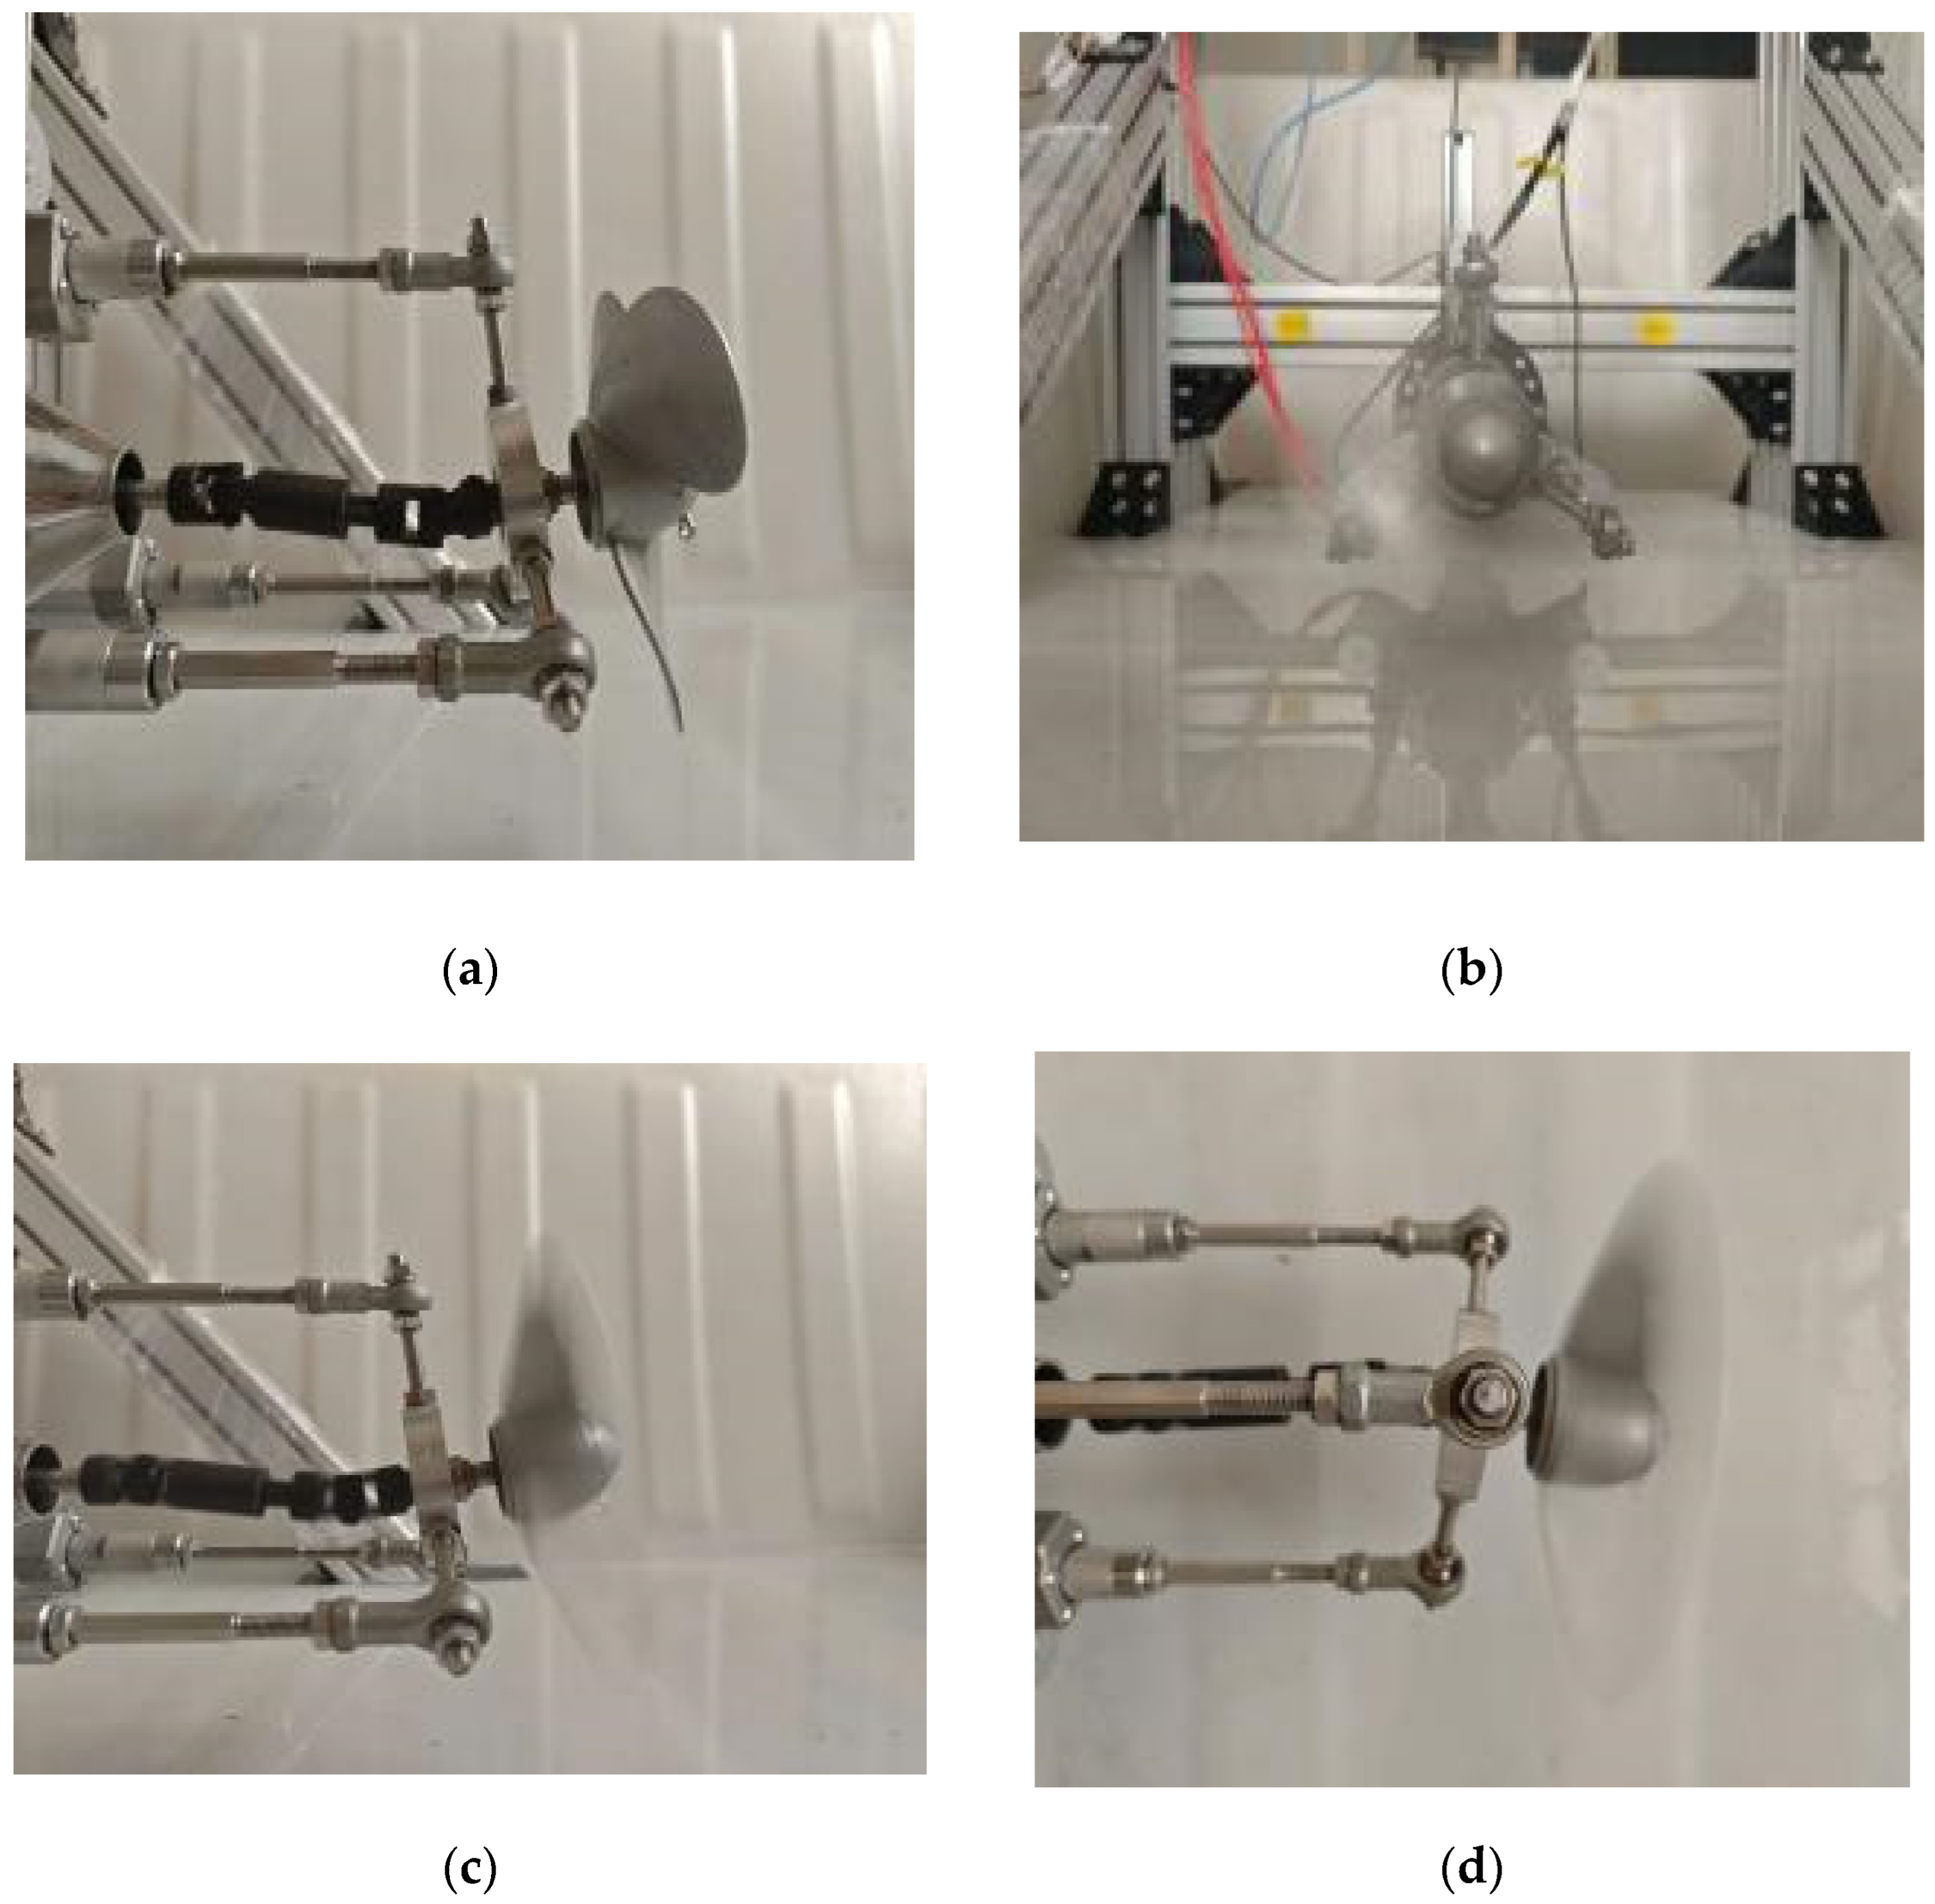
The test bench adopts an integrated design, fixing the propeller to the main body of the test stand, allowing the propeller to be tested in a water tank measuring 1.8 m in length, 1.2 m in width, and 0.6 m in height. By altering the yaw direction of the propeller, the steering motion of the propulsion system is controlled, enabling yaw tests in both the horizontal and vertical planes. The experimental process is illustrated in
Figure 11, which details the working process: (a) stationary state; (b) motion state; (c) propeller uptilt state; and (d) propeller downtilt state. It should be noted that the experimental setup employs a specific propeller type and a steering mechanism whose parameters are determined by a static stiffness model. While this specific configuration is the focus of the present study, the design of the test bench and the methodological approach are sufficiently general to accommodate future investigations of other propeller-mechanism combinations.
During the experiment, key parameters including thrust, torque, and efficiency of the thruster were continuously monitored. The real-time interface displays of the measurement system under both non-inclined and inclined conditions are provided in
Figure 12a and
Figure 12b, respectively. Spectral analysis of the corresponding raw signals indicates a highly complex frequency structure, which is attributed to nonlinear vibrations induced by the coupled steering mechanism. This spectral complexity makes it difficult to clearly identify the dominant blade-passing frequency, necessitating dedicated data processing for specific operational parameters. Therefore, to systematically characterize the performance of the vector thruster, the acquired data were processed and analyzed under four distinct parameter combinations. The resulting dynamic characteristic curves are presented in
Figure 12c–f, corresponding to inclination angles of 10° and 20°, each at rotational speeds of 300 rpm and 500 rpm.
From the monitoring results of the four conditions, it can be seen that due to the effect of the tail vortex, even when the thruster speed is constant, clear fluctuation peaks appear in the thrust curve. The fluctuations become more intense as the speed or inclination angle increases. For example, at a rotational speed of 300 rpm and an inclination angle of 10°, the thrust pulsation component reaches approximately 2.4 KG, representing about 14.1% of the mean thrust. When the inclination angle increases to 20°, this component rises to 3.8 KG, accounting for approximately 22.1% of the mean value. Simultaneously, the pulse distribution of the measured thrust shows a higher density, which is correlated with the expansion of the low-pressure region in the corresponding flow field, as depicted in
Figure 7. This coupled behavior becomes more pronounced at a rotational speed of 500 rpm.
Furthermore, by comparing
Figure 12c and
Figure 12d, as well as
Figure 12e and
Figure 12f, it can be found that the mean thrust decreases as the inclination angle increases. That is, the thrust loss becomes more pronounced. To reveal the characteristics of the thrust loss, we plotted the variation in the theoretical value, simulated value, and measured values with the inclination angle at different speeds, as shown in
Figure 13. The specific definitions of these values are as follows:
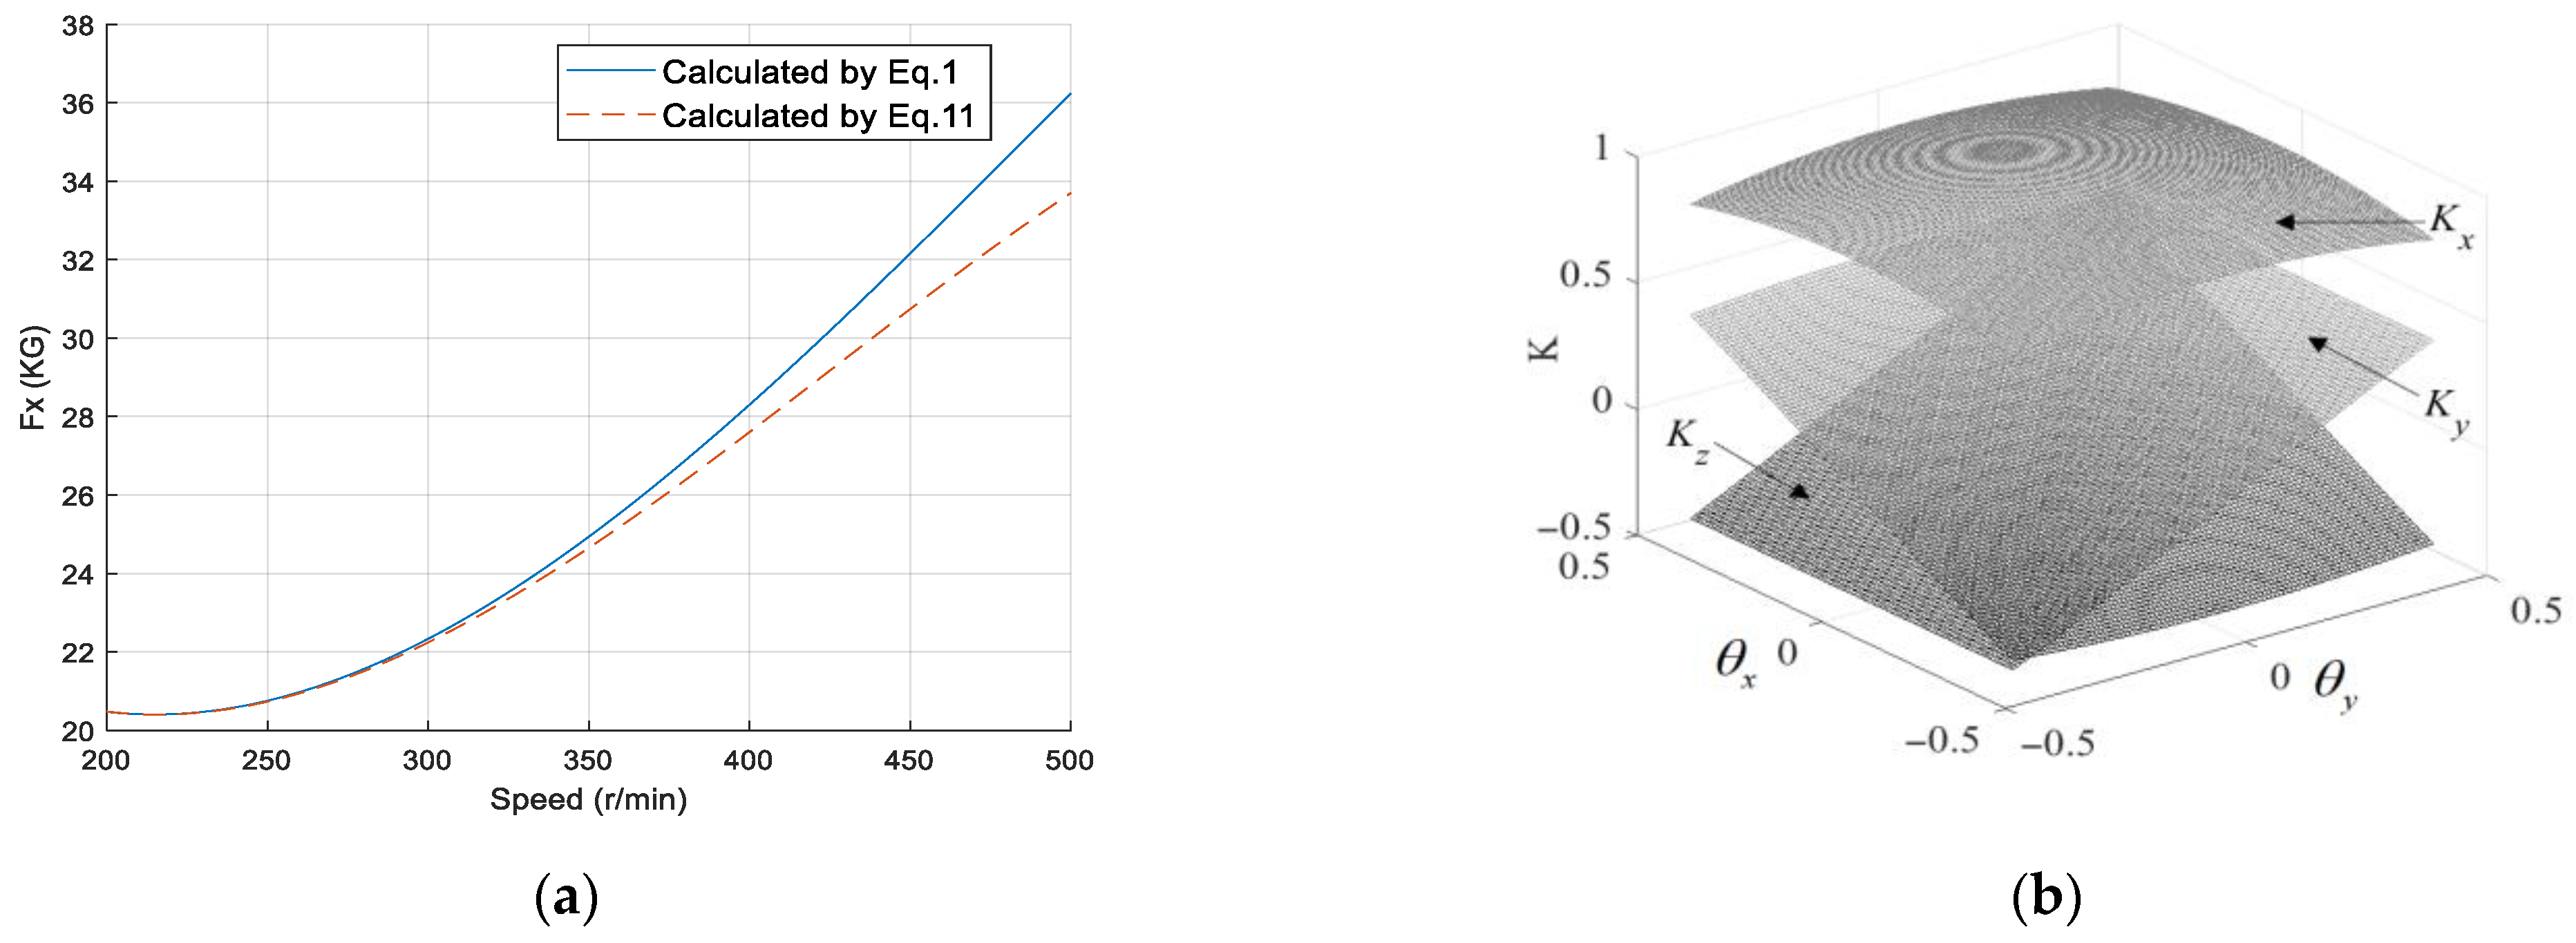
“Theoretical value”: This represents the prediction calculated using Equations (1) and (2), which is consistent with the “calculated by Equation (1)” curve shown in
Figure 3.
“Simulated value”: This denotes a more accurate computational result obtained by integrating mechanical structure analysis with hydrodynamic calculations. Specifically, hydrodynamic simulation outputs are incorporated into Equation (11) to derive this value.
“Measured value”: This corresponds to the axial projection of the vector thrust recorded by the experimental test rig.
It can be seen that under the condition of zero inclination angle, the theoretical, simulated, and actual values are basically consistent. When the inclination angle increases, the efficiency loss gradually increases due to the increased impact of cavitation and vortex phenomena, leading to a gradually increasing deviation between the theoretical and simulated values. When the rotational speed increases, the total thrust generated by the propeller increases. Therefore, the inclination angle will slightly increase under the action of the thrust, leading to further thrust loss. Consequently, the deviation between the experimental and theoretical values further increases. At the common operating condition of 300 r/min, the thrust loss within a 35-degree inclination angle is about 0.25 KG. At the high-speed condition of 500 r/min, the thrust loss is further exacerbated, reaching 0.45 KG. These quantified thrust loss results could potentially be integrated as look-up tables or correction factors into advanced control strategies, such as model predictive control.
5. Discussion
To reveal the hydrodynamic performance under complex inclination angle variations, this study designed a parallel-type vector thruster and characterized its operational envelope and thrust characteristics. Through three-component force testing and hydrodynamic coefficient calculations, combined with mechanical structural dynamics analysis, the comprehensive dynamic performance characteristics of the parallel vectoring structure were obtained. The results demonstrate that the thruster can effectively provide the main propulsive force while generating sufficient deflection moments for steering control. However, during the spatial motion of the propeller, as the inclination angle increases, the low-pressure zone shifts to the side at low speeds and large inclination angles, and the pressure difference around the blades decreases. The velocity distribution, pressure gradient, and turbulence characteristics of the fluid around the blades all change. Overall, the low-pressure areas are observed to increase, with cavitation and vortex phenomena becoming more pronounced. These observations suggest a corresponding decrease in propulsion efficiency, which exhibits an increasing trend with higher rotational speeds and inclination angles.
Based on hydrodynamic calculations and experimental measurements conducted on a specific propeller and steering mechanism combination with defined stiffness parameters, this study identifies thrust pulsation and mean thrust loss as critical factors degrading propulsion performance under large inclination angles. The results show that thrust pulsation intensifies substantially with increasing rotational speed and inclination, while conventional analytical methods significantly overestimate thrust due to unaccounted cavitation, vortex effects, and mechanical deformation. These findings highlight the necessity of incorporating large-angle thrust characteristics into vector thruster design and control, particularly for high-speed applications involving significant inclination angles. While the specific quantitative results are configuration-dependent, the revealed physical mechanism of the coupled structural–hydrodynamic effect and the presented methodology provide a valuable framework for analyzing similar systems. Future work should therefore focus on developing higher-fidelity models through transient coupled analysis to better capture the dynamic flow phenomena and improve control precision.
