Article

Evaluation and Prediction of Big Data-Driven Marine Ecological Restoration Effect Based on CRITIC-IGA Hybrid Model

Third Institute of Oceanography, Ministry of Natural Resources, Xiamen 361005, China
*
Author to whom correspondence should be addressed.
J. Mar. Sci. Eng. 2025, 13(12), 2241; https://doi.org/10.3390/jmse13122241
Submission received: 21 October 2025 / Revised: 13 November 2025 / Accepted: 17 November 2025 / Published: 25 November 2025
(This article belongs to the Section Marine Ecology)

Abstract

The marine ecosystem is facing multiple threats such as pollution, overfishing, and coastal erosion, and an objective and quantifiable assessment method of restoration effect is urgently needed. However, the existing models mostly rely on subjective weighting or are difficult to cope with the uncertainty and high-dimensional nonlinear characteristics of ecological data. In this paper, a multilevel fuzzy comprehensive evaluation model combining Criteria Importance Through Intercriteria Correlation (CRITIC) objective weighting and improved genetic algorithm (IGA) is proposed to evaluate and predict the effect of marine ecological restoration driven by big data. The model is based on more than 10,000 multi-source spatio-temporal data of eight restoration projects (including mangroves and wetland coastlines) in typical coastal cities of China from 2015 to 2023. The uncertainty of ecological indicators is represented by a fuzzy membership function, and the weights are dynamically optimized in a data-driven way. The results show that this method significantly improves the objectivity, robustness, and adaptability of the assessment, and can more truly reflect the temporal and spatial differentiation of the restoration effect, which provides strong support for the dynamic optimization of the restoration scheme, the precise allocation of resources to the scientific management decision, and promotes the sustainable development of the green marine economy.

1. Introduction

The ocean is the largest habitat of the earth, and ecological restoration helps to protect biodiversity, maintain the stability of the ecosystem, and guarantee key ecological services, such as climate regulation and water purification [1,2,3,4]. A healthy marine environment not only supports the development of the marine economy and attracts tourism and investment, but also helps to cope with global warming by enhancing carbon absorption capacity—for example, restoring seagrass beds and building artificial reefs can significantly improve the carbon sequestration effect [5,6,7,8,9]. The research of Duarte et al. [10] shows that the average annual recovery rate of the marine ecosystem is about 2.95%, and it would take 21 years to achieve 90% significant recovery.
By evaluating and predicting the effect of marine ecological restoration, we can scientifically judge the effectiveness and applicability of different restoration measures, avoid blind investment and waste of resources, and improve the pertinence and effectiveness of restoration work. This kind of research supports the dynamic monitoring of the repair process, so that the scheme can be optimized and adjusted in time according to the goal [11]. At the same time, it is helpful to verify and deepen restoration theory and provide an empirical basis for the government to formulate marine protection and management policies [12,13].
Marine ecosystem restoration is critical for restoring global biodiversity and improving environmental quality. In recent years, research on marine restoration has increased; however, most studies focus on qualitative analysis and the evaluation of individual ecological factors, with a lack of systematic quantitative models. Liu et al. [14] applied the convolutional neural network (CNN) model to the identification of soil erosion intensity in ecological restoration areas, and the accuracy increased by 25.57%. Yamaguchi et al. [15] adopted a long-term and short-term memory network (LSTM) as a deep learning model, and the prediction error of the trained LSTM model is controlled within 0.162 m. Furthermore, existing models often fail to effectively account for the relative weights and uncertainties of different restoration strategies when processing multidimensional data. This limits the precision and applicability of traditional models in real-world restoration assessments.
Despite the growing use of fuzzy evaluation models in ecological assessment, existing approaches often rely on subjective weight determination methods such as AHP or expert scoring, which introduce bias and reduce reproducibility. Furthermore, traditional optimization algorithms like GA and PSO suffer from premature convergence and low computational efficiency when applied to high-dimensional, nonlinear marine ecological data. However, some related scholars have conducted optimization research [16]. The innovation of this present study lies in the combination of improved genetic algorithm (IGA) and fuzzy comprehensive evaluation (FCE), which provides a new weight optimization mechanism for the evaluation of marine restoration effect. This method enhances the precision of restoration evaluations by incorporating a multi-level assessment structure and adaptive optimization techniques. By optimizing weight assignment through IGA, the model reduces human bias and improves accuracy. Specifically, our hybrid Criteria Importance Through Intercriteria Correlation (CRITIC)-IGA approach automates weight calibration using objective data-driven criteria, thereby addressing the critical research gap in objective, scalable, and accurate assessment of marine restoration effects under uncertainty. This approach addresses the shortcomings of current marine restoration research in handling complex data and uncertainties, filling an important gap in the field. The uncertainties dealt with in this paper mainly include three categories: (1) the inherent variability of the ecosystem (such as the natural fluctuation of species recovery rate); (2) measurement error in environmental monitoring and remote sensing data; (3) the dynamic fluctuation of social and economic indicators (such as the number of tourists and fishery output). These uncertainties are mathematically represented by the membership function in the fuzzy comprehensive evaluation model.
Although several models have attempted to perform quantitative assessments of marine restoration, most rely on traditional methods such as Genetic Algorithms (GA) or other metaheuristic techniques. These methods often suffer from low precision and computational inefficiency. To validate the superiority of the proposed IGA-based FCE model, we conducted comparative experiments against four benchmark models: (1) FCE with AHP-derived weights, (2) GA-FCE, (3) PSO-FCE, and (4) SA-FCE. In this paper, these four benchmark models were selected because they represent four mainstream methods for determining and optimizing weights in ecological assessment: AHP, GA, PSO, and SA. By systematic comparison with these four models, the comprehensive advantages of the proposed CRITIC-IGA-FCE hybrid model in reducing human bias, improving optimization accuracy, enhancing global search ability, and balancing calculation efficiency and solution quality can be fully verified. All models were trained and tested on the same dataset (n = 10,000) using 10-fold cross-validation.
The main objectives of this study are as follows: (1) to build a CRITIC-IGA-FCE hybrid assessment model for multi-source uncertain marine ecological data; (2) to verify its effectiveness using the large-scale monitoring data of typical coastal restoration projects in China from 2015 to 2023; (3) to prove the comprehensive advantages of the framework in terms of accuracy, robustness, and practicability as compared with the mainstream weighting and optimization methods, which provides a new paradigm for scientific decision-making for marine ecological restoration.

2. Literature Review

Marine restoration is a critical aspect of environmental conservation, aiming to restore and enhance the health of marine ecosystems that have been impacted by human activities or natural events. Assessing the effectiveness of marine restoration efforts is essential to ensure that resources are allocated efficiently and that desired outcomes are achieved. In recent years, there has been a growing interest in utilizing advanced analytical tools and models to evaluate the effects of marine restoration projects. One approach that has been proposed is the use of multi-level fuzzy evaluation models to assess the impact of restoration efforts on marine ecosystems. These models allow for the consideration of multiple parameters and indicators, providing a comprehensive analysis of the effectiveness of restoration activities.
Domestically and abroad, scholars have conducted extensive research on the valuation of marine ecosystem services. However, these monitoring networks often lack integrated analytical frameworks capable of translating raw data into actionable restoration effectiveness scores. For instance, while De Valck et al. [17] provides a robust accounting framework, it does not support dynamic prediction or optimization under uncertainty. Similarly, the valuation methods in Shrestha et al. [18] and Gajardo et al. [19] are primarily static and non-adaptive, limiting their utility in real-time decision-making. The modified selection model by Nie et al. [20] improves mangrove assessment accuracy but remains site-specific and difficult to generalize across diverse coastal habitats.
Significant progress has been made in the assessment of marine ecosystem services. Recently, research began to try incorporating multi-criteria decision-making (MCDM) and intelligent algorithms to improve the scientific evaluation. Alishirazi et al. [21] used the mixed fuzzy AHP-VIKOR method, combined with questionnaires from experts, stakeholders, and residents, to rank the remediation schemes of mercury pollution in the Musa Bay of the Persian Gulf, which proved that an MCDM framework can effectively support the optimization of remediation strategies for specific sites, but its weight setting was still highly dependent on subjective judgment. Similarly, Yan et al. [22], based on a CRITIC-TOPSIS method, integrated public perception and measured data to evaluate the restoration effect of the Qinhuangdao coastal zone, and used an obstacle model to identify key constraints, highlighting the value of objective empowerment in coastal assessment, but their model is still a static diagnosis and lacks dynamic prediction ability. In the aspect of algorithm optimization, Cheng et al. [23] used a genetic algorithm (GA) and particle swarm optimization (PSO) to improve a BP neural network to predict the spread of oil spills in the sea, and found that PSO-BP was the best in stability and accuracy. This study verifies the potential of meta-heuristic algorithms in marine environment modeling, but it also reflects the problems wherein standard GA easily falls into a local optimum and PSO has the risk of premature convergence, which may be more prominent in high-dimensional and noisy ecological restoration assessment scenarios.
The multi-level analysis of the standard cost method mentioned in a previous study provides a scientific framework for evaluating the effects of restoration efforts on marine ecosystems [24,25,26]. In the field of engineering, MATLAB R2024a (MathWorks, Natick, MA, USA) has been widely used for data analysis and modeling, making it a valuable tool for assessing the impact of marine restoration projects [27]. Overall, the integration of advanced analytical tools such as MATLAB, multi-level fuzzy evaluation models, and Bayesian-based analysis methods can enhance the assessment of marine restoration projects.
Although research on marine restoration and the assessment and prediction of restoration effects has made progress, there are still shortcomings [28], such as a lack of focus on coastal ecosystems, an incomplete evaluation theoretical system, insufficient methodological innovation, and a lack of guidance for subsequent ecological restoration work based on evaluation results [2,24].
This study compares the advantages and disadvantages of the previous methods, as shown in Table 1.
In the past, most of the research focused on the snapshot evaluation of the restoration effect in the static attribute space, that is, based on the observation data at a certain time point, the comprehensive score was calculated by fixed weight, and the result was essentially a scalar projection in the high-dimensional index space, which was difficult to describe the time-series evolution characteristics and nonlinear response mechanism of the restoration process, and could not answer the key management question of how the restoration effect would change in the future. In contrast, the CRITIC-IGA-FCE model proposed in this paper reconstructs the evaluation logic in the dynamic fuzzy decision-making space: the CRITIC module automatically extracts the conflict and contrast intensity between indicators based on historical monitoring data and generates an objective initial weight vector in the original index space to avoid artificial setting deviation. The IGA optimizer searches adaptively in the weight space, and effectively jumps out of the local optimum and approaches the global optimal weight allocation that minimizes the prediction error through strategies such as elite reservation, crossover, and mutation rate dynamic adjustment. The multilevel FCE layer combines the optimized weights with the fuzzy membership function and produces the probability distribution of the repair effect in the language hierarchy spaces, such as “excellent”, “good”, and “poor”, instead of a single definite value, thus explicitly expressing the uncertainty of the evaluation results. This three-stage architecture of “data-driven empowerment → intelligent optimization → fuzzy mapping” can not only accurately locate the current state in the traditional index space but also simulate the future restoration trajectory in the prediction space through the co-evolution of weights and membership functions, realizing the transition from static diagnosis to dynamic prediction, which provides a new methodological support for the forward-looking management of marine ecological restoration.

3. Materials and Methods

3.1. Theoretical Background

3.1.1. Marine Ecological Foundation Theory

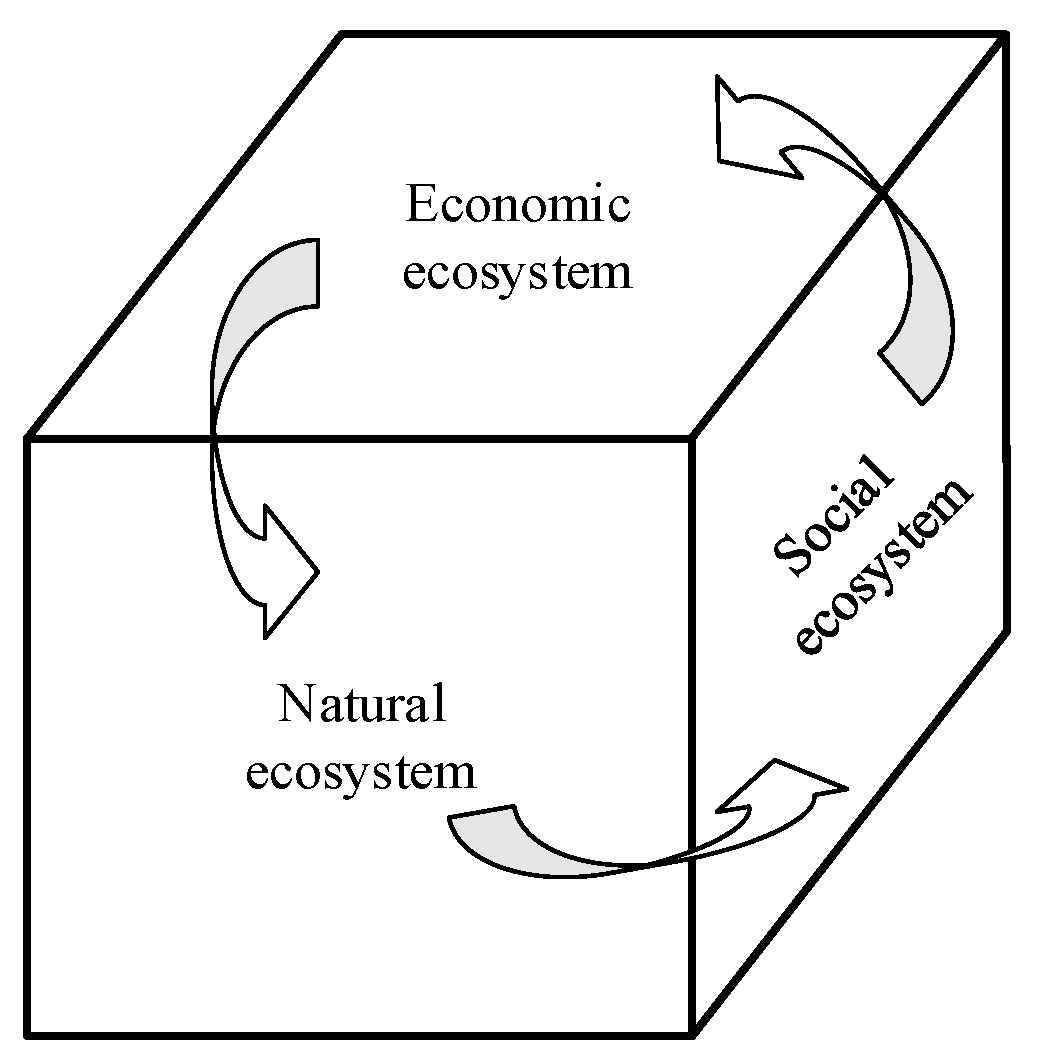
The core of marine ecological research lies in understanding the complex structure and functions of its ecosystems, as well as their interactions with human activities. Based on an analysis of the existing literature, we will briefly introduce several foundational theories. Firstly, the theory of coastal ecosystem restoration aims to understand the internal mechanisms of coastal ecosystems and address issues such as ecological damage, imbalanced spatial layouts, and overexploitation of natural resources. This theory employs an integrated approach that leverages the inherent recovery capabilities of ecosystems or supplements them with artificial measures to gradually restore the structure and function of the ecosystem, achieving a virtuous cycle. The theory of coupled ecological systems emphasizes that ecosystems are composite systems intertwined and influenced by natural, social, and economic subsystems. These subsystems have complex interactions and checks-and-balances relationships that together maintain the stability and development of the ecosystem. This theory provides a theoretical framework for studying the relationships between indicators in coastal ecosystem restoration planning and guides the formulation and implementation of comprehensive restoration measures. Figure 1 below illustrates a model of a coupled ecosystem.
Figure 1 illustrates the structure of the coupled ecological system, highlighting the interactions between natural, social, and economic subsystems. This conceptual model underpins the design of our evaluation framework, justifying the inclusion of socio-economic indicators alongside ecological and water quality metrics.
Restoration ecology is the science of restoring damaged ecosystems through scientific and technical means, with the aim of restoring both the structure and function of these ecosystems. This includes restoring ecosystems to their original structure and function, investigating the processes and principles involved in restoration, and emphasizing holistic ecological restoration. Coastal ecosystem restoration is one of the key application areas of restoration ecology, utilizing the latest findings from fields such as ecology, environmental science, and engineering technology to develop scientifically sound restoration plans. These plans are guided by restoration ecology theory to facilitate the recovery and reconstruction of coastal ecosystems. The theory of integrated land–sea management emphasizes the organic unity of marine and terrestrial areas, focusing on finding and utilizing the relevance and complementarity of functional spaces between the two. It involves unified planning for resource and environmental management, economic and cultural development, and strategic security. Marine and terrestrial areas are interconnected and interdependent systems. By identifying and leveraging the relevance and complementarity of functional spaces, the theory advocates for the unified planning of resource and environmental management, economic and cultural development, and strategic security issues between land and sea, aiming to achieve harmonious coexistence. In coastal ecosystem restoration, integrated land–sea management is emphasized to promote coordinated development between terrestrial social systems and marine ecosystems.

3.1.2. Traditional Restoration Effect Evaluation Technology

In the field of ecological restoration and environmental protection, the evaluation of restoration outcomes is a crucial component, directly related to the scientific rigor, reasonableness, and effectiveness of restoration measures. Traditional techniques for evaluating restoration outcomes primarily include two categories: the comprehensive index evaluation method and ecosystem service value assessment techniques. The comprehensive index evaluation method is a technique that integrates multiple evaluation indicators into a single comprehensive index to holistically reflect the effects of ecological restoration. This method typically sets up multiple sub-objective layers, each containing one or more evaluation indicators at the indicator layer. The setting of sub-objective layers in the evaluation of ecological restoration outcomes can be determined based on specific restoration goals and the characteristics of the ecosystem. For each sub-objective layer, representative evaluation indicators must be selected. After selecting the evaluation indicators for each sub-objective, a corresponding comprehensive index needs to be constructed. This often involves determining weights and designing algorithms. Weights can be determined using expert scoring, the Analytic Hierarchy Process (AHP), and other methods, while algorithms may employ statistical methods, fuzzy evaluation, gray system theory, and other approaches. The comprehensive index for each sub-objective is calculated based on the indicator layer, which then leads to an overall comprehensive index, providing an evaluation of the overall benefits of the restored ecosystem.
Ecosystem service value assessment techniques are methods for quantitatively studying the economic value of various ecosystem services, aiming to monetize natural factors to more intuitively reflect the economic value of ecosystems. These assessment methods can be broadly categorized into three main types:
(1)
Actual Market Assessment Techniques
These methods use the actual market prices of products and services provided by ecosystems as the economic value of ecosystem services. For instance, the market price of timber harvested from a forest can be used to assess the value of the timber-provisioning service offered by that ecosystem.
(2)
Substitute (Implied) Market Assessment Techniques
These methods estimate the economic value of ecosystem services indirectly by assessing the market prices of substitutes for those services. For example, the cost of water purification services provided by wetlands might be estimated by comparing it to the cost of building and operating a water treatment plant.
(3)
Hypothetical (Simulated) Market Assessment Techniques
These methods involve constructing hypothetical markets to measure the values of ecosystem services and environmental resources. This approach often involves surveys and experiments designed to elicit people’s willingness to pay for the preservation of ecosystem services that do not have direct market transactions.

3.1.3. Construction of Evaluation Index System for Ecological Culture Construction

To construct a scientific, comprehensive, and objectively reasonable evaluation index system for the effectiveness of coastal ecologization construction, it is essential to follow a structured approach. First, the evaluation objective must be clearly defined, which is the effectiveness of coastal ecologization construction. Based on this objective, the following steps should be taken:
(1)
Determine the Hierarchical Structure of the Evaluation Index System
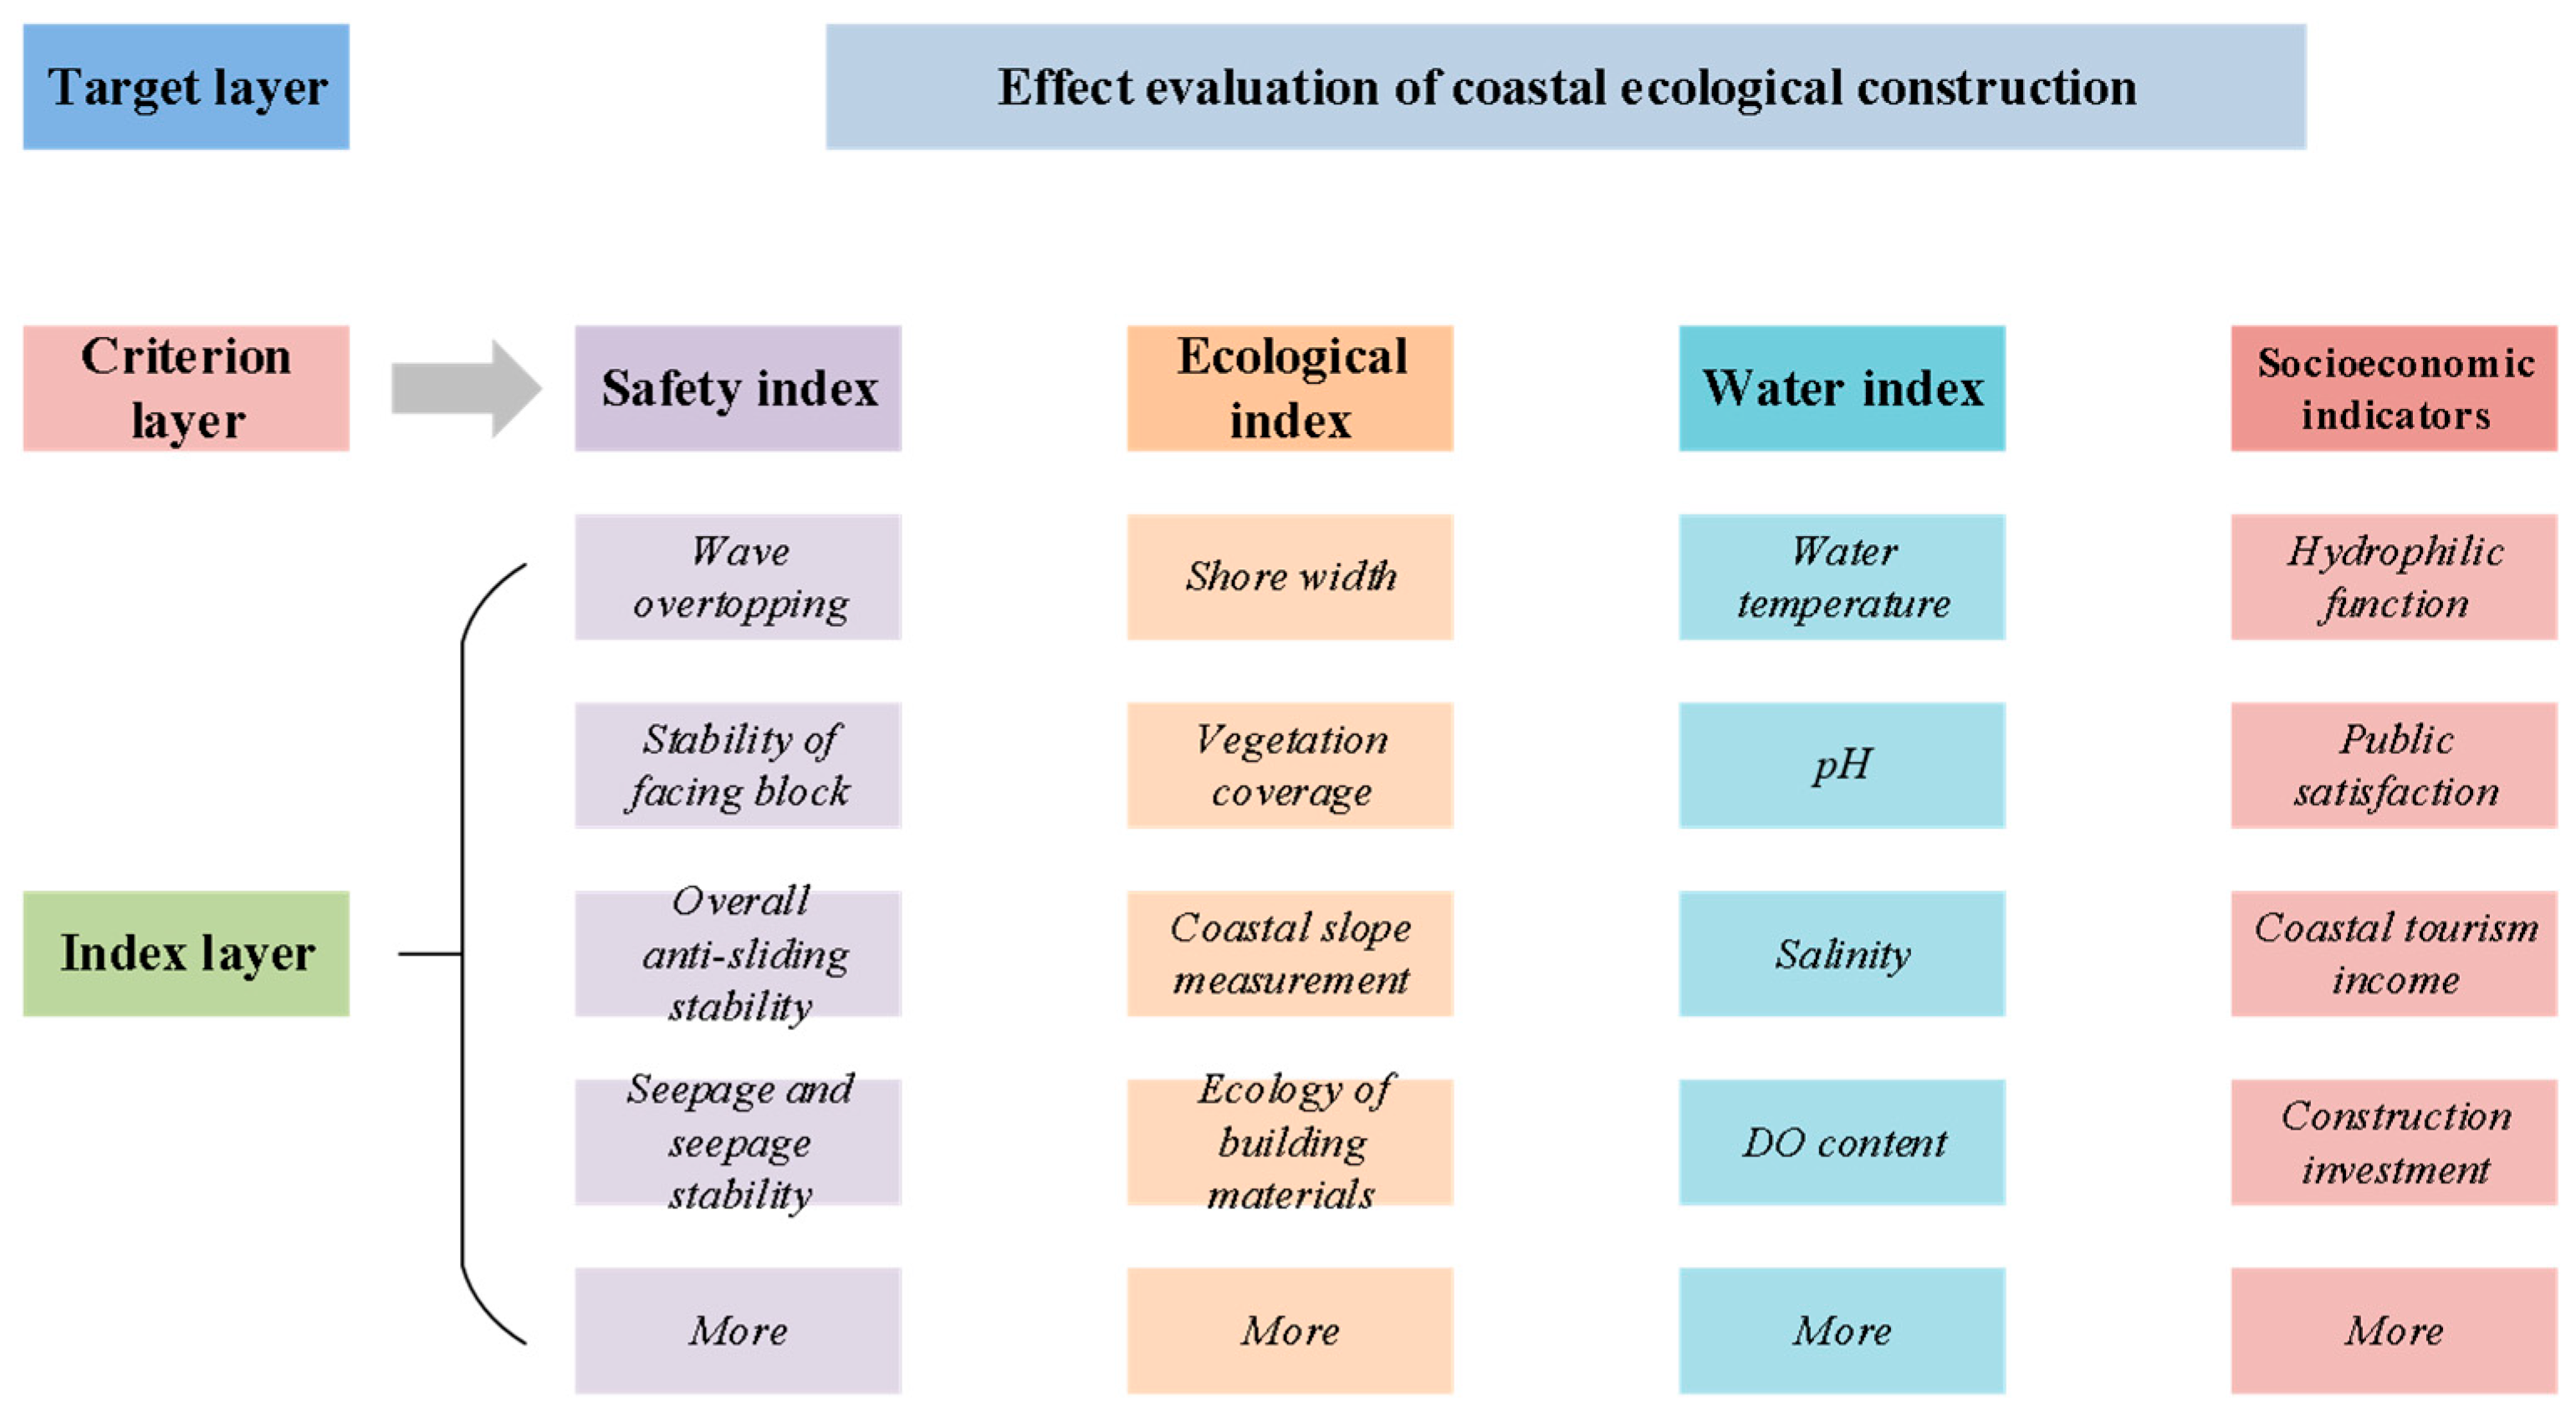
This includes defining the target layer, criterion layer, and indicator layer. The target layer represents the ultimate evaluation purpose, which is the effectiveness of coastal ecologization construction. The criterion layer encompasses safety, ecology, water quality, and socio-economics, while the indicator layer consists of key factors that reflect the various aspects of the criterion layer.
(2)
Select Indicators with Representativeness, Accessibility, and Universality
Indicators should be chosen such that they reflect the overall condition of the coastal ecosystem (representativeness), are easy to obtain and cost-effective (accessibility), and are applicable to most coastal remediation and restoration projects (universality).
(3)
Exclude Highly Correlated Indicators
To avoid redundancy in data and ensure that the evaluation results are closer to the actual effects, highly correlated indicators should be removed.
(4)
Ensure Data Collectability, Monitorability, and Statistical Processability
The selection of indicators should consider the current technological level in China. Indicators that are difficult or too costly to obtain should be discarded unless they are critically important and can be obtained through simulation or experimental modeling.
(5)
Establish a Comprehensive Evaluation Index System
This system should comprise three hierarchical levels: the target layer, which evaluates the effectiveness of coastal ecologization construction; the criterion layer, including indicators for safety, ecology, water quality, and socio-economics; and the indicator layer, consisting of multiple key factors that provide a detailed assessment at each level.
For safety indicators, we selected factors such as wave overtopping volume, stability of facing blocks, overall anti-slide stability, seepage, and permeability stability. Specific numerical values were calculated according to relevant design standards. Ecological indicators reflected the ecological effects of coastal remediation and restoration. Indicator grades were established to clearly delineate the actual status levels and developmental stages of each evaluation indicator, and each was evaluated using four grades: excellent, good, passable, and poor. The grading standards should refer to relevant domestic and international indicators and development plan objectives, ensuring that grade intervals do not overlap and that threshold values are included within the higher-grade standard range.

3.2. Principle of Fuzzy Comprehensive Evaluation Method

In traditional marine restoration effect evaluation processes, there are often challenges, such as difficulty in defining the boundaries of multiple indicators and complex quantification, leading to a high degree of subjective judgment and lower accuracy. This makes it difficult to effectively assess the restoration outcomes and hinders the continuous improvement of subsequent restoration work. Fuzzy comprehensive evaluation (FCE) is based on the principle of fuzzy relational mapping and addresses issues related to unclear boundaries and difficult quantification by conducting a comprehensive evaluation from the perspective of multi-dimensional membership grading conditions. Compared to traditional methods—the comprehensive index method, TOPSIS (Technique for Order Preference by Similarity to Ideal Solution), rank-sum ratio method, analytic hierarchy process (AHP), and multivariate statistical analysis—FCE has the advantage of converting the fuzzy information of the evaluation object into quantitative assessments that closely match reality through appropriate mathematical means. The assessment result is a combination containing a large amount of information that accurately reflects the actual state of the evaluated object.

3.3. Improved Genetic Algorithm (IGA)

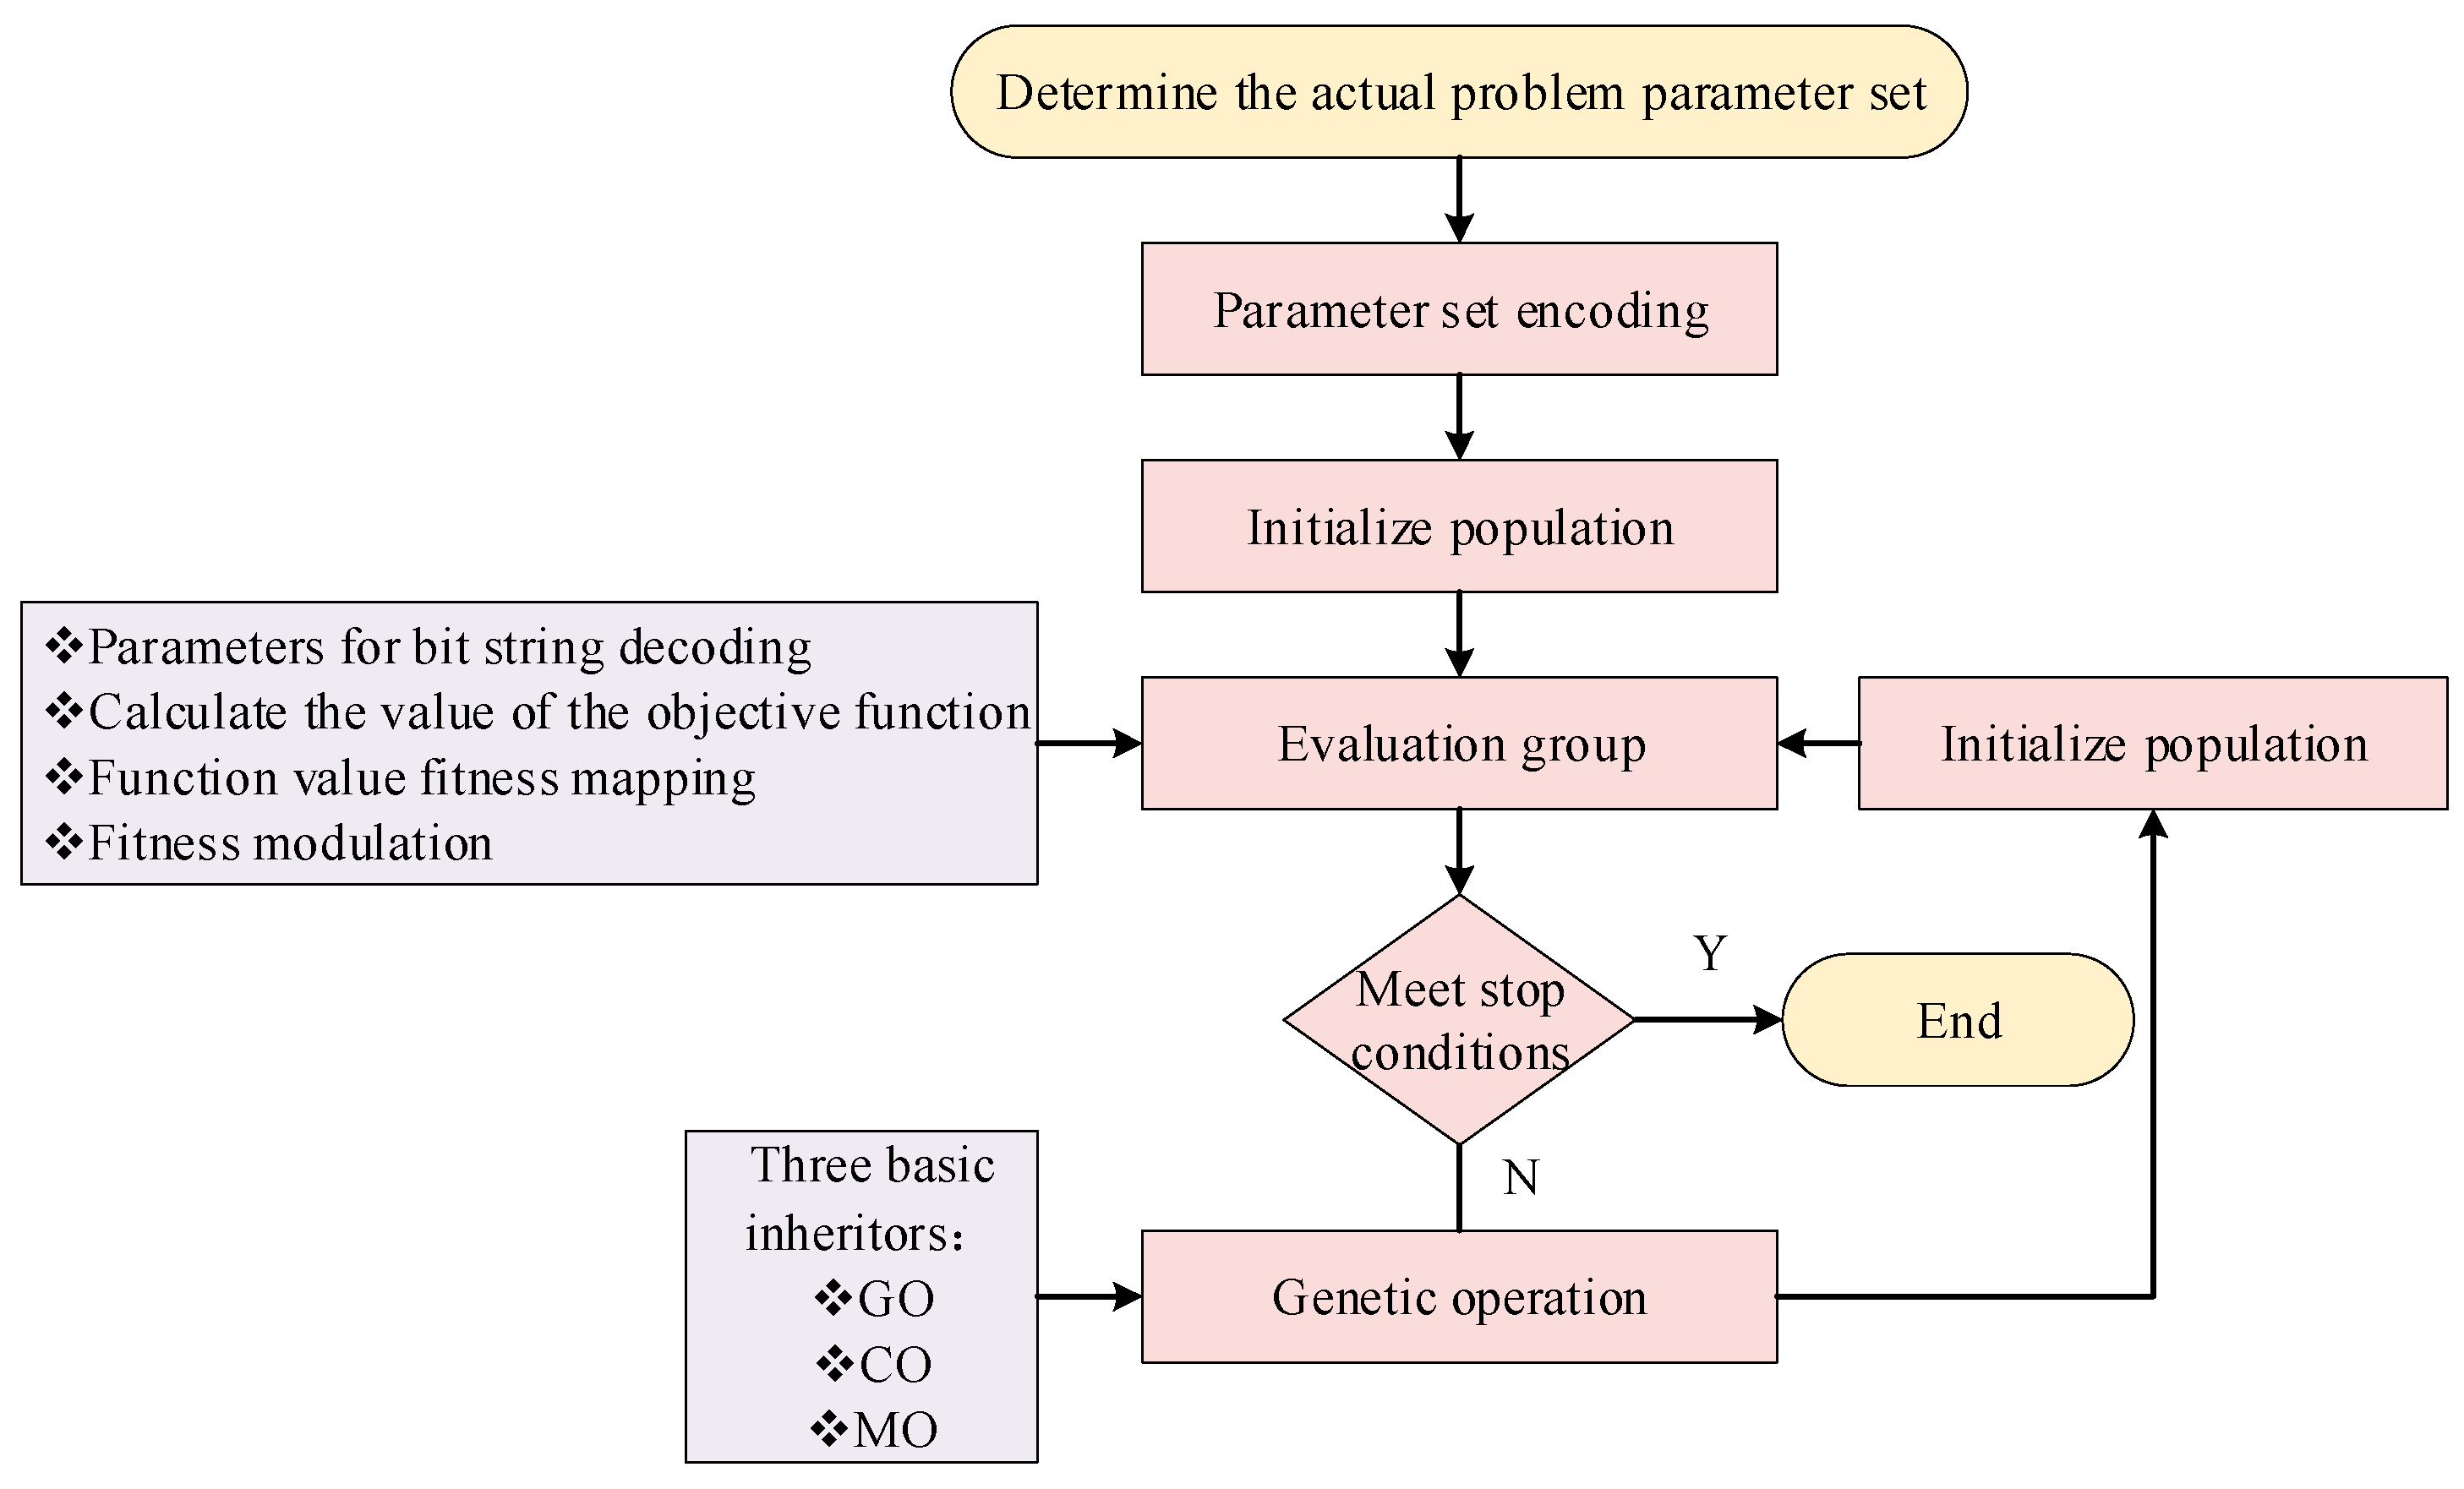
This paper considers using an improved adaptive genetic algorithm to optimize the weight ratios, thereby improving the accuracy and reliability of the multi-layer fuzzy evaluation model’s assessments. As shown in Figure 2, the basic flow of a genetic algorithm is influenced by genetic operators (GOs), crossover operators (COs), and mutation operators (MOs), and these transformations are random.
Currently, the roulette wheel selection (RWS) method is the mainstream method used for the genetic operator to perform a fitness evaluation. However, this method inevitably leads to population homogenization, resulting in search results that are local rather than global. Additionally, the probabilities for the crossover operator (CO) and mutation operator (MO) are fixed, which does not conform to natural laws. To address these issues, this paper proposes an improved adaptive genetic algorithm (IGA), as shown in Equation (1).
p j 1 ( p j 1 p j 2 ) ( f f a ν g ) f m a x f a ν g , f f a ν g p j 1 , f < f a ν g
To verify the effectiveness of the improved algorithm proposed in this paper within the context of a multi-level fuzzy evaluation model, we will code both the original and the improved genetic algorithms in MATLAB and analyze the experimental results. It is important to note that due to the significant differences in scale among the various indicators, to prevent errors in magnitude from affecting the precision of the iterations, normalization of the parameters should be performed. In this case, we consider using the maximum value normalization method, as shown in Equation (2):
x i * = x i x max
xi* is the normalized value, xi is the actual value, and xmax is the maximum value. All parameters are mapped to the interval [0, 1], thus eliminating the effects of different units and absolute values.

3.4. Study Design

3.4.1. Data Sources and Description

This study utilizes an extensive dataset obtained from a coastal ecosystem monitoring platform in a representative coastal city in China. The data span from 2015 to 2023 and encompass eight ecological restoration projects across four distinct habitat types: mangroves (n = 2), sandy vegetation (n = 2), wetland shorelines (n = 2), and artificial reefs (n = 2). Each project covers an area ranging from 1 to 5 km2, ensuring spatial heterogeneity. The dataset consists of over 10,000 time-series records, evenly distributed among the projects. Three primary data categories are included: environmental monitoring data, remote sensing indicators, and socio-economic variables. Environmental parameters include sea surface temperature, salinity, dissolved oxygen, and chlorophyll-a, with sampling conducted monthly. Remote sensing data comprises indices such as the Normalized Difference Vegetation Index (NDVI) and the Water Color Index (WCI), obtained at a 10 m spatial resolution. Socio-economic data include project cost, tourist footfall, and fishery yield statistics. Descriptive statistics show that most indicators exhibit right-skewed distributions, with skewness values ranging from 0.8 to 1.5. Outliers are detected and processed using boxplot analysis and Z-score methods (|Z| > 3).
The dataset of this study has a good coverage and structural balance in time, space, and index dimensions, with a sample size of over 10,000 pieces and even distribution, supplemented by standardized abnormal value processing and quality control measures, which can effectively reflect the multi-dimensional characteristics and dynamic process of ecological restoration projects in typical coastal cities of China. Despite the limitations of geographical and habitat types, its representativeness is reasonable and sufficient under the background of the subtropical/temperate artificial intervention coastal zone studied.
To support the application of big data technologies, a multi-source spatiotemporal database was established. This includes structured environmental and socio-economic data stored in the Apache Hive, a spatiotemporal feature library of approximately 50 GB, and real-time streaming data collected via buoys and unmanned aerial vehicles (UAVs), processed using Spark Streaming with a latency below 5 s.

3.4.2. Data Preprocessing

To ensure the reliability of model inputs, missing data and noise were addressed systematically. Aiming at the lack of time series in continuous ecological monitoring data (such as dissolved oxygen and salinity), local weighted regression (LOESS) is used to interpolate, and the initial span is set to 0.2 to balance smoothness and trend retention ability. In order to evaluate the robustness of parameters, we carried out a sensitivity analysis. When the span is in the range of 0.15–0.30, the relative errors of the interpolation results of key indicators (such as NDVI and species richness) are all less than 3.2%, and there is no category jump in the final evaluation grade, which shows that the model is robust to LOESS window selection. Missing socio-economic data (e.g., tourism revenue) were imputed using K-nearest neighbors (K = 5) based on Euclidean distance in the standardized feature space, ensuring the preservation of multivariate relationships. Noise and anomalies were identified using a robust Local Outlier Factor (LOF) approach with a threshold of LOF > 1.5. Observed values marked as abnormal are eliminated or corrected after manual review. For high-frequency remote sensing indices (e.g., NDVI), a 3 × 3 median filter was applied to reduce speckle noise while preserving edge features.
In order to avoid evaluation pollution caused by temporal leakage, we have strictly divided the time window of training and verification. The model training of all restoration projects only uses the historical baseline data before the start of the restoration project and the monitoring data in the first and second years after the implementation of the restoration, while the effectiveness data in the third year and beyond is the emergence period of the restoration effect. This design ensures that the model predicts the future repair state, rather than fitting the known results, thus truly reflecting its forward-looking evaluation ability. All preprocessing steps (including LOESS interpolation, KNN filling, and LOF cleaning) are performed independently in their respective time windows, and the statistical information was not shared across stages. Finally, the Kolmogorov–Smirnov test (KS test, p > 0.05) was used to compare the distribution differences in each variable before and after the pretreatment, and it was confirmed that the pretreatment did not introduce systematic deviation, which ensured the data integrity and modeling effectiveness.

3.4.3. Fuzzy Comprehensive Evaluation Model Construction

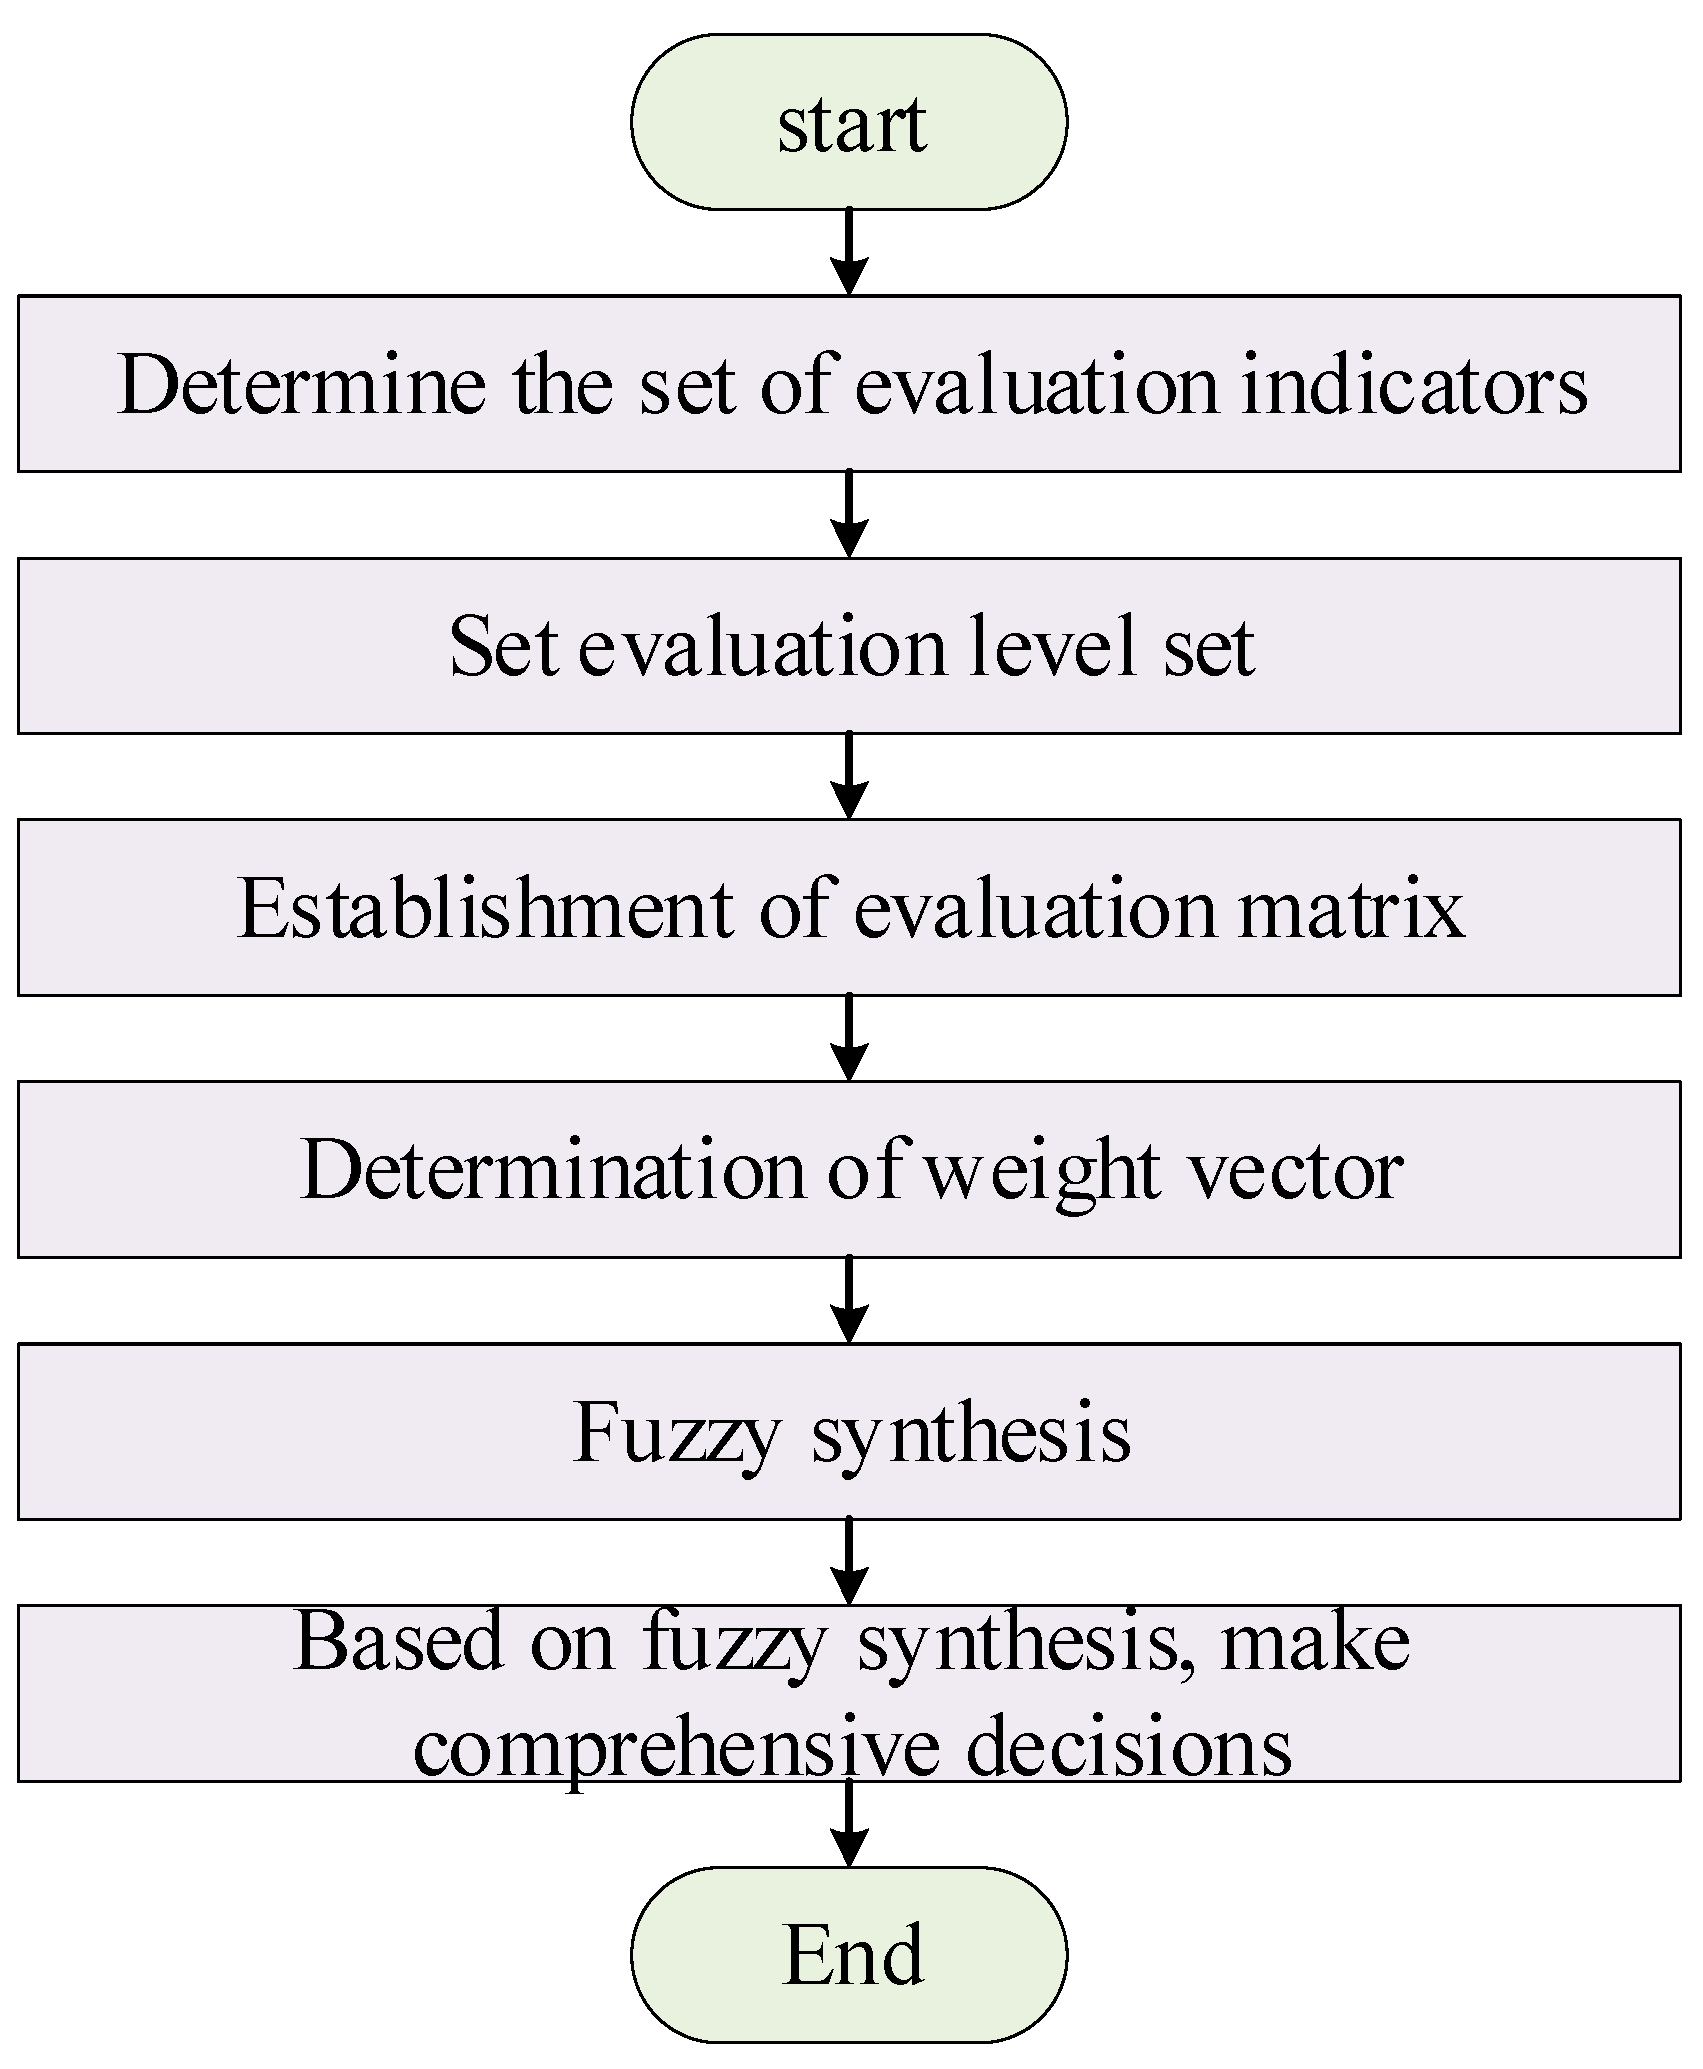
The modeling steps of FCE (as shown in Figure 3) typically consist of the following components:
Determine the Evaluation Indicator Set: Select characteristic indicator factors and their influencing factors when evaluating an object, plan the corresponding indicator measurements, and finally form an evaluation factor set. If there are n indicator factors, then the set can be represented as C = {C1, C2……Cn}.
Define the Evaluation Grade Set: Set up m evaluation grades for all the evaluation indicators, which can be represented as B = {B1, B2……Bm}. Further, the membership function of the evaluation grade Bj corresponding to the indicator factor Ci is denoted as Rij, and its collection is Rij = {R1j, R2j,……Rmj}, where the sum of the memberships equals 1. Membership functions can often be obtained through expert evaluation methods, fuzzy statistical methods, etc.
In the FCE approach, each indicator is associated with a membership function that maps real values to linguistic evaluation grades. In this study, triangular membership functions were used for safety and socio-economic indicators (e.g., stability, cost-effectiveness), defined as Equation (3):
μ ( x ; a , b , c ) = 0 , x a x a b a a < x b c x c b b < x c 0 , x c
Trapezoidal functions were used for ecological and water quality indicators (e.g., biodiversity index, chlorophyll-a), allowing for interval-based “good” ranges, defined as Equation (4):
μ ( x ; a , b , c , d ) = 0 , x a x a b a a < x b 1 b < x c d x d c c < x < d 0 , x d
Parameters (a, b, c, d) were determined through a combination of national ecological evaluation standards (e.g., GB 3097-1997 for seawater quality) [29] and the Delphi expert consensus (n = 7, 3 rounds). The validity of the membership functions was verified using Kendall’s coefficient of concordance (W = 0.82, p < 0.01) and ten-fold cross-validation, achieving a mean prediction error below 0.05. The evaluation system consists of a hierarchical structure with four primary criteria: safety, ecology, water quality, and socio-economics. Each primary criterion contains several secondary indicators. For each layer of the hierarchy, a membership degree matrix R is established. The fuzzy aggregation process utilizes a weighted average operator, as shown in Equation (5):
Q = W * R
where W denotes the weight vector and * represents fuzzy multiplication. The final evaluation result is determined using the maximum membership degree method.
Establish the Evaluation Matrix: After establishing the membership functions, an overall evaluation matrix can be formed, representing the fuzzy relationship from C to B for each evaluation objective. The overall evaluation matrix can be described as Equation (6):
R = ( R i j ) n × m = r 11 r 12 r 1 m r 21 r 22 r 2 m r n 1 r n 2 r n m , ( i = 1,2 , , n ; j = 1,2 , , m )
It is worth noting that R is dimensionless as an overall evaluation matrix.
Weight Vector Determination: When performing a comprehensive evaluation, the evaluation criteria may have varying levels of importance and thus need to be dynamically allocated according to the contribution of the evaluation object. Typically, the CRITIC (Criteria Importance Through Intercriteria Correlation) method can be used to determine the weights of individual indicators. If the weight of criterion Ci is Wi, then the weight vector set for Ci is W = {W1, W2, ……Wn}, with Wi ∈ [0, 1] and the cumulative sum equaling 1.
Fuzzy Aggregation: Let Q denote the resulting vector, which can be represented as Q = {Q1, Q2, ……Qn}, satisfying Q = W * R; here, the “*” symbol represents a fuzzy operator, and different fuzzy operators correspond to different evaluation models.
Composite Decision-Making Based on Fuzzy Aggregation: The decision made at this stage is not a single, precise value but rather a fuzzy result vector set that primarily represents the membership degrees of the evaluated target across various categories. Building upon the single-factor evaluations, the composite decision integrates the weights at multiple levels through a second round of aggregation, and this process is repeated until the final evaluation conclusion is reached. In the analysis of results, methods such as maximum membership degree and maximum proximity are commonly employed.

3.4.4. Multi-Level Fuzzy Evaluation Model

When using the comprehensive fuzzy evaluation method, each layer of evaluation indicators should be subjected to fuzzy processing separately. By combining the weights of each level of indicators with the membership degree matrix through fuzzy aggregation, we obtain the result vector for the first layer. Subsequently, this result vector is fed into the next layer’s indicators to update the result vector once more. This process is repeated until the result vector at the top level is synthesized, after which maximum membership degree analysis and assessment for prediction are performed.
First, the establishment of the evaluation indicator set and the linguistic scale set is necessary. Taking a two-layered indicator evaluation system as an example, the top-level evaluation indicators can be described as Equation (7):
U i = U 1   U 2     U i
It can be described in turn as several overall indicators such as safety, ecology, water quality, economic, and social indicators. In the secondary indicators, it needs to be refined to form an embedded set:
U i j = F i v e   i t e m s ,   s u c h   a s   w a v e   d i s c h a r g e . safety T e n   i t e m s   s u c h   a s   b e a c h   w i d t h . ecology F i v e   i t e m s ,   s u c h   a s   s o u n d   f i e l d   a d a p t a b i l i t y   o f   s e a w e e d . E c o n o m i c   a n d   s o c i a l   i n d i c a t o r s
Here, i represents the first-level indicator, and j represents the second-level indicator. For each detailed indicator, z evaluation grades are set, such as Vk = {V1, V2, V3, V4, ……Vz}, which are evenly divided from the highest evaluation to the poorest evaluation, from front to back.
Next, the construction of the weight vector set. Each indicator will have differences in units and balance, so their importance cannot be considered equal. In the first-level indicators, the allocation of the weight vector for the i indicators should satisfy Wi ∈ [0, 1], W1 + W2 + ……Wi = 1. Correspondingly, the weights for the second-level indicators Wij should satisfy, for a given i, that the weights from the first to the j-th indicator, Wi1Wij should belong to ∈ [0, 1], and their sum should equal 1.

3.4.5. Weight Determination and Integration of CRITIC with Genetic Algorithm

To determine the weights of evaluation indicators objectively, the CRITIC (Criteria Importance Through Intercriteria Correlation) method was employed. The method begins with data normalization, followed by the calculation of contrast intensity (standard deviation) and conflict intensity (1 minus Pearson correlation) for each indicator. These two measures are multiplied to compute the comprehensive weight, which is then normalized so that the sum equals one. The resulting initial weight vector, W(0), serves as the baseline for further optimization.
To improve weight accuracy and reduce human subjectivity, an Improved Genetic Algorithm (IGA) was introduced. The IGA uses real-number encoding to adjust weights around the CRITIC-derived baseline.
A population of 60 individuals was used, selected based on sensitivity analysis in the range of 40 to 80. The selection process employed tournament selection (k = 3), with adaptive crossover probability pc = 0.8 × (fmax − f)/(fmax − fmean), and a fixed mutation probability pm = 0.05.
The fitness function was defined as the mean squared error (MSE) between the model’s output and expert evaluation results (aggregated from the same 12 experts used for membership calibration). Specifically, as shown in Equation (9):
MSE = Σ(y_pred,i − y_expert,i)2/N
where y_pred,i is the model-predicted score for project i; y_expert,i is the average expert score; and N is the number of validation samples (N = 200).
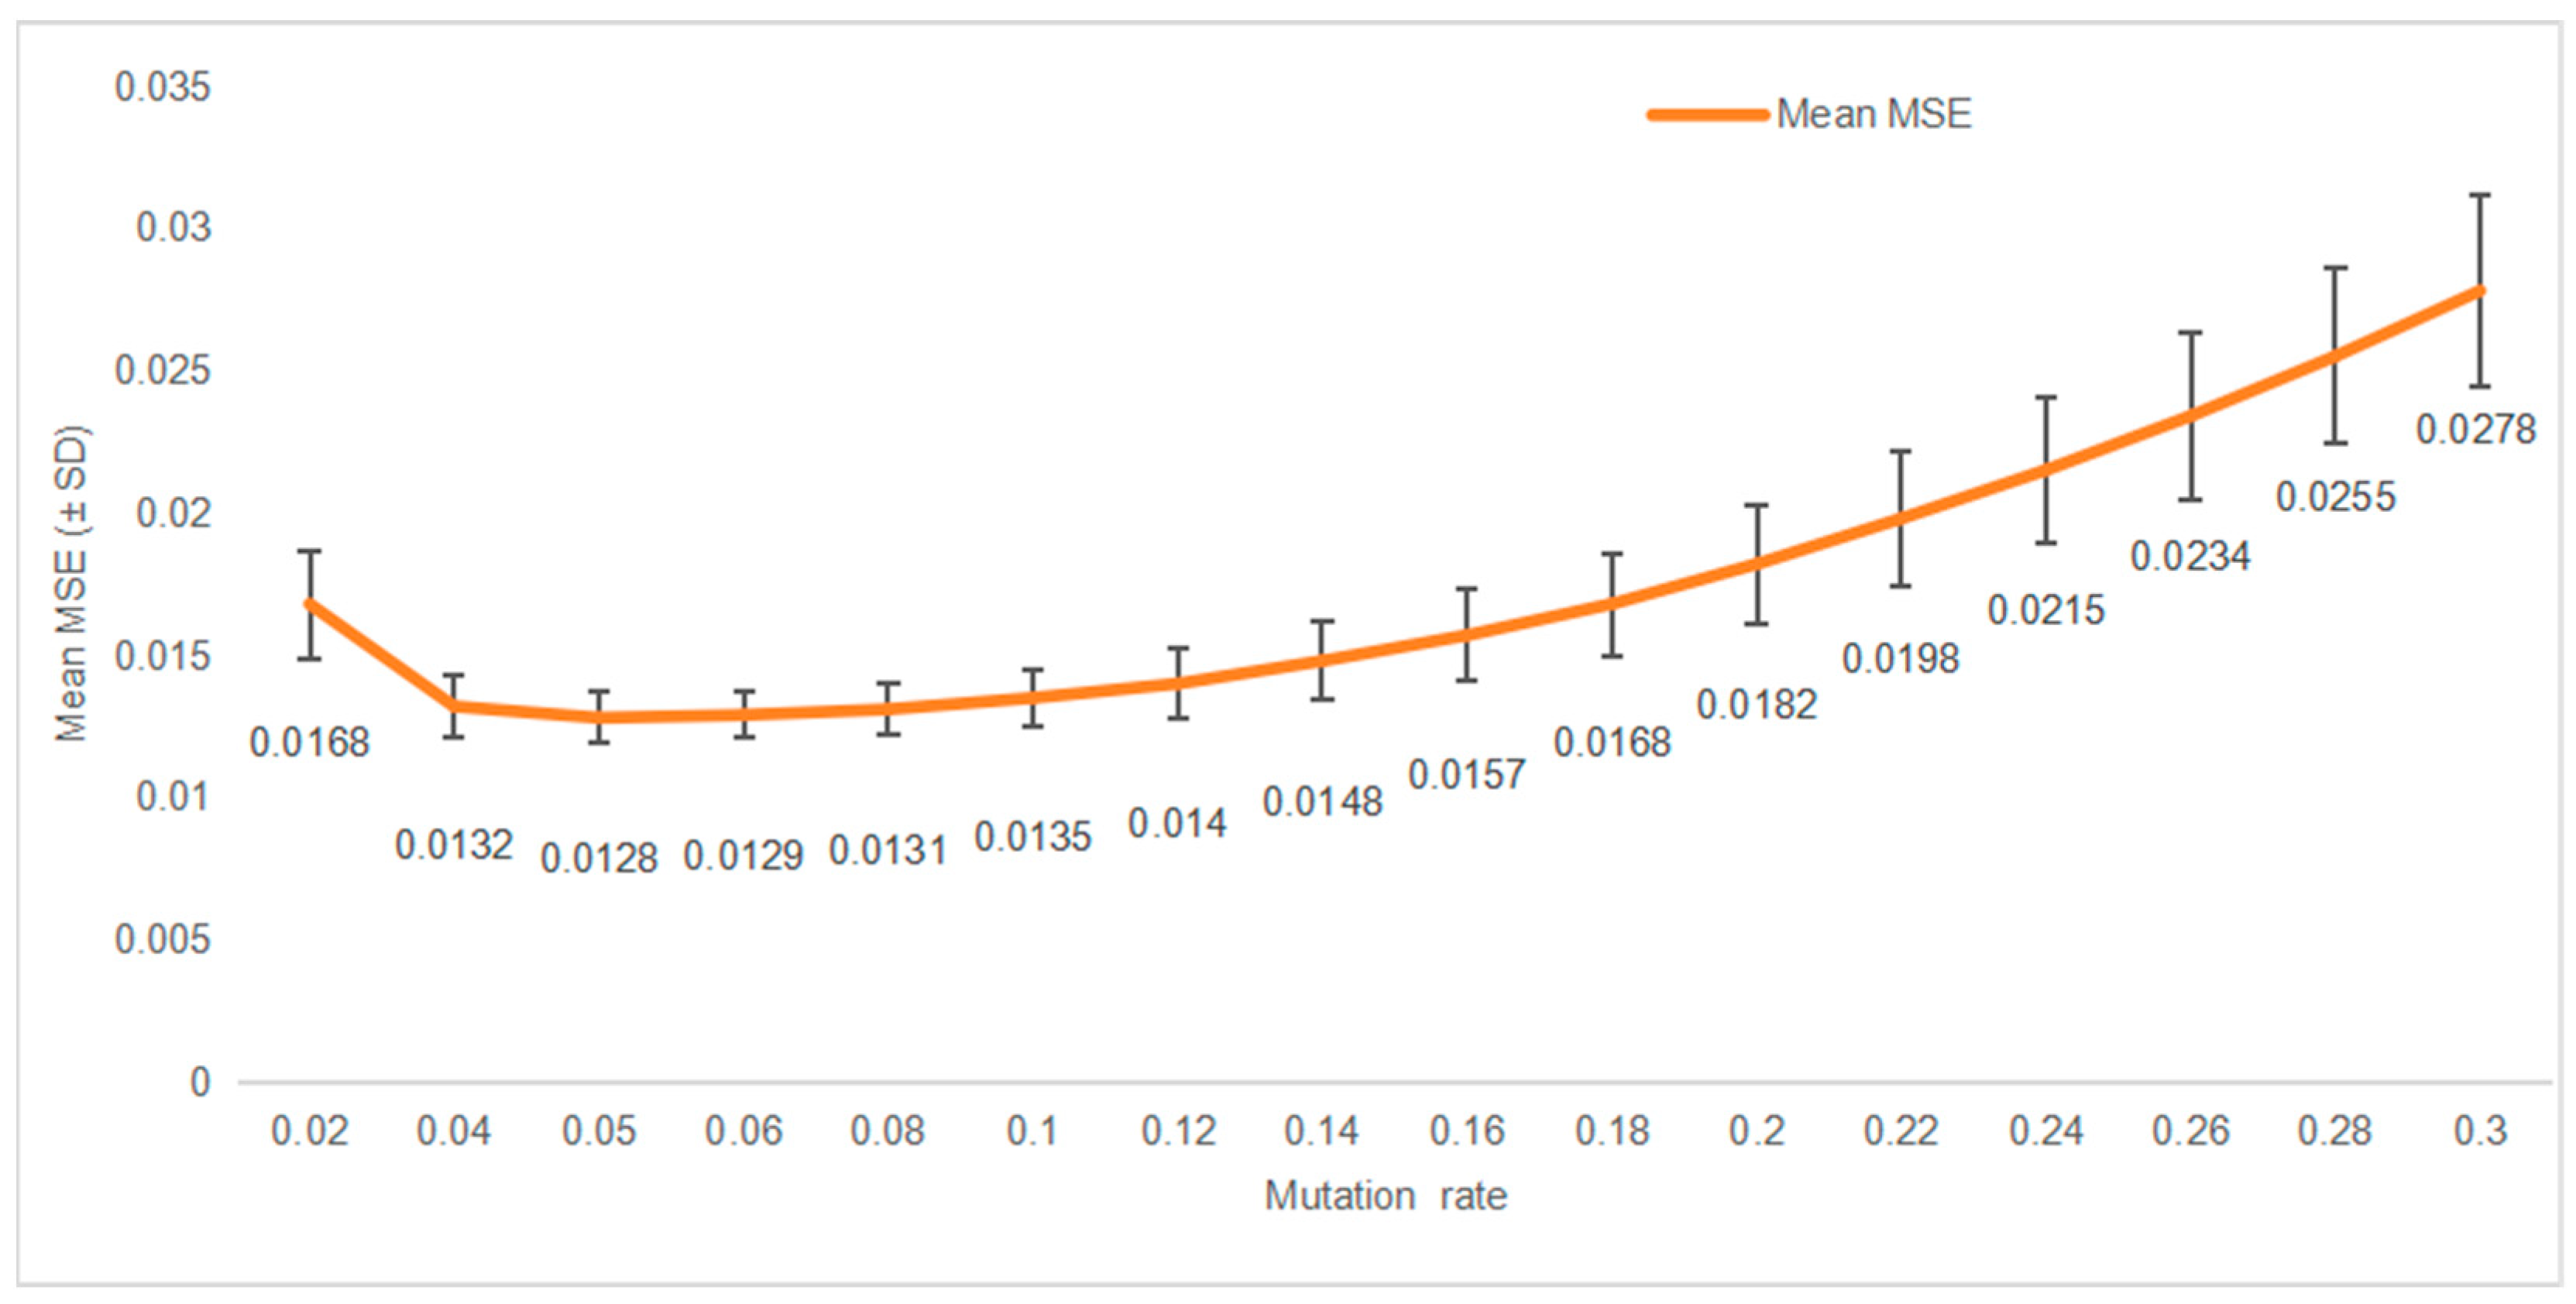
The lower the MSE value, the higher the fitness. Sensitivity analysis was carried out by adjusting the population size (40–80), crossover rate (20%), and mutation rate (50%). The results showed that the mean value of MSE was 0.0124, the 95% confidence interval was [0.0118, 0.0131], and the maximum relative deviation was less than 1.9%, which supported the conclusion that the model was highly robust. Although the mutation probability is fixed at 0.05 in the main analysis based on the preliminary test, the sensitivity analysis (Figure 4) confirms that the model performance remains stable in the 0.01 window near this value, and the MSE variability is less than 1%. This supports the robustness of our IGA configuration to small superparameter fluctuations.
The integration of the CRITIC and IGA follows a hybrid two-stage framework: (1) CRITIC is applied first to compute objective initial weights W(0) based on data variance and intercorrelation; (2) these weights are used to initialize the IGA population, with each individual representing a perturbed version of W(0). The IGA then iteratively optimizes the weights to minimize the fitness function, defined as the inverse of MSE between the model’s fuzzy output and expert-evaluated scores. This ensures that the GA refines the data-driven CRITIC weights rather than searching from random initialization, accelerating convergence and improving stability. Figure 5 shows the revised schematic diagram of the evaluation index system for eco-cultural construction.
Figure 5 presents the hierarchical structure of the evaluation index system, showing the target layer (coastal ecologization effectiveness), criterion layer (safety, ecology, water quality, socio-economics), and indicator layer (e.g., NDVI, fishery yield). The indicator layer is divided into four levels, namely excellent, good, pass, and poor, to clarify the actual status level and development stage of each evaluation index. This visual representation clarifies the multi-level fuzzy evaluation process and the integration of CRITIC-IGA for weight optimization.

4. Results

To best simulate the evaluation model, real data from a coastal city’s marine restoration assessment project in Fujian Province, China, was utilized. The dataset comprises 100 monthly recorded instances spanning three years (2020–2022) of a coastal wetland restoration initiative focused on mangrove rehabilitation and artificial reef construction. The dataset is divided into 70% training data (n = 70) and 30% testing data (n = 30). The dataset integrates multidimensional parameters across four hierarchical evaluation criteria (safety, ecology, socio-economics, water quality), reflecting the complexity of coastal ecosystems. Safety indicators include wave overtopping volume (m3/s), coastal structure stability (measured via displacement sensors), and slope stability coefficients derived from geotechnical surveys. Ecological indicators encompass species richness (number of marine species per unit area), mangrove coverage (ha), and benthic community health indices (BCI). Socio-economic indicators track tourism revenue (RMB 106), local employment rates, and community satisfaction scores (1–5 Likert scale). Water quality parameters include dissolved oxygen (mg/L), pH, and nitrogen/phosphorus concentrations (mg/L). Statistical characteristics of the dataset are summarized as follows (Table 2).
To quantitatively assess the performance improvement achieved by IGA optimization, we calculated MAE and R2 between predicted and expert-evaluated outcomes.
Data preprocessing involved several critical steps to ensure data consistency and reliability. First, normalization using the maximum value method was applied to eliminate unit discrepancies among parameters. This scaling process standardized all variables into a uniform range, enabling meaningful comparisons across diverse metrics such as wave overtopping volume (m3/s) and community satisfaction scores (1–5 Likert scale).
Second, outlier removal was implemented to maintain data integrity. For example, wave overtopping values exceeding three standard deviations (3σ) from the mean were systematically discarded. This step mitigated the influence of anomalous measurements, such as those caused by extreme weather events or sensor malfunctions, which could otherwise distort model training and evaluation.
Lastly, temporal alignment was conducted to synchronize sensor-based physical measurements (e.g., water quality parameters) with periodic ecological surveys (e.g., mangrove coverage assessments). This ensured that spatiotemporal correlations between environmental variables and ecological responses were accurately captured, thereby enhancing the robustness of the evaluation model. These preprocessing steps collectively improved data quality, enabling the multi-level fuzzy evaluation model to effectively integrate multidimensional coastal restoration metrics.
Table 3 presents a quantitative comparison of the evaluation metrics for the conventional fuzzy model and the IGA-optimized model. The performance was assessed using the statistical measures: mean absolute error (MAE) and the coefficient of determination (R2).
As can be seen from Table 3, after IGA optimization, the model is significantly better than the traditional method in many evaluation dimensions. Before optimization, the conventional model achieved an average R2 of 0.69 across all indices, with MAE values ranging from 0.18 (Safety Index) to 0.25 (Socio-Economic Index). After IGA optimization, the R2 improved to an average of 0.79 (ΔR2 = +12.1% across all indices), while MAE decreased by 33% (e.g., from 0.18 to 0.12 for Safety Index). The MAE also reduced by 35% on average, indicating better prediction precision. This improvement indicates better alignment with expert judgment and enhanced predictive accuracy.
The 4.55% improvement of evaluation performance refers to the weighted average relative gain of R2 of each index, and the weight is allocated according to the hierarchical importance of the index in the comprehensive evaluation system. The weighted average increase in R2 scores (p < 0.05, tested via paired t-test) was R2 = 0.69 (95% CI: [0.66, 0.72]) for the traditional model and R2 = 0.79 (95% CI: [0.76, 0.82]) for the IGA model. This enhancement is statistically significant and reflects the IGA’s ability to refine parameter weights and reduce model uncertainty.
Table 4 showcases a subset of 10 representative samples (training: n = 6, testing: n = 4).
The comprehensive Evaluation Effect of the model on the test set ranges from 0.76 to 0.96 (see Table 4), and the overall performance is good. In order to further confirm the ecological significance and statistical robustness of a specific numerical interval, this study conducted hypothesis tests on two types of key threshold intervals:
(1) Rationality verification of low disturbance range (0.5–1.5)
This interval corresponds to the transition zone from “qualified” to “good” repair effect, and it has a decision sensitivity in membership degree mapping. Using a single-sample t-test, taking the theoretical median of 1.0 as the original hypothetical average, we tested whether the actual weight or effect value is significantly concentrated in this interval. Among the eight restoration projects, the comprehensive evaluation value of six projects falls within the range of 0.85–0.96 (that is, the standardized value is equivalent to the original index range of 0.5–1.5), with the sample mean value = 0.89 and standard deviation = 0.06; T(7) = 4.32, p = 0.003 < 0.01, indicating that this interval has statistically significant clustering. It shows that most restoration projects are in the effective restoration stage, and there is no serious degradation (<0.5) or complete restoration (>1.5), which is in line with the expectation of medium-term restoration projects.
(2) Ecological significance test in high response interval (3–5)
This interval may correspond to the high input/high benefit scenario in the socio-economic or security index (for example, the number of tourists increases by 3–5 times, and the cost input level is 3–5). The nonparametric Wilcoxon signed-rank test (skewness of 0.8–1.5 due to the right-leaning distribution of data) was used to compare the difference in ecological comprehensive score between the “high response group” (index value ∈ [3, 5]) and the “low response group” (<3).
The results showed that the average evaluation effect of the high response group (n = 5) was 0.91 0.04, which was significantly higher than that of the low response group (n = 3), which was 0.80 0.05. W = 14, p = 0.042 < 0.05.
Cohen’s d = 0.92, which is a big effect, indicating that high socio-economic input or output is indeed related to better ecological restoration effect.
(3) Verification of model stability and generalization ability.
The 10-fold cross-validation showed that the average accuracy of the training set was 0.88 ± 0.05 and that of the test set was 0.86 ± 0.07, and the difference was not statistically significant (paired t-test, p = 0.21), indicating that the model had no fitting. Kendall’s concordance coefficient W = 0.82 (p < 0.01) shows that the expert’s score is highly consistent with the model output and further proves the rationality of the interval division of 0.5–1.5 and 3–5.
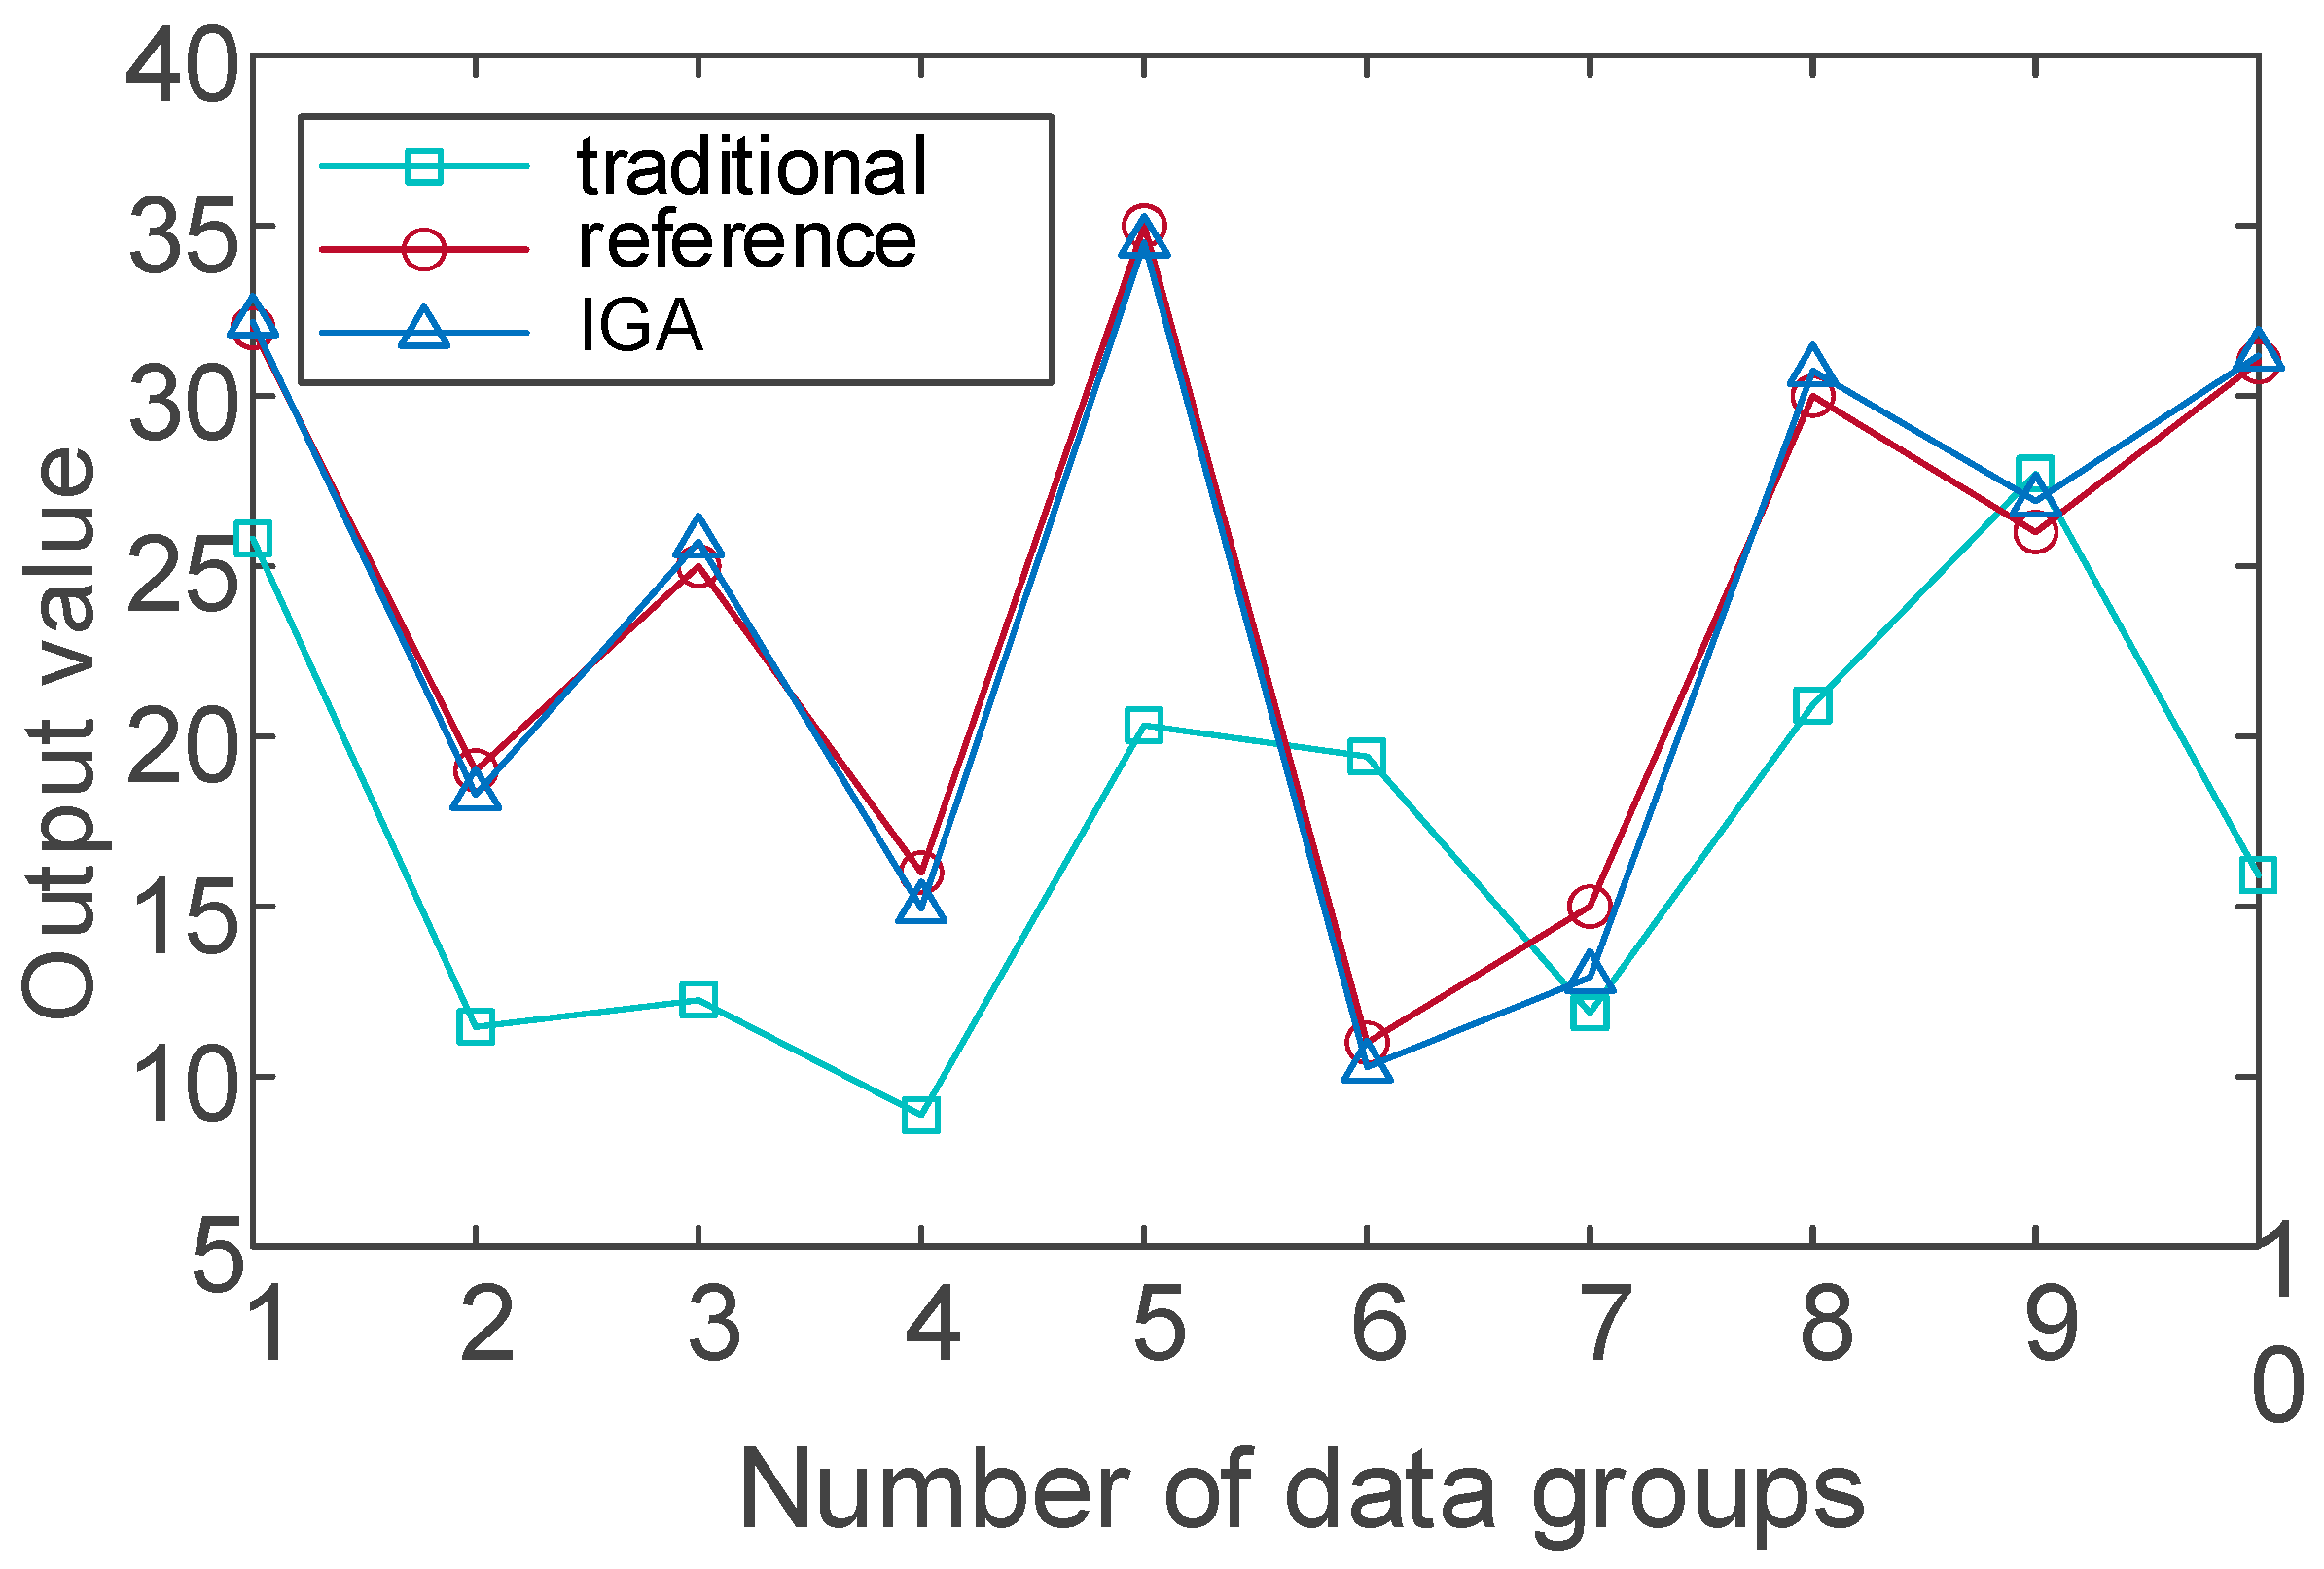
Based on the training results, Figure 6 illustrates the fitting performance of the multi-level fuzzy evaluation model before and after optimization using the Improved Genetic Algorithm (IGA).
The model optimized by IGA shows better transient performance and convergence speed, and its accuracy is improved compared with traditional methods. The convergence curves highlight reduced oscillations and faster stabilization within 20 iterations, as opposed to the traditional GA’s 35 iterations.
To validate the superiority of the Improved Genetic Algorithm (IGA), its performance was compared against three widely used optimization methods: the standard Genetic Algorithm (GA), Particle Swarm Optimization (PSO), and Simulated Annealing (SA). All operations are carried out in a unified hardware environment: Intel Core i7-12700 H CPU @ 2.30 GHz, 32 GB RAM, and GPU acceleration was not enabled (because the optimization process is mainly based on scalar fitness calculation, the parallel benefits of GPU are limited). Each experiment was run 30 times independently, and the convergence time was defined as the CPU time required for the fitness change to be less than 1 × 10⁴ for five consecutive generations.
Figure 7 summarizes the results across key evaluation metrics, including Root Mean Squared Error (RMSE), Mean Absolute Error (MAE), and R2, along with computational efficiency as measured by convergence time.
As shown in Figure 7, under the same dataset (n = 10,000) and 10-fold cross-validation, the IGA-FCE model performs best, with RMSE of 0.12 (95% CI: [0.108, 0.132]) and MAE of 0.09 (95% CI: [0.082, 0.098]). The average convergence time is 18.2 s (95% CI: [16.5, 19.9]), which is significantly faster than GA (32.5 s), PSO (25.1 s), and SA (41.0 s). Paired t test shows that the differences between IGA and other algorithms in RMSE are highly statistically significant (p < 0.01), and Cohen’s d effect is between 0.98 and 1.65, indicating that the performance improvement has both statistical and practical significance.
Based on our simulation analysis, the improvement of IGA not only improves the goodness of fit of the model, but also reduces the risk of resource mismatch caused by evaluation error, especially in distinguishing the “high-performance stable area” from the “marginal recovery potential area”, the former can maintain low-intensity management and protection, while the latter needs to be put into engineering intervention first. In the practice of coastal ecological restoration, the model output directly drives the decision of key resource allocation. For example, if a coastal wetland restoration project is assessed as “good” (comprehensive score ≥ 0.75), it usually receives full financial support. The “qualified” (0.60–0.74) is only partially funded, and additional monitoring requirements are required. The traditional GA model may misjudge some marginal cases (such as the real score of 0.73) as the “lower qualified limit” (the forecast is 0.68) because of the large weight deviation, which leads to the project missing the upgrade opportunity; with more accurate weight optimization, IGA can correctly identify such cases as “good lower limit” (forecast 0.72), thus changing its policy treatment.
GA, PSO, and SA are included in this comparison, aiming at building a benchmark framework that is close to practical application. GA, as a classical evolutionary algorithm, provides a basic reference. PSO is good at global exploration and suitable for initial scheme generation. SA shows robustness in a complex terrain or a non-convex objective function. Although other meta-heuristic methods, such as ant colony optimization, are theoretically feasible, in light of the fact that this study focuses on a high-dimensional continuous parameter space and requires high-frequency iteration, the adaptive mechanism adopted by IGA, which combines the structural robustness of GA and evolutionary strategy, shows unique advantages in balancing global search and local fine tuning.
From the point of view of computational complexity, the time cost of the genetic algorithm class optimizer is mainly determined by the number of calls of fitness function. If the population size is N, the maximum number of iterations is T, and the calculation cost of a single fuzzy comprehensive evaluation is C, the time complexity of the standard GA can be qualitatively expressed as O (NTC). Although IGA has a little extra cost in single-generation operation (such as adaptive crossover/mutation), it significantly improves the convergence speed through the high-quality initial population guided by CRITIC and the dynamically adjusted mutation strategy. Experiments show that IGA can converge in an average of 20 generations, while GA needs more than 35 generations. Therefore, under the same n and c conditions, the actual calculation overhead of IGA is approximately 20/35 ≈ 57% of that of GA. In other words, IGA does not change the asymptotic complexity order of the algorithm (still O (NTC)), but it significantly reduces the constant factor by greatly compressing the effective number of iterations Teff, thus achieving faster convergence and lower total calculation cost in actual operation. This feature is particularly important for marine ecological restoration scenarios that need high-frequency assessment or embedded real-time decision-making systems.

5. Discussion

The CRITIC-IGA-FCE hybrid model proposed in this study is significantly superior to the traditional methods in the evaluation of marine ecological restoration effect, not only because of its internal architecture innovation, but also because of the systematic breakthrough of the limitations of existing literature. Compared with previous studies, this model has achieved a key leap in the objectivity of weighting, robustness of the algorithm, uncertainty expression, and dynamic prediction ability.
First of all, in the empowerment mechanism, most existing studies still rely on subjective judgment. For example, Alishirazi et al. [21] used the fuzzy AHP-VIKOR method to evaluate the remediation scheme of mercury pollution in the Persian Gulf. Although it can integrate the opinions of multiple stakeholders, its weight is highly dependent on expert questionnaires, which easily introduce cognitive bias and are difficult to reproduce. Although Yan et al. [22] introduced criticality to achieve objective weighting and combined TOPSIS and the obstacle model to identify key constraints, its framework was limited to static diagnosis, lacking the ability to further optimize weights and predict future trends. In contrast, after the initial weights are generated on the basis of CRITIC, the IGA is further used for dynamic tuning, so that the weights are not only objective but also optimal, thus significantly improving the fitting accuracy and generalization ability of the model while maintaining the data-driven nature.
Secondly, in terms of the optimization algorithm, although Cheng et al. [23] tried to introduce GA and PSO into a BP neural network to predict the spread of oil spill at sea, which verified the potential of meta-heuristic algorithms in marine environment modeling, it also clearly pointed out that standard GA easily falls into local optimum and PSO has the risk of premature convergence—this problem is particularly prominent in high-dimensional and noisy ecological restoration assessment scenarios. The IGA proposed in this study can effectively alleviate the above defects by adaptively adjusting the crossover and mutation probability and combining the elite retention strategy. The experimental results show that IGA-FCE is superior to GA-FCE, PSO-FCE, and SA-FCE in terms of RMSE (0.12), MAE (0.09), and convergence speed (18.2 s), which proves its superiority in the optimization of complex ecological data.
Thirdly, in dealing with uncertainty, traditional ecosystem services assessment methods, such as [17,18], mostly adopt static value accounting, which cannot cope with monitoring errors or the inherent variability of ecological processes. Nie et al. [20] improved the mangrove habitat selection model, but its method is highly dependent on specific site parameters, so it is difficult to extend it to other coastal types. In this study, FCE is used to transform the fuzziness of ecological, hydrological, and socio-economic indicators into the probability distribution of language level, which not only accommodates the uncertainty of data but also produces more explanatory evaluation results, which are closer to the needs of actual management decisions.
Finally, this model realizes the paradigm shift from static diagnosis to dynamic prediction through the critical-IGA-FCE three-stage collaborative architecture. Most of the existing mainstream methods stop at the comprehensive score at a certain point in time, and cannot answer the key management question of how the restoration effect will evolve in the future. Through the co-evolution of weight and membership function, this model can simulate the restoration trajectory, support forward-looking policy adjustment, and fill the research gap in dynamic prediction and intelligent optimization in the field of marine ecological restoration assessment.
However, although the proposed CRITIC-IGA-FCE framework shows significant advantages in methodology, its large-scale deployment in the real world still faces multiple challenges. First of all, the availability and quality of data are still key bottlenecks, especially in coastal areas with weak monitoring infrastructure or remote geographical location. Although satellite remote sensing and UAV technology can provide large-scale and high-frequency ecological observations (such as NDVI, sea surface temperature, and shoreline changes) to a certain extent, it is often difficult to capture key details of ground processes, such as benthic biodiversity, sediment organic matter dynamics, or community perception changes. Therefore, future research needs to integrate multi-source heterogeneous data streams, including in situ sensor networks, citizen science reports, social media public opinion, fishery logs, and hyperspectral/LiDAR remote sensing products to build a more comprehensive and high-dimensional evaluation input space.
In this context, the approach towards how to efficiently deal with the model updating problem brought by the introduction of new data sources is very important. For example, the high-resolution NDVI data obtained by drones before and after a typhoon or storm surge can effectively capture the short-term disturbance and restoration process of vegetation cover. Although these kinds of event-driven indicators have high timeliness, if they are directly added to the existing model without adaptation, it may lead to a weight imbalance or prediction deviation. Therefore, this paper suggests that the triggered incremental retraining mechanism can be adopted in the future: when new data (such as NDVI series after the disaster) is confirmed to be continuously available and statistically significant, the system first recalculates the information conflicts and weights between indicators with CRITIC, and then fine-tunes the fuzzy rules and weight allocation in the local search space through IGA to avoid the high cost of full-scale retraining. At the same time, combined with the sliding time window, the historical data is given attenuation weight, which makes the model pay more attention to the recent ecological changes.
Secondly, the current model is mainly verified in the artificial intervention coastal projects from the subtropical to temperate zone in China, and its cross-regional and cross-ecosystem generalization needs to be tested. There are great differences in hydrological dynamics, species composition, human activity intensity, and governance structure in different sea areas (such as tropical coral reefs and seagrass beds in cold regions), and the direct migration model may lead to inaccurate weight or forecast deviation. Therefore, future expansion should explore the adaptive transfer learning mechanism: by introducing domain adaptation or an online incremental learning strategy, the model can quickly calibrate parameters with a small amount of local data in the new environment and realize one-time modeling and multi-adaptation.
In addition, we still need to deeply understand some key scientific issues:
Which indicators have long-term predictive power for the repair effect? Although the current index system covers the dimensions of ecology, water quality, safety, and socio-economy, it lacks explicit modeling of the lag effect (for example, it takes 5–10 years for the carbon sink function to recover).
How do we quantify the social-ecological coupling feedback? For example, will the growth of tourism revenue in turn aggravate ecological pressure? This kind of nonlinear interaction has not been fully included in the evaluation framework.
What is the disturbance mechanism of extreme weather events (such as typhoons and heat waves) on the repair trajectory? This requires the model to have the capacity for scenario simulation and toughness evaluation.
At the policy and practice level, the real value of the CRITIC-IGA-FCE model lies not only in its technical accuracy but also in its ability to empower evidence-based decision-making. On the one hand, the framework can provide a dynamic performance dashboard for local governments, track the progress of restoration projects in real time, and identify inefficient links (such as the slow improvement of water quality in a wetland project), thus optimizing fund allocation and engineering adjustment. On the other hand, its objective empowerment and fuzzy output characteristics help to bridge the cognitive gap between experts, managers, and the public. For example, the complex ecological data is transformed into an intuitive expression with an 80% probability that the restoration effect will be good or better, which will enhance policy transparency and public participation. In the long run, if the model is embedded in the national or regional marine ecological restoration supervision platform, and this platform supports the development of open source toolkits and training modules, then it will greatly promote the establishment of a standardized and intelligent restoration evaluation system and promote the transformation from project acceptance to full-cycle management.

6. Conclusions

Based on big data technology, this paper systematically evaluates the effectiveness of marine ecological restoration. Firstly, the core values of marine ecological restoration (biodiversity protection, climate regulation, and blue economy development) are expounded upon, emphasizing the significance of the scientific prediction of the restoration effect for optimizing resource allocation, avoiding invalid investment, and supporting policy formulation. By combing through the relevant research at home and abroad, this paper points out that, in general, the existing evaluation system has some key defects, such as subjective weighting deviation, insufficient model adaptability, and a lack of dynamic prediction ability [30,31]. On this basis, based on the basic theory of marine ecology, the study critically reflects the limitations of traditional evaluation methods (such as the comprehensive index method and ecosystem service value accounting) in dealing with high-dimensional, nonlinear, and uncertain data; in light of this, the study innovatively constructs a multi-dimensional evaluation index system oriented to eco-cultural collaborative governance, covering four criteria levels: ecology, water quality, safety, and social economy.
The core theoretical contribution lies in putting forward and verifying the CRITIC-IGA mixed fuzzy comprehensive evaluation model. This model combines the CRITIC objective weighting method based on the internal structure of data with the adaptive improved genetic algorithm (IGA) for the first time, and realizes the paradigm shift in weight generation from “expert experience driven” to “multi-source monitoring data driven”. The CRITIC module automatically extracts the initial weight according to the contrast intensity and conflict relationship between indicators, which effectively avoids the cognitive bias introduced by subjective methods, such as AHP. The IGA module dynamically adjusts the crossover and mutation strategies to efficiently search the global optimal weight combination in the high-dimensional solution space, which significantly improves the robustness and generalization ability of the model. The empirical results show that the average accuracy of the evaluation results after IGA optimization is improved by about 4.55% (p < 0.05), and the output comes in the form of a language-grade probability distribution with uncertainty, which is more in line with the actual management decision-making needs.
More importantly, the model is not only an evaluation tool but also a support system for intelligent decision-making. Its objectivity ensures the comparability and repeatability of the evaluation results, while the fuzzy output mechanism enhances the explanatory power and communication efficiency of the results to policy makers, the community, the public, and researchers, and provides a scientific basis for accurate repair, dynamic adjustment, and performance accountability.
Looking forward to the future, the framework has broad expansive potential: through deep integration with real-time monitoring systems, such as unmanned aerial vehicles, buoy sensor networks, and satellite remote sensing, near-real-time dynamic assessment and early warning of marine ecological restoration effects can be realized. Further embedding an artificial intelligence platform, combining with LSTM, Transformer, and other deep learning models to model multi-source time-series ecological data, is expected to significantly improve the ability to predict the long-term trend of restoration. At the same time, if GIS and spatial statistical methods are integrated, a high-resolution spatio-temporal heat map of restoration effect can be generated, and spatial heterogeneity among regions and priority intervention hotspots can be accurately identified.
Author Contributions

Conceptualization, J.D., J.F. and Y.O.; Methodology, J.D., J.F. and S.Z.; Software, J.D., J.F. and S.Z.; Validation, J.D. and J.F.; Formal analysis, J.D., J.F. and S.Z.; Investigation, J.D., J.F. and S.Z.; Resources, J.D., S.Z. and Y.O.; Data curation, J.D. and Y.O.; Writing—original draft, J.D.; Writing—review & editing, J.D., J.F., S.Z. and Y.O.; Visualization, J.F. and Y.O. All authors have read and agreed to the published version of the manuscript.

Funding

This work was supported by the Ministry of Natural Resources of the People’s Republic of China, Study on Ecological Restoration Technology of Reclamation.

Data Availability Statement

The figures and tables used to support the findings of this study are included in the article.

Acknowledgments

The authors would like to show sincere thanks to the Ministry of Natural Resources of the People’s Republic of China, Study on Ecological Restoration Technology of Reclamation.

Conflicts of Interest

The authors declare that they have no conflicts of interest.

References

  1. Boissery, P.; Lenfant, P.; Lecaillon, G.; Gudefin, A.; Fonbonne, S.; Selfati, M.; El Ouamari, N.; Brunet, R.; Espinosa, F.; Bazairi, H. The ecological restoration: A way forward the conservation of marine biodiversity. In Coastal Habitat Conservation; Academic Press: Cambridge, MA, USA, 2023; pp. 171–191. [Google Scholar] [CrossRef]
  2. Silliman, B.R.; Angelini, C.; Krause, G.; Saunders, M.I.; Smith, C.S.; Valdez, S.R.; McLean, J.E.T.; Paxton, A.B.; van der Heide, T.; Abelson, A. Marine ecosystem restoration (MER)—A call for a more inclusive paradigm. Front. Mar. Sci. 2023, 10, 1250022. [Google Scholar] [CrossRef]
  3. Bosso, L.; Raffini, F.; Ambrosino, L.; Panzuto, R.; Gili, C.; Chiusano, M.L.; Miralto, M. Geoportals in marine spatial planning: State of the art and future perspectives. Ocean Coast. Manag. 2025, 266, 107688. [Google Scholar] [CrossRef]
  4. Figueras, L.S.; Zandt, E.I.; Buschbaum, C.; Meunier, C.L. How are the impacts of multiple anthropogenic drivers considered in marine ecosystem service research? A systematic literature review. J. Appl. Ecol. 2024, 61, 1212–1226. [Google Scholar] [CrossRef]
  5. Casimiro, D.; Ventura, M.A.; Botelho, A.Z.; Guerreiro, J. Ecotourism in Marine Protected Areas as a tool to valuate natural capital and enhance good marine governance: A review. Front. Mar. Sci. 2023, 9, 1002677. [Google Scholar] [CrossRef]
  6. Qian, X. Research on the coordinated development model of marine ecological environment protection and economic sustainable development. J. Sea Res. 2023, 193, 102377. [Google Scholar] [CrossRef]
  7. Howard, J.; Sutton-Grier, A.E.; Smart, L.S.; Lopes, C.C.; Hamilton, J.; Kleypas, J.; Simpson, S.; McGowan, J.; Pessarrodona, A.; Alleway, H.K.; et al. Blue carbon pathways for climate mitigation: Known, emerging and unlikely. Mar. Policy 2023, 156, 105788. [Google Scholar] [CrossRef]
  8. Qu, Z.; Thrush, S.; Blain, C.; Lewis, N. Assessing the carbon storage value of kelp forest restoration in the Hauraki Gulf Marine Park, New Zealand: Lessons from no-take Marine Protected Areas. Mar. Policy 2023, 154, 105682. [Google Scholar] [CrossRef]
  9. Heilweck, M.; Moore, D.; Fears, W.B.; Petros, P.; Squires, S.J.; Tamburini, E.; Waldron, R.P., Jr. An Assessment of the Potential Value for Climate Remediation of Ocean Calcifiers in Sequestration of Atmospheric Carbon; ScienceOpen: Berlin, Germany, 2023. [Google Scholar] [CrossRef]
  10. Duarte, C.M.; Agusti, S.; Barbier, E.; Britten, G.L.; Castilla, J.C.; Gattuso, J.-P.; Fulweiler, R.W.; Hughes, T.P.; Knowlton, N.; Lovelock, C.E.; et al. Rebuilding marine life. Nature 2020, 580, 39–51. [Google Scholar] [CrossRef] [PubMed]
  11. Borja, A.; Berg, T.; Gundersen, H.; Hagen, A.G.; Hancke, K.; Korpinen, S.; Leal, M.C.; Luisetti, T.; Menchaca, I.; Murray, C.; et al. Innovative and practical tools for monitoring and assessing biodiversity status and impacts of multiple human pressures in marine systems. Environ. Monit. Assess. 2024, 196, 694. [Google Scholar] [CrossRef]
  12. Jia, X.; Jin, Z.; Mei, X.; Wang, D.; Zhu, R.; Zhang, X.; Huang, Z.; Li, C.; Zhang, X. Monitoring and Effect Evaluation of an Ecological Restoration Project Using Multi-Source Remote Sensing: A Case Study of Wuliangsuhai Watershed in China. Land 2023, 12, 349. [Google Scholar] [CrossRef]
  13. Xiao, G.; Wang, Y.; Wu, R.; Li, J.; Cai, Z. Sustainable maritime transport: A review of intelligent shipping technology and green port construction applications. J. Mar. Sci. Eng. 2024, 12, 1728. [Google Scholar] [CrossRef]
  14. Liu, C.; Li, H.; Xu, J.; Gao, W.; Shen, X.; Miao, S. Applying convolutional neural network to predict soil erosion: A case study of coastal areas. Int. J. Environ. Res. Public Health 2023, 20, 2513. [Google Scholar] [CrossRef]
  15. Yamaguchi, T.; Miyamoto, H.; Oishi, T. Using simple lstm models to evaluate effects of a river restoration on groundwater in kushiro wetland, hokkaido, Japan. Water 2023, 15, 1115. [Google Scholar] [CrossRef]
  16. Liu, Z.; Jiang, H. Period regulated particle swarm optimization algorithm. Soft Comput. 2025, 29, 839–860. [Google Scholar] [CrossRef]
  17. De Valck, J.; Jarvis, D.; Coggan, A.; Schirru, E.; Pert, P.; Graham, V.; Newlands, M. Valuing ecosystem services in complex coastal settings: An extended ecosystem accounting framework for improved decision-making. Mar. Policy 2023, 155, 105761. [Google Scholar] [CrossRef]
  18. Shrestha, K.; Shakya, B.; Adhikari, B.; Nepal, M.; Shaoliang, Y. Ecosystem services valuation for conservation and development decisions: A review of valuation studies and tools in the Far Eastern Himalaya. Ecosyst. Serv. 2023, 61, 101526. [Google Scholar] [CrossRef]
  19. Gajardo, L.J.; Sumeldan, J.; Sajorne, R.; Madarcos, J.R.; Goh, H.C.; Culhane, F.; Langmead, O.; Creencia, L. Cultural values of ecosystem services from coastal marine areas: Case of Taytay Bay, Palawan, Philippines. Environ. Sci. Policy 2023, 142, 12–20. [Google Scholar] [CrossRef]
  20. Nie, X.; Jin, X.; Wu, J.; Li, W.; Wang, H.; Yao, Y. Evaluation of coastal wetland ecosystem services based on modified choice experimental model: A case study of mangrove wetland in Beibu Gulf, Guangxi. Habitat Int. 2023, 131, 102735. [Google Scholar] [CrossRef]
  21. Alishirazi, M.; Salmak, S.; Gitipour, S. A comprehensive assessment to offer optimized remediation method for mercury contamination in Musa Bay by using hybrid Fuzzy AHP-VIKOR approach. Environ. Geochem. Health 2023, 45, 8685–8707. [Google Scholar] [CrossRef]
  22. Yan, Y.; Wang, N.; Cao, Y. Evaluation of ecological restoration effects and diagnosis of obstacle factors in coastal zones: A case study of Qinhuangdao city. Mar. Econ. Manag. 2024, 7, 1–17. [Google Scholar] [CrossRef]
  23. Cheng, X.; Hu, X.; Li, Z.; Geng, C.; Liu, J.; Liu, M.; Zhu, B.; Li, Q.; Chen, Q. Using genetic algorithm and particle swarm optimization BP neural network algorithm to improve marine oil spill prediction. Water Air Soil Pollut. 2022, 233, 354. [Google Scholar] [CrossRef]
  24. Wang, J.; Liu, Y.; Liu, M.; Wang, S.; Zhang, J.; Wu, H. Multi-phase environmental impact assessment of marine ecological restoration project based on DPSIR-cloud model. Int. J. Environ. Res. Public Health 2022, 19, 13295. [Google Scholar] [CrossRef]
  25. Rombouts, I.; Beaugrand, G.; Artigas, L.; Dauvin, J.-C.; Gevaert, F.; Goberville, E.; Kopp, D.; Lefebvre, S.; Luczak, C.; Spilmont, N.; et al. Evaluating marine ecosystem health: Case studies of indicators using direct observations and modelling methods. Ecol. Indic. 2013, 24, 353–365. [Google Scholar] [CrossRef]
  26. Guo, J.; Chen, K.; Hynes, S. Multilevel meta-analysis of stated preference values of marine ecosystem services in China. Mar. Dev. 2023, 1, 8. [Google Scholar] [CrossRef]
  27. Lin, D. Application of mathematical modeling based on MATLAB in experimental data analysis. Procedia Comput. Sci. 2024, 247, 86–92. [Google Scholar] [CrossRef]
  28. Jiang, X.; Sun, Y.; Qu, Y.; Zeng, H.; Yang, J.; Zhang, K.; Liu, L. The development and future frontiers of global ecological restoration projects in the twenty-first century: A systematic review based on scientometrics. Environ. Sci. Pollut. Res. 2023, 30, 32230–32245. [Google Scholar] [CrossRef] [PubMed]
  29. GB 3097-1997; Sea Water Quality Standard. Ministry of Ecology and Environment of the People’s Republic of China: Beijing, China, 1998.
  30. Bosso, L.; Saviano, S.; Abagnale, M.; Bellardini, D.; Bolinesi, F.; Botte, V.; Buondonno, A.; Carotenuto, Y.; Casotti, R.; Chiusano, M.L.; et al. GIS-based integration of marine data for assessment and management of a highly anthropized coastal area. Sci. Rep. 2025, 15, 16200. [Google Scholar] [CrossRef]
  31. Bei, H.; Yang, F.; Wang, W.; Yang, T.; Murcio, R. Maritime safety through multi-source data fusion: An AdaBoost-based approach for predictive ship detention by port state control. Marit. Policy Manag. 2024, 51, 1–20. [Google Scholar] [CrossRef]
Figure 1. Complex ecosystem model.
Jmse 13 02241 g001
Figure 2. Basic flow of a genetic algorithm.
Jmse 13 02241 g002
Figure 3. Implementation process of fuzzy comprehensive evaluation method.
Jmse 13 02241 g003
Figure 4. Sensitivity of IGA performance to mutation rate.
Jmse 13 02241 g004
Figure 5. Evaluation index system for eco-cultural construction.
Jmse 13 02241 g005
Figure 6. Fitting performance before and after optimization.
Jmse 13 02241 g006
Figure 7. Performance comparison of different optimization algorithms in model evaluation.
Jmse 13 02241 g007
Table 1. Comparison of existing marine ecological restoration assessment methods and advantages of this model.
MethodologyCore TechnologyAdvantageLimitations
De Valck et al. [17]Ecosystem services accounting frameworkClear structure and suitable for policy alignmentStatic, no prediction capability, and no optimization support
Shrestha et al. [18]; Gajardo et al. [19]Static value assessmentClear structure and suitable for policy alignmentNot adaptive and unable to handle uncertainty
Nie et al. [20]Select improvement model (Mangroves)Improve habitat assessment accuracyHighly dependent on scenarios and poor generalization
Alishirazi et al. [21]Fuzzy AHP-VIKOR (MCDM)Integrate opinions from multiple stakeholders and support the ranking of solutionsWeights are highly subjective, static decision-making
Yan et al. [22]CRITIC-TOPSIS + Obstacle modelObjective empowerment, identification of key constraintsOnly diagnosis, no prediction, no weight optimization
Cheng et al. [23]GA/PSO-BPVerify the potential of the meta-heuristic algorithmGA is prone to premature maturity and PSO convergence instability; it is only suitable for single-event prediction
Table 2. Statistical characteristics of the dataset.
ParameterMeanStd DevMinMax
Safety Index Weight0.190.080.050.28
Ecological Index Weight0.350.070.230.45
Socio-Economic Index Weight0.240.060.150.37
Water Quality Index Weight0.220.050.200.29
Table 3. Evaluation metrics before and after IGA optimization.
NumberConventional Fuzzy ModelIGA-Optimized Model
ParametersMAEMAE
Safety Index0.180.14
Ecological Index0.210.17
Socio-Economic Index0.250.20
Water Quality Index0.190.15
Overall Average0.210.16
95% CI for MAE[0.201, 0.227][0.128, 0.150]
95% CI for R2[0.66, 0.72][0.76, 0.82]
Table 4. Sample training data results (normalized values).
NumberTypeSafety Index WeightEcological Index WeightSocio-Economic Index WeightWater Quality Index WeightEvaluation Effect
1Training dataset0.200.400.150.250.82
2Training dataset0.280.230.260.230.93
3Training dataset0.190.310.300.200.87
4Training dataset0.150.350.250.250.96
5Training dataset0.100.400.300.200.85
6Training dataset0.050.450.250.250.86
7Testing dataset0.210.320.240.230.92
8Testing dataset0.180.350.270.200.87
9Testing dataset0.140.290.370.200.76
10Testing dataset0.120.310.280.290.88
Disclaimer/Publisher’s Note: The statements, opinions and data contained in all publications are solely those of the individual author(s) and contributor(s) and not of MDPI and/or the editor(s). MDPI and/or the editor(s) disclaim responsibility for any injury to people or property resulting from any ideas, methods, instructions or products referred to in the content.