1. Introduction
Beaches are valuable coastal resources that are closely linked to human life and possess significant economic, environmental, and resource importance [
1,
2,
3]. In recent years, under the combined influence of multiple factors—such as sea level rise and increased wave energy caused by global warming, reduced fluvial sediment supply due to watershed activities, and extensive human interventions near beaches—beach shorelines have experienced notable erosion or accretion [
4,
5,
6,
7,
8,
9,
10,
11,
12,
13,
14,
15]. Shoreline changes not only directly affect nearshore ecosystems and coastal landscapes, but also influence the performance of coastal engineering structures and even alter national territory areas [
2,
3,
5,
6,
7,
8]. Against the backdrop of ever-intensifying human activities, studying beach shoreline evolution is of great significance.
While large-scale offshore artificial islands remain relatively rare due to their high cost and complex engineering, they have been constructed in select coastal regions—particularly in East Asia, the Middle East, and parts of Europe—for purposes including tourism, real estate development, port expansion, and symbolic urban branding [
7,
8,
10,
11]. Notable examples include Dubai’s Palm Islands (luxury tourism) [
7,
8], Japan’s Kansai International Airport island (infrastructure), and China’s coastal resort islands such as Qingdao’s Xingguang Island and Haikou’s Pearl Island [
5,
9,
10]. Offshore artificial islands are typically constructed by first building a perimeter dike (often using rock or geotextile tubes) to enclose a shallow marine area, followed by land reclamation through sand or soil infill.
Previous studies have shown that the construction of offshore artificial islands has multifaceted impacts on the evolution of nearby beach shorelines [
4,
5,
7,
8,
9,
10,
11]. On the one hand, by sheltering incident waves, artificial islands induce accretion in their lee areas; for instance, after the construction of Lianli Island [
4], Xingguang Island [
5], Pearl Island [
9,
10], and Guanyin Island [
11], rapid accretion occurred without exception in their respective shadow zones. On the other hand, artificial islands can also intensify waves in some areas through reflection and refraction, resulting in beach erosion—a viewpoint supported by the studies on Pearl Island [
9], Yulong Island [
12], and Ruyi Island [
13]. In addition, artificial islands influence alongshore sediment transport, thereby altering sediment supply and further changing beach evolution, as demonstrated in the research on Lianli Island [
4], Pearl Island [
10], and Lotus Island [
11].
Although a number of studies have addressed shoreline changes after the construction of offshore artificial islands, due to the complexity of geological, morphological, and oceanographic factors and the relative scarcity of case studies, the shoreline responses adjacent to artificial islands still vary considerably, and a unified mechanism has yet to be established. Even for the same artificial island and the same beach, different studies sometimes yield divergent results; for example, Li et al. [
9] attributed erosion on the west side of Pearl Island to wave reflection from the island, whereas Hu et al. [
10] argued that it was caused by sand excavation. Researchers have also focused on whether the beach opposite an artificial island will form a salient or a tombolo [
10,
11]. A salient refers to a protrusion formed on the opposing beach after artificial island construction; if this protrusion continues to grow and eventually connects with the artificial island, the resulting landform is termed a tombolo. Relevant studies often draw on findings from (submerged) breakwaters. However, compared with these smaller structures, offshore artificial islands are much larger in scale and their impacts may differ accordingly [
9,
10,
11].
In previous cases the offshore artificial islands studied either were located far from the shore, had limited alongshore length, experienced insufficient alongshore sediment supply, or had short construction histories; consequently, salients were commonly observed on the opposite shore, whereas tombolos were rarely reported. Most existing studies focus on single islands and post-construction snapshots, commonly reporting leeside accretion and flank erosion. However, the lateral interaction of adjacent islands and the shoreline response after island removal have rarely been documented, leaving their coupling mechanisms uncertain.
The beach investigated in this paper, Riyue Beach, is flanked by two adjacent offshore artificial islands: Ridao and Yuedao. Ridao Island was developed as a resort and residential complex to support Hainan Province’s growing tourism economy. Yuedao Island was similarly intended for luxury real estate and recreational use. However, after the construction of Ridao Island, a tombolo has already formed on its landward side. Following the construction of Yuedao Island, rapid accretion also occurred on its landward side. In addition, post-construction monitoring revealed that Yuedao significantly intensified erosion along its southwestern flank and posed potential risks to the nearby nature reserve. These adverse geomorphic and environmental impacts led local authorities to order its complete removal in 2022. Thus, the construction and subsequent removal of Ridao and Yuedao Islands provide excellent material for studying the influence of adjacent offshore artificial islands on beach shoreline evolution. However, to date, the only studies [
14,
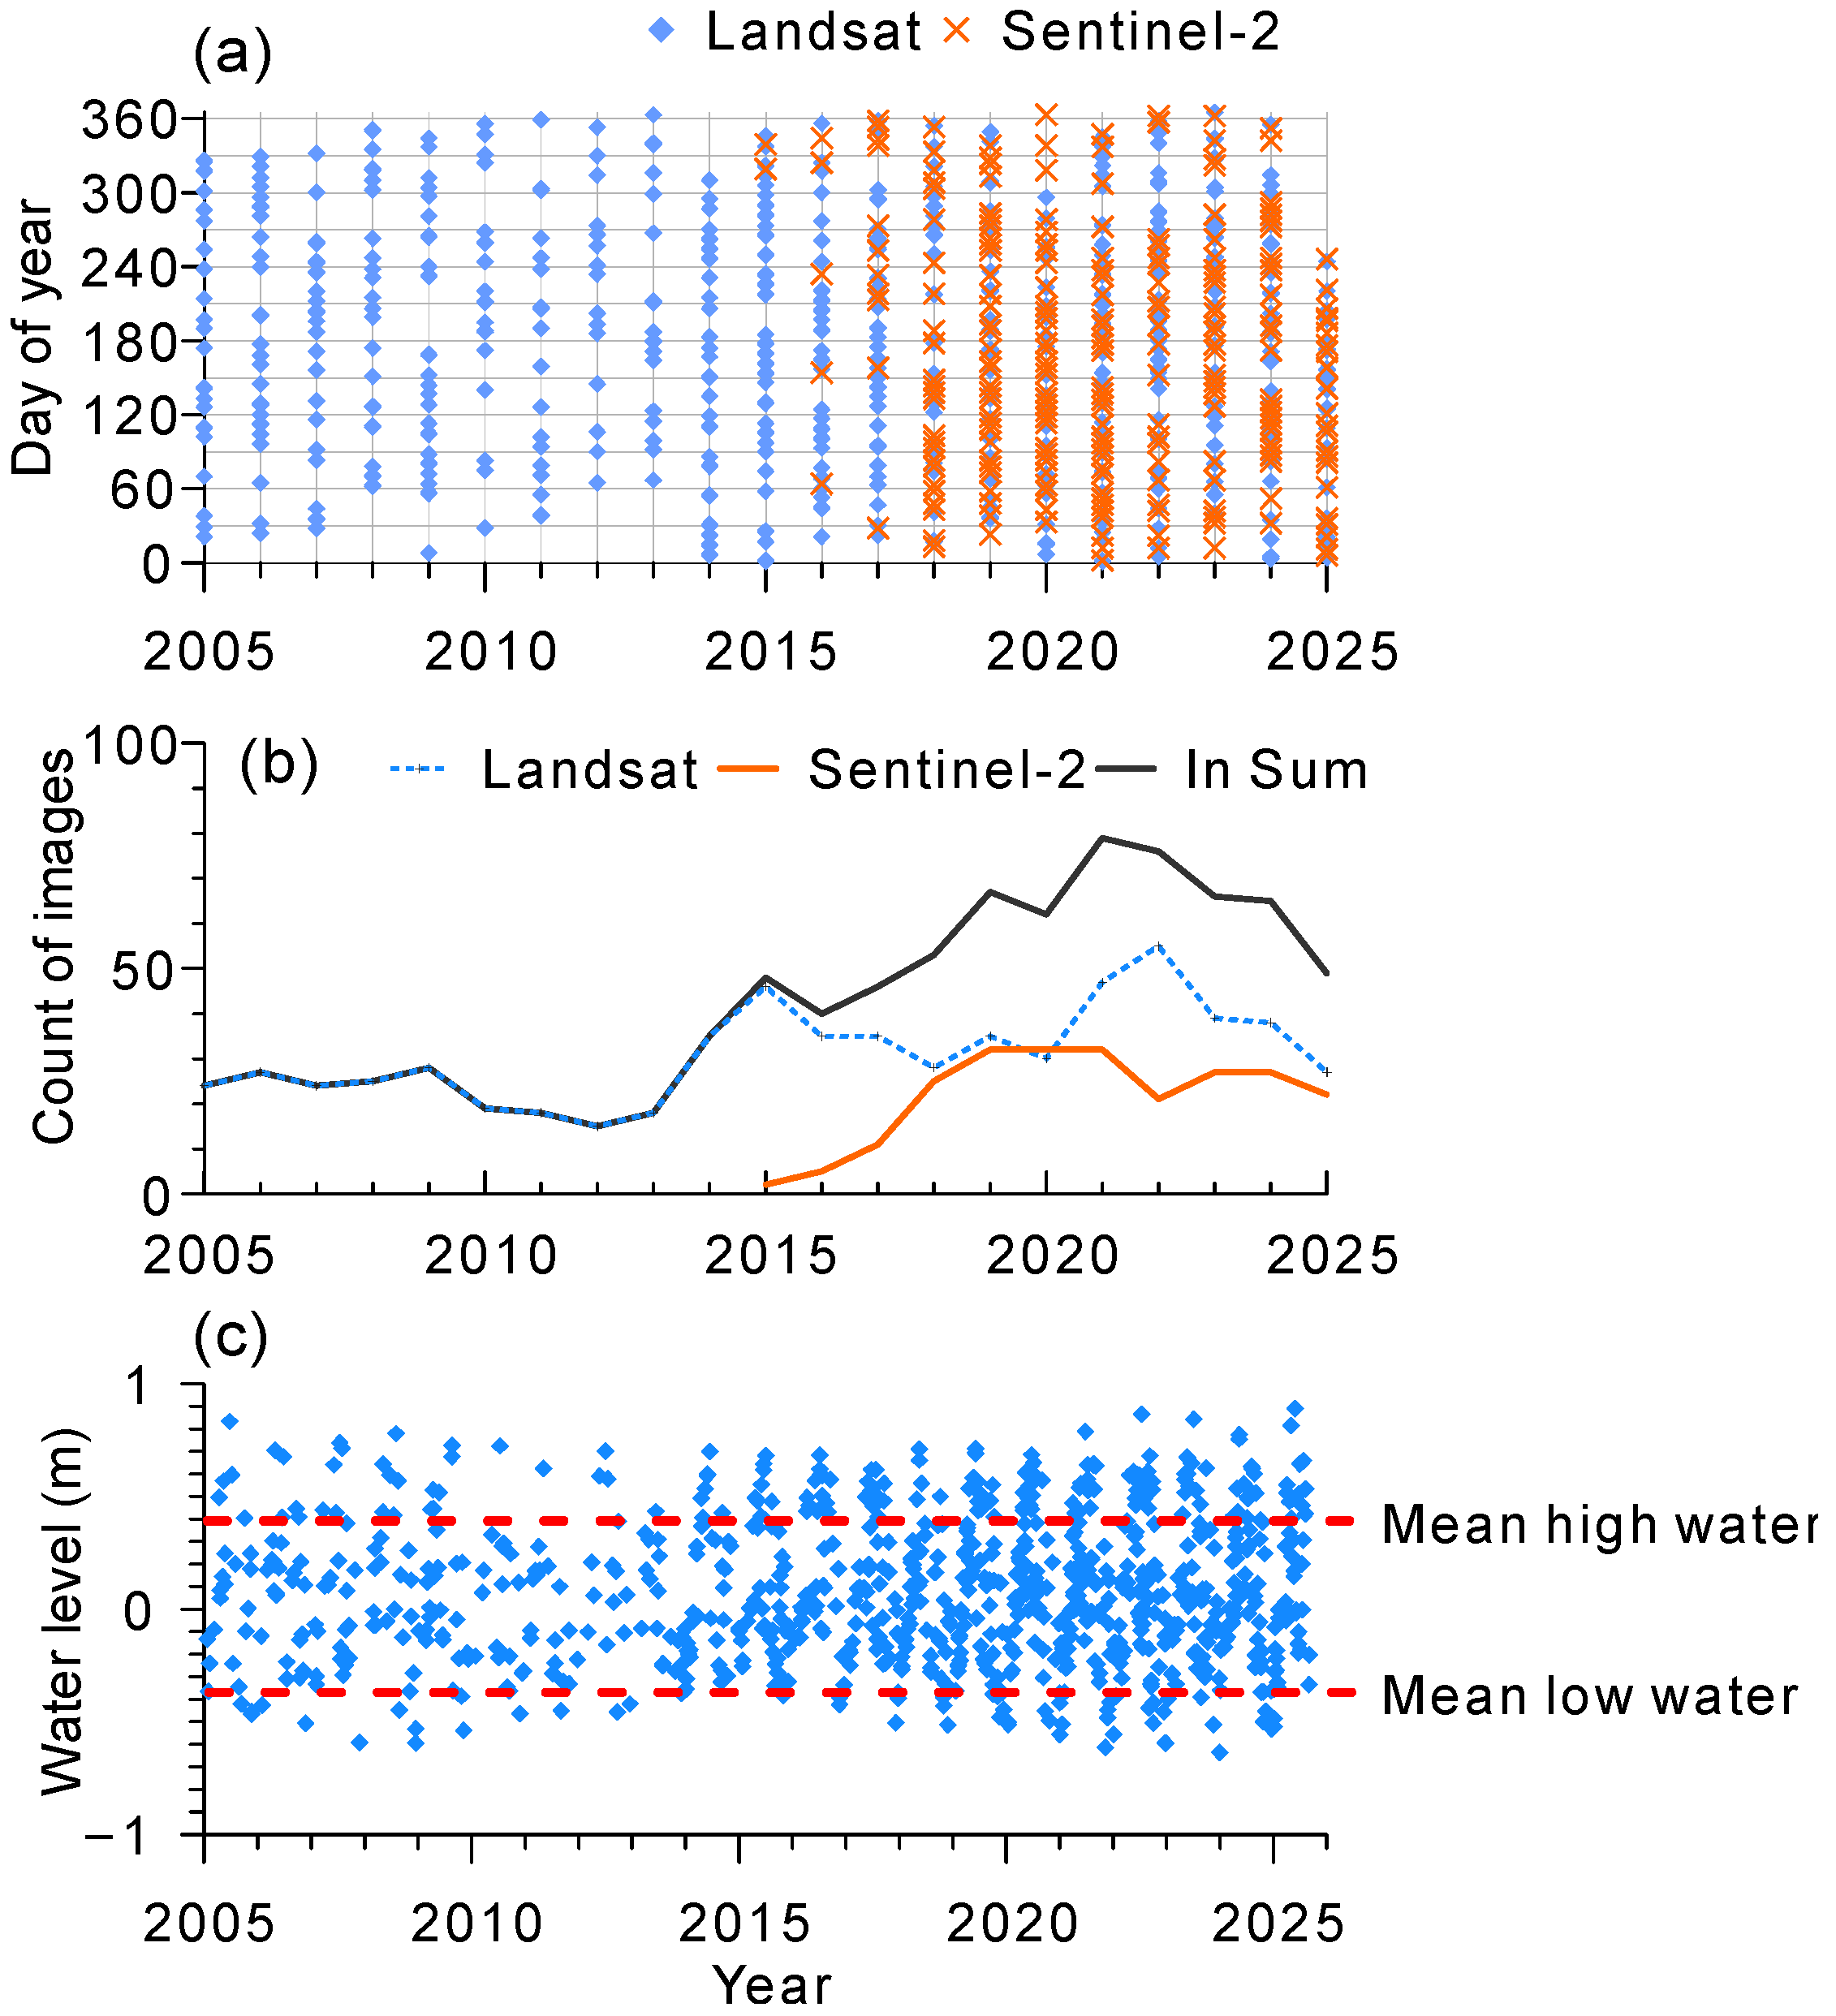
15], both in Chinese, have examined these impacts, using 8–9 satellite images, covering the periods 1992–2017 and 2011–2018, respectively. At that time, Yuedao Island had only recently been built and its impacts had just begun to manifest; moreover, their results did not include the period after Yuedao Island’s removal. This paper utilizes 884 Landsat and Sentinel-2 images from 2005 to 2025 to investigate the spatiotemporal shoreline evolution of Riyue Beach, aiming to reveal detailed shoreline change processes, establish links between shoreline evolution and artificial island construction, further clarify their life-cycle impacts and underlying mechanisms, and provide field-calibrated D/L thresholds for tombolo formation. The outcomes offer an empirical benchmark for sustainable design of future artificial islands.
2. Study Area
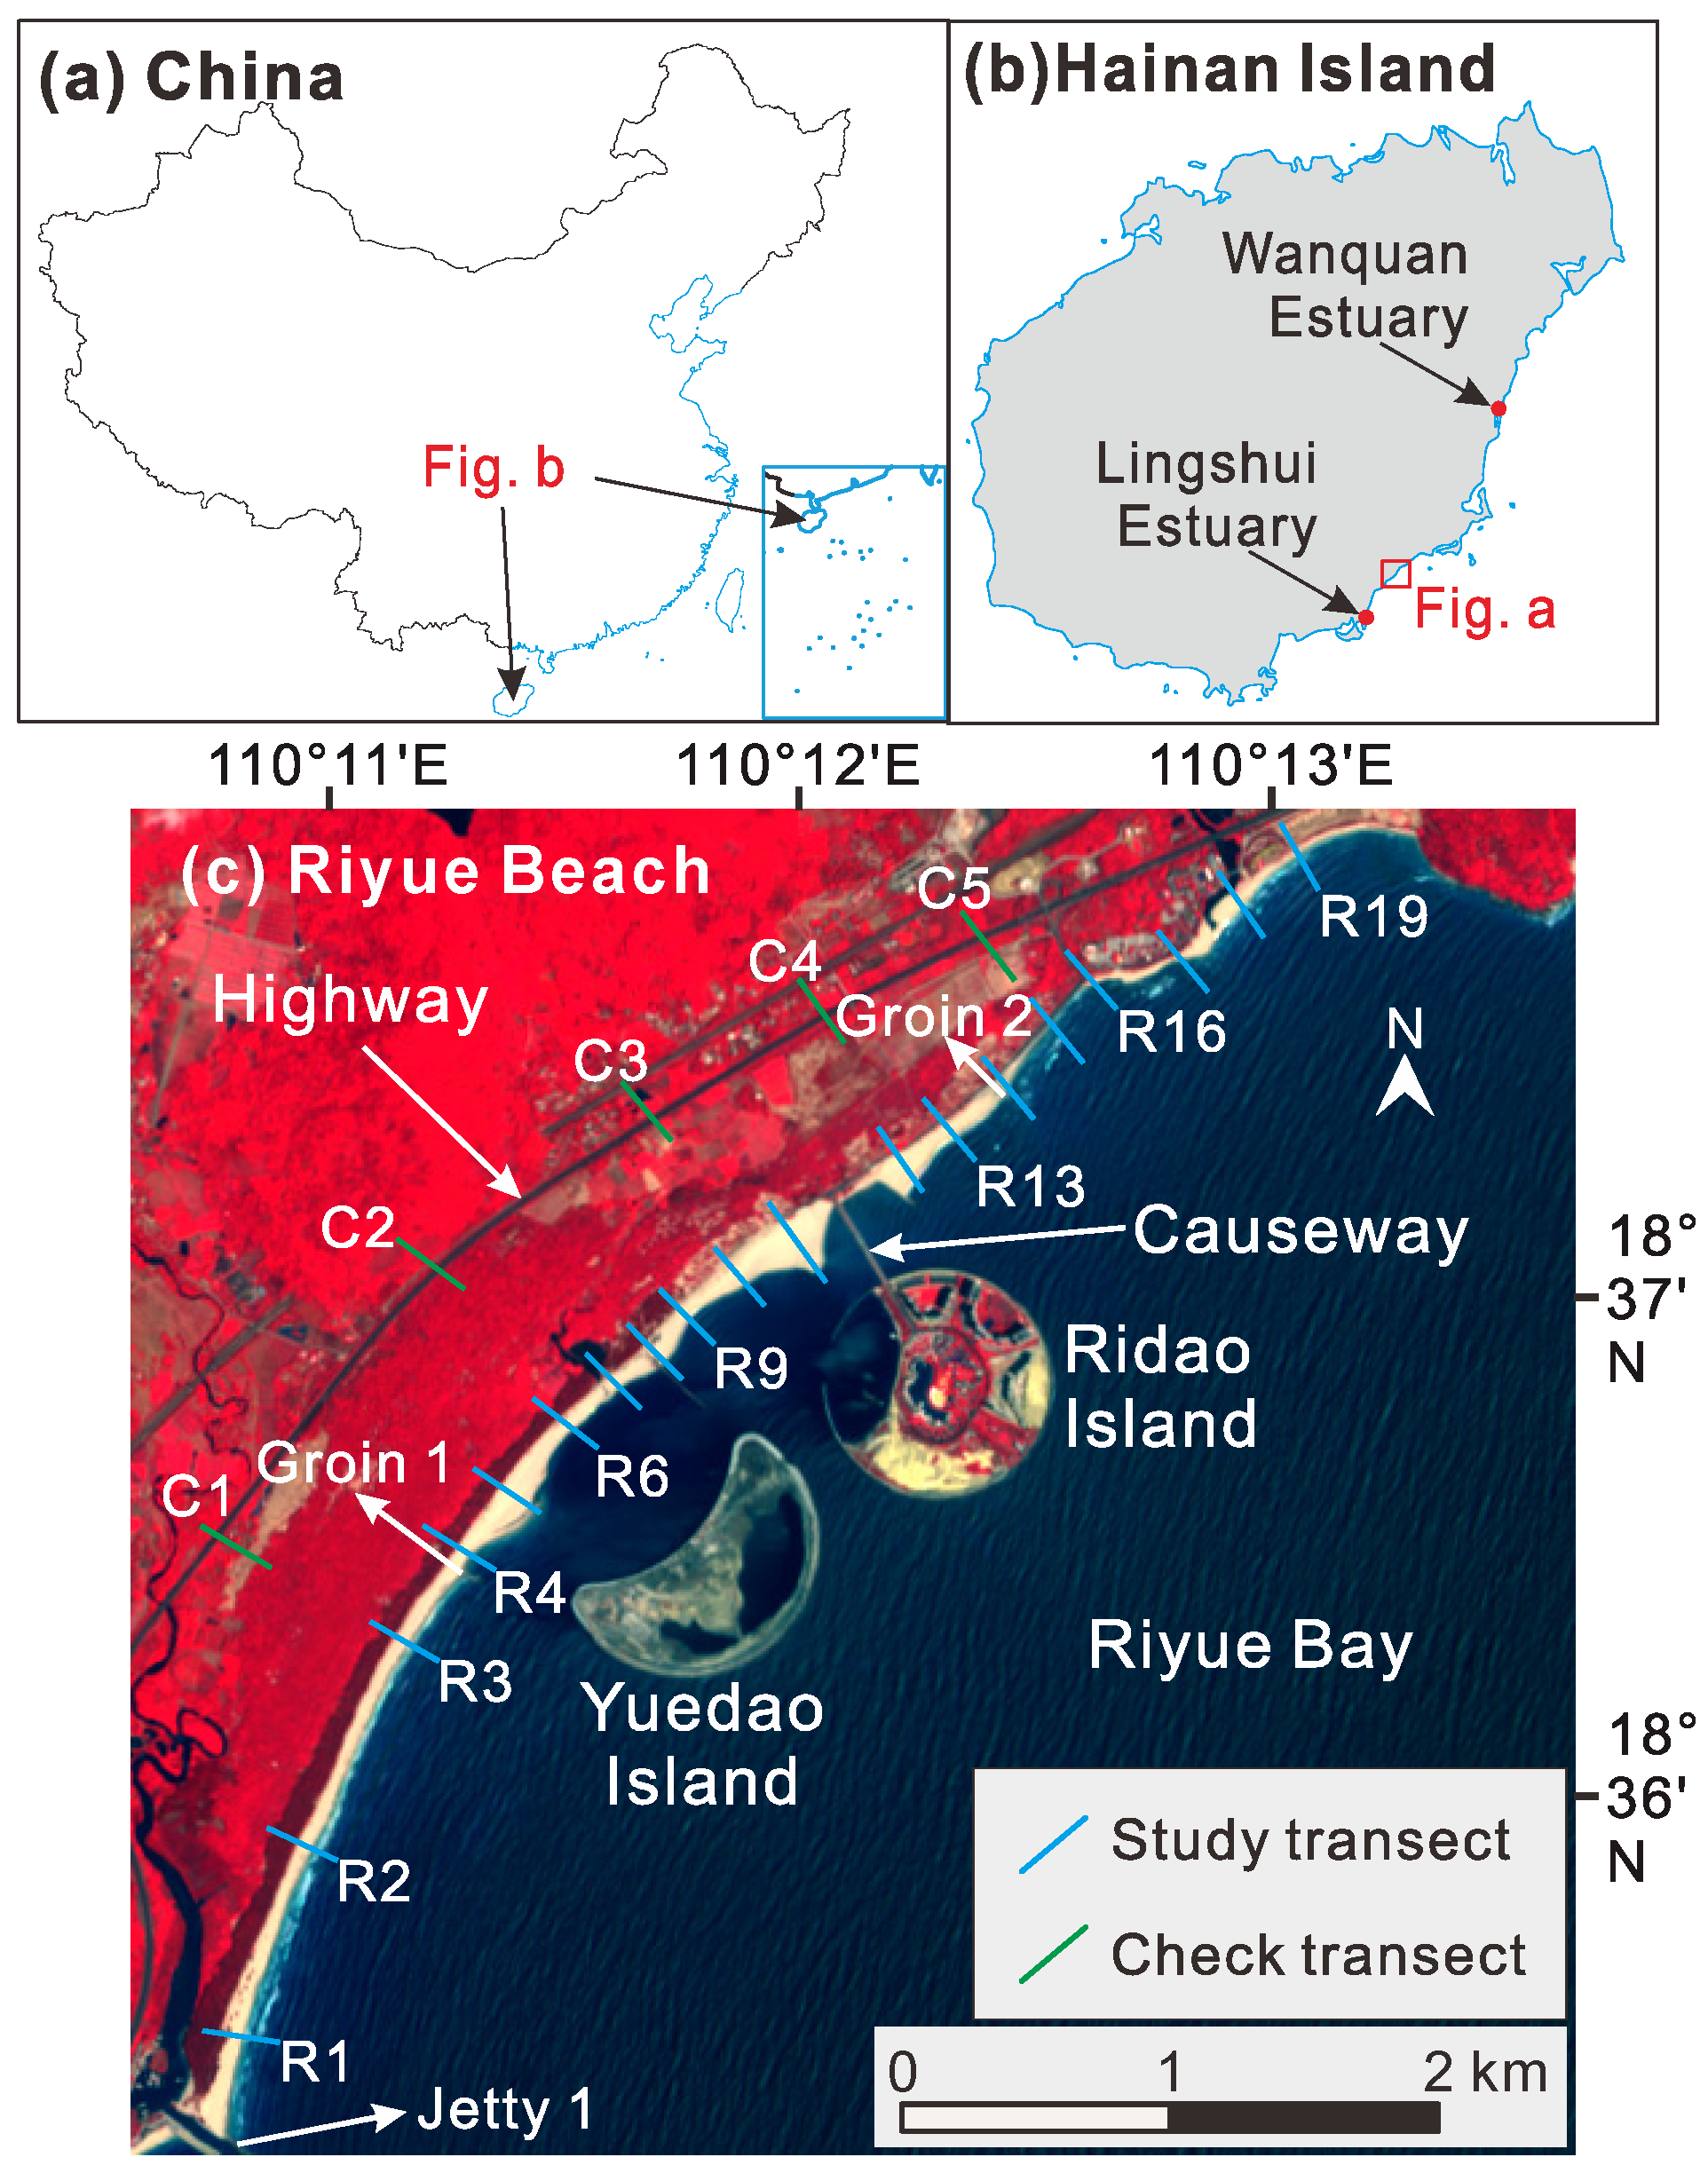
Riyue Beach lies in Riyue Bay, a southeast-facing embayment on Hainan Island, China (
Figure 1). The beach is ~7 km long, ~50 m wide, trends NE–SW, and is slightly curved seaward. Its southwestern limit is the mouth of an unnamed ~10 km-long river whose estuary is stabilized by a jetty; the northeastern limit is a rocky headland. Hainan, China’s newest and largest special economic zone, is renowned for its warm climate, long coastline, and scenic coastal landscapes.
The Wanquan River, Hainan’s third largest (length 163 km, drainage 3693 km
2), delivers an average annual discharge of 4.84 × 10
9 m
3 and sediment load of 453 × 10
3 t. Its mouth lies 80 km northeast of Riyue Beach (
Figure 1b). The fourth-largest river, the Lingshui (74 km, 1131 km
2), discharges 1.41 × 10
9 m
3 yr
−1 and its mouth is 14 km southwest of the beach (
Figure 1b). The Wanquan flow remains steady, yet its sediment load has slightly diminished [
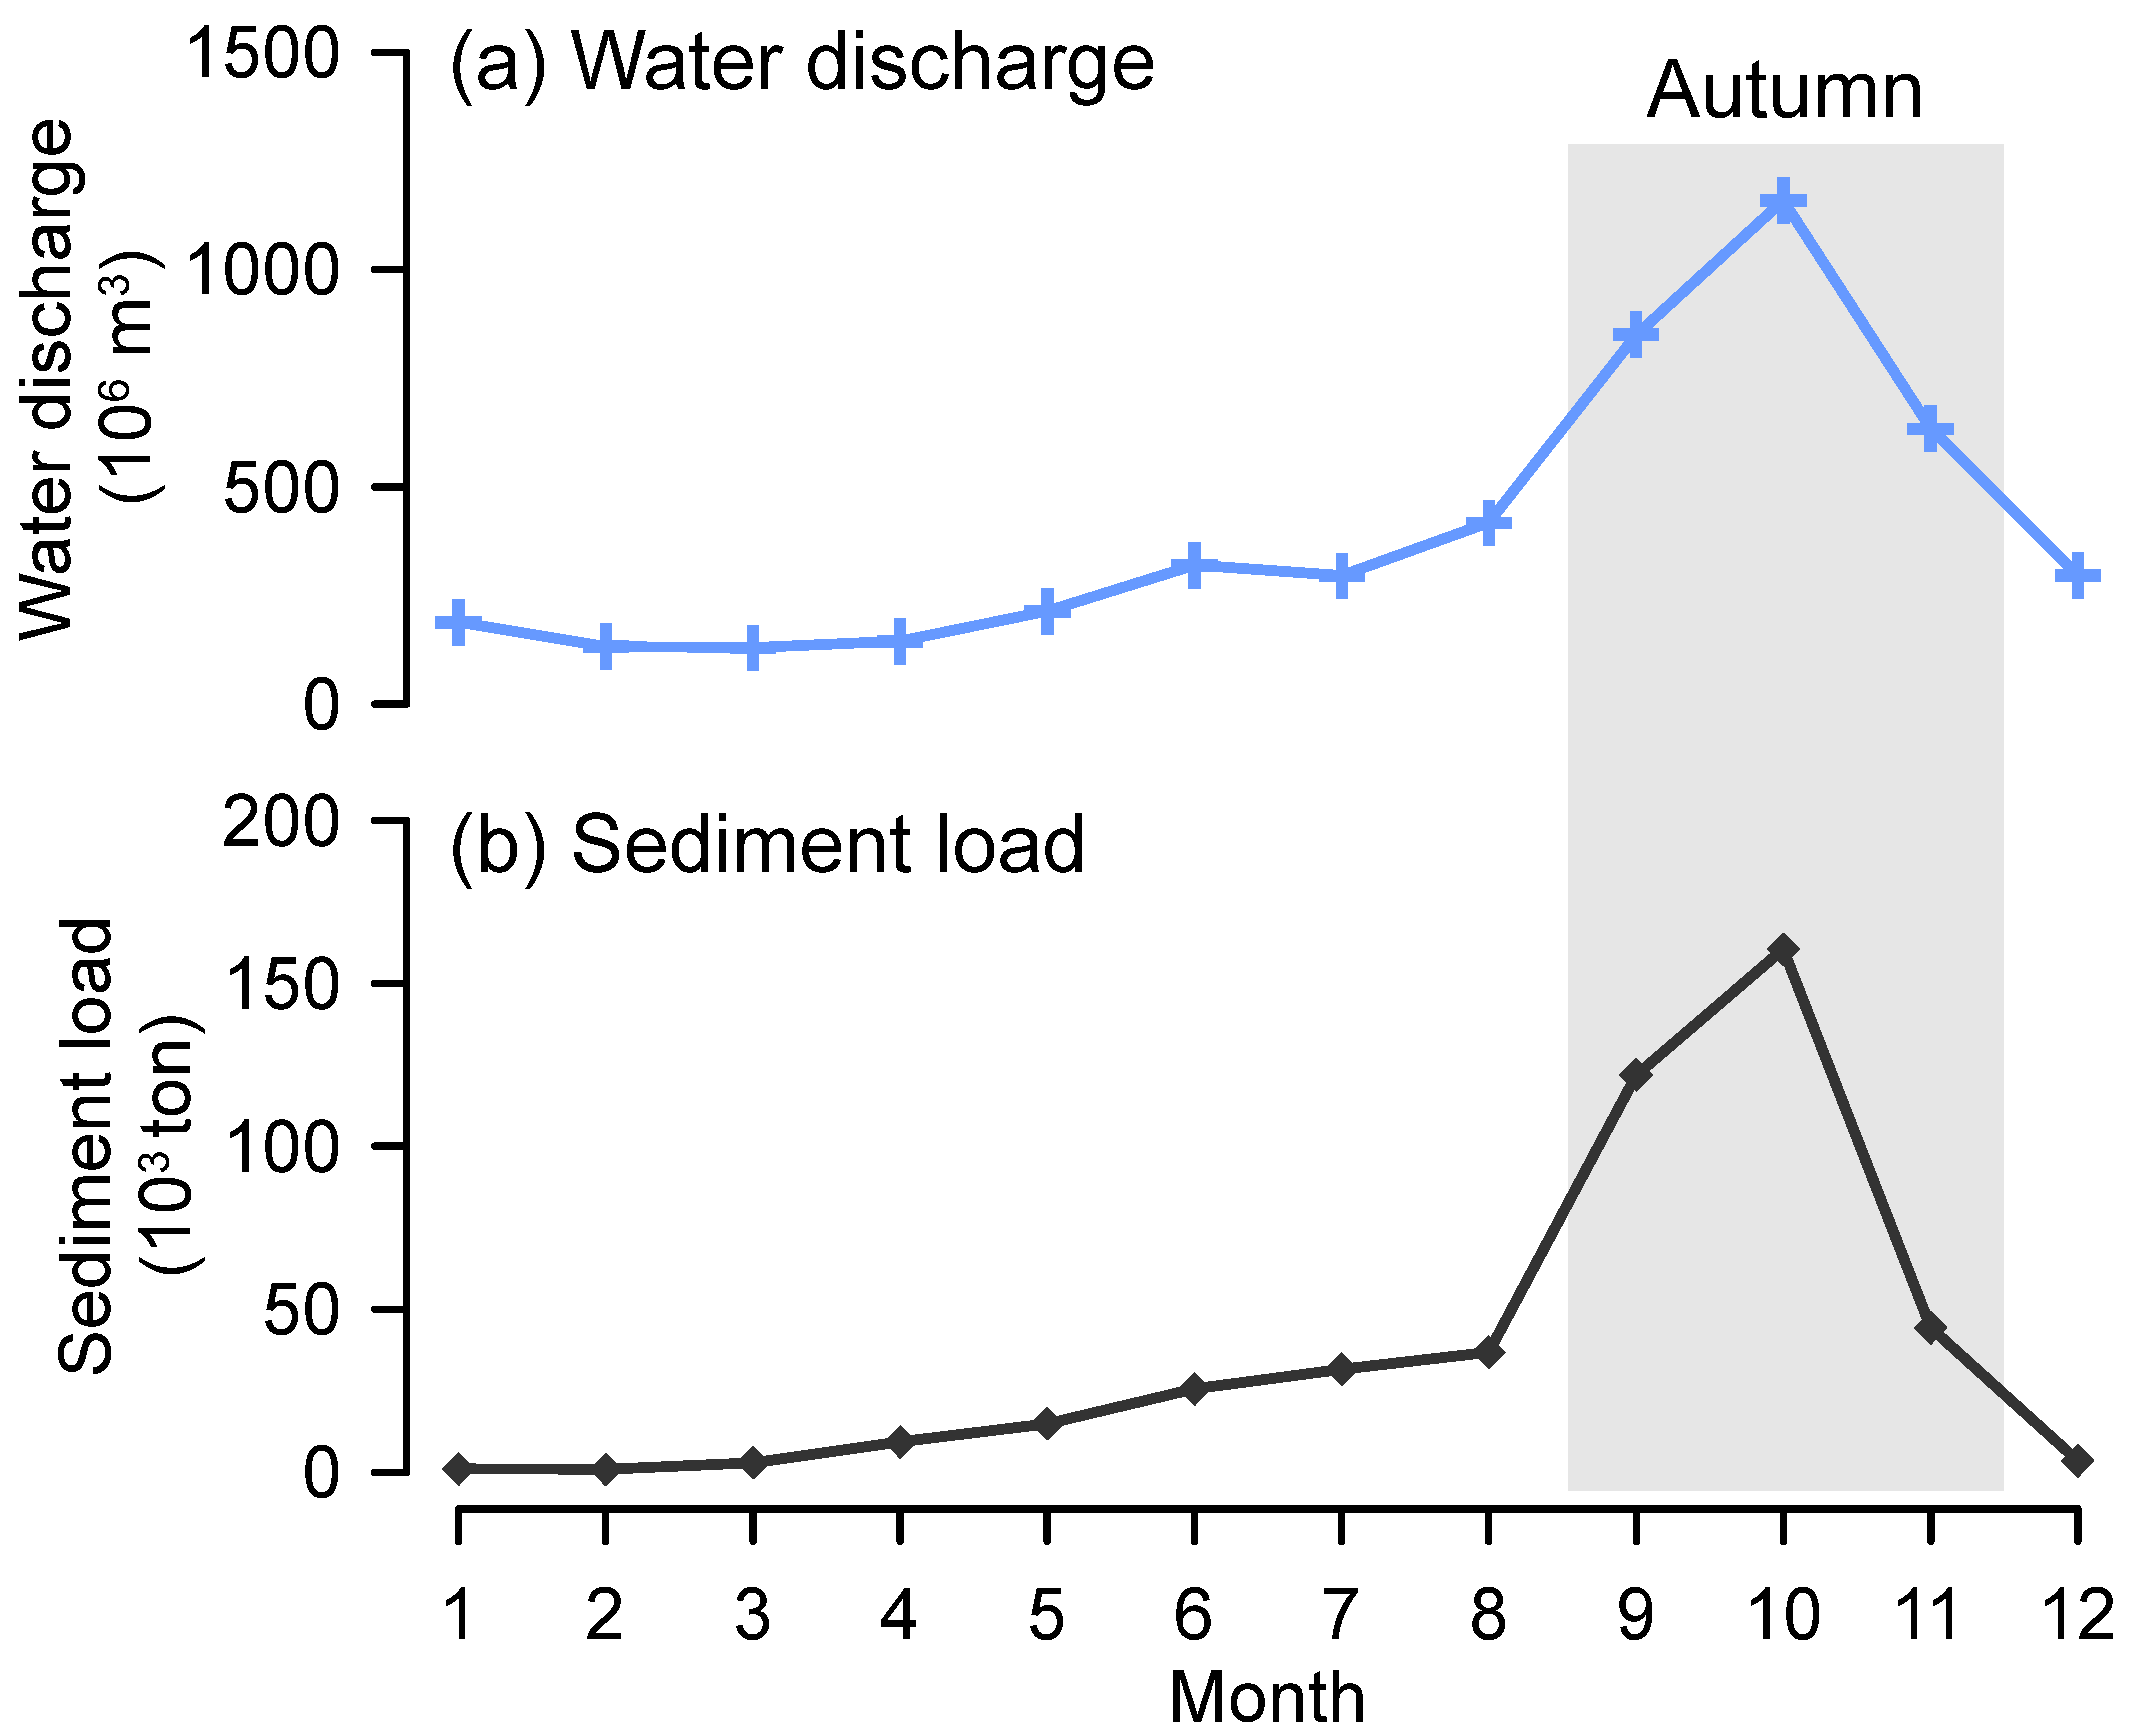
16]. Both the water discharge and sediment load of the Wanquan River culminate in the September-October autumn pulse (
Figure 2) [
16].
Tides in Riyue Bay are irregular semi-diurnal with a range of 0.77 m (mean high water 0.39 m, mean low water −0.38 m). Wave energy is moderate (mean significant wave height = 1.1 m) (ERA5 reanalysis data,
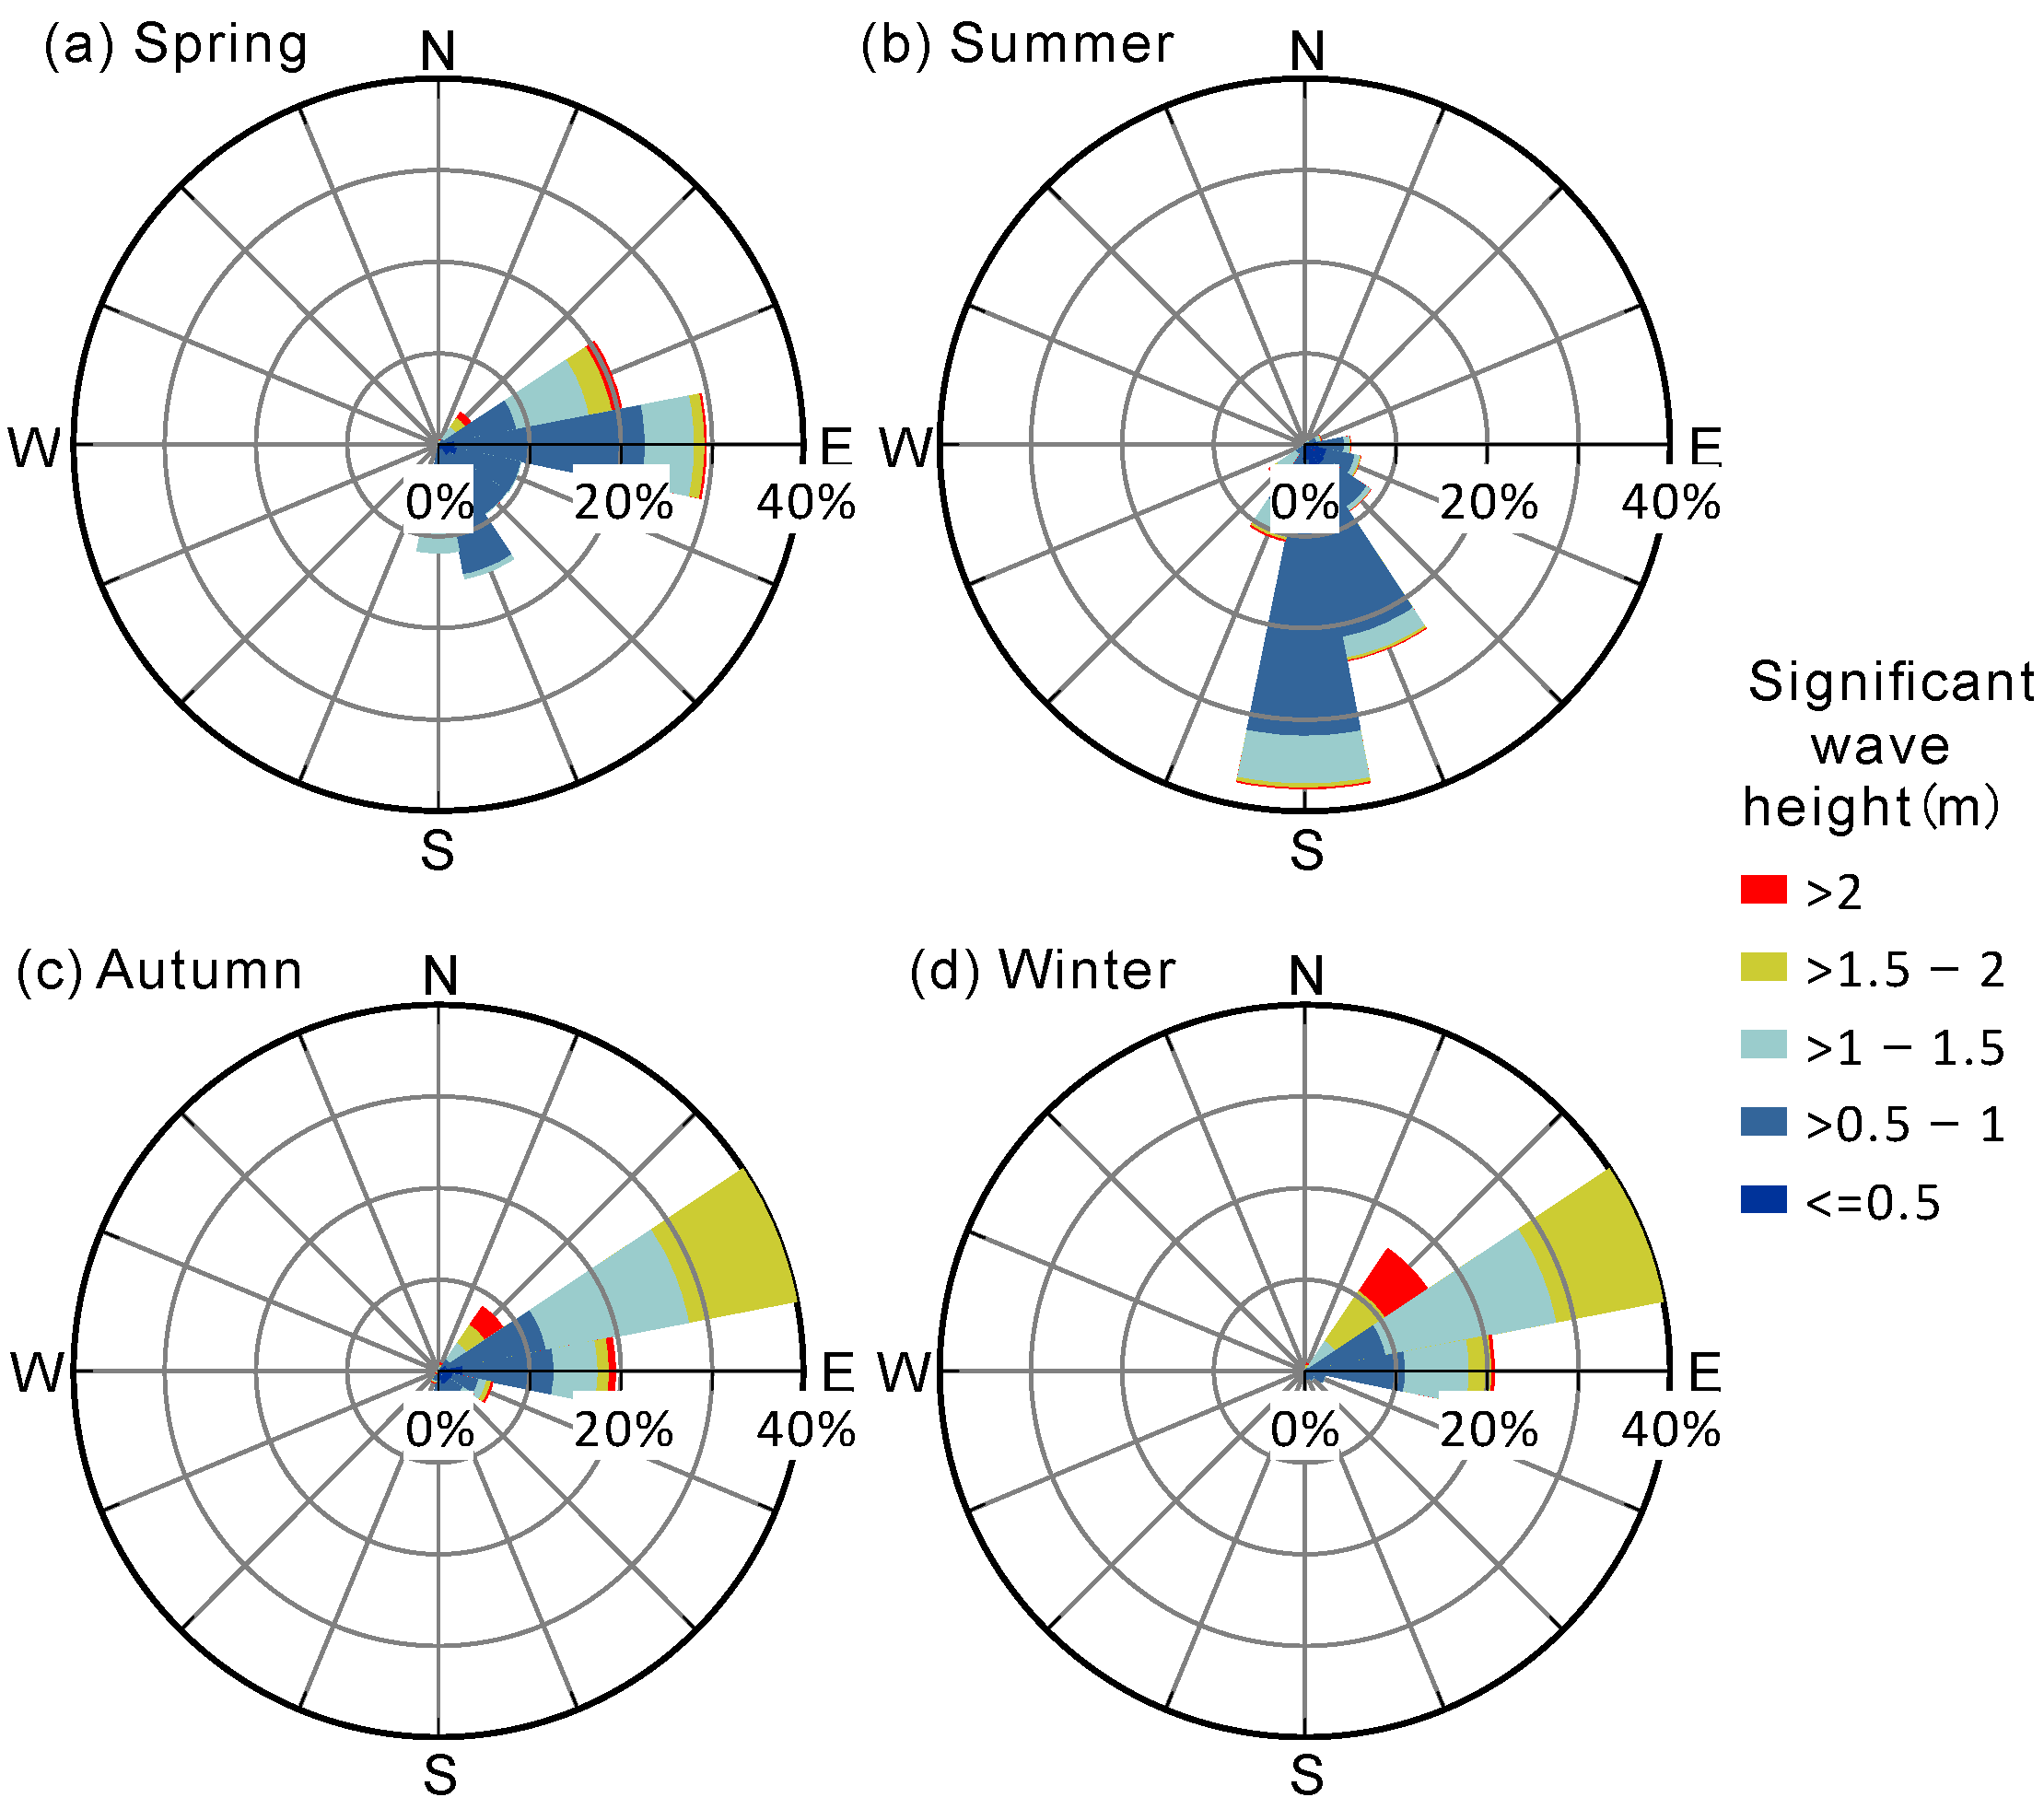
https://cds.climate.copernicus.eu/, accessed on 26 September 2025). Dominant waves are from ENE and S; S waves are relatively weak, generally not exceeding 1.5 m and occurring mainly in summer; ENE waves are comparatively stronger, yet seldom surpass 3 m, and predominate in autumn and winter (
Figure 3).
Two offshore artificial islands have been built immediately offshore (
Figure 1c). Ridao (circle, 870 m diameter, 46 ha area, 380 m offshore) was initially constructed as a resort island, with its basic landform completed by 2013. It has since been developed into a hotel and residential complex. Yuedao (crescent, 980 m long axis, 490 m short axis, 44 ha area, 420 m offshore) had its basic landform completed by 2016 but was completely removed in 2022 due to its adverse impact on the adjacent shoreline, as mentioned earlier.
4. Results
4.1. Chronology and Coastal Engineering Inventory
The complete satellite-image stack was visually inspected to establish a chronological inventory of all significant interventions at Riyue Beach (
Table 1;
Figure 6). Ridao Island first appeared as a faint access causeway on 20 July 2012 and its circular perimeter dike was fully closed by 31 July 2013, a date we adopt as the effective completion of the island shell (
Figure 6a,b); infill was finished before 7 January 2014. Yuedao Island’s causeway emerged on 26 October 2013, but its crescent-shaped perimeter dike was not continuously visible until 14 February 2016 and was judged complete on 21 August 2016 (
Figure 6c). Internal reclamation of Yuedao proceeded through 2017–2021, yet the island vanished from every image acquired after 1 June 2022, indicating that demolition was accomplished between late May and early June 2022 (
Figure 6d–f). Three additional hard-structure projects (Jetty 1 in 2008, Groin 1 in 2019, Groin 2 in 2025), three sand dredging events (2018, 2019, 2025), and two beach nourishment events (2019, 2025) were likewise pinpointed to provide an unambiguous engineering timeline for subsequent shoreline change analysis.
4.2. Shoreline Position Uncertainty
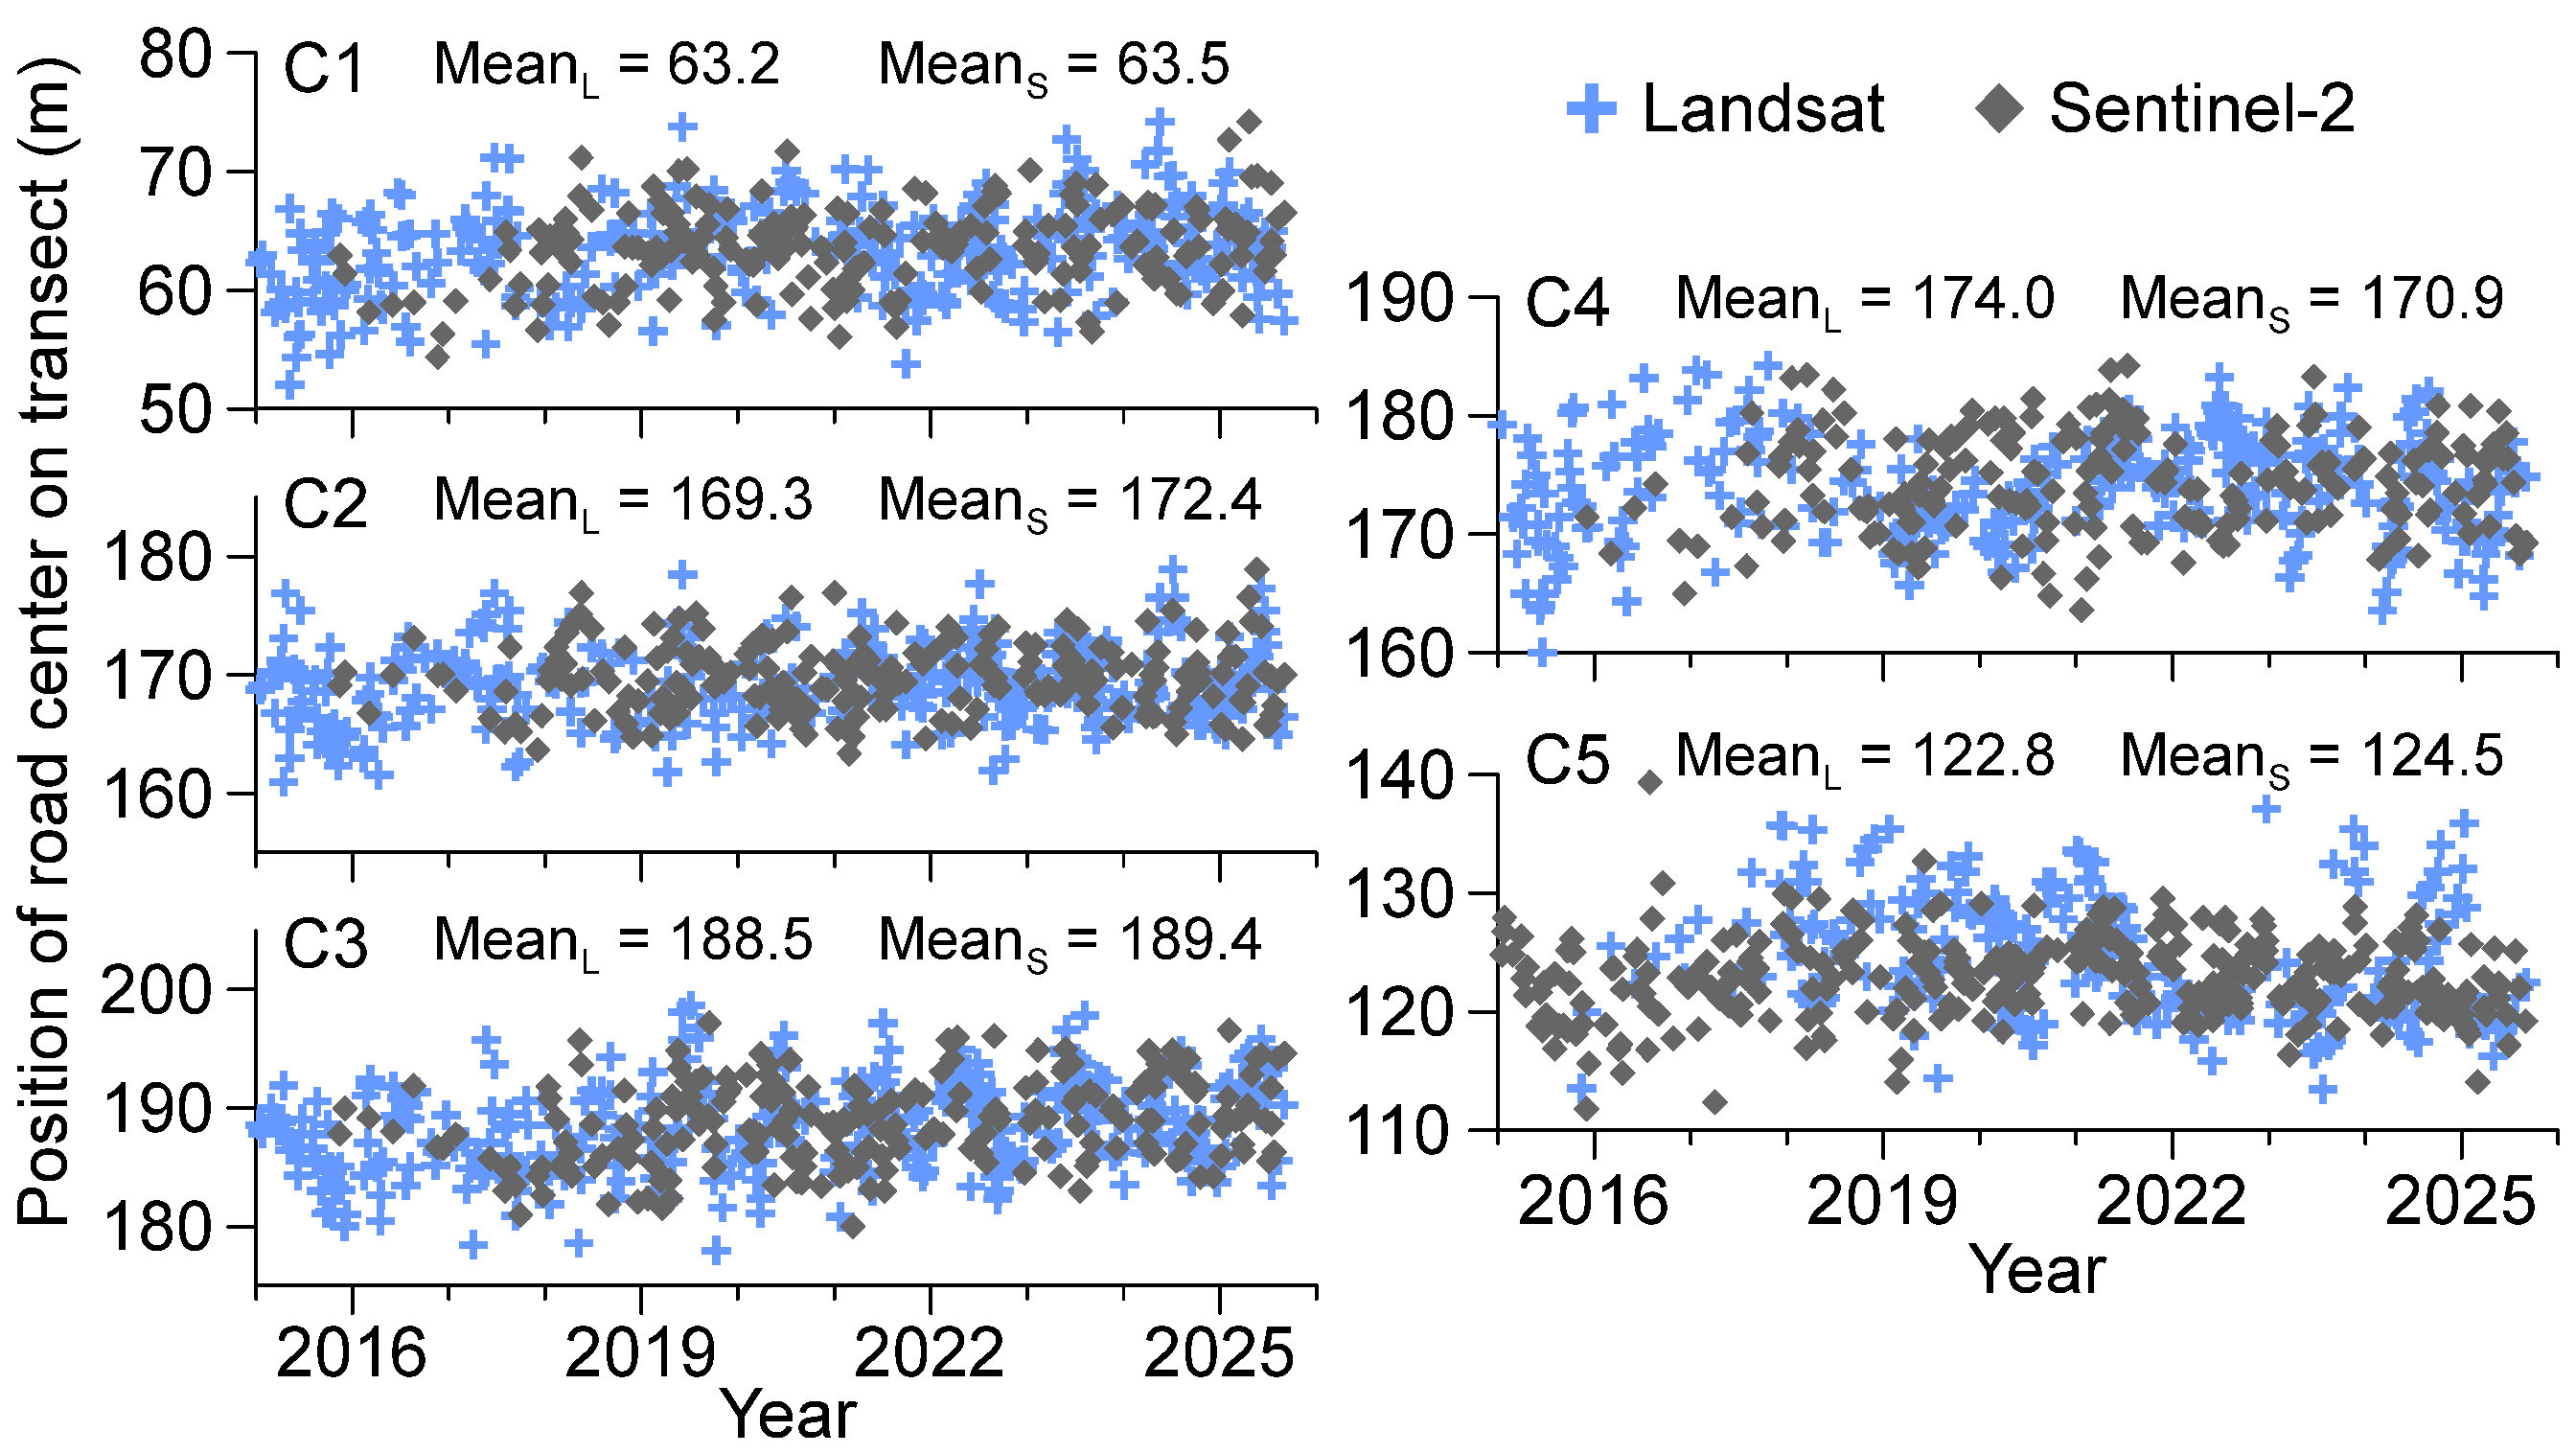
The cross-shore positions of the coastal-highway centerline derived from Landsat and Sentinel-2 imagery agree within 3.1 m and show no systematic drift (
Figure 7). However, the Sentinel-2 tiles themselves exhibited a coherent correlation (correlation coefficient vary between 0.86–0.91 among check transects C1–C5) (
Table 2). In contrast, the Landsat tiles exhibited a weaker correlation (correlation coefficients vary between 0.16–0.39 among check transects C1–C5) (
Table 3). After having performed the georeferencing and water-level correction, the combined dataset of mean water position yields a mean random uncertainty of 9.6 m, comparable to the level of sub-pixel precision reported elsewhere [
4,
5,
10,
11,
12].
As noted earlier, the uncertainty in the annual mean shoreline position depends not only on the error of individual shoreline positions but also on the number of positions available each year (Equation (2)). Consequently, for the four engineering-relevant periods defined above, the estimated random errors in the annual mean shoreline position are 2.0 m for 2005–2012, 1.7 m for 2012–2016, and 1.2 m each for 2016–2022 and 2022–2025.
4.3. Intertidal Beach Slope
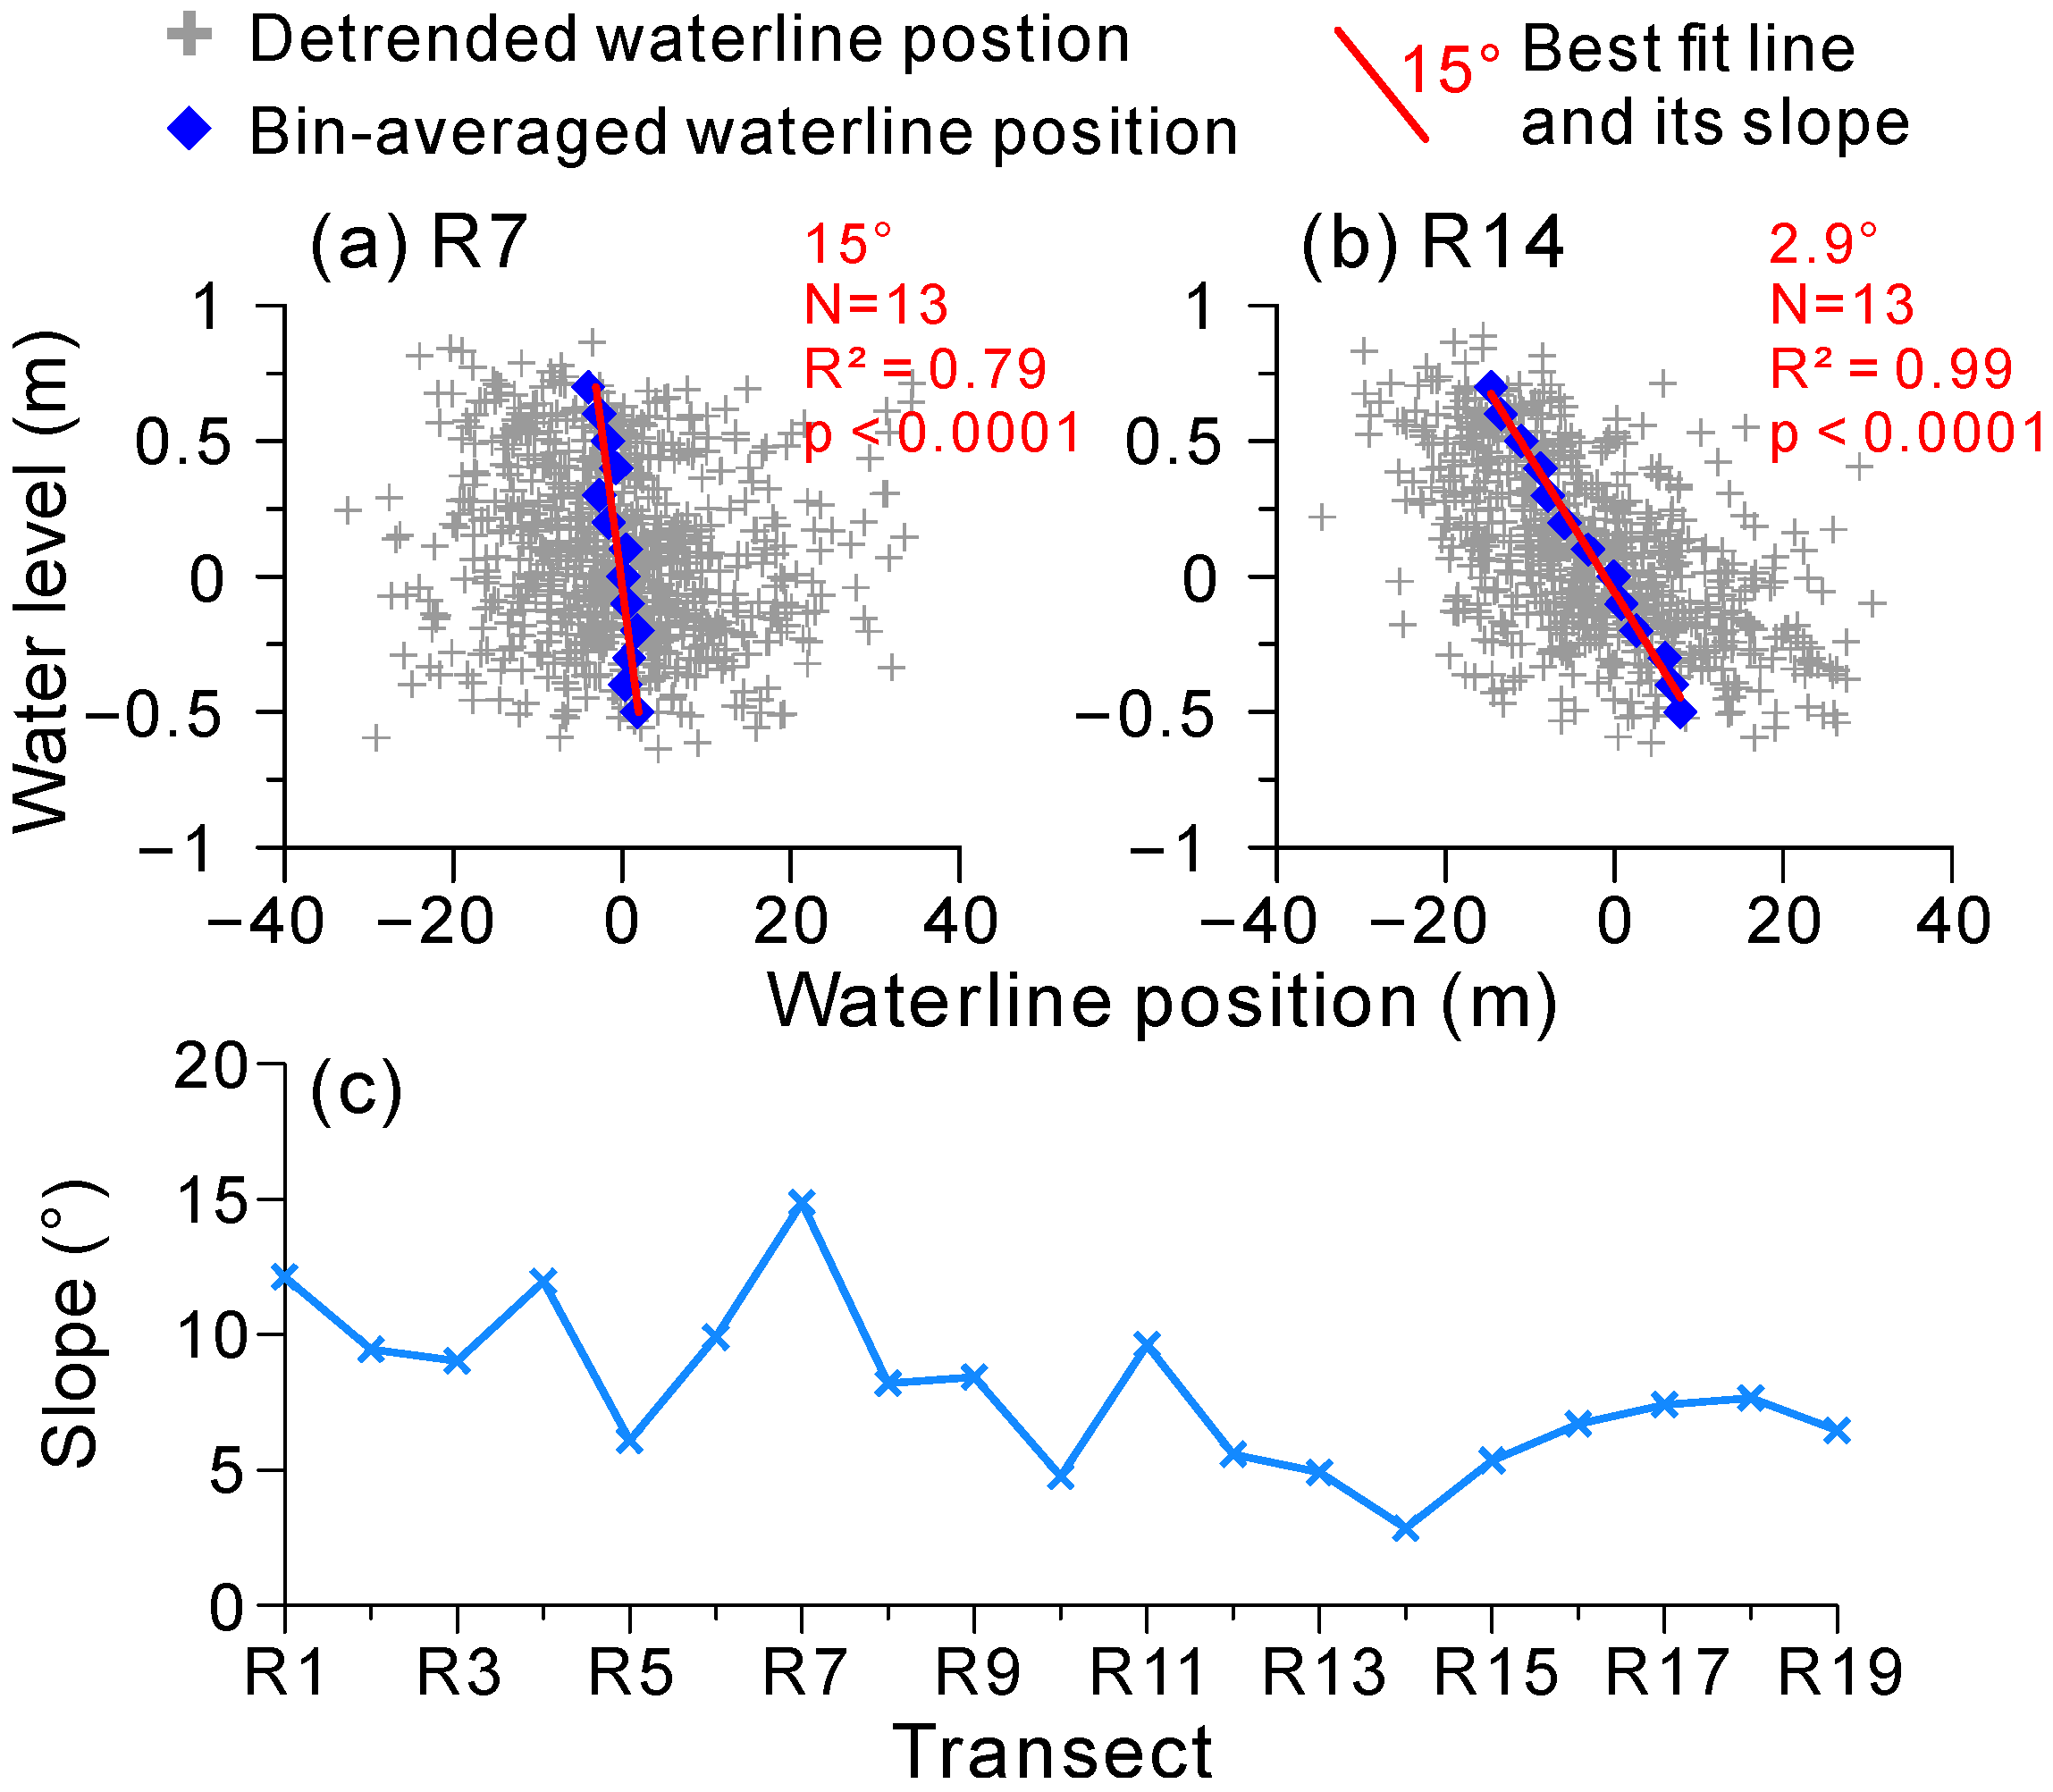
Intertidal beach slope was retrieved by regressing detrended waterline positions against modelled tidal heights at each transect (
Figure 8a,b). Owing to the sizeable random error of individual waterline positions relative to the intertidal width, we grouped all positions into 0.1 m water-level bins, calculated the mean values for each bin, and regressed these bin-averaged waterline positions against the corresponding water levels to obtain the intertidal slope. The resultant slopes range from 2.9° to 15° (all regressions are statistically significant at
p < 0.001), which is broadly consistent with a previously reported field measurement of ~6° [
14].
Spatial variability in slope appears to reflect local geomorphic controls: steeper profiles dominate the central and southern sections, likely due to direct exposure to typhoon-generated waves and limited fluvial sediment input; in contrast, gentler slopes in the northern segment are associated with proximity to the rocky headland, which attenuates wave energy and favors sediment deposition.
4.4. Shoreline Position Change Along Transects (2005–2025)
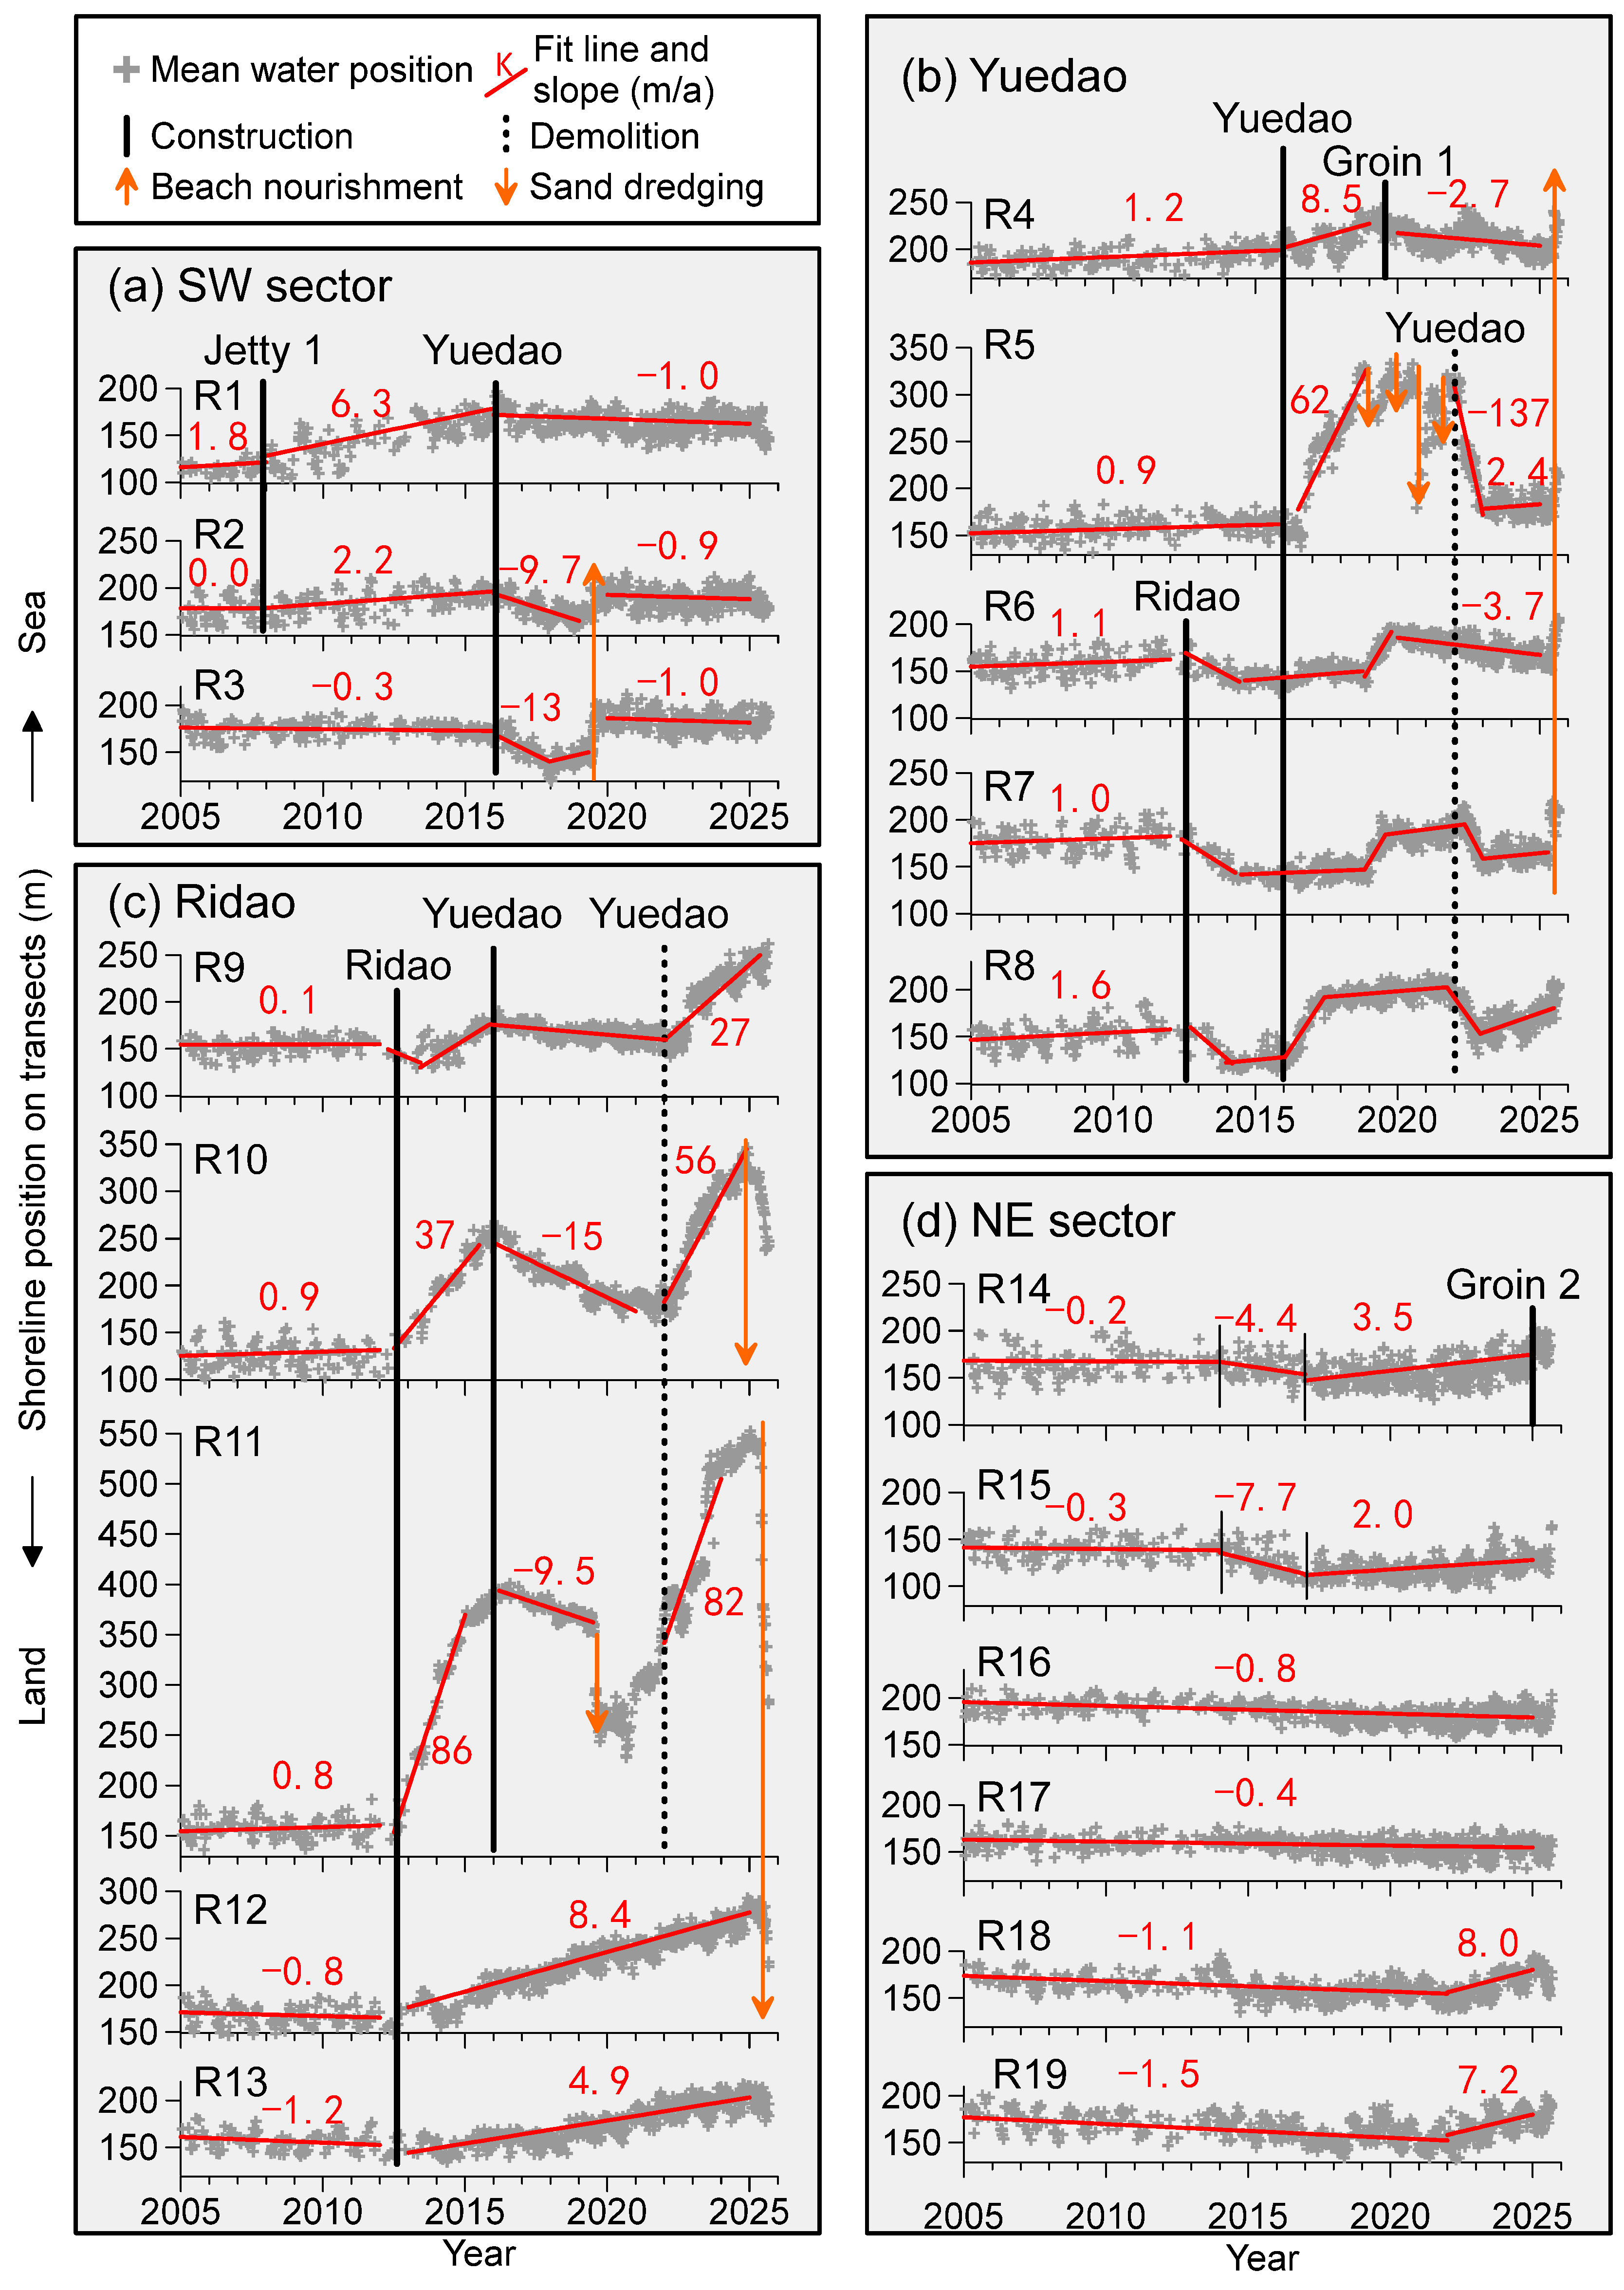
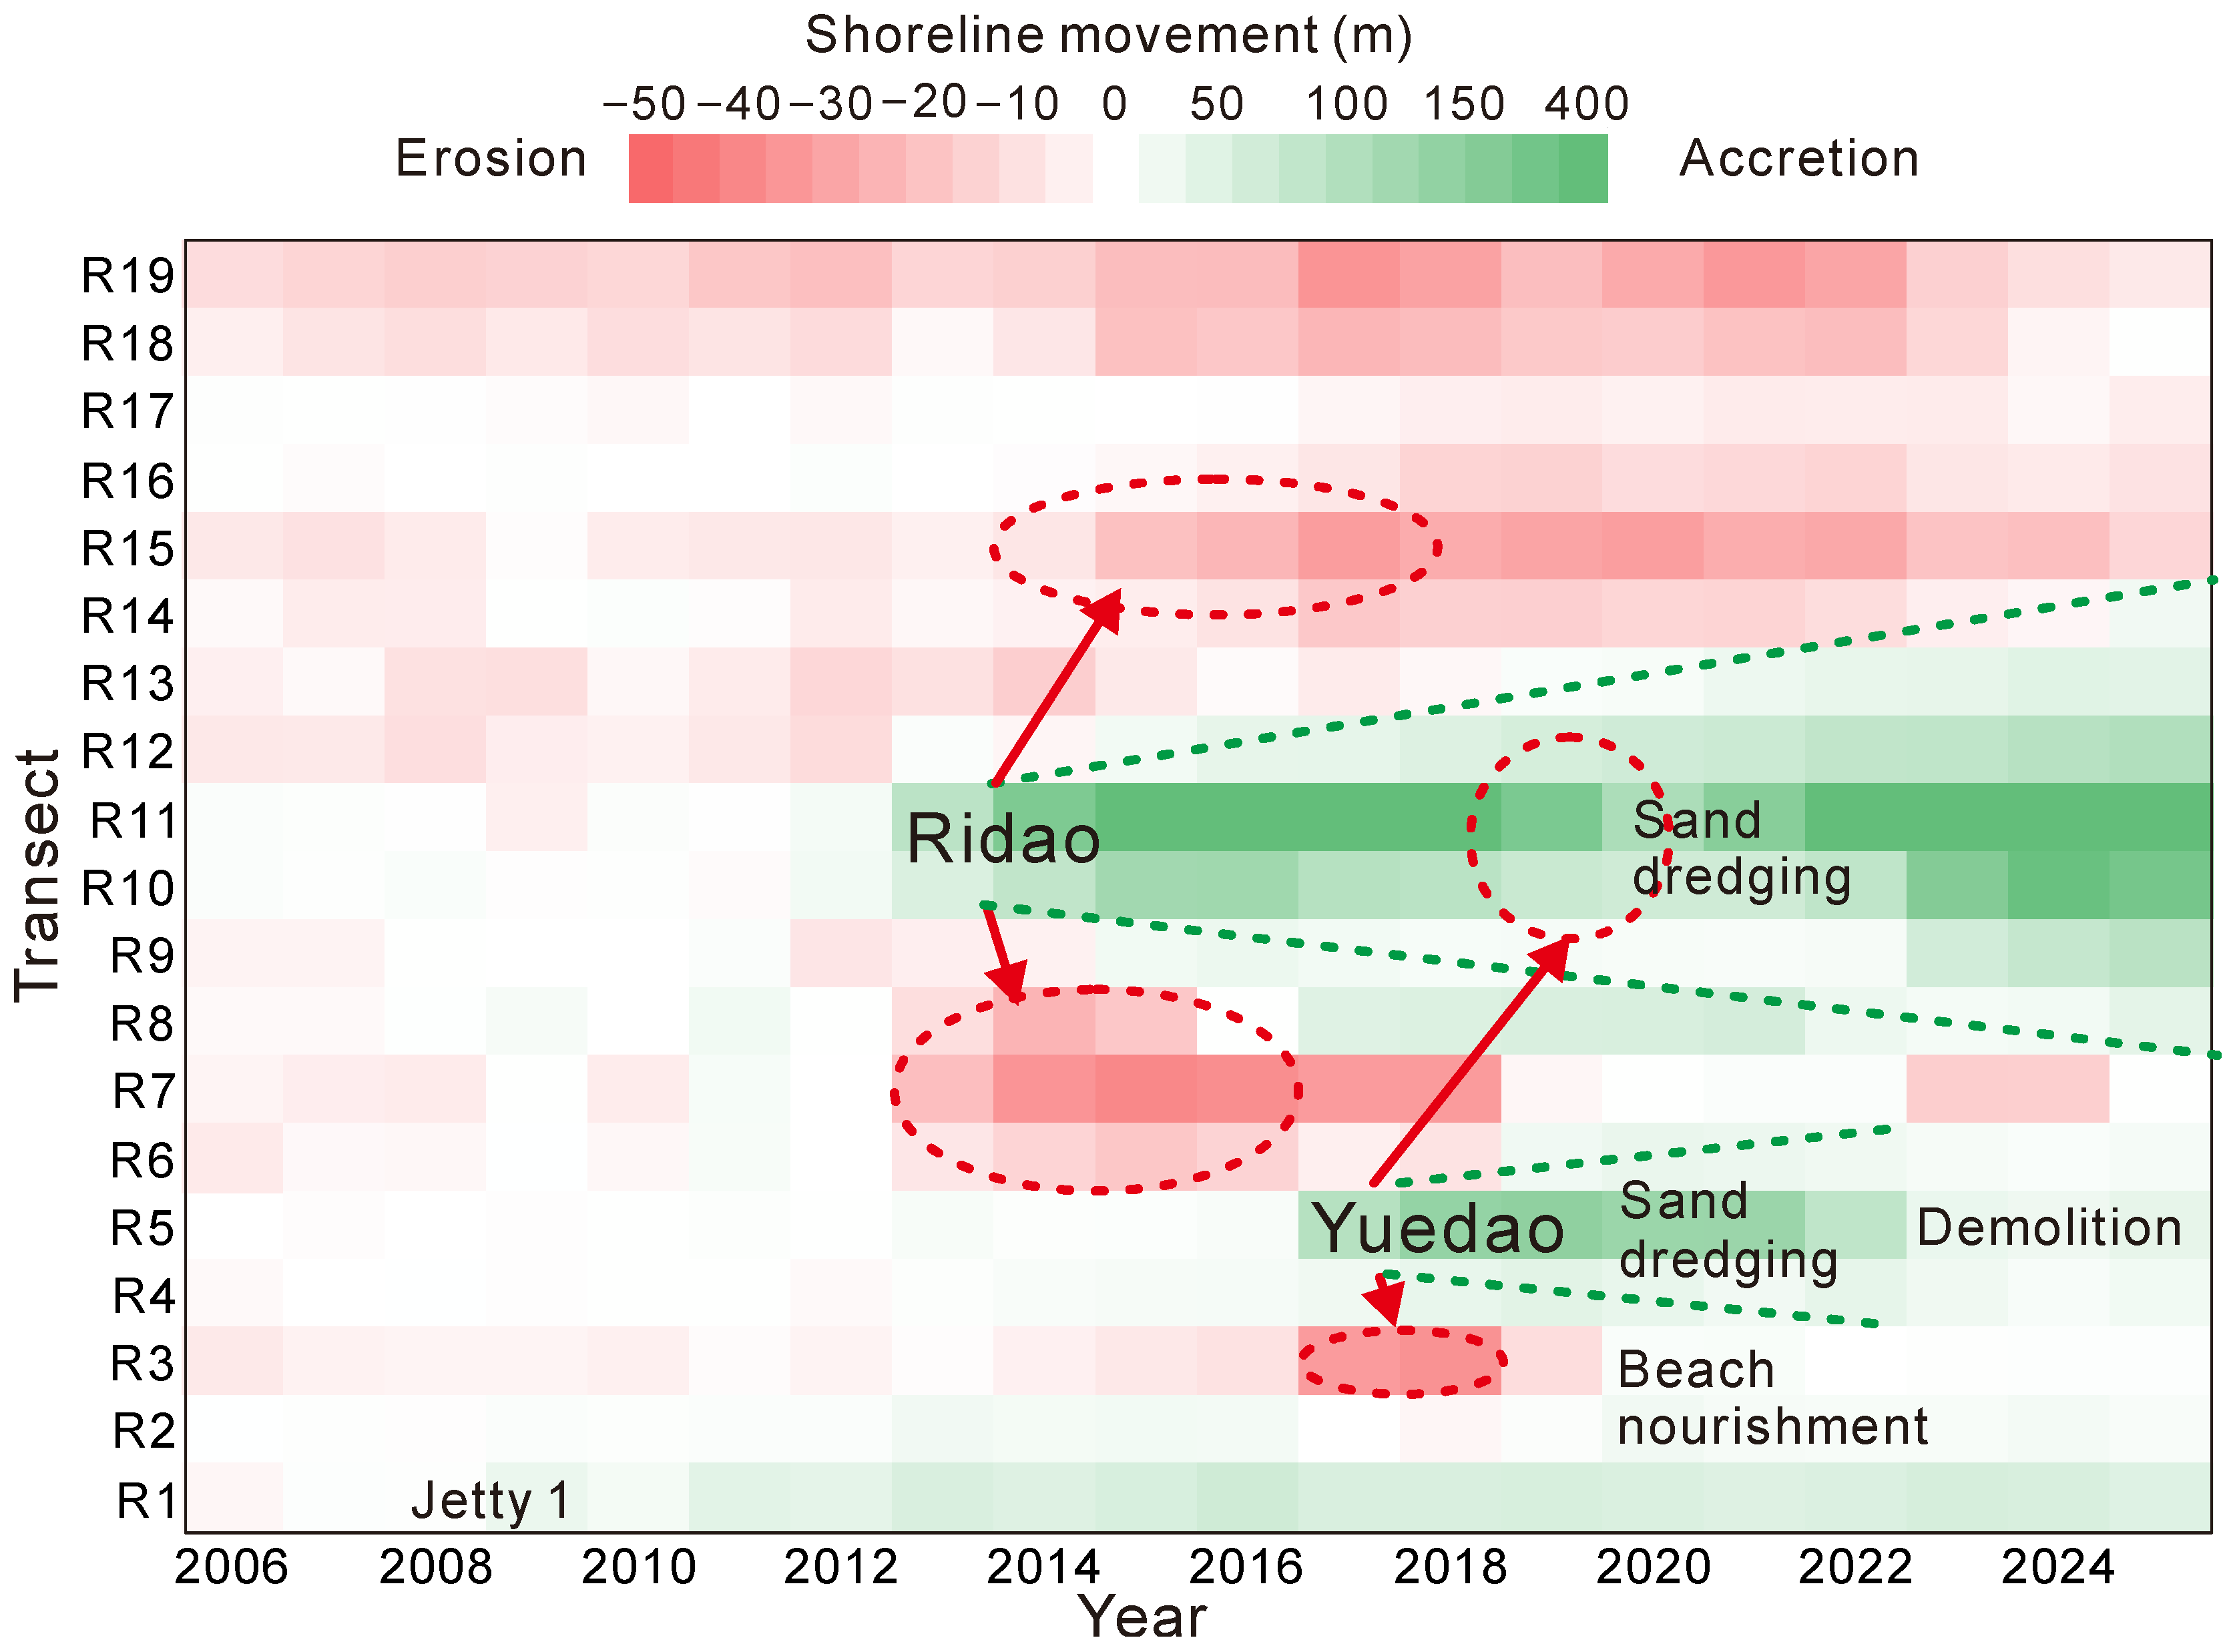
Water-level-corrected mean water positions from 2005 to 2025 reveal a distinct spatial–temporal shoreline change in Riyue Beach (
Figure 9). The largest and most frequent excursions occur at R5, R10 and R11, all showing a net progradation. R11 advanced up to 400 m, chiefly after Ridao Island was built and again after Yuedao Island was removed; R10 gained ~200 m during the same intervals. R5 accreted 180 m within two years of Yuedao completion, then retreated almost to its 2016 position following demolition.
Shorelines between R5 and R10 (R6–R9) display more complex, lower-amplitude behavior: immediate, short-lived erosion after Ridao construction; variable response during Yuedao presence; and rapid readjustment after removal. Far-field transects exhibit subtler trends: R1–R2 switched from progradation to erosion when Yuedao was installed; R3 switched from slow erosion to rapid erosion when Yuedao was installed; R4 switched from slow progradation to rapid progradation when Yuedao was installed; R12–R13 shifted from slight erosion to steady accretion after Ridao appeared; and R14–R15 showed no immediate response to the construction of Ridao Island; however, 1–2 years later they shifted from near-stable to erosion.
Additional engineering projects leave clear signatures: Jetty 1 (2008) accelerated accretion at R1–R2; Groin 1 (2019) turned rapid progradation at R4 into erosion; beach nourishment (2019, 2025) produced sudden 50–100 m advances at R2–R3 and R4–R7; and sand dredging (2018, 2019, 2025) caused 100–300 m retreats at R5 and R10–R12. Transects R16–R19 show only minor, periodic changes unrelated to the major projects listed in
Table 1.
4.5. Stage-Wise Shoreline Evolution and Process Drivers
To clarify the drivers of shoreline change, we divided the 21-year record into four engineering-based stages (
Figure 10):
Stage 1—Pre-construction of Ridao Island (2005–2012)
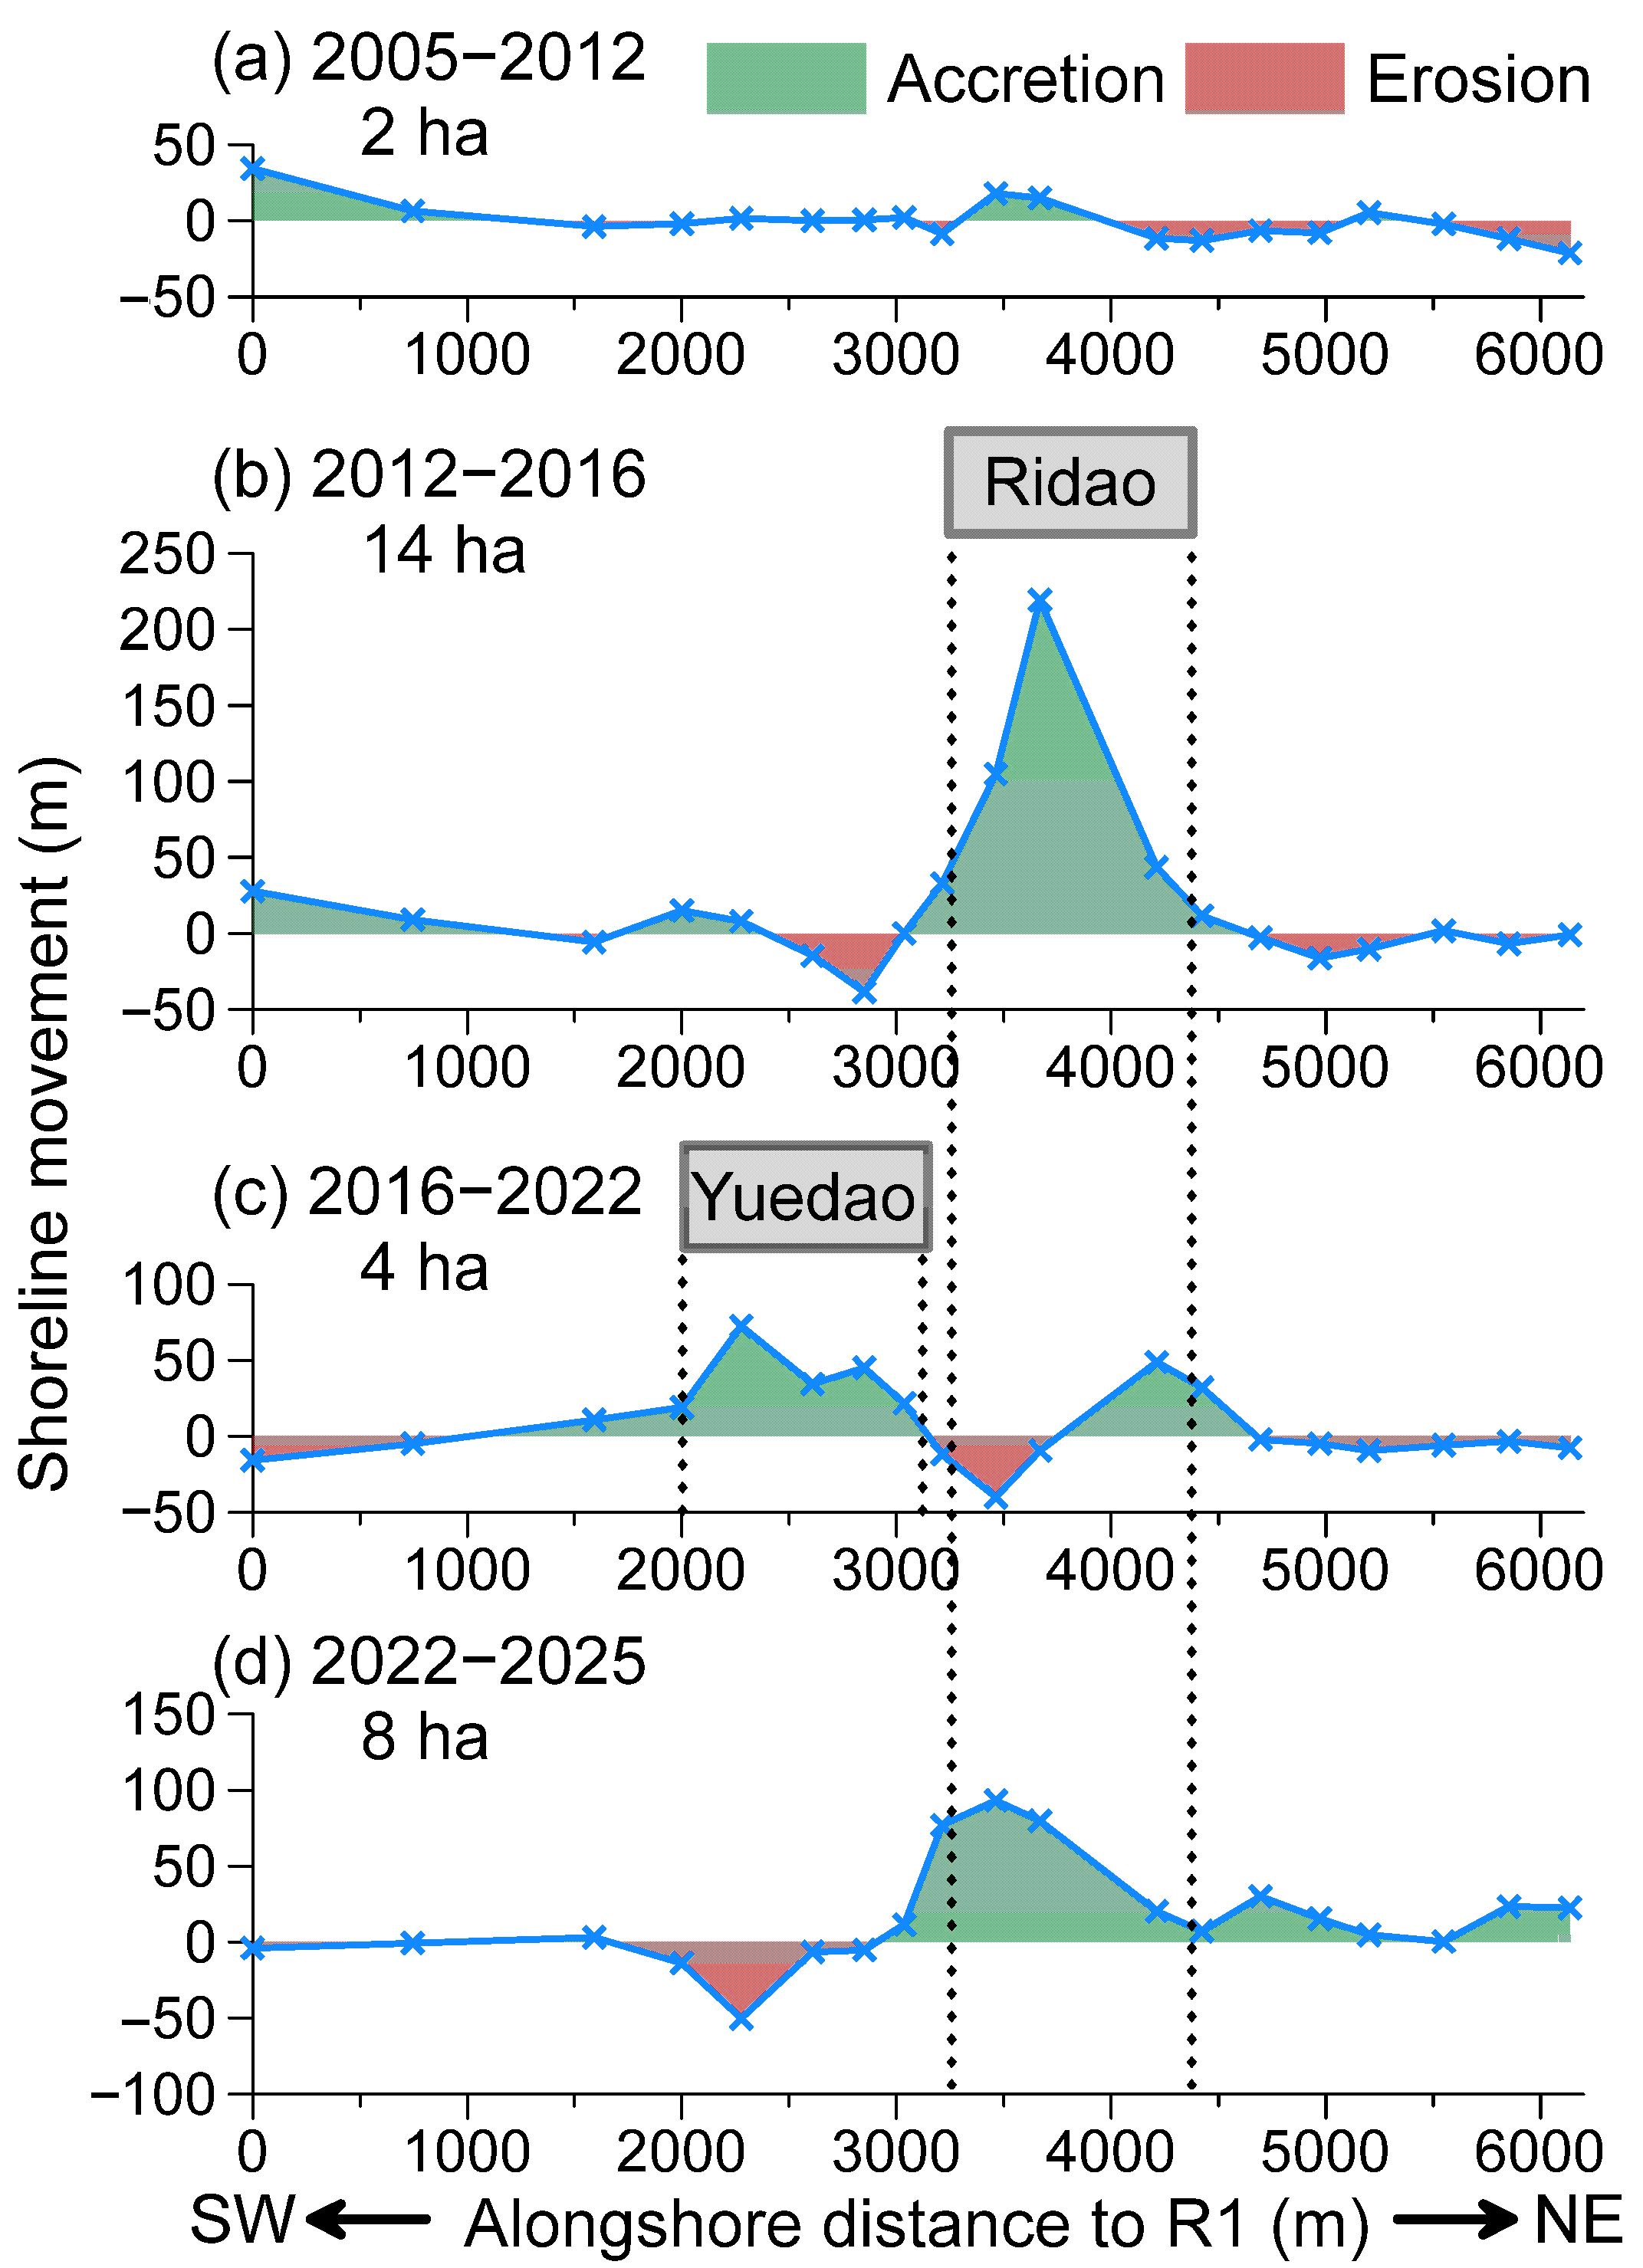
Natural baseline: shoreline change was minor and balanced; slight net progradation in the south-west (R3–R11) and slow erosion in the north-east (R12–R19), except for the Jetty-1-induced progradation at R1–R2.
Stage 2—Post-Ridao construction (2012–2016)
Most dynamic period: rapid accretion up to 86 m yr
−1 at R11 opposite the island (
Figure 9); simultaneous erosion (<40 m) on both flanks (R6–R8, R14–R16). The accretion zone gradually expanded to R8–R14 while erosion pockets shrank and even flipped to progradation at R8 and R14.
Stage 3—Post-Yuedao construction (2016–2022)
Along-shore coupling period: accretion maximum shifted to R5 (62 m yr
−1) opposite Yuedao (
Figure 9); the former rapid progradation at R10–R11 slowed or reversed. Far-field shoreline at R1–R2 stabilized or slightly eroded.
Stage 4—Post-Yuedao demolition (2022–2025)
Reverse period: R5 flipped to severe erosion (–137 m yr
−1 in year 1) once the Yuedao Island was removed. Ridao-facing beaches immediately rebounded: R11 prograded 82 m yr
−1 and R10 56 m yr
−1—exceeding Stage-2 rates (
Figure 9).
Integrating each transects’ control length, the four stages yielded net areal gains of 2, 14, 4 and 8 ha, respectively, for a cumulative 29 ha (roughly 40 standard football fields), of which 27 ha were acquired after the construction of Ridao Island. This confirms that artificial-island impacts dominate the long-term shoreline evolution of Riyue Beach.
5. Discussion
5.1. How Offshore Artificial Islands Drive Shoreline Change
The stretches of Riyue Beach least affected by artificial-island construction and other engineering projects are the shorelines opposite transects R16–R17 and the early-period records at R3–R5 and R18–19. Analysis of these segments indicates that, under natural conditions, the shoreline is essentially stable with a slight erosional bias—most likely driven by global sea-level rise and wave-height increases associated with climate change. This near-stable baseline provides an ideal setting for isolating and quantifying the impacts of offshore artificial islands on adjacent shoreline evolution.
Against this near-stable baseline, the two artificial islands dominate modern shoreline change. To further clarify the impacts, we computed the cumulative annual shoreline movements along transects R1–R19 from 2005 to 2025 (
Figure 11). After Ridao Island was completed, a salient grew opposite the island at 86 m yr
−1 while its flanks (R6–R8, R14–R16) eroded (
Figure 9,
Figure 10b and
Figure 11). The pattern is consistent with wave-sheltering by the 870 m-long island: there was reduced breaking-wave height and enhanced deposition in the lee, whereas the island and the growing salient intercepted east- and west-directed littoral drift, depriving adjacent sectors of sediment. As the salient continued to grow, wave energy over the previously eroding flanks dropped below the transport threshold, triggering a “feedback switch” from erosional shadow to secondary shelter that allowed these sectors to re-accrete (
Figure 9 and
Figure 11)—a phenomenon also reported in earlier modelling studies [
20,
21].
Yuedao Island produced a similar but smaller-scale response: 180 m of accretion at R5 (62 m yr
−1) and 30–50 m of erosion at R3 and R9. Importantly, its construction reversed the rapid progradation at R10–R11 that had persisted since 2013 (
Figure 9). This cross-shore coupling of two neighboring islands ~200 m apart shows that the littoral cell is laterally coupled; when Yuedao trapped summer south-wave sediment (
Figure 3), Ridao’s salient immediately starved. Conversely, removal of Yuedao in June 2022 re-opened the sediment pathway and R10–R11 rebounded to 82 m yr
−1 accretion—faster than the original rate—while R5 eroded 137 m yr
−1, returning almost to its 2016 position (
Figure 9). Given that Yuedao’s erosive impact on adjacent shorelines is unlikely to persist indefinitely, its complete removal may not represent the optimal management decision.
Conversely, Ridao Island also influenced shoreline change around Yuedao Island. The crescent-shaped Yuedao Island has two near-shore points/salients, located near R5 and R8 (
Figure 1). Although the shoreline adjacent to R8 accreted after Yuedao Island was built, this progradation lasted less than two years (
Figure 9). This short-lived response is attributed to Ridao Island and its associated salient or tombolo trapping southwestward-moving sediment during autumn, winter and spring (
Figure 3).
The nearly symmetrical impact of the two offshore artificial islands on their adjacent shorelines (
Figure 9 and
Figure 11) is likely linked to seasonal variations in river sediment supply and wave direction (
Figure 2 and
Figure 3). Riverborne sediment from local catchments reaches the nearshore almost exclusively during autumn (
Figure 2b), but the prevailing waves at that time are from the ENE (
Figure 3c); thus, the autumn discharge of the Lingshui River—the fourth largest on Hainan—and of the unnamed small river next to Riyue Beach is not driven directly toward the study site. Only when southerly waves dominate in summer can these fluvial sediments be resuspended and transported to Riyue Beach. Moreover, south-wave events are limited to summer and are short-lived, whereas ENE waves persist through autumn, winter and spring. In short, seasonal mismatch between sediment supply and wave direction produced the symmetric along-shore response.
It should be noted that the above interpretations or hypothesis are primarily based on the strong spatiotemporal correspondence between remotely sensed shoreline changes and the construction/removal timeline of the artificial islands, integrated with regional hydrodynamic and fluvial sediment data, as well as insights from our prior studies on similar artificial island systems. While internally consistent, these inferences would benefit from further validation through direct field measurements and model study of nearshore sediment transport and morphodynamics.
5.2. Critical D/L Threshold for Salient–Tombolo Transition
There is now broad agreement within both academia and industry that offshore artificial islands influence adjacent shoreline change; however, the magnitude of that influence and whether the opposite coast will evolve into a salient or a tombolo remain uncertain. The general rule is that the shorter the island’s offshore distance (D) and the longer its alongshore length (L), the more likely a tombolo is to form. The main difference among existing studies lies in their proposed threshold for the D/L ratio. Literature thresholds decrease progressively: 2.0 [
22], 1–1.54 [
23], 1.0 [
24], 0.67–1.5 [
25], and 0.8 [
26]; when the D/L ratio exceeds the threshold a salient is expected, otherwise a tombolo should form (
Table 4).
Ridao Island (D/L = 0.44) fulfilled the most restrictive criterion and produced a tombolo 4 years after construction, despite two dredging episodes that temporarily cut the connecting spit (
Figure 6d,e). Yuedao Island (D/L = 0.43) was approaching the same fate: progradation at R5 averaged 62 m yr
−1. Had the island been left in place and mining ceased, a tombolo would have closed within ~7 years. The agreement supports Ming & Chiew’s D/L ≤ 0.8 rule [
26] as a reliable predictor for artificial islands on sediment-rich coasts.
Guanyin Island, a smaller circular island upgraded from 140 m to 200 m length in 2018, provides a contrasting example [
11]. Before the 2018 extension the D/L was 1.5 (salient); after extension it fell to 0.90 and the shoreline response remained a stable salient, confirming that values slightly above 0.8 still inhibit full tombolo formation. Taken together, the field evidence from Riyue Beach and Guanyin Island brackets the critical D/L to 0.44–0.9, and offers a first empirical benchmark for future island designs.
It should be noted that the canonical D/L criterion was originally developed based on studies of small-scale, linear, shore-parallel breakwaters. In contrast, large artificial islands—particularly those with circular or other non-linear geometries—induce more complex wave diffraction and sediment transport patterns, often resulting in intricate equilibrium shoreline configurations (e.g., the double salient observed seaward of Yuedao Island). Consequently, directly applying thresholds derived from linear structures to island systems risks overlooking critical shape-dependent morphodynamic processes.
Moreover, the quantitative relationships between island geometry (e.g., aspect ratio, orientation) and coastal response remain poorly constrained—a key knowledge gap that calls for dedicated numerical modeling or physical experimentation. Future studies that systematically integrate multiple controlling factors—including island size and shape, D/L ratio, local bathymetry, coastal geomorphology, wave climate, and sediment supply—will be essential to advancing a generalized framework for predicting shoreline evolution around offshore artificial islands.
5.3. Future Evolution of Riyue Beach and Management Implications
With Yuedao Island now removed, its shadow zone has reverted to a near-natural state, but Ridao Island remains active and continues to act as a giant littoral sink. Over the past three years (2022–2025), the shoreline opposite Ridao Island has advanced at up to 82 m yr−1 and the accretion belt has extended 2 km along-shore (R8–R15). Without intervention a new tombolo will form, reconnecting Ridao Island to the mainland and splitting the original bay into two smaller, semi-enclosed pocket bays.
Managers currently delay this outcome by dredging sand from the proximal beach (R10–R12) and by constructing short groins to interrupt long-shore transport (
Figure 1). These measures are expensive, disturb benthic habitats and merely postpone the eventual outcome. Two longer-term, environmentally gentler options exist:
(1) Accept the tombolo trajectory. Allow natural accretion to weld Ridao Island to the shore, creating two pocket beaches. This option eliminates recurring dredging costs, enhances coastal scenery and provides a living laboratory for island-coast interaction research.
(2) Maintain Ridao as a true island. Build hard barriers near R11 and R12 between the island and the mainland. This would block sediment incursion, preserve the island’s insular status and still generate two smaller bays, but at a higher capital expense.
From economic, ecological and aesthetic perspectives, Option 1 is recommended. Accepting tombolo formation converts the ongoing maintenance problem into a natural asset, aligns with Hainan’s “ecological island” policy and offers a globally rare example of a large artificial island voluntarily allowed to merge with its shore.
While tombolo formation may offer shoreline stabilization benefits, it is not without potential drawbacks. Artificial islands and their associated sediment accumulation can fragment nearshore ecosystems, alter natural littoral drift, and affect recreational beach access—issues particularly relevant in ecologically sensitive and tourism-dependent regions like Hainan. Therefore, such interventions should only be considered within an integrated coastal zone management framework that weighs geomorphic benefits against ecological and socio-economic costs. Future monitoring should focus on salient growth, habitat development, and post-tombolo management to inform similar projects worldwide.
6. Conclusions
By synergizing 884 freely available Landsat and Sentinel-2 images with sub-pixel shoreline detection we quantified the life-cycle impacts of two adjacent offshore artificial islands on Riyue Beach. Our main conclusions are:
(1) Ridao and Yuedao islands both triggered 62–86 m yr−1 progradation in their lee and short-lived flank erosion. Ridao formed a complete tombolo within 4 years; Yuedao would have connected to the mainland in ~7 years if had not been removed. Together the two islands—and Ridao in particular—produced a net areal gain of 27 ha between 2012 and 2025, exceeding half of Ridao’s reclaimed area.
(2) Wave sheltering reduces incident energy and may be a primary driver of leeside deposition at Ridao and Yuedao Islands. As the salient or tombolo expands, it likely disrupts alongshore sediment transport, potentially leading to sand deficits and erosion on the adjacent beach flanks. Once the wave shadow zone widens and wave energy falls below the sediment transport threshold, these formerly eroding flanks may transition from an “erosional shadow” to a “secondary shelter,” facilitating localized re-accretion.
(3) The two islands were laterally coupled: Yuedao’s construction starved Ridao’s shoreline, while Ridao’s growing salient or tombolo limited nourishment at Yuedao’s northern attachment. Removal of Yuedao instantly reinstated rapid accretion opposite Ridao and eroded the former Yuedao salient, demonstrating reversible, along-shore coupling.
(4) Field data encompass the critical D/L ratio for tombolo formation at 0.44–0.9, validating Ming & Chiew’s ≤ 0.8 threshold for large islands on sediment-rich coasts, and provides the first empirical benchmark for future offshore-island designs.
Finally, we recommend allowing Ridao to weld naturally to the mainland, creating two scenic pocket beaches, eliminating recurrent dredging costs and providing a global reference for the sustainable management of offshore artificial islands. Beyond Hainan, this study demonstrates how high-frequency Earth observations can transform our understanding of island–shore interactions over engineering-relevant timescales. The empirically constrained D/L threshold not only validates decades-old design rules but also establishes a replicable methodology for assessing tombolo potential worldwide—particularly in data-scarce regions where field monitoring is limited.
