Article

Spatio-Temporal Characteristics of Ship Carbon Emissions in Port of New York and New Jersey Based on AIS Data

1
College of Naval Architecture and Shipping, Guangdong Ocean University, Zhanjiang 524088, China
2
College of Mathematics and Computer, Guangdong Ocean University, Zhanjiang 524088, China
3
Guangdong Provincial Key Laboratory of Intelligent Equipment for South China Sea Marine Ranching, Zhanjiang 524088, China
4
Guangdong Provincial Engineering Research Center for Ship Intelligence and Safety, Zhanjiang 524088, China
*
Authors to whom correspondence should be addressed.
J. Mar. Sci. Eng. 2025, 13(11), 2199; https://doi.org/10.3390/jmse13112199
Submission received: 22 September 2025 / Revised: 9 November 2025 / Accepted: 13 November 2025 / Published: 19 November 2025
(This article belongs to the Section Ocean Engineering)

Abstract

Shipping is a major source of carbon emissions and faces an urgent need for decarbonization. Research on vessel carbon emissions not only characterizes regional emission patterns but also provides critical evidence for targeted mitigation policies and optimized maritime management. This study quantifies vessel carbon emissions in the Port of New York and New Jersey from February to November 2023 using Automatic Identification System (AIS) data combined with the STEAM model. An activity-weighted spatial allocation method was applied to distribute emissions across 100 m × 100 m grids. Emission characteristics were analyzed across four dimensions: vessel type, operational state, temporal variation, and spatial distribution. Results show that total emissions during the study period reached approximately 136,701.8 t, with container ships contributing 62.3% of the total. Berthing operations were identified as the dominant emission source, accounting for 73.4% of total emissions, followed by tugboats and cargo vessels. Temporally, emissions peaked in October (10.8%) and were lowest in February (8.8%), reflecting variations in trade intensity and seasonal weather conditions. Spatially, emissions exhibited strong clustering around terminal berths. A sensitivity analysis was performed to assess the robustness of the emission estimates. When the load factor (LF) varied by ±10%, total emissions changed by only ±1.85%, indicating that the results are highly stable and robust. This limited variation arises from the dominance of berthing operations with relatively steady auxiliary loads and the application of the constraint LF ≤ 1, which prevents unrealistic overloading. These findings offer indicative insights that can inform port-level emission management and serve as a reference for future low-carbon policy development.

1. Introduction

Maritime transport is central to the global trade and logistics system, underpinning the world economy and stabilizing supply chains. Over 80% of international trade by volume is carried by seaborne transport, and this share has continued to rise [1]. However, this vital economic activity has a significant environmental cost, particularly greenhouse gas (GHG) emissions [2,3]. The International Maritime Organization (IMO) reported in 2020 that the shipping sector emitted 1056 million tonnes of CO2-equivalent annually, representing 2.89% of global emissions [4]. Notably, about 70% of vessel CO2 emissions occur within 400 km (about 216 nautical miles) of coastlines, concentrating impacts in nearshore waters [5]. Such high-intensity emissions degrade regional air quality and have multifaceted adverse effects on human health and sustainable development. If not effectively mitigated, these emissions will pose serious threats to ecosystem stability and public health [6].
The international community has increasingly recognized the urgency of reducing global carbon emissions, with the shipping and aviation sectors identified as potential fast-growing sources of greenhouse gases [7,8]. The maritime sector, therefore, faces the dual challenges of decarbonization and a transition to cleaner energy carriers, making rapid and substantial emission reductions especially urgent. In 2023, the IMO set two principal targets: a 40% reduction in shipping carbon emissions by 2030 relative to 2008 levels, and the pursuit of net-zero greenhouse-gas emissions around 2050 to align with the Paris Agreement’s long-term goals [9]. Vessels operating in and around ports are major emitters: research shows that ship-related emissions in port areas are roughly an order of magnitude greater than emissions from direct port operations [10]. Meanwhile, improving energy efficiency in port operations themselves—through operational strategies, technological upgrades, and energy management systems—also represents a critical pathway to reducing the overall carbon footprint of maritime hubs [11]. To enable time-differentiated mitigation and to reduce pollutant and greenhouse-gas impacts across temporal scales, reliable, high-precision, jurisdiction-specific carbon accounting methods for ships and ports are urgently required.
As the world’s largest economy, maritime transport serves as the primary mode for U.S. international trade, and carbon emissions from U.S. waters are closely tied to its status as a major maritime power. Although the United States pledged to reduce emissions by 50–52% below 2005 levels by 2030 and set a long-term goal of net-zero emissions by 2050 after rejoining the Paris Agreement in 2021 [12], effectively regulating carbon emissions from ships remains a major challenge that must be addressed on its energy transition path.
In existing research, ship carbon emissions are generally represented by CO2 emissions [13]. Estimation methods fall into two categories: the macro-level “top-down” approach and the micro-level “bottom-up” approach [14]. The top-down approach relies on aggregate statistics, exemplified by fuel-consumption-based estimation [15] and trade-activity-based inference [16]. Also known as the fuel-based method, it infers emissions from total fuel sales within a given region [17]. However, by disregarding variations in actual fuel consumption during operations, it often produces substantial uncertainty in regional estimates [18,19,20].
To address these limitations, researchers have developed bottom-up methods that calculate emissions from vessel activity trajectories and real-time operational states (e.g., speed and location), also called activity-based approaches [21]. The power-based method—which uses vessel power as a principal parameter—is the most representative bottom-up technique [22]. The bottom-up approach is widely adopted and considered more precise and reliable [23,24] because it combines detailed vessel attributes (engine power, fuel type, emission factors) with operational data.
AIS provides extensive and reliable navigation records with high temporal and spatial resolution, substantially advancing multidimensional research and applications in ship emission studies—from macro-level policy formulation to micro-level emission control [25,26]. Accordingly, many scholars now develop AIS-based bottom-up emission models, and this approach has become the mainstream technical paradigm for ship emission estimation [27].
Jalkanen et al. pioneered the integration of AIS data with STEAM to derive regional vessel emission inventories for the Baltic Sea [28], Europe [29], and the global ocean [30]. Li et al. [31] developed an ST-DBSCAN-based AIS track-segmentation algorithm and applied STEAM to estimate CO2 emissions within China’s Coastal Emission Control Area (DECA). Weng et al. [32] used STEAM to quantify vessel emissions in the Yangtze River Estuary and analyzed the effects of vessel type, operational mode, emission-control devices, temporal variability, and spatial distribution. Li et al. [33] proposed a Geographic-based Emission Model (GEEM) for high-sea greenhouse-gas estimation and recommended targeted policy measures based on key emission drivers. Sun et al. [34] analyzed distant-water fishing-vessel activities from China, Japan, and South Korea using AIS from 2019 onward and estimated their carbon emissions. Mon [35] estimated the carbon emissions of 48,321 vessels within the U.S. Exclusive Economic Zone (EEZ) using a power-based method based on 3.6 billion AIS reports and analyzed the EEZ’s carbon emissions across three levels: national, regional, and port. He [36] conducted a quantitative assessment of vessel emissions at Long Beach Port using the STEAM model. The results indicate that port vessel emissions primarily originate from auxiliary engines and boilers operating at berths and anchorages. The study further reveals that the outbreak of the COVID-19 pandemic led to reduced port productivity and worsened vessel congestion, consequently causing emissions from these port-based vessels to increase rather than decrease. Xiao [37] based on AIS and vessel data from the ports of Los Angeles and Long Beach in 2020, this study employed a dynamic methodology combined with the STEAM2 model to quantify port vessel emissions and evaluate the actual effectiveness of Emission Control Area (ECA) policies in reducing emissions. Linda Styhre [38] systematically analyzed the greenhouse gas emission characteristics of ships during port stays based on annual data from Gothenburg, Long Beach, Osaka, and Sydney ports. The study revealed a key finding: approximately 50% of ship emissions in these ports stem from operations during the “berthing” phase. The study by Giada Venturini et al. [39] introduces a joint optimization approach for berth allocation and sailing speed to achieve concurrent emission reductions in port areas and at sea. Furthermore, findings confirm that precise speed discretization is key to unlocking superior dual benefits in both cost efficiency and environmental impact. Ye et al. [40] compared integrated river–sea, river-only, and hybrid bottom-up emission models across thirteen common scenarios, showing that adjustments in shipping modes can effectively reduce emissions. Wang et al. [41] applied the enhanced Ship Emission Inventory Model V2.0 (SEIM v2.0) to estimate multiple pollutants (including SO2) from inland waterway vessels and examined interannual trends under rising activity and evolving emission-control policies. Qi et al. [42] constructed a port-vessel carbon inventory from AIS by forming a three-dimensional emission tensor, decomposing it via non-negative tensor factorization (NTF), and discussing tensor-rank selection to extract multidimensional emission features. Finally, Sun et al. [43] employed STEAM on AIS records from selected sections of the Beijing–Hangzhou Grand Canal (2018–2023) to analyze multi-dimensional emission patterns.
Based on the computational advantages of existing methods and previous studies, this study, based on AIS ship trajectory data, adopts the current popular model STEAM (e.g., Jalkanen [28], Mou [35]) for ship carbon emission measurement as the computational framework to estimate the ship carbon emissions at the Port of New York–New Jersey from February to November 2023. This study’s “primary objective” is to examine the structural composition of vessel carbon emissions in the Port of New York and New Jersey by operational mode and vessel type, to analyze the spatiotemporal distribution of port emissions, and to reveal spatial characteristics of emissions so as to provide directional guidance for relevant authorities in the formulation of science-based mitigation strategies.
The “research gap” refers to the fact that existing studies have predominantly concentrated on vessel-type and temporal distributions of port emissions while neglecting the spatial characteristics of vessel carbon emissions and insufficiently accounting for the influence of external environmental factors (e.g., wind, waves, currents) on emission estimates. This study’s “novelty of the research” lies in the application of a refined framework for vessel emission estimation and spatial allocation: we apply STEAM to quantify emissions in the Port of New York and New Jersey and adopt an activity-weighted allocation to distribute emissions onto high-resolution 100 m × 100 m grid cells. This approach improves the precision of emission mapping, elucidates the spatiotemporal patterns of emissions, and enriches the empirical evidence on vessel emissions for U.S. ports.
The remainder of this paper is organized as follows: Section 2 details data preprocessing, carbon emission estimation, and spatial allocation methods; Section 3 conducts an in-depth analysis of carbon emission characteristics across four dimensions—time, space, vessel type, and operation states; Section 4 presents research findings, discusses policy implications, analyzes limitations, and outlines future research directions. Finally, Section 5 summarizes the study’s contributions and outcomes.

2. Materials and Methods

2.1. Study Area

The Port of New York and New Jersey is a world-renowned natural deepwater harbor and a principal freight hub in North America, handling substantial cargo volumes. As the core port on the U.S. East Coast, its operational capacity exerts significant global influence [44]. The port comprises six container terminals, two cruise terminals, three auto terminals, and multiple public berths, and it handles container, roll-on/roll-off (Ro-Ro), bulk, break-bulk, and specialized project cargo [45].
The study area covers portions of the Port of New York and New Jersey (Figure 1), between 74°3′21.384″ W and 74°11′41.244″ W, and 40°38′6.72″ N to 40°42′19.296″ N. It primarily includes Port Newark Container Terminal, APM Terminals, Port Liberty New York Terminal, Maher Terminals, and Port Liberty Bayonne Terminal.

2.2. Materials

2.2.1. Data Collection

The vessel AIS data used in this paper was obtained from the publicly available database provided by the U.S. National Oceanic and Atmospheric Administration (NOAA) (https://hub.marinecadastre.gov/pages/vesseltraffic, and accessed on 26 October 2024), with a complete download of data from February to November 2023 to ensure the continuity of the analysis sample. Regarding the sampling frequency, according to the official NOAA website description, the data interval is 1 min. The downloaded data fully complies with the website specifications. AIS data include both static and dynamic vessel fields (Table 1). Static fields primarily include vessel identifiers and attributes such as MMSI, IMO number, and physical dimensions. Dynamic fields comprise time-varying navigational parameters—e.g., latitude, longitude, timestamps, and navigation status—recorded during vessel operations.

2.2.2. Data Cleansing

AIS data often contains noise, missing values, redundancy, and inconsistencies arising from satellite positioning errors, signal interference, manual entry mistakes, and system failures. Combined with complex navigation environments, these factors lead to raw datasets with numerous errors and ambiguities, potentially compromising the accuracy of subsequent carbon emission calculations. To ensure data quality and the reliability of emission estimates, raw AIS data undergo systematic cleaning. For instance, records lacking an MMSI or containing MMSIs with fewer or more than nine digits were excluded, as were records with speeds outside the specified threshold. Detailed cleaning criteria are provided in Table 2. Original AIS data comprised a total of 24,111,553 track records. After data cleansing, the number of tracks decreased to 20,262,487, representing a reduction of 15.96%. Among these, erroneous data, incomplete data, and duplicate data accounted for approximately 14.55%, 1.4%, and 0.02%, respectively.

2.2.3. Remove Outlier Trajectory Points

Although the data cleaning procedures described in the previous subsection eliminated most anomalous records, trajectory anomalies caused by satellite positioning errors and other factors persisted. To address this issue, vessel movement trajectories were constructed using AIS elements such as BaseDateTime and latitude/longitude. Points exhibiting trajectory anomalies—such as those deviating significantly from the overall trajectory trend (Figure 2) or erroneously located on land—were subsequently removed.
This study generates track points based on latitude/longitude coordinates from AIS data within ArcGIS Pro 3.5.0 software (WGS-84 coordinate system). All track points falling on land are directly excluded to ensure subsequent analyses include only valid data within maritime areas.
In AIS data, sorting all points with the same MMSI in ascending order of BaseDateTime yields a point set representing the vessel’s trajectory, as expressed in Equation (1).
Trajectorie M M S I = P t 1 ,   P t 2 ,   ,   P t i ,   P t i + 1 ,   ,   P t n 1 ,   P t n
P t i = M M S I ,   L a t ,   L o n ,   L e n g t h ,   W i d t h ,   B a s e D a t e T i m e
In the formula, P t i denotes the track point recorded at time ti in the AIS, containing the complete AIS information recorded. ti is the reporting time of the vessel track point, and t 1 , t 2 , , t i , t i + 1 , , t n 1 , t n is a strictly monotonically increasing sequence.  P t i must satisfy Formula (3).
l o n i l o n ¯ 2 σ l o n ,   l o n ¯ + 2 σ l o n l a t i l a t ¯ 2 σ l a t ,   l a t ¯ + 2 σ l a t
where l o n ¯ and l a t ¯ represent the average latitude and longitude values of all trajectory points in Trajectorie M M S I , respectively, while σ l a t and σ l o n denote the variances of latitude and longitude (units: square degrees, (°)2).

2.2.4. Data Interpolation

AIS data collection often exhibits uneven message intervals. Previous studies indicate that missing vessel track points typically follow a random distribution pattern, with substantial variability in the extent of data gaps [46]. The time gap between consecutive messages may range from a few seconds to several minutes. Such irregular temporal resolution can lead to data discontinuities during certain periods, thereby reducing the accuracy of vessel carbon emission calculations. To address this issue, this study employs an interpolation algorithm that incorporates vessel dynamics, as referenced in Huang [47], to improve the accuracy of subsequent carbon emission estimates.
To ensure calculation accuracy, in this study, a data interpolation density of 1 min was set for the trajectories of ships with speeds higher than 1 knot, aiming to obtain motion states with high temporal resolution. Taking the trajectory of MMSI 338240818 as an example, Figure 3 shows the comparative analysis results between the interpolated trajectory and the original trajectory.

2.3. Methodology

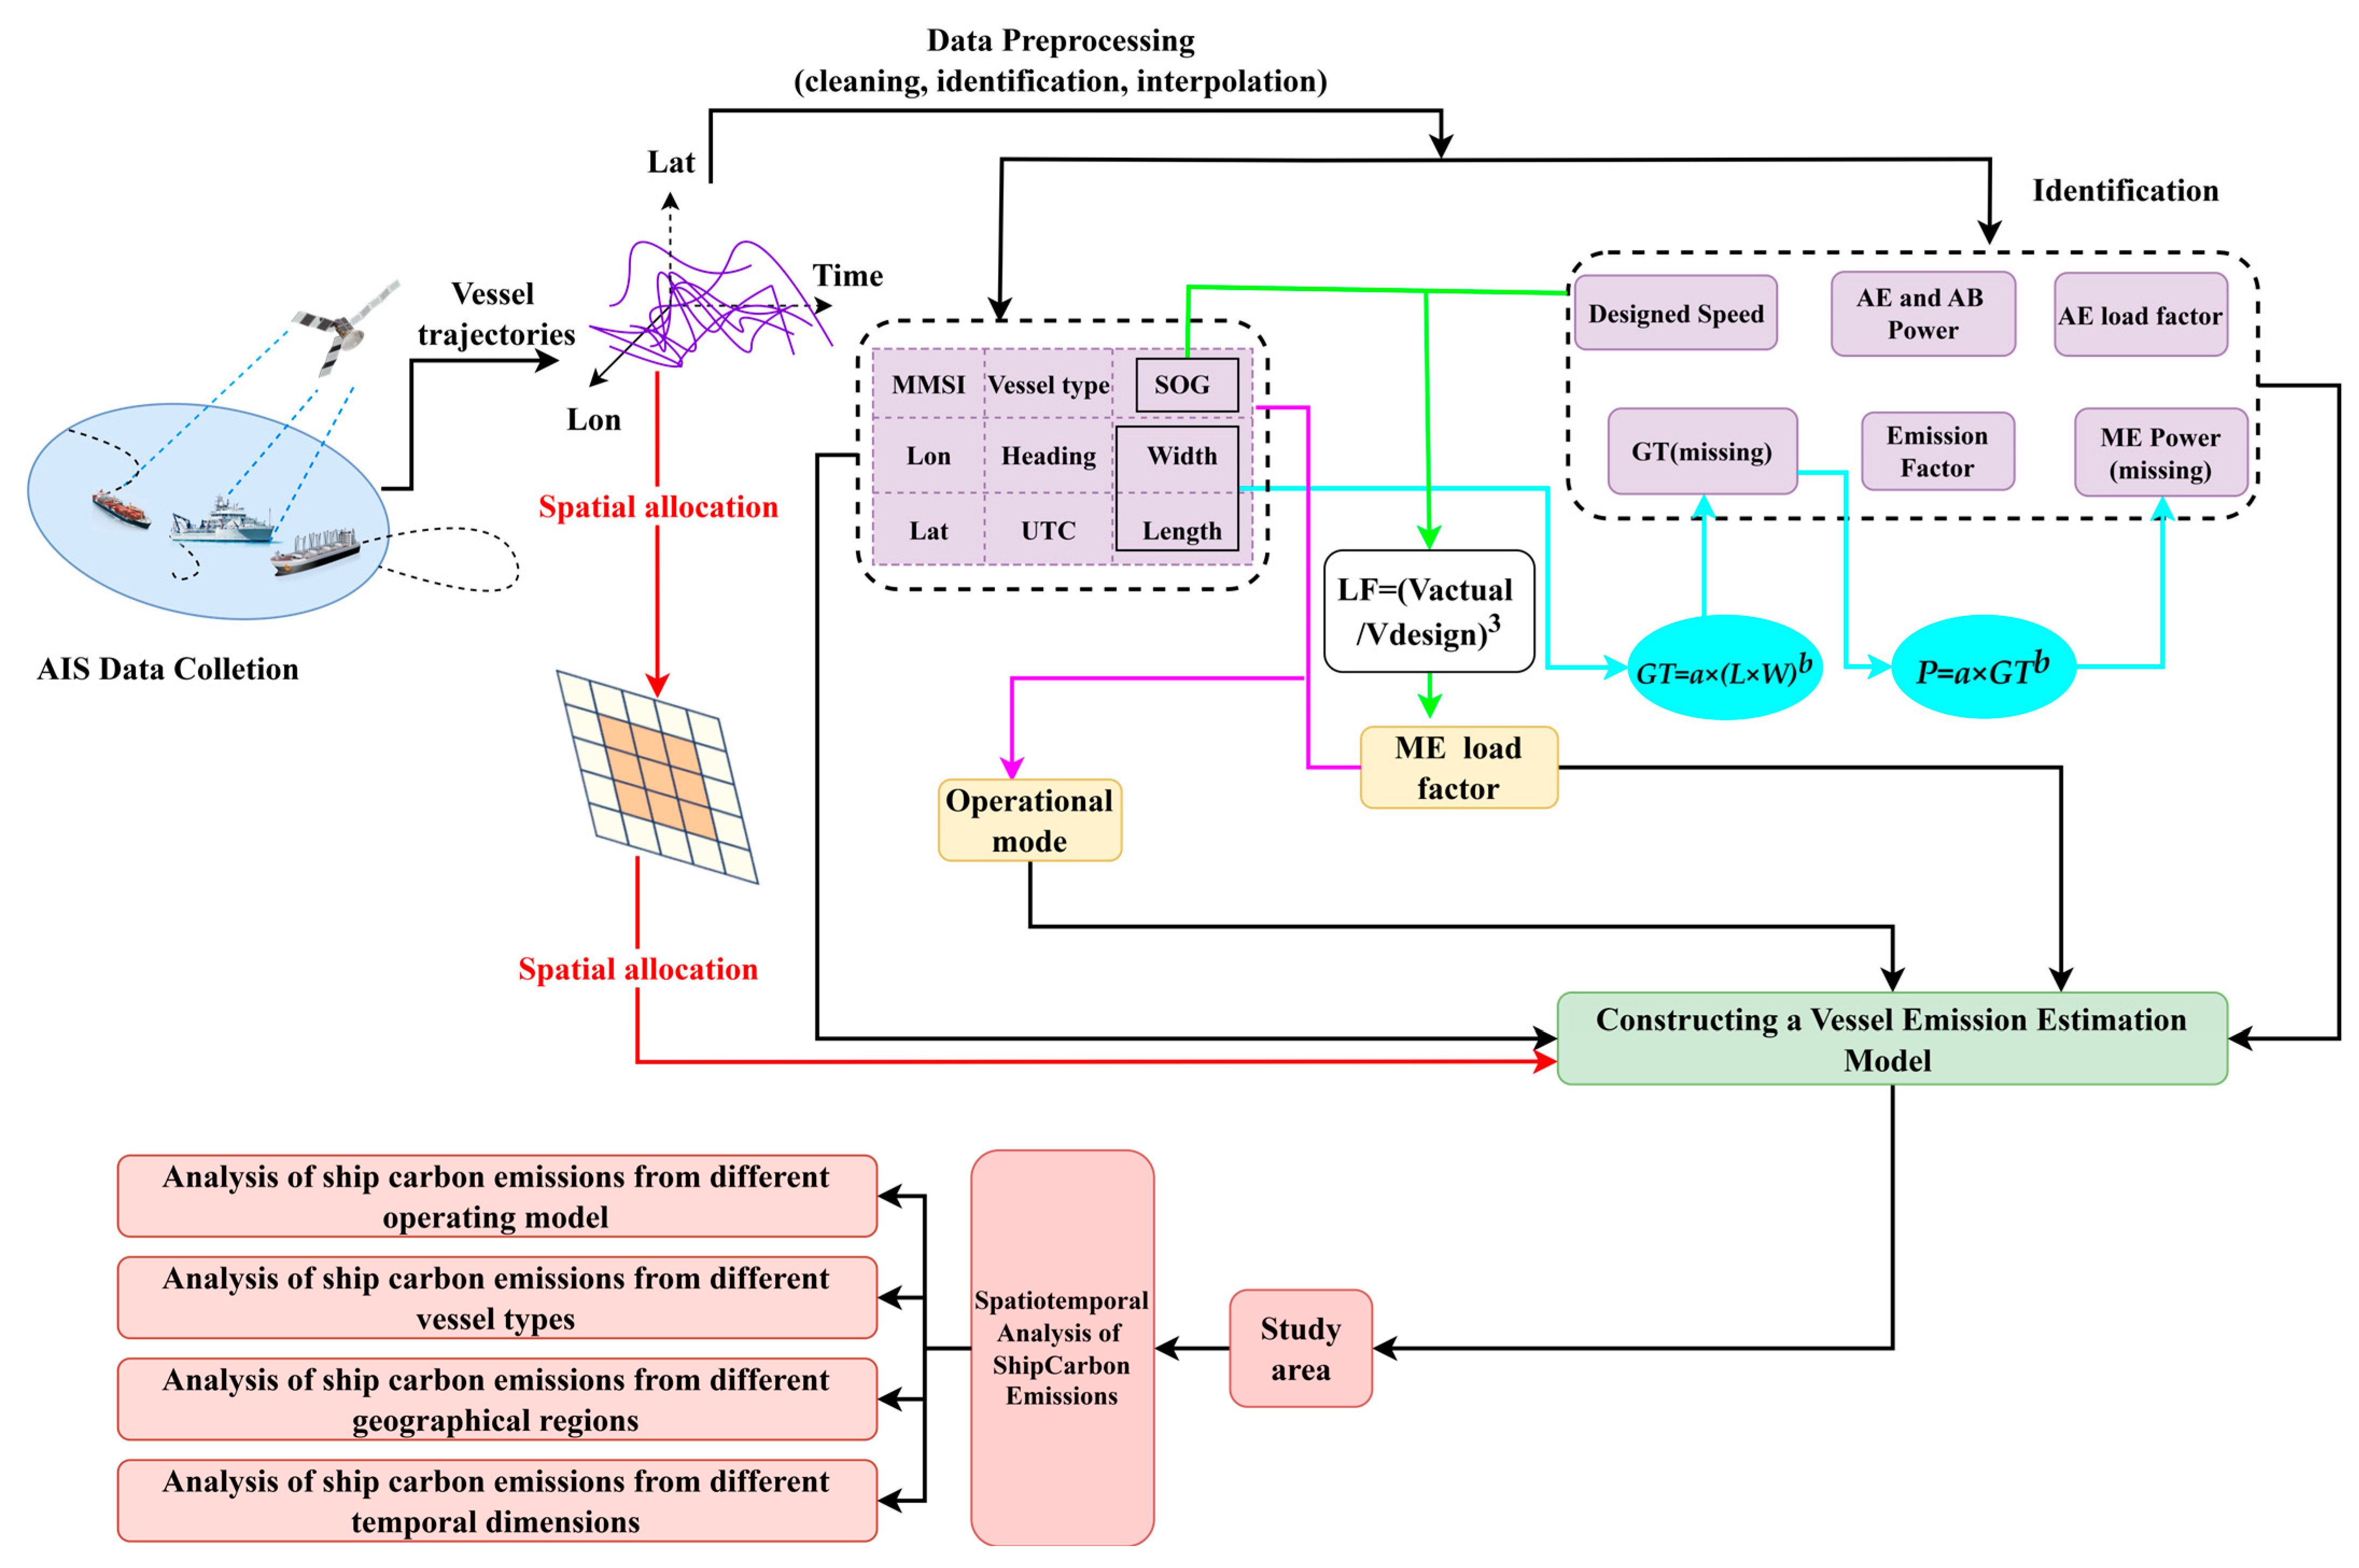
This study develops a high-resolution framework for estimating port-vessel carbon emissions and for analyzing their spatiotemporal patterns. First, AIS records and vessel-equipment attributes for the study area were collected and preprocessed (data cleaning, interpolation, and vessel/operation identification). Next, vessel track segments derived from AIS are spatially allocated to 100 m × 100 m grid cells using an activity-weighted scheme. Finally, port-vessel carbon emissions are computed with STEAM and analyzed to reveal multidimensional emission characteristics. The complete operational workflow is illustrated in Figure 4.

2.3.1. Calculation of Ship Carbon Emission Based on AIS

This study utilizes vessel AIS data from February to November 2023 and collects vessel equipment information—including gross tonnage and main engine power—from the Vessel Value Visualization database (https://voc.myvessel.cn/position, and accessed on 29 October 2024). By integrating information from online databases such as Vessel Value Visualization, vessels are categorized into six types: cargo ships, container ships, oil tankers, bulk carriers, tugs, and other vessels. Port vessel carbon emissions are calculated using a power-based STEAM model [35], incorporating emissions from three source categories: main engines, auxiliary engines, and boilers. The calculation formula is as shown in Equations (4)–(7): [48]
E = E M E + E A E + E A B
E M E = o s = 1 5 P M E L F M E E F M E A L F ( T i + 1 T i ) 10 6
E A E = o s = 1 5 P A E L F A E E F A E ( T i + 1 T i ) 10 6
E A B = o s = 1 5 P A B E F A B ( T i + 1 T i ) 10 6
where E represents total carbon emissions (t) and E M E , E A E , and E A B represent the emissions from the main engine, auxiliary engine and boiler, respectively (t). os denotes the vessel’s operation states. ME, AE, and AB denote the main engine, auxiliary engine, and boiler, respectively. P denotes power (kW), L F is the load factor, and E F is the emission factor (g/(kW·h)). A L F represents the adjustment factor when L F M E < 20 % . Since CO2 is being calculated, it is a constant value equal to 1. T i + 1 T i indicates the time interval (h) between the AIS reporting times of the i to i + 1 records. Other relational parameters can be referred to Appendix A.
Operation State
The emission characteristics of marine engines are closely associated with their operating conditions, which are strongly influenced by speed fluctuations. To accurately estimate CO2 emissions generated during vessel operations, it is essential to distinguish between different operational states. Following the recommendations of the IMO’s Fourth Greenhouse Gas Study [4], vessels are classified into five operational states based on the relationship between actual speed and Maximum Continuous Rating (MCR), as detailed in Table 3.
Vessel Activity Parameters
In ship carbon emission calculations, activity parameters constitute a critical component, primarily including vessel type, main engine power (ME power), gross tonnage (GT), and design speed. While some of these parameters are obtained directly from the Vessel Value Visualization database, certain data remain unavailable and require supplementation.
(1)
Engine power;
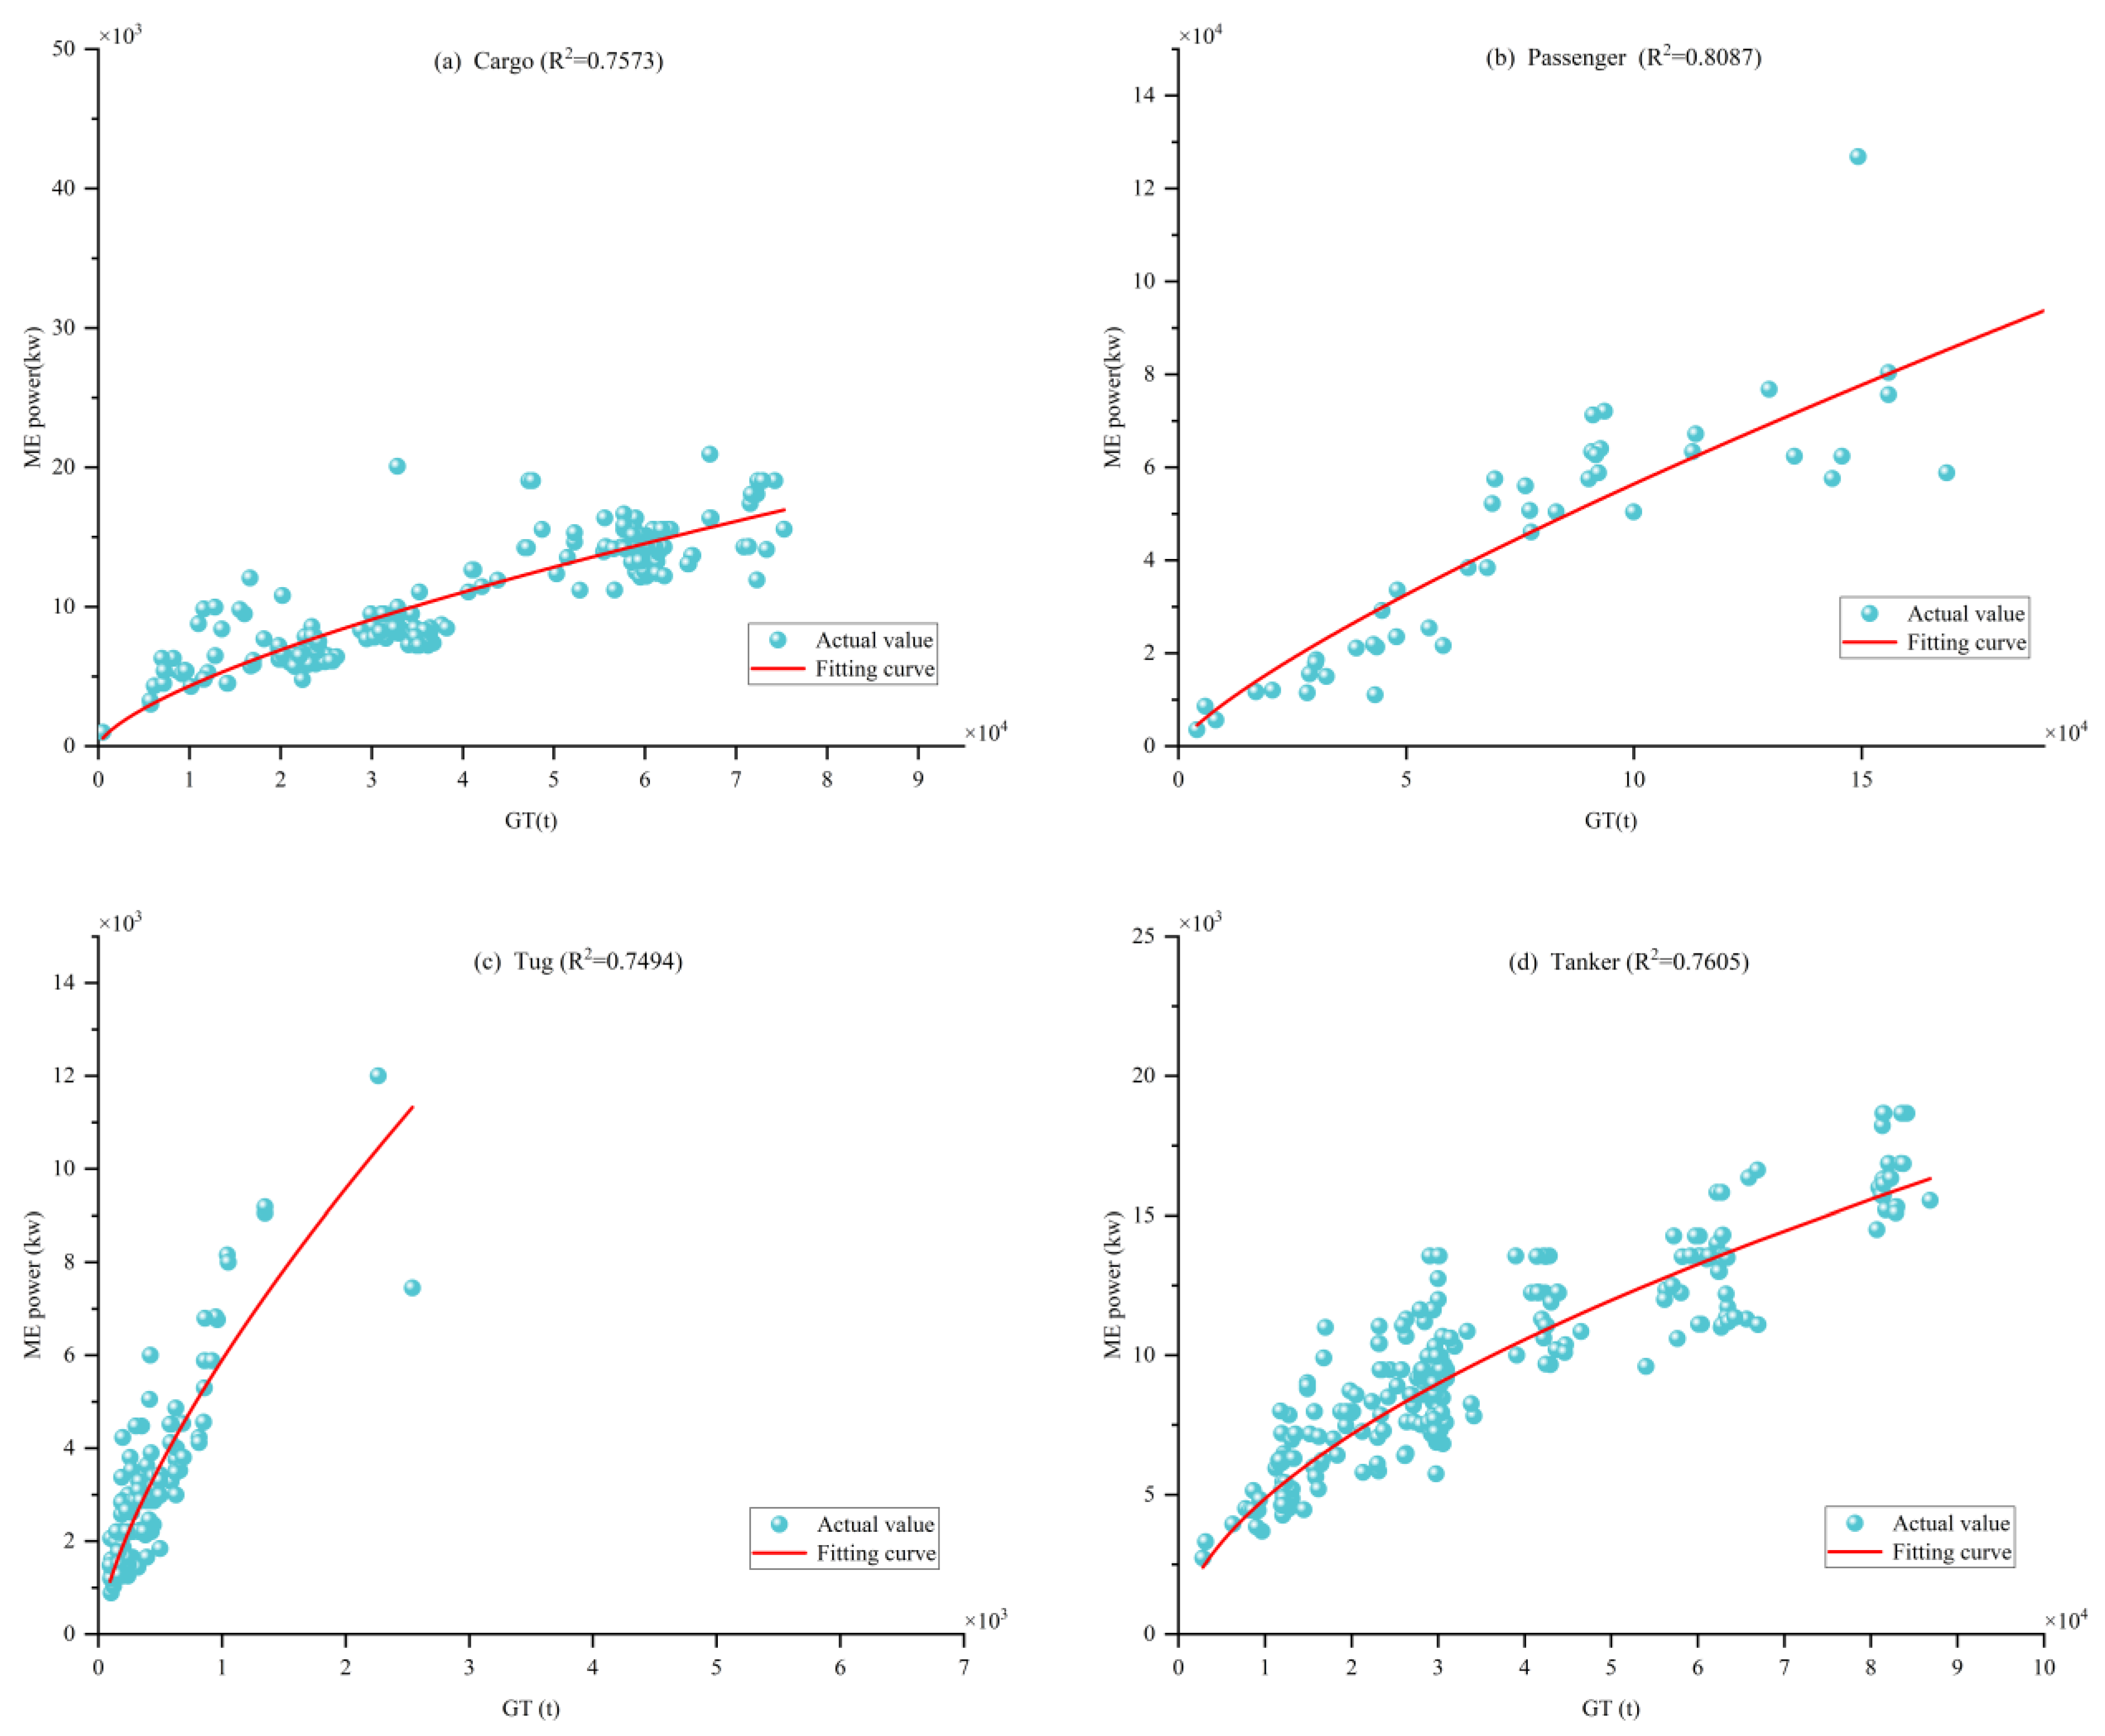
In existing research, methods for estimating main engine power primarily involve comparing the correlation between engine power and parameters such as hull type, main dimensions, and gross tonnage, then approximating the value based on known engine power data [49]. In this study, a correlation analysis was conducted between ME power and various vessel attributes. Results indicate that ME power exhibits the strongest correlation with GT, as shown in Figure 5. Accordingly, when both vessel type and GT data are available, function regression fitting is employed to estimate missing ME power values. Figure 6 presents the regression fitting results for ME power versus GT across different vessel types, with all R2 values exceeding 0.7, demonstrating reliable predictive performance and interpretability.
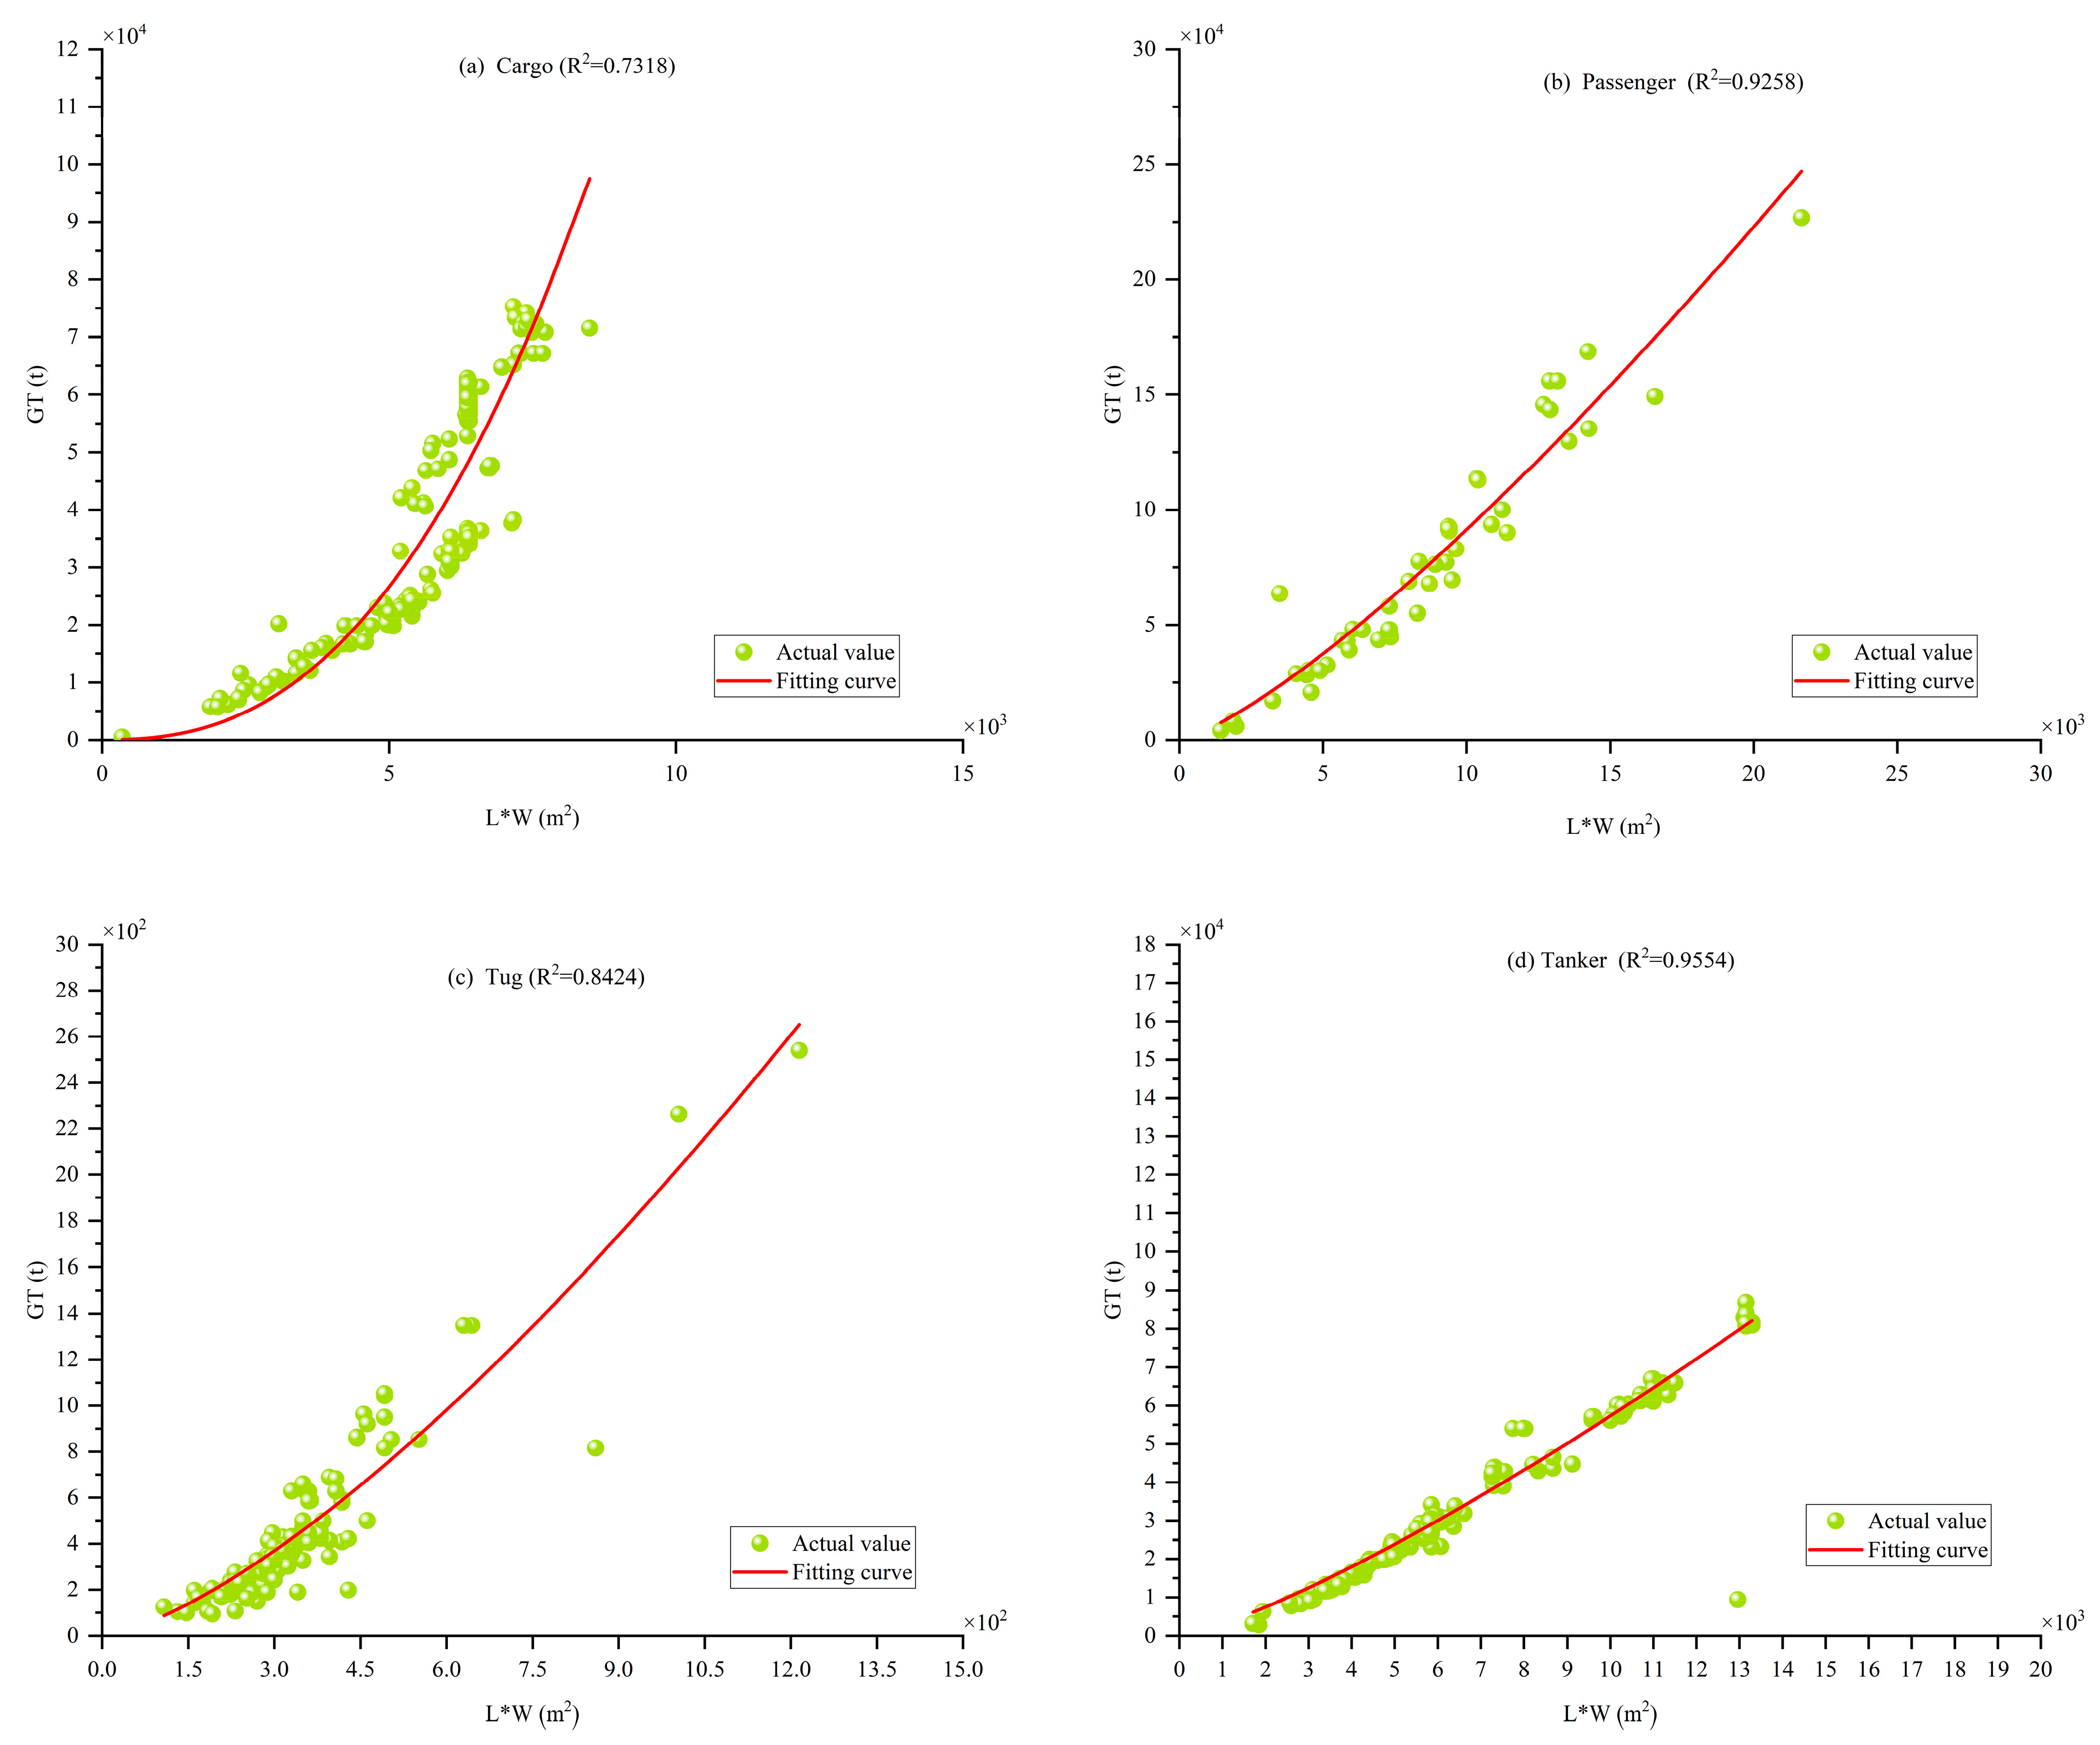
Although most GT data are available, certain vessels lack this information. As shown in Figure 5, GT exhibits the highest correlation with vessel dimensions (Length × Width). To improve data completeness, GT fitting models were developed for different vessel types using vessel dimensions as independent variables. The specific fitting results are illustrated in Figure 7. However, for some vessel types, the available data on ME power and GT represent less than 50% of the total vessel population. As a result, the established fitting relationships are insufficient for accurately estimating the missing GT and ME power values. Therefore, this study adopts the methodology proposed by Cai et al. [50] to supplement missing GT and ME power data for these vessel types. The detailed fitting relationships are provided in Table 4 and Table 5.
For auxiliary engine (AE) and auxiliary boiler (AB) power, the currently available AE and AB power matching rates are significantly lower than those for ME power. Existing studies predominantly estimate AE power based on the power ratio relationship between AE and ME [22]. Accordingly, this study applies the proportional system proposed by Weng [32] and Qi [42], with the corresponding AE/ME power ratios for different vessel types summarized in Table 6. When obtaining a vessel’s design speed, we encountered limitations in acquiring consistent and comprehensive information regarding maximum design speed due to the limited records of such data in the Vessel Value Visualization database and other ship databases. Consequently, this parameter adopts the research findings of Sun et al. [43]. For details, see Table 6.
For missing AB power values, the methods recommended in the IMO Report [4] and by Mou [35] are adopted, using vessel type, GT, deadweight tonnage (DWT), TEU, and operational conditions as input parameters. The detailed calculation criteria are presented in Table 7. “AB power” refers to the auxiliary boiler’s rated thermal output, expressed in kW, and serves as one of the key input parameters for calculating carbon emissions.
(2)
Load factor;
The ME load factor is a critical parameter in ship carbon emission assessment. Based on propeller propulsion characteristics, the ME load factor exhibits a quantifiable relationship with the vessel’s actual speed and maximum design speed [32,42] and is calculated using Equation (8).
L F M E = V A S V M S 3 100 %
where V A S is the actual operating speed of the vessel, and V M S is the maximum design speed of the vessel. The ME load factor is closely related to the speed of navigation, whereas the AE load factor is not directly affected by the speed of navigation. it primarily relates to the operating conditions during navigation. Under different navigation conditions, the load status of auxiliary machinery varies. This study adopts data from Zeng [51] and Cai [50] to determine the load factor for auxiliary machinery, as detailed in Table 8. During cruising or low-speed cruising conditions, fuel oil boilers are typically shut down. Under other operating conditions, it is assumed that fuel oil boilers operate at full capacity throughout all active periods, i.e., running at rated power [42].
(3)
Emission factor;
Emission factors, which depend on engine type, represent the amount of carbon dioxide emitted per unit of fuel consumed and constitute key parameters for estimating carbon emissions from shipping operations. Determining accurate emission factors requires extensive field measurements and experimental validation, leading to high research costs; consequently, the availability of reliable public data remains limited. In this study, emission factor data are primarily derived from the IMO’s Fourth Greenhouse Gas Study [4] and research conducted by Weng [32], Sun [43], and others. Detailed information is provided in Table 9 and Table 10.
To ensure regional consistency with the operating environment of the Port of New York and New Jersey, the emission factors adopted here were further compared with those recommended in the Port Emissions Inventory Guidance: Methodologies for Estimating Port-Related and Goods Movement Mobile Source Emissions (EPA-420-B-22-011, 2022) [52]. According to Section 3.5.6 (in [52]) of the EPA guidance: “CO2 emission factors depend on BSFC rates and fuel type and should be calculated for vessels with C3 propulsion engines according to Equation (9).”
E F C O 2 = B S F C × C C F
where E F C O 2 is the CO2 emission factor (g/kwh), BSFC is the brake-specific fuel consumption(g/kwh), and CCF is the carbon content factor (g CO2/g fuel). The guidance provides typical BSFC values for marine diesel engines operating on MGO/MDO fuel: slow-speed diesel (SSD) 185 g fuel kWh−1, medium-speed diesel (MSD) 205 g fuel kWh−1, and high-speed diesel (HSD) 217 g fuel kWh−1. The guidance also specifies the corresponding CCF values: MGO/MDO = 3.206 g CO2 g−1 fuel and RM/HFO = 3.114 g CO2 g−1 fuel. By combining these parameters, the implied CO2 emission factors for MGO/MDO are approximately 593, 657, and 696 g CO2 kWh−1, respectively.
These values fall within the 620–686 g CO2 kWh−1 range adopted in this study, confirming that our emission factors are physically consistent with both the EPA and IMO methodologies. Furthermore, the guidance (Section 3.5 (in [52])) states that all Category 3 marine diesel vessels operating within the North American Emission Control Area (ECA)—which includes the Port of New York and New Jersey—are required to use distillate marine gas oil (MGO) or marine diesel oil (MDO) to comply with the 0.1% sulfur limit. Therefore, the fuel characteristics assumed in this study accurately represent the vessel types and regulatory environment of the study area.

2.3.2. Space Allocation

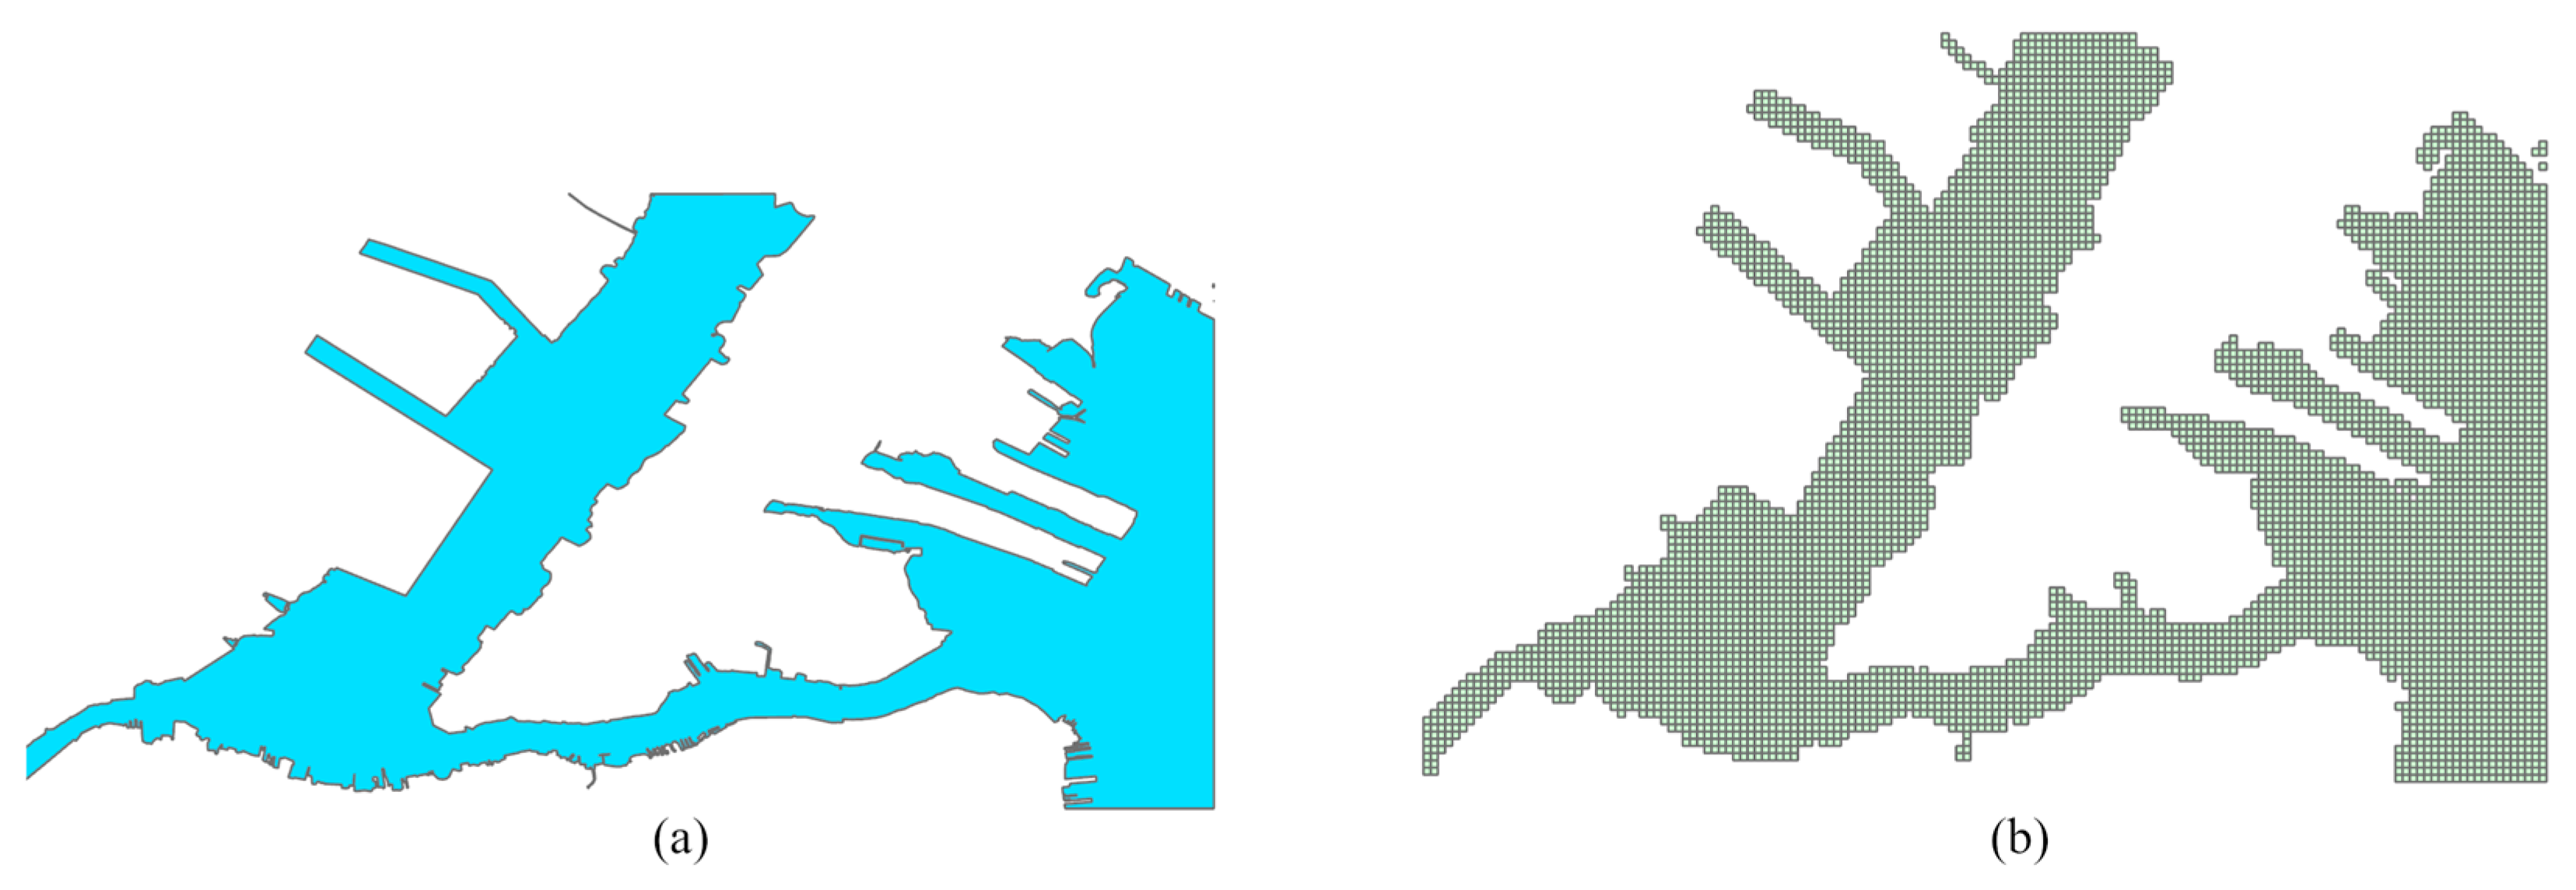
Because vessel emissions are strongly influenced by navigation trajectories and operational patterns, they exhibit pronounced spatial clustering. To enhance the spatial resolution of vessel emission estimates and identify emission hotspots, emissions must first be spatially allocated and then distributed across a grid system. Previous studies have typically used spatio-temporal resolutions of 1° × 1° [53], 1000 m [35], or 1 nautical mile [54]. To achieve a higher spatial resolution and accurately identify emission hotspots, this study divides the research area into grid cells measuring 100 m × 100 m and allocates vessel trajectory-based emissions to each grid cell accordingly. The grid partitioning results are presented in Figure 8.
Two common spatial allocation approaches exist: the point density method [55] and the activity-weighted method [47]. The point density method, widely adopted in earlier studies, assigns emissions from a vessel track segment to its starting or ending point and calculates total emissions within each grid cell based on the spatial density of these points [56]. While computationally simple and easy to implement, this method exhibits substantial limitations. When consecutive vessel position reports are separated by large distances exceeding grid boundaries, intermediate cells traversed during the voyage remain unaccounted for, causing significant deviation from actual emission patterns [35].
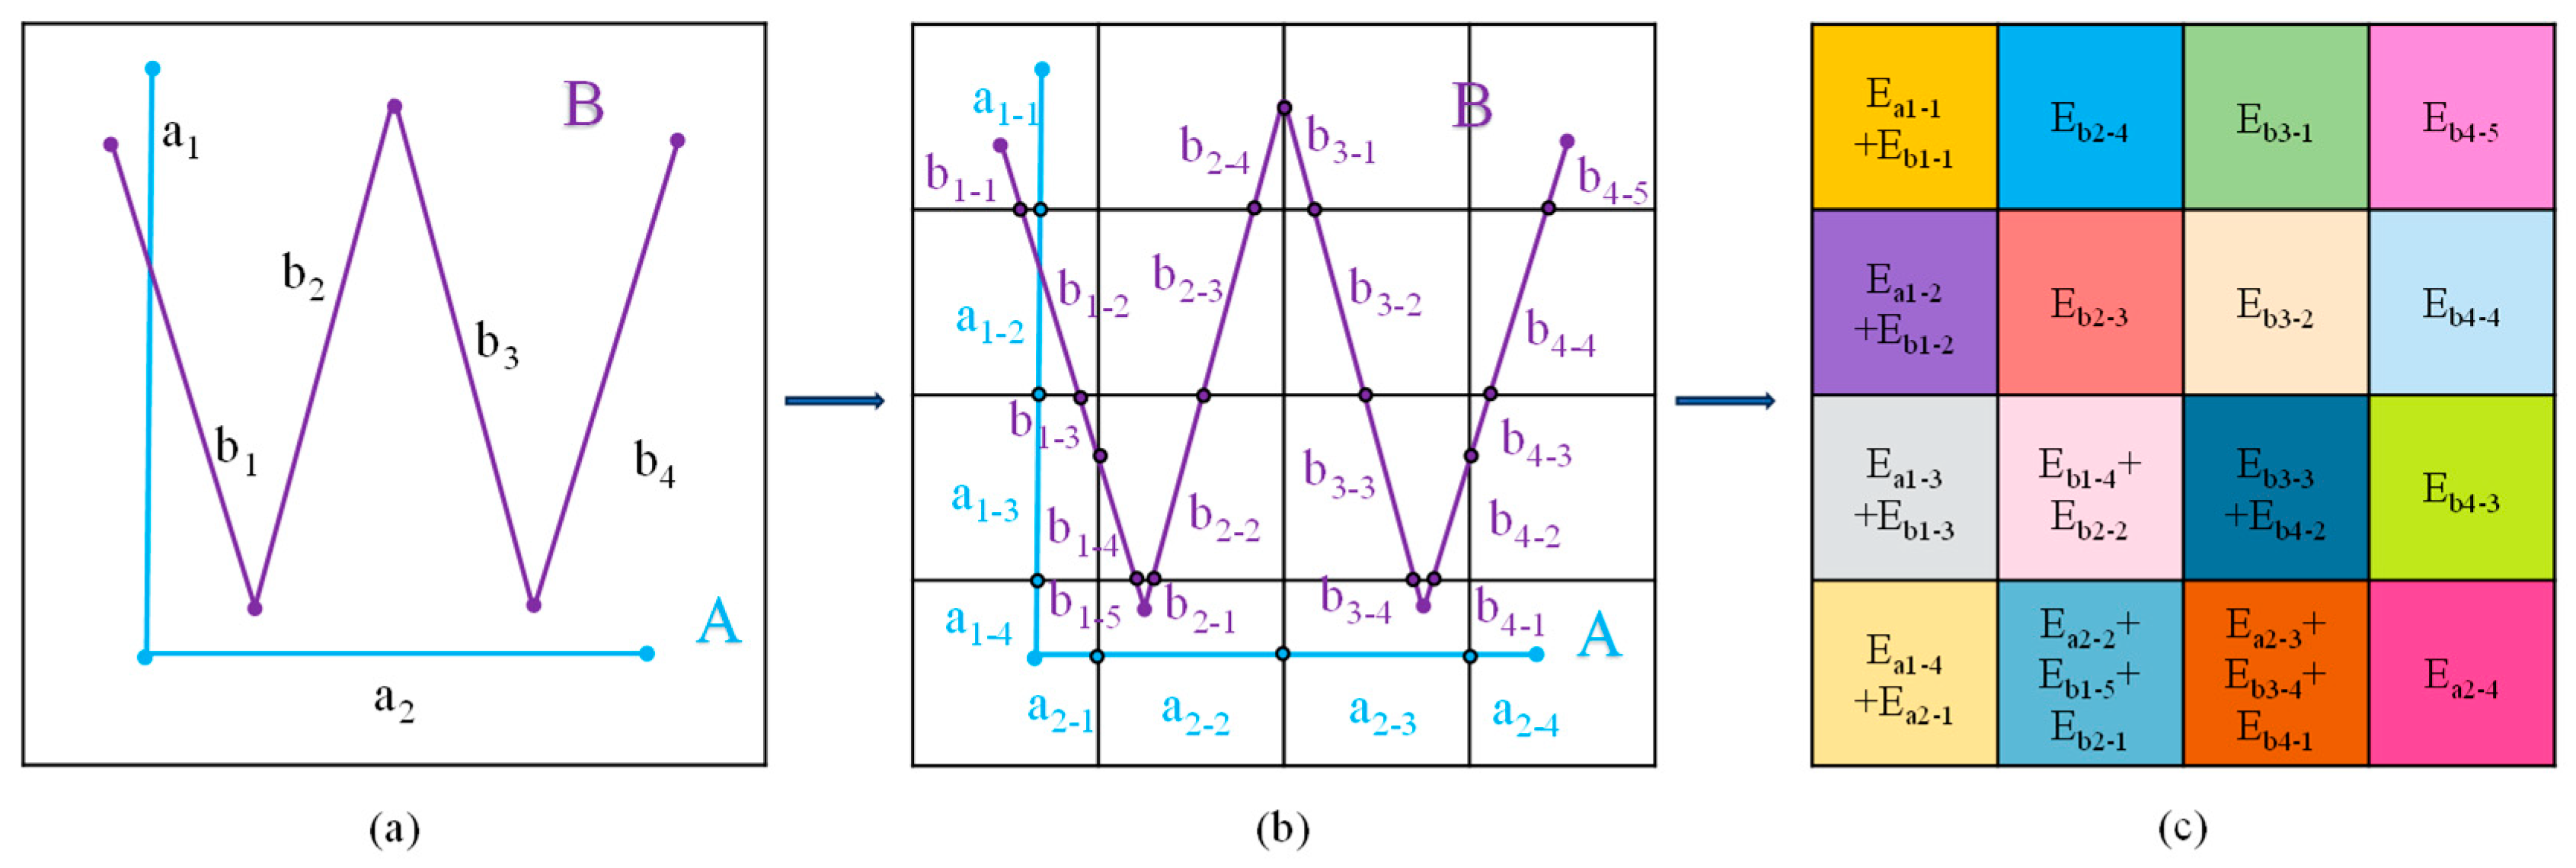
To overcome this limitation, the activity-weighted allocation method [57] was developed and has since gained increasing adoption [42]. This method proportionally distributes emissions across all grid cells intersected by a vessel’s trajectory, using either the trajectory length or time spent within each cell as the weighting factor. In this study, we employ the activity-weighted approach, as illustrated in Figure 9. Specifically, Figure 9a shows the trajectories of vessels A and B intersecting spatial grid boundaries. Intersection points divide trajectories into sub-segments, as shown in Figure 9b, where vessel A’s trajectory is segmented into a1-1, a1-2, a1-3, a1-4, a2-1, a2-2, a2-3, and a2-4. Emissions are then allocated to each grid cell proportionally to the segment length within that cell, as depicted in Figure 9c. This approach ensures that emissions are spatially allocated with greater precision, enabling high-resolution spatiotemporal emission analysis and supporting more effective emission control strategies.
In a port-scale, low-speed context, we allocate segment-level emissions to 100 × 100 m grid cells based on the intersection length between each trajectory segment and the grid cells. This choice is motivated by two main considerations: (1) Emissions are calculated at the segment level as ‘power × duration’, and the time dimension is already reflected in Equations (5)–(7) through the term T i + 1 T i ; therefore, under near-steady within-segment speeds, length share and time share are first-order equivalent; (2) AIS trajectories are uniformly resampled with a maximum interval of about one minute, and length weighting is more robust to uneven AIS reporting (dense during turning, sparse during straight sailing) while ensuring conservative, mass-preserving allocation.

3. Results and Analysis

3.1. Analysis of Total Carbon Emissions from Ships

This study focuses on vessel operations in selected areas of the Port of New York and New Jersey from February to November 2023. Applying the vessel carbon emission calculation method described herein, we estimate the total CO2 emissions from all vessels in the study area during this period at 136,701.81 tons. Subsequent analyses examine vessel emissions along four dimensions: temporal variation, spatial distribution, vessel type, and operational state.
Sensitivity analysis of the load factor (LF) aids in assessing the robustness of emission estimation results. We conducted sensitivity analysis for ±10% variations in the load factor to evaluate its impact on total carbon emissions. The sensitivity analysis indicates that when the load factor fluctuates by ±10%, total emissions change by only approximately ±1.85%. This minimal variation indicates that model outputs exhibit low sensitivity to load factor fluctuations, demonstrating robust stability and reliability. This characteristic primarily stems from the dominance of “berthing” conditions within the study area, which maintains relatively stable auxiliary machinery loads. Additionally, the model incorporates a constraint of LF ≤ 1, preventing unrealistic emission fluctuations caused by overload operations. Consequently, these results validate the strong stability and reproducibility of emission estimates based on the STEAM model.
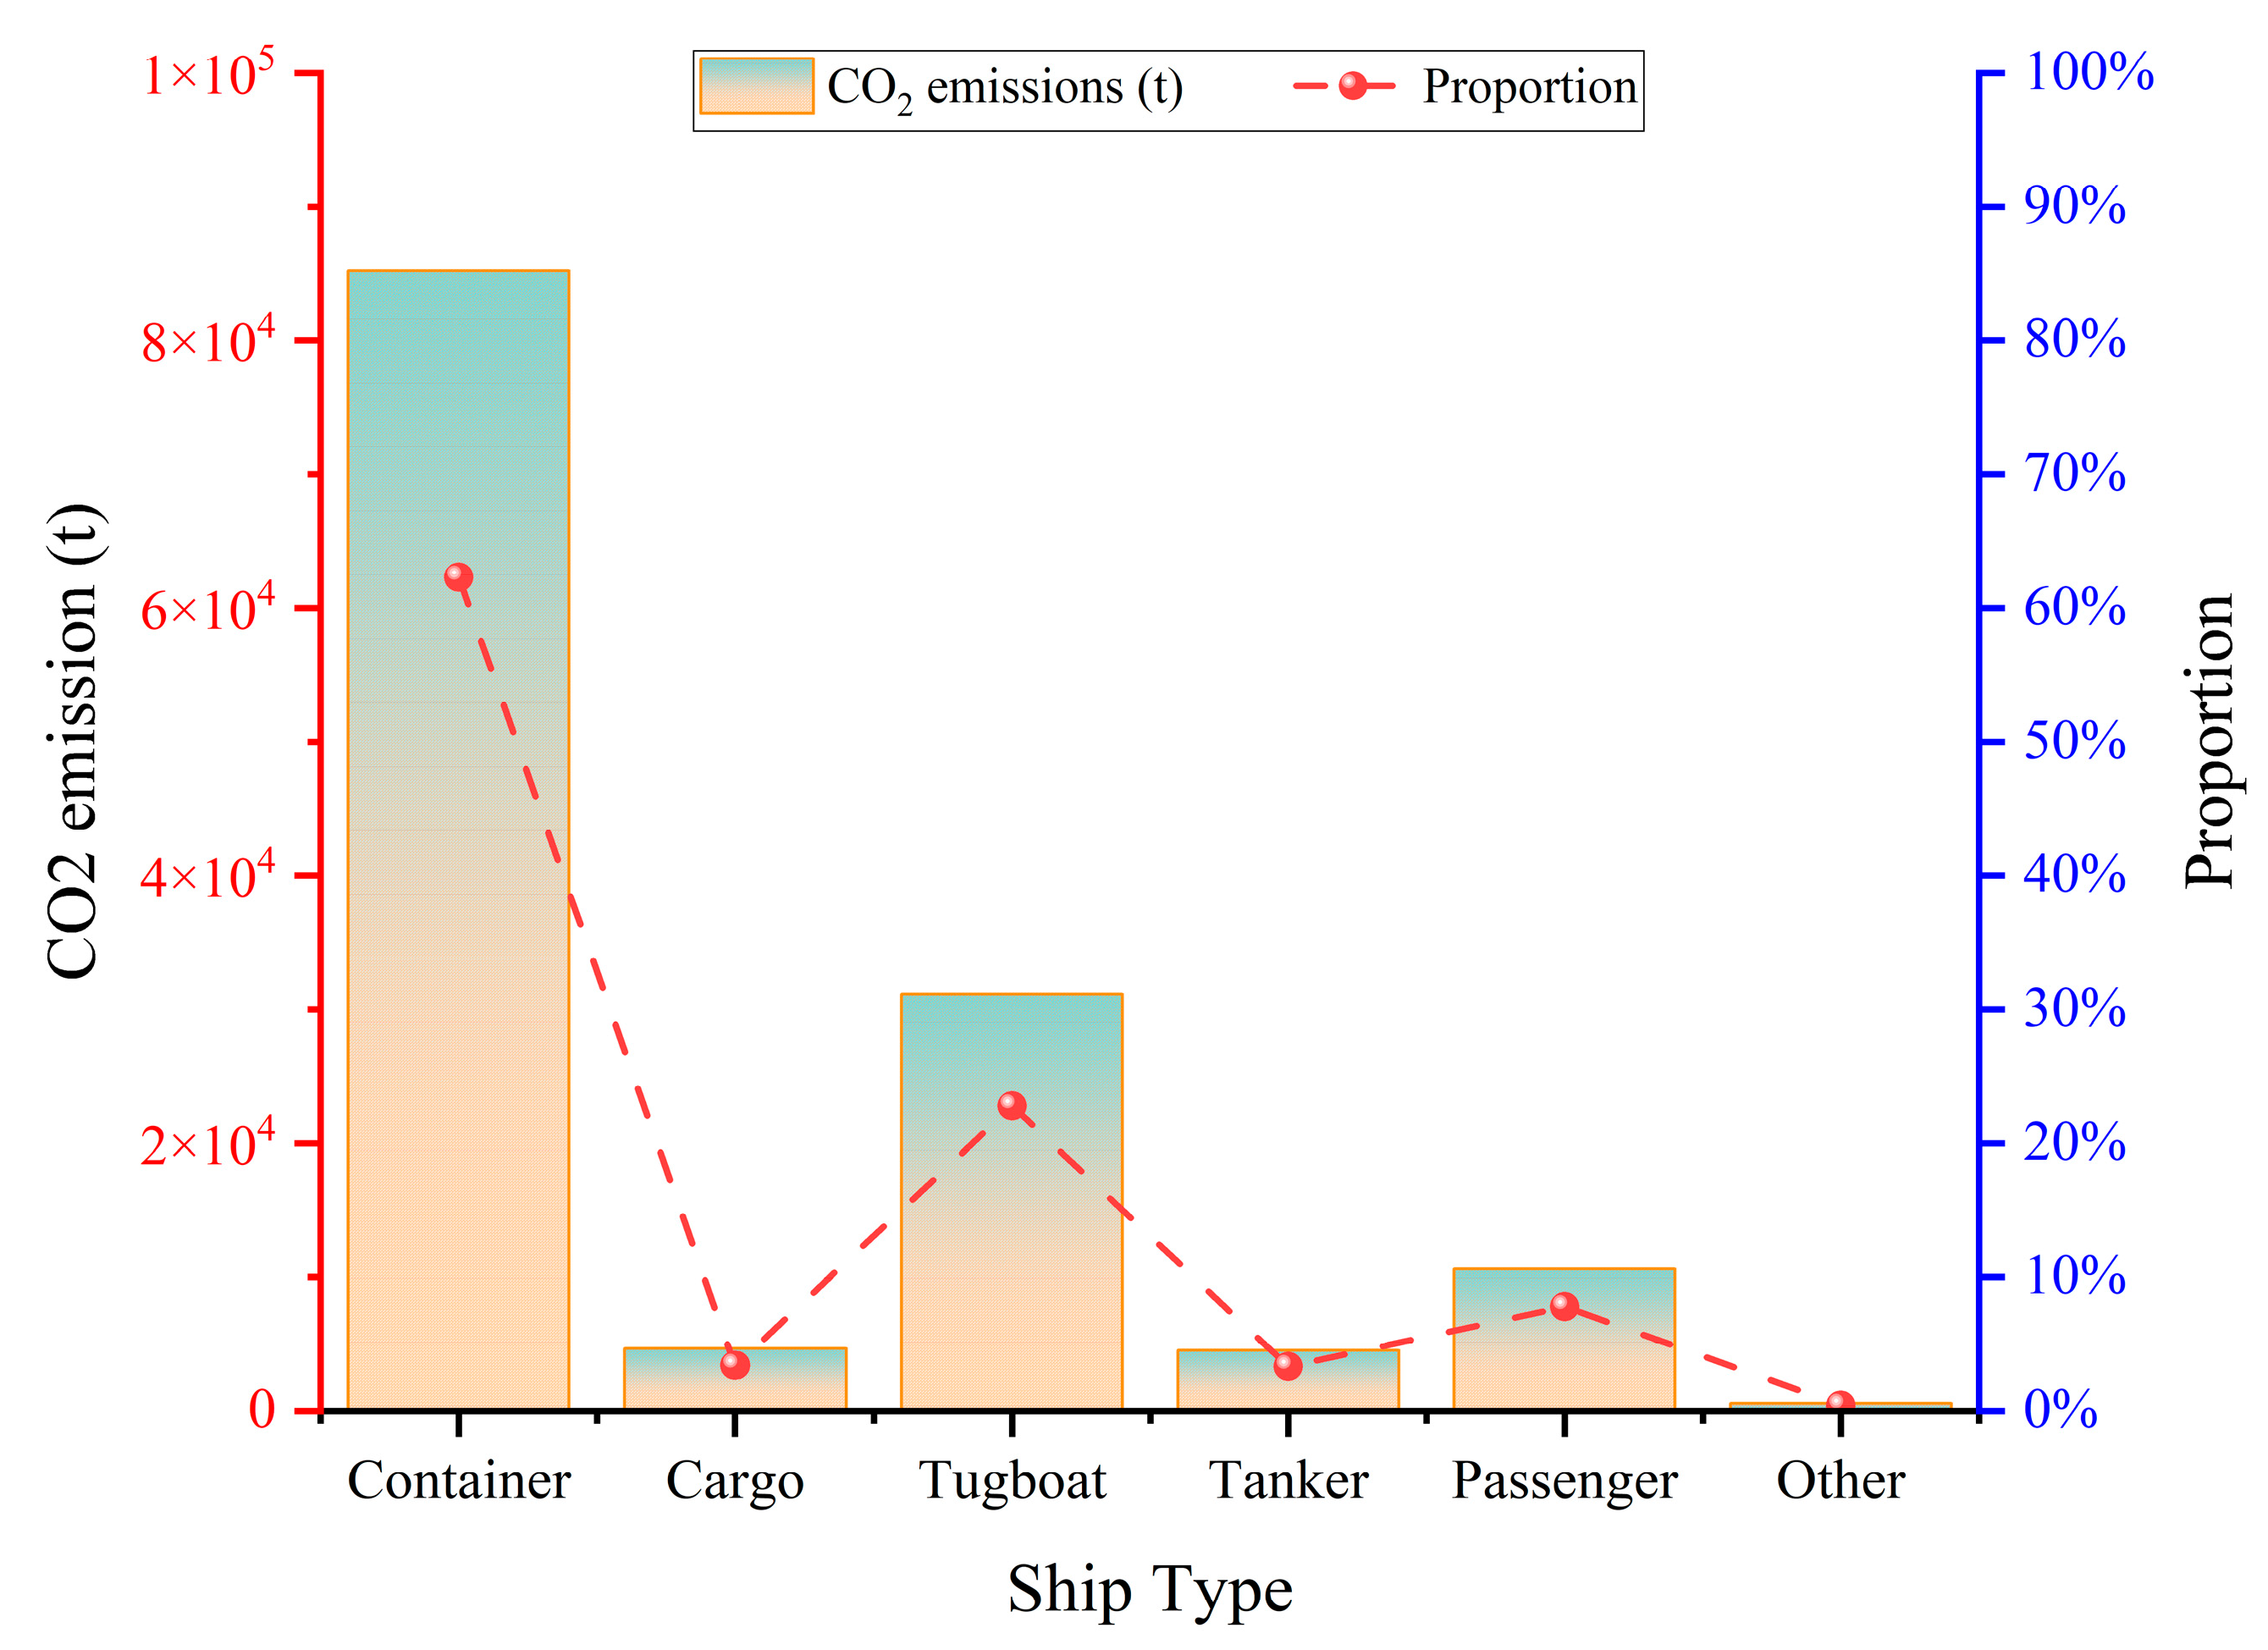
As shown in Figure 10, container ships constitute the largest emission source, accounting for 62.3% of total emissions. This dominance arises from the concentration of major container terminals within the study area, where frequent container ship operations generate substantial CO2 emissions. Tugboats represent the second-largest contributor at 22.8%, primarily due to the area’s high density of terminals and berths requiring frequent towing services. Although individual tugboats emit less than large ocean-going vessels, their engines often operate at high loads and low efficiency during tasks such as pushing and towing, resulting in elevated fuel consumption rates and emission intensity per unit time. Additionally, their frequent maneuvering within port waters and the need to maintain power during standby further amplify their total emissions.
The emissions of cargo ships are relatively low, and the difference is significant compared to container ships. This difference stems from several interrelated operational and technical factors. Fleet Size and Activity Frequency: The number of container ships in the study area is approximately 2.5 times that of general cargo vessels, while the number of track segments derived from AIS data reaches 3.3 times that of cargo ships. This directly indicates that container ships operate at a significantly larger scale and higher frequency within the port area than general cargo vessels, forming the fundamental reason for their dominant share of total emissions. Core Port Functionality: The Port of New York–New Jersey serves as the primary container hub on the U.S. East Coast, inherently prioritizing container shipping operations. Consequently, container ships engage in frequent loading/unloading, waiting, and maneuvering activities here, while general cargo ships exhibit relatively lower operational volumes and berthing frequencies. Vessel Power and Operational Model: Container ships typically feature larger tonnage and higher main and auxiliary engine power to meet rapid turnaround requirements. Even during berthing, their auxiliary engines must maintain high-load operation to power equipment like refrigerated containers, further widening the gap in emissions intensity per unit time compared to conventional cargo ships.
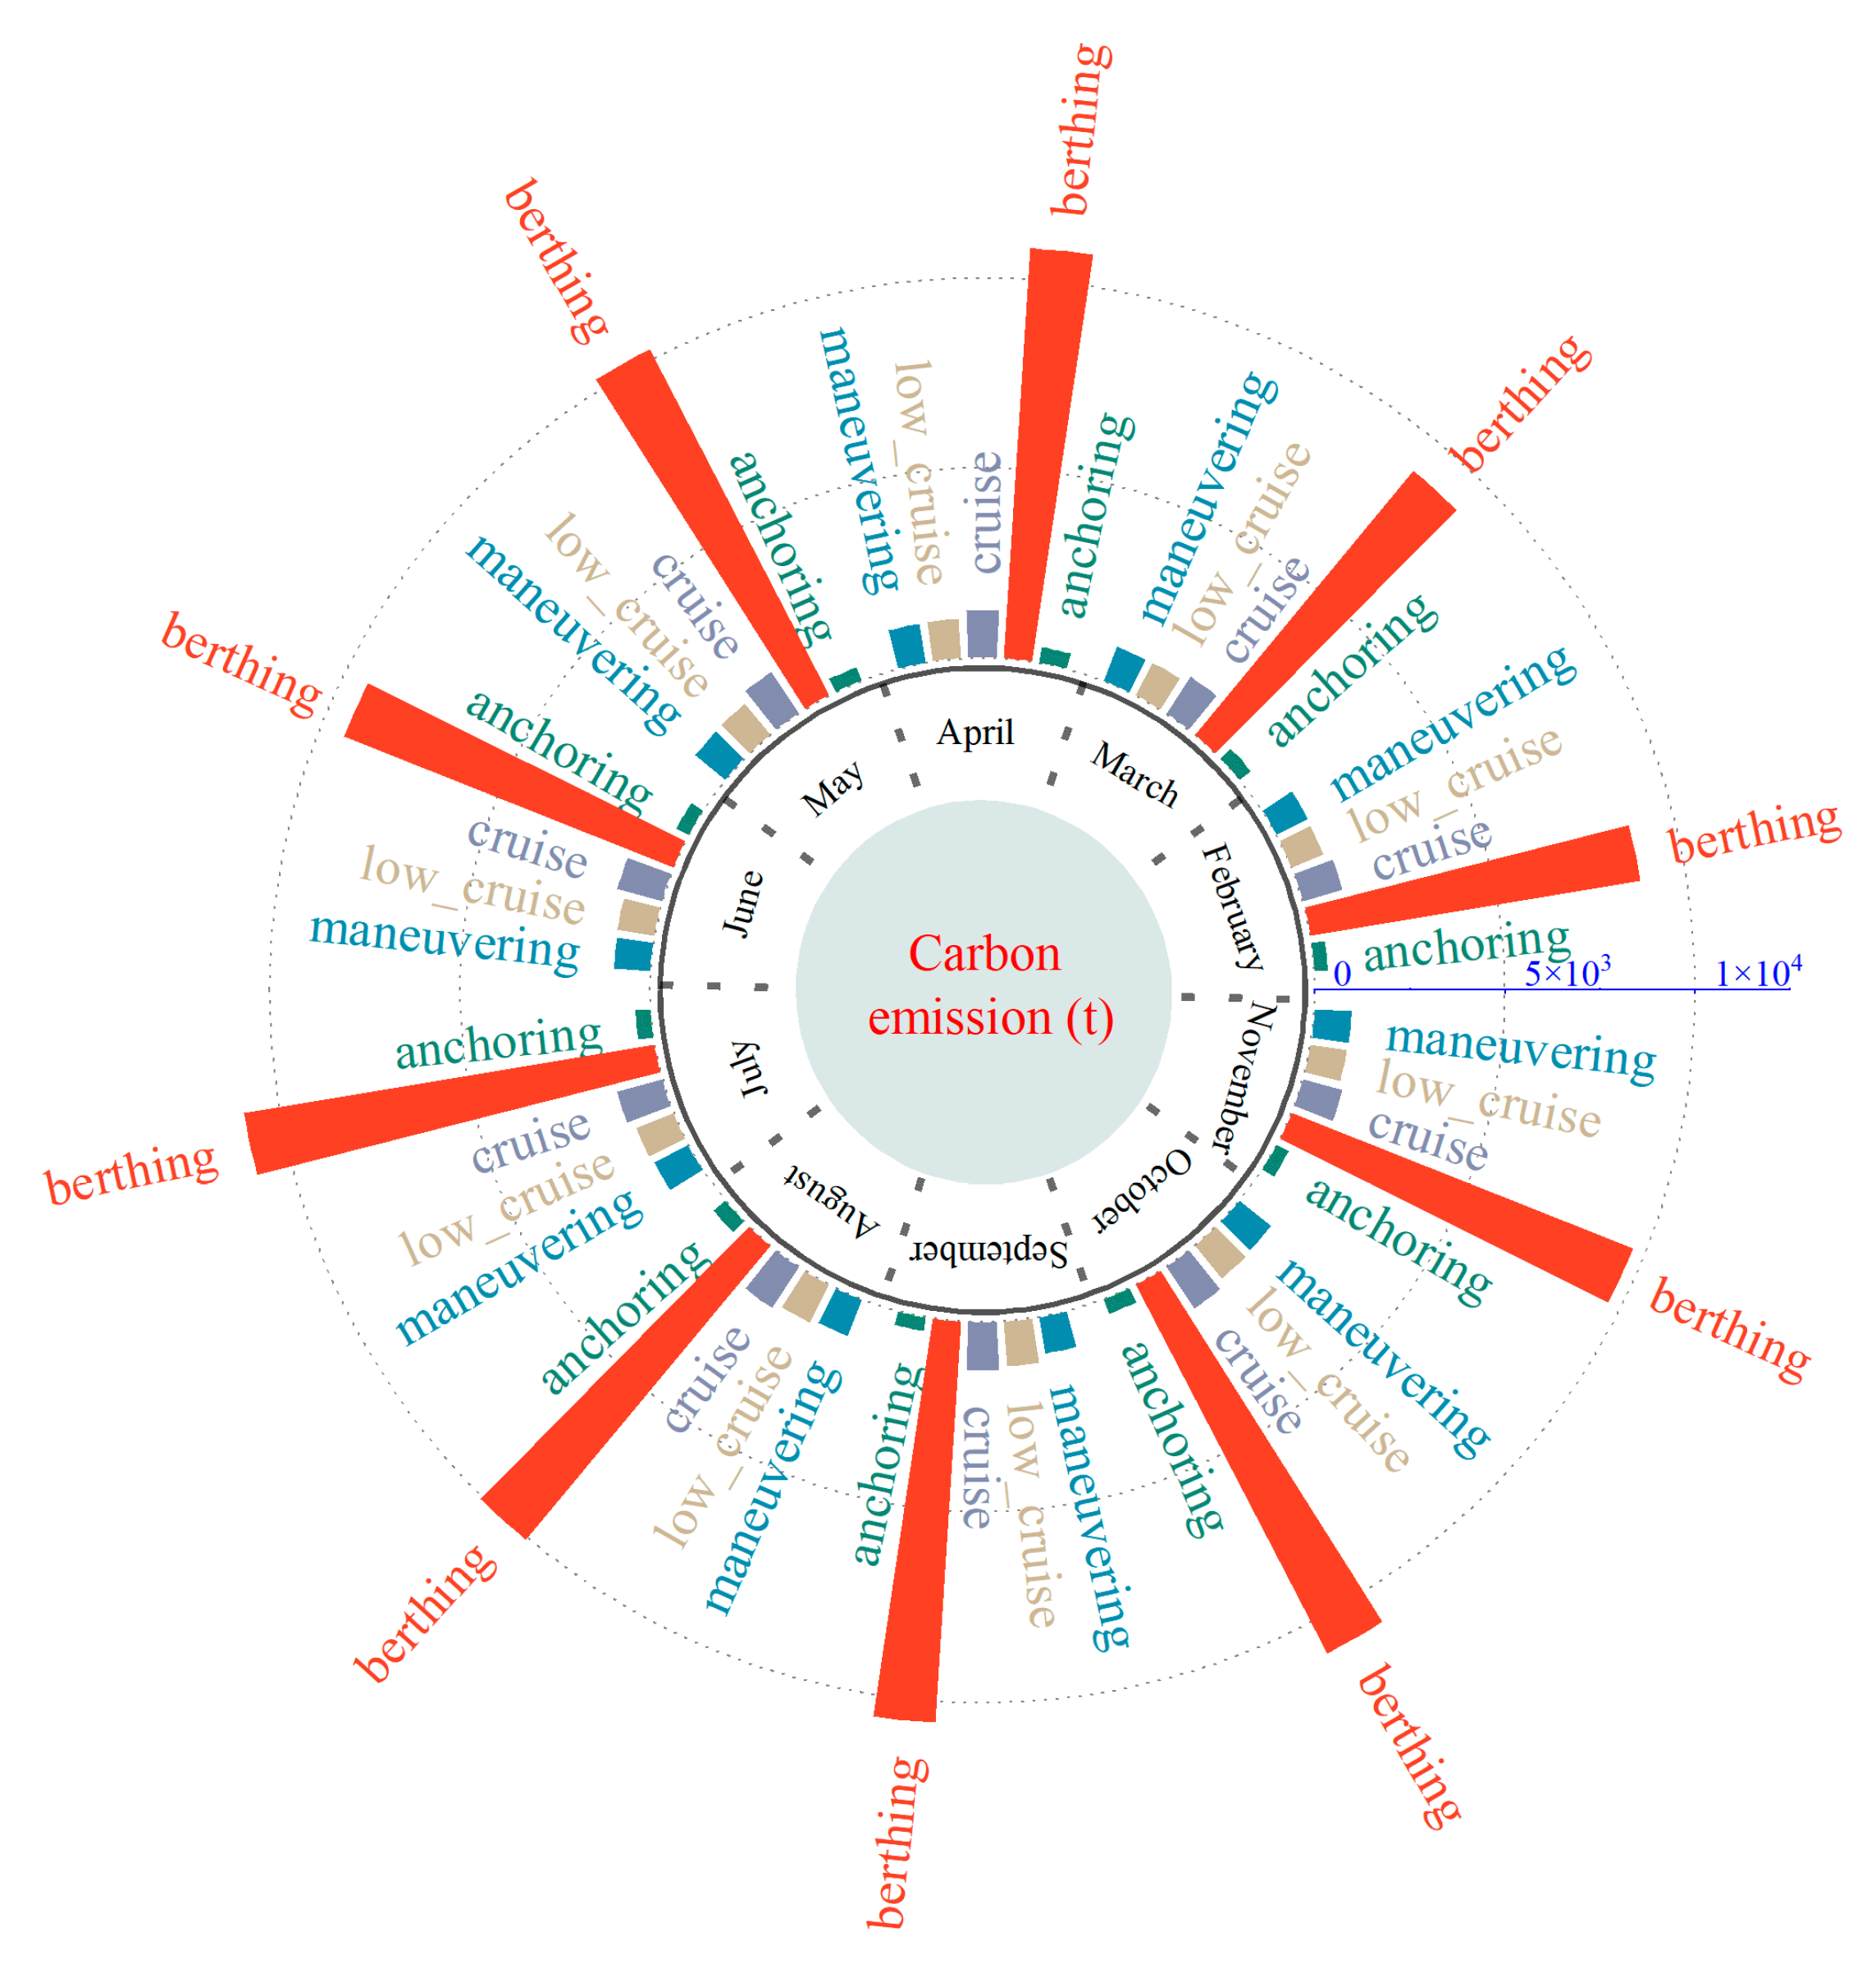
Figure 11 presents vessel carbon emissions across different operational states. Berthing operations dominate, accounting for 73.4% of total emissions, thereby representing the primary scenario for vessel-related carbon emissions. This finding is consistent with the research results conducted at other major ports around the world. For instance, according to the research of Linda Styhre et al. [38], in the ports of Long Beach, Gothenburg, Osaka, and Sydney, the emissions in the berthing state accounted for 60% to 88% of the total emissions of the ports, which confirmed that the “berthing” mode was the main source of emissions in the port areas. Cruising operations contribute only 9%, suggesting that the majority of emissions originate from low-speed operations or frequent maneuvering activities, such as berthing and docking. The study area, as a key operational hub hosting numerous terminals and berths, naturally exhibits emission clustering during berthing periods. Conversely, during maneuvering and low-cruise states, vessels frequently adjust engine power to perform high-intensity tasks, making these states the main emission contributors outside of berthing operations. This emission distribution closely aligns with the actual operational characteristics of vessels in port environments.
The observed disparities across operational states underscore critical priorities for carbon reduction in the shipping sector. High-emission operations such as berthing and maneuvering should be targeted first. Potential measures include technological optimizations, such as implementing more efficient shore-based auxiliary power systems for port operations, and operational improvements, such as developing berthing energy management protocols and enhancing maneuvering precision to minimize power losses. At the same time, documenting and promoting best practices in energy-efficient cruising operations will support a comprehensive optimization of carbon emissions across all vessel operating conditions.

3.2. Spatio-Temporal Analysis of Carbon Emissions

3.2.1. Temporal Variation of Carbon Emissions

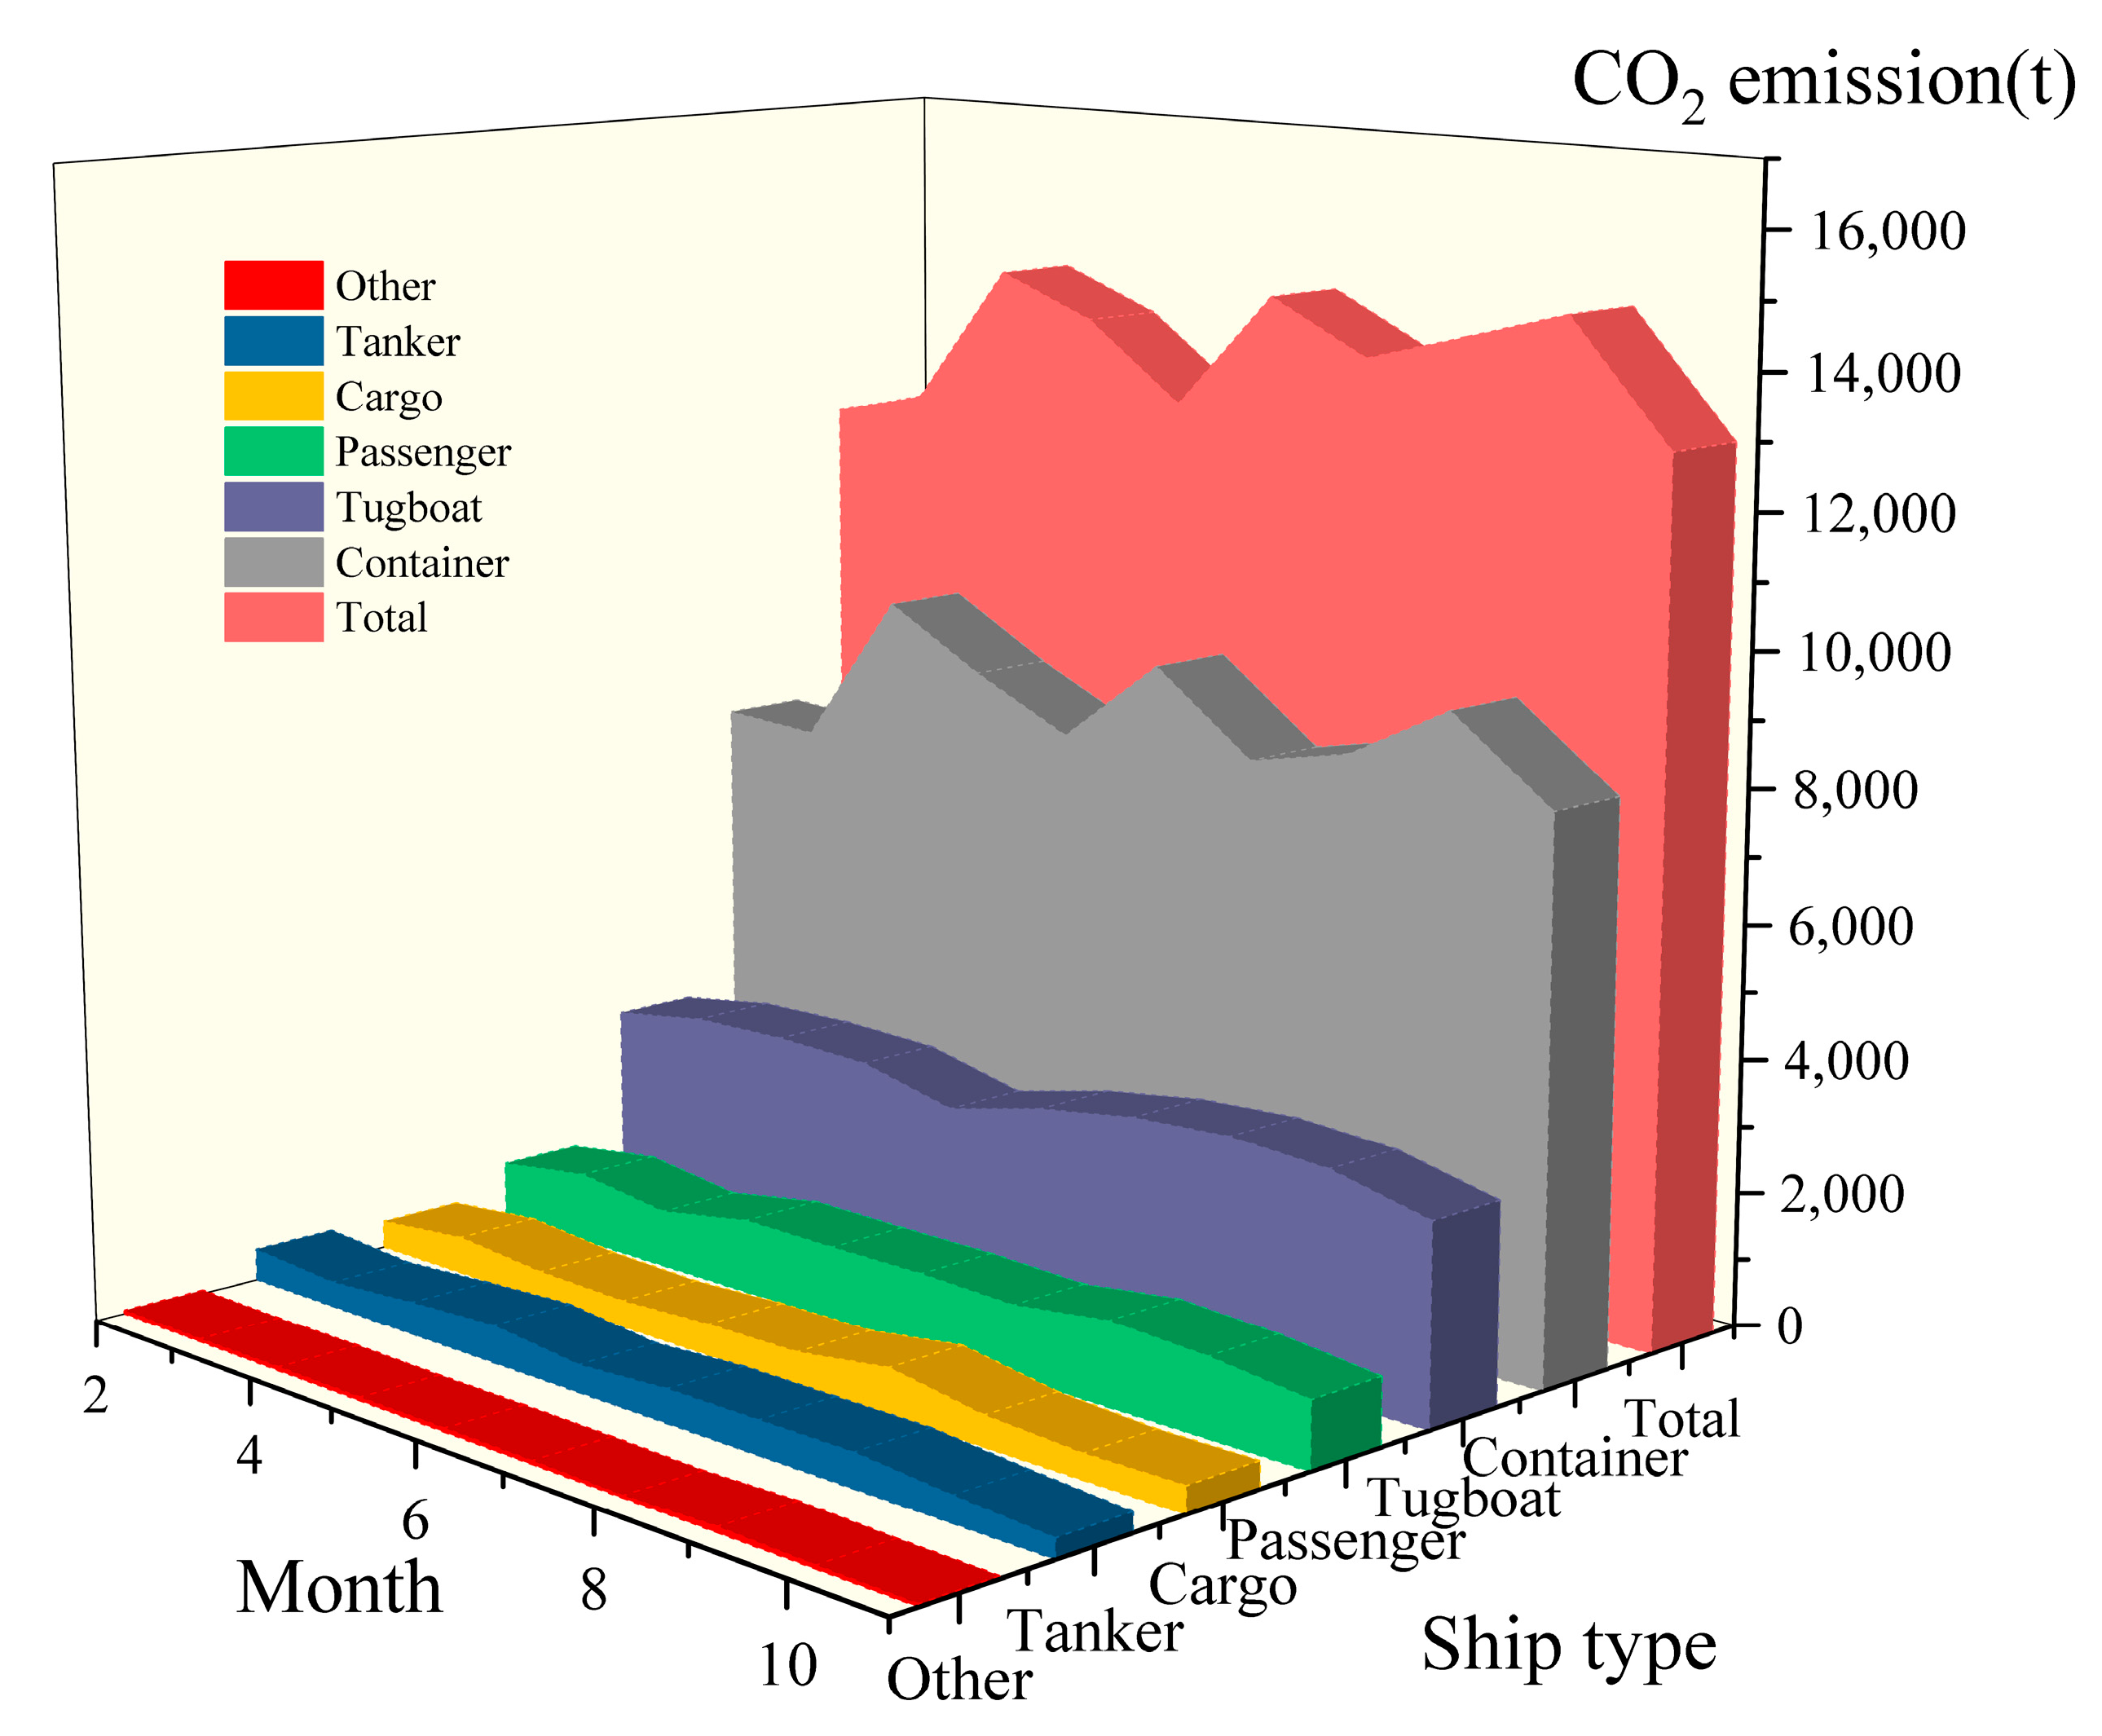
Located in the northeastern United States, the Port of New York and New Jersey exhibits a temperate continental climate influenced by the Atlantic Ocean. As a major international shipping hub on North America’s East Coast, vessel carbon emissions in this region are shaped by multiple factors, including climatic conditions, shipping demand, and operational practices. These emissions reflect the interplay of economic, technological, policy, and environmental factors. As shown in Figure 12, monthly carbon emissions from container ships are consistently higher than those from other vessel types, closely following the overall emission trend. This is attributable to the port’s role as a core container hub, handling substantial transatlantic and East Coast container transshipment and distribution. Container ships, characterized by large tonnage and high operational frequency, thus dominate total shipping emissions.
Based on Figure 12 and regional climate and shipping patterns, monthly variations can be divided into several phases. February is in the late stage of North American winter. The average temperature at ports in this month of 2023 was 40.8 °F. The lowest value during the observation period (the monthly average temperature of the port is from the NEWARK LIBERTY INTL AP, NJ site, which is the closest to the port of New York in the National Oceanic and Atmospheric Administration. The website is: https://www.weather.gov/wrh/Climate?wfo=okx, and accessed on 10 November 2024), dominated by northwest monsoon winds and low temperatures, which constrain shipping activity and result in lower overall carbon emissions.
With the arrival of spring, the average temperature gradually rose from 44.9 °F in March to 63.5 °F in May, while strengthening south/southeast monsoonal winds improved sea conditions and enhanced shipping efficiency. Under the combined effect of these factors, the fuel for ships can burn more fully. Concurrently, North American production recovers, increasing voyage frequency—particularly for container ships—leading to a gradual rise in emissions. From June to July, the early hurricane season brings storms and rainy weather along the Atlantic coast, causing vessels to reduce speed, reroute, or suspend operations, thereby producing fluctuations in emissions.
From August to November, temperatures are pleasant with averages ranging from 62 °F to 76.7 °F. The southeast monsoon remains stable, while Atlantic waters experience clear skies and calm seas, creating optimal shipping conditions. Concurrently, global trade enters the Christmas season stockpiling cycle, with surging demand for imports from North America to Europe and the Asia-Pacific region. As the gateway to North America’s East Coast, the Port of New York experiences a sharp increase in container ship volumes and voyage frequencies, driving carbon emissions to their peak in October. This phenomenon clearly demonstrates that under favorable meteorological conditions, economic factors play a more dominant role in driving port carbon emission dynamics. This aligns with the peak periods of container ship carbon emissions shown in Figure 12, further validating the driving effect of the peak shipping season on total emissions.
Figure 13 presents monthly carbon emissions by operational state from February to November, including berthing, anchoring, maneuvering, low-cruise, and cruise. Emission volumes differ significantly across operational states, reflecting port operational rhythms and vessel activity patterns. Berthing represents the largest contributor to emissions, followed by cruise and low-cruise states, while anchoring contributes the least. This distribution indicates that emissions generated during port operations and waiting periods—particularly berthing—dominate total emissions, driven by sustained auxiliary engine operation and cargo handling processes. Although cruise and low-cruise modes may exhibit higher hourly emission intensities, their shorter durations in port result in lower cumulative emissions compared to berthing.
Monthly variations reveal characteristic fluctuations across operational states. For example, berthing emissions exhibit a “spring recovery, summer surge, and autumn–winter fluctuation” pattern, paralleling the monthly trends of container ship emissions in Figure 11. This demonstrates that berthing dominates port-area carbon emissions, reflecting the concentration of terminals and high cargo-handling volumes. The transshipment and distribution of large container and bulk/breakbulk shipments necessitate prolonged vessel berthing, leading to concentrated emissions. These findings underscore the importance of implementing shore power systems, optimizing operational workflows, and promoting low-carbon technologies to effectively mitigate carbon emissions in port areas.

3.2.2. Spatial Variation of Carbon Emissions

This study examines the high-resolution spatial distribution of vessel carbon emissions using AIS data and an activity-weighted allocation method. As shown in Figure 14, emissions in New York Harbor waters from February to November display pronounced spatial heterogeneity, with distribution patterns closely associated with vessel operating conditions and the contributions of carbon-emitting equipment.
The spatial grid map highlights high-emission zones (orange-red to red) that are strongly concentrated in berthing areas, whereas other regions, including mid-channel sections and anchorage peripheries, exhibit medium-to-low emissions (green to yellow-green). This indicates that berths serve as the core hotspots for vessel carbon emissions. When considered alongside Figure 11, which shows that berthing operations dominate emissions, it is clear that operational behavior directly shapes the spatial emission pattern. During berthing, main engines generally operate at low load or are turned off, while auxiliary engines run continuously to supply power and support auxiliary systems. The sustained operation of auxiliary engines thus constitutes the primary equipment-level driver behind the elevated emissions observed at berth locations.
In summary, the spatial distribution of vessel carbon emissions in New York Harbor from February to November exhibits a “hotspot clustering centered around berths” pattern. This distribution is influenced both by the scope of the study area and the continuous operation of auxiliary engines during berthing periods, emphasizing the critical role of port operations in shaping localized carbon emission hotspots.

4. Discussion

Ship emissions exert significant pressure on the marine environment, with their air pollutants constituting a major source of marine atmospheric pollution. Due to the complexity of shipping systems in operational patterns, engine types, and fuel consumption, accurately quantifying and thoroughly analyzing their carbon emission characteristics remains a core challenge in the field of shipping emissions reduction. Systematic emission analysis not only enables precise assessment of pollution loads in specific marine areas but also effectively tracks spatiotemporal dynamics of emissions, thereby providing a critical scientific basis for marine environmental pollution control and emission reduction policy formulation.
To enhance the accuracy of ship emission estimation, this study employs a top-down STEAM model. This model utilizes a power-based calculation method to estimate emissions at the microscopic level. The study demonstrates how AIS data and activity-weighted methods can be leveraged to precisely calculate emissions and allocate them across spatial scales. This quantitative analytical approach not only helps track emission trend changes but also reveals emission patterns, enabling multidimensional classification of emission results. This provides crucial support for optimizing vessel emission control strategies.
Port of New York and New Jersey, located at the border of New York State and New Jersey, suffers from severe pollution. Findings indicate that container ships are the primary emission source (accounting for approximately 62.3% of total emissions), followed by tugboats and passenger vessels. In operational terms, berthing conditions contribute over 73% of emissions, primarily due to the continuous operation of auxiliary engines and boilers during a vessel’s port stay. This aligns with findings from Styhre et al. [38] in four major global ports, indicating that over half of vessel greenhouse gas emissions occur during berthing. Therefore, for high-container-throughput ports like New York Harbor, connecting berthing vessels to shore power represents a viable option to significantly reduce local air pollutant emissions from auxiliary engines.
Spatially, high-emission zones are concentrated around the main channel and container berths. This pattern aligns with findings from Chen et al. [58], reflecting how port functional layout and operational organization decisively influence spatial emission variation. Thus, while advancing technological emission reductions, systematic efforts to lower port emission intensity through optimized vessel scheduling, anchorage management, and berth allocation are equally crucial. Eide et al. [59] noted that enhancing port operational efficiency represents one of the pathways with the greatest emission reduction potential and lowest costs. Effectively compressing vessel turnaround time in port not only directly reduces auxiliary engine operation duration and corresponding emissions but also boosts berth turnover capacity. This provides shipping companies with operational flexibility to adjust speeds and optimize energy efficiency. Specific measures include improving terminal handling efficiency, shortening loading/unloading and pilotage waiting times, alleviating port congestion, and optimizing customs clearance procedures [60]. Beyond optimizing port handling processes, governments can also implement coordinated scheduling strategies like “slow steaming” to mitigate anchorage congestion caused by concentrated arrivals, thereby preventing additional pollution from stranded vessels in port waters.
Furthermore, while power-based models can accurately estimate emissions, actual emission drivers are more complex, including meteorological conditions, water currents, and engine load variations. Therefore, as noted by Iris et al. [11], port emission reduction should rely on system performance enhancement strategies that integrate operational optimization, equipment electrification, and energy management coordination to achieve sustainable emission reduction goals.

5. Conclusions

This study employs a technical combination of AIS data, the STEAM model, and activity-weighted spatial allocation to achieve a refined characterization of vessel emissions, spanning from dynamic vessel behavior to high-resolution spatial emission distribution. Its primary advantage lies in capturing emission variations across distinct functional zones—such as berths, fairways, and anchorages—and linking these variations to specific vessel operations, including berthing and cruising. This approach enables tracking emission dynamics and analyzing emission patterns from multiple dimensions, thereby enhancing the management and control of vessel emissions. Key findings are summarized across four dimensions: vessel type, operational status, temporal variation, and spatial distribution.
Contribution by Vessel Type: Container ships are the dominant source of emissions, with their trends closely reflecting fluctuations in total carbon emissions. This pattern is consistent with the Port of New York and New Jersey’s role as a primary container hub on the U.S. East Coast, where container ships operate with high tonnage and frequent voyages.
Operational Status Analysis: Berthing represents the principal activity generating carbon emissions. Given that the study area focuses on terminal berths and adjacent waters, AIS data primarily capture vessels in berthing status, resulting in substantially higher emissions compared to other operational conditions. Effective emission management should prioritize vessels at berth through measures such as improving berthing efficiency, accelerating the green upgrade of port infrastructure, and optimizing energy systems and resource allocation to support a low-carbon transition in port operations.
Temporal Variation Characteristics: Monthly emissions closely correspond to regional economic activity, global trade cycles, and climatic conditions. Emissions are lowest in February, reflecting reduced winter shipping activity; increase gradually from March to May with production and trade recovery; peak in October as the annual maximum; and decline in November due to adverse weather and decreased transport demand.
Spatial Distribution Characteristics: Vessel emissions exhibit pronounced “berth-concentrated” clustering. Grid cells with emissions ≥ 500 tons cluster along terminal berths, whereas waterways, anchorages, and peripheral areas typically display low emissions (0–50 tons). This pattern is primarily driven by the high energy consumption of auxiliary machinery and boilers during berthing, including tasks related to vessel stability and cargo handling operations.
Furthermore, a sensitivity assessment of the load factor (LF) was conducted to evaluate the robustness of the emission estimates. The results show that moderate variations (±10%) in LF led to only minor changes (±1.85%) in total emissions, confirming the strong stability and reliability of the STEAM-based modeling framework. This robustness primarily reflects the dominance of berthing conditions with relatively constant auxiliary loads and the constraint of LF ≤ 1, which effectively prevents unrealistic overestimation due to overloading.
Although this study provides valuable empirical data for calculating the carbon emissions of ships, it does have certain limitations.
  • The accuracy of carbon emission estimates relies heavily on high-quality data, including vessel operational parameters (such as engine power and fuel consumption), load factor, and emission factor calculations. However, due to challenges in data collection and organization, the absence or insufficient representativeness of key data, and potential data loss during cleaning processes, carbon emission calculations may contain errors, introducing a degree of uncertainty. Specific AE/ME ratios and AE load factors for the NY/NJ region were not available and were taken from prior literature. These parameters are the primary contributors to current parametric uncertainty, which can be refined upon local validation.
  • This study did not account for external environmental factors such as wind speed, tidal currents, and wave conditions. These elements can influence vessel speed and engine load, thereby affecting carbon emission levels.
Given these limitations, the following represent key directions for future research:
  • Enhance the processing of AIS data by employing more effective anomaly point removal and convexification techniques to minimize impacts from data handling.
  • Future studies should integrate real-time operational data (e.g., engine performance, fuel flow, energy consumption) to optimize emission estimates through intelligent sensor systems, thereby improving model accuracy. Establishing high-frequency sensor networks to monitor real-time operational changes of vessels within ports will provide valuable data for emission model validation.
  • Incorporating external environmental factors (e.g., wind speed, tidal currents, sea conditions) into emission models is critical. This will enable more refined carbon emission predictions under varying weather conditions and improve spatial accuracy for emissions in specific port areas.
  • Additionally, conducting long-term studies to track the impact of policy interventions (e.g., ECA regulations) on emission changes will provide valuable insights for future emission reduction strategies.

Author Contributions

W.L.: Writing—original draft, Validation, Methodology, Data curation. N.W.: Writing—review and editing, Supervision, Methodology, Formal analysis. J.Y.: Writing—review and editing, Validation, Methodology, Funding acquisition. All authors have read and agreed to the published version of the manuscript.

Funding

This work was supported by the National Natural Science Foundation of China under Grants 52271361 and 52231014, the Special Projects of Key Areas for Colleges and Universities in Guangdong Province under Grant 2021ZDZX1008, the Natural Science Foundation of Guangdong Province of China under Grant 2023A1515010684.

Data Availability Statement

The data that support the findings of this study are available upon reasonable request from the authors. All authors have read and agreed to the published version of the manuscript.

Conflicts of Interest

The authors declare that they have no known competing financial interests or personal relationships that could have appeared to influence the work reported in this paper.

Abbreviations

The following abbreviations are used in this manuscript:
AISAutomatic Identification System
IMOInternational Maritime Organization
STEAMShip Traffic Emissions Assessment Model
MMSIMaritime Mobile Service Identity value
MEmain engine
AEauxiliary engine
ABauxiliary boiler
LFload factor
EFemission factor
MCRMaximum Continuous Rating
GTgross tonnage
DWTdeadweight tonnage

Appendix A. Reproducibility Note

(1)
Key parameters
a.
AE/ME ratio (see Table 6)
b.
AE load factor (see Table 8)
c.
Emission factors (see Table 10)
(2)
Regression equations and their corresponding sample sizes (see Table 4 and Table 5, Figure 6 and Figure 7)
(3)
Link to the NOAA AIS data source used (https://hub.marinecadastre.gov/pages/vesseltraffic)

Appendix B. Sensitivity Analysis

Table A1. The changes in total carbon emissions and carbon emissions during berthing under the variations in various elements.
Changes in Various ElementsChanges in Carbon EmissionsChanges in Carbon Emissions During Berthing
LFME ± 10%±1.85%-
AE/ME power ratios ± 20%±13.21%±16.06%
AE load factors ± 20%±13.21%±16.06%
EF ± 5%±5%±5%

References

  1. UNCTAD. Review of Maritime Transport 2022; United Nations Conference on Trade and Development: Geneva, Switzerland, 2022. [Google Scholar]
  2. Yang, L.; Zhang, Q.; Lv, Z.; Zhang, Y.; Yang, Z.; Fu, F.; Lv, J.; Wu, L.; Mao, H. Efficiency of DECA on ship emission and urban air quality: A case study of China port. J. Clean. Prod. 2022, 362, 132556. [Google Scholar] [CrossRef]
  3. Issa-Zadeh, S.B.; Garay-Rondero, C.L. Decarbonizing Seaport Maritime Traffic: Finding Hope. World 2025, 6, 47. [Google Scholar] [CrossRef]
  4. IMO. Fourth IMO Greenhouse Gas Study 2020; International Maritime Organization: London, UK, 2020. [Google Scholar]
  5. Park, S.-Y.; Woo, S.-H.; Lim, C. Predicting PM10 and PM2.5 concentration in container ports: A deep learning approach. Transp. Res. Part D Transp. Environ. 2023, 115, 103601. [Google Scholar] [CrossRef]
  6. Wang, L.; Li, Y. Estimation methods and reduction strategies of port carbon emissions—What literatures say? Mar. Pollut. Bull. 2023, 195, 115451. [Google Scholar] [CrossRef] [PubMed]
  7. Gray, N.; McDonagh, S.; O’Shea, R.; Smyth, B.; Murphy, J.D. Decarbonising ships, planes and trucks: An analysis of suitable low-carbon fuels for the maritime, aviation and haulage sectors. Adv. Appl. Energy 2021, 1, 100008. [Google Scholar] [CrossRef]
  8. Bach, H.; Hansen, T. IMO off course for decarbonisation of shipping? Three challenges for stricter policy. Mar. Policy 2023, 147, 105379. [Google Scholar] [CrossRef]
  9. IMO. Revised GHG Reduction Strategy for Global Shipping Adopted; International Maritime Organization: London, UK, 2023. [Google Scholar]
  10. Habibi, M.; Rehmatulla, N. Carbon Emission Policies in the Context of the Shipping Industry; CASS Business School, City University: London, UK, 2009. [Google Scholar]
  11. Iris, C.; Lam, J.S.L. A review of energy efficiency in ports: Operational strategies, technologies and energy management systems. Renew. Sustain. Energy Rev. 2019, 112, 170–182. [Google Scholar] [CrossRef]
  12. The Long-Term Strategy of the United States Pathways to Net-Zero Greenhouse Gas. 2021. Available online: https://bidenwhitehouse.archives.gov/wp-content/uploads/2021/10/US-Long-Term-Strategy.pdf#:~:text=In%202021%2C%20we%20rejoined%20the%20Paris%20Agreement%2C%20set,actions%20to%20advance%20climate%20action%20domestically%20and%20internationally (accessed on 6 May 2025).
  13. Wang, P.; Hu, Q.Y.; Xie, W.X.; Wu, L.; Wang, F.; Mei, Q. Big data-driven carbon emission traceability list and characteristics of ships in maritime transportation-a case study of Tianjin Port. Environ. Sci. Pollut. Res. 2023, 30, 71103–71119. [Google Scholar] [CrossRef]
  14. Feng, Y.; Wang, X.; Luan, J.; Wang, H.; Li, H.; Li, H.; Liu, Z.; Yang, Z. A novel method for ship carbon emissions prediction under the influence of emergency events. Transp. Res. Part C Emerg. Technol. 2024, 165, 104749. [Google Scholar] [CrossRef]
  15. Toscano, D.; Murena, F.; Quaranta, F.; Mocerino, L. Assessment of the impact of ship emissions on air quality based on a complete annual emission inventory using AIS data for the port of Naples. Ocean Eng. 2021, 232, 109166. [Google Scholar] [CrossRef]
  16. Yang, H.; Ma, X.; Xing, Y. Trends in CO2 Emissions from China-Oriented International Marine Transportation Activities and Policy Implications. Energies 2017, 10, 980. [Google Scholar] [CrossRef]
  17. Endresen, Ø.; Sørgård, E.; Sundet, J.K.; Dalsøren, S.B.; Isaksen, I.S.; Berglen, T.F.; Gravir, G. Emission from international sea transportation and environmental impact. J. Geophys. Res. Atmos. 2003, 108, 4560. [Google Scholar] [CrossRef]
  18. Nguyen, P.-N.; Woo, S.-H.; Kim, H. Ship emissions in hotelling phase and loading/unloading in Southeast Asia ports. Transp. Res. Part D Transp. Environ. 2022, 105, 103223. [Google Scholar] [CrossRef]
  19. Wang, K.; Wang, J.H.; Huang, L.Z.; Yuan, Y.P.; Wu, G.T.; Xing, H.; Wang, Z.Y.; Wang, Z.; Jiang, X.L. A comprehensive review on the prediction of ship energy consumption and pollution gas emissions. Ocean Eng. 2022, 266, 112826. [Google Scholar] [CrossRef]
  20. Chen, S.K.; Meng, Q.; Jia, P.; Kuang, H.B. An operational-mode-based method for estimating ship emissions in port waters. Transp. Res. Part D Transp. Environ. 2021, 101, 103080. [Google Scholar] [CrossRef]
  21. Chen, Z.S.; Lam, J.S.L.; Xiao, Z. Prediction of harbour vessel emissions based on machine learning approach. Transp. Res. Part D Transp. Environ. 2024, 131, 104214. [Google Scholar] [CrossRef]
  22. Chen, D.S.; Wang, X.T.; Li, Y.; Lang, J.L.; Zhou, Y.; Guo, X.R.; Zhao, Y.H. High-spatiotemporal-resolution ship emission inventory of China based on AIS data in 2014. Sci. Total Environ. 2017, 609, 776–787. [Google Scholar] [CrossRef]
  23. Juan-Carlos, M.G. Analysis and measurement of SOx, CO2, PM and NOx emissions in port auxiliary vessels. Environ. Monit. Assess. 2021, 193, 374. [Google Scholar] [CrossRef]
  24. Fuentes Garcia, G.; Baldasano Recio, J.M.; Sosa Echeverria, R.; Granados Hernandez, E.; Zamora Vargas, E.; Antonio Duran, R.; Kahl, J.W. Estimation of atmospheric emissions from maritime activity in the Veracruz port, Mexico. J. Air Waste Manag. Assoc. 2021, 71, 934–948. [Google Scholar] [CrossRef] [PubMed]
  25. Li, Y.; Li, H.; Zhang, C.; Zhao, Y.; Yang, Z. Incorporation of adaptive compression into a GPU parallel computing framework for analyzing large-scale vessel trajectories. Transp. Res. Part C Emerg. Technol. 2024, 163, 104648. [Google Scholar] [CrossRef]
  26. Dettner, F.; Hilpert, S. Modelling CO2 emissions and mitigation potential of Northern European shipping. Transp. Res. Part D Transp. Environ. 2023, 119, 1313. [Google Scholar] [CrossRef]
  27. Yuan, Y.; Zhang, Y.; Mao, J.; Yu, G.; Xu, K.; Zhao, J.; Qian, H.; Wu, L.; Yang, X.; Chen, Y.; et al. Diverse changes in shipping emissions around the Western Pacific ports under the coeffect of the epidemic and fuel oil policy. Sci. Total Environ. 2023, 879, 162892. [Google Scholar] [CrossRef]
  28. Jalkanen, J.-P.; Brink, A.; Kalli, J.; Pettersson, H.; Kukkonen, J.; Stipa, T. A modelling system for the exhaust emissions of marine traffic and its application in the Baltic Sea area. Atmos. Chem. Phys. 2009, 9, 9209–9223. [Google Scholar] [CrossRef]
  29. Jalkanen, J.-P.; Johansson, L.; Kukkonen, J. A comprehensive inventory of ship traffic exhaust emissions in the European sea areas in 2011. Atmos. Chem. Phys. 2016, 16, 71–84. [Google Scholar] [CrossRef]
  30. Johansson, L.; Jalkanen, J.-P.; Kukkonen, J. Global assessment of shipping emissions in 2015 on a high spatial and temporal resolution. Atmos. Environ. 2017, 167, 403–415. [Google Scholar] [CrossRef]
  31. Li, H.; Jia, P.; Wang, X.; Yang, Z.; Wang, J.; Kuang, H. Ship carbon dioxide emission estimation in coastal domestic emission control areas using high spatial-temporal resolution data: A China case. Ocean Coast. Manag. 2023, 232, 106419. [Google Scholar] [CrossRef]
  32. Weng, J.; Shi, K.; Gan, X.; Li, G.; Huang, Z. Ship emission estimation with high spatial-temporal resolution in the Yangtze River estuary using AIS data. J. Clean. Prod. 2020, 248, 119297. [Google Scholar] [CrossRef]
  33. Li, Y.; Jia, P.; Jiang, S.; Li, H.; Kuang, H.; Hong, Y.; Wang, S.; Zhao, X.; Guan, D. The climate impact of high seas shipping. Natl. Sci. Rev. 2023, 10, nwac279. [Google Scholar] [CrossRef] [PubMed]
  34. Sun, Y.; Lian, F.; Yang, Z. Analysis of the activities of high sea fishing vessels from China, Japan, and Korea via AIS data mining. Ocean Coast. Manag. 2023, 242, 106690. [Google Scholar] [CrossRef]
  35. Mou, N.; Zhang, X.; Yang, T.; Xu, H.; Zheng, Y.; Wang, J.; Niu, J. Carbon footprints: Uncovering multilevel spatiotemporal changes of ship emissions during 2019–2021 in the US. Sci. Total Environ. 2024, 912, 169395. [Google Scholar] [CrossRef] [PubMed]
  36. He, Z.; Lam, J.S.L.; Liang, M. Impact of Disruption on Ship Emissions in Port: Case of Pandemic in Long Beach. Sustainability 2023, 15, 7215. [Google Scholar] [CrossRef]
  37. Xiao, G.; Wang, T.; Chen, X.; Zhou, L. Evaluation of Ship Pollutant Emissions in the Ports of Los Angeles and Long Beach. J. Mar. Sci. Eng. 2022, 10, 1206. [Google Scholar] [CrossRef]
  38. Styhre, L.; Winnes, H.; Black, J.; Lee, J.; Le-Griffin, H. Greenhouse gas emissions from ships in ports—Case studies in four continents. Transp. Res. Part D Transp. Environ. 2017, 54, 212–224. [Google Scholar] [CrossRef]
  39. Venturini, G.; Iris, C.; Kontovas, C.A.; Larsen, A. The multi-port berth allocation problem with speed optimization and emission considerations. Transp. Res. Part D Transp. Environ. 2017, 54, 142–159. [Google Scholar] [CrossRef]
  40. Ye, J.; Chen, J.; Wen, H.; Wan, Z.; Tang, T. Emissions assessment of bulk carriers in China’s east Coast-Yangtze River maritime network based on different shipping modes. Ocean Eng. 2022, 249, 110903. [Google Scholar] [CrossRef]
  41. Wang, X.; Yi, W.; Lv, Z.; Deng, F.; Zheng, S.; Xu, H.; Zhao, J.; Liu, H.; He, K. Ship emissions around China under gradually promoted control policies from 2016 to 2019. Atmos. Chem. Phys. 2021, 21, 13835–13853. [Google Scholar] [CrossRef]
  42. Qi, Y.; Yang, J.; Qin, K.S. Spatial-temporal analysis of carbon emissions from ships in ports based on AIS data. Ocean Eng. 2024, 308, 118394. [Google Scholar] [CrossRef]
  43. Sun, Z.; Xu, S.; Jiang, J. Spatial-temporal characteristics of ship carbon emission based on AIS data. Ocean Coast. Manag. 2025, 265, 107629. [Google Scholar] [CrossRef]
  44. Meng, Z.; Comer, B. Electrifying Ports to Reduce Diesel Pollution from Ships and Trucks and Benefit Public Health: Case Studies of the PORT of Seattle and the Port of New York and New Jersey; International Council on Clean Transportation: Washington, DC, USA, 2023. [Google Scholar]
  45. Semchukova, V.; Topolski, K.; Abdin, Z. Hydrogen technology for maritime applications: A review of challenges, opportunities, and lessons from the port authority of New York and New Jersey. Renew. Sustain. Energy Rev. 2025, 216, 115641. [Google Scholar] [CrossRef]
  46. Chen, Y.; Chen, Y.; Cui, Y.; Cai, X.; Yin, C.; Cheng, Y. Optimizing vessel trajectories: Advanced denoising and interpolation techniques for AIS data. Ocean Eng. 2025, 327, 120988. [Google Scholar] [CrossRef]
  47. Huang, L.; Wen, Y.; Zhang, Y.; Zhou, C.; Zhang, F.; Yang, T. Dynamic calculation of ship exhaust emissions based on real-time AIS data. Transp. Res. Part D Transp. Environ. 2020, 80, 102277. [Google Scholar] [CrossRef]
  48. Issa Zadeh, S.B.; López Gutiérrez, J.S.; Esteban, M.D.; Fernández-Sánchez, G.; Garay-Rondero, C.L. A Framework for Accurate Carbon Footprint Calculation in Seaports: Methodology Proposal. J. Mar. Sci. Eng. 2023, 11, 1007. [Google Scholar] [CrossRef]
  49. Huang, H.; Zhou, C.; Huang, L.; Xiao, C.; Wen, Y.; Li, J.; Lu, Z. Inland ship emission inventory and its impact on air quality over the middle Yangtze River, China. Sci. Total Environ. 2022, 843, 156770. [Google Scholar] [CrossRef]
  50. Cai, X.; Chen, Y.; Chen, Y. Estimation and analysis of carbon emissions from ships in the Yangtze River Delta coastal region based on AIS data. Acta Sci. Circumstantiae 2024, 44, 83–97. (In Chinese) [Google Scholar] [CrossRef]
  51. Zeng, F.; Jing, L. Ship emission inventory and valuation of eco-efficiency in Xiamen PortShip emission inventory and valuation of eco-efficiency in Xiamen Port. China Environ. Sci. 2020, 40, 2304–2311. [Google Scholar] [CrossRef]
  52. EPA. Port Emissions Inventory Guidance: Methodologies for Estimating Port-Related and Goods Movement Mobile Source Emissions; Environmental Protection Agency: Washington, DC, USA, 2022. [Google Scholar]
  53. Yu, H.; Fang, Q.; Fang, Z.; Xu, L.; Liu, J. Carbon footprints: Uncovering spatiotemporal dynamics of global container ship emissions during 2015–2021. Mar. Pollut. Bull. 2024, 209, 117165. [Google Scholar] [CrossRef]
  54. Yao, D.; Yue, M.; Zhang, X.; Wu, F.; Cheng, S. Model for Predicting Ship Emission Pollutants Based on MASTGCN using AIS Information. J. Transp. Inf. Saf. 2025, 43, 63–73. (In Chinese) [Google Scholar] [CrossRef]
  55. Lv, Z.; Liu, H.; Ying, Q.; Fu, M.; Meng, Z.; Wang, Y.; Wei, W.; Gong, H.; He, K. Impacts of shipping emissions on PM2.5 pollution in China. Atmos. Chem. Phys. 2018, 18, 15811–15824. [Google Scholar] [CrossRef]
  56. Ding, Y.; Hu, Z.; Dong, D. A density prediction method for fishing vessel based on deep learning and fusion of spatial-temporal features. J. Appl. Oceanogr. 2024, 43, 350–359. (In Chinese) [Google Scholar] [CrossRef]
  57. Goldsworthy, L.; Goldsworthy, B. Modelling of ship engine exhaust emissions in ports and extensive coastal waters based on terrestrial AIS data—An Australian case study. Environ. Model. Softw. 2015, 63, 45–60. [Google Scholar] [CrossRef]
  58. Chen, X.; Dou, S.; Song, T.; Wu, H.; Sun, Y.; Xian, J. Spatial-Temporal Ship Pollution Distribution Exploitation and Harbor Environmental Impact Analysis via Large-Scale AIS Data. J. Mar. Sci. Eng. 2024, 12, 960. [Google Scholar] [CrossRef]
  59. Eide, M.S.; Longva, T.; Hoffmann, P.; Endresen, Ø.; Dalsøren, S.B. Future cost scenarios for reduction of ship CO2 emissions. Marit. Policy Manag. 2011, 38, 11–37. [Google Scholar] [CrossRef]
  60. Johnson, H.; Styhre, L. Increased energy efficiency in short sea shipping through decreased time in port. Transp. Res. Part A Policy Pract. 2015, 71, 167–178. [Google Scholar] [CrossRef]
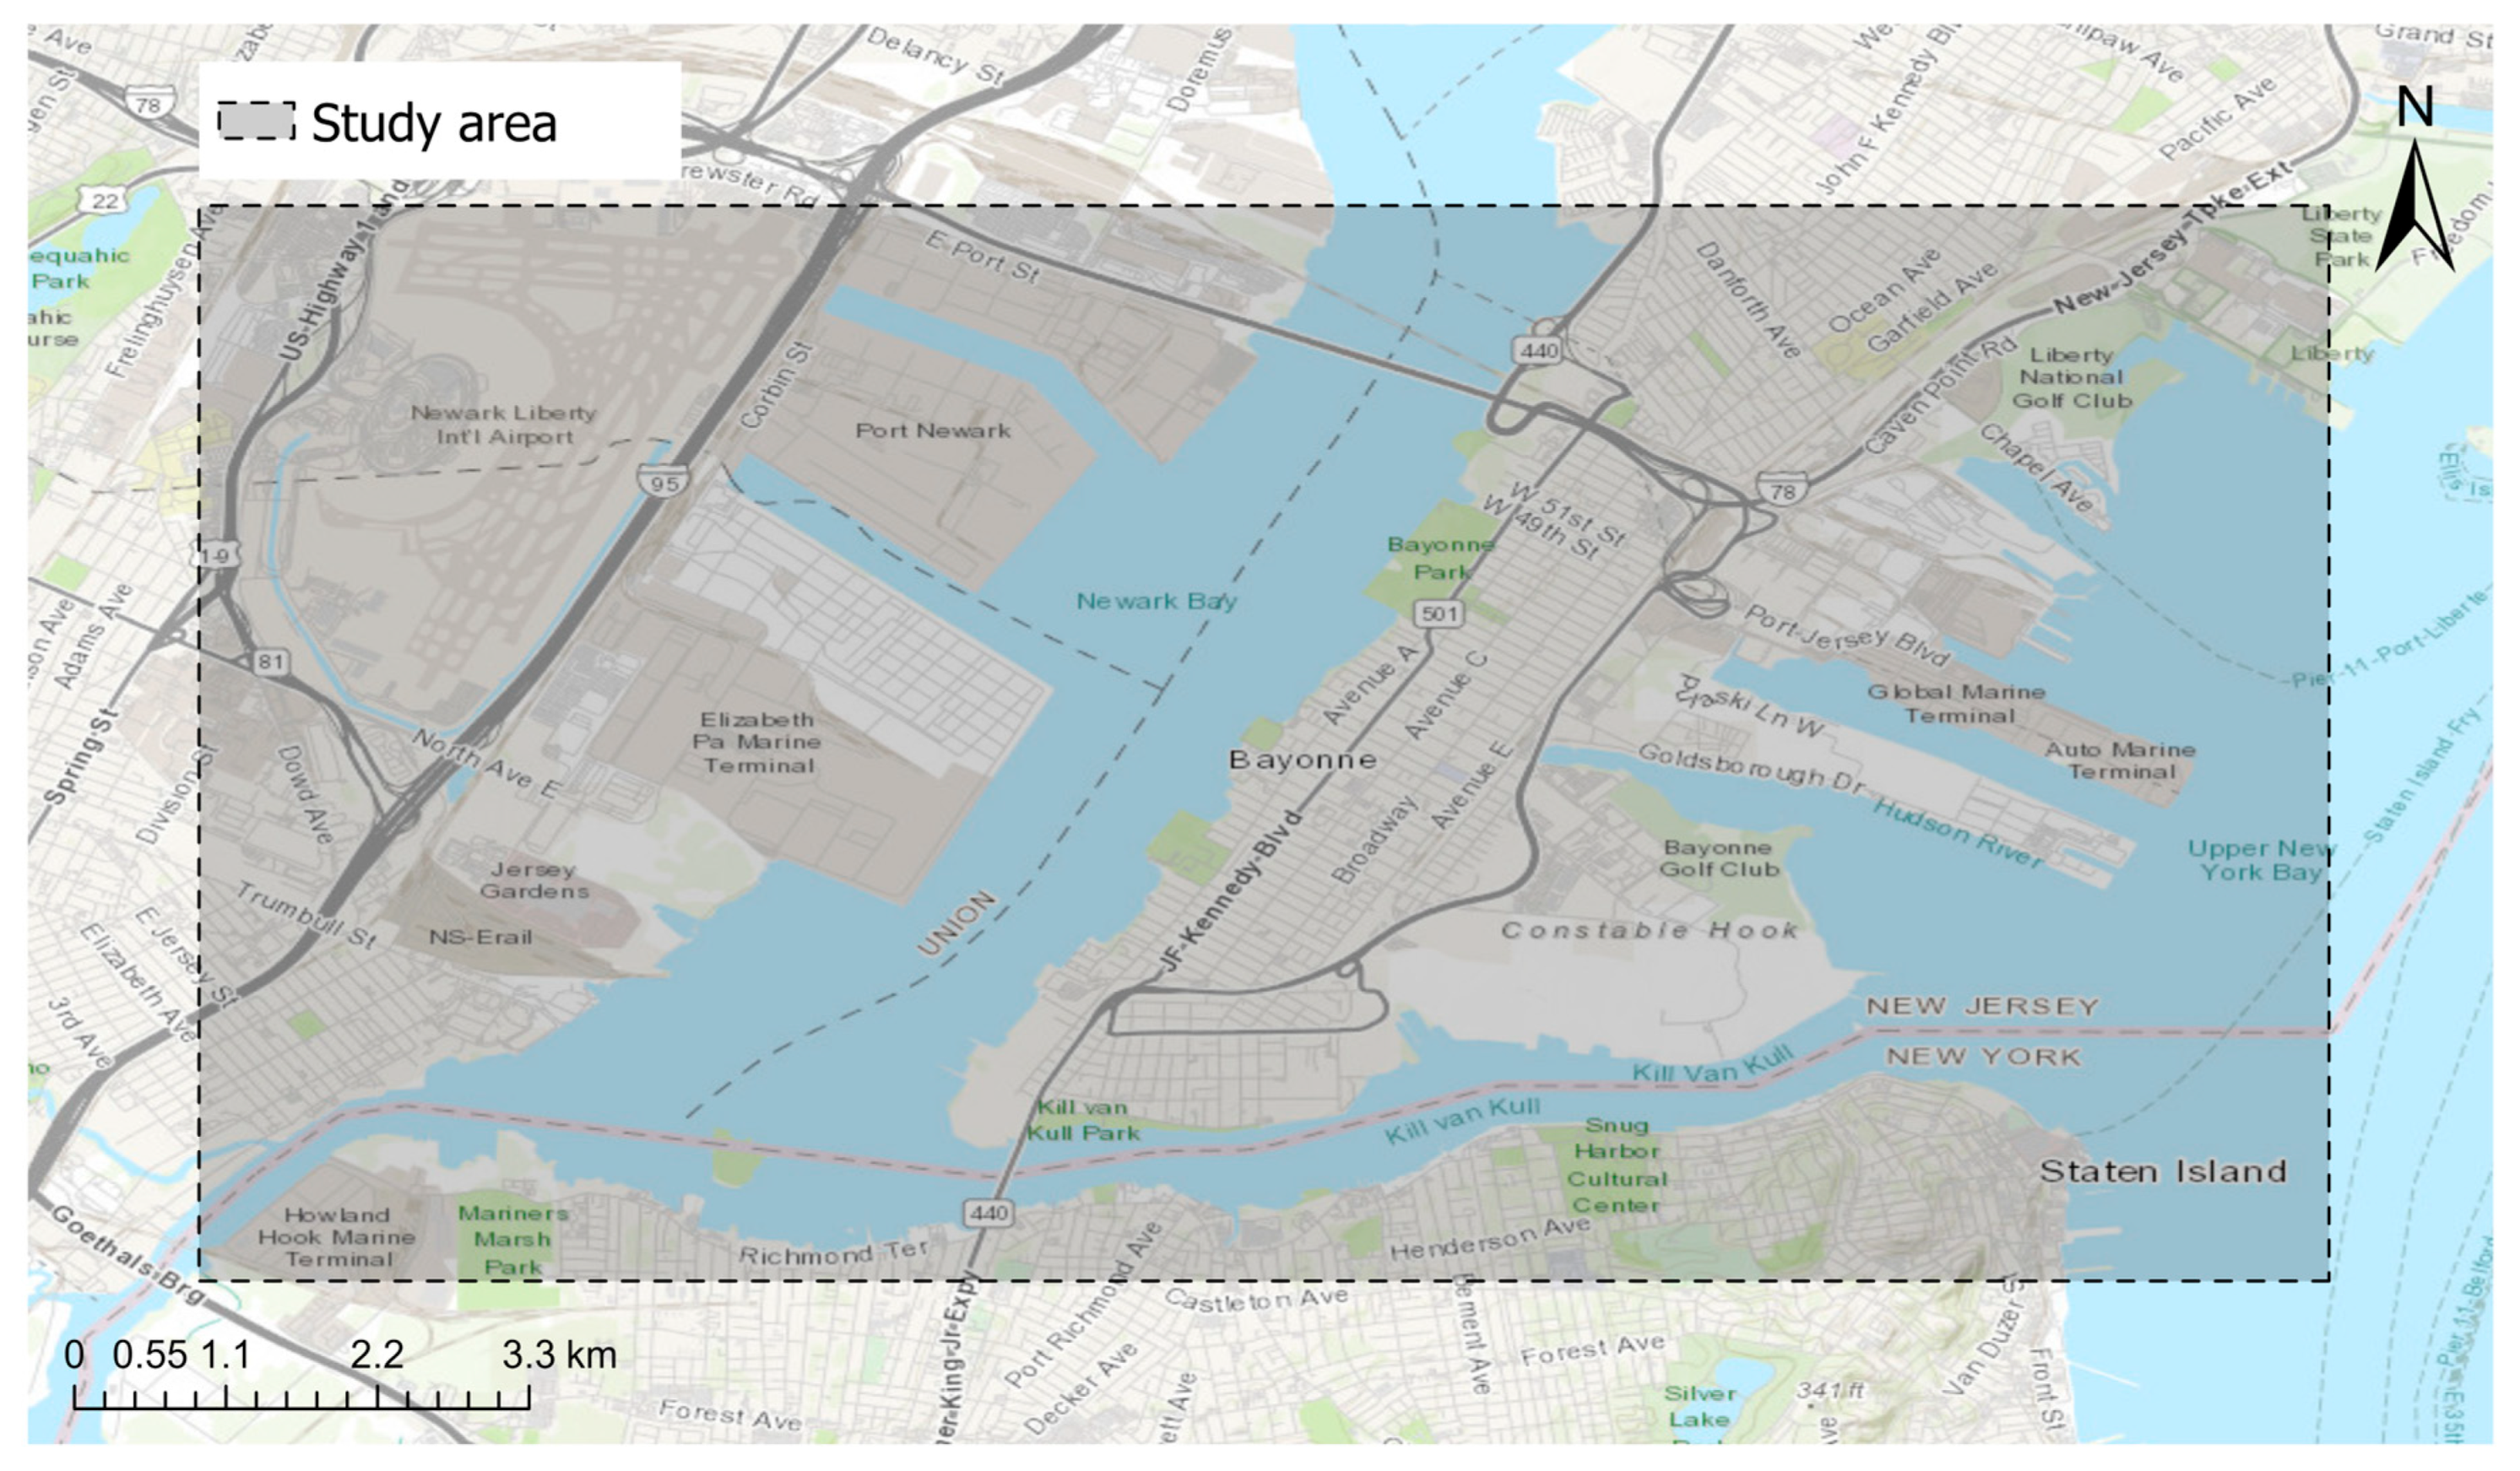
Figure 1. Study area (delineated by the gray box).
Jmse 13 02199 g001
Figure 2. Abnormal Trajectory Point. (a) AIS data points located on land (b) AIS data points deviating from the overall trajectory.
Jmse 13 02199 g002
Figure 3. Comparison of trajectories before and after interpolation.
Jmse 13 02199 g003
Figure 4. Framework for Spatiotemporal Analysis of Ship Carbon Emission.
Jmse 13 02199 g004
Figure 5. Characteristic-related heat map.
Jmse 13 02199 g005
Figure 6. Exponential regression of ME power and GT.
Jmse 13 02199 g006
Figure 7. Exponential regression of GT and Ship dimensions (Length × Width).
Jmse 13 02199 g007
Figure 8. Vector and grid representations of the study area. (a) represents the vector of the study area, and (b) represents the meshing result of the study area.
Jmse 13 02199 g008
Figure 9. Vessel Emission Allocation. (a) Vessel trajectory. (b) Trajectory segmentation. (c) Emission allocation.
Jmse 13 02199 g009
Figure 10. Carbon emissions from different ship types (unit: t). Results represent total absolute emissions estimated using the STEAM model from February to November 2023.
Jmse 13 02199 g010
Figure 11. Carbon emissions from different operation states.
Jmse 13 02199 g011
Figure 12. Carbon emissions of various ship types in different months.
Jmse 13 02199 g012
Figure 13. Carbon emissions of various Operation states from 2 to 11 months.
Jmse 13 02199 g013
Figure 14. The distribution of carbon emissions in the study area (WGS 84 Mercator coordinate system).
Jmse 13 02199 g014
Table 1. AIS attribute fields and example.
TypeNameDescriptionExample
Static dataMMSIMaritime Mobile Service Identity value211549000
Vessel nameName as shown on the station radio licenseBASLE EXPRESS
IMOInternational Maritime Organization
Vessel number
IMO 9501344
CallsignCall sign as assigned by the FCCDFGN2
Vessel typeVessel type as defined in NAIS specifications71
LengthLength of vessel366.5
WidthWidth of vessel48.2
Dynamic dataBaseDateTimeFull UTC date and time2023-10-01T00:14:20
HeadingTrue Heading299.0
LatLatitude40.67105
LonLongitude−74.08014
COGCourse Over Ground118.5
SOGSpeed Over Ground15.3
DraftDraft depth of the vessel12
StatusNavigation status as defined by the COLREGS5
Note: The ‘Navigation status’ field is listed only to indicate data availability in AIS records (as defined by COLREGS) and was not used in the emission analysis.
Table 2. Data cleaning standard.
TypeStandard
Erroneous DataEliminate data where Speed is not within the range of 0–40, Length is not within the range of 0–460, MMSI is not a 9-digit number, and Width is not within the range of 0–70.
Missing dataClear data where MMSI, Longitude, Latitude, Length, and Width are 0 or empty, and Speed is empty, and the vessel type is unknown.
Repeating dataRemove all data where the values of all attribute fields are identical.
Table 3. Operation State and Its Classification Criteria.
Operation StateSpeed RangeMCR
Berthing<1 knot-
Anchoring1 knot–3 knot-
Maneuvering>3 knot<20%
Low-cruise-20–65%
Cruising->65%
Table 4. Fitting functions for ME power of various ship types.
Ship TypeFitting Function for GT and ME Power (P = a × GTb)R2Confidence Intervals for Parameter aConfidence Intervals for Parameter bRMSESample Size
CargoP = 8.3639GT0.67810.7573(3.884495702,
12.84349083)
(0.628507522,
0.727612009)
9881.98332
TugboatP = 46.7180GT0.70030.7494(29.200797945,
64.23507654)
(0.757725278,
0.749373984)
133.17151
Oil tankerP = 27.7301GT0.560787950.7605(20.20188239,
35.25851495)
(0.535145684,
0.586429649)
3716.44572
PassengerP = 6.3014GT0.79040.8087(−3.90065513,
16.50330914)
(0.65108011,
0.929711886)
13,439.6133
OtherP = 2.7800GT0.750.90
(Cai et al. [50])
----
Table 5. Fitting Equations and fitting performance for Ship Dimensions and GT.
Ship TypeFitting Function for Ship Dimensions and GT (GT = a × (L × W)b)R2Confidence Intervals for Parameter aConfidence Intervals for Parameter bRMSESample Size
CargoGT = 2.2972 × 10⁻⁵ (L × W)2.450340.7318(−2.13112 × 10⁻⁵,
6.72556 × 10⁻⁵)
(2.230564379,
2.670117776)
2044.28333
TugboatGT = 0.1182(L × W)1.41060.8424(0.062301327,
0.174036567)
(1.335656297,
1.485640872)
883.24149
Oil tankerGT = 0.4980(L × W)1.26520.9554(0.398865364,
0.597105437)
(1.243274854,
1.287188435)
1474.78572
PassengerGT = 0.64514(L × W)1.28770.9258(−0.071006014,
1.361314095)
(1.169704898,
1.405681557)
11780.9753
OtherGT = 0.04(L × W)1.520.98
(Cai et al. [50])
----
Table 6. AE Power and design speed determination.
Ship TypeAE/ME Power RatioMaximum Design Speed/Knot
Container0.22020.6
Cargo0.19111
Tugboat0.22210.2
Oil tanker0.21110
Passenger0.27822
Other0.2229.3
Table 7. Determination of Boiler Power.
Ship TypeSizeUnitAuxiliary Boiler Power (kW)
At BerthAnchoredManeuveringCruise
Container0–999TEU2502502400
1000–19993403403100
2000–29994604504300
3000–49994804804300
5000–79995905805500
8000–11,9996206205400
12,000–19,9996306306300
≥20,0007007007000
Cargo0–4999DWT0000
5000–99991101101000
≥10,0001501501300
Oil tanker0–4999DWT5001001000
5000–99997501501500
10,000–19,99912502502500
20,000–59,9992700270270270
60,000–79,9993250360360280
80,000–119,9994000400400280
120,000–199,9996500500500300
≥200,0007000600600300
Tug-GT0000
Passenger0–1999GT0000
2000–999911009509800
Other-GT0000
Table 8. Determination of AE load factor.
Operation StateBerthingAnchoringManeuveringLow-CruiseCruising
AE Load0.190.480.250.130.13
Table 9. Main engine types.
GT\Ship TypeContainerCargoTugboatOil TankerPassengerOther
≤5000MSDMSDMSDMSDMSDMSD
5000–25,000SSDSSDMSDSSDMSDMSD
>25,000SSDSSDSSDMSDSSDSSD
Table 10. Emission Factors for Engines, g/kWh.
Machine TypeEngine TypeCO2
MESSD620
MEMSD683
MEHSD686
AEMSD683
Disclaimer/Publisher’s Note: The statements, opinions and data contained in all publications are solely those of the individual author(s) and contributor(s) and not of MDPI and/or the editor(s). MDPI and/or the editor(s) disclaim responsibility for any injury to people or property resulting from any ideas, methods, instructions or products referred to in the content.