3.1. Open Water Performance of the Model Propeller
As shown in this section, the proposed method was used with the toroidal propeller geometry published in Ye et al. (2024) [
10] to validate the hydrodynamic BEM approach. The detailed geometric profiles defined along the axial span are provided in their paper; therefore, only the key specifications of the model propeller are summarized in
Table 1. More recently, Wang et al. (2024) [
2] and Kim et al. (2025) [
6] (in Korean) tested the same geometry using Reynolds-averaged Navier–Stokes (RANS) simulations, investigating various parameter sets to assess their influence on propeller performance. Their findings provide a database for the selection of appropriate geometric parameters in both the design and analysis of future toroidal propellers.
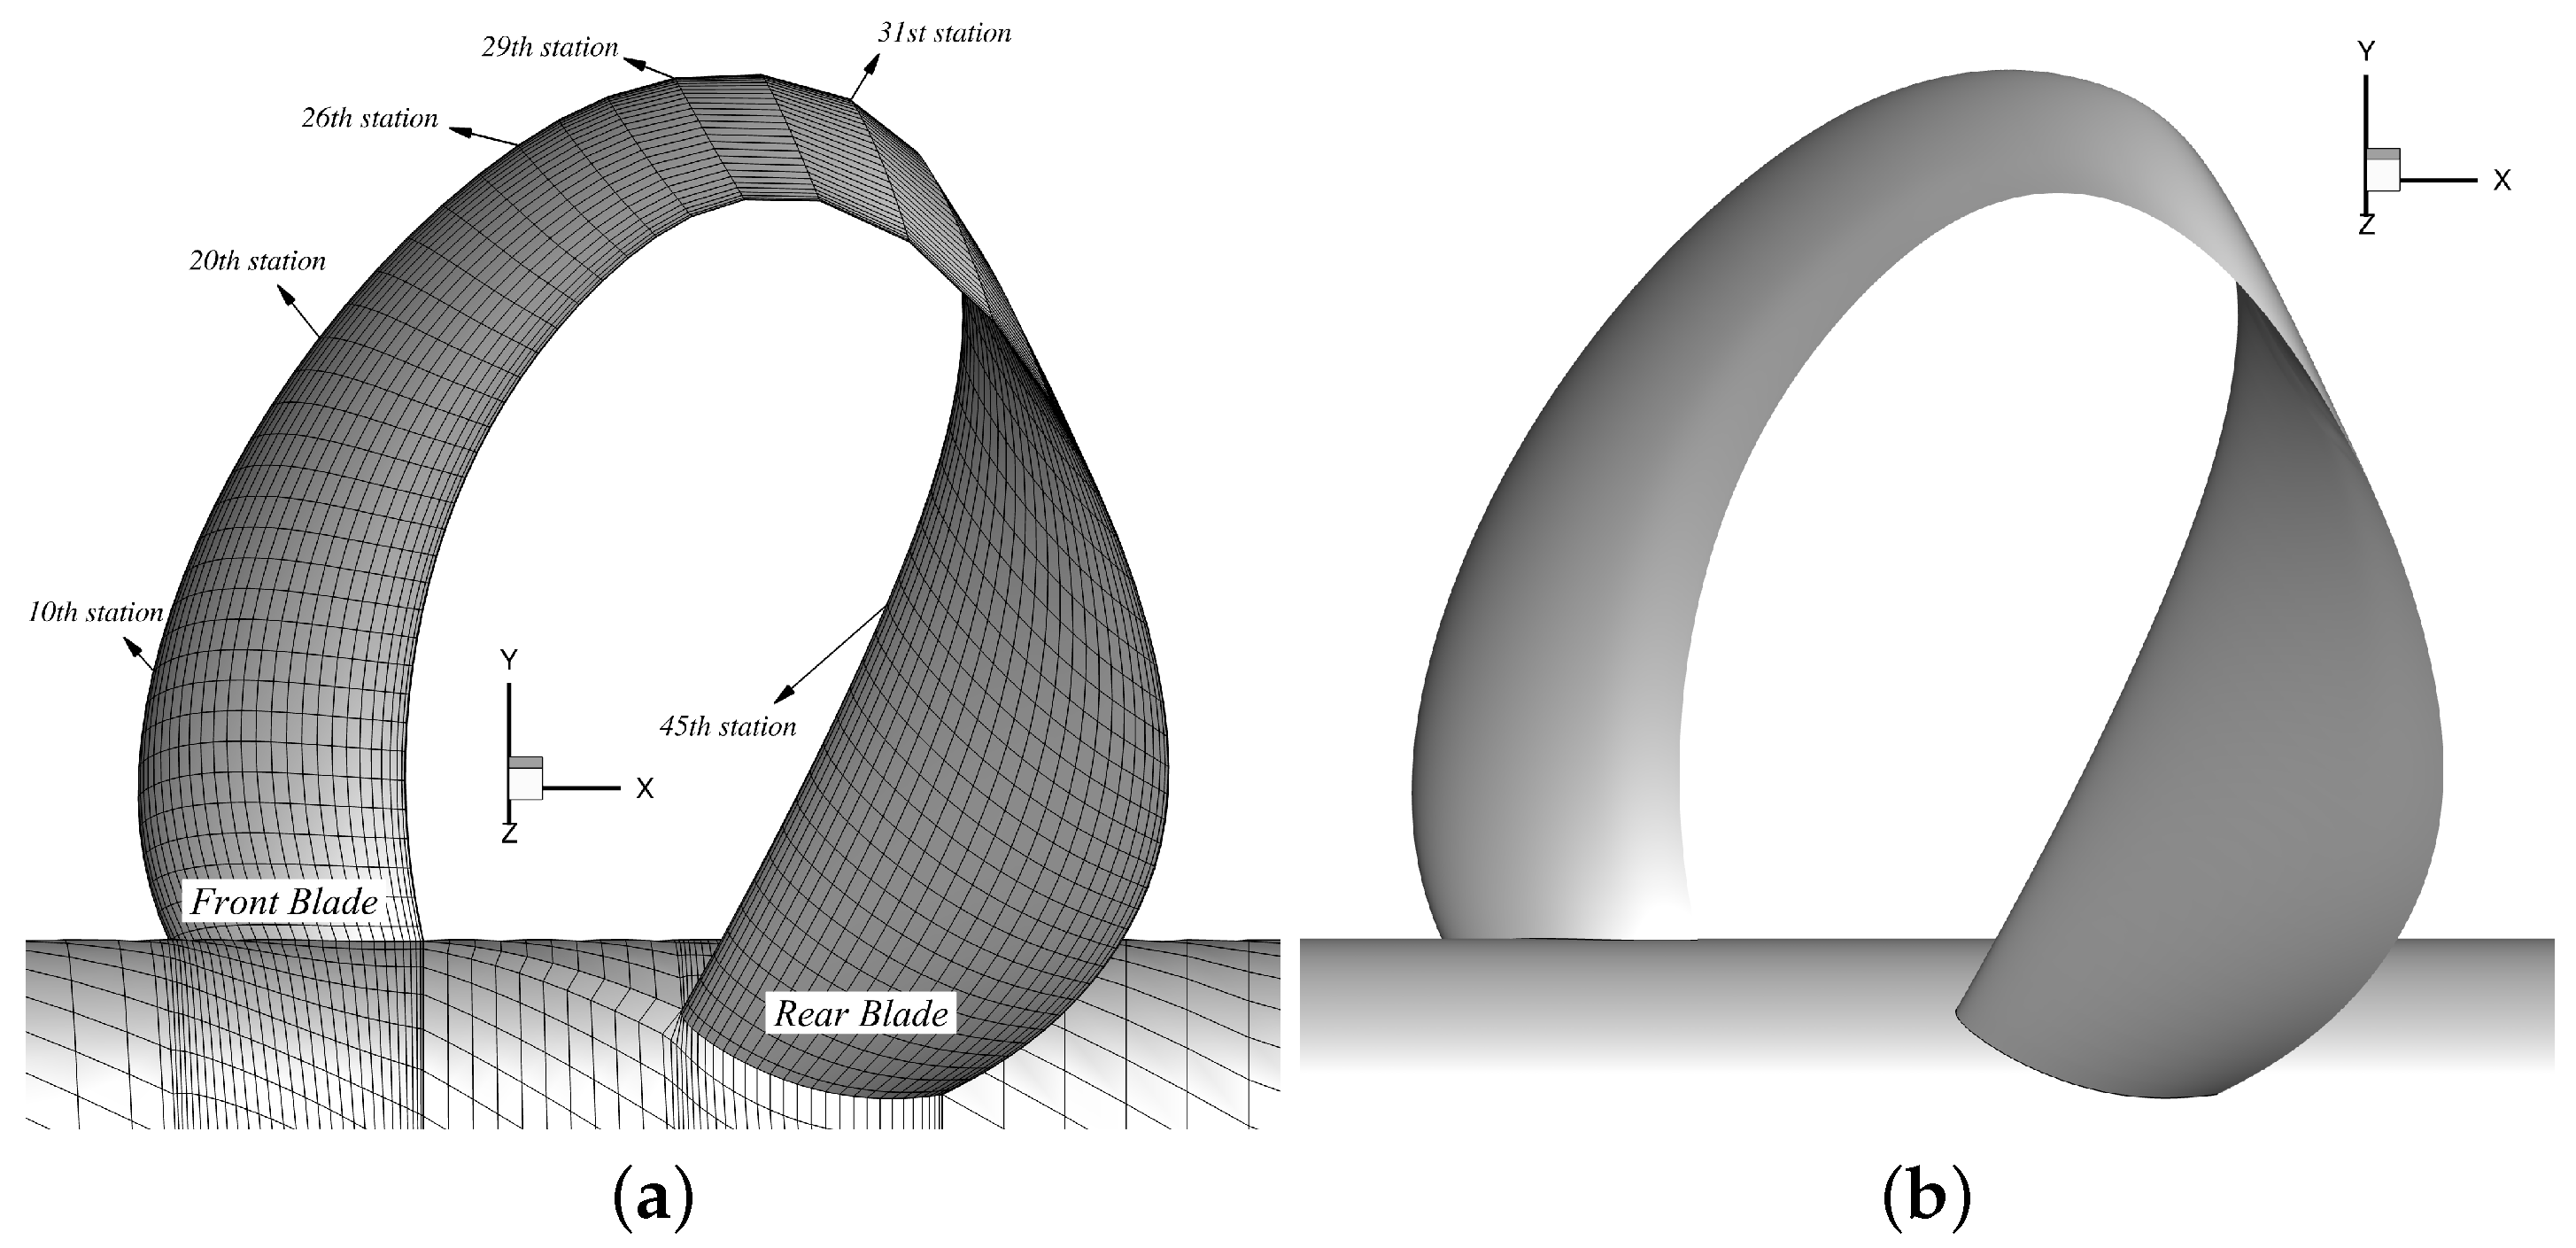
For BEM discretization, the proposed method, using 60 panels in both directions (
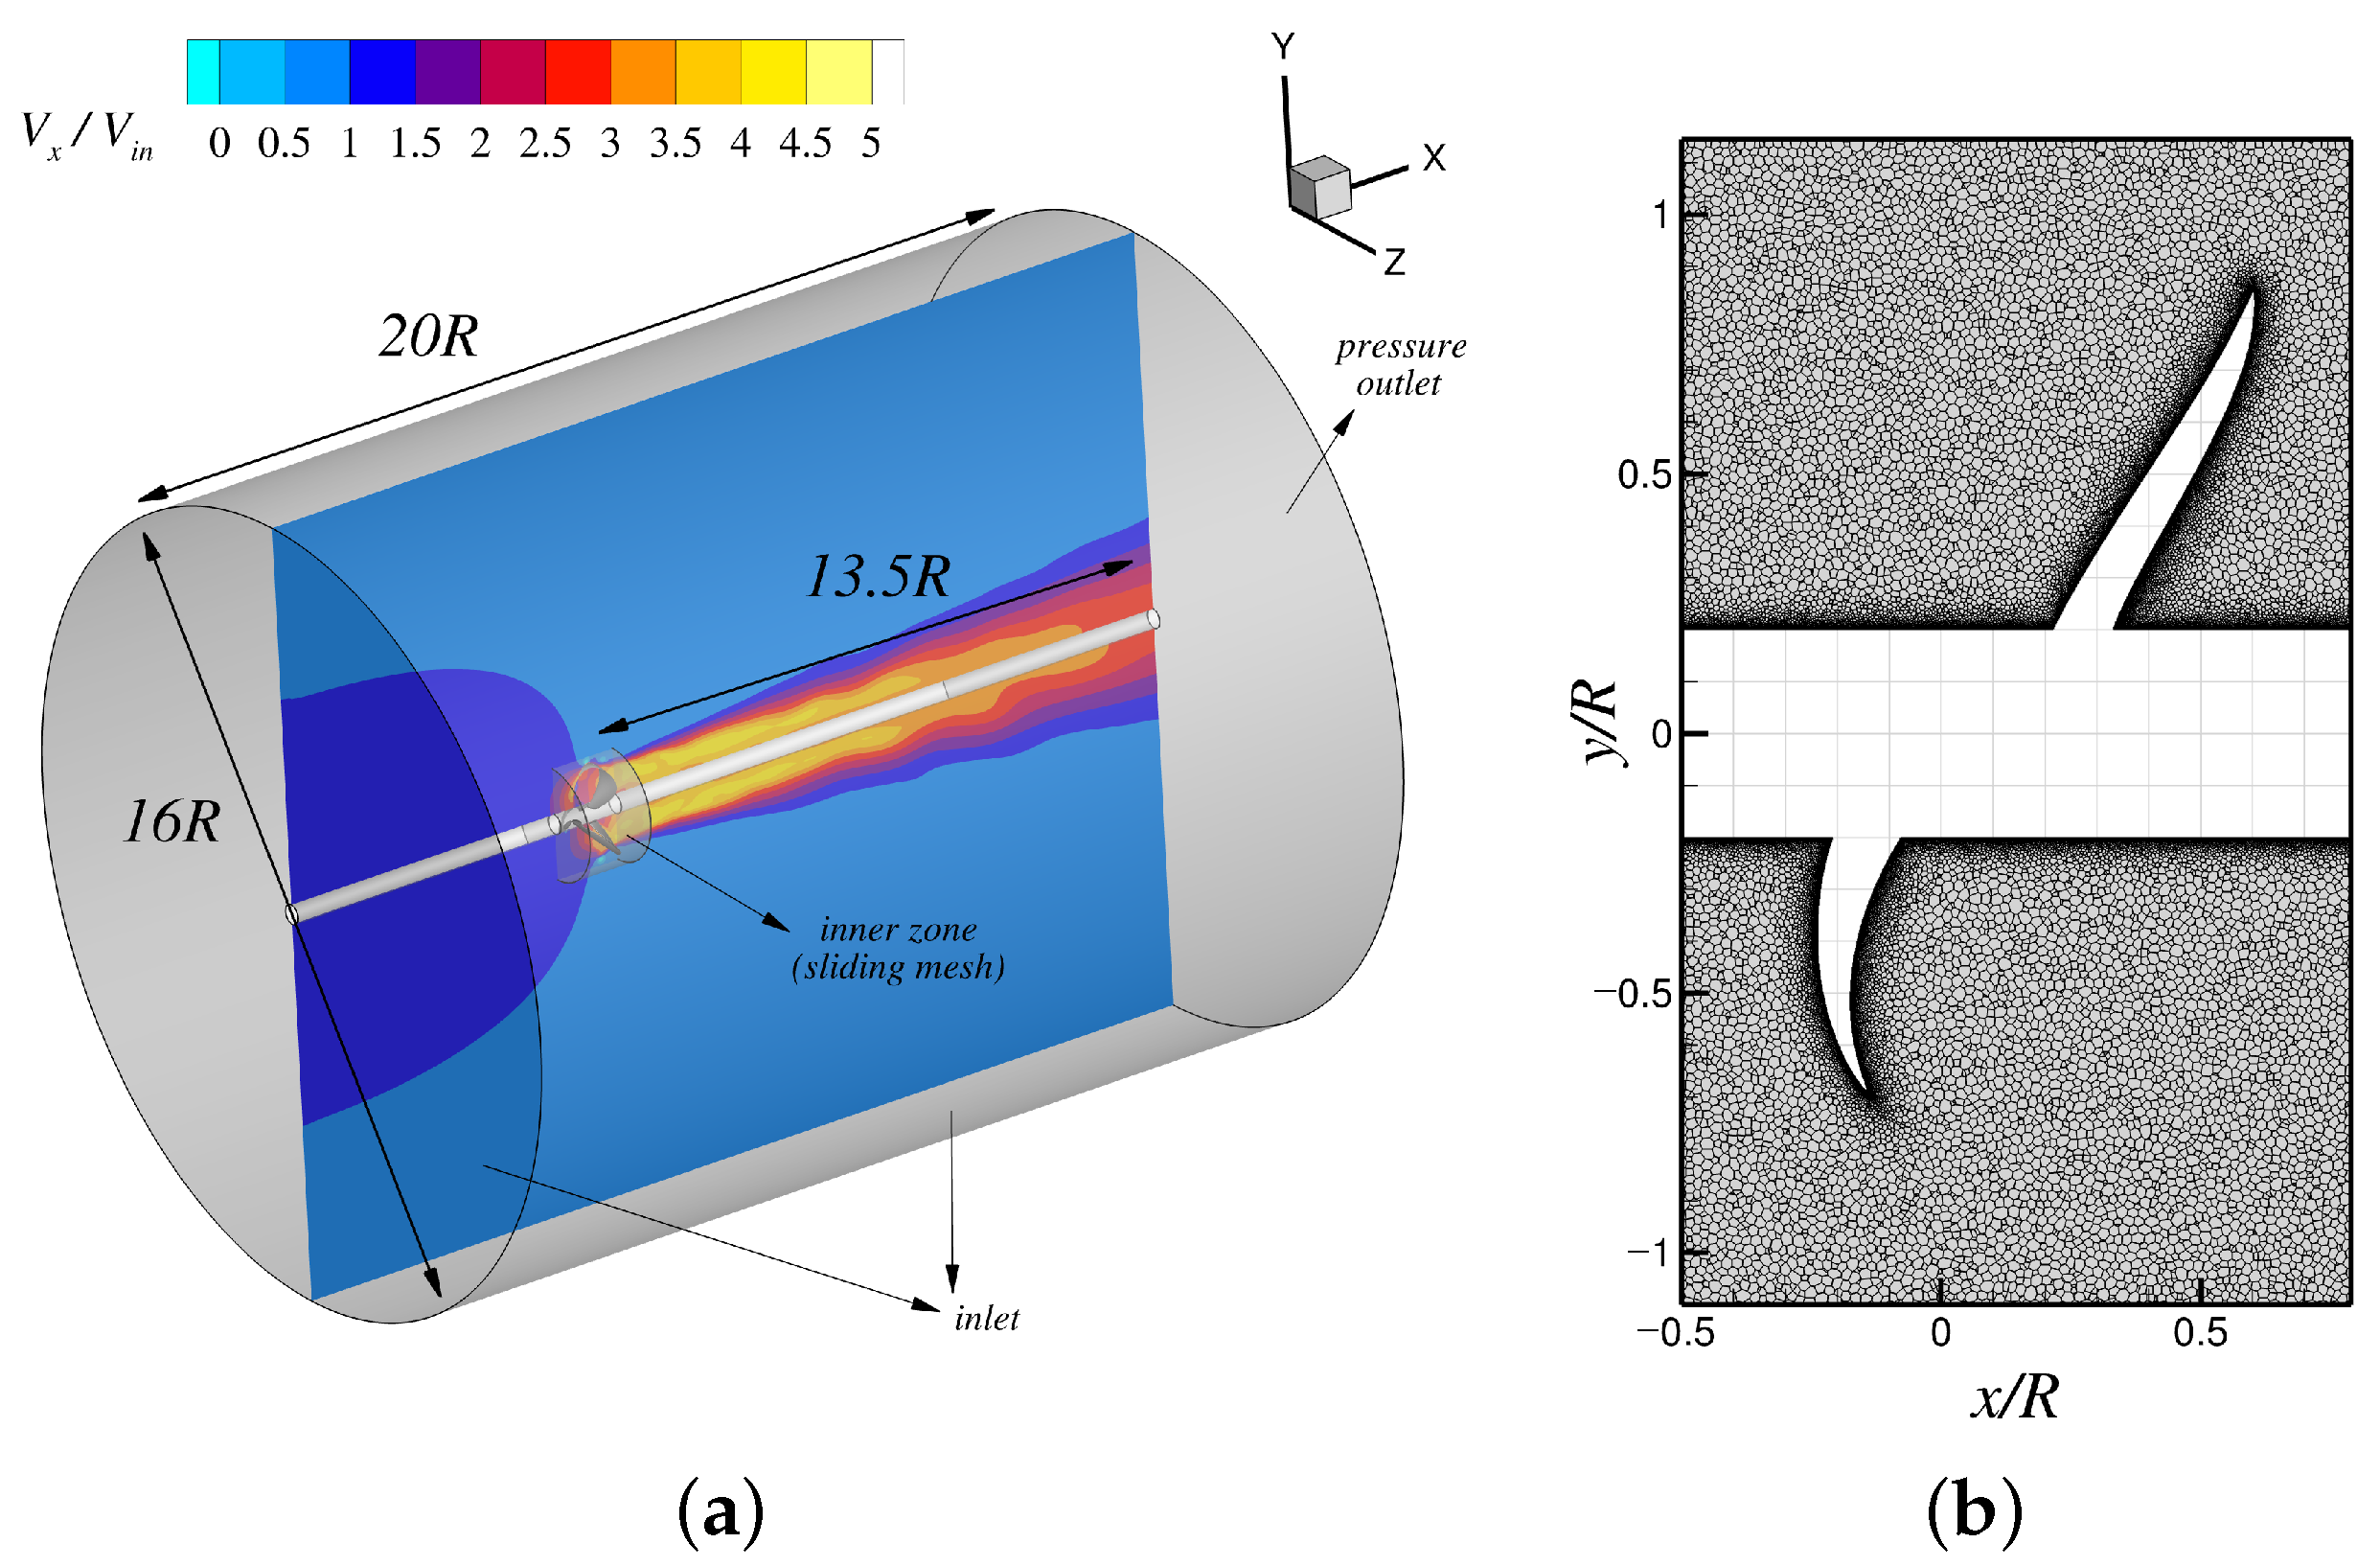
Figure 9a), utilizes full-cosine spacing in the chordwise direction and uniform spacing in the spanwise direction. For additional validation of the BEM results, RANS simulations were conducted in this study using ANSYS/Fluent (version 2022 R1).
Figure 9b and
Figure 10a show the model propeller used in the RANS simulations and the computational domain with applied boundary conditions, respectively. The RANS simulations were performed in a fully unsteady manner with a time-step size of
per blade motion. The
SST turbulence model was adopted with a Reynolds number of
, which was defined based on the upstream speed
and the propeller radius
R. A second-order implicit scheme was used for time advancement in transient mode. Polyhedral grids were employed in the inner rotating zone (
Figure 10b) that conformed with the rotating blades, while quadrilateral grids were given elsewhere. The overall domain dimensions were set wide enough to avoid tunnel effects. The QUICK and SIMPLEC schemes were selected for spatial discretization and pressure–velocity coupling, respectively. Convergence residuals were set to
for all solving variables, and most of them met the tolerance except for the continuity, which remained around
after 30 iterations per time step. About 22.6 million cells were used to discretize the whole computational domain, and each simulation took more than one day per advance ratio to achieve stabilized forces (without mesh generation time), with a longer runtime observed for low advance ratios. Although most of the simulations in modern CFD analysis are largely automated from setup to execution, the total computational cost still remains substantial compared with what is incurred by BEM, which requires about five to ten minutes depending on loading to complete the same case and when running on much fewer computing nodes (the BEM and RANS simulations were performed on a Windows workstation equipped with a 12th Gen Intel(R) Core(TM) i7 processor (2.50 GHz) and 64 GB of RAM; the RANS simulations were executed using 64 computing nodes, while the BEM computations employed 8 nodes in parallel mode). Moreover, from the input parameters, the geometry production prior to the hydrodynamic analysis takes less than one second.
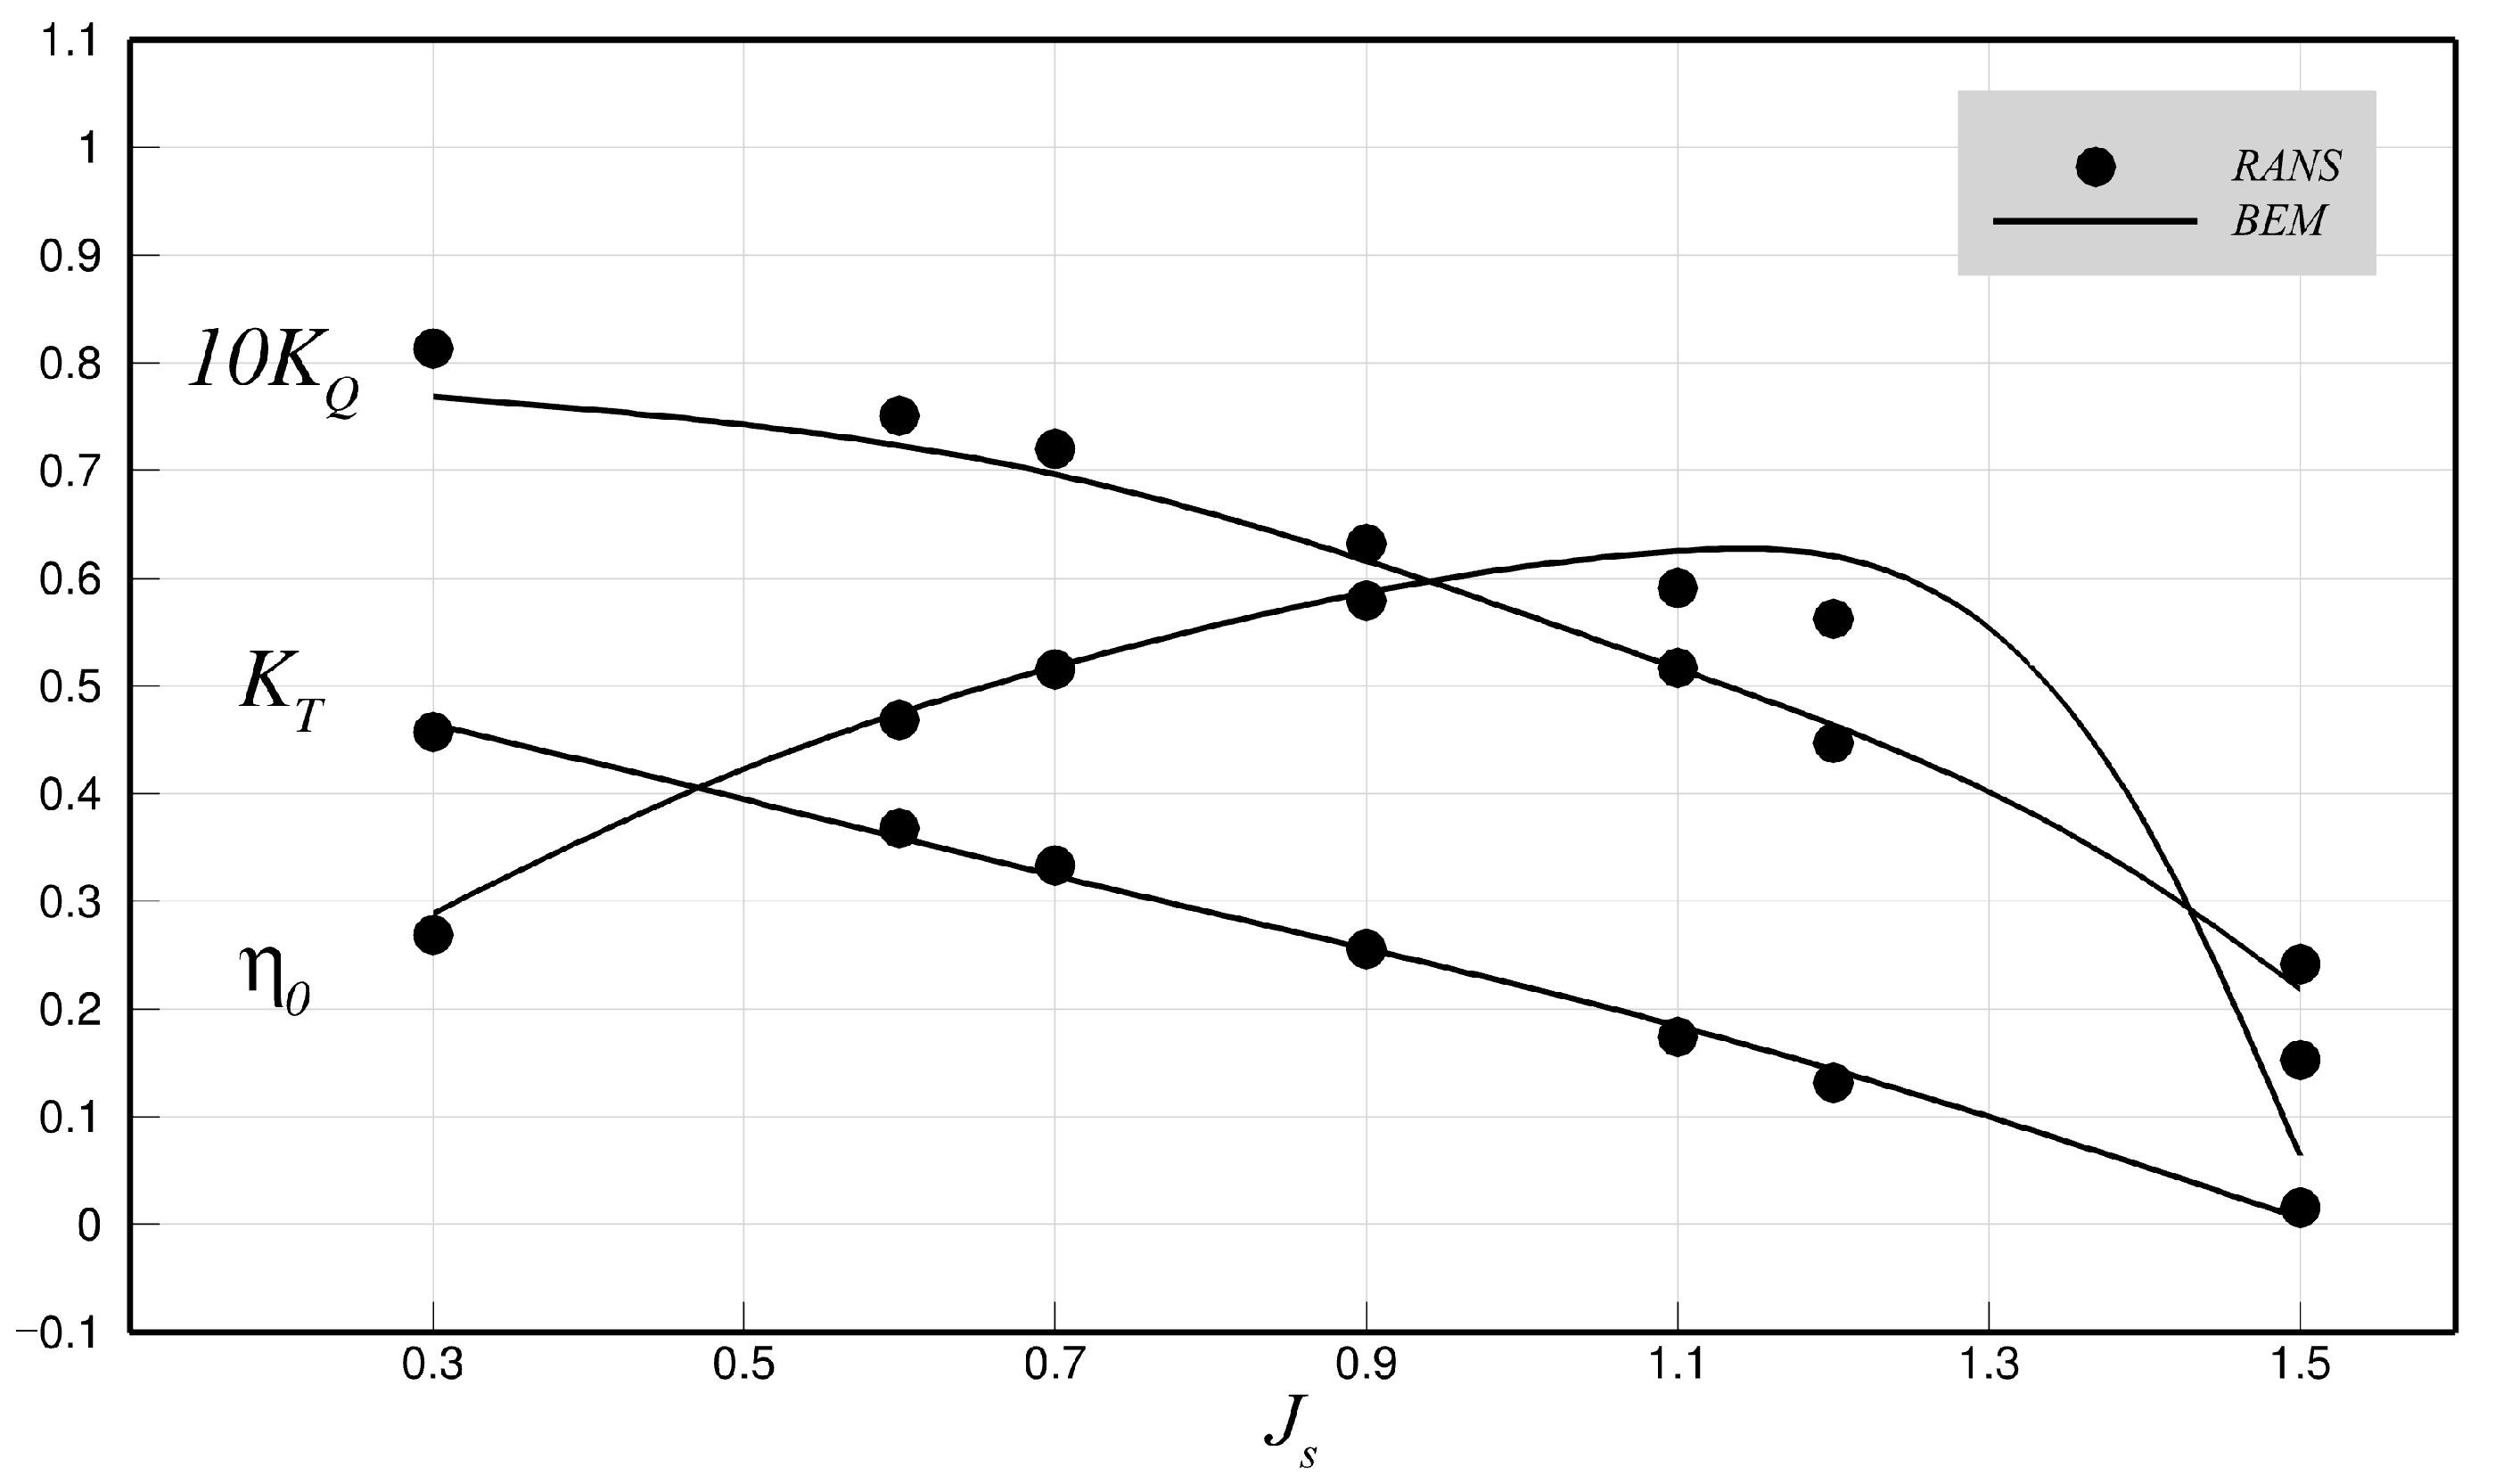
Figure 11 presents the open water performance of the model propeller, as analyzed using the present method, in comparison with RANS. The thrust and torque coefficients,
and
, in the figure are defined following the equations:
where
T and
Q denote the predicted thrust and torque on the blade, respectively; and
and
n are the propeller diameter and rotational speed (in revolution per second), respectively. In general, the BEM predictions follow the overall trends and magnitudes observed in the RANS results well, although the torque was shown to be slightly underpredicted with a low
. The high angles of attack at a low
with a large pitch and vertical angle lead to, along with flow separation on the suction side of the blade, strong pressure peaks near the leading edge. The separated flow increases pressure drag and viscous losses, which contribute to a higher torque when compared with the fully inviscid predictions by the BEM. It is worth noting that the toroidal propeller produces significantly higher thrust and torque, compared to conventional propellers, mainly because of the combined loading contributions from both blades. However, since both
and
increased simultaneously, the propulsive efficiency did not show a notable improvement over that of conventional propellers under the present configuration.
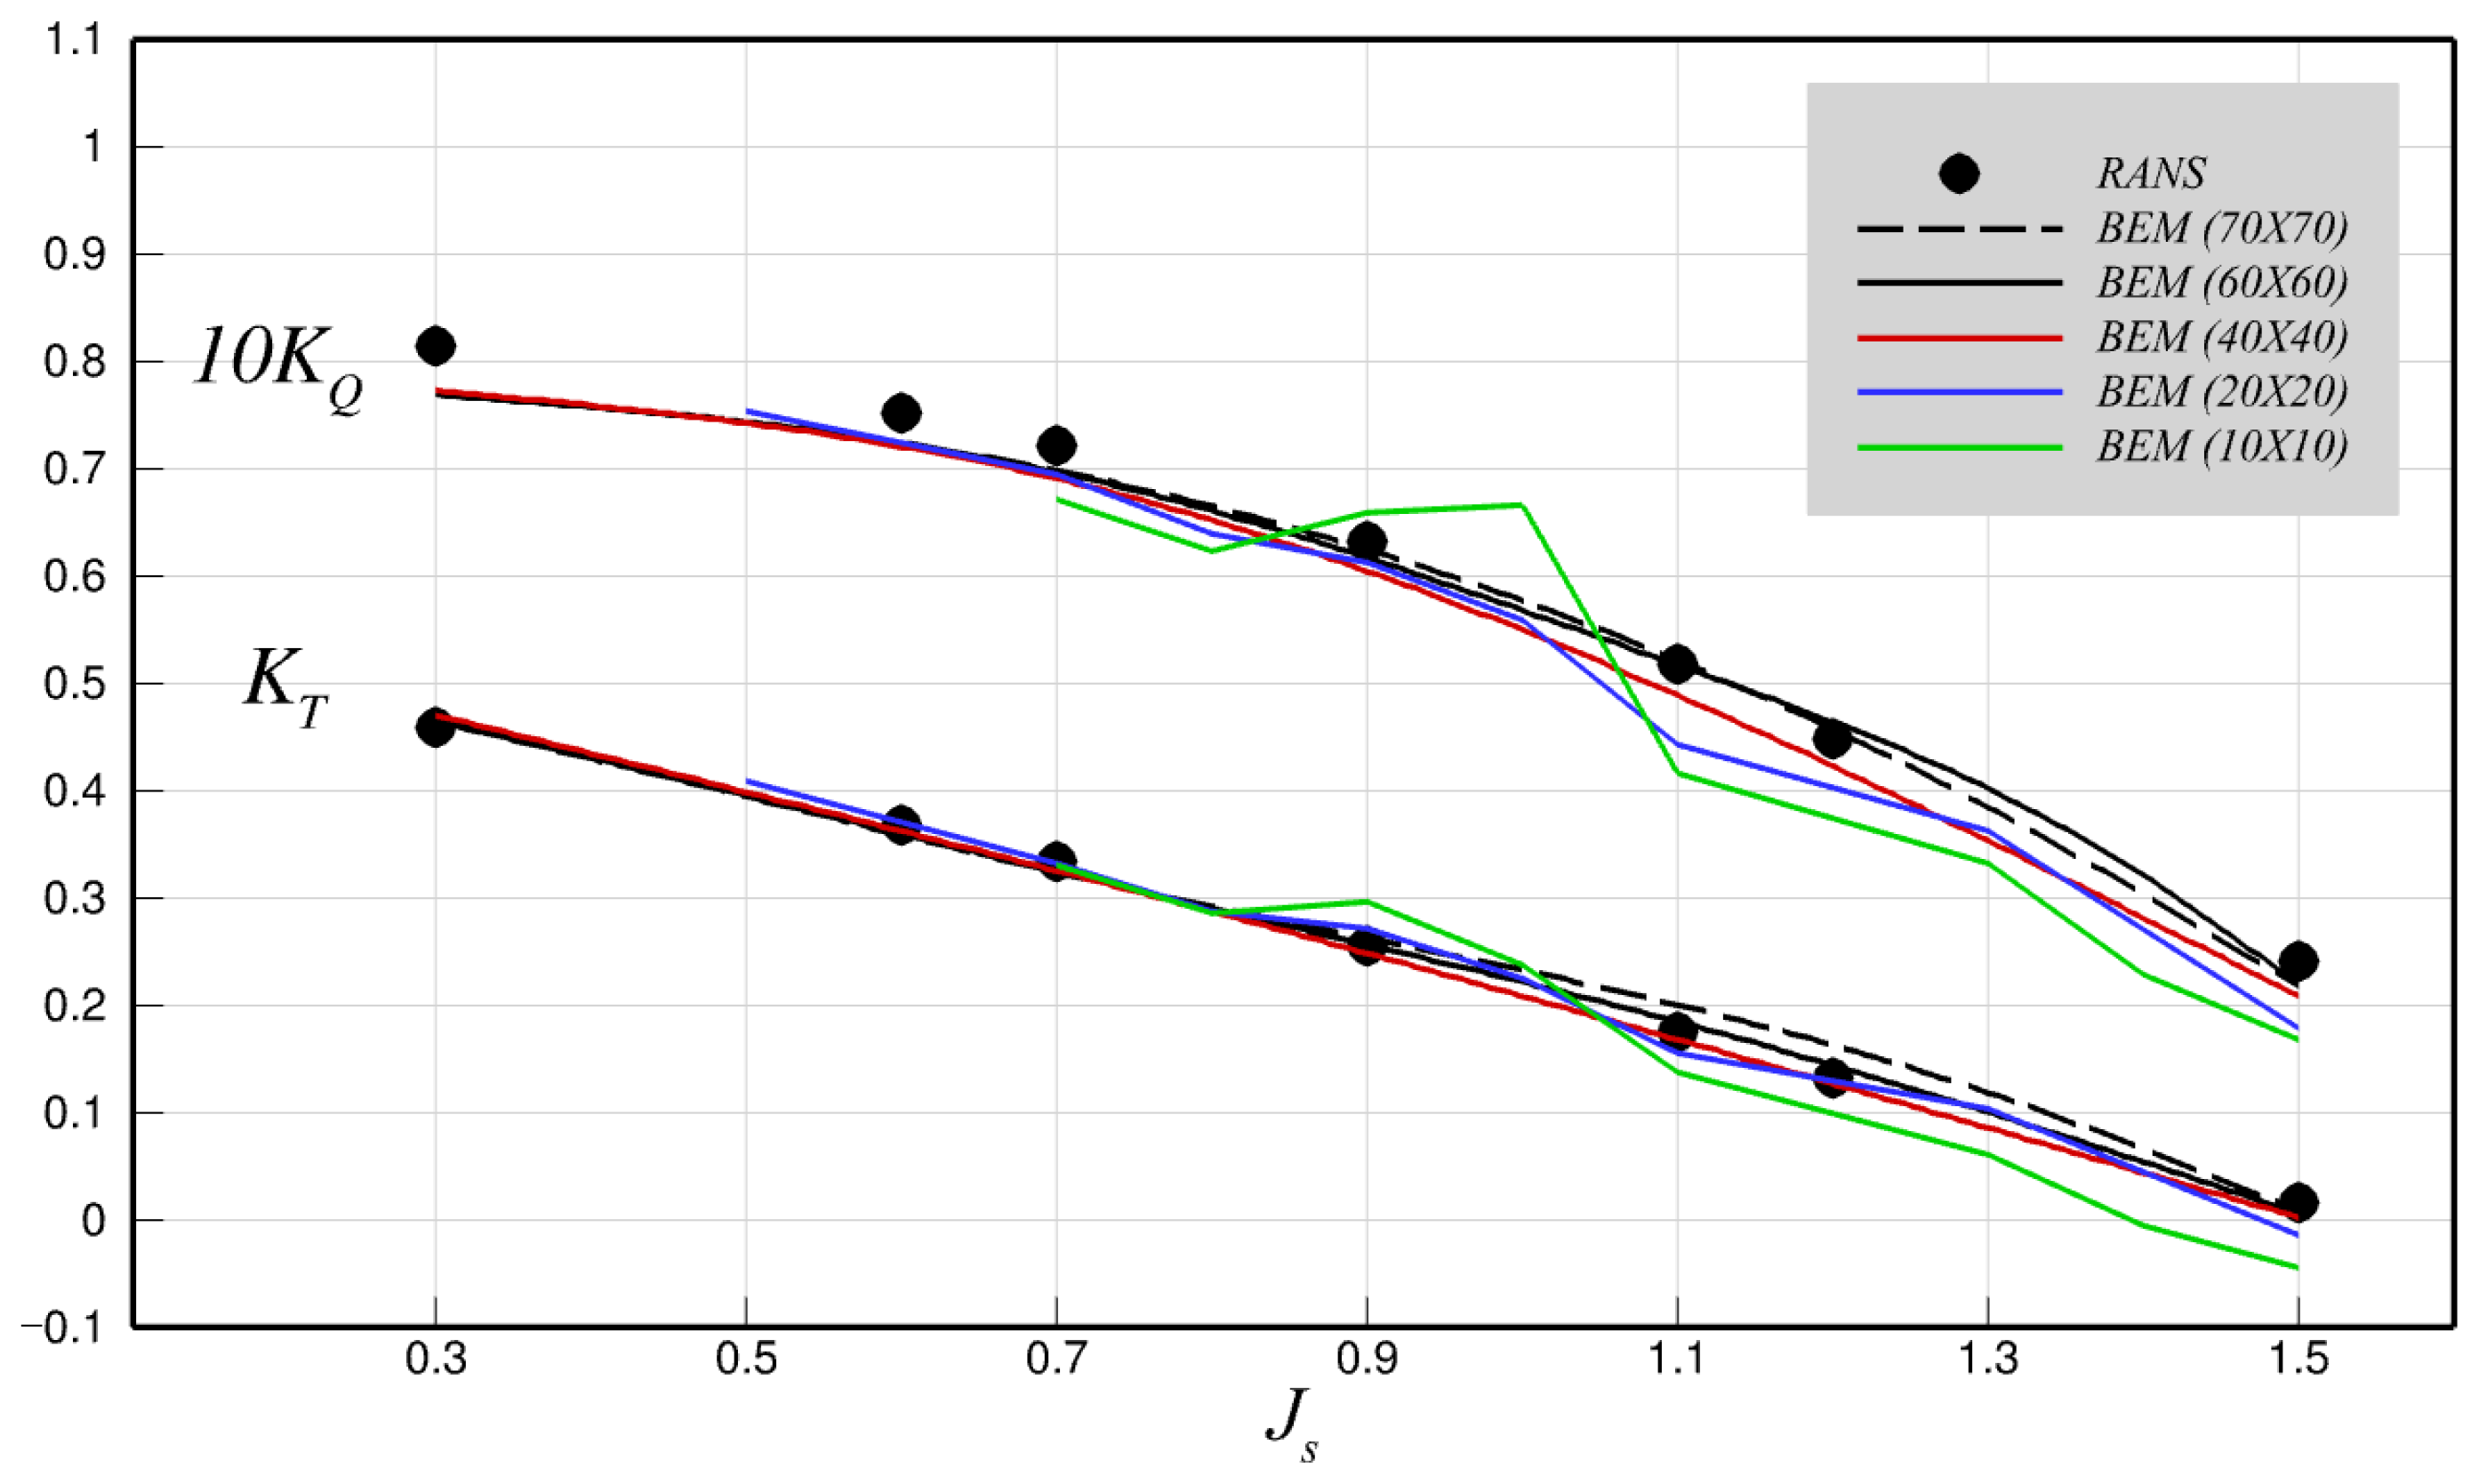
Following the open water test, a grid independence study was conducted using different panel densities on the blade surface (
Figure 12). The hub panels connected to the blade roots were adapted according to the number of blade panels in the chordwise direction. Five different grid densities were tested, and the corresponding open water performance are presented in
Figure 13. The panel density had a noticeable influence on the numerical predictions. The coarsest grid (the
case) shows very unstable and inconsistent performance trends, which improved progressively with finer discretizations. Beyond the current setup (
), the predicted thrust and torque showed no significant deviation at a lower
, in which the higher angles of attack effectively suppressed the intense blade–wake interactions, as will be discussed next in detail. Minor fluctuations were observed at higher
. The toroidal propeller, in particular, exhibited unstable predictions at these conditions, mainly because the reduced angle of attack causes the front blade wake to impinge directly on the rear blade. Under such conditions, a sufficiently fine panel resolution is required to ensure more reliable performance predictions.
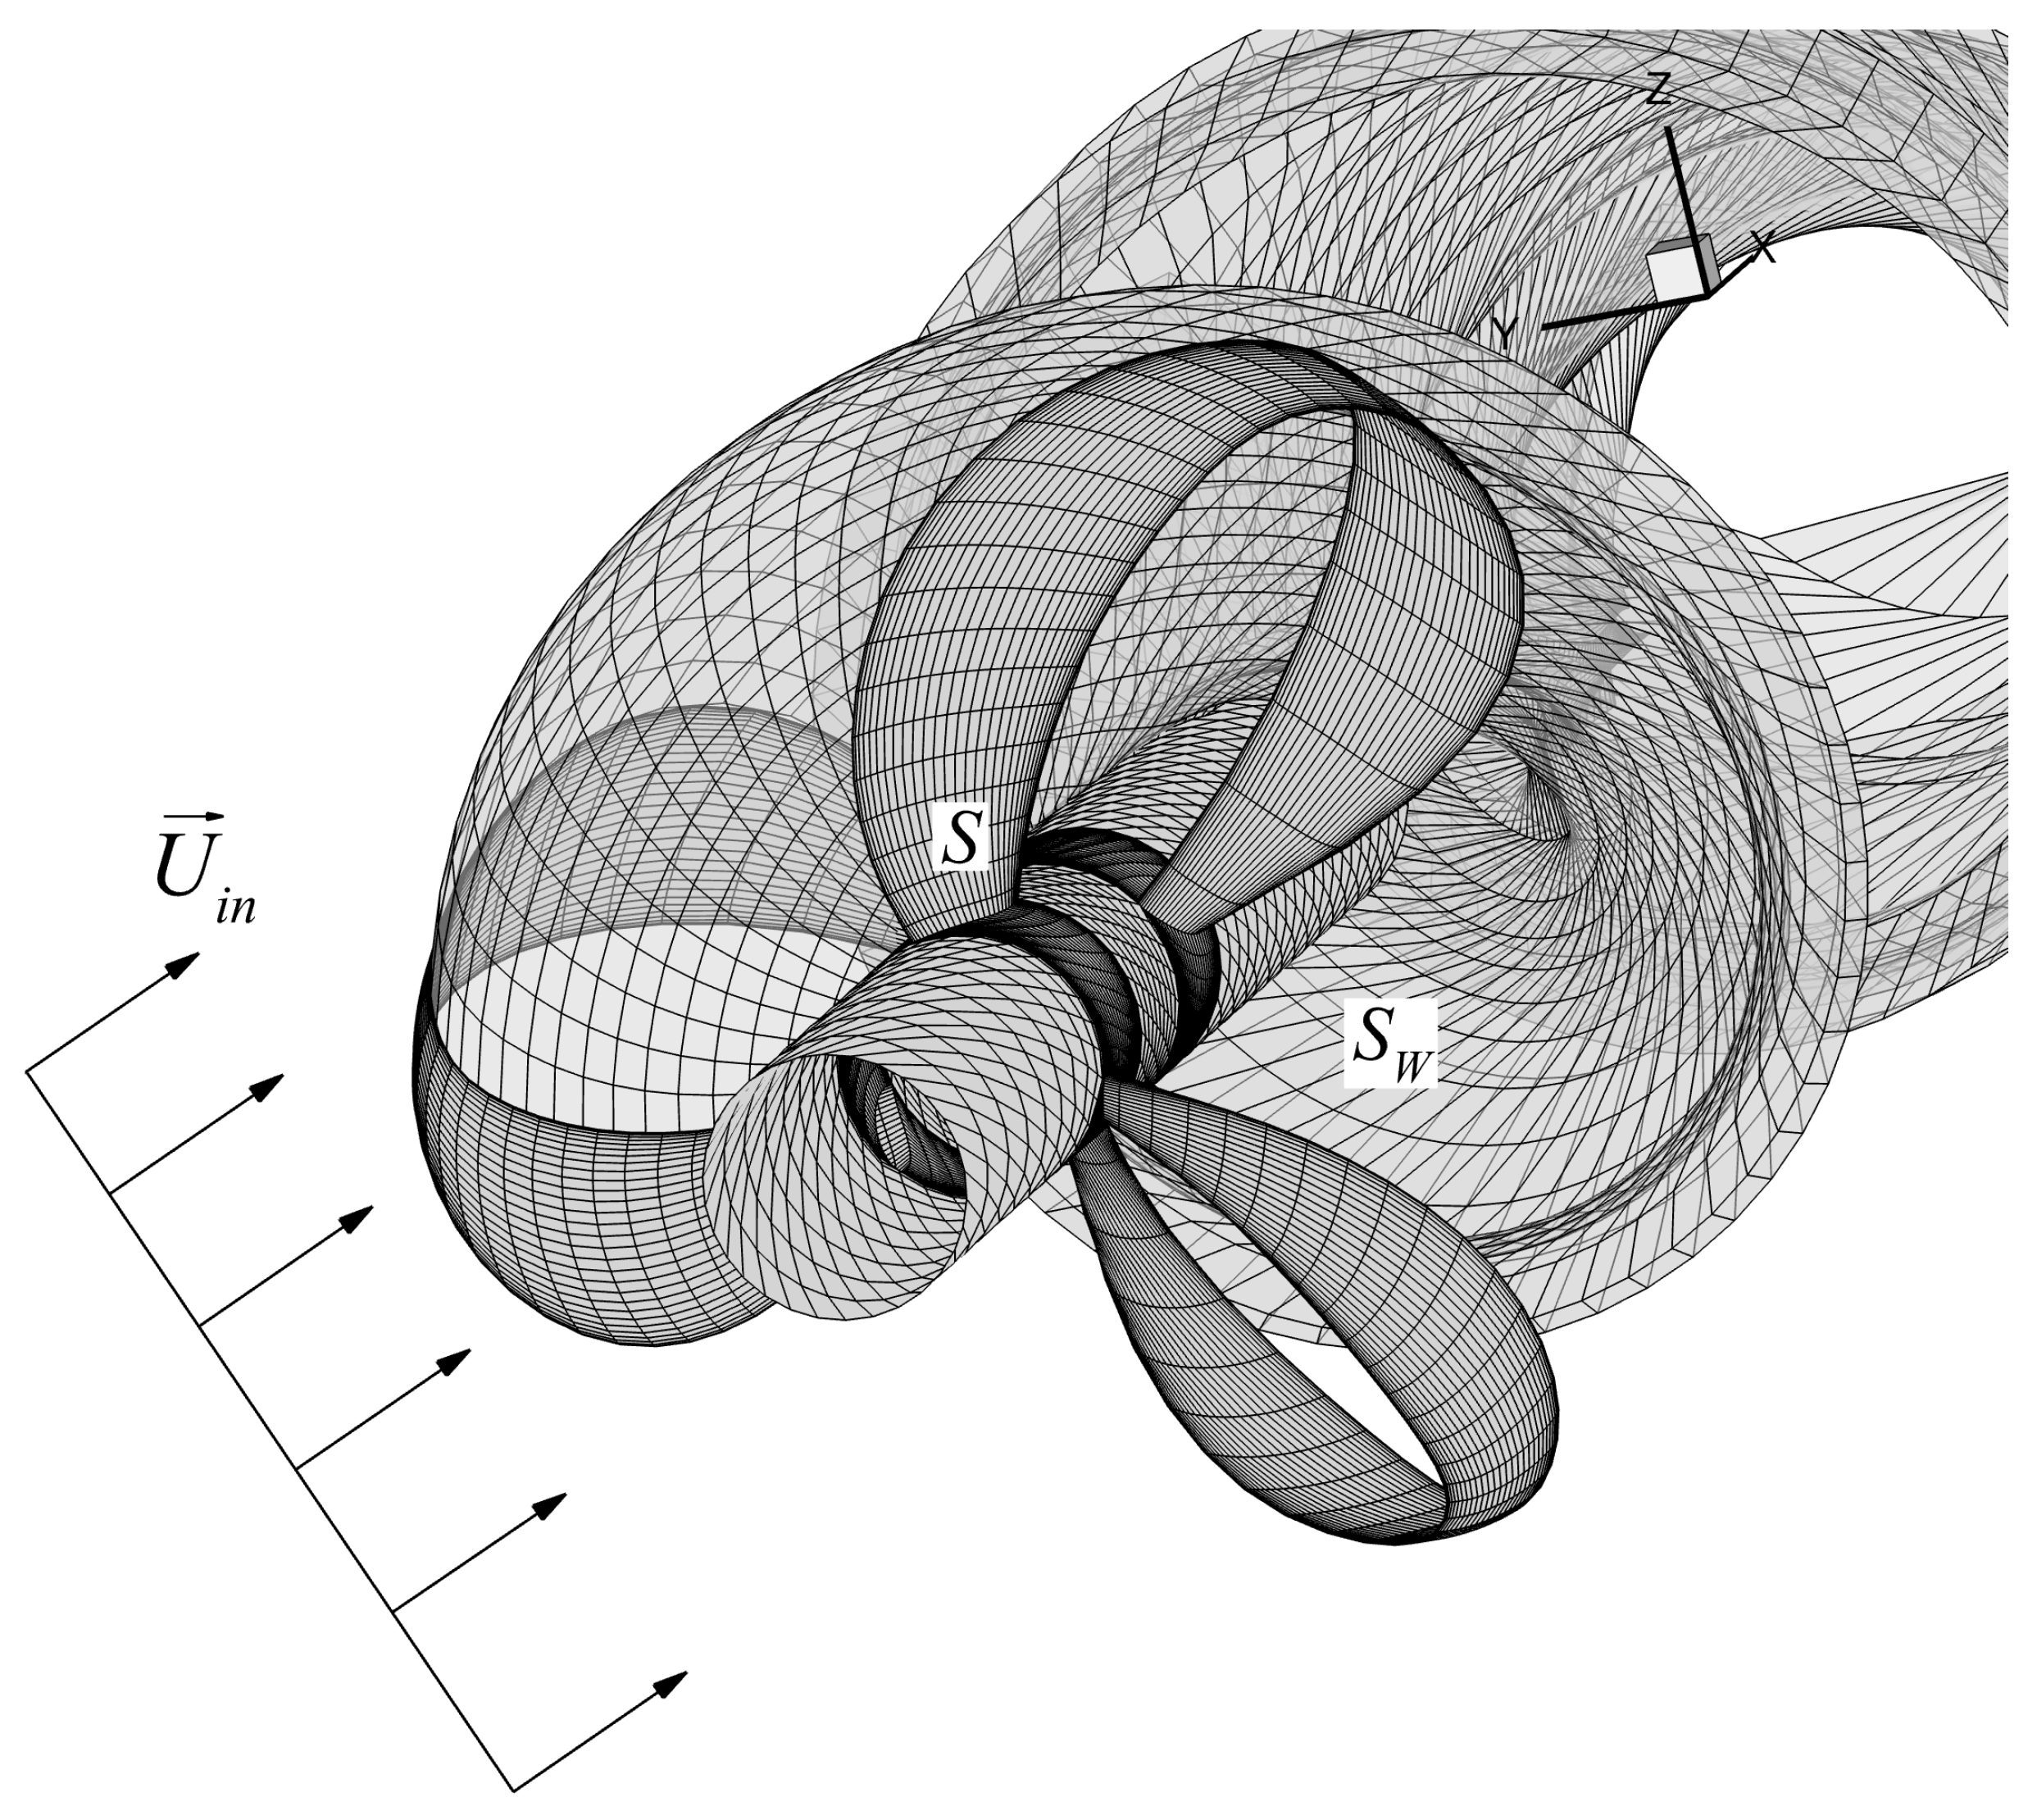
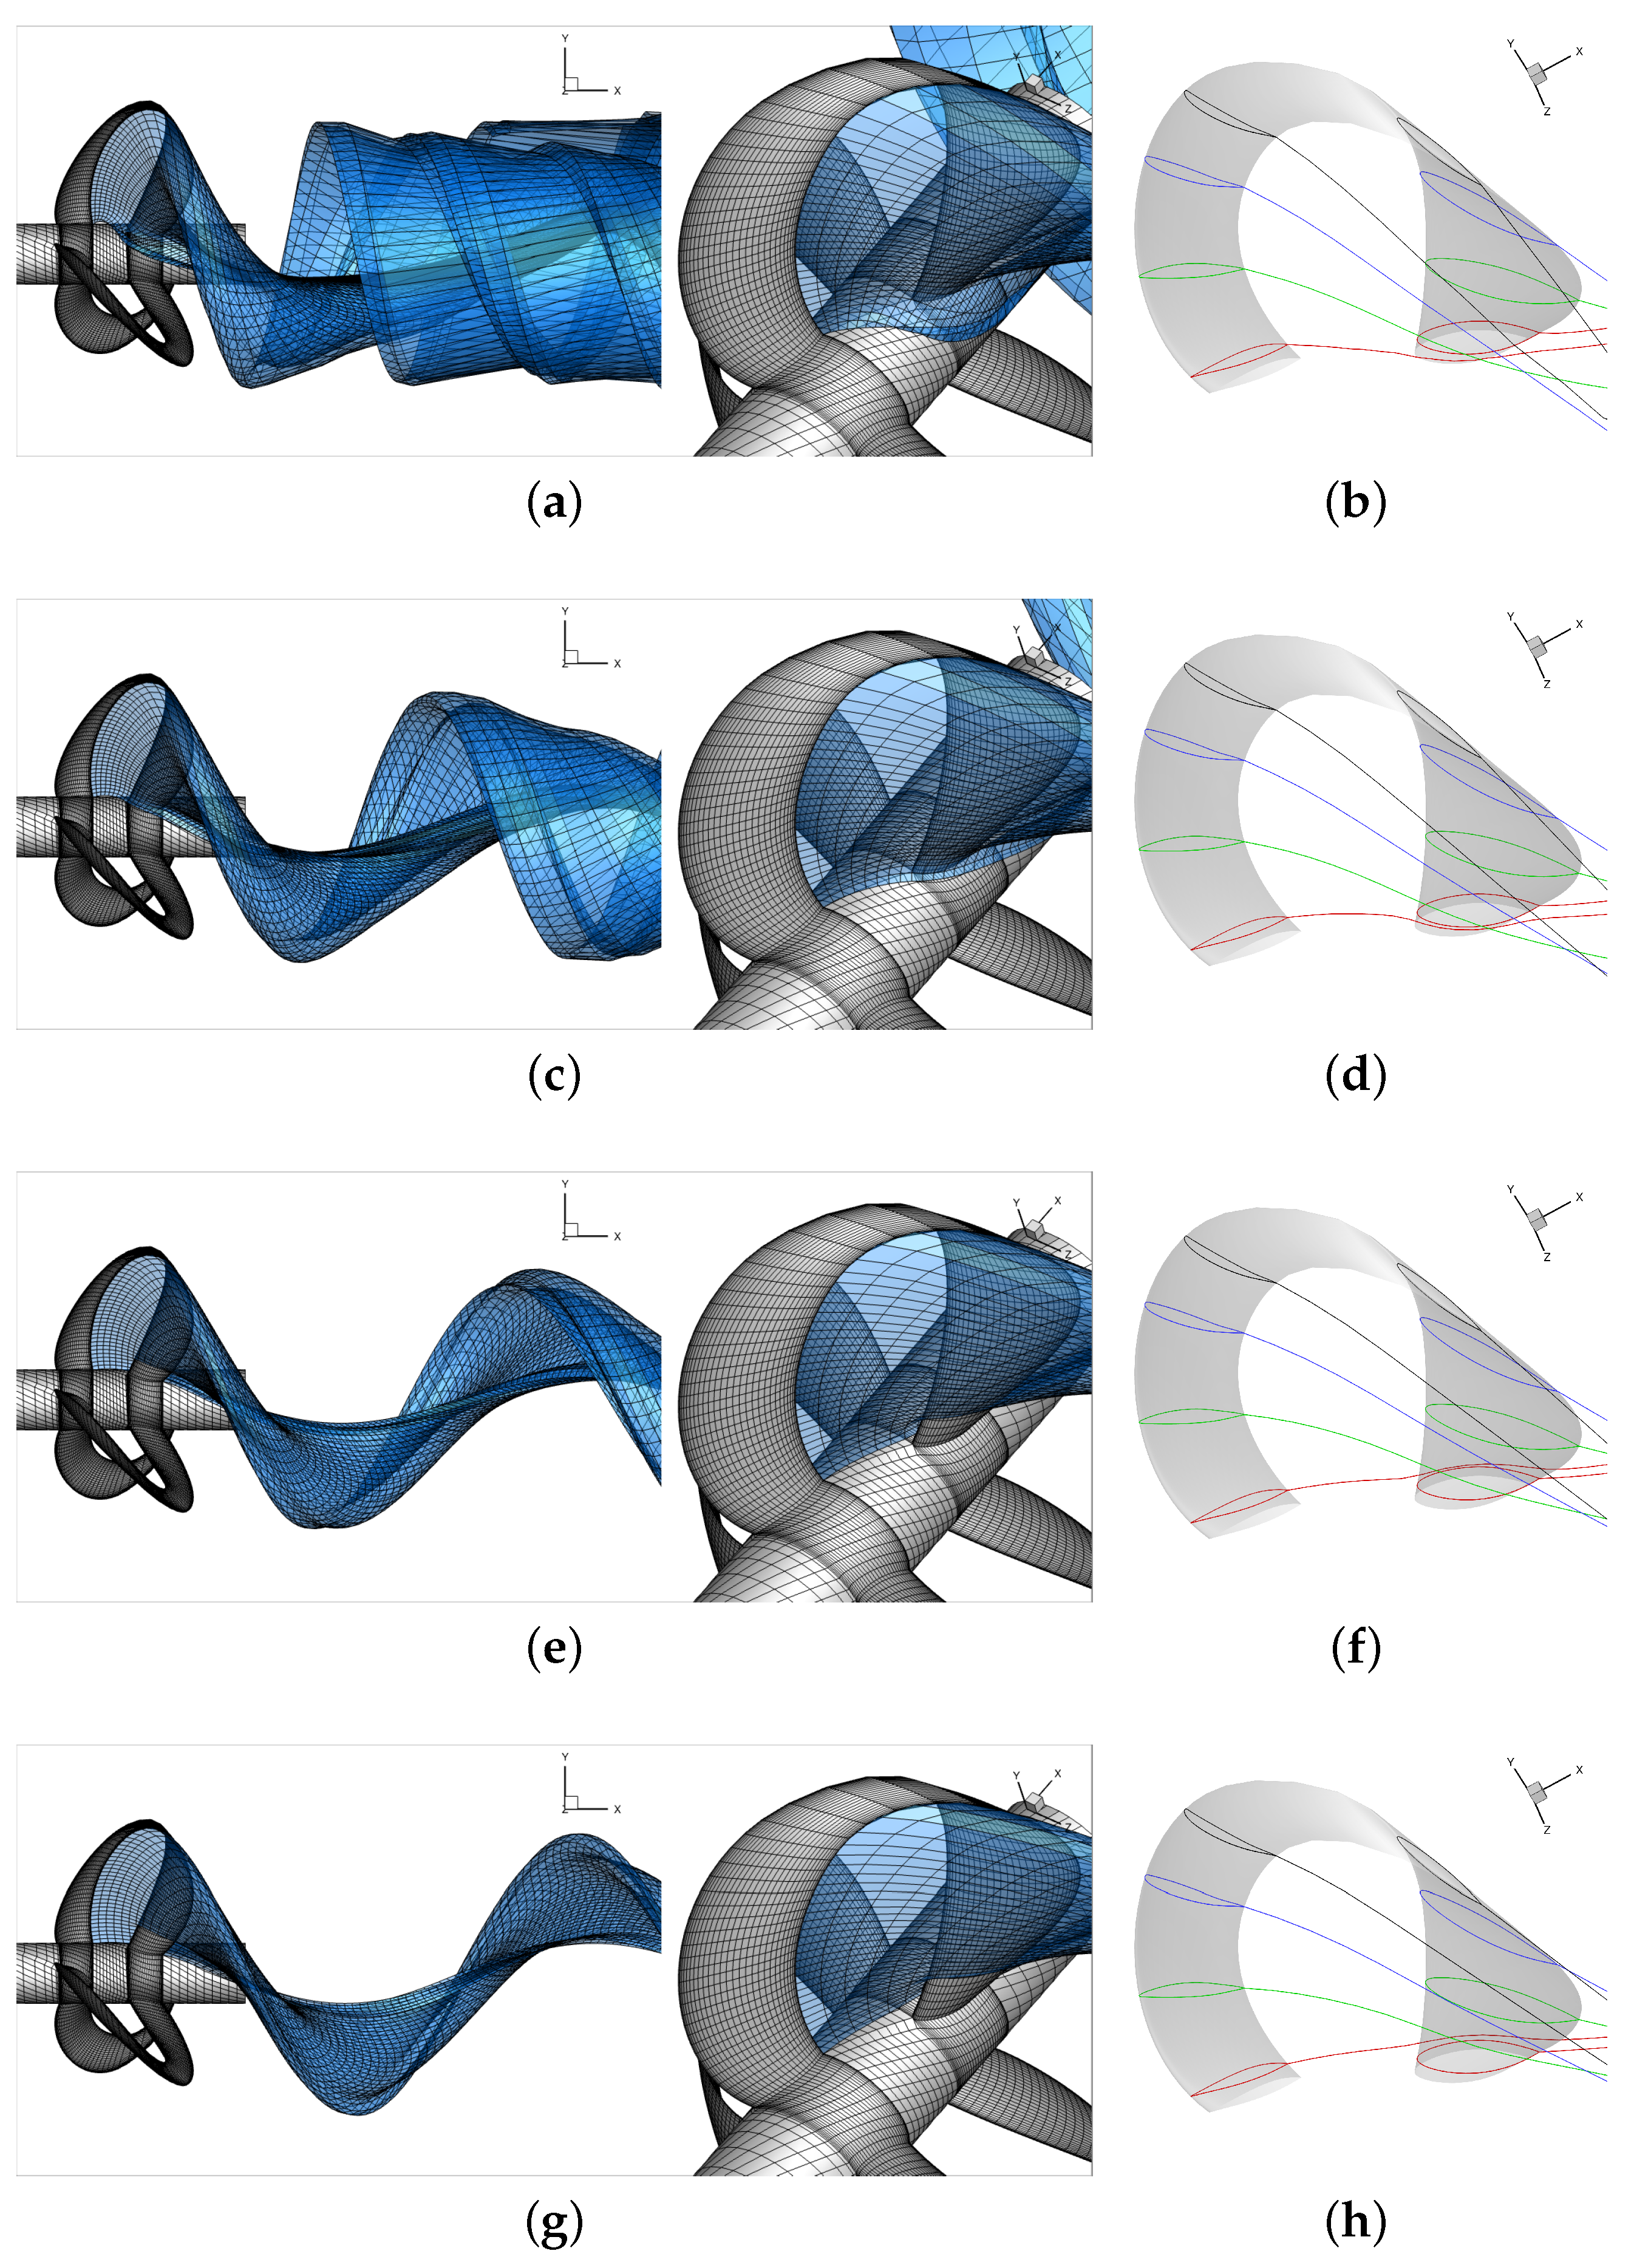
Figure 14 show the fully aligned wake under four different loading conditions, corresponding to
and
. Each subfigure shows the intersection between the blade and its wake at several cylindrical cross sections for different radial locations. Previous studies on conventional propellers [
13,
14,
15] have shown that the wake has a significant influence on the performance of both open and ducted propellers when using the panel method. The main cause arises from concentrated vortices (that is, the trailing wake panels), which can induce numerical singularities when they convect too close to wall boundaries during the intense propeller–wake interactions. In the present work, the most advanced wake alignment model [
13] was adopted, aligning the four nodal points of each wake panel based on the induced velocities from the blade, hub, and the wake itself. Unlike conventional propellers, toroidal propellers require an additional treatment because the trailing wake shed from the front blade may intersect or even split the rear blade, as shown in
Figure 14e,g. In cases where a wake panel intersects with the blade surface during the wake alignment process, its nodal points that fall inside the blade surface are repositioned onto the rear blade surface. This repositioning is normally performed during the initial wake alignment stage before the wake becomes fully aligned and stabilized. However, even after relocating the nodal points outside the blade, the associated control points (note the control point is positioned at the centroid of each quadrilateral panel defined by four nodal points) may still remain inside the blade geometry, as the wake could penetrate through the rear blade. To maintain the physical accuracy of the BEM solution, the influence functions associated with these control points to the propeller need to be neglected when constructing the BEM matrix of the influence function. The toroidal propeller is relatively unaffected by the wake-splitting issue under high loading conditions or when operating at low pitch angels (as shown in
Figure 14a,c) because the wake passes the rear blade with sufficient clearance; however, as the
increases, the wake–blade intersection becomes more pronounced.
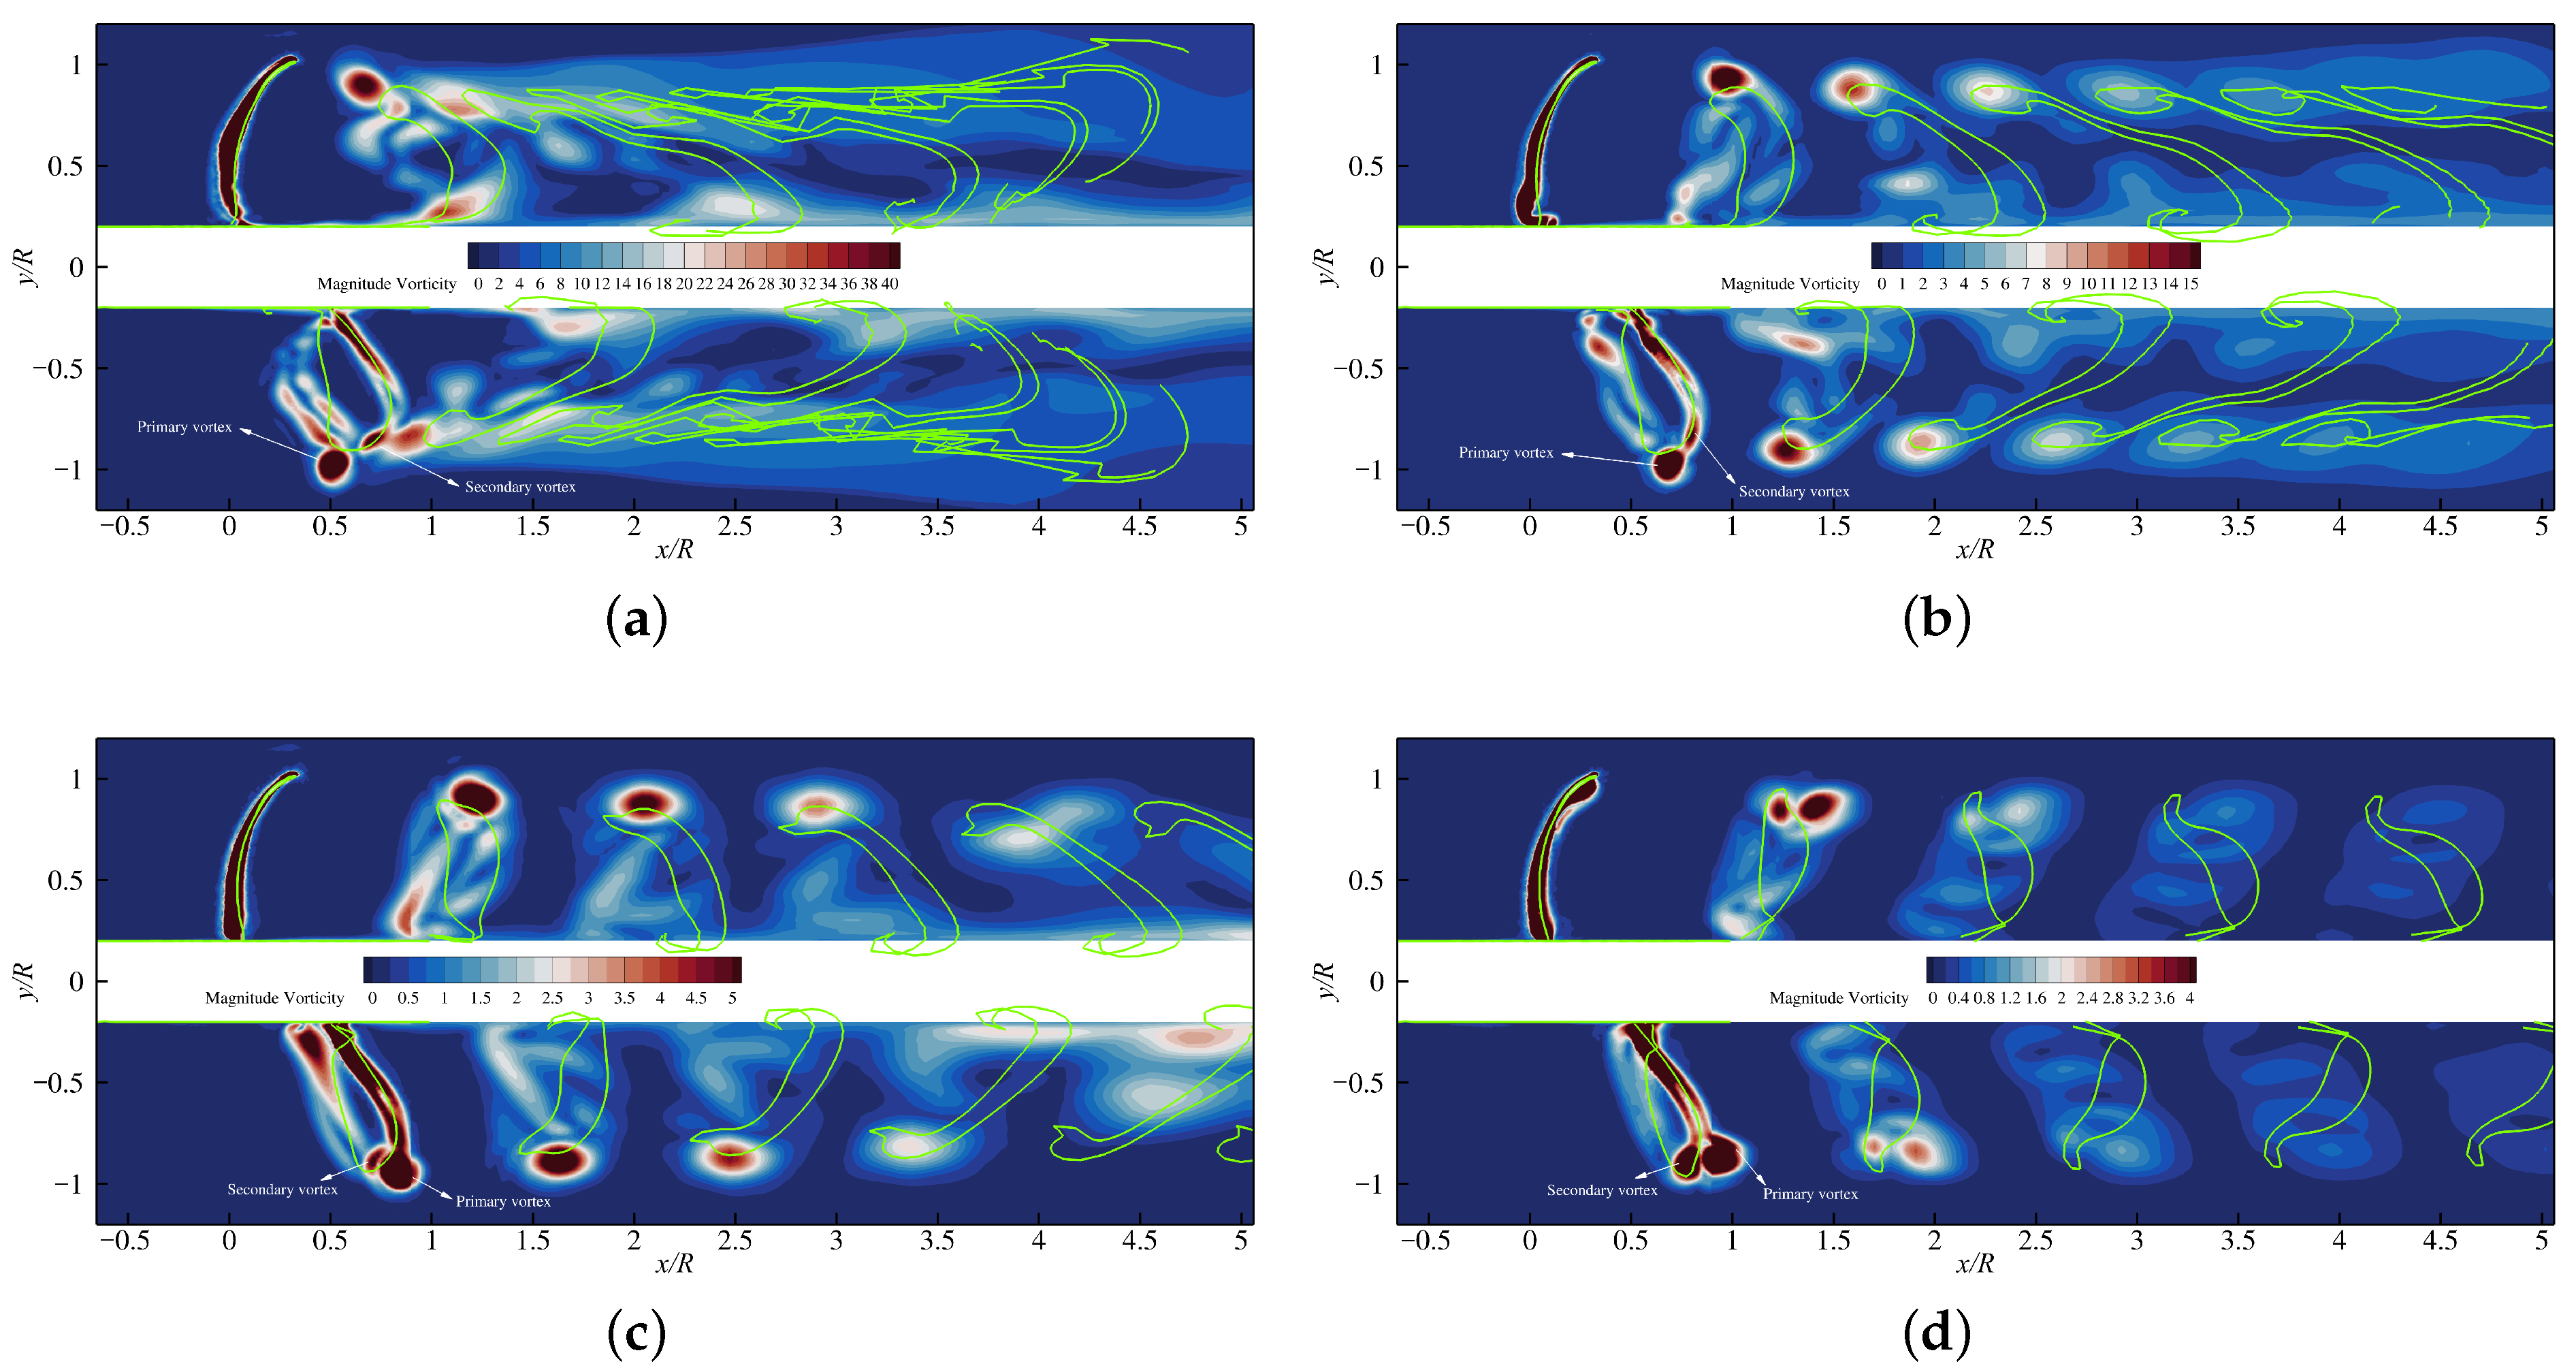
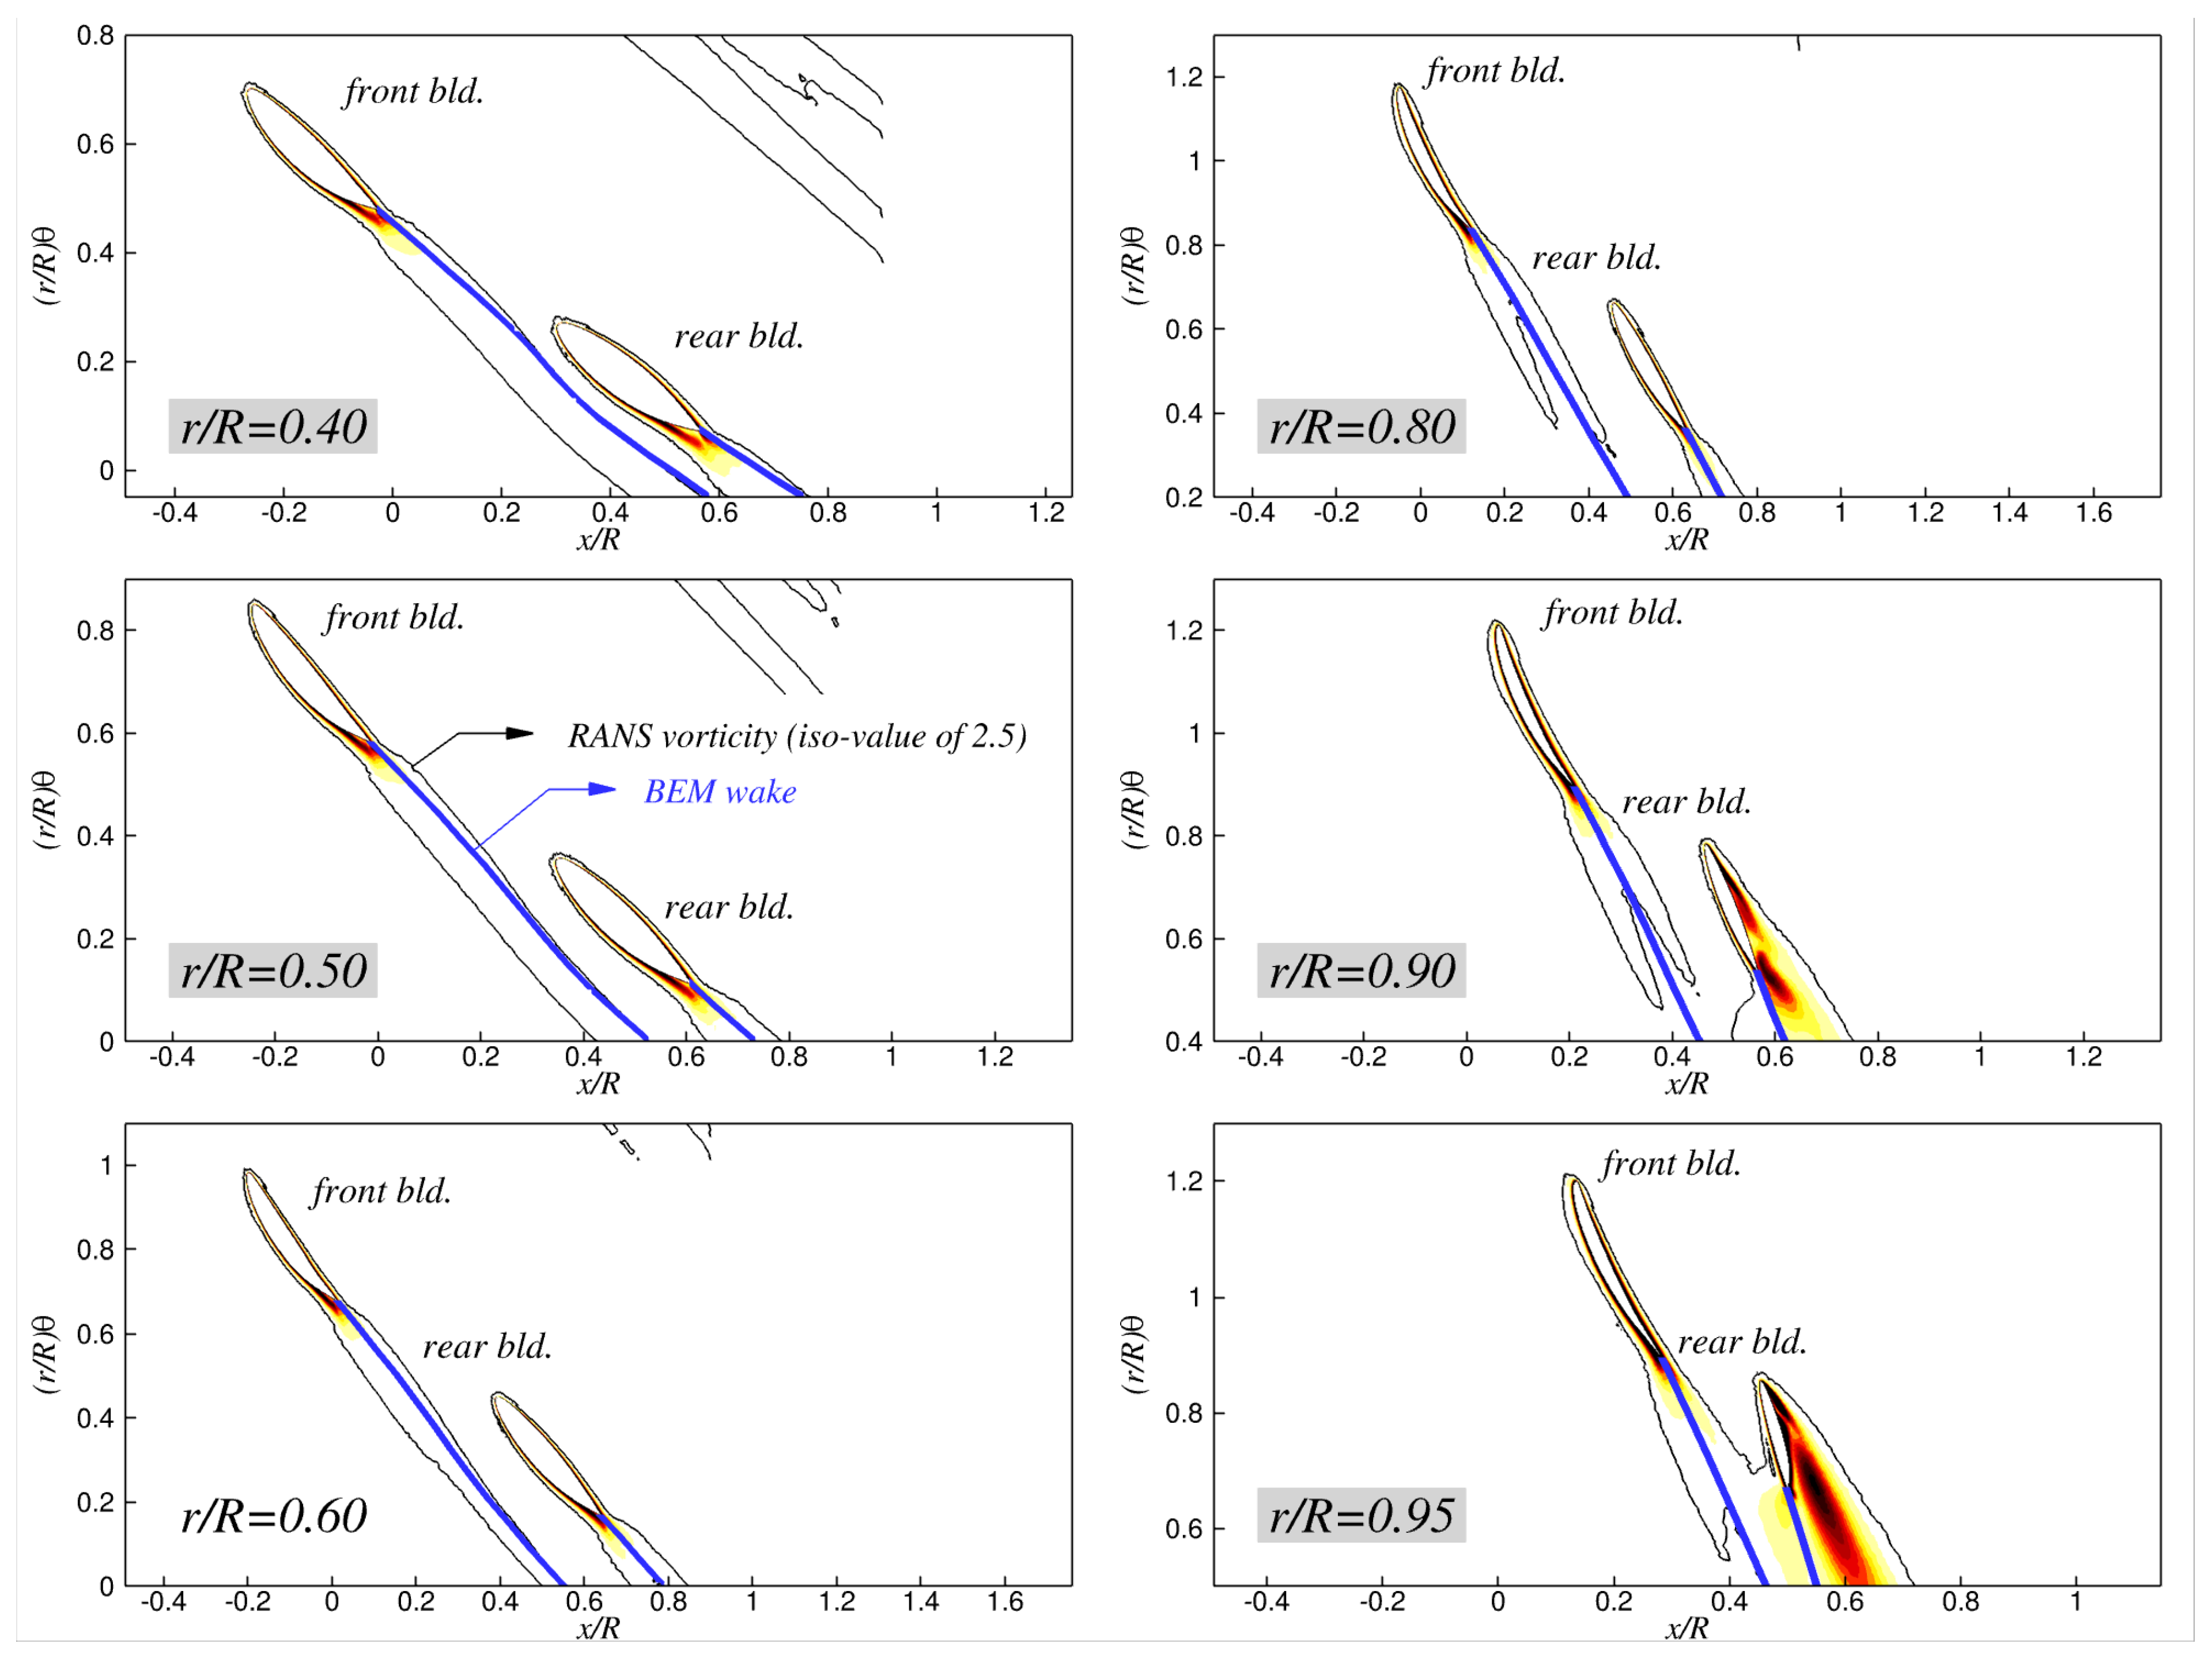
Figure 15 presents contour plots of the vorticity magnitude on the
plane predicted by the RANS simulations, and these are overlaid with the BEM wake panels (shown as green solid lines) on the same plane for four different advance ratios. As is shown, the lower the advance ratio, the stronger the vorticity shed from both blades, and the vortical structures gradually diffused as they were convected downstream. The locations of the concentrated vorticity in the wake predicted by the BEM did not exactly match those from the RANS predictions. The model toroidal propeller exhibited two distinct vortical structures: one referred to as the primary vortex, and the other as the secondary vortex. The primary vortex mainly developed from the leading edge of the front blade (thus, it is a leading-edge vortex), and it was convected over the looped tip, resulting in its position being at a higher radial location in the wake compared with the BEM wake panels. The secondary vortex, which forms near the tip region, gradually shifted toward the pressure side of the front blade with
due to the reversed angle of attack on the blade, and it eventually started to originate from the leading edge along the pressure side of the front blade. Consequently, the positions of the concentrated secondary vortices in the wake moved forward in the axial direction relative to the primary vortex at high
, and they fell inside the looped blade region (
Figure 15d). The mismatch in the wake locations between the BEM and RANS predictions might be attributed to not only the presence of the leading-edge vortices that were not accounted for in the proposed BEM formulation, but also due to the vortical interactions between the shed wake and the rear blade, which can lead to wake breakdown and diffusion during wake–blade interactions.
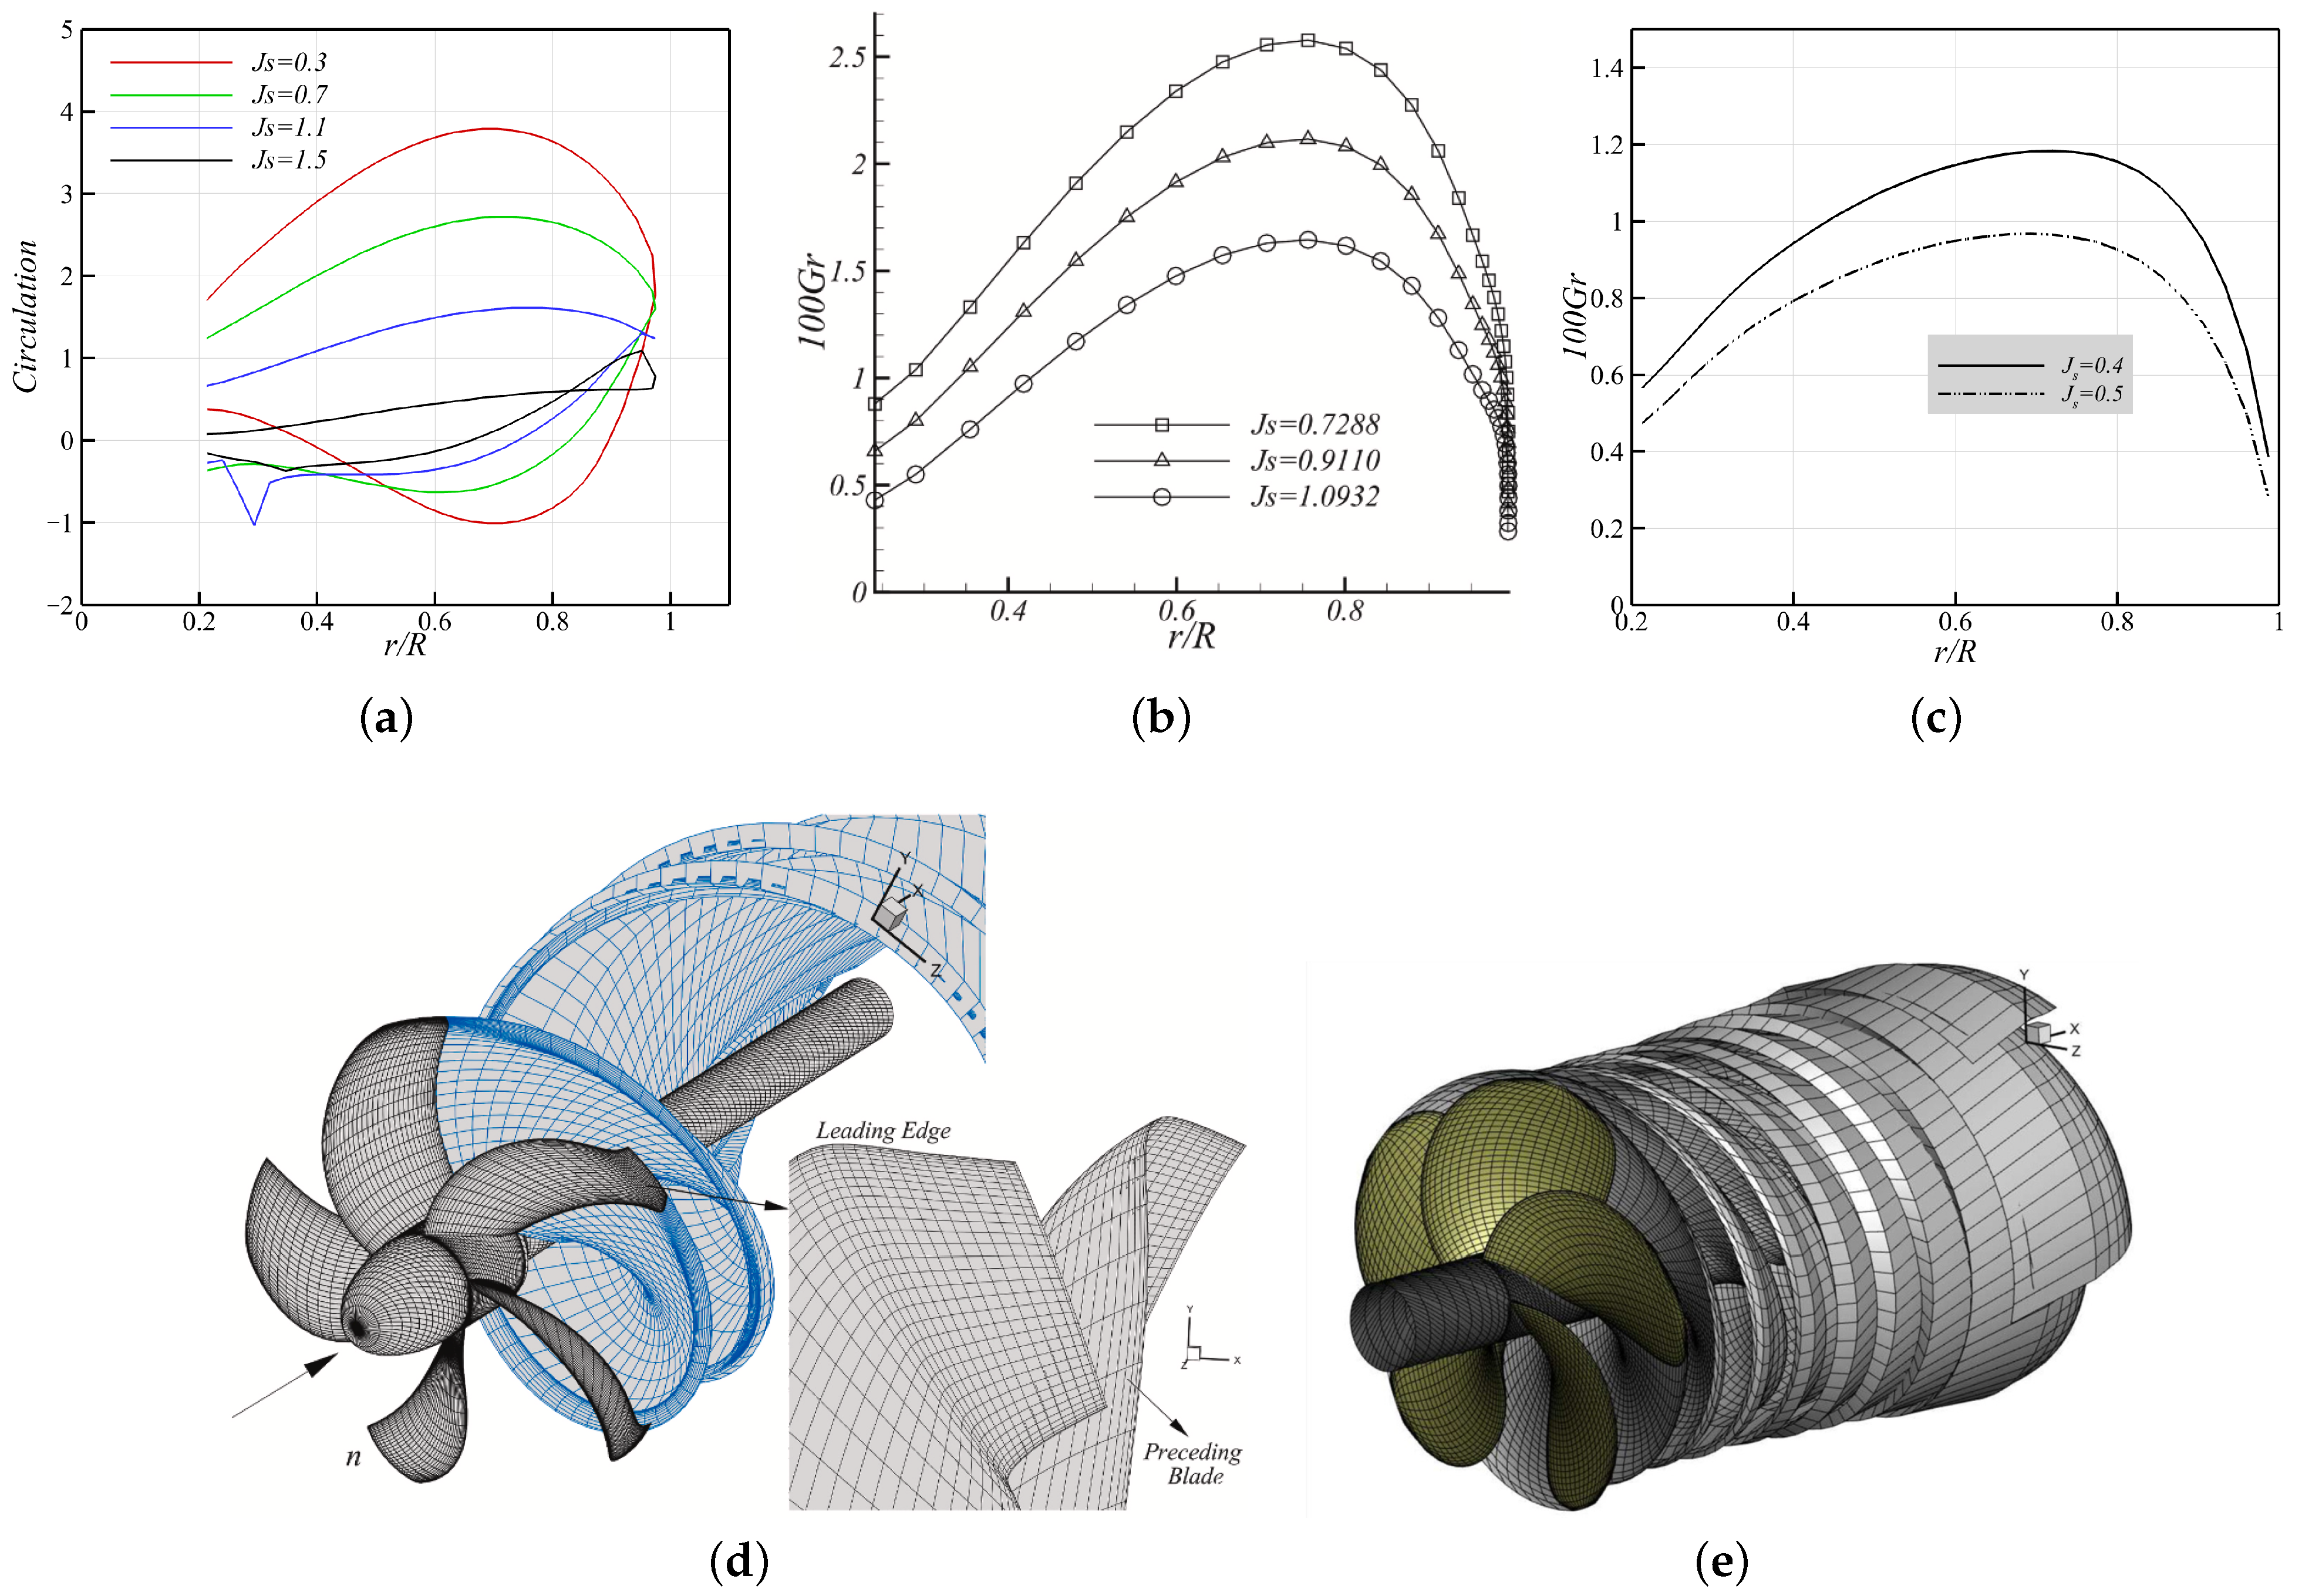
Figure 16a presents the predicted circulation distributions at four different advance ratios, i.e.,
and
. Owing to the toroidal (looped) shape of the blade, the circulation showed a continuous pattern that started from the front blade root (
), passed the tip around
, and returned to the rear blade root (
), which formed a distinctive
sparrow-shaped pattern. It is clearly different from the circulation patterns of conventional, non-looped propellers, such as for example, the tip-loaded propeller (TLP) (
Figure 16b,d) with a knuckled tip that shifts the load distribution outward, as well as the rounded-tip open propeller (
Figure 16c,e). As expected, the loading on the front blade seemed to be very similar to that of conventional propellers, whereas the rear blade showed characteristics similar to a turbine with negative axial loading on the upper part of the rear blade (corresponding to the regions of positive circulation). The front blade consistently generated positive thrust across its entire span, providing the propeller with forward thrust, whereas the rear blade exhibited two distinct regions: one that generated negative axial force (pushing the propeller backward) and another that contributed to forward thrust. For instance, at
, the front blade showed positive circulation throughout, indicating uniformly positive thrust. Meanwhile, the rear blade produced negative thrust (i.e., positive circulation but force directed downstream) in the range
and positive thrust in
(in this context, positive thrust refers to a force directed upstream (forward), whereas negative thrust corresponds to a force directed downstream (backward)). Ideally, optimal performance may be achieved by designing the toroidal propeller such that the front blade generates positive circulation and the rear blade generates negative circulation over their entire spans, thereby maximizing net thrust. In other words, the
beak of the sparrow pattern, which is formed at the blade tip where the front blade transitions into the rear blade, should ideally approach zero, indicating minimal thrust cancellation at the junction.
Judging from the circulation distributions, the front blade experiences higher loading than the rear blade under all operating conditions, with the maximum loading on both blades occurring around and decreasing in magnitude as increases. The abnormal peaks observed near the rear blade root are caused by the extreme proximity of the trailing wake from the front blade to the rear blade surface. Such interactions are inevitable in multi-propeller systems, where propellers sit in a face-to-face arrangement and could behave as a critical source of error in the panel method as discussed next.
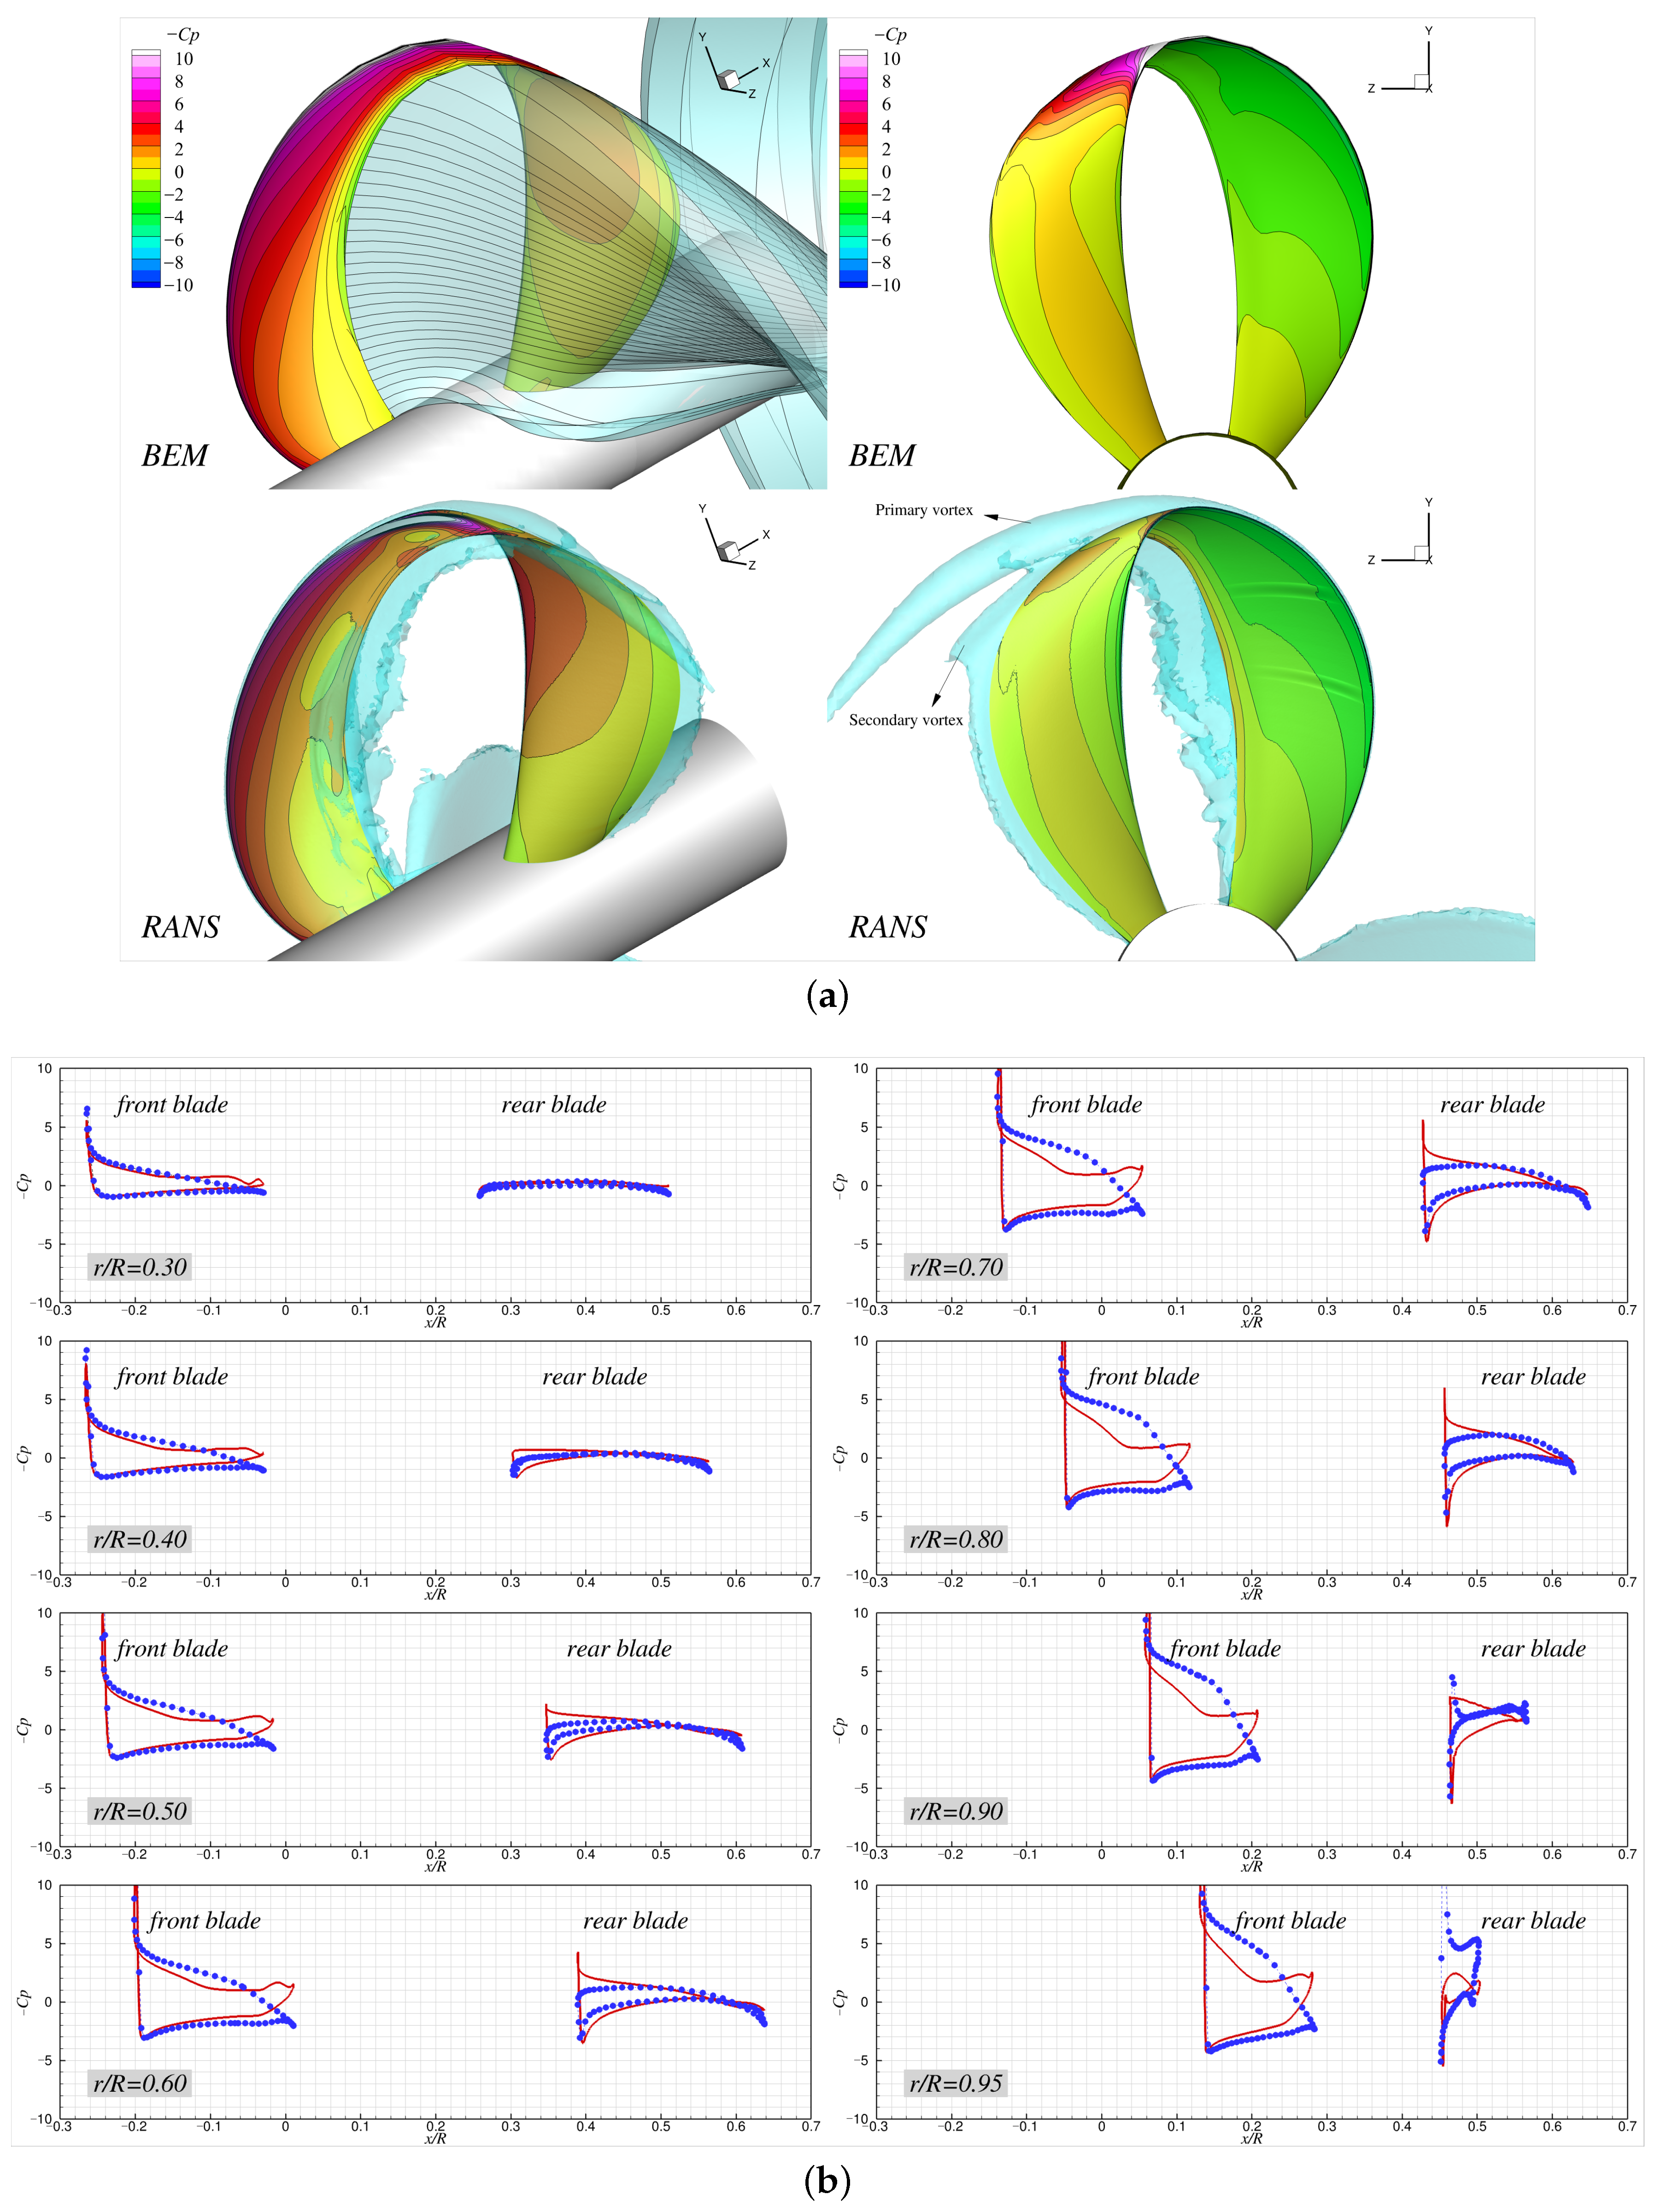
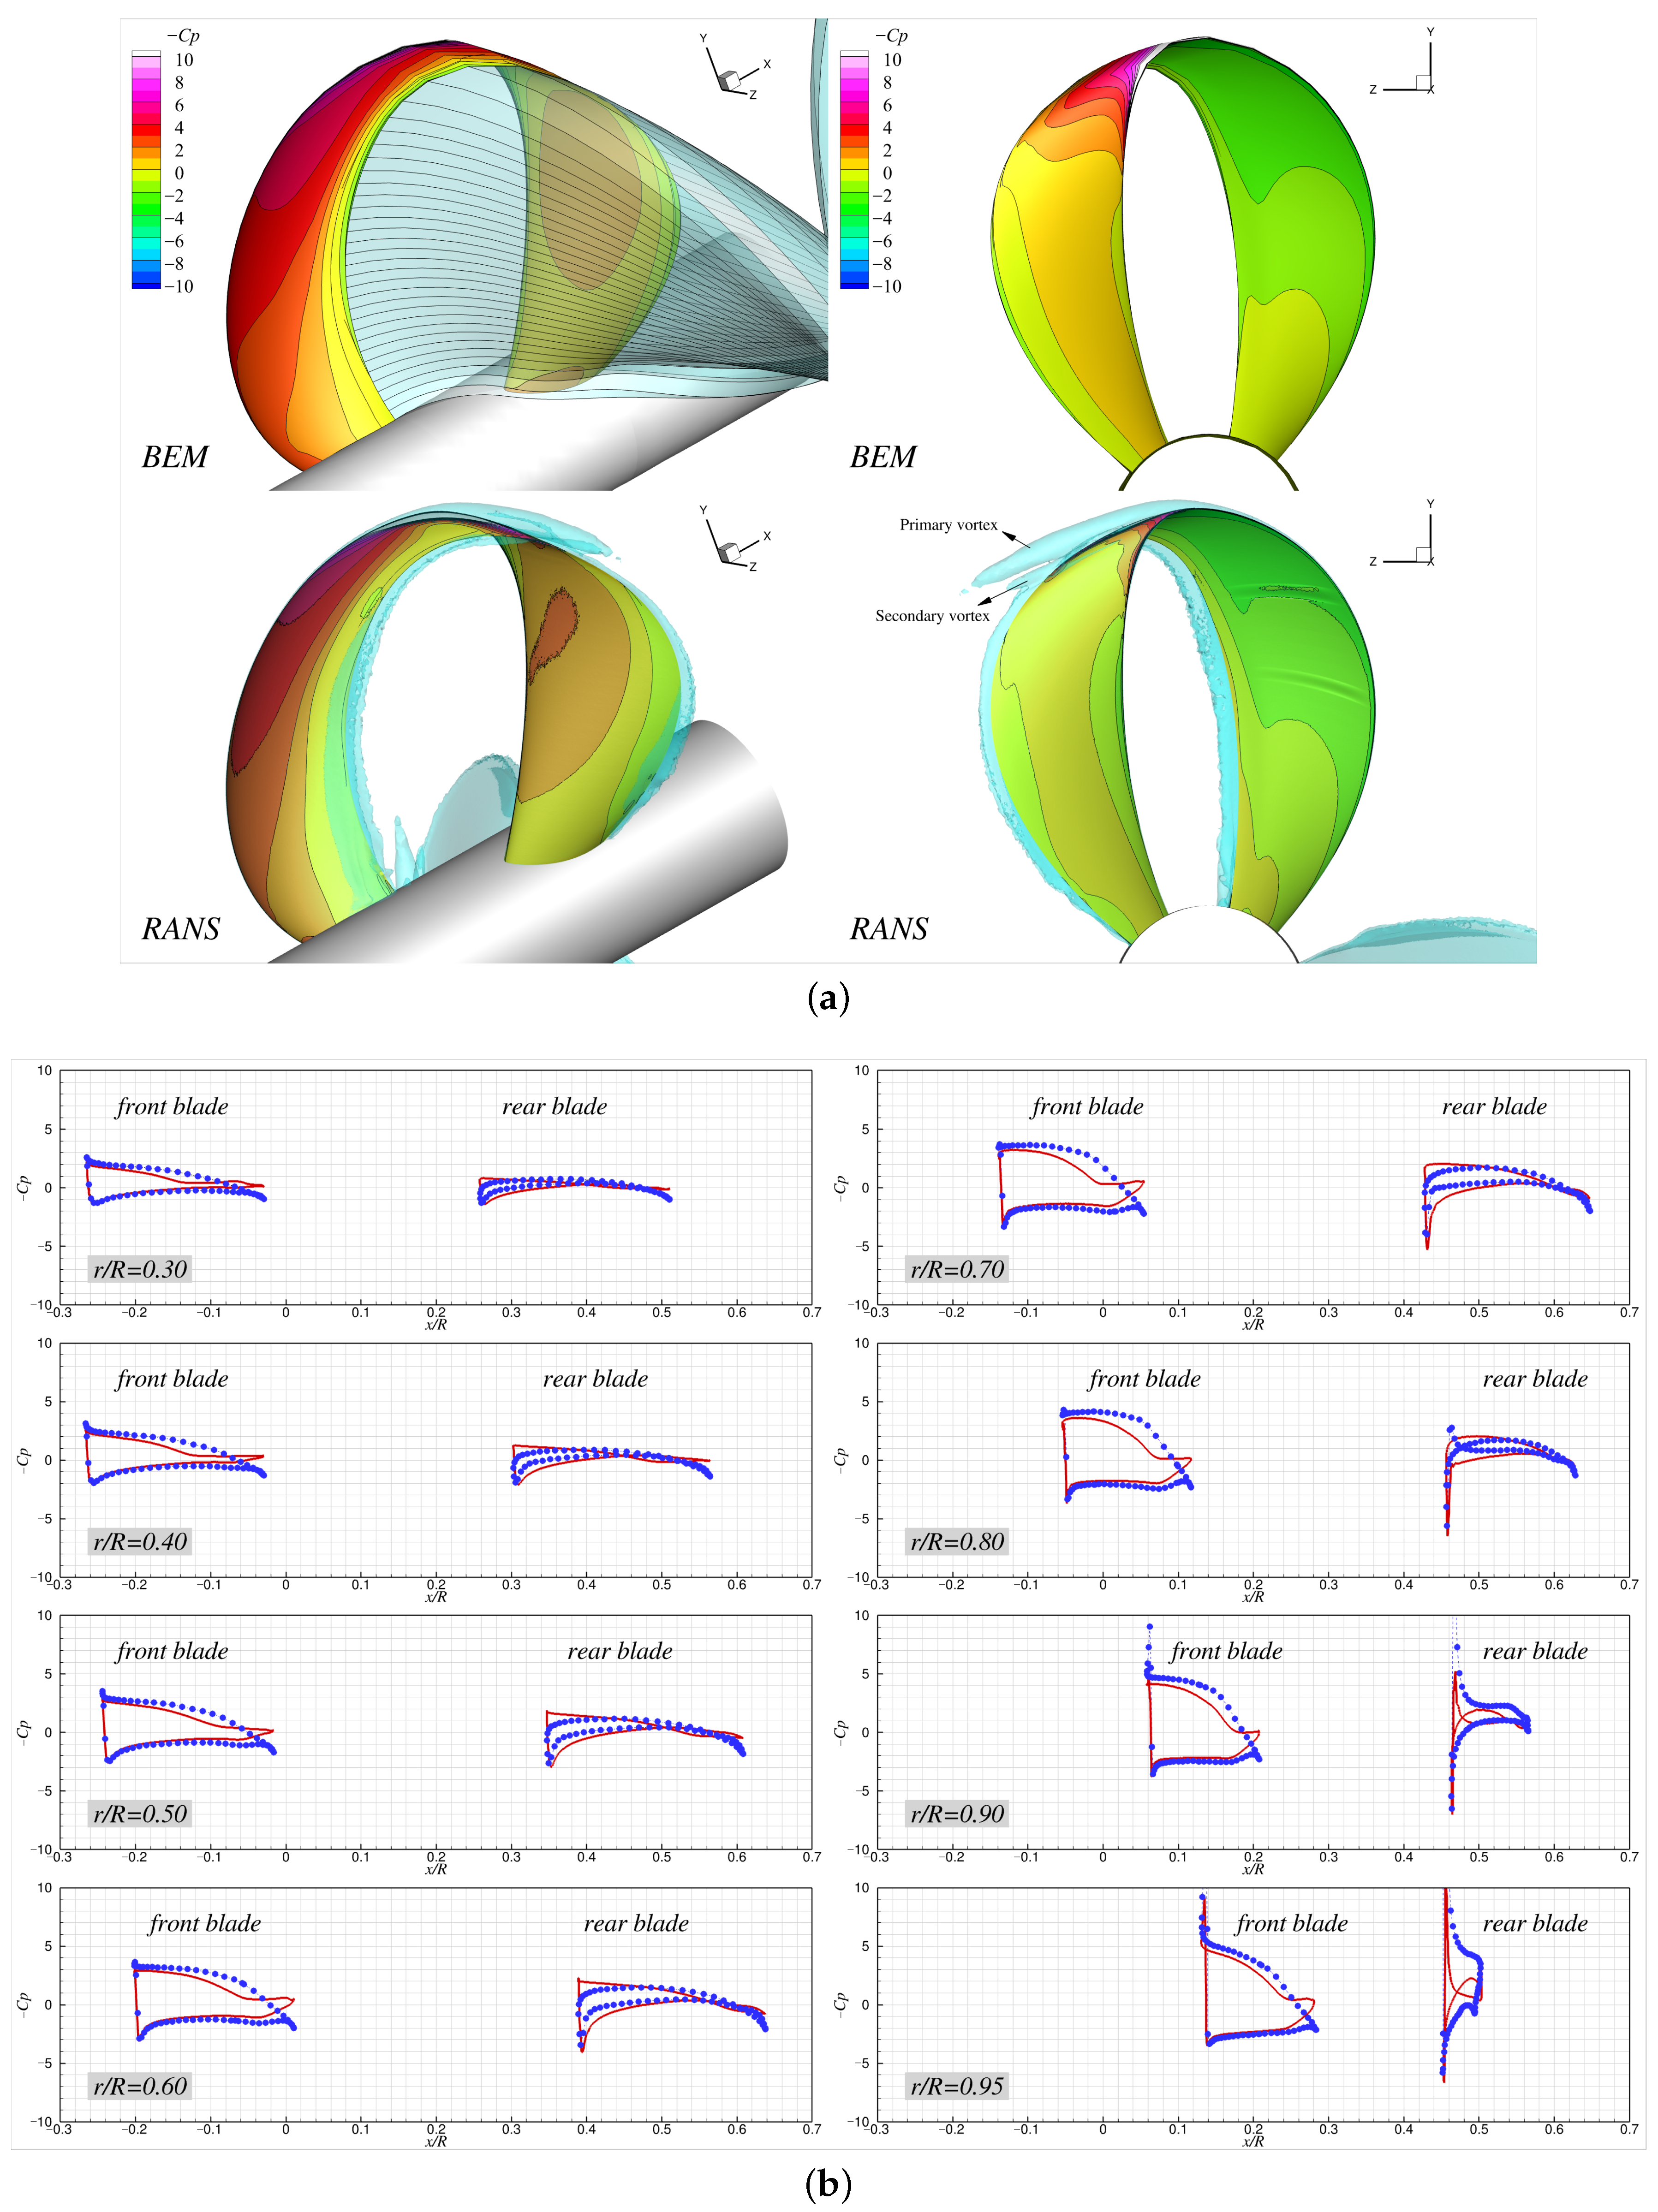
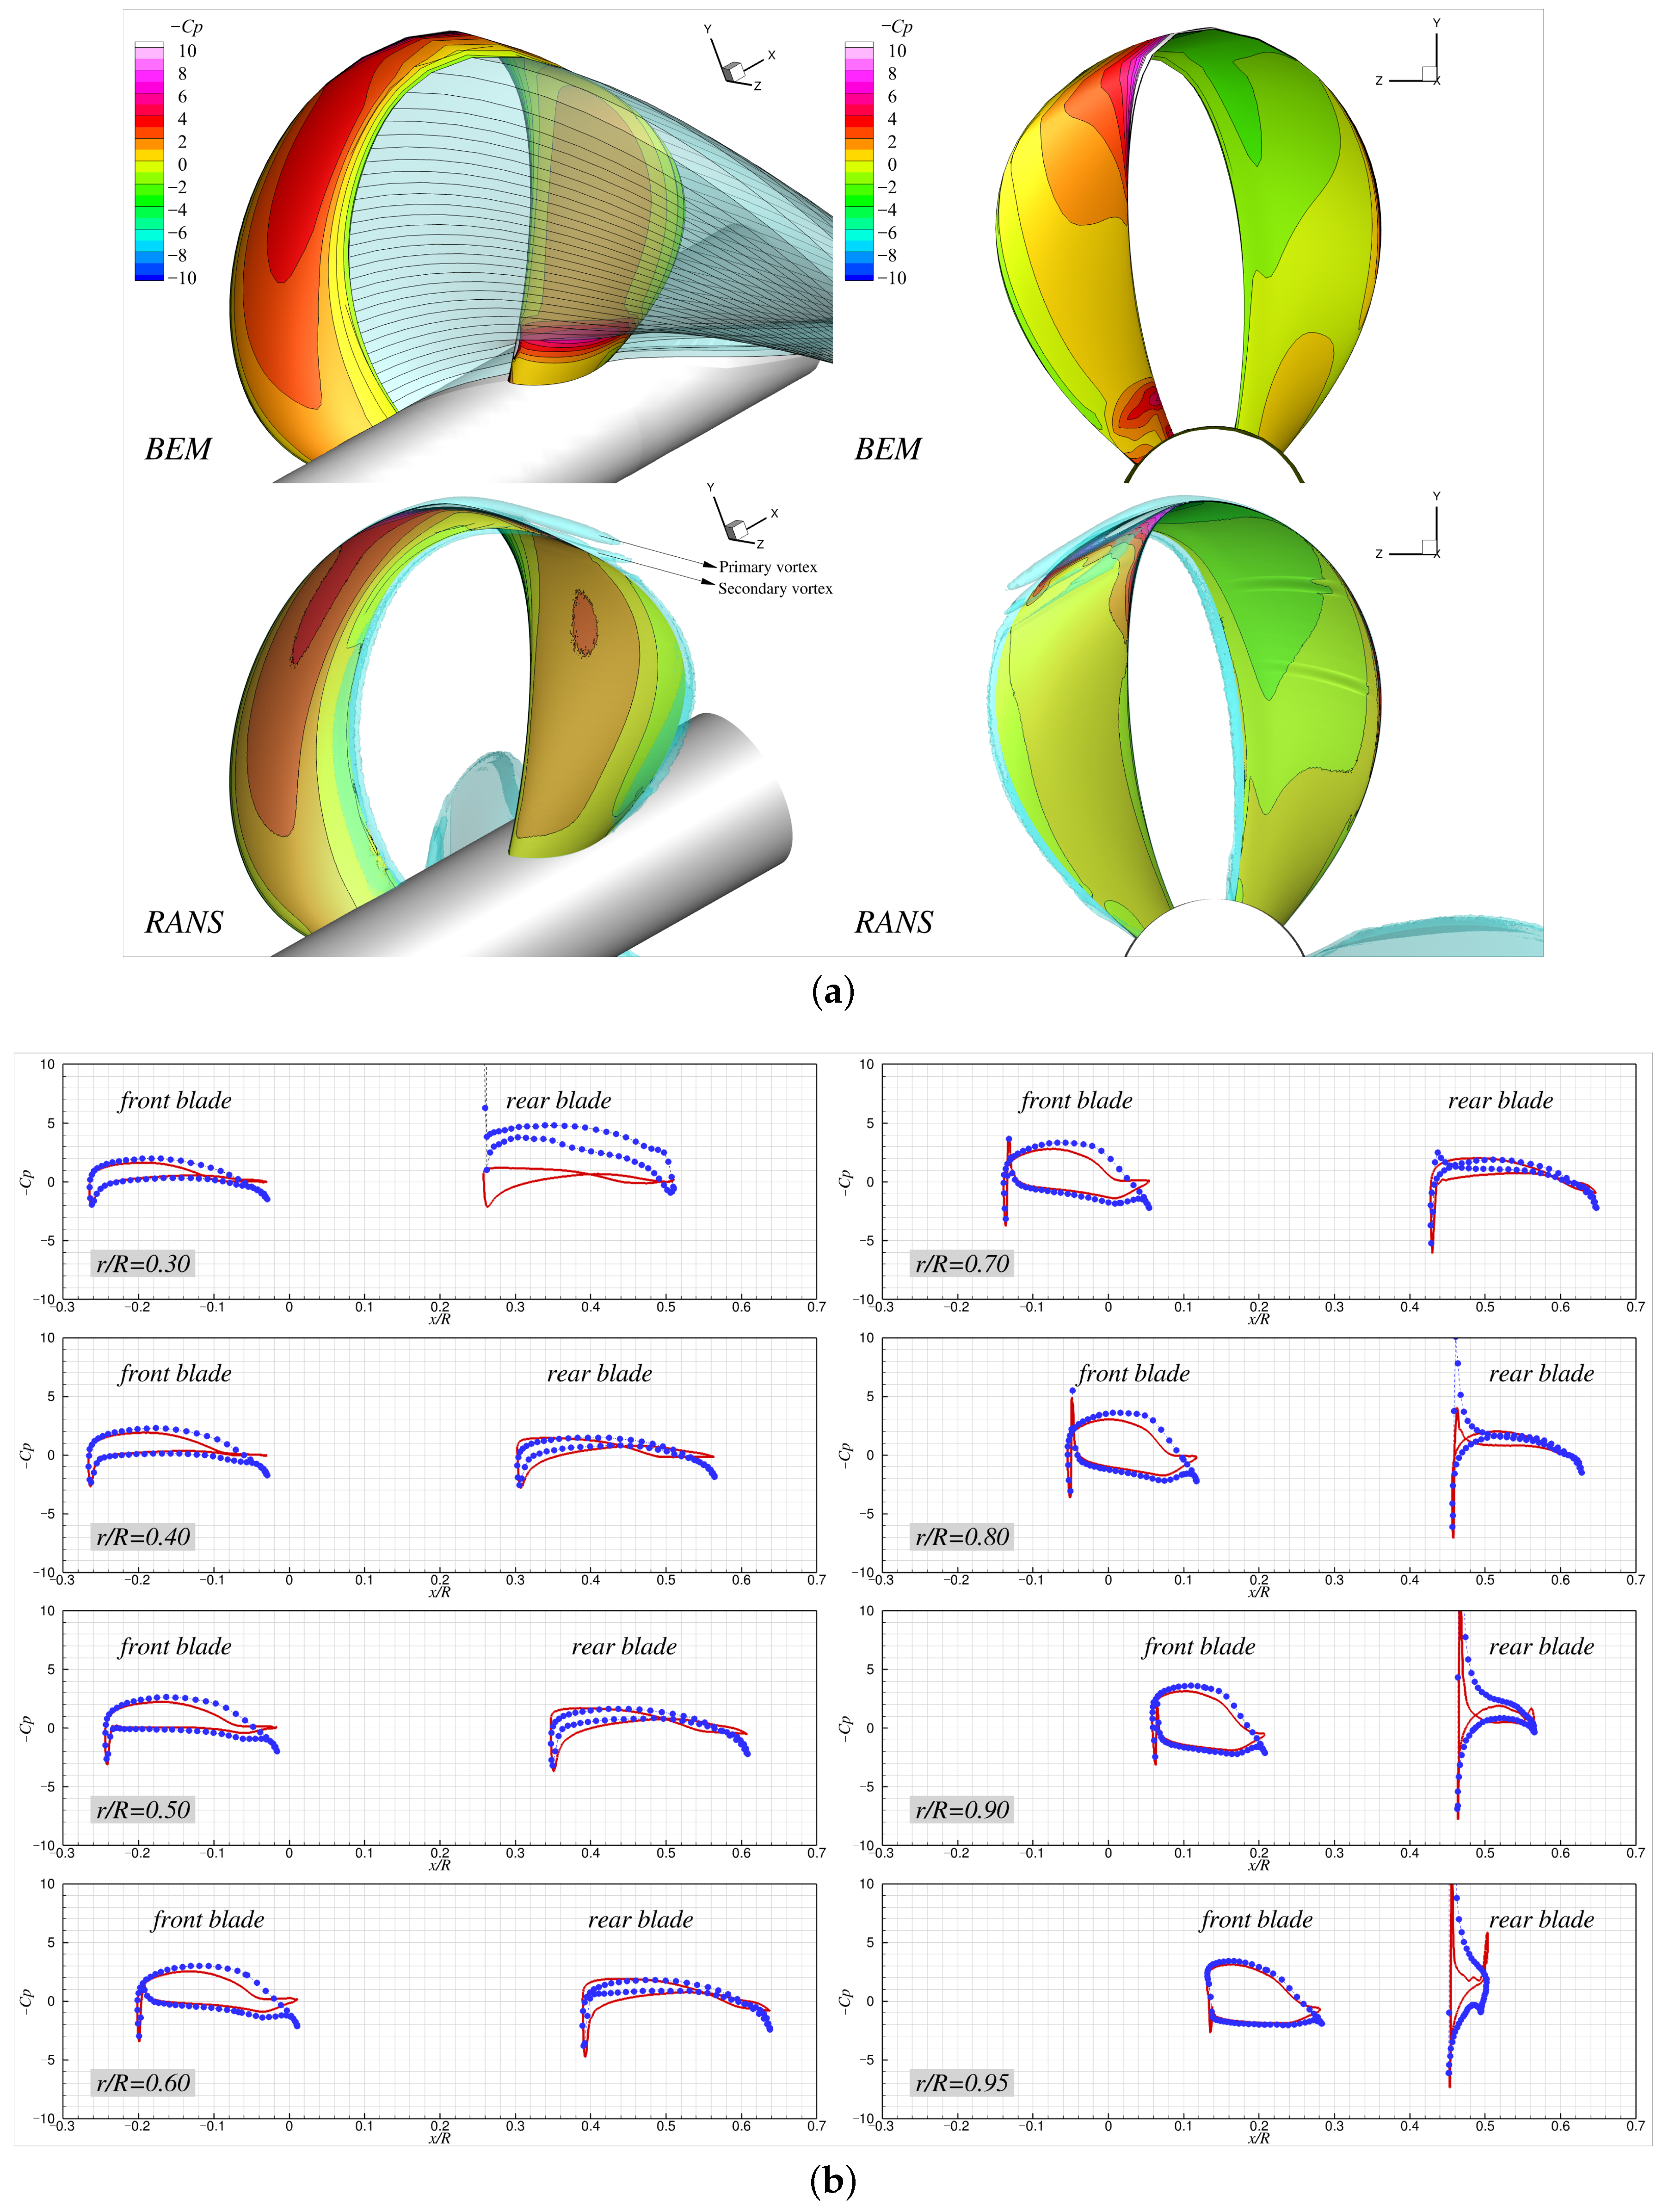
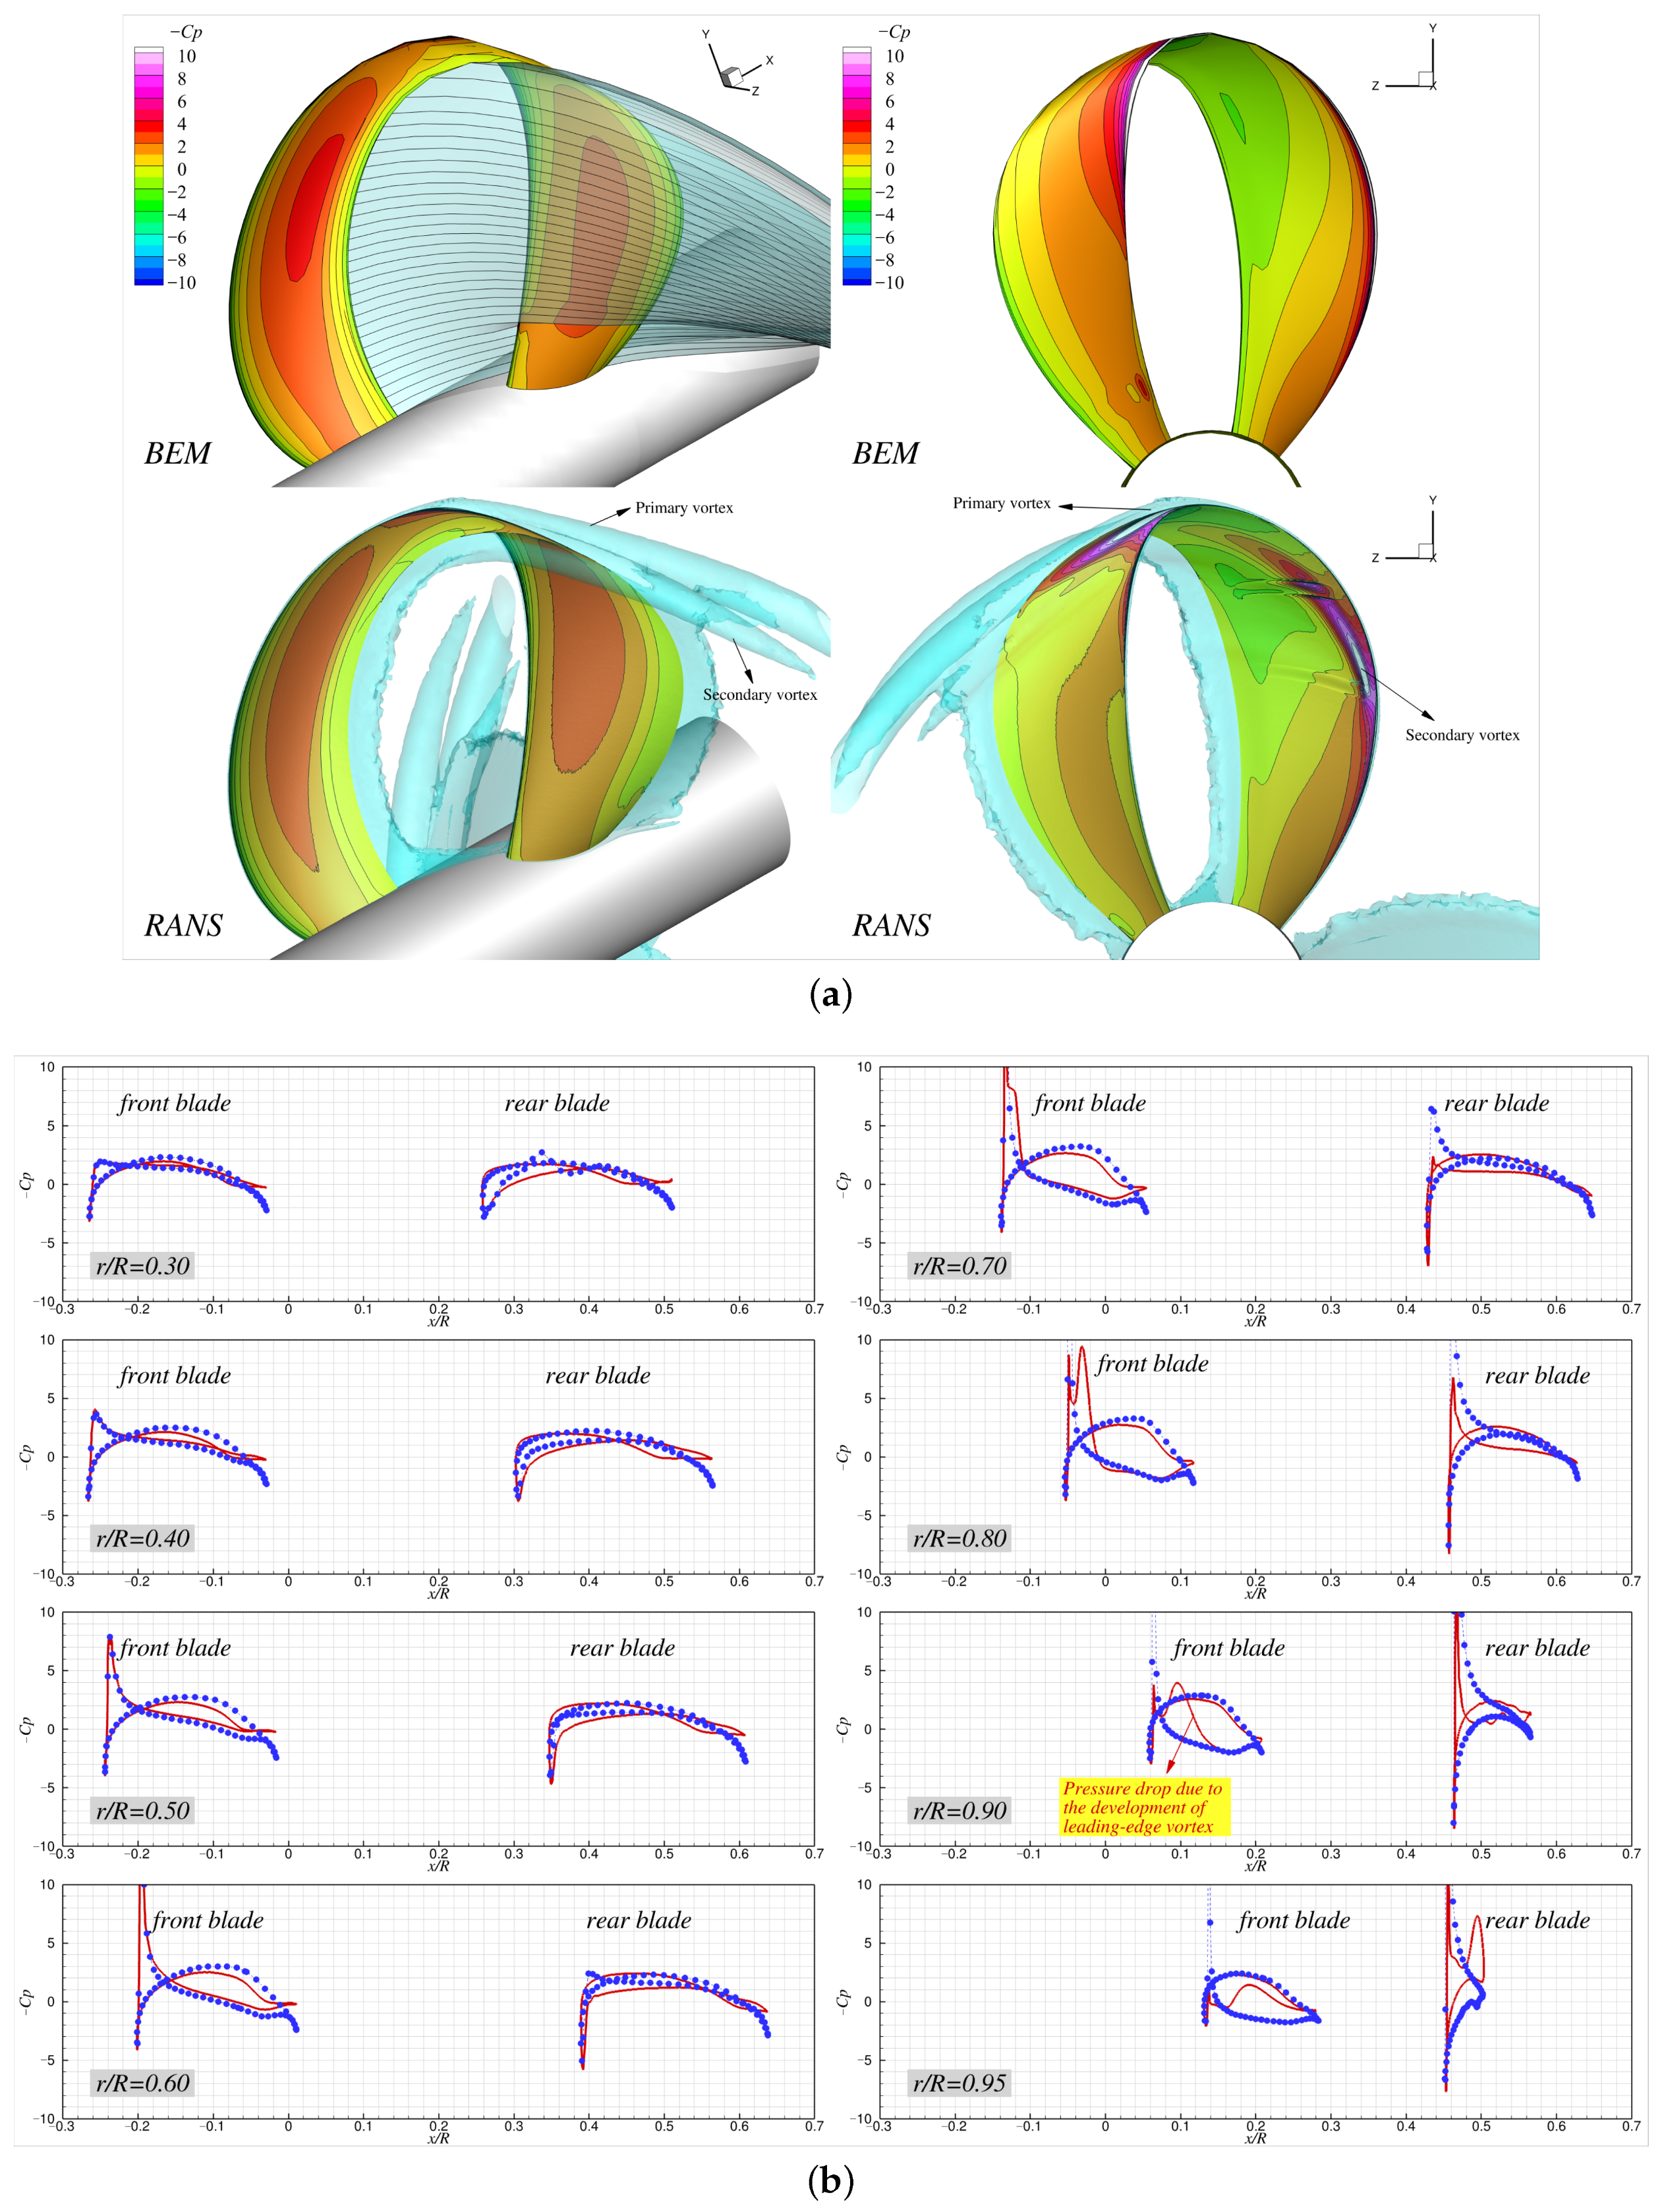
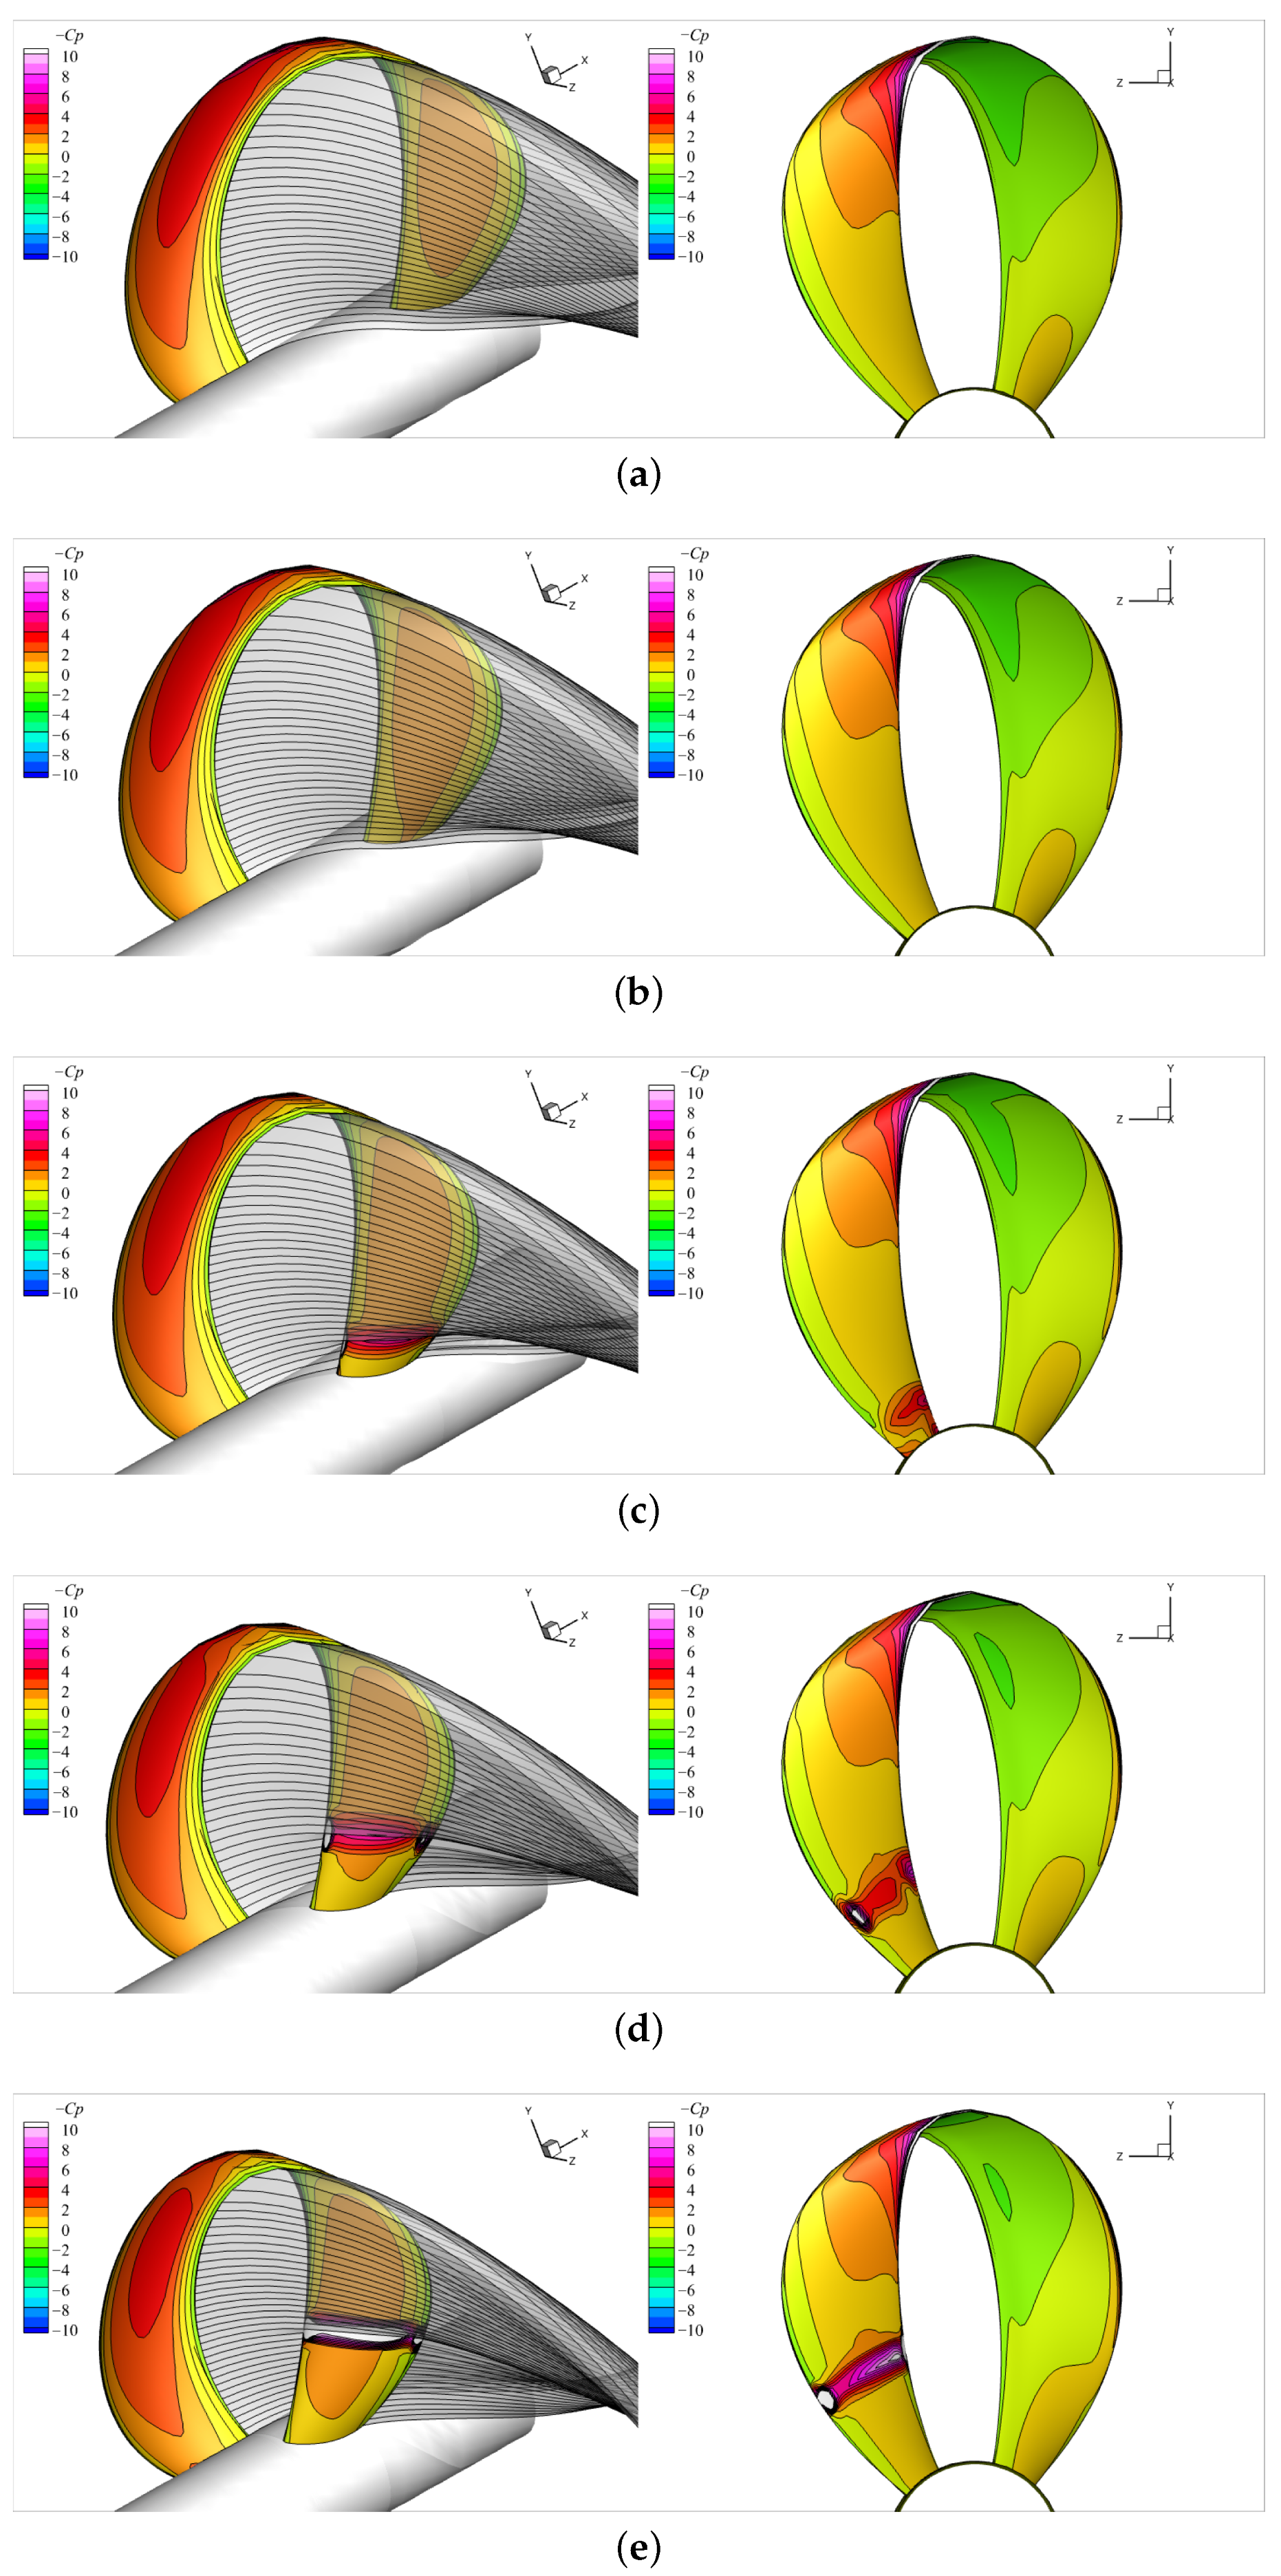
Figure 17,
Figure 18,
Figure 19 and
Figure 20 compare the pressure distributions (in
) on the blade between the BEM and RANS predictions at several
together with the fully aligned BEM wakes and the iso-surface of vorticity magnitude of 100 [s
−1]. Under higher loading conditions, the 3D plots show that the wake shed from the front blade did not intersect with the rear blade due to the high angle of attack; instead, the wake remained aligned along the hub surface and flowed downstream without direct contact with the rear blade. As the loading fell, the angle of attack was reduced, bringing the rear blade gradually into the path of the shed wake and causing it to split (
and
). Since the front blade had its maximum pitch near the root, the initial point of contact with the wake occurred at the root of the rear blade; as
increased, this contact point shifted outward along the span of the rear blade. The iso-surfaces of the vorticity and surface pressure contours from the RANS results captured a strong leading-edge vortex that originated from the front blade, passed over the looped tip, and convected downstream. This vortex induced very low pressure along its trajectory near the blade surface, resulting in noticeable differences from the BEM predictions, where such low-pressure regions beneath the leading-edge vortices were absent as these vortices were not modeled. Particularly, at
, the leading-edge vortex from the front blade developed on the pressure side due to the reversed angle of attack, resulting in localized pressure reduction along its trajectory.
Another critical flow feature that the BEM failed to capture here was flow separation, as observed in the 3D plots that compare the BEM wake and the RANS vortices. In the 2D pressure plots, the two approaches showed reasonable agreement near the leading edge of the front blade, but noticeable deviations appeared from the midchord region where the flow separation occurred (see also the detachment of vorticity from the blade midchord in the 3D plots). When separation occurred, the adverse pressure gradient induced a localized increase in the pressure due to flow stagnation, leading to discrepancies from the inviscid results on the suction side. Toward the trailing edge, the surface pressures behind the separation region went lower than those predicted by the BEM because the separated flow prevents pressure recovery. As
increased and the angle of attack decreased, the separation on the front blade was mitigated, resulting in better agreement between the BEM and RANS predictions on the suction side. However, at
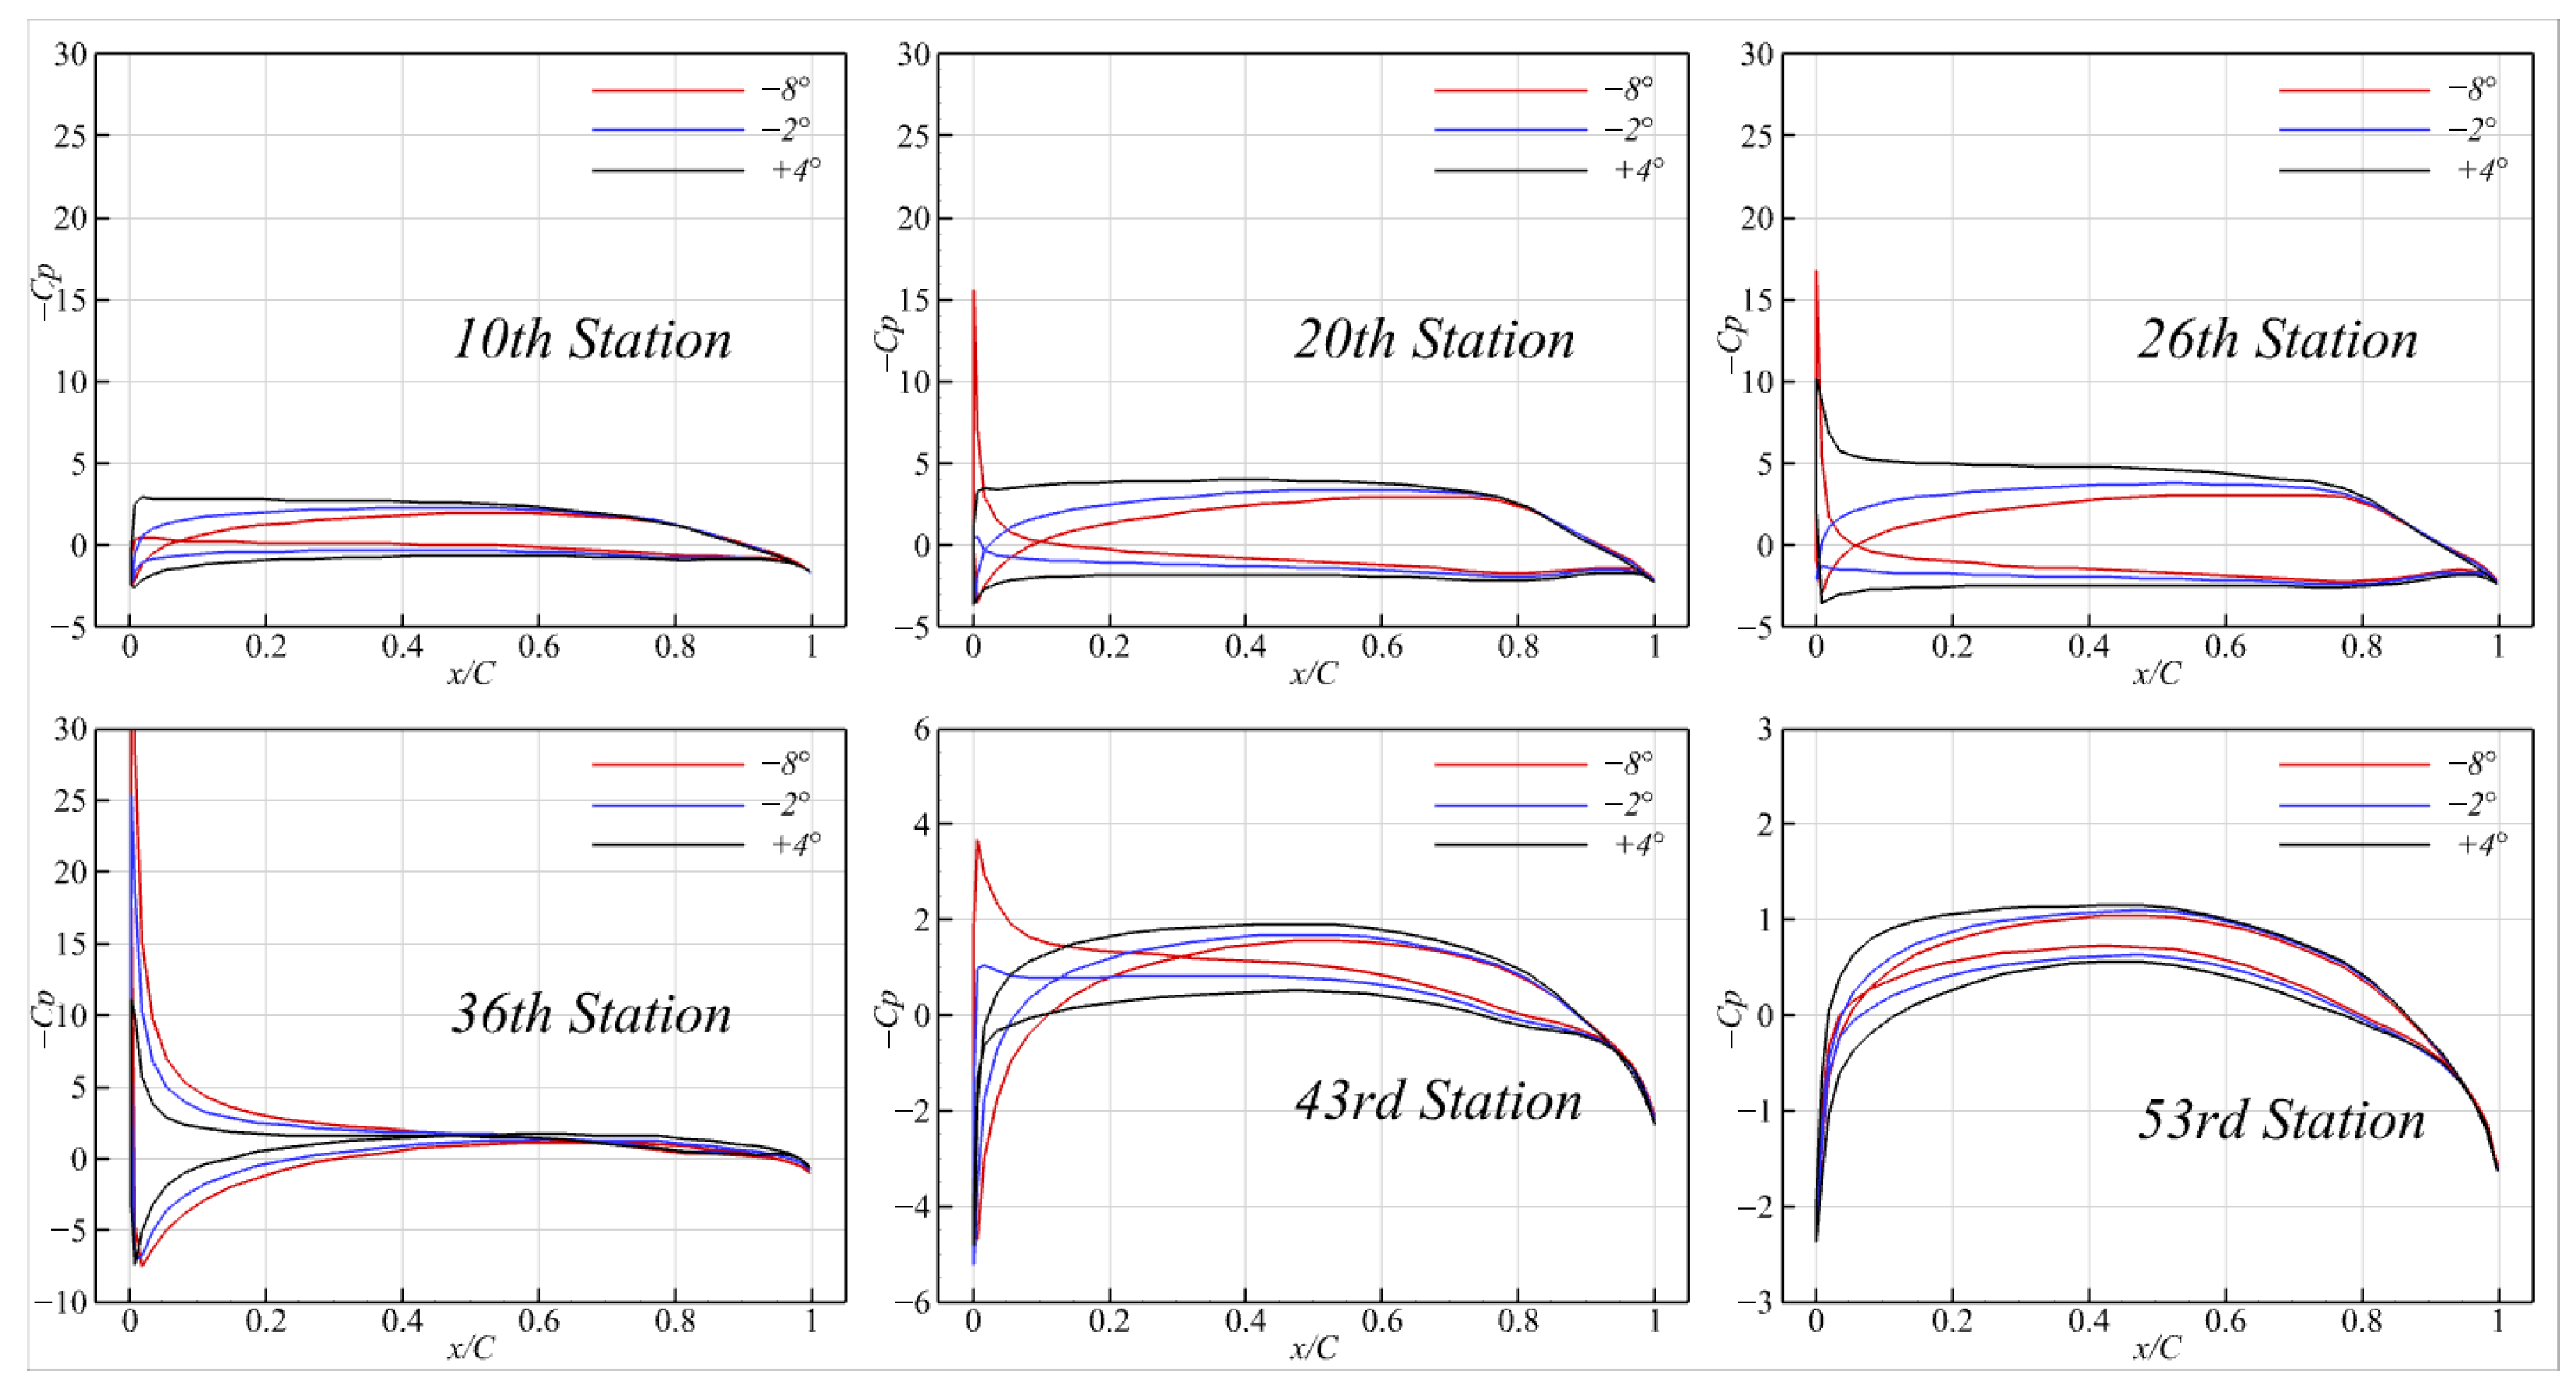
, a strong leading-edge vortex originating from the pressure side of the front blade generated a region of significantly low pressure, as captured in the 2D pressure plots (
Figure 20b).
A noticeable difference between the BEM and RANS predictions also appeared on the rear blade pressure distribution, particularly at ∼, where the RANS results exhibited pronounced suction peaks near the leading edge, which were absent in the BEM predictions. These peaks might be attributed to the unsteady interaction between the rear blade and the wake shed from the front blade. As the rear blade passes through this highly non-uniform inflow, it experiences locally increased angles of attack and strong velocity gradients, which, in turn, induce the formation of leading-edge pressure peaks. As the loading falls, these leading-edge pressure peaks become mitigated due to the reduced angle of attack. Such effects are fully captured in the viscous and transient nature of the RANS simulations, but they are beyond the scope of the potential-based BEM solver.
In the present BEM formulation, the trailing wake is represented as a concentrated vortex sheet shed from the trailing edges of both blades. This modeling explains the noticeable pressure discrepancies at and , where the BEM predicts substantially lower pressures than RANS on both sides of the rear blade. When the concentrated vortex convects too close to the blade surface, it can induce extremely low pressures. In contrast, the vortices shed from the front blade in the RANS simulations diffuse and interact with the rear blade boundary layer, preventing direct impingement on the blade surface and, thus, avoiding such exaggerated pressure drops.
In addition to the wake comparison between the BEM and RANS predictions on the vertical (
x-
y) plane (
Figure 15),
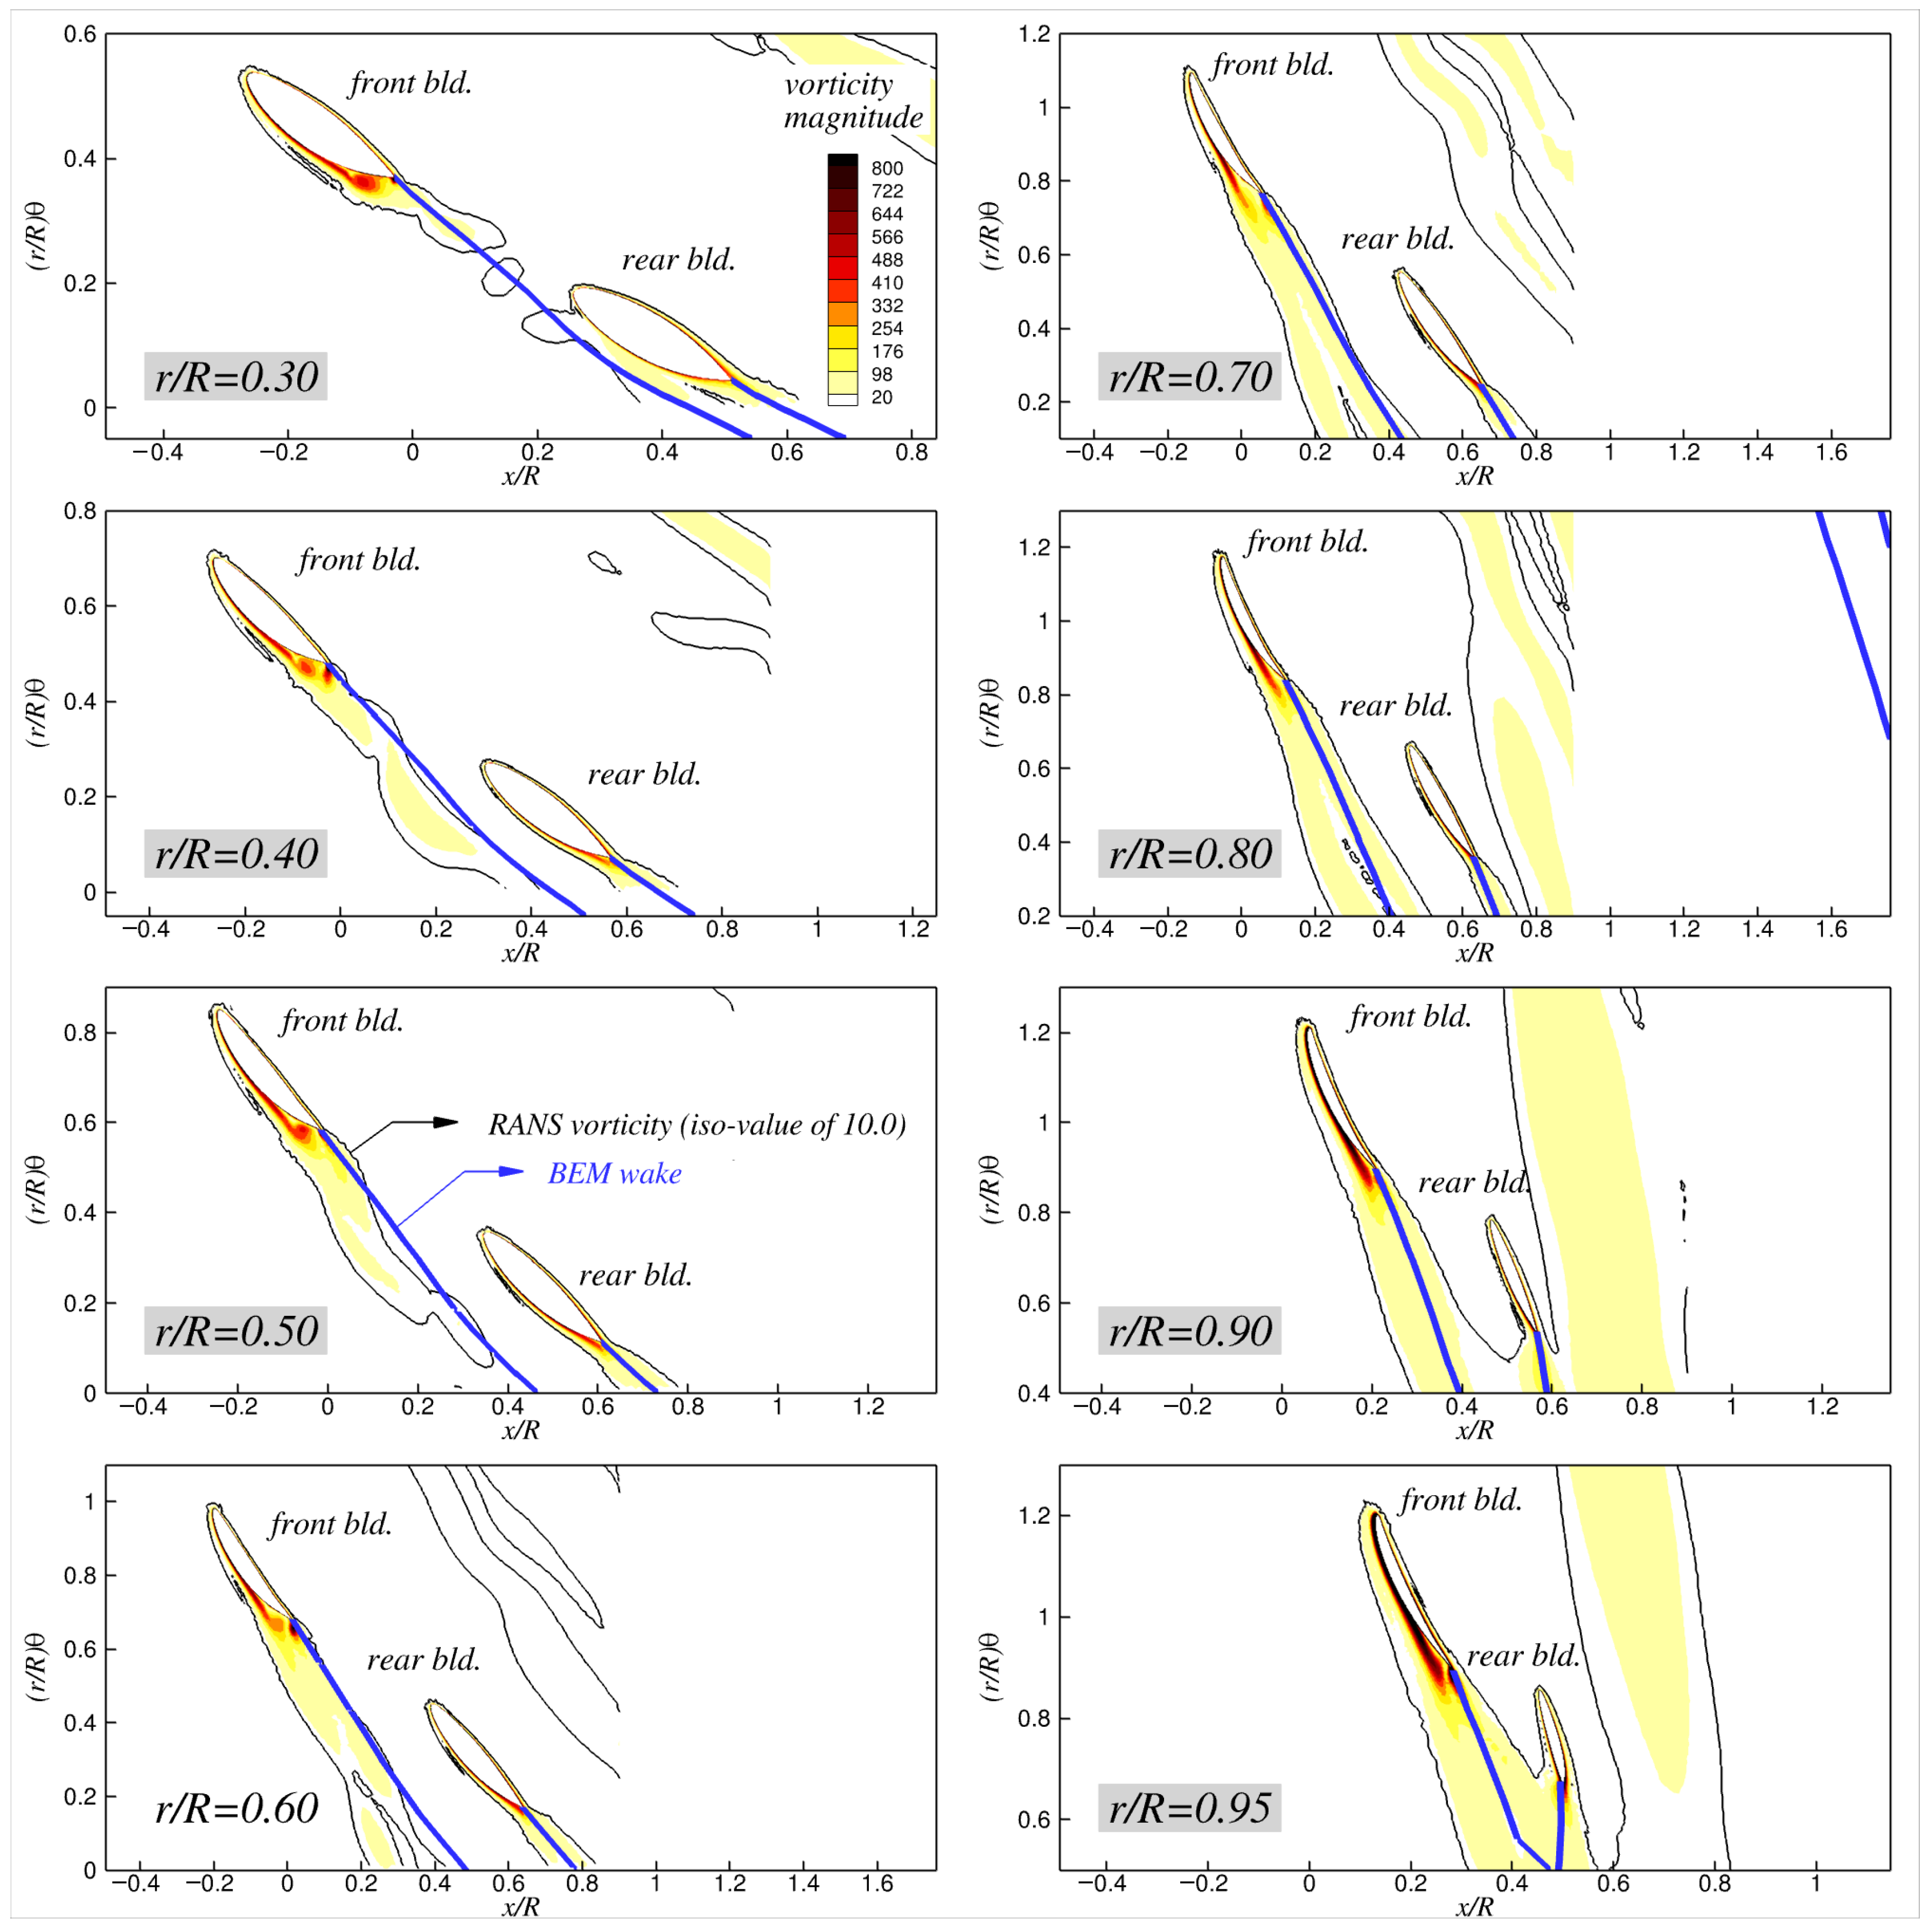
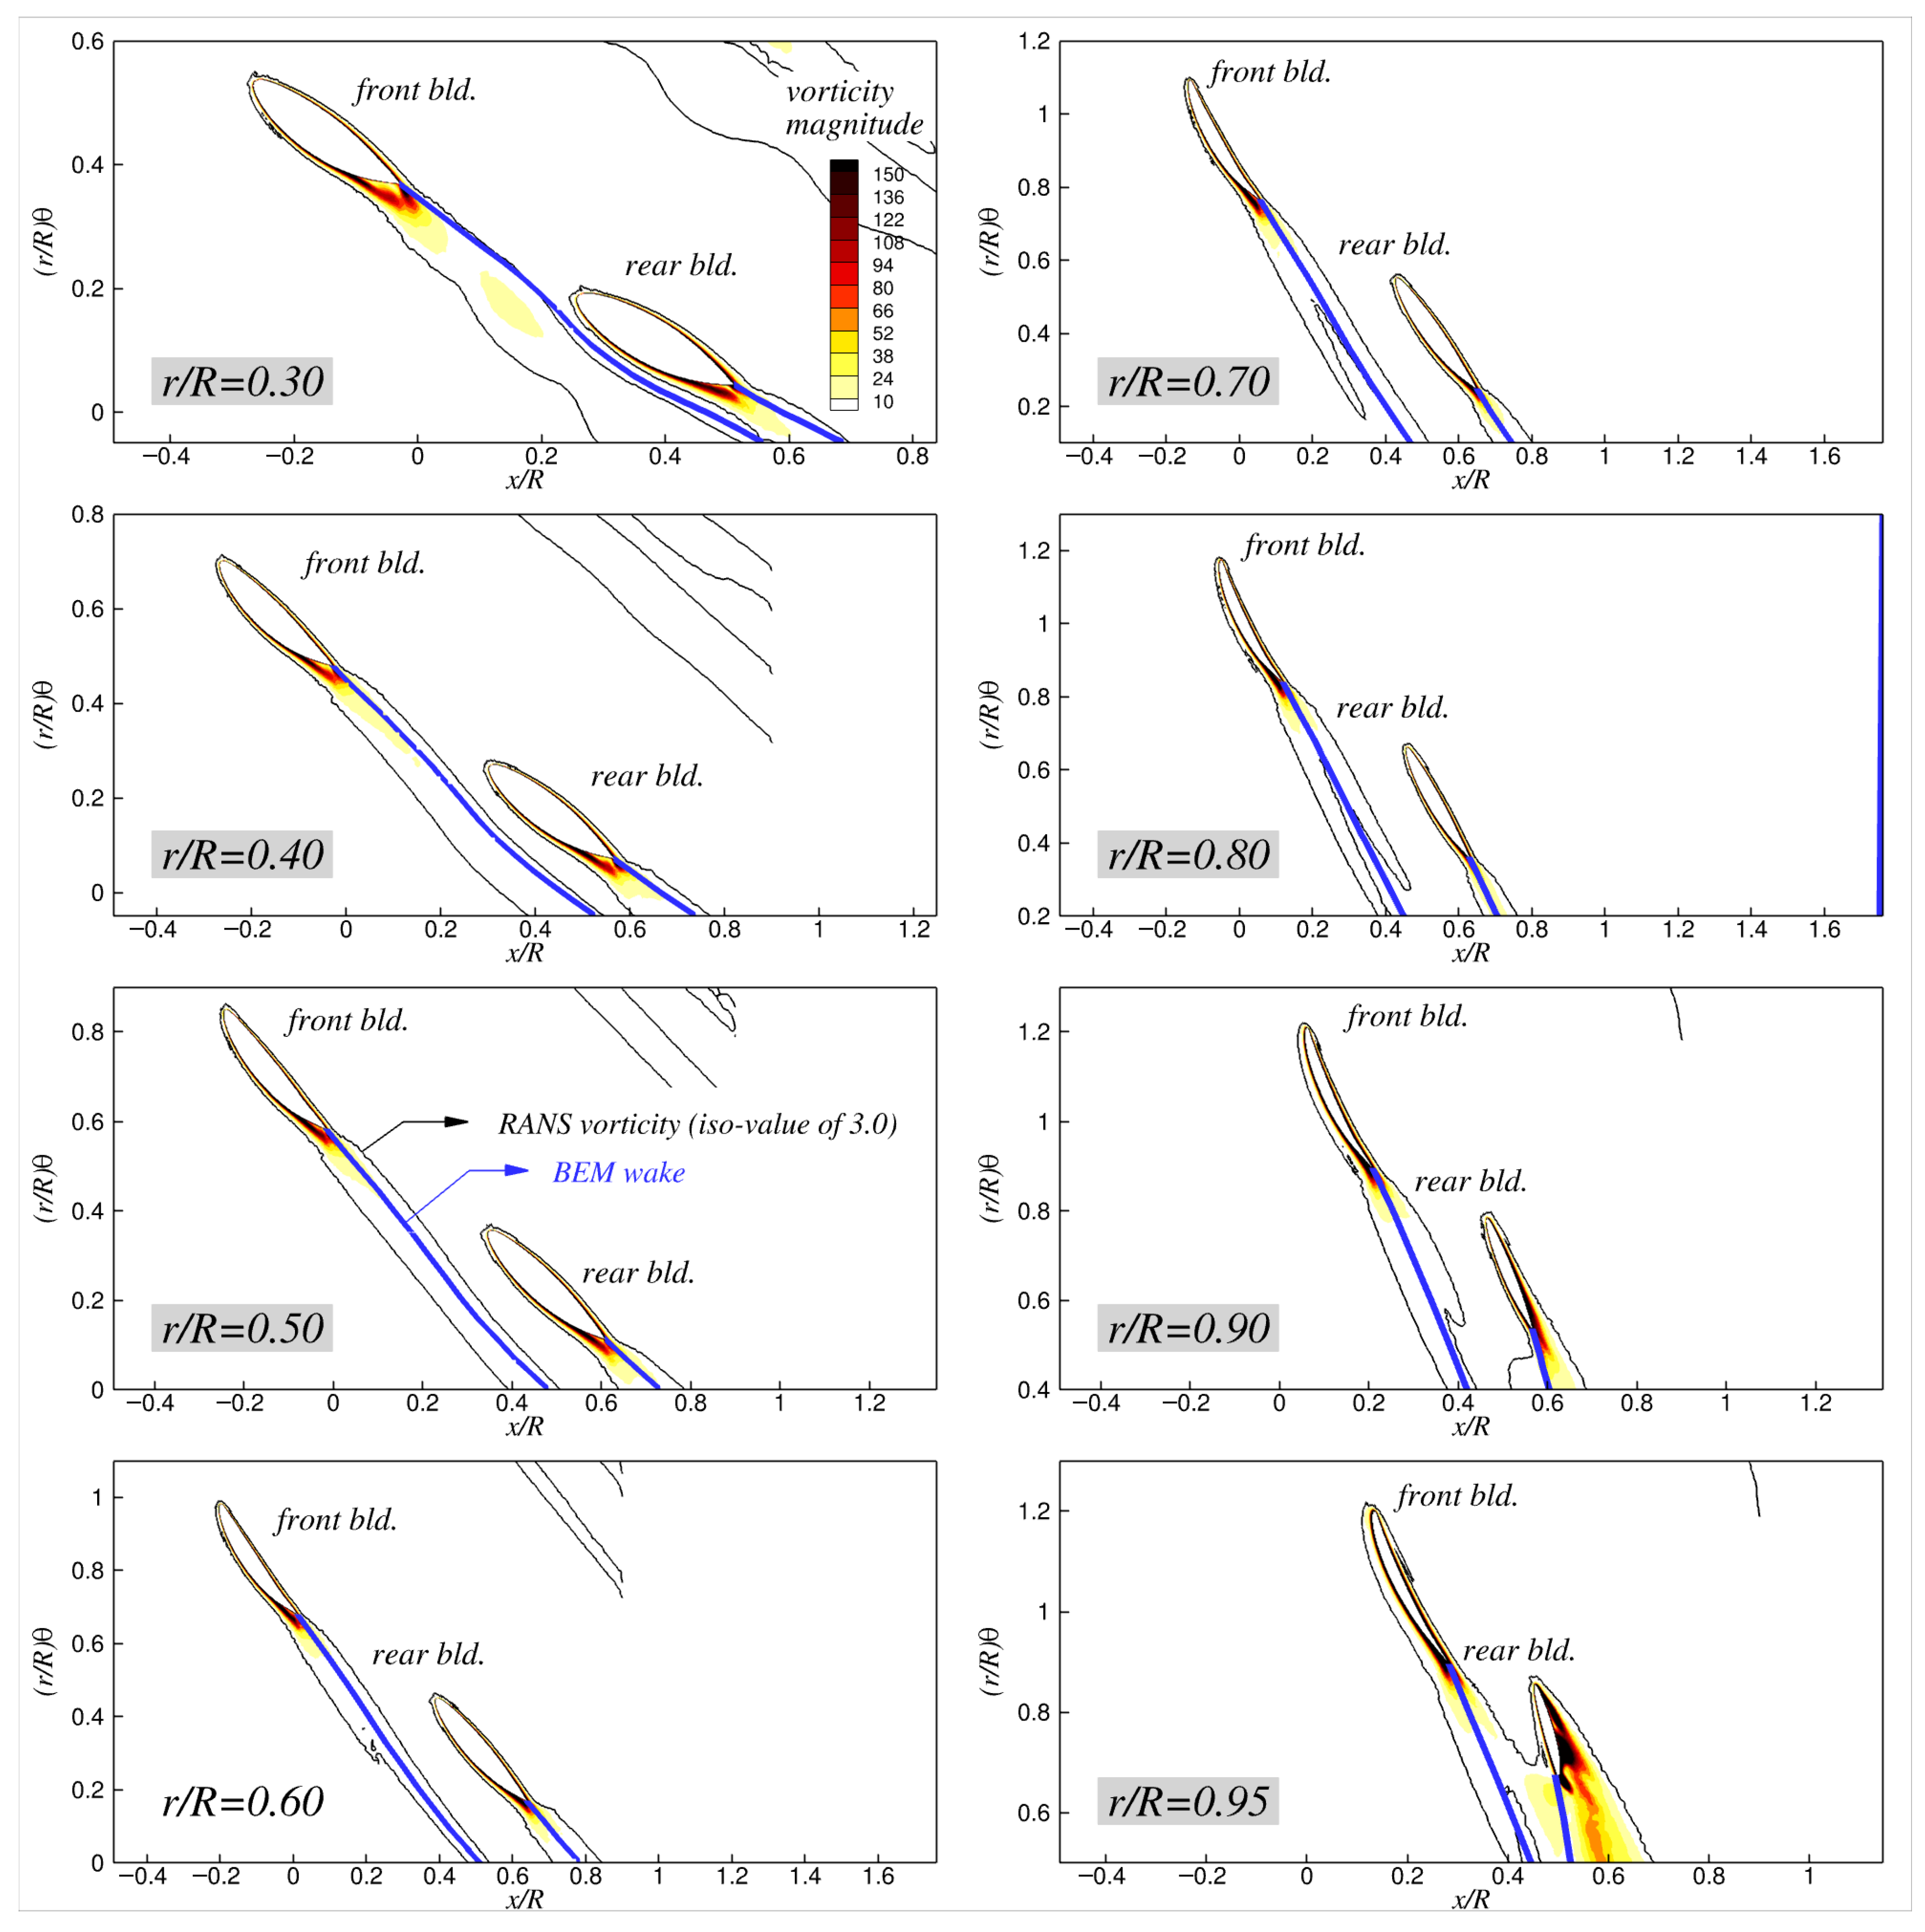
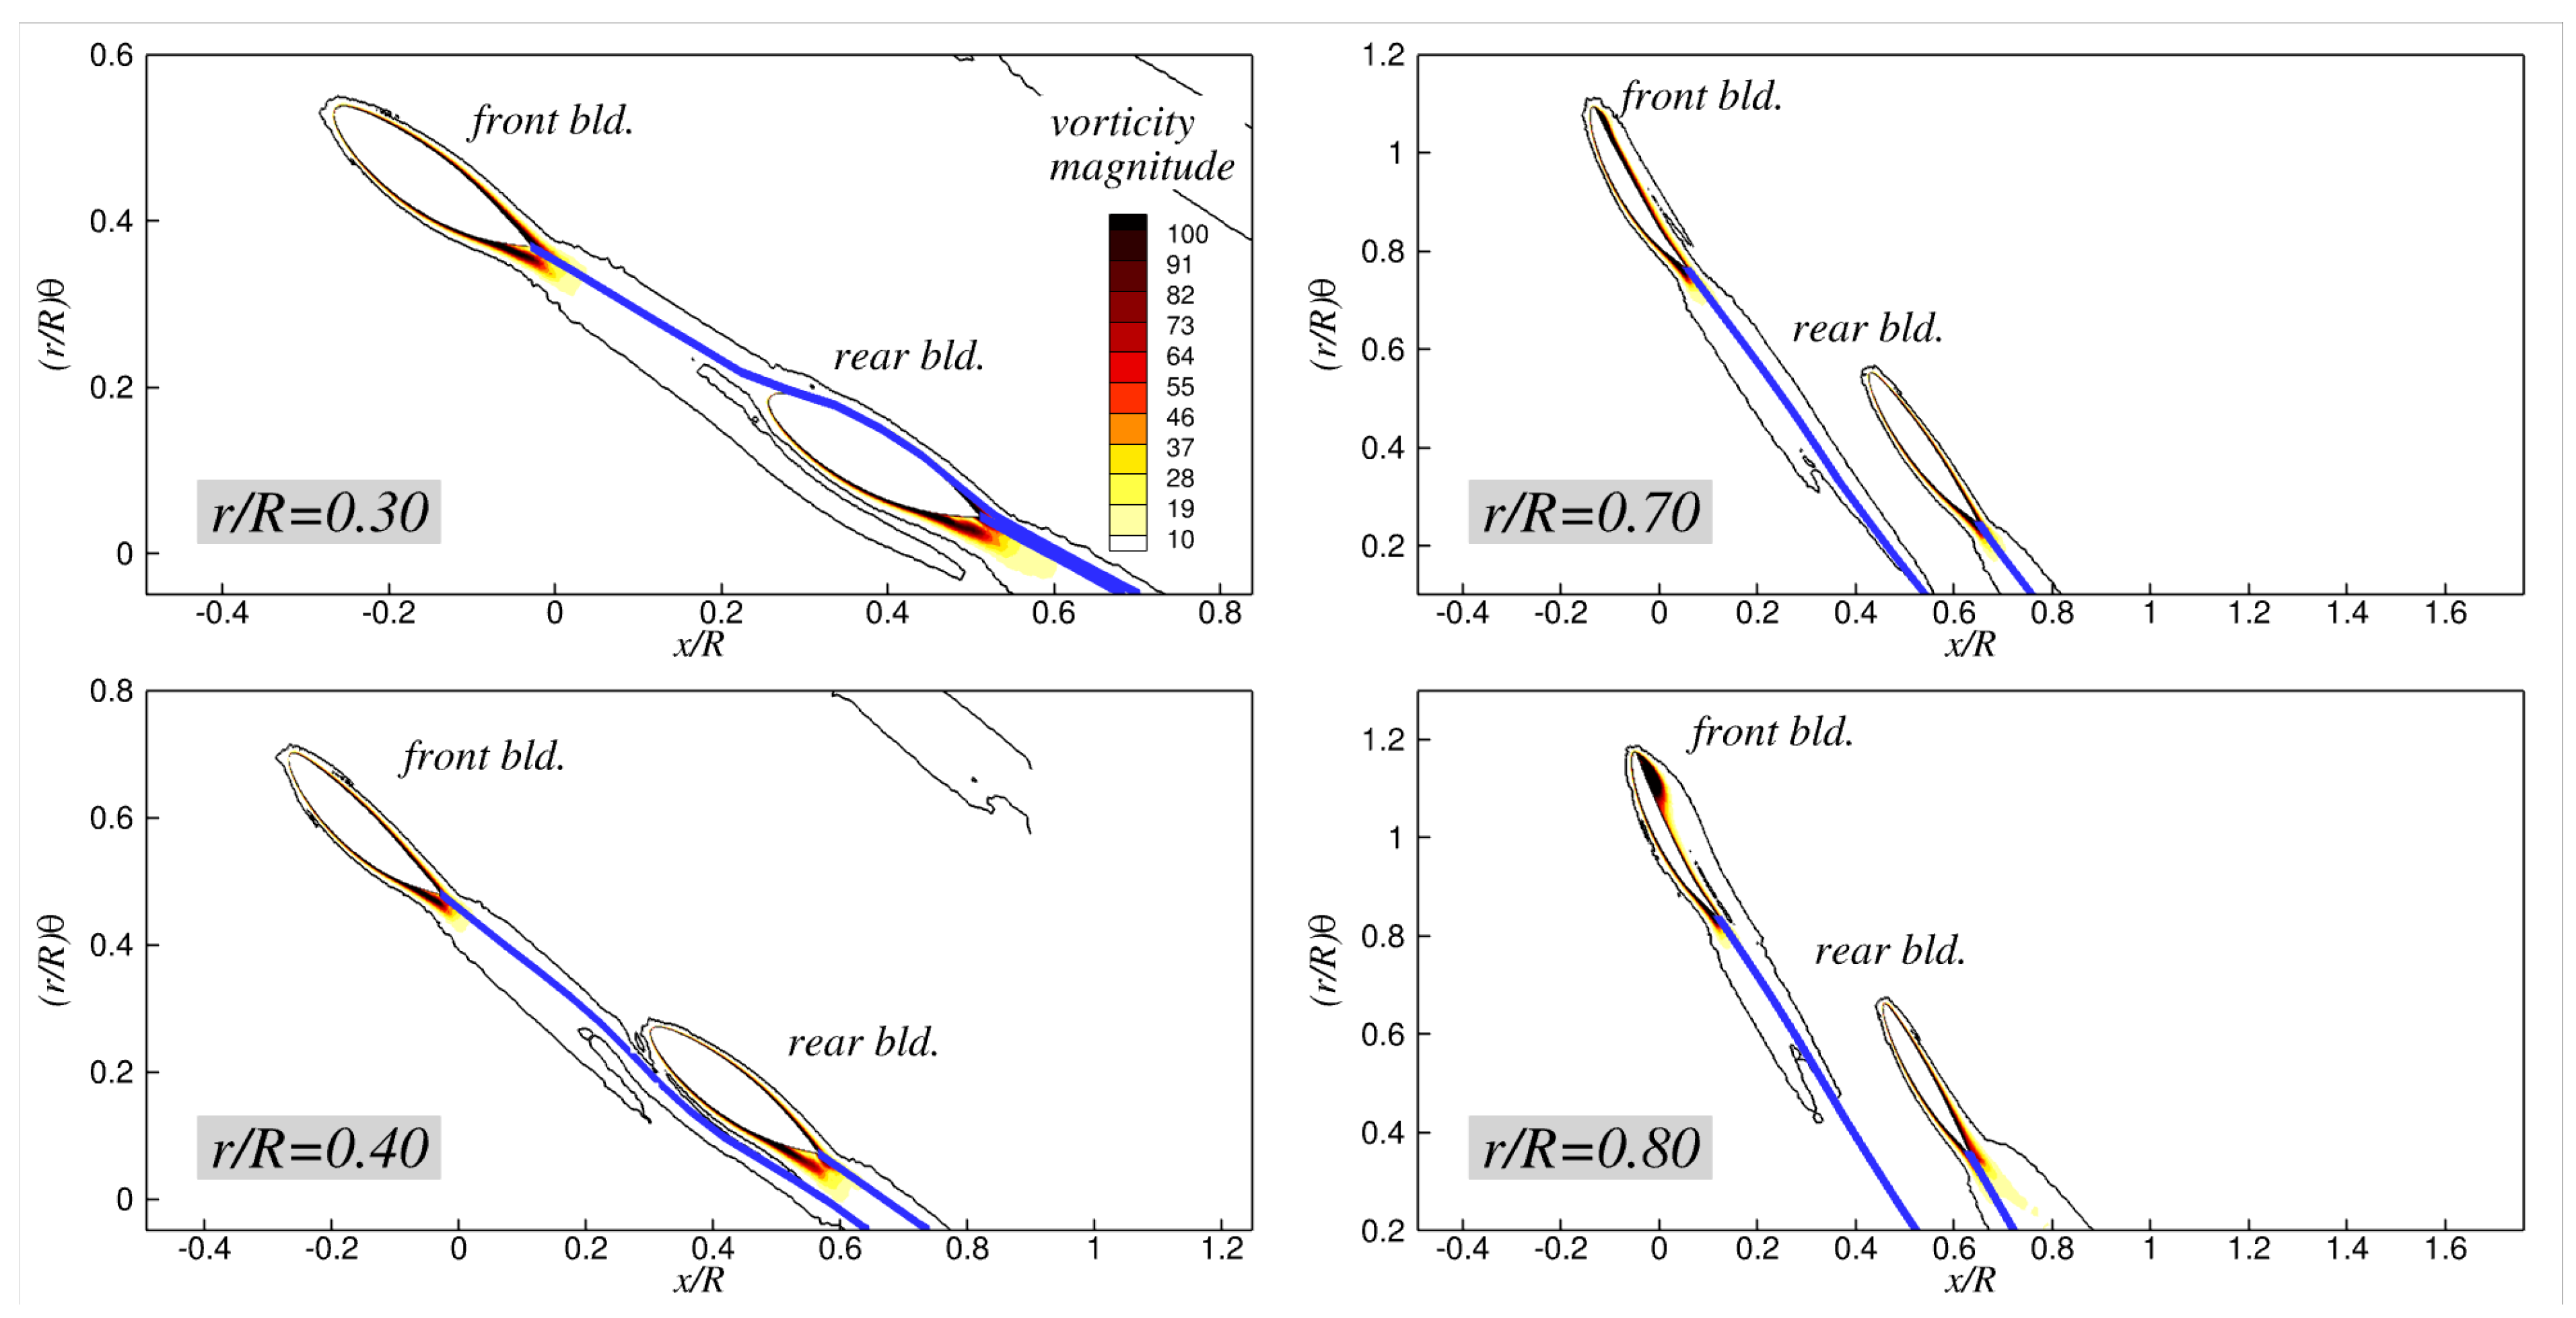
Figure 21,
Figure 22,
Figure 23 and
Figure 24 compare the BEM-predicted trailing wakes with the shed vortices from the RANS simulations on the
x-
plane at several radial stations. Because the toroidal propeller exhibits a non-conventional blade configuration and complex wake topology, it is crucial to validate the BEM-predicted wake trajectories against the viscous RANS results at various radial locations. Overall, the figures show satisfactory agreement between the two different approaches: the BEM trailing wakes, represented as concentrated vortex filaments (blue solid lines in the figures), generally follow the paths of the shed vortices captured in the RANS simulations. The wake–blade interactions near the rear-blade root are particularly well reproduced by the BEM. The predicted wake approaches the rear-blade surface as
increases, eventually touching the surface at
, and it then shifts from the suction side to the opposite side of the blade at
. The RANS results reveal a very similar trend, where the wake shed from the front blade gradually moves closer to the rear blade with increasing
, bringing the rear blade into the path of the shed wake. These features are captured by the BEM, demonstrating its capability to predict the overall wake alignment and its evolution under varying operating conditions. It is also worth noting that the BEM trailing wake passes extremely close to the rear-blade surface at
and
in the absence of a developing boundary layer on the rear blade surface, which explains the substantial low-pressure regions discussed earlier.
3.2. Parametric Study of the Model Propeller
As shown in this section, a parametric study of the model propeller was conducted by varying key geometric parameters, such as the blade pitch, axial distance, and lateral angle, to evaluate the feasibility and reliability of the proposed method across different geometric configurations. For validation, reference was made to the RANS simulation data reported in Kim et al. (2025) [
6].
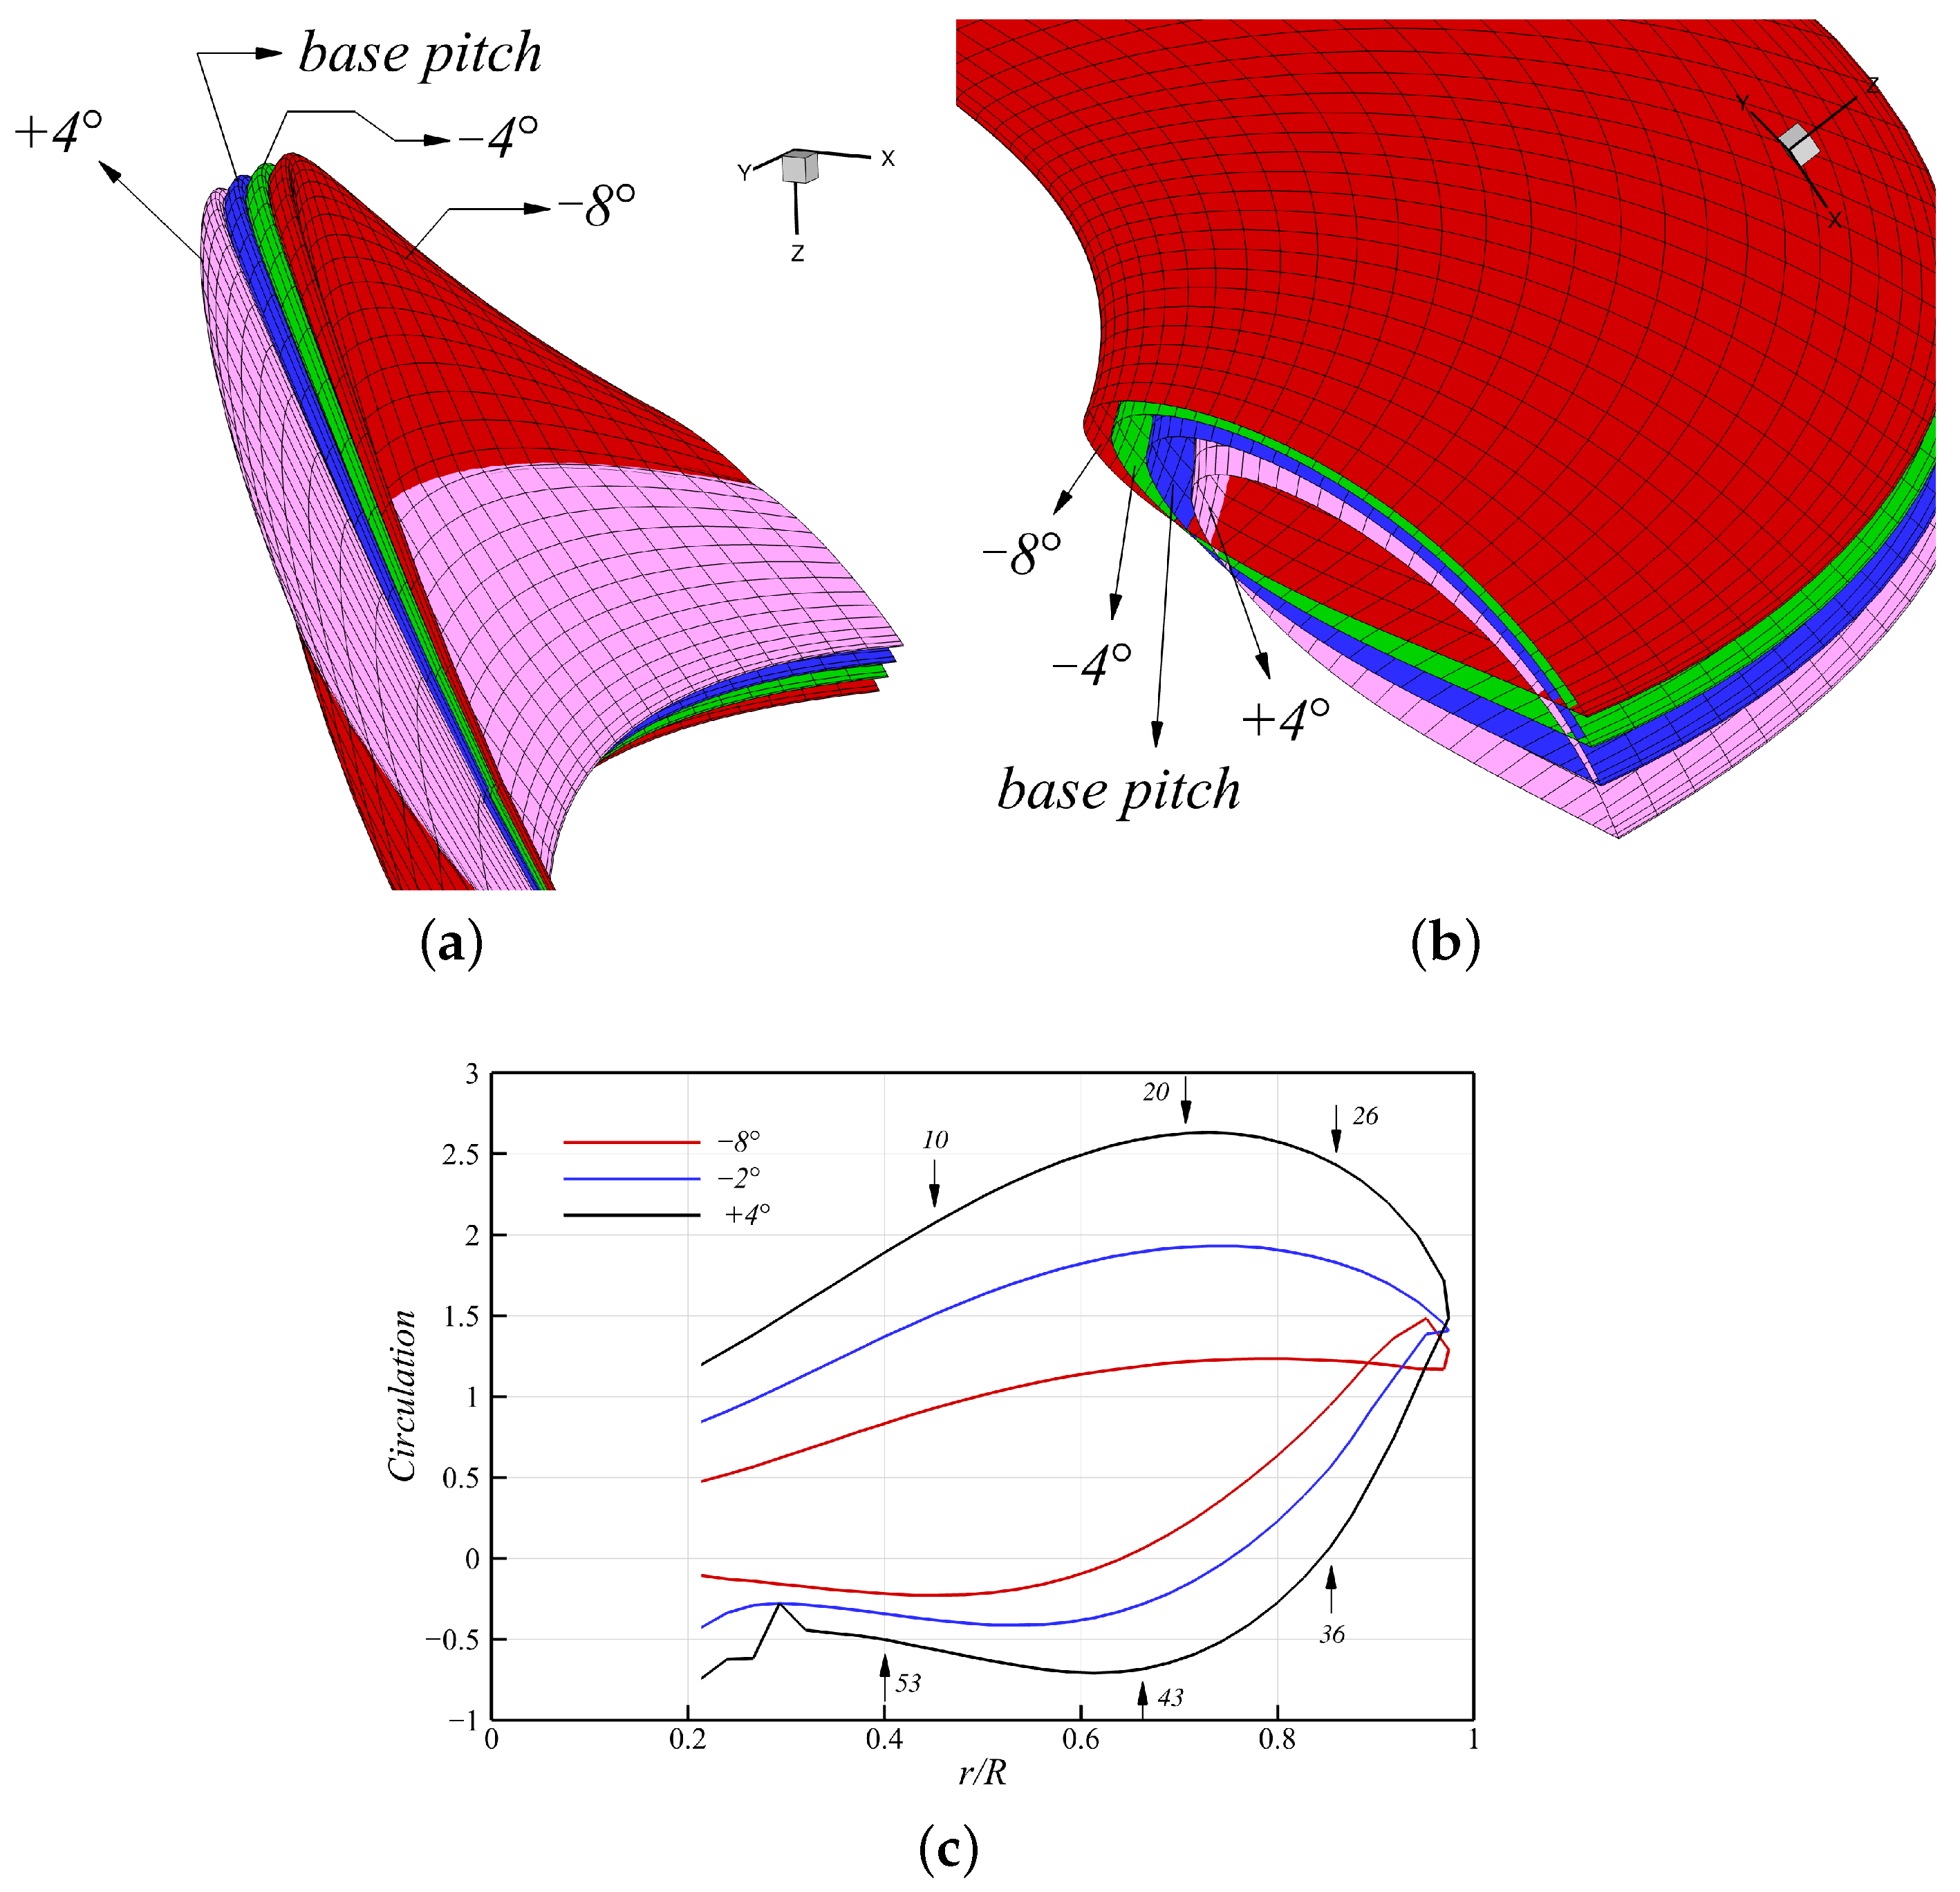
Figure 25a,b shows how the propeller geometry varied with four different pitch angles:
and
. The
case shows the base pitch, representing the geometry without any pitch adjustment across all radial positions.
Figure 25c shows the circulation distribution for pitch angles of
, and
at an advance ratio of
, presenting how pitch variation affects the loading distribution of the model propeller.
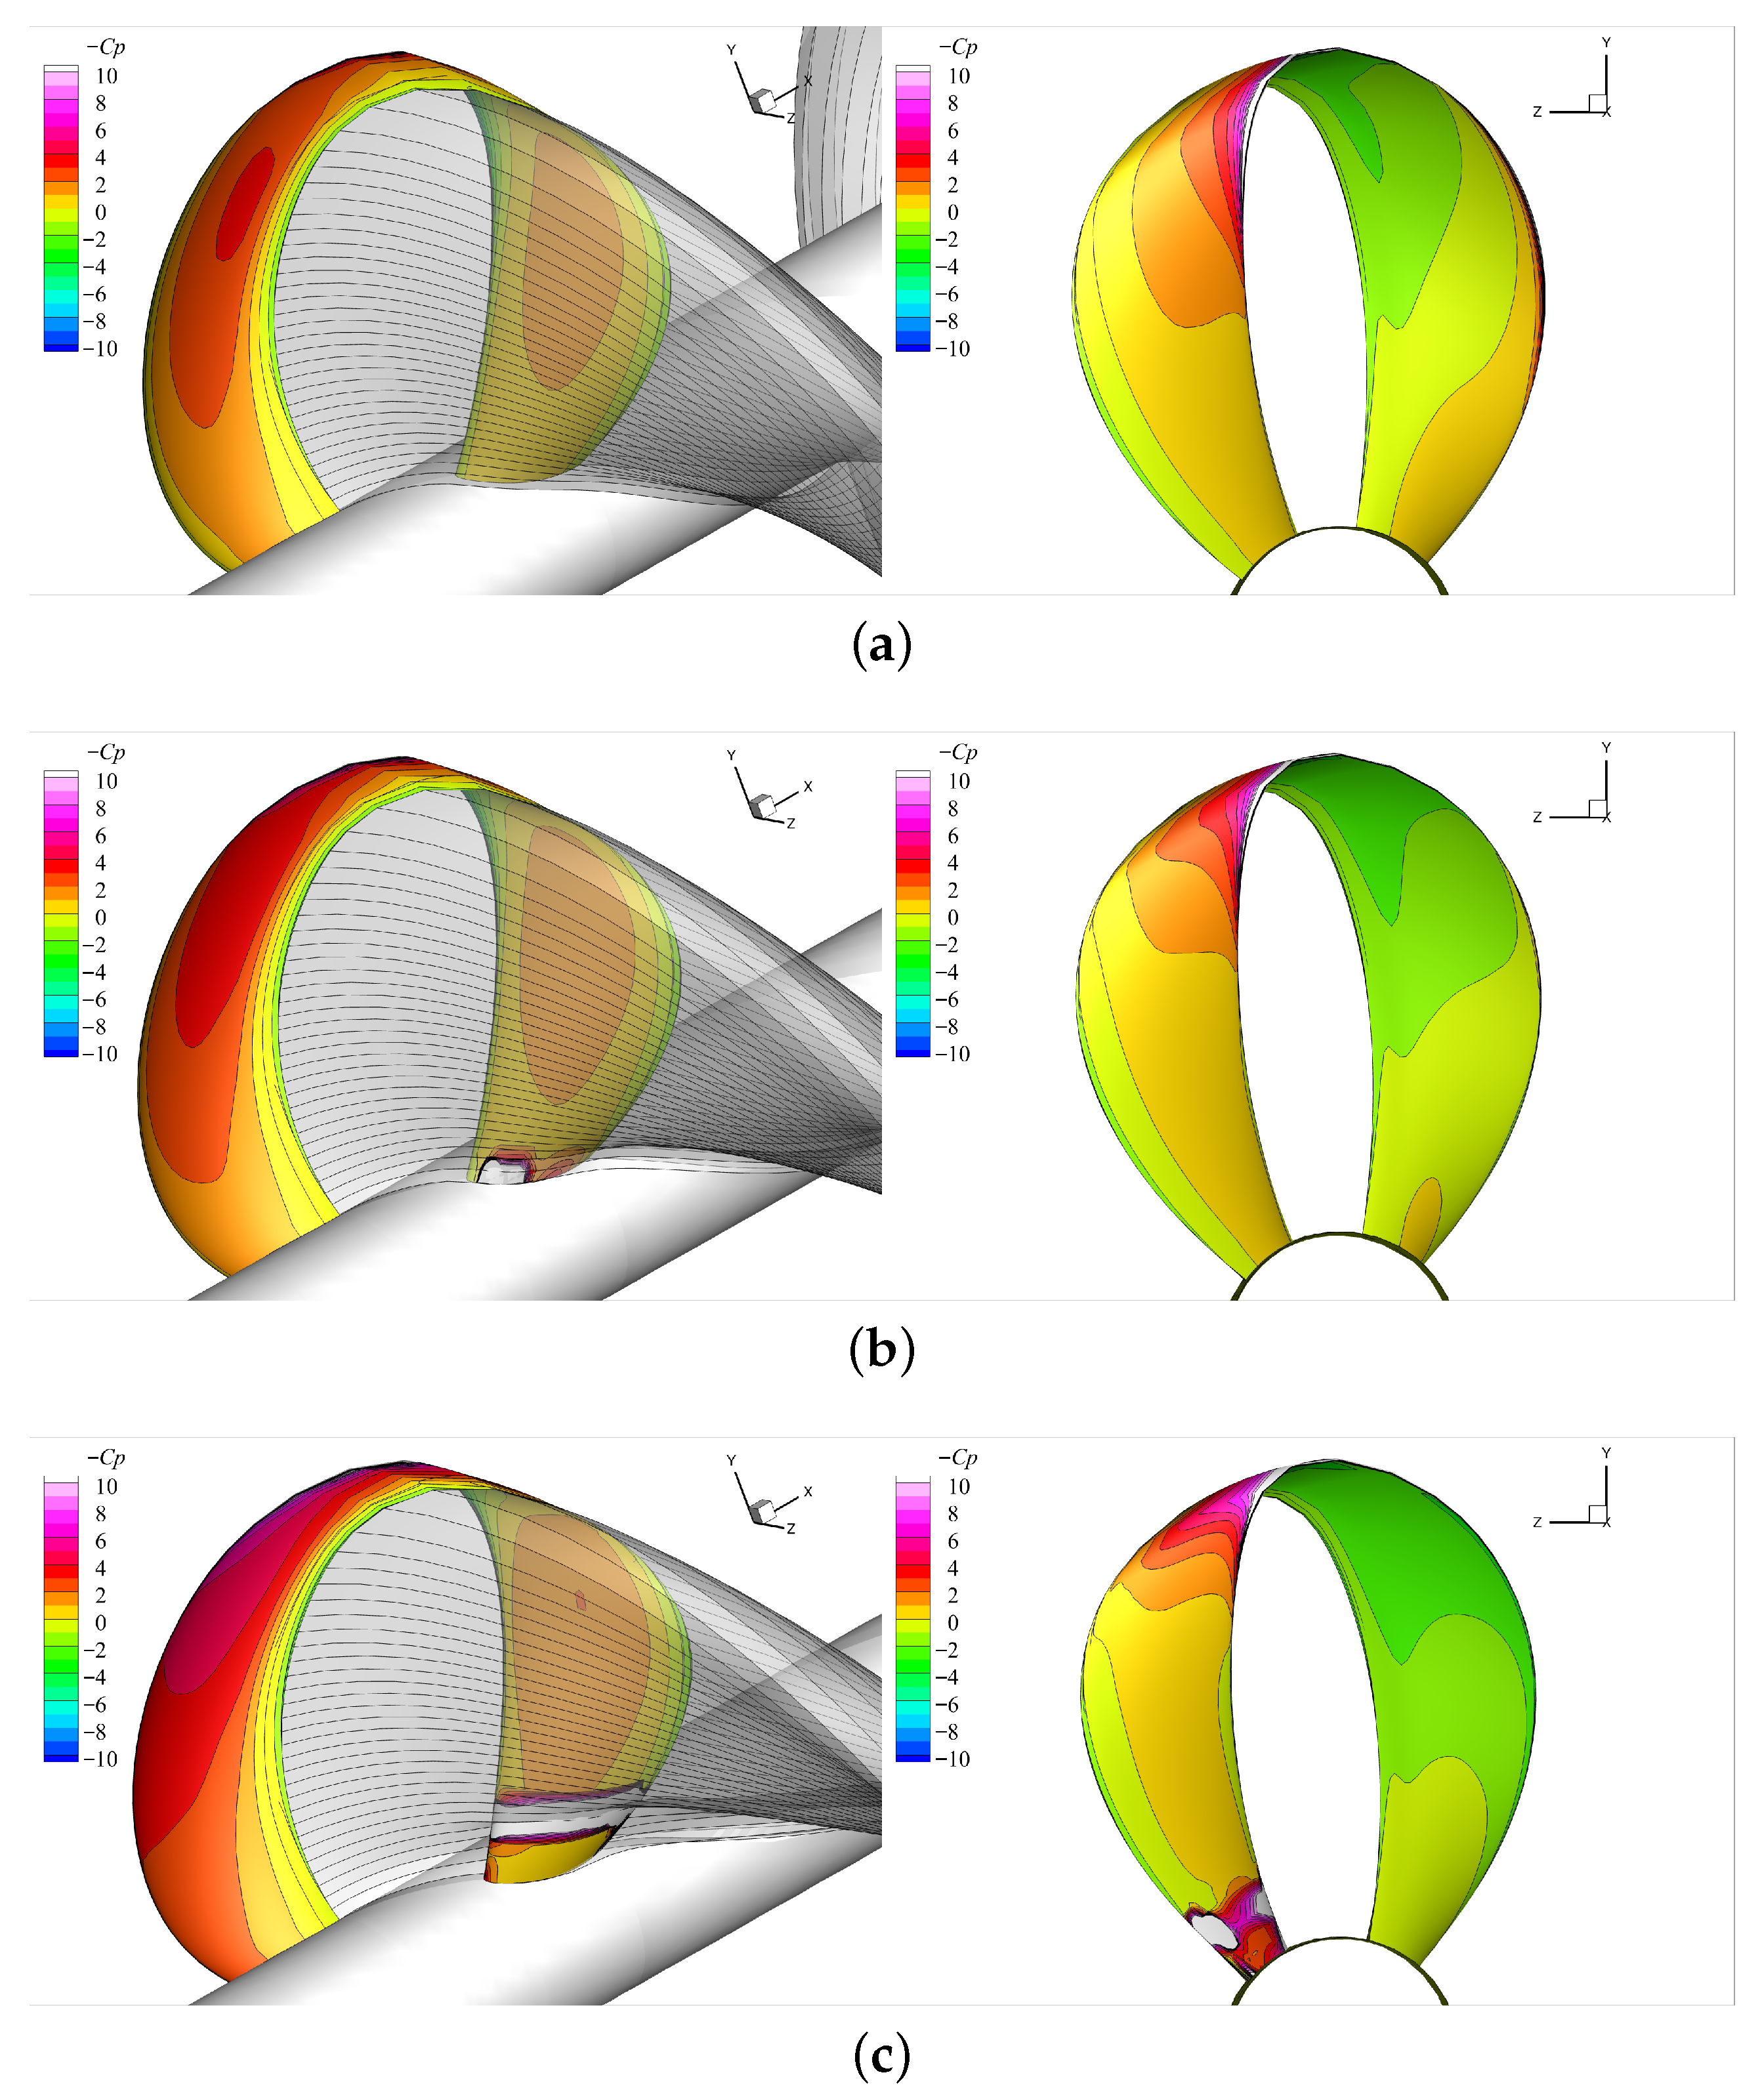
As shown in
Figure 26 and
Figure 27, the pressure difference between the suction and pressure sides of the blades increased with pitch, resulting in higher loading and thrust on the propeller. In the
pitch case, the loading approached nearly zero around the 36th station as this was the region where the negative thrust (directed downstream) of the rear blade turned positive. Consequently, the negative values in the circulation plot at
actually indicate a positive thrust that drove the propeller forward, which contrasted with the turbine blades, where negative circulation typically indicates axial forces directed downstream. It is because of the inverted sections with rotation angle
that enabled the rear blade to act as a lifting body, rather than as a turbine blade. As will be shown in the following results under different geometric configurations, pitch variation produced the most significant influence on the toroidal propeller loading, whereas the effects of other geometric parameters tested in the present study were comparatively minor.
As the blade pitch increased, the rear blade was gradually placed in the path of the shed wake from the front blade. This wake induced very low pressures as it passed near the rear blade surface, significantly increasing the risk of cavitation, even near the root sections. As noted earlier, the BEM-predicted wake occasionally tended to pass too close to the rear-blade surface, whereas the RANS results showed that viscous effects prevent direct contact between the wake and the blade. To address this gap numerically, one could introduce a numerical fence or a proximity constraint that prevents the wake panels from approaching unrealistically close to the blade surface, allowing the BEM predictions to remain physically consistent with the RANS results in the regions of intensive blade–wake interaction.
Figure 28 shows a comparison of the predicted forces from the proposed method with the RANS results [
6] across a range of pitch adjustments, from
to
, at two different advance ratios:
and
. The overall magnitudes and trends predicted by the proposed method showed promising agreement, although the torque tended to be slightly underpredicted compared to the RANS results. As shown in
Figure 27, increasing the pitch reduced the reversed pressure peaks at the leading edge, which likely helps to prevent flow separation on the face side of the blade and, thus, results in better agreement between the panel method and the viscous simulations.
Next, the present method was evaluated for various axial distances,
, 0.15, 0.20, 0.25, and
, at an advance ratio of
, as shown in
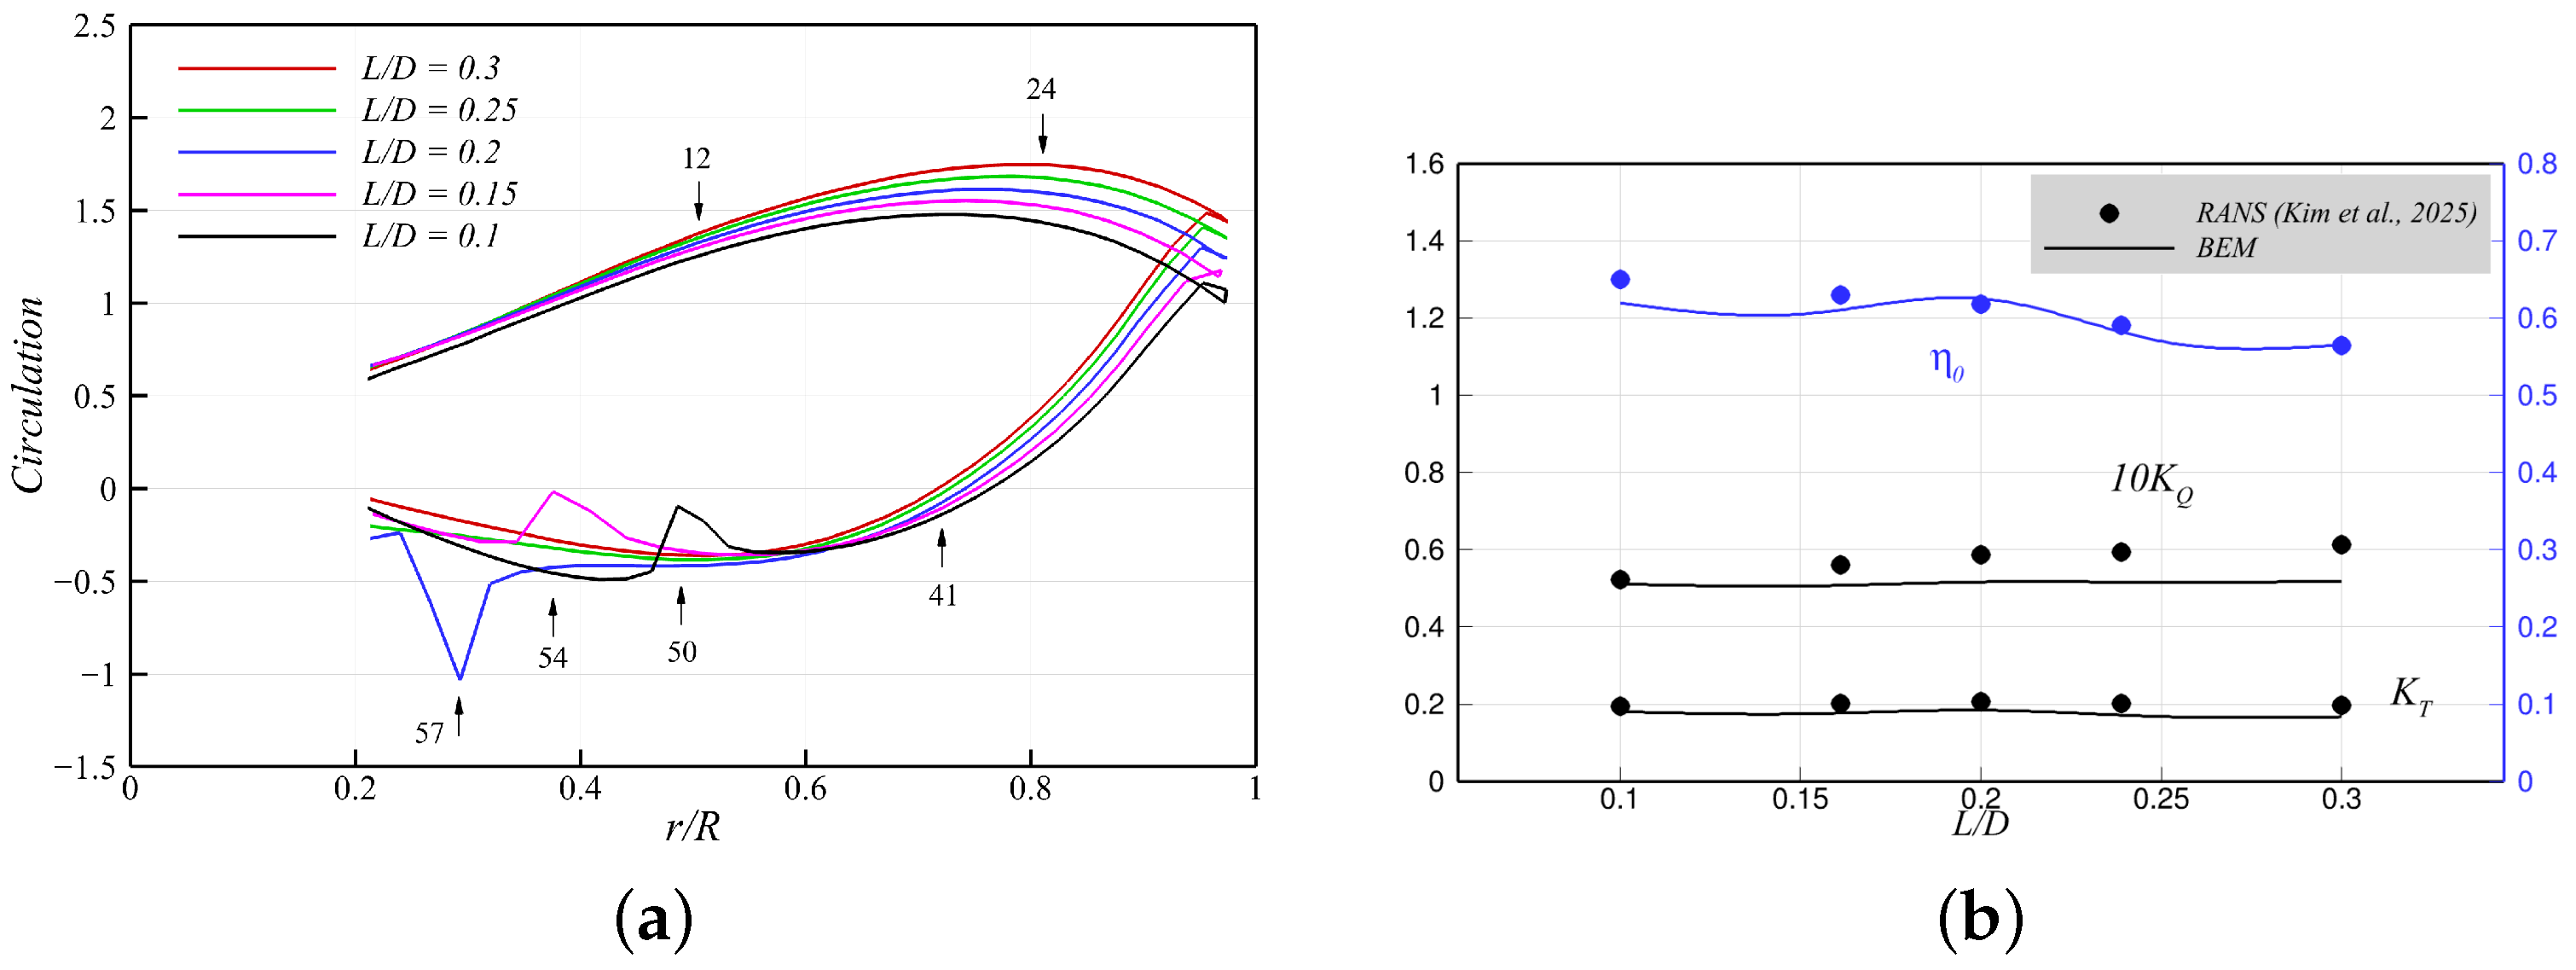
Figure 29. As the axial gap between the front and rear blades was reduced, the rear blade progressively entered the path of the shed wake. When
, the wake from the front blade began to impinge on the rear blade surface, lowering its local surface pressure. This pressure drop became more pronounced at smaller axial distances due to stronger blade–wake interactions as the wake impingement point shifted radially outward.
Low-pressure regions were shown on the pressure (face) side of the rear blade (
), which became smaller as the axial distance decreased, thereby reducing thrust cancellation. This trend can be further examined through the circulation distributions presented in
Figure 30a, which shows that the beak of the circulation curve progressively approached zero with shorter axial spacing. The abnormal peaks near the rear blade root resulted from the localized pressure variations caused by the interactions between the shed wake and the rear blade. When the fully aligned wake was positioned close to the blade surface, it lowered the local pressure, either on the suction or pressure side (depending on its location of contact). For instance, in the cases of
and
, the wake impinging on the pressure side of the rear blade (facing downstream) reduced the local pressure and, consequently, diminished the positive thrust in that region. In contrast, for
, the wake situated close to the suction side decreased the suction side pressure, thereby enhancing the thrust, as shown in the increased loading near
in
Figure 30a. This interaction led to a slight increase in both
and
at
, as observed in both the BEM and RANS predictions shown in
Figure 30b.
Lastly, the proposed method was evaluated for different lateral angles, i.e.,
and
, at an advance ratio of
, as shown in
Figure 31, where
corresponds to the baseline geometry. The cases where
and
represent the configurations where the lateral angle of the baseline geometry was uniformly reduced to 75% and 50% of its original value, respectively, along the entire span.
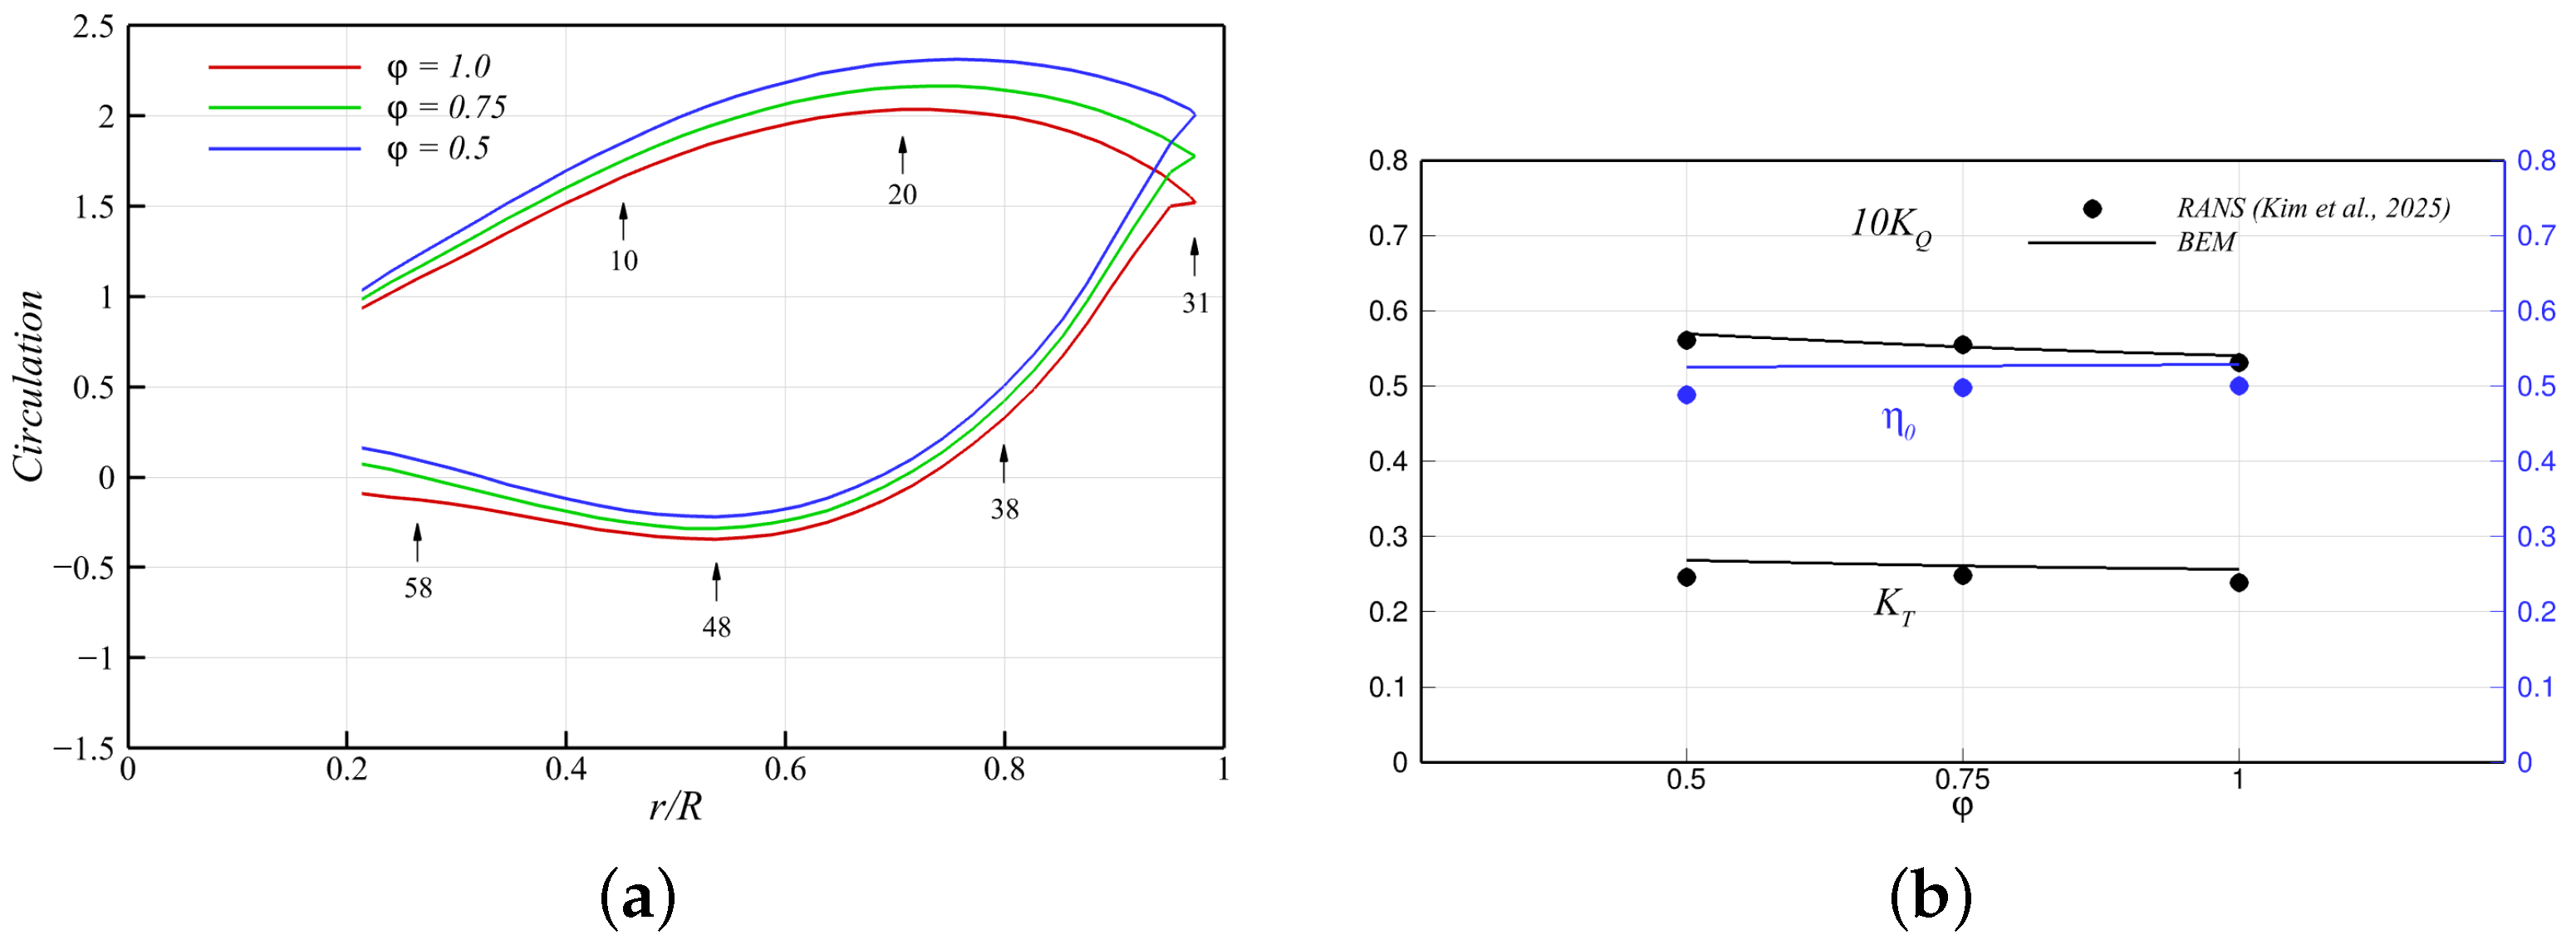
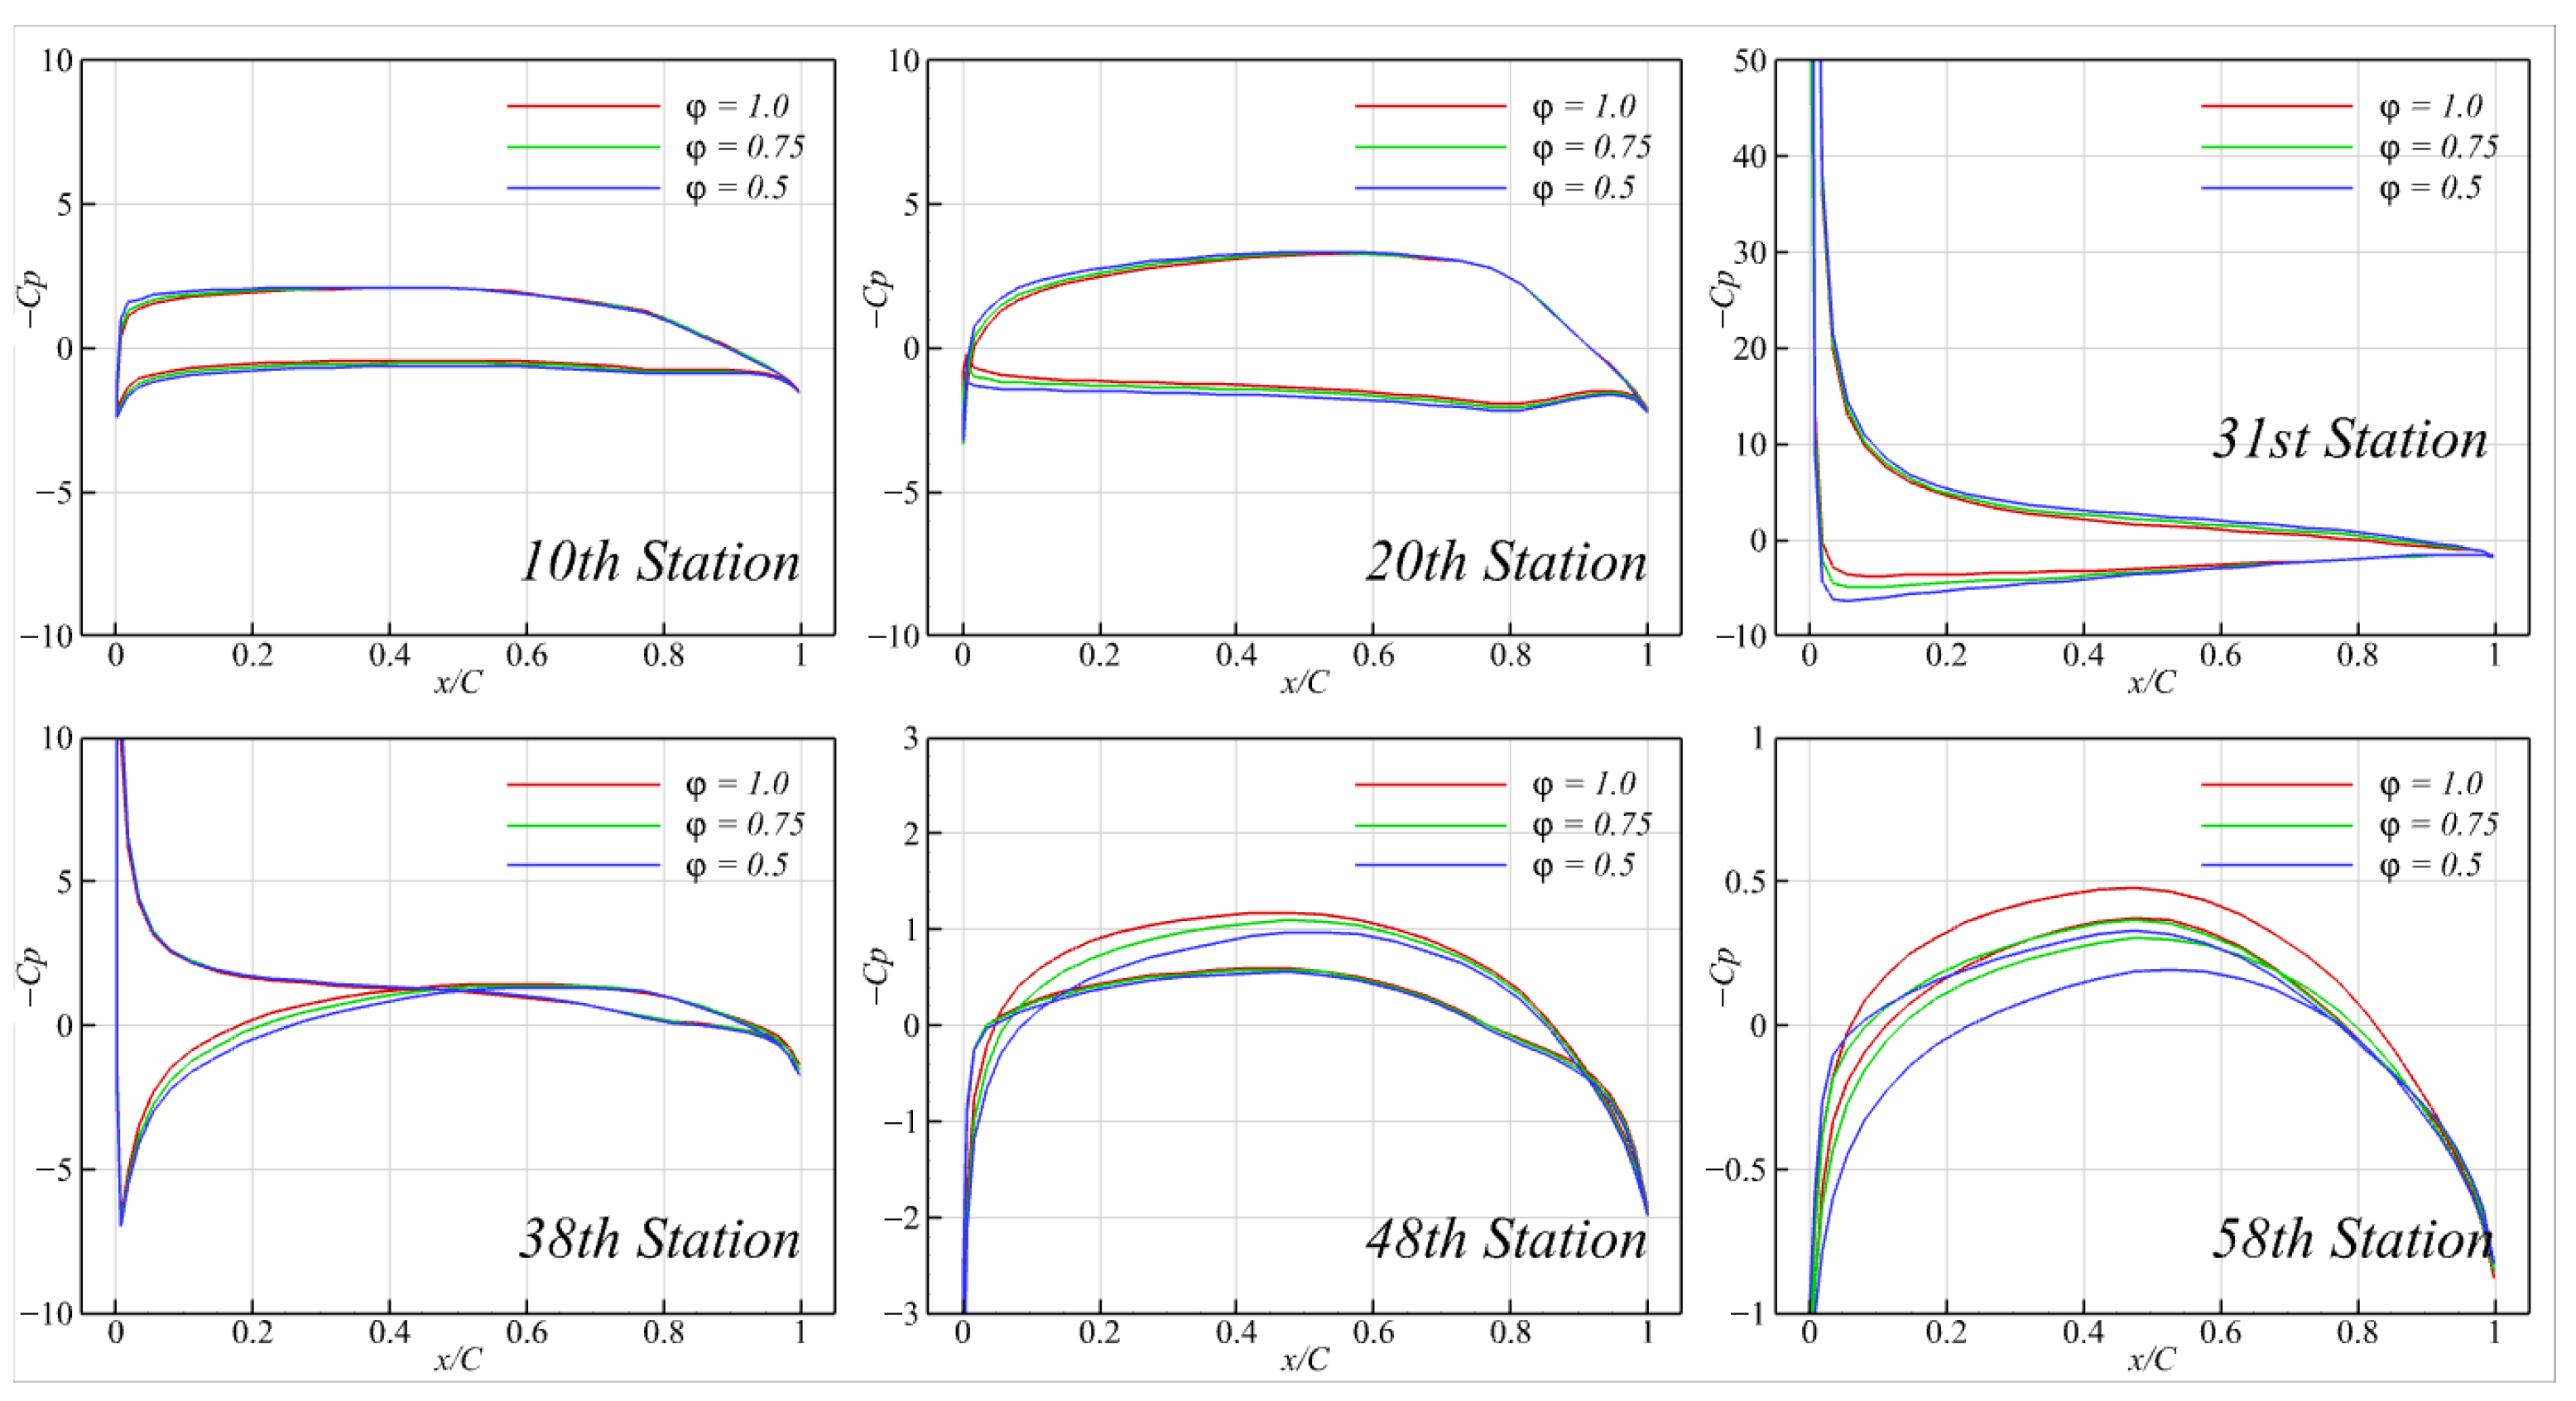
Figure 32 presents the circulation distributions and a comparison of the thrust and torque coefficients (
and
) between the proposed method and RANS. At this
, variations in the later angle
did not lead to significant changes in overall propeller loading. Specifically, as
decreased, the front blade experienced increased loading, but the rear blade simultaneously lost positive thrust, resulting in a net thrust cancellation. The beak of the circulation distribution also deviated further from zero as
decreased, without providing significant improvement in efficiency
(
Figure 32b). This trade-off should be carefully considered when using lateral angles as a key design parameter for toroidal propellers. The surface pressure distributions (
Figure 33) further suggest that the current geometries were highly prone to cavitation on both the face and back sides of the blades; due to the high torque and pressure peaks near the leading edge, the model propeller will likely experience supercavitation.
