Abstract
This work, conducted within the framework of the international network CRESTE (Coastal Resilience Using Satellites), examines the role of resilience in monitoring coastal evolution across diverse environments in Europe (France, The Netherlands), America (Mexico), Asia (China), and Oceania (Australia). High-resolution morphological datasets, derived from in situ measurements and video monitoring systems, were analyzed for wave- and tide-dominated beaches influenced by both climatic drivers and anthropogenic pressures. Findings indicate that beach resilience is strongly linked to system resistance, which depends on the intensity of climate drivers, including storm frequency, and site-specific conditions related to the type of sediment and its availability, and the presence of anthropogenic activities including coastal structures (e.g., Normandy, Yucatán) and shoreface nourishments (Netherlands). In Batemans Bay (Australia) and Hangzhou Bay (China), assessing the resilience is particularly challenging due to the combined influence of multiple drivers, fluvial inputs, and urban development. Accurate monitoring of coastal resilience across timescales requires accounting for long-term morphological, ecological, and socio-economic processes. This can be enhanced through satellite observations, which, when integrated with in situ measurements, numerical modeling, and artificial intelligence, support a more comprehensive assessment of resilience and refine projections under future climate change and sea-level rise; representing a key focus for further works.
1. Introduction
Coastal environments face multiple, interacting, and cumulative stresses including those resulting from increasing climate change (e.g., sea level rise, ocean warming, extreme events) and coastal urbanization [1]. Sea level rise and (more frequent and severe) extreme weather events will likely exacerbate coastal erosion and flooding [2].
The connections between natural coastal environments–controlled by climate conditions and anthropogenic systems–driven by human actions are often implicit when addressing coastal issues (e.g., [3,4]) related to the multi-timescale evolution including hazardous scenarios. However, these interactions significantly alter the coastal environment, which subsequently needs to be considered as a coupled human-natural system, the functioning of which differs markedly from its original natural behavior [5].
The complex interactions of natural and anthropogenic coastal perturbations contribute to the increased vulnerability of the coastline, which depends on its exposure, sensitivity and adaptive capacity to recover and reduce the impacts of coastal hazards. Furthermore, certain studies (e.g., [6,7]) have considered the mutual interactions between the physical (natural and human induced) and the socio-economic beach components to assess coastal vulnerability, which is crucial to achieve efficient coastal management and create adequate adaptation policies for sustainability [8]. The vulnerability of coasts is geographically dependent on the spatial distribution of hazards, risks and exposure involving the physical drivers and the internal characteristics of coastal systems. Therefore, a mutual framework would therefore be beneficial for comparing coastal sites, irrespective of their geographical setting or physical characteristics.
From an engineering point of view, the stability of the system depends on its dynamic properties, as described by its resistance. The degree of resistance of a coast to a natural and/or anthropogenic disturbance demonstrates its ability to absorb this disturbance with minimal internal changes. This introduces the convoluted concept of resilience, widely viewed as an important attribute of coastal systems [9,10,11,12] and reviews the validity of assumptions regarding stability and equilibrium in hydrodynamic geomorphic and ecological systems [12,13], and their shift from natural to human systems [14]. The concept of resilience, highly important in the context of achieving sustainability [15], has been used for a wide range of scientific fields with different objectives over a broad conceptual framework [13]. There is increasing interest in research regarding the ecological [16,17], engineering [18], and geomorphological resilience of barrier islands [19]. The first two types of resilience have been gaining ground over the more rigid views of the third type [13], which has been the focus of several recent studies (e.g., [8]).
Assessing the resilience of the coastline and the evolution of its trajectory over time, for different coastal systems facing various physical drivers and human interventions, could be an effective way to develop a comparative analysis between the sensibility of the natural resilience to the internal and the external characteristics of the coast. For this, innovative approaches are needed to deal with diverse datasets of coastal monitoring from natural observations and/or numerical models, which span multiple disciplines and link physical changes to ecological and biological conditions [20].
In the framework of the International Space Science Institute (ISSI) program, a new action has been devoted to investigate the contribution of remote sensing techniques to assess coastal resilience by gathering a multi-disciplinary international team of researchers from different countries (France, Netherlands, Mexico, Australia, China). This action, entitled ‘Coastal Resilience using Satellites: CRESTE’, was introduced in this work to review how key morphological features (such as shoreline changes in sandy, gravel, muddy beaches, submerged sandbar positions, tidal flats) across diverse coastal systems worldwide respond to climate-driven and anthropogenic pressures, and to trace the pathways of their resilience over time. The development of these insights is essential for emphasizing the pivotal role of spatial approaches in addressing the complex drivers of coastal dynamics, which form the foundation of resilience assessment in diverse coastal contexts where the multiscale monitoring is enhanced through the use of satellite dataset.
2. Pathways to Coastal Resiliency Assessment: An Overview
The concept of resilience originally referred to the resistance of the system in order to maintain relationships within its operational functions. It measures the system’s ability to absorb environmental changes with its internal dynamics intact (e.g., [12,21]). Resistance is generally considered as the main intrinsic component of resilience. In other words, a system is resilient when it is able to recover and reach the state preceding a disturbance or to reorganize into a new state if this disturbance exceeds a critical threshold.
According to Masselink and Lazarus [12], coastal resilience incorporates a variety of physical, social, and socioeconomic dimensions, being in an implicit and explicit connection with vulnerability, sensitivity, susceptibility, persistence, equilibrium, stability, thresholds, tipping points, regime shifts, recovery, adaptive capacity and sustainability [22]. Figure 1 illustrates the trade-off between resistance and resilience in coastal systems, showing typical responses to environmental change as a function of system state (vulnerability) and potential energy (forcing). Each response reflects distinct resistance and resilience characteristics. Indeed, the coupled resistance-resilience varies depending on the state of the coastal system and the energy applied to this system which is not locked to a steady stable state. Its behavior is stochastic around a stable state, even with negligible changes in external environmental conditions [21].
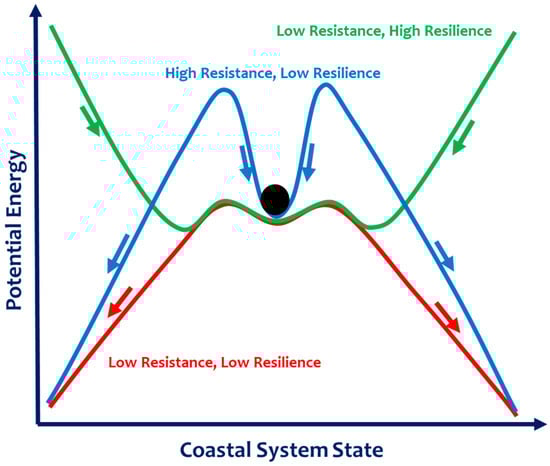
Figure 1.
The trade-off between the resistance and the resilience of coastal systems depending on its potential energy (extracted from [23] https://www.coastalwiki.org/wiki/Resilience_and_resistance#cite_note-16 (15 July 2025); and modified by authors). The X-axis represents the system state (vulnerability), while the Y-axis represents the potential energy (forcing). The black circle represents the system’s current state, illustrating the balance between external forces and internal resilience, while the arrows indicate the restoring or destabilizing forces that govern transitions between alternative stable states.
There are multiple approaches for assessing coastal resilience depending on the type of coastal system and the presence of anthropogenic activities. The measurement of resilience variables in real-world situations remains challenging, and varies across disciplines.
The resilience of a system infers its ability to persist during a disturbance [24] and its adaptive capacity to reorganize in face of this disturbance while maintaining key structures and processes [25] to reach its stable domain. This concept introduces the ecological resilience which could be produced when the magnitude of the disturbance can be rapidly absorbed before a system shifts to another state [10]. Contrary to the ‘engineering resilience’ (sometimes, also called recovery), it is defined by the rate with which a system returns to a reference state after a disturbance [26]. In this case, the stable domain (and functions) needs to be restored to the same position [16,24,25].
Recently, Murshed et al. [27] defined coastal resilience as ‘embracing a wide range of resilience concepts ranging from resistance to retrieval to conversion’ and ‘conceptualized resilience as an integrated function of stability, recoverability, and transformability’. Considering these versions of various definitions in the literature, a coherent concept combining physical/natural, ecological, and engineering resilience is required for assessing the overall resilience of coastal systems and their durability.
At present, there is no single number or standardized approach to measure coastal resilience. Standardized resilience indicators are required to identify where pressures and threats to resilience exist, and where deviations from resilience occur. Such indicators would provide a useful starting point to coordinate international efforts, and to focus participatory research with local communities and authorities to build resilience. An international framework to clarify and standardize the practice of coastal resilience is strongly required to put the different indicators into practice [28].
This international research work aims to provide insights into coastal resilience through the analysis of different study cases controlled by natural climate drivers and anthropogenic perturbations. We present each study case by exploring the previous work developed regarding coastal evolution to address the concept of resilience for natural and anthropogenic applications and its trajectory over time.
2.1. Assessment of Coastal Resilience in Natural Systems
According to Townend et al. [8], resilience is widely viewed as an important attribute of natural systems [10,29,30], including those on the coast [9,11]. In natural systems, the concept of resilience is generally used to capture the response of coastal systems to the combined effects of their geomorphological characteristics and climate drivers, including severe storms and rising sea levels in a changing climate, leading to their gradual and more pervasive disturbance. The system is able to naturally resist this disturbance and dissipate the induced chronic stresses in order to achieve successful functioning through time. This situation argues for the first type of resilience.
‘Natural Coastal Resilience’ is largely observed on barrier islands and beaches where changes in their planforms and profiles reflect the dissipation of physical energy for maintaining their forms and sustaining their morphology over time [12]. For example, natural systems could enhance their inherent resilience when they maintain the integrity of their morphological components with an internal change in sediment composition [31]. Subsequently, the oscillating behavior of the beach response from accretion to erosion at seasonal, interannual and decadal scales defines different morphological regimes, exhibiting a form of resilience between two successive regimes.
Natural coastal resilience is strongly controlled by the vulnerability of the system, which is progressively impacted by the degradation of its geometric characteristics and rapid sea level rise, as well as a sudden increase in the magnitude and frequency of storms [32].
Regarding coastal dunes, these are sensitive to the effects of sediment transport and the presence of vegetation that serves to resist storm-driven erosion and enhance sediment deposition. The density of vegetation exerts an influence on external variability by shaping topographic recovery and reinforcing the dune’s adaptation to coastal hazards. It has been demonstrated that more than 30% of vegetated dunes are highly resilient to erosion from marine storms [33,34,35], which enhances their flood-defense capacity [36] and the retention of sediment, which acts as a reservoir of sand during high energy storms, increasing the resilience of the shoreline to storm wave erosion [32]. The dune’s resistance is commonly based on the relative elevation of extreme water levels and the dune’s morphological features [37]. A coastal resilience index, based on the beach and dune resistance, was introduced by [38].
Similarly, the complex feedback between vegetation and sedimentation plays an important role in sustaining tidal wetlands where the resilience is highly influenced by the sediment supply [12,39] while the direct effect of individual energetic storms plays a less important role in the system resilience [40].
Therefore, coastal systems face multiple interacting climate pressures that cause negative impacts as their degradation (erosion) increases their vulnerability. The morphological factors of coasts and their characteristics (sediment texture, presence of vegetation) affect their vulnerability and could change their resistance to climate pressures and their resilience trajectory.
2.2. Assessment of Coastal Resilience in Human-Controlled Systems
Here, the concept of resilience is related to the effect of anthropogenic disturbance in a natural coastal system where the morphological changes are controlled by the engineering components. Coastal resilience in human environmental systems incorporates the protective actions, traditionally supported by coastal engineering approaches to erosion and flood risk management [41], as well as more dynamic adaptive responses to dissipate the effects of hazards [42,43,44].
According to Grafton et al. [45], coastal resilience is defined as comprising resistance, recovery and robustness of complex systems controlled by human actions. This could be defined as the human-affected ability of these systems to adjust their response to recovery when perturbed by one or more adverse events. The resistance and robustness of these systems are underpinned by anthropogenic activities (coastal structures, beach nourishment); they can affect the time taken to recover a given functional state once perturbed and the probability of a change in state (or crossing of a threshold) after high energy periods. This may occur if a system lacks sufficient resilience.
The management of developed coastal areas engages in a general model of engineering resilience, exhibiting the long-term maintenance of a single, stable equilibrium state of the system. The proposed management actions could impose a subjective preference for single-state stability onto an inherently multi-state system, driving the dynamics of ecological resilience to conform to those of engineering resilience [8].
Masselink and Lazarus [12] have stated that resilience in coastal human-environmental systems requires a balance between the natural and the anthropogenic as well as the socio-economic components. This last component promotes the construction of coastal protection structures, which could change the intrinsic natural environmental evolution and the resilience trajectory. Therefore, it is crucial to consider all the above components in order to enhance coastal resilience. For instance, the resilience of highly urbanized coastal systems in southeast Mexico has been investigated by Mendoza et al. [46] using remote sensing techniques based on aerial photogrammetry. These authors have demonstrated the key role of anthropogenic activities in determining the resilience trajectory beyond natural perturbations.
3. Monitoring Morphological Evolution of Coasts Towards Resilience Assessment
This section presents the trajectories of key morphological parameters at different coastal environments exposed to high energy drivers, including storm events and anthropogenic disturbances in order to track their recovery and investigate their resilience in the light of the conceptual models previously used (e.g., [12]). Figure 2 presents the location map of the overall CRESTE sites: wave- and tide- dominated beaches in Yucatan (Gulf of Mexico, Mexico), Normandy (South English Channel, France) and North-Holland (North Sea, The Netherlands); and river dominated systems where the fluvial activity is significant; case of Cullendula beach connected to Batemans bay (Australia) and the tidal flat of Hangzhou bay (China). The wave rose of each site is also illustrated. The wave data were obtained from the global ERA 5 reanalysis database, produced by the European Centre for Medium-Range Weather Forecasts (https://www.ecmwf.int/en/forecasts/datasets/reanalysis-datasets/era-interim accessed on 15 July 2025). This dataset has been widely used and validated in the previous studies of Dee et al. [47] and Hersbach et al. [48].

Figure 2.
Geographical map showing all studied sites: Sisal, Yucatan (Gulf of Mexico, Mexico), Étretat, Normandy (South English Channel, France), Egmond aan Zee, North-Holland (North Sea, Netherlands), Batemans Bay-Cullendula Beach (Australia) and Hangzhou Bay (China). The wave rose for each site was generated using ERA5 reanalysis data from the grid point nearest to the respective location.
This section presents a comprehensive analysis for each site, describing the geographical location and morphological characteristics, physical drivers, natural and anthropogenic disturbances, the geomorphological evolution, and the resilient behavior. The implications while employing morphological datasets with different spatial and temporal resolutions are also discussed.
3.1. Yucatan Study Case in Gulf of Mexico: Sandy Coast
3.1.1. Geographical Location and Morphological Characteristics
Sisal is located on a barrier island in the northern Yucatan peninsula facing the Gulf of Mexico (Figure 3a). Sisal was the main port of the Yucatan peninsula until the 1850s, serving as the exportation port of henequen fiber (known worldwide as Sisal). However, in the early 1900s the Port of Progreso became more important due to its better connectivity with the capital city, Merida (Figure 3). Hence, fisheries became the main activity in Sisal and the fleet grew due to the shelter provided by the construction of the Sisal Harbor [49]. More recently, ecotourism has grown exponentially for bird watching, recreational fishing, and sun and beach tourism. This has diversified the economic activities in the community while the pressure on the ecosystem has increased.

Figure 3.
(a) Location of Sisal with respect to the Gulf of Mexico. (b) Main natural and anthropogenic disturbances of the shoreline. (c) Beach monitoring program cross-shore transects (P1–P40, blue lines).
The study area is characterized by a low-land elevation (<3 m) and a karstic geology. Thus, freshwater inputs occur via groundwater discharges emanating through springs in coastal areas. The sediment is mainly composed of carbonate sand of biogenic origin produced on the carbonated continental shelf [50], which is transported onshore by waves and currents [51]. The shoreline orientation is approximately West-East. The barrier island varies in width and bridges with the mangrove at certain locations. At these locations the communication is mainly seasonal, however it has persisted for decades in a nearby (~10 km) coastal lagoon called La Carbonera (see Figure 3b).
3.1.2. Physical Drivers and Natural Disturbances in the Region
Low-energy waves (Hs < 1 m) and a micro-tidal regime (water level < 1 m) characterize this region during moderate conditions. Waves are mainly associated with sea-breeze winds interacting with the trade winds. Hence, short-period waves with a high-incidence angle from the NE are ubiquitous in this region. The tides are diurnal with a 0.75 m spring tidal range.
Storms are mainly associated with cold-front passages (fall-winter), tropical storms (summer), and local storms (spring-summer). The sea level is increasing at a rate of approximately 3 mm/year [52]. From the shoreline morphology perspective, the presence of La Carbonera coastal lagoon affects the littoral transport at the east end of the study area. Hurricane Gilbert caused a breach in the barrier island in 1988, connecting the ocean with the wetlands at this location, which remains today. A sand spit has been growing at the mouth of the lagoon over the past decades altering the littoral transport of downdrift beaches due to sediment retention. Moreover, the presence of sand waves can also induce large beach accretion (erosion) as they propagate along the coast (Figure 3b).
3.1.3. Anthropogenic Disturbances
The construction of the harbor jetties in the late 1980s and the permeable Sisal Pier interact with coastal processes. The east and west jetties have an extension of ~300 m and ~200 m, respectively, whereas the pier extends approximately 160 m at 1.8 m above the mean sea level. More recently, mitigation measures such as sand bypassing, submerged breakwaters (ReefBalls), and groins (geotubes) have been implemented on the western (downdrift) side of the Sisal port (Figure 3c).
3.1.4. Morphological Response to Physical and Anthropogenic Disturbances
The disturbances in the study area can occur as either shocks (transient disturbance) or stresses (permanent disturbance) inducing shoreline perturbations. However, disturbances can also occur in the medium term when they are related to large-scale morphological features (i.e., sand spits and sand waves). Wave conditions and water levels control sediment transport and beach response, whereas morphological features and coastal infrastructure induce littoral transport gradients. Short-term storms can induce either positive or negative effects on the beach morphology [53]. The subaerial beach volume and elevation can increase due to sediment deposition via wave overtopping on the beach berm. Such positive effects have been observed at beach transects with a bar-beach-dune system, hence locations with a beach scarp are further eroded during storms.
The shoreline dynamics are dominated by the alongshore sediment transport gradients due to the presence of port infrastructure (jetties) interrupting the littoral transport. Therefore, beach accretion (erosion) occurs on the eastern (western) sides at maximum rates of +(−) 6 m/y owing to the westward alongshore sediment transport in this region [54]. Thus, the coastal landscape has been drastically transformed due to the presence of the harbor with marked differences on the updrift and downdrift sides (Figure 3b). Beach profiles were undertaken along 40 cross-shore transects (P01–P40 in Figure 3c), extending from the foredune to the inner sandbar, using a Differential Global Positioning System (DGPS) in Real Time Kinematics (RTK). A reference station is located near the meteorological station mast (Figure 3b), whereas the rover is carried out in a backpack measuring with a sampling frequency of 1 Hz. The beach surveys have been conducted every other week since 2015 and 2019 at the East and West Sisal beach, respectively. The East Sisal beach presents a wide beach (Figure 4b) with a foredune field. On the other hand, the downdrift (West) beach presents a beach scarp due to the large recession rates (Figure 4a) becoming more vulnerable to storm events. Therefore, shoreline erosion is present in most of the transects on the downdrift side (Figure 4a). Mitigation measures such as sand bypassing (P21–P23, December 2020 to May 2021) and ReefBall breakwaters (P27–P32, May 2019–January 2020) have only had a temporary effect on the erosion problem.

Figure 4.
(a) Spatial- and temporal-evolution of the shoreline position change on the (a) West and (b) East of the harbor which is located between P20 and P21. (c) (Eco)system (shoreline position) response at a transect updrift (East Sisal Beach) and downdrift (West Sisal Beach) from the harbor. Transects’ locations are depicted as dashed lines in (a,b). The gray bar represents the stress or permanent disturbance (port jetties) that induce the shoreline position change.
The time series of shoreline position changes can be analyzed at selected alongshore locations (Figure 4c). The shoreline position at P16, located East of the harbor, presents seasonal changes due to variations in wave conditions. However, a clear positive trend is observed that can be ascribed to the sediment impoundment by the harbor (green solid line in Figure 4c). Transect P25, located downdrift of the harbor, presents oscillations with a net shoreline recession (red solid line in Figure 4c). The erosion trend reduces in 2022 due to the sand bypassing at neighbor transects (P21 and P22 in Figure 4a).
Similar erosion patterns are reported in the La Carbonera coastal lagoon due to the growth of a sand spit (see La Carbonera in Figure 3b). Also, sand waves are present in the study area and are responsible for alternating erosive-accreting patterns at pristine locations (e.g., Punta Piedra in Figure 3b). The shoreline dynamics in these areas could be addressed by means of remote sensing data which would allow us to study larger portions of the coast. Satellite data can be calibrated and validated by means of in situ measurements at Sisal.
3.2. Normandy Study Case in NW English Channel: Gravel Coast
3.2.1. Geographical Location and Morphological Characteristics
The Normandy coast, located in the South of the English Channel, extends on both sides of the Seine Bay. This work focuses on two neighboring beaches nestled along the Normandy Coast (Figure 5): (1) Etretat, and (2) Hautot-sur-mer. They are considered highly touristic sites and have diversified the economic activities in the community while the pressure on the ecosystem has increased. The two beaches are located close to each other (64 Km) and therefore are faced with similar wave and tide conditions. However, they differ in spatial organization and granulometric characteristics. Etretat sediment consists of a continuous layer of pebble that acts as an armor to the sand underneath, it is an embayed beach with a N42° E orientation and Hautot-sur-Mer is a composite sand and gravel beach located on a semi-open coast with a N70° E orientation.
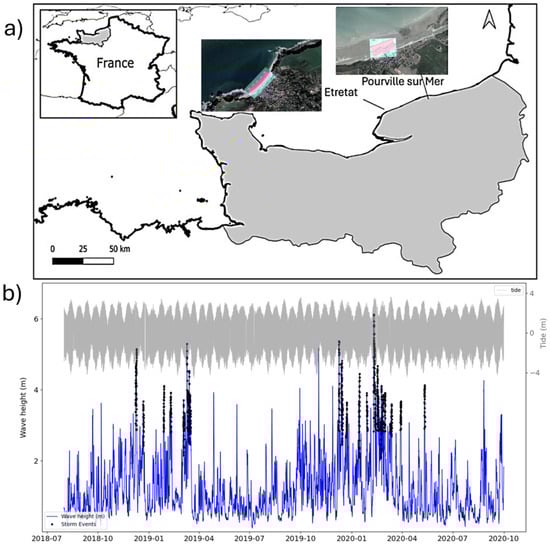
Figure 5.
(a) Location of the Normandy coasts and overview of Etretat and Hautot-sur Mer beaches (the orthogonal profiles are also illustrated); (b) significant wave height (in blue), black dots denote identified storms and tide level time series (in grey).
This coast, is considered as a pocket beach, framed by bedrock structures of indurated limestone, with a length of 1000 m; it is composed of pebbles (measured D50 = 60 mm) forming a steep slope (>12%) and resting on a subtidal sandy substrate (measured D50 = 0.8 mm). The beach is surrounded by chalk cliffs, and crossed by 4 groins resting on a seawall. At low tides, the pebble barrier emerges over a cross-shore distance of 150 m. The sandy fraction occasionally appears on the beach face following intense successive storm conditions, which result in a temporary transition from a pure gravel beach to a sandy-dominated system. At both sides of the embayment, the intertidal zone is covered by an emerging bedrock at low tide.
Hautot-sur-Mer is a composite sand and gravel system [55] with a pebble beach (measured D50 = 75 mm) forming a steep slope (>10%) and resting on a sandy substrate (measured D50 = 0.18 mm), which emerges at low tide [56]. The gentle slope of the sandy substrate (1.3%) allows the water to retreat over 210 m during the lowest tides, exposing the ridge and runnel. The beach is subdivided into several small sections pocketed by nine groins resting on a seawall.
Both beaches are monitored by a video monitoring system of three cameras, capturing 10-min time-exposure images every hour during daylight hours. The image resolution at Etretat is 8.3 Mp, whereas at Hautot-sur-Mer it is 2.3 Mp. Shorelines were extracted from these images using the Mask R-CNN method at various time intervals and subsequently aligned with the corresponding sea levels. This AI-based approach, developed by [56], processes images acquired at these sites to automatically segment visible water bodies and extract the waterline. The method has also been applied to derive digital elevation models (DEMs) of the intertidal zone. These DEMs were validated against field data obtained from synchronous GPS surveys, as described in Soloy et al. [56,57].
3.2.2. Physical Drivers and Natural Disturbances
The Normandy coasts are characterized by a large macrotidal range, averaging 9.5 m at spring tide. Environments with tidal amplitudes greater than 8 m are classified as mega tidal systems, which reflects the significant hydrodynamics associated with such extreme daily variations in the sea surface elevation. Average sea state conditions are characterized by waves from the west and northeast, with heights of approximately 1 m and periods of 5–7 s. Seasonal variations manifest high energy during winter (October through March) and low energy during the rest of the year.
According to Lopez Solano et al. [58], dominant waves, originating in the Atlantic Ocean, indicate the presence of sea and swell waves. This behavior is consistent from deep water to shallow areas, with a reduction in average wave height (Hs) of around 50% and 25% in energy dissipation, respectively, from the Atlantic to the English Channel due to changes in water depth [59]. During storms, changes in wave direction occur, with an average clockwise variation of 18° at the peak of the storm, shifting from the sectors W-WNW to sectors WNW-NW. These changes are predominantly influenced by bathymetry variation and bottom friction, leading to wave refraction and energy dissipation processes [59].
The rate of sea level rise in the Normandy region is consistent with broader trends observed along the Atlantic coast of France. Globally, sea levels are rising at approximately 3.9 mm per year globally, with variations depending on local conditions such as land subsidence and ocean currents (NASA Earth Observatory) [28]. This rate has been accelerated, having increased from about 2.5 mm per year in the early 1990s (NASA Earth Observatory).
In Etretat, the tidal range varies from 3.2 m to 9.13 m, with an average of 6.08 m [60]. In Hautot-sur-Mer, the tidal range varies from 2.96 m in neap to 9.86 m in spring tide with an average amplitude of 6.79 m (tidal range measured at Dieppe, 4.5 km east of the beach).
Wave data (Figure 2 and Figure 5b) reveals a distinct pattern of wave seasonality; during the winter months (typically from October to March), wave conditions exhibit higher heights (Hs > 1.5 m) with periods of approximately six seconds. On the other hand, during the summer, wave heights are lower (Hs < 1 m), and the periods are slightly shorter (5 s), generally occurring from April to September.
The analysis of storm events over a 40-year period (1982–2022) indicated that the 2018/2019 winter represents an average season, while 2019/2020 represents an extreme one [58], both in terms of storm frequency and total energy. Within the English Channel, the storm clusters of each season were considered (Table 1): Cluster 1, known as the Gareth storm cluster of winter 2018/2019, in which the most energetic event is Storm Gareth; and Cluster 2, known as the Ciara storm cluster of winter 2019/2020, in which the most energetic event is Storm Ciara. Table 1 summarizes the most energetic storms (energy > 3 × 10⁵) of each season.

Table 1.
Storm clusters of 2018/2019 and 2019/2020, initial date of each extreme event (Date), and the main storm characteristics: maximum significant wave height (Hs,max), peak period (Tp), wave direction (Dir), duration of the storm event (Dur) and energy content (E). The bold horizontal line separates the two winter periods.
3.2.3. Anthropogenic Disturbances
The northern part of Normandy, consisting of high cliffs, is globally anthropogenic with the presence of coastal structures concentrated close to the mouth of rivers. Such structures are generally used for channeling and draining river estuaries or protecting the coasts against the impacts of extreme storms. In the two studied beaches, Etretat and Hautot-sur-Mer, the backshore is bounded by a beach promenade, which acts as a limit to sediment transport and dune development, and crossed by a series of concrete groins that have been built at different time periods and exert variable influence on the beach dynamics.
3.2.4. Morphological Response to Physical and Anthropogenic Disturbances
The studied sections at both sites are considered to be representative of the overall morphodynamic behavior of each beach. At Etretat, around 300 m alongshore section is evaluated, where three groins are visible—one buried, one centrally located, and another at the southern end of the study area; this configuration allows a complete groin cell to be observed and part of an adjacent one. In Hautot-sur-Mer, a 160 m segment is analyzed, encompassing two groins: one near the northern boundary (note that data collection does not cover the final 20 m near this groin), and another positioned centrally. These structures effectively divide the beach into two distinct morphological sections.
The largest changes observed at these two sites are driven by both individual and clustered storm events, with their impact influenced by the tidal conditions at the time the storm occurs.
During the first winter season, Etretat beach was subject to a series of advance-retreat cycles indicating storm induced erosion followed by post storm beach recovery. In March 2019, a large retreat occurred due to Gareth (a storm cluster formed by two consecutive events) which marked the last event of the winter season. Although the beach partially recovered during the summer, the shoreline at the beginning of the following winter season exhibited a net landward displacement relative to the previous season. This pattern was more marked in the southern section of the beach. Furthermore, the intertidal beach volume showed only a partial recovery related to the pre-winter situation (e.g., [56,57]).
The shoreline retreat produced during the second winter season (2019–2020) was larger (the shoreline retreat attaining the maximum values registered at the site) and longer-lasting. In this period, the extreme wave conditions of Ciara storm (February 2020) transported gravel offshore, transforming the gravel beach in Etretat into a sandy coast [57]. However, the last events of this second winter season contributed to the recovery of the beach width (~3 months), which then continued through the summer months.
At Hautot-sur-Mer, shoreline changes occur more frequently, often triggered by individual storms or storm clusters, but recovery is usually rapid within a few weeks to months. In contrast, even the largest storms at Etretat (e.g., Gareth, Ciara) did not generate markedly different responses compared to other events. Human structures also influence morphological responses to waves. At Etretat, Groin 1 (P60, Figure 6) shows no clear effect on shoreline position, while the influence of Groin 2 (P102) varies over time. Before storm Gareth (March 2019), Groin 2 had little impact, and no contrasting behavior was observed between its updrift and downdrift sides. In such cases, shoreline change was dominated by cross-shore migration across the whole monitored section, with alongshore variability sometimes linked to beach rotation around a pivot point outside the study area.

Figure 6.
(a) Normalized planform evolution of the 2 m elevation shoreline position at Etretat (top) and Hautot-sur-Mer (bottom), from July 2018 to November 2020. (b) Alongshore-averaged evolution of the shoreline position of elevation +2 m on the beaches of Etretat (blue) and Hautot-sur-Mer (orange) from July 2018 to November 2020 ([56]). Both energetic storms, Gareth and Ciara, are indicated by dotted red lines.
After April 2019, the northern section of the beach (which recovered promptly after storm Gareth) has a different behavior to the southern section (the beach cell between the groins, which did not fully recover). The beach cell formed by Groins 1 and 2, undergoes a different alongshore pattern of advance/retreat at several points in time, which might be associated with the rotation of the beach cell. Following storm Gareth, Groin 2 starts to play a role in the beach dynamics as different patterns are observed at its sides. Furthermore, no clear sign of beach rotation is appreciated northward of Groin 2 during this period.
In Hautot-sur-Mer, Groin 2 creates an active boundary hindering alongshore sediment transport and, in this manner, creating a different behavior at its sides. Although the last profiles close to Groin 1 are not presented, the data shows the differing shoreline responses along the cell (opposing advance-retreat of the shoreline in relation to the groin position). In this beach, the groins influence not only the shoreline response but also the grain size distribution [56]. Accordingly, the small pocket beaches in Hautot-sur-Mer are highly influenced by groins, which play an important role in protection through the shoreline containment, thereby reducing the disturbance of the beach after storms; while this disturbance is more significant in Etretat beach where the recovery does not appear to be fully achieved given that the initial state is not completely restored after a long period.
3.3. Egmond Aan Zee Study Case in the North Sea: Subtidal Bar
3.3.1. Geographical Location and Geomorphological Characteristics
Egmond aan Zee is located in the province of North Holland, within the municipality of Bergen in the Netherlands (Figure 7). Positioned along the North Sea, Egmond aan Zee has been a popular seaside resort since the beginning of the 20th century, with its economy primarily driven by tourism-related activities on its beach and in the village. Beyond tourism, the fishing industry has historically played an important role, though it has diminished over time, with small-scale fisheries and seafood trade still present. Known for its open sandy beaches, Egmond aan Zee is surrounded by the North Holland Dune Reserve (Noordhollands Duinreservaat), a protected area featuring sand dunes and diverse wildlife.

Figure 7.
Location and view of Egmond aan Zee. The subtidal bars are illustrated along the shore, used to assessing changes in sand volumes.
The nearshore subtidal morphology is characterized by the presence of a shore-parallel double-bar system, with both bars showing alongshore undulations in their cross-shore positions (with wave lengths that vary between 350 and 900 m in the inner bar and >1 km in the outer bar) [61]. The dynamics of bar systems are typically described by: (i) their alongshore-uniform behavior, representing the overall cross-shore migration of each bar (measured by changes in the alongshore-averaged cross-shore position of the bar crest), and (ii) their alongshore non-uniform, or three-dimensional, behavior, which reflects the dynamics of alongshore undulations (measured by the standard deviation of bar positions around the mean or by bar-crest sinuosity). In this contribution, the interannual dynamics is described through (i), the mean cross-shore position of the bar.
The morphological state of the beach-dune system is strongly connected to the dynamics of the subtidal bars in response to climate drivers [62,63] and anthropogenic activities [64,65]. In this study, the subtidal-bar dynamics are considered to illustrate the multi-timescale evolution of the bar-beach system and its resilience.
Beyond the high-tide line (at around 3 m above mean sea level), the beach steepens and switches into a sharply sloped front of the foredune. Higher up (at about 14 to 17 m) the slope changes noticeably again before gradually rising to the dune’s crest, which reaches between 20 and 25 m above sea level; the upper part of the dune is densely vegetated with European marram grass [66]. The sediment is characterized by well-sorted quartz sand with a grain size of 0.025–0.030 µm, which tends to decrease in size further inland [67].
3.3.2. Physical Drivers and Natural Disturbances
Egmond aan Zee is located along the 120-km-long North-Holland coast (Netherlands), where it is exposed to the semi-enclosed North Sea. This site is storm-wave-dominated, with an annual mean offshore significant wave height of approximately 1.3 m and a mean wave period of 4.5 s. Wave activity varies seasonally, with significantly higher Hm0 in winter (1.8 m) compared to summer (0.9 m). During northwesterly storms, wave heights can exceed 7 m. The tide is semi-diurnal and microtidal, with a neap tidal range of about 1.4 m and a spring tidal range of approximately 1.8 m. Storm surges, particularly during northwesterly and northerly winds, can elevate water levels by more than 1 m. The regular erosion of the foredune by such events, approximately once every 1–2 years, results in the persistent steep foredune slope described above. Embryo dunes may develop at the toe of the foredune during multiple years without significant dune erosion events [68].
3.3.3. Anthropogenic Disturbances
Since 1990, the volume of sand along the Dutch coast has been maintained through sand deposits, or sand nourishments. Without these nourishments, the coast would gradually erode [63]. Egmond aan Zee is considered to be one of the most nourished locations along the Dutch coast, and has been subjected to frequent nourishments since 1990 [64,68]. Initially, nourishments were dominantly placed on the beach, but since 2000 shoreface nourishments [62] have been the dominant mode of adding sand to the system. Such nourishments are typically placed in water depths < 5 m, within the active zone of subtidal sandbars [64,69,70]. At Egmond, all nourishments have predominantly been directed towards the 3–4 km stretch of coast directly fronting Egmond aan Zee with typical volumes ranging between 200 and 400 m3/m of coast alongshore. Although the area to the north (including Bergen and the Hondsbossche dunes; [70]) has also been extensively nourished, the 4 km directly to the south of Egmond have never been nourished. This allows for a comparison of resilience for adjacent stretches of nourished and non-nourished coast, otherwise exposed to identical environmental conditions (Figure 8a).
Annual bed level measurements of the entire coast (known as the Jarkus program) have been executed by the Dutch government since 1965 to monitor the amount of sand in the coastal zone, through a parameter known as the “Momentary Coastline”, or MKL-position (Momentane KustLijn, i.e., current coastline) which is used as a proxy to determine the current position of the coastline [64,68]. The MKL is a weighted average of the sand volume between the dune foot (~3 m above mean sea level) and the same elevation below the low water line (~5 m below mean sea level). If the MKL at a given location tends to fall below the legal minimum, a nourishment is implemented (see [64,68] for details). Since the minimum values at Egmond aan Zee are frequently exceeded, this site is nourished regularly.
3.3.4. Morphological Response to Physical and Anthropogenic Disturbances
Both in the nourished and un-nourished sections of the coast, storm waves drive seaward migration of the subtidal bars, while onshore movement of the bar takes place during calmer conditions [70]. Over longer time-frames, the bars show a Net Offshore Migration (NOM) with cycle times up to 15 years at Egmond aan Zee (Figure 8a, left). During such a cycle, a new bar is generated at the shoreline and gradually migrates seaward before decaying outside the surf zone. The evolution of nourishment interventions and their impacts on subtidal bar dynamics have been subject of several studies along the Dutch coast [71]. Using the Jarkus annual measurements and video data of the nearshore zone, shoreface nourishments have been found to disperse into the nearshore zone within 4–10 years, depending on the placement and volume of the nourishment [72]. This becomes visible as a flattening and widening of the nourishment, both in bed level measurements and through a visible widening and fading of the surf zone over time in video imagery [73,74]. Accordingly, nourishments do not evolve independently of the surrounding morphodynamics. Shoreface nourishments have been observed to temporarily seize, slow down or reverse the NOM cycle (e.g., [73]; Figure 8, right). In multiple bar systems, such as Egmond aan Zee, the response of each subtidal bar may change depending on the nourishment placement. Commonly, the placement of nourishment stagnates the offshore migration of the outer bar, followed by a stagnation or onshore migration of the inner bar(s). Once the nourishment body has merged with the bar morphology and becomes undetectable as a separate feature, the bars resume their NOM cycle (Figure 8a).
Although the placement of a single shoreface nourishment has not been observed to directly affect the shoreline position or feed the beach with sand, it has been suggested that repeated shoreface nourishment over multiple years is needed to retain the sediment on the beach [64]. Figure 8b shows timeseries of the cross-shore shoreline positions relative to a fixed line (RSP, i.e., Dutch Beach Poles; [69]) from alongshore locations in the nourished (RSP 38.000) and non-nourished (RSP 43.000) sections, respectively. The shoreline at the non-nourished site generally exhibits larger fluctuations, with notable peaks (wider beaches) around 1985 and 2006, corresponding to periods of bar generation (Figure 8, left). The position of the nourished shoreline exhibited smaller fluctuations, also prior to nourishment, and beach widths steadily increased since nourishment started. Larger beach widths remained between 2000–2010, corresponding to a period where a bar remained close to the shoreline (Figure 8a, right).
The smaller positive and negative fluctuations, together with the steady increase in beach width, indicate a more resistant and resilient system.

Figure 8.
(a) Mean cross-shore positions of the sandbars at Egmond aan Zee for the unnourished (left) and nourished (right) sections. Adapted from [75]. Each colour represents a distinct sandbar, allowing its cross-shore evolution to be tracked over time. (b) Timeseries of the cross-shore shoreline positions, derived from Jarkus data, at the nourished (red, at RSP 38.000) and non-nourished (blue, at RSP 43.000) sections of Egmond aan Zee, respectively. The vertical dashed line indicates the start of large-scale repeated nourishment along the Dutch coast.
3.4. Case of Bateman Bay in Australia Coast: Muddy Beach
3.4.1. Geographical Location and Geomorphological Characteristics
Batemans Bay (BB) is an estuarine system on the southeast coast of New South Wales, Australia (35.7144° S, 150.1795° E). It is a funnel-shaped drowned river valley covering 28 km2, with an average depth of 11.1 m and a tidal range of 1.85 m [76,77]. Cullendulla Beach and its flood-tide delta lie at the mouth of Cullendulla Creek in inner BB (Figure 9) and are influenced by Clyde River discharges (mean flow 6.75 m3/s over the past 20 years, with sharp increases during floods). Cullendulla Beach is an 891 m-long embayed beach, bounded by Square Head to the east and Hawk’s Nest Head to the west. Its sediments are sandy–muddy mixtures with grain sizes from 0.125–0.225 mm [77].

Figure 9.
Location of Batemans Bay and Cellendulla beach.
3.4.2. Physical Drivers and Natural Disturbances
Batemans Bay is shaped by the combined effects of baroclinicity, tides, waves, and human activities, which control suspended sediment concentration and geomorphology [77]. Swell waves dominate the system, driving sediment transport, erosion, and resuspension, particularly in summer. Strong waves can triple net sediment flux, narrow beaches, and erode the seabed during storms. Wave–current interactions further enhance sediment fluxes and contribute to estuarine turbidity maximum zones.
3.4.3. Anthropogenic Disturbances
Human activities have long shaped Batemans Bay (BB). The construction of a training wall at Corrigans Beach in the early 20th century significantly altered local hydrodynamics and sediment dynamics, while contemporary pressures continue to influence the bay’s resilience and morphology. European development began in the 1840s with Joseph Phipps Townsend’s exploration, intersecting with long-standing Indigenous occupation and resource use. Early ambitions to establish BB as a commercial hub rivaling Sydney and Melbourne faltered due to economic setbacks, such as the failed St Vincent land sales in 1841. The northern suburbs, historically isolated until the Princes Highway bridge was built in 1956, reflect these developmental challenges. Research on BB underscores both the historical economic motives of early coastal settlements and the importance of acknowledging Indigenous custodianship.
3.5. Hangzhou Bay in China Coast: Angdon Tidal Flat
3.5.1. Geographical Location and Geomorphological Characteristics
Hangzhou Bay is a funnel-shaped tidal estuary on the eastern coast of China (Figure 10), at the southern edge of the Yangtze River Delta (30°17′45″ N, 121°12′34″ E). Located between Shanghai and Ningbo, it is a hub of industrial development, aquaculture, and large-scale land reclamation, including the Hangzhou Bay New District established in 2010 [78]. The bay’s geomorphology is shaped by strong East China Sea tides and sediment inputs from the Qiantang and Yangtze rivers. With an average depth of 10 m, its sediments are mainly fine to medium silt, easily resuspended under tidal action, while coarser sands accumulate near the shores. The southern tidal flat forms an arc-shaped structure, extending up to 10 km offshore in the central section but narrowing to less than 1.5 km in the east and west. In 2020, tidal flats covered ~280 km2 (≈3.15% of China’s tidal flat resources), ranking among the country’s largest plain-type tidal flats.

Figure 10.
Location of Hangzhou bay and its associated tidal flat system.
3.5.2. Physical Drivers and Natural Disturbances
Hangzhou Bay experiences semi-diurnal tides with macro-tidal ranges driven by its funnel shape [79]. Strong tidal currents (ebb: 0.90–2.19 m/s; flood: 1.02–2.79 m/s) promote rapid mixing and sediment resuspension, sustaining high turbidity. The bay is also famous for the Qiantang tidal bore, one of the world’s largest. Sea-level rise along the East China Sea coast exceeds the global average, with a trend of 4.6 mm/year from 1978–2017 [80]. Rising sea levels, storm tides, and typhoon waves reshape tidal flats, salt marshes, and sediment dynamics, while frequent tropical cyclones drive rapid and large-scale morphological changes.
3.5.3. Anthropogenic Disturbances
Hangzhou Bay has been heavily modified by human activities, including coastal construction, land reclamation, and land-use change. Infrastructure such as the Hangzhou Bay Bridge and extensive seawalls have disrupted natural sediment transport and hydrodynamics, altering erosion and deposition patterns. Since 2000, large-scale reclamation—especially in the south—has created industrial zones, ports, and urban areas, leading to rapid coastline changes, reduced wetlands, and increased impervious surfaces [79].
The main characteristics of the different coastal systems, addressed in CRESTE network are summarized in Table 2.
Table 2.
Characteristics of CRESTE sites influencing the evolution of their resilience.
4. Discussions: How Is the Resilience Trajectory Changing in Coastal Systems?
4.1. Comprehensive Overview of Resilience Trajectory
The comprehensive analysis of the different cases addressed in this work has demonstrated that the time-evolution of coastal systems is manifested differently, exhibiting various morphological states according to their vulnerability to some specific conditions and their resistance to the changing combined effects of internal components (morphology of the beach, presence of subtidal or intertidal sandbars, presence of vegetation), external drivers (wave conditions, tides, wind) and anthropogenic activities (hard and soft interventions). This comprehensive study is crucial to assess the multi-timescale resilience and its trajectory in wave-environments where the morphological response of the system and its recovery is mainly controlled by marine drivers. The trade-off between the resistance and the resilience at Sisal, Normandy and Egmond beaches is addressed in this section.
Indeed, both the East (updrift) and West (downdrift) Sisal beaches present low resistance to changing wave conditions between 2019 and 2024. The harbor induces an opposite effect on two sides, increasing and decreasing the sediment transport at the East and West beaches, respectively. The trajectory of the resilience period of 6 years is described in a conceptual diagram where the resistance scheme of both Sisal beaches, located in the vicinity of Sisal harbor, is presented (Figure 11a). Changes in the hypothetical energy potential vary differently between the two sides of the beach as a function of the ecosystem state and its vulnerability (exposure to physical drivers and anthropogenic activities). Indeed, both beaches present low resistance (shallow basing) with different resilience; high (low) for east (west) Sisal beach explained as reversible (irreversible) after strong perturbations. The coastal resilience of Sisal’s systems is closely linked to maritime structures, which disrupt shoreline configuration, sediment transport, and ultimately beach stability.
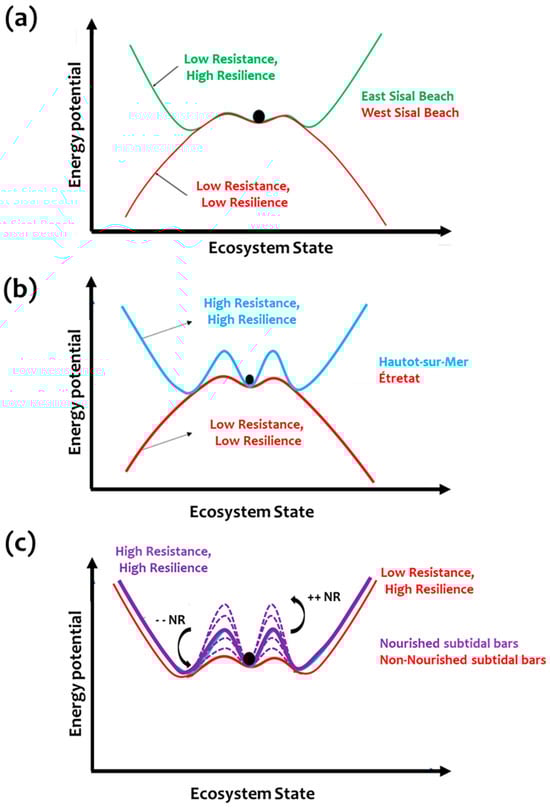
Figure 11.
Conceptual diagrams showing the trade-off between the resistance and the resilience of coastal systems in Sisal, Normandy and Egmond beaches. A compared analysis between (a) West-East Sisal, (b) Etretat-Hautot-sur-mer, and (c) Egmond Aan Zee subtidal bars, where “++ NR” and “-- NR” stand for more or less nourishment, respectively. (NR: nourishment).
For the Normandy coasts, the analysis of the gravel beaches Etretat and Hautot-sur-Mer has outlined that the resilience could be described at interannual scales (trajectory during 2 years) and at short scales (storm events). By September 2020, the beach had recovered nearly 95% of its sediment volume loss, reflecting a strong capacity for morphological adjustment following storm impacts. Recovery in gravel beaches is expressed through berm rebuilding, shoreline readjustment, and gradual onshore sediment transport, typically occurring over several months. In Normandy, this recovery is progressive, occurring during the calmer intervals between successive storms and storm clusters (e.g., Gareth storm in 2019; Ciara storm in 2020). Such cycles of erosion and recovery highlight both the resilience of gravel-dominated systems and their dependence on storm-free periods to restore sediment volumes and beach morphology (Figure 5). The resistance of both gravel beaches depends on their internal parameters during their initial state (sediment availability, the grain size and the beach slope, beach orientation). The presence of coastal structures (groins), changing the dynamics of beaches, should also be considered for assessing coastal resilience; case of Hautot-sur-Mer where the groins play a key role in wave transformation, sediment transport and beach enclosure [81] by modifying their exposure to the extreme physical drivers as well as their vulnerability. The alongshore component explained a substantial component of the variability, with beach-planform rotation largely controlled by groins that interrupt sediment transport. Acting as fixed boundaries, groins compartmentalize the shoreline into smaller sediment cells, within which localized right- or left-centered rotation develops in response to hydrodynamic forcing [81]. The diagram of resistance-resilience is displayed in Figure 11b for Normandy Beaches. Hautot-sur-Mer beach, a sandy-gravel mixed beach, is considered to be a resistant and resilient system. The resistance is mainly explained by the presence of groins, whose role here is more protective, limiting the sedimentary dynamics of the beach. It is also considered to be a resilient system since the recovery of the beach after storms seems to be faster and effective, according to the hydro-morphodynamic observations presented in the previous section. This fast recovery in a small pocket beach, confined between groins, could be supported by the sediment nature mixing gravels and sands. In Etretat, the overall observations have demonstrated that the post-storm recovery of the beach is not complete, and the system requires longer recovery periods that are not always attained, resulting in a more vulnerable beach. This gravel beach, classified as a pebble system, acts as an effective barrier by dissipating wave energy and protecting the shoreline; however, this role was not fully evident during the two-year observation period of this study.
The Dutch coast is considered as one of the most heavily nourished coasts globally. The nourishment actions, considered to be soft engineering solutions, are successful in temporarily augmenting the volume of sand in the nearshore region. Although successful in maintaining sand volumes along the Dutch shorelines, it remains unclear how sand finds its way towards the beach. The subtidal bars at Egmond beach appear to play an important role in the exchange of sand between the shoreface and the beach-dune system. Nourishments influence the NOM cycle by stabilizing cross-shore bar positions, including those closest to the shoreline. Under calmer conditions, such bars are more likely to attach to the intertidal beach, widening it. During storms, the increased sediment volumes within the cross-shore profile enhance wave dissipation and provide a greater buffer against beach erosion.
Such anthropogenic solutions are external to the natural morphological system of the beach, as exemplified by the maritime structures at Sisal and along the Normandy coasts. Instead, they represent interventions introduced when system vulnerability increases. Consequently, their influence on system resilience varies according to the system’s state and degree of vulnerability. Figure 11c presents the resilience diagram comparing nourished and non-nourished subtidal bars.
4.2. Limitations and Challenges: From Beaches to Deltaic Systems
According to the preliminary insights on coastal resilience, the use of accurate observations of coastal components with a high resolution in time and space is required for providing a reliable monitoring of resilience trajectory in beaches controlled by natural drivers and anthropogenic activities.
The resilience of the coastline has been addressed in this work for two different cases; the first one is related to the interannual shoreline evolution in response to the morphological disturbance induced by the presence of a maritime structure in Sisal beach; the second one of Normandy coast examines the short scale recovery of the shoreline and its resilience after high energetic storm periods. The Normandy interannual analysis was limited to a 2-year dataset of shoreline position which is not enough to fully understand the trajectory of resilience over time and its change according to the severity of physical drivers and the impact of man-made structures. Monitoring this trajectory needs to include the longer-term evolution of the shoreline position and an accurate identification of the different drivers controlling the beach changes.
Coastal evolution in Egmond beach is strongly related to the nourishment of the shoreface, which affects the subtidal bar dynamics. The previous studies of [64,70] have demonstrated that the nourishments are successful in increasing the volume of sand around the shoreline. There are no specific studies linking the evolution of shoreface nourishments and their effects on shoreline position in the years following the nourishment. As the nourishments are placed at some distance from the beach, the response of the beach is delayed and attenuated due to the gradual transport of sediment towards the coastline.
However, this does not mean that beaches on nourished coasts remain unaffected by nourishments. The cross-shore position and depth of subtidal bars directly affect the amount of wave dissipation in the nearshore and, through that, the amount of wave energy reaching the beach during storms [82]. Shoreface nourishments have a similar effect. In contrast, beach nourishments result in a seaward displacement of the shoreline through widening of the beach. This increases the buffer of sand against erosion during storm waves. Also, flatter slopes and a wider intertidal area increase sand availability for aeolian transport towards the dune, increasing the potential for beach and dune recovery following storm erosion. As such, nourishments may affect the coastal resilience at Egmond aan Zee through a decrease in erosion during storms and an increase in recovery rate in the periods following storms (but we do not yet have the analysis showing this).
The monitoring of coastal resilience is complex in river- and tide-dominated systems; the case of Batemans Bay–Cullendulla beach (Southeast coast of New South Wales, Australia) and Hangzhou Bay—Angdon tidal flat (eastern coast of China), where multiple physical drivers interact with anthropogenic activities and intensifying socio-economic pressures (e.g., [83,84]). In Batemans Bay, the interaction of fluvial dynamics with tidal currents and waves produces a complex morphology characterized by mixed sediments ranging from sand to mud and silts of varying size. These natural drivers, combined with human interventions such as seawalls and socio-economic pressures, increase system vulnerability—especially in areas with higher concentrations of low-income households and industrial activity. Similarly, Hangzhou Bay, one of the world’s largest macro-tidal estuaries, is shaped by strong tidal currents and fluvial inflows, which generate extensive tidal flats subject to rapid sediment accretion and erosion. The morphological changes of fine-grained cohesive sediments occur across multiple timescales, from seasonal variations driven by storm surges interacting with river discharge, to long-term alterations associated with large-scale land reclamation, port development, and coastal defense structures that disrupt sediment transport and hydrodynamic regimes.
Socio-economic pressures further amplify risks through urbanization, tourism, and port development. Similar challenges are observed in Europe and Mexico’s Yucatán, where erosion, aging defenses, resort expansion, and mangrove loss, exacerbated by governance gaps, reinforce cycles of risk. Comparable issues arise in the tidal flats of Batemans Bay and Hangzhou Bay, where habitat loss and development heighten exposure. Vulnerability is assessed by overlaying flood hazard scenarios with a social vulnerability index, identifying at-risk groups, while economic impacts are estimated through the value of residential assets in flood-prone areas and the potential effects of inundation on income distribution. Dependence on hard infrastructure, coupled with limited investment in ecosystem restoration, further increases exposure to sea-level rise and intensifying storms.
The case studies presented in this work, developed within the framework of the CRESTE project, encompass diverse internal and external conditions. These interact with the combined effects of rapid urbanization and industrial expansion in adjacent areas, collectively shaping coastal vulnerability and amplifying exposure to flooding, shoreline retreat, and ecosystem degradation. The lack of reliable in situ data with sufficient temporal frequency and duration hinders the study of system dynamics and the estimation of long-term evolution, particularly in river–tide dominated environments. Yet, evaluating resilience trajectories is essential, as it provides new insights into the capacity of such systems to adapt under increasing environmental and socio-economic pressures; addressing this challenge is a central outcome of the CRESTE action.
For example, the proposed Batemans Bay Clyde River Bar Dredging 2025–2035 Project is a strategically important initiative that addresses two critical challenges in Batemans Bay: maintaining safe maritime navigation through the Clyde River Bar and mitigating coastal erosion, particularly at Cullendulla Beach. This ten-year program integrates navigation safety with shoreline nourishment to deliver sustainable benefits over the long term. In recent years, beaches such as Cullendulla have experienced severe shoreline retreat, with erosion threatening residential properties, public infrastructure, and valuable environmental assets. The Clyde River project thus represents a timely and well-justified intervention that combines coastal engineering with adaptive sediment management.
To this end, a reliable comparison between the different systems requires the use of a homogeneous, universal and long-term dataset for accurately assessing the resilience indicators and their temporal evolution, which is mainly provided by satellites. This approach is an excellent way to overcome major limitations, including the achievement of large-scale studies, the high-resolution monitoring of coastal processes, as well as the integration of socioeconomic parameters.
4.3. Opportunities Offered by Satellite Networks
The expansion of satellite observational networks over the past two decades [85], with advances in optical, radar, and lidar techniques, provides a strong foundation for near-global coastal monitoring. However, trade-offs between spatial and temporal resolution remain, as daily overpasses rarely deliver both fine detail and broad regional coverage [86,87]. This spatial approach can equitably complement in situ observations by filling data gaps and improving the monitoring of environmental change.
The recent discussions of Benveniste et al. [88] and Cazenave et al. [89] have addressed the capacity of satellites to provide an observational backbone in the study of coastal evolution, which is key for assessing the multi-timescale variability of resilience trajectories and supporting dynamic adaptation policy pathways for coastal protection [90]. Integrating satellite observations into multiscale datasets for coastal monitoring remains challenging, particularly in identifying the most suitable parameters for calculating resilience indicators.
This work assessed coastal evolution using morphological indicators, while noting that ecological inputs are essential in urbanized or vegetated environments for a fuller view of resilience. Tracking resilience across space and time can be advanced through satellite imagery and altimetry, especially when combined with multi-source observations (optical, radar, lidar, airborne), in situ data, modeling, and AI. Geospatial Big Data and deep-learning methods can enhance resolution and deliver near–real-time, large-scale monitoring. Such integrative approaches enable the development of reliable resilience indicators, supporting coastal communities and stakeholders in managing risks and adaptation strategies.
5. Conclusions
A review work has been developed in this research to emphasize the complex dynamics of diverse environments, subject to varying disturbances, and their multi-scale variability, with the aim of providing insights into the pathways of their resilience over time in response to changing climatic drivers and human activities.
Within the CRESTE project, case studies address both wave- and river-dominated coastal systems under diverse environmental conditions. For wave-dominated coasts, analyses in Yucatán (Mexico), Normandy (France), and the Dutch North Sea (The Netherlands), using in situ measurements, video monitoring, and hydrodynamic data, show that beach resilience is strongly linked to system resistance. This resistance depends on the intensity of climatic drivers, sediment type (from sandy to gravel beaches), and human interventions, including maritime structures (ports, jetties, dykes) and nourishment strategies (e.g., shoreface nourishments). For river-dominated coasts, such as the Angdon tidal flat in Hangzhou Bay (China) and Cullendulla beach in Batemans Bay (Australia), monitoring coastal resilience is particularly challenging in environments shaped by fluvial processes and subject to rapid urbanization and industrial expansion.
Assessing multiscale coastal resilience and its evolving trajectory across the CRESTE study sites requires reliable long-term monitoring of beach components with high-resolution sampling in both time and space. Satellite-based datasets play a key role in this effort, providing accurate indicators of resilience by integrating morphological parameters with ecological and socio-economic dimensions. While satellite observations enable global data collection, in situ measurements, video monitoring, and airborne observations remain essential for capturing local-scale changes and validating satellite-derived information. Advancing towards a coastal multi-platform that integrates multiscale datasets (satellite, airborne, and in situ), numerical modeling, and artificial intelligence methods is necessary to better understand and predict changes in coastal resilience across relevant spatial and temporal scales. This is the main focus of the CRESTE network and the central theme of our future work. Such an integrative approach supports reliable assessment of multiscale resilience and its trajectory—an essential step in creating frameworks for coastal communities to develop adaptation strategies guided by long-term, observation-based indicators of coastal risk.
Author Contributions
Conceptualization, E.I.T., E.O., E.T.M., G.M., A.T.-F., T.D.P., E.S., X.H.W. and L.L.; methodology, E.I.T., E.O., E.T.M., G.M., A.T.-F. and T.D.P.; formal analysis, E.I.T., E.O., E.T.M., G.M., A.T.-F. and T.D.P.; investigation, E.I.T., E.O., E.T.M., G.M., A.T.-F. and T.D.P.; resources, E.I.T.; data curation, E.I.T., E.T.M., G.M., A.T.-F., G.L.F., T.D.P. and E.S.; writing—original draft preparation, E.I.T., E.O., G.M., A.T.-F. and T.D.P.; writing—review and editing, E.I.T., E.O., E.T.M., G.M., A.T.-F., T.D.P., G.L.F., X.H.W. and L.L.; supervision, E.I.T., E.O., E.T.M., G.M., A.T.-F., T.D.P., E.S. and X.H.W.; project administration, E.I.T.; funding acquisition, E.I.T. All authors have read and agreed to the published version of the manuscript.
Funding
This research received no external funding.
Data Availability Statement
No new data were created or analyzed in this study.
Acknowledgments
This research was supported by the International Space Science Institute (ISSI) in Bern, through ISSI International Team project ‘Coastal resilience using satellites: CRESTE’ (ISSI Team project #23-598: https://teams.issibern.ch/creste/ accessed on 4 November 2025). Thanks are due to the French organism Syndicat Mixte de la Seine Maritime and Waves’n See Company; DGAPA UNAM (IN107925 and BV300123); and Investigadoras e Investigadores por Mexico, SECIHTI (7071); and for their support to collect data. We also thank Antoine Soloy, from Rouen Normandy University, for processing shoreline datasets along Normandy coasts.
Conflicts of Interest
The authors declare no conflicts of interest.
References
- Neumann, B.; Vafeidis, A.T.; Zimmermann, J.; Nicholls, R.J. Future coastal population growth and exposure to sea-level rise and coastal flooding—A global assessment. PLoS ONE 2015, 10, e0118571. [Google Scholar] [CrossRef]
- Zheng, Q.; Bingham, R.; Andrews, O. Using Sea Level to Determine the Strength, Structure and Variability of the Cape Horn Current. Geophys. Res. Lett. 2023, 50, e2023GL105033. [Google Scholar] [CrossRef]
- McNamara, D.E.; Murray, A.B.; Smith, M.D. Coastal sustainability depends on how economic and coastline responses to climate change affect each other. Geophys. Res. Lett. 2011, 38, L07401. [Google Scholar] [CrossRef]
- Nordstrom, K.F.; Jackson, N.L.; Pranzini, E. Beach Sediment Alteration by Natural Processes and Human Actions: Elba Island, Italy. Ann. Assoc. Am. Geogr. 2004, 94, 794–806. [Google Scholar] [CrossRef]
- Lazarus, E.D. Scaling laws for coastal overwash morphology. Geophys. Res. Lett. 2016, 43, 12113–12119. [Google Scholar] [CrossRef]
- Park, J.J.; Denson, N. When Race and Class Both Matter: The Relationship Between Socioeconomic Diversity, Racial Diversity, and Student Reports of Cross–Class Interaction. Res. High. Educ. 2013, 54, 725–745. [Google Scholar] [CrossRef]
- Sheaves, M. Simple processes drive unpredictable differences in estuarine fish assemblages: Baselines for understanding site-specific ecological and anthropogenic impacts. Estuar. Coast. Shelf Sci. 2016, 170, 61–69. [Google Scholar] [CrossRef]
- Townend, I.H.; French, J.R.; Nicholls, R.J.; Brown, S.; Carpenter, S.; Haigh, I.D.; Hill, C.T.; Lazarus, E.; Penning-Rowsell, E.C.; Thompson, C.E.L.; et al. Operationalising coastal resilience to flood and erosion hazard: A demonstration for England. Sci. Total Environ. 2021, 783, 146880. [Google Scholar] [CrossRef] [PubMed]
- Bernhardt, J.R.; Leslie, H.M. Resilience to climate change in coastal marine ecosystems. Ann. Rev. Mar. Sci. 2013, 5, 371–392. [Google Scholar] [CrossRef] [PubMed]
- Holling, C.S. Resilience and stability of ecological systems. In Part IV—Socio-Environmental Research in Ecology; International Institute for Applied Systems Analysis: Laxenburg, Austria, 1973. [Google Scholar]
- Klein, R.J.T.; Smit, M.J.; Goosen, H.; Hulsbergen, C.H. Resilience and vulnerability: Coastal dynamics or Dutch dikes? Geophys. J. 1998, 164, 259–268. [Google Scholar] [CrossRef]
- Masselink, G.; Lazarus, E.D. Defining Coastal Resilience. Water 2019, 11, 2587. [Google Scholar] [CrossRef]
- Kombiadou, K.; Costas, S.; Carrasco, R.; Plomaritis, T.A.; Ferreira, O.; Matias, F. Bridging the gap between resilience and geomorphology of complex coastal systems. Earth-Sci. Rev. 2019, 198, 102934. [Google Scholar] [CrossRef]
- Chaffin, B.C.; Scown, M. Social-ecological resilience and geomorphic systems. Geomorphology 2018, 305, 221–230. [Google Scholar] [CrossRef]
- Brand, F.S.; Jax, K. Focusing the meaning(s) of resilience: Resilience as a descriptive concept and a boundary object. Ecol. Soc. 2007, 12, 23. [Google Scholar] [CrossRef]
- Flood, S.; Schechtman, J. The rise of resilience: Evolution of a new concept in coastal planning in Ireland and the US. Ocean Coast. Manag. 2014, 102, 19–31. [Google Scholar] [CrossRef]
- Lin, Z.; Singh, M. Assessing Coastal Vulnerability and Evaluating the Effectiveness of Natural Habitats in Enhancing Coastal Resilience: A Case Study in Shanghai, China. Sustainability 2024, 16, 609. [Google Scholar] [CrossRef]
- Sutton-Grier, A.E.; Wowk, K.; Bamford, H. Future of our coasts: The potential for natural and hybrid infrastructure to enhance the resilience of our coastal communities, economies and ecosystems. Environ. Sci. Policy 2015, 51, 137–148. [Google Scholar] [CrossRef]
- Thoms, M.; Delong, M. Ecosystem Responses to Water Resource Developments in a Large Dryland River. Water Resour. Res. 2018, 54, 6643–6655. [Google Scholar] [CrossRef]
- Alencar, A.; Shimbo, J.; Lenti, F.; Balzani Marques, C.; Zimbres, B.; Rosa, M.; Arruda, V.; Castro, I.; Fernandes Marcico Ribeiro, J.P.; Varela, V.; et al. Mapping Three Decades of Changes in the Brazilian Savanna Native Vegetation Using Landsat Data Processed in the Google Earth Engine Platform. Remote Sens. 2020, 12, 924. [Google Scholar] [CrossRef]
- Panerati, J.; Schwind, N.; Zeltner, S.; Inoue, K.; Beltrame, G. Assessing the resilience of stochastic dynamic systems under partial observability. PLoS ONE 2018, 13, 1932–6203. [Google Scholar] [CrossRef] [PubMed]
- van Dongeren, A.; Ciavola, P.; Martinez, G.; Viavattene, C.; Bogaard, T.; Ferreira, O.; Higgins, R.; McCall, R. Introduction to RISC-KIT: Resilience-increasing strategies for coasts. Coast. Eng. 2018, 134, 2–9. [Google Scholar] [CrossRef]
- Vos, M.; Kooi, B.W.; DeAngelis, D.L.; Mooij, W.M. Inducible defenses in food webs. In Dynamic Food Webs. Multispecies Assemblages, Ecosystem Development and Environmental Change; de Ruiter, P.C., Wolters, V., Moore, J.C., Eds.; Elsevier: Amsterdam, The Netherlands, 2005; pp. 114–127. [Google Scholar]
- Francis, R.; Bekera, B. A metric and frameworks for resilience analysis of engineered and infrastructure systems. Reliab. Eng. Syst. Saf. 2014, 121, 90–103. [Google Scholar] [CrossRef]
- Malvarez, G.; Ferreira, O.; Navas, F.; Cooper, J.A.G.; Gracia-Prieto, F.J.; Talavera, L. Storm impacts on a coupled human-natural coastal system: Resilience of developed coasts. Sci. Total Environ. 2021, 768, 144987. [Google Scholar] [CrossRef]
- Pimm, S.L. The complexity and stability of ecosystems. Nature 1984, 307, 321–326. [Google Scholar] [CrossRef]
- Murshed, S.; Griffin, A.L.; Islam, M.A.; Olivier, T.; Wang, H.X.; Paull, D.J. A framework for appraising the status of disaster resilience within the multi-hazard environment of coastal Bangladesh. Int. J. Disaster Risk Reduct. 2024, 113, 104832. [Google Scholar] [CrossRef]
- Lee, H.; Calvin, K.; Dasgupta, D.; Krinner, G.; Mukherji, A.; Thorne, P.; Trisos, C.; Romero, J.; Aldunce, P.; Barret, K.; et al. IPCC, 2023: Climate Change 2023: Synthesis Report, Summary for Policymakers. Contribution of Working Groups i, II and III to the Sixth Assessment Report of the Intergovernmental Panel on Climate Change [Core Writing Team, H. Lee and J. Romero (Eds.)]; IPCC: Geneva, Switzerland, 2023.
- Pimm, S.L. The Balance of Nature?: Ecological Issues in the Conservation of Species and Communities; University of Chicago: Chicago, IL, USA, 1991. [Google Scholar]
- Walker, B.; Salt, D. Resilience Thinking: Sustaining Ecosystems and People in a Changing World; Island Press: Washington, DC, USA, 2012. [Google Scholar]
- Long, A.; Waller, M.; Plater, P. Coastal resilience and late Holocene tidal inlet history: The evolution of Dungeness Foreland and the Romney Marsh depositional complex (UK). Geomorphology 2006, 82, 309–330. [Google Scholar] [CrossRef]
- Jackson, D.W.T.; Costas, S.; Guisado-Pintado, E. Large-scale transgressive coastal dune behaviour in Europe during the Little Ice Age. Glob. Planet. Change 2019, 175, 82–91. [Google Scholar] [CrossRef]
- Ajedegba, J.O.; Choi, J.W.; Jones, K.D. Analytical modeling of coastal dune erosion at South Padre Island: A consideration of the effects of vegetation roots and shear strength. Ecol. Eng. 2019, 127, 187–194. [Google Scholar] [CrossRef]
- Feagin, R.A.; Innocenti, R.A.; Bond, H.; Wengrove, M.; Huff, T.P.; Lomonaco, P.; Tsai, B.; Puelo, J.; Pontiki, M.; Figlus, J.; et al. Does vegetation accelerate coastal dune erosion during extreme events? Sci. Adv. 2023, 9, eadg7135. [Google Scholar] [CrossRef]
- Sigren, J.; Figlus, J.; Armitage, A. Coastal sand dunes and dune vegetation: Restoration, erosion, and storm protection. Shore Beach 2014, 82, 5–12. [Google Scholar]
- Van Gent, M.R.A.; van Thiel de Vries, J.M.S.; Coeveld, E.M.; de Vroeg, J.H.; van de Graaff, J. Large-scale dune erosion tests to study the influence of wave periods. Coast. Eng. 2008, 55, 1041–1051. [Google Scholar] [CrossRef]
- Sallenger, A.H., Jr. Storm impact scale for barrier islands. J. Coast. Res. 2000, 16, 890–895. [Google Scholar]
- Dong, Z.; Elko, N.; Robertson, Q.; Rosati, J. Quantifying beach and dune resilience using the coastal resilience index. Coast. Eng. Pro. 2018, 1, 30. [Google Scholar] [CrossRef]
- Mariotti, G.; Fagherazzi, S. A numerical model for the coupled long-term evolution of salt marshes and tidal flats. J. Geophys. Res. Earth Surf. 2010, 115, F01004. [Google Scholar] [CrossRef]
- Leonardi, N.; Carnacina, I.; Donatelli, C.; Ganju, N.K.; Plater, A.J.; Schuerch, M.; Temmerman, S. Dynamic interactions between coastal storms and salt marshes: A review. Geomorphology 2018, 301, 92–107. [Google Scholar] [CrossRef]
- Nicholls, R.J.; Hanson, S.E.; Lowe, J.A.; Warrick, R.A.; Lu, X.; Antony, J.L. Sea-level scenarios for evaluating coastal impacts. WIREs Clim. Change 2014, 5, 129–150. [Google Scholar] [CrossRef]
- Lawrence, J.; Bell, R.; Stroombergen, A. A hybrid process to address uncertainty and changing climate risk in coastal areas using dynamic adaptive pathways planning, multi-criteria decision analysis & real options analysis: A New Zealand application. Sustainability 2019, 11, 406. [Google Scholar] [CrossRef]
- Ranger, N.; Reeder, T.; Lowe, J. Addressing ‘deep’ uncertainty over long-term climate in major infrastructure projects: Four innovations of the Thames Estuary 2100 Project. EURO J. Decis. Process. 2013, 1, 233–262. [Google Scholar] [CrossRef]
- Stephens, S.A.; Bell, R.J.; Lawrence, J. Applying principles of uncertainty within coastal hazard assessments to better support coastal adaptation. J. Mar. Sci. Eng. 2017, 5, 40. [Google Scholar] [CrossRef]
- Grafton, R.Q.; Squires, D.; Steinshamn, S.I. Towards resilience-based management of marine capture fisheries. Econ. Anal. Policy 2023, 77, 231–238. [Google Scholar] [CrossRef]
- Mendoza, E.T.; Torres-Freyermuth, A.; Ojeda, E.; Gabriela, M.; Rodolfo, R.N.; Salles, P.; Turki, I. Seasonal changes in beach resilience along an urbanized barrier island. Front. Mar. Sci. 2022, 9, 889820. [Google Scholar] [CrossRef]
- Dee, D.P.; Uppala, S.M.; Simmons, A.J.; Berrisford, P.; Poli, P.; Kobayashi, S.; Andrae, U.; Balmaseda, M.A.; Balsamo, G.; Bauer, P.; et al. The ERA-Interim reanalysis: Configuration and performance of the data assimilation system. Q. J. R. Meteorol. Soc. 2017, 137, 553–597. [Google Scholar] [CrossRef]
- Hersbach, H.; Bell, B.; Berrisford, P.; Hirahara, S.; Horányi, A.; Muñoz-Sabater, J.; Nicolas, J.; Peubey, C.; Radu, R.; Schepers, D.; et al. The ERA5 global reanalysis. Q. J. R. Meteorol. Soc. 2020, 146, 1999–2049. [Google Scholar] [CrossRef]
- Franklin, G.L.; Medellin, G.; Appendini, C.M.; Gómez, J.A.; Freyermuth, A.T.; González, J.L.; Ruiz-Salcines, P. Impact of port development on the northern Yucatan Peninsula coastline. Reg. Stud. Mar. Sci. 2021, 45, 101835. [Google Scholar] [CrossRef]
- Lowery, J.G.; Rankey, E.C. Nearshore Influences of Upwelling, Waves, and Currents on A Tropical Carbonate Ramp: Holocene, Northwestern Yucatán Shelf, Mexico. J. Sed. Res. 2017, 87, 546–566. [Google Scholar] [CrossRef]
- Anthony, E.; Aagaard, T. The lower shoreface: Morphodynamics and sediment connectivity with the upper shoreface and beach. Earth Sci. Rev. 2020, 210, 103334. [Google Scholar] [CrossRef]
- Carnero-Bravo, V.; Sanchez-Cabeza, J.A.; Ruiz-Fernández, A.C.; Merino-Ibarra, M.; Hillaire-Marcel, C.; Corcho-Alvarado, J.C.; Röllin, S.; Diaz-Asencio, M.; Cardoso-Mohedano, J.G.; Zavala-Hidalgo, J. Sedimentary records of recent sea level rise and acceleration in the Yucatan Peninsula. Sci. Total Environ. 2016, 573, 1063–1069. [Google Scholar] [CrossRef]
- Medellín, G.; Torres-Freyermuth, T.; Cohn, N. Distinct sandbar behavior on a gently sloping shoreface sea-breeze dominated beach. Mar. Geol. 2025, 484, 107543. [Google Scholar] [CrossRef]
- Medellín, G.; Torres-Freyermuth, A. Foredune formation and evolution on a prograding sea-breeze dominated beach. Cont. Shelf Res. 2021, 226, 104495. [Google Scholar] [CrossRef]
- Jennings, R.; Shulmeister, A. A field based classification scheme for gravel beaches. Mar. Geol. 2002, 186, 211–228. [Google Scholar] [CrossRef]
- Soloy, A.; Turki, I.; Lecoq, N.; Gutiérrez Barceló, Á.D.; Costa, S.; Laignel, B.; Bazin, B.; Soufflet, Y.; Le Louargant, L.; Maquaire, O. A fully automated method for monitoring the intertidal topography using Video Monitoring Systems. Coast. Eng. 2021, 167, 103894. [Google Scholar] [CrossRef]
- Soloy, A.; Turki, I.; Lecoq, N.; López Solano, C.; Laignel, B. Spatio-temporal variability of the morpho-sedimentary dynamics observed on two gravel beaches in response to hydrodynamic forcing. Mar. Geol. 2022, 447, 106796. [Google Scholar] [CrossRef]
- López Solano, C.; Turki, E.I.; Hamdi, Y.; Soloy, A.; Costa, S.; Laignel, B.; Gutiérrez Barceló, Á.D.; Abcha, N.; Jacono, D.; Lafite, R. Dynamics of Nearshore Waves during Storms: Case of the English Channel and the Normandy Coasts. Water 2022, 14, 321. [Google Scholar] [CrossRef]
- López Solano, C.; Turki, E.I.; Mendoza, E.T.; Gutiérrez Barceló, A.D.; Migaud, A.; Hamdi, Y.; Laignel, B.; Lafite, R. Hydrodynamic modelling for simulating nearshore waves and sea levels: Classification of extreme events from the English Channel to the Normandy coasts. Nat. Hazards 2024, 120, 13951–13973. [Google Scholar] [CrossRef]
- Chassignet, E.P.; Hurlburt, H.E.; Smedstad, O.M.; Halliwell, G.R.; Hogan, P.J.; Wallcraft, A.J.; Baraille, R.; Bleck, R. The HYCOM (HYbrid Coordinate Ocean Model) data assimilative system. J. Mar. Syst. 2007, 65, 60–83. [Google Scholar] [CrossRef]
- Ruessink, B.G.; Van Enckevort, I.M.J.; Kingston, K.S.; Davidson, M.A. Analysis of observed two-and three-dimensional nearshore bar behaviour. Mar. Geol. 2022, 169, 161–183. [Google Scholar] [CrossRef]
- Aagaard, T.; Kroon, A.; Andersen, S.; Sørensen, R.M.; Quartel, S.; Vinther, N. Intertidal beach change during storm conditions; Egmond, The Netherlands. Mar. Geol. 2005, 218, 65–80. [Google Scholar] [CrossRef]
- De Winter, R.C.; Gongriep, F.; Ruessink, B.G. Observations and modeling of alongshore variability in dune erosion at Egmond aan Zee, the Netherlands. Coast. Eng. 2025, 99, 167–175. [Google Scholar] [CrossRef]
- Van Duin, M.J.P.; Wiersma, N.R.; Walstra, D.J.R.; Van Rijn, L.C.; Stive, M.J.F. Nourishing the shoreface: Observations and hindcasting of the Egmond case, The Netherlands. Coast. Eng. 2004, 51, 813–837. [Google Scholar] [CrossRef]
- Brand, E.; Ramaekers, G.; Lodder, Q. Dutch experience with sand nourishments for dynamic coastline conservation–An operational overview. Ocean Coast. Manag. 2022, 217, 106008. [Google Scholar] [CrossRef]
- Donker, J.; Van Maarseveen, M.; Ruessink, G. Spatio-temporal variations in foredune dynamics determined with mobile laser scanning. J. Mar. Sci. Eng. 2018, 6, 126. [Google Scholar] [CrossRef]
- Tuijnman, J.T.; Donker, J.J.; Schwarz, C.S.; Ruessink, G. Consequences of a storm surge for aeolian sand transport on a low-gradient beach. J. Mar. Sci. Eng. 2000, 8, 584. [Google Scholar] [CrossRef]
- Ruessink, G.; Schwarz, C.S.; Price, T.D.; Donker, J.J.A. A Multi-Year Data Set of Beach-Foredune Topography and Environmental Forcing Conditions at Egmond aan Zee, The Netherlands. Data 2019, 4, 73. [Google Scholar] [CrossRef]
- Brand, E.; Lodder, Q.; Quataert, E.; Slinger, J. Sustainable coastline management-the cumulative effects of 30 years of nourishments in the Netherlands. Ocean Coast. Manag. 2025, 270, 107895. [Google Scholar] [CrossRef]
- van der Werf, J.J.; Huisman, B.J.A.; Price, T.D.; Larsen, B.E.; de Schipper, M.A.; McFall, B.C.; Krafft, D.R.; Lodder, Q.J.; Ruessink, B.G. Shoreface nourishments: Research advances and future perspectives. Earth Sci. Rev. 2025, 267, 105138. [Google Scholar] [CrossRef]
- Kroon, A.; de Schipper, M.; de Vries, S.; Aarninkhof, S. Subaqueous and Subaerial Beach Changes After Implementation of a Mega Nourishment in Front of a Sea Dike. J. Mar. Sci. Eng. 2022, 10, 1152. [Google Scholar] [CrossRef]
- Huisman, B.J.; Walstra, D.J.R.; Radermacher, M.; de Schipper, M.A.; Ruessink, B.G. Observations and modelling of shoreface nourishment behaviour. J. Mar. Sci. Eng. 2019, 7, 59. [Google Scholar] [CrossRef]
- Ojeda, E.; Ruessink, G.; Guillén, J. Morphodynamic response of a two-barred beach to a shoreface nourishment. Coast. Eng. 2008, 55, 1185–1196. [Google Scholar] [CrossRef]
- Ruessink, B.G.; Van der Grinten, R.M.; Vonhögen-Peeters, L.M.; Ramaekers, G.; Lodder, Q.J. Nearshore evolution at Noordwijk (NL) in response to nourishments, as inferred from Argus video imagery. In NCK-Days 2012: Crossing Borders in Coastal Research; University of Twente: Enschede, The Netherlands, 2012. [Google Scholar]
- Haverkate, S.M. Nearshore Dynamics of a Nourished Coast with Respect to a Neighbouring Natural Coast. Master’s Thesis, Utrecht University, Utrecht, The Netherlands, 2020. Available online: https://studenttheses.uu.nl/handle/20.500.12932/39858 (accessed on 31 October 2025).
- Wang, A.; Wang, X.H.; Yang, G. The effects of wind-driven storm events on partly sheltered estuarine beaches in Batemans Bay, New South Wales, Australia. J. Mar. Sci. Eng. 2021, 9, 314. [Google Scholar] [CrossRef]
- Yang, G.; Wang, X.H.; Zhong, Y.; Oliver, T.S.N. Modelling study on the sediment dynamics and the formation of the flood-tide delta near Cullendulla Beach in Batemans Bay, Australia. Mar. Geol. 2022, 452, 106910. [Google Scholar] [CrossRef]
- Li, L.; Ren, Y.; Ye, T.; Wang, X.; Hu, J.; Xia, Y. Positive feedback between the tidal flat variations and sediment dynamics: An example study in the macro-tidal turbid Hangzhou Bay. J. Geophys. Res. Oceans 2023, 128, e2022JC019414. [Google Scholar] [CrossRef]
- Wang, T.; Hu, M.; Song, L.; Yu, J.; Liu, R.; Wang, S.; Wan, Z.; Sokolova, I.M.; Huang, W.; Wang, Y. Coastal zone use influences the spatial distribution of microplastics in Hangzhou Bay, China. Environ. Pollut. 2020, 266, 115137. [Google Scholar] [CrossRef] [PubMed]
- Feng, J.; Li, W.; Wang, H.; Zhang, J.; Dong, J. Evaluation of sea level rise and associated responses in Hangzhou Bay from 1978 to 2017. Adv. Clim. Change Res. 2018, 9, 227–233. [Google Scholar] [CrossRef]
- Wen, W.; Wan, L. Coastal ecological and environmental management under multiple anthropogenic pressures: A review of theory and evaluation methods. J. Curr. Trends Estuar. Coast. Dyn. 2024, 4, 385–415. [Google Scholar] [CrossRef]
- Castelle, B.; Turner, I.L.; Ruessink, B.G.; Tomlinson, R.B. Impact of storms on beach erosion: Broadbeach (Gold Coast, Australia). J. Coast. Res. 2007, 50 (Suppl. S1), 534–539. [Google Scholar] [CrossRef]
- Molina, R.; Manno, G.; Villar, A.C.d.; Jigena-Antelo, B.; Muñoz-Pérez, J.J.; Cooper, J.A.G.; Pranzini, E.; Anfuso, G. The Effects of Anthropic Structures on Coastline Morphology: A Case Study from the Málaga Coast (Spain). J. Mar. Sci. Eng. 2025, 13, 319. [Google Scholar] [CrossRef]
- Rangel-Buitrago, N.; Anfuso, G. Coastal storm characterization and morphological impacts on sandy coasts. Earth Surf. Process. Landf. 2011, 36, 1997–2010. [Google Scholar] [CrossRef]
- Laignel, B.; Vignudelli, S.; Almar, R.; Becker, M.; Bentamy, A.; Benveniste, J.; Birol, F.; Frappart, F.; Idier, D.; Salameh, E.; et al. Observation of the Coastal Areas, Estuaries and Deltas from Space. Surv. Geophys. 2023, 44, 1309–1356. [Google Scholar] [CrossRef]
- Melet, A.; Almar, R.; Hemer, M.; Le Cozannet, G.; Meyssignac, B.; Ruggiero, P. Contribution of wave setup to projected coastal sea level changes. J. Geophys. Res. Oceans 2020, 125, e2020JC016078. [Google Scholar] [CrossRef]
- Poggio, L.; Gimona, A. Modelling high resolution RS data with the aid of coarse resolution data and ancillary data. Int. J. Appl. Earth Obs. Geoinf. 2013, 23, 360–371. [Google Scholar] [CrossRef]
- Benveniste, J.; Cazenave, A.; Vignudelli, S.; Fenoglio-Marc, L.; Shah, R.; Almar, R.; Andersen, O.; Birol, F.; Bonnefond, P.; Bouffard, J.; et al. Requirements for a Coastal Hazards Observing System. Front. Mar. Sci. 2019, 6, 348. [Google Scholar] [CrossRef]
- Cazenave, A.; Gouzenes, Y.; Birol, F.; Leger, F.; Passaro, M.; Calafat, F.M.; Shaw, A.; Nino, F.; Legeais, J.F.; Oelsmann, J.; et al. Sea level along the world’s coastlines can be measured by a network of virtual altimetry stations. Commun. Earth Environ. 2022, 3, 117. [Google Scholar] [CrossRef]
- Hamlington, B.D.; Willis, J.K. Vinogradova, N, The Emerging Golden Age of Satellite Altimetry to Prepare Humanity for Rising Seas. Earth’s Future 2023, 11, e2023EF003673. [Google Scholar] [CrossRef]
Disclaimer/Publisher’s Note: The statements, opinions and data contained in all publications are solely those of the individual author(s) and contributor(s) and not of MDPI and/or the editor(s). MDPI and/or the editor(s) disclaim responsibility for any injury to people or property resulting from any ideas, methods, instructions or products referred to in the content. |
© 2025 by the authors. Licensee MDPI, Basel, Switzerland. This article is an open access article distributed under the terms and conditions of the Creative Commons Attribution (CC BY) license (https://creativecommons.org/licenses/by/4.0/).