Article

Study on the Structural Vibration Control of a 10 MW Offshore Wind Turbine with a Jacket Foundation Under Combined Wind, Wave, and Seismic Loads

1
PowerChina Chengdu Engineering Corporation Limited, Chengdu 611130, China
2
State Key Laboratory of Coastal and Offshore Engineering, Faculty of Infrastructure Engineering, Dalian University of Technology, Dalian 116024, China
3
Institute of Earthquake Engineering, Faculty of Infrastructure Engineering, Dalian University of Technology, Dalian 116024, China
*
Author to whom correspondence should be addressed.
J. Mar. Sci. Eng. 2025, 13(11), 2112; https://doi.org/10.3390/jmse13112112
Submission received: 25 September 2025 / Revised: 26 October 2025 / Accepted: 28 October 2025 / Published: 6 November 2025
(This article belongs to the Section Ocean Engineering)

Abstract

As offshore wind power continues to develop, with increased capacity and ability to function in deeper waters, jacket-type offshore wind turbines (OWTs) are becoming increasingly challenged by complex environmental loads and significant structural vibration issues. This study focuses on a 10 MW jacket foundation OWT and proposes an optimization approach for tuned mass damper (TMD) parameters based on the artificial bee colony (ABC) algorithm. A fully coupled model of the OWT and TMD system is developed, and the TMD parameters are optimized through frequency-domain analysis and time-domain simulations. The vibration control performance of the optimized TMD is then evaluated under combined wind, wave, and seismic excitations. The results show that the passive TMD achieves substantially greater vibration suppression under seismic loading compared to combined wind and wave conditions. In addition, the optimized TMD reduces the standard deviations of tower-top displacement and tower-base bending moment by more than 50%, significantly enhancing the dynamic response of the structure and contributing to an extended fatigue life.

1. Introduction

With the global energy transition advancing toward decarbonization, offshore wind power has emerged as a key area of research due to its favorable characteristics, including remote siting, away from urban centers, and substantial development potential [1]. According to the GWEC [2], the wind energy sector is projected to achieve a compound annual growth rate of 8.8%, with global installed wind power capacity expected to increase by 981 GW by 2030. In recent years, the rated capacity of individual wind turbines has steadily grown, with units of 10 MW class and larger becoming the industry mainstream. Jacket-type foundations, known for their high adaptability to deep-water conditions, have been widely employed in OWT installations [3]. However, as OWT capacities scale up, structural vibration challenges in complex marine environments have become increasingly prominent. In particular, low-frequency modal vibrations can lead to fatigue damage in both the tower and the foundations, thereby posing serious risks to the long-term structural integrity and economic viability of OWT systems [4].
Research on vibration control strategies for OWTs can generally be classified into two primary approaches. The first approach involves actively adjusting the turbine’s operational parameters, such as blade pitch angles and generator torque, in order to regulate the aerodynamic loads acting on the OWT blades. The second approach encompasses the use of vibration control devices such as tuned mass dampers (TMD), tuned liquid column dampers (TLCD), and others, which act through passive, semi-active, or active mechanisms to dissipate energy and reduce structural vibrations [5].
The first approach to controlling OWTs involves dividing operational strategies into three regions based on incoming wind speeds [6]: Region I, Region II, and Region III. In Region I, where the wind speed is below the cut-in threshold, the turbine blades remain stationary, and no active control is applied. Once the wind speed exceeds the cut-in value in Region II, the turbine begins power generation, typically employing a maximum power point tracking method to maximize energy capture. In Region III, when the wind speed reaches or surpasses the rated level, pitch angle regulation is used to maintain a constant power output. Extensive research has focused on control methodologies within Regions II and III. Jonkman et al. [7] proposed a baseline controller widely implemented in the open-source FAST V7/8 simulation software for OWTs, with subsequent studies validating its effectiveness in managing turbine dynamics [8,9]. Building upon this foundation, the controller evolved into the ROSCO controller, incorporating features such as discrete Kalman filtering for wind speed estimation, set-point smoothing for torque and pitch transitions, and tip speed ratio tracking for generator torque control [10]. The ROSCO controller has since been extensively adopted in OWT control simulations [11,12]. Moreover, the Wind Energy Controller [13], developed by DTU, has been widely applied in OWT operational control. It is noteworthy that most of these control schemes employ relatively straightforward algorithms.
Some researchers have explored advanced control theories to design strategies targeting specific control objectives, aiming to mitigate structural loads while improving power generation efficiency. Mozayan et al. [14] proposed an improved sliding mode control method for a 4 KW wind turbine, which effectively mitigated flutter issues during operation and was validated through experimental testing on a 2 KW prototype. Bagherieh and Nagamune [15] developed linear quadratic regulator (LQR) and linear parameter-varying (LPV) control algorithms and compared their performance with the baseline controller using a 5 MW barge-type floating wind turbine model. The results demonstrated superior control performance and a more effective trade-off between power output and platform motion suppression. Shah et al. [16] employed a model predictive control (MPC) algorithm for a semi-submersible wind turbine, showing through simulation that the approach significantly reduced platform motions. Civlek et al. [17] designed a fuzzy logic controller using rotor speed deviation and its time derivative as input variables and demonstrated its superiority over traditional proportional integral control in managing turbine operating states. Moreover, advanced techniques such as incorporating neural networks into control algorithms [18,19] and applying individual pitch control strategies [20,21] have also been introduced into control frameworks. While these advanced control algorithms exhibit remarkable performance in tracking power outputs and regulating rotor speed with high precision, they exhibit fundamental limitations in suppressing critical structural dynamic loads. The primary goal of control is to ensure a rapid and accurate response to power or speed commands, with control law design focused mainly on optimizing tracking performance. As a result, the control system primarily adjusts the aerodynamic loads acting on the blades, striving to balance energy production with system efficiency. However, it lacks effective mechanisms for addressing structural dynamic responses induced by turbulent wind excitations, aeroelastic interactions, and the control actions themselves. Therefore, implementing structural control strategies beyond conventional operational control systems is imperative for achieving comprehensive load mitigation and enhancing the structural performance of OWTs.
In contrast to the first approach, which focuses on controlling operational parameters to optimize power output, the second approach to OWT vibration control involves structural control strategies. Among these, passive methods are the most widely implemented [22]. Drawing inspiration from the successful deployment of tuned mass dampers (TMDs) in civil engineering for suppressing vibrations in high-rise buildings [23,24,25], the fundamental concepts of TMD-based vibration mitigation have been extended to the OWT domain. By tuning critical TMD parameters such as mass ratio, frequency ratio, and damping ratio to align with the dynamic characteristics of the wind turbine, it is possible to achieve targeted suppression of resonant responses, especially those occurring near structural frequencies such as the tower’s first natural mode.
Lackner and Rotea [26] applied a TMD to the nacelle of a barge-type wind turbine and proposed a parameter optimization method. Their results demonstrated that the TMD reduced fatigue loads in the fore–aft direction by approximately 10% compared to the uncontrolled case. Similarly, Yan et al. [27] conducted vibration control studies on a 5 MW barge-type turbine, incorporating time-delay effects into the state-space formulation, and evaluated the damping performance using a simplified degrees-of-freedom model, which demonstrated that the TMD achieved excellent vibration suppression by significantly reducing structural responses under dynamic loads. Luo et al. [28] developed a 14-degree-of-freedom multibody dynamic model for a 5 MW semi-submersible OWT and validated the model by comparing its results with OpenFAST simulations. The comparison between controlled and uncontrolled configurations showed a significant reduction in tower-top displacement with the application of TMD. Li et al. [29] used the OC4 semi-submersible wind turbine model to investigate the influence of wind-wave misalignment on vibration control performance, and reported that TMDs installed within the nacelle and tuned to frequencies near the fore–aft and side–side tower modes effectively suppressed tower responses while targeting the pitch mode.
In addition to floating OWTs, numerous studies have investigated TMD applications in bottom-fixed OWTs. Stewart and Lackner [30] examined a 5 MW monopile turbine and evaluated the TMD’s effectiveness under various wind-wave incident angles. Their results indicated a 4–6% reduction in structural loads in the TMD-actuated direction. Zhang et al. [31] conducted a detailed investigation into the damping performance of TMDs installed in both the X- and Y-directions, which revealed that the tower-top displacement was reduced by nearly 25% under shutdown conditions of OWTs. Building upon traditional TMDs, recent research has expanded into tuned mass dampers with inerter (TMDI), which have attracted increasing attention, as demonstrated by Hua et al. [32], who modeled three simplified inerter configurations for a 5 MW barge-type wind turbine in the FAST-SC platform and showed that TMDI not only provided superior vibration mitigation performance but also effectively reduced the TMD stroke. By modifying the OpenFAST codes, Zhang et al. [33] investigated the performance of TMDI under combined wind, wave, and seismic excitations and demonstrated that placing TMDI at locations corresponding to higher modal amplitudes, particularly near the second mode, significantly enhanced damping performance. Beyond TMDI, researchers have proposed novel TMD configurations inspired by pendulum dynamics. Sun and Jahangiri [34] explored the optimal parameter selection of three-dimensional nonlinear tuned mass dampers (3D-PTMDs) under combined wind, wave, and seismic loading using a 5 MW monopile turbine model. Additionally, Jahangiri and Sun [35] analyzed the vibration control performance of 3D-NTMDs for spar-type floating wind turbines and found that setting the mass ratio to 1.5% resulted in approximately 15% and 25% reductions in roll and pitch responses, respectively. Luo et al. [36] developed an OC4 semi-submersible wind turbine model within the SIMPACK platform to analyze and compare the performance of 3D-PTMDs and dual-TMD configurations (2D-TMDs), demonstrating that 2D-TMDs effectively suppressed roll and pitch mode amplitudes of the floating platform while 3D-PTMDs more efficiently reduced the tower’s natural frequencies, with vibration mitigation effects being more pronounced in the frequency domain compared to the time domain under wave-dominated excitation conditions.
Traditional passive vibration control methods, which are characterized by energy independence and low maintenance requirements, have been well established in onshore wind power but remain insufficiently explored for application in jacket foundation OWTs. Existing studies have primarily focused on monopile foundations or floating wind turbines, while research into the dynamic response characteristics, optimization, and vibration mitigation performance of jacket foundation OWTs with TMD based on a fully coupled model is still limited. To address this gap, this study focuses on a 10 MW jacket foundation OWT and investigates an optimization design methodology for passive TMD based on an ABC algorithm. Numerical simulations are performed to assess their effectiveness under realistic operational conditions. The results aim to offer novel insights into improving the structural safety and dynamic performance of large-scale OWTs.

2. Fully Coupled Analysis Theories of OWT with Jacket Foundation

2.1. Kane’s Equations of Motion

Kane’s equations [37] provide an efficient and systematic framework for analyzing the dynamic behavior of OWTs, which are inherently complex and coupled multibody systems. Grounded in D’Alembert’s and virtual power principles, this method avoids the cumbersome computation of scalar energy functions and their derivatives required by the traditional Lagrange approach, while also eliminating the need to explicitly solve constraint forces inherent in the Newton–Euler formulation. The advantage of Kane’s equations lies in their ability to automatically eliminate ideal constraint forces and formulate the equations of motion directly in terms of generalized coordinates and partial velocities. This makes the method particularly suitable for systems with a large number of degrees of freedom, complex constraints, and strong nonlinearities. Moreover, Kane’s equations accommodate rigid–flexible, multibody, and environmental coupling effects, offering a comprehensive dynamic framework for analyzing the dynamic responses of OWTs, as shown in Equation (1).
F i + F i = 0 i = 1 , 2 , , P
Here, F i and F i are the generated active and inertial forces, respectively, which are expressed as follows:
F i = r = 1 W ϑ E , i X r · F X r + ω E , i N r · M N r   i = 1 ,   2 , , P
F i * = r = 1 W ϑ E , i X r · m r α E X r + ω E , i N r · H ˙ E N r i = 1 , 2 , , P
where Nr denotes reference frame, E denotes inertial frame, and W denotes a set of rigid bodies characterized; F X r and M N r denote the three-component active force and moment vectors, respectively; Xr is the CM (the center of mass) point location; α E X r denotes the three-component acceleration vector of the CM point Xr; and H ˙ E X i denotes the first-time derivative of the angular momentum of rigid body Nr about Xr in the inertial frame (E) three-component vector. The three-component vector quantities, α E X r and ω E N r , represent the partial linear velocities of CM point Xr and the partial angular velocities of rigid body Nr in the inertial frame, respectively.

2.2. Wind Loads

OWTs operate in complex marine environments where wind speed and direction vary randomly over time and space, and the actual wind speed at any moment is the sum of the mean wind speed and its fluctuations, as shown in Equation (4).
V x , y , z , t = V ¯ z + v x , y , z , t
where V ¯ ( z ) represents the mean wind speed and v x , y , z , t denotes the turbulent wind speed.
Due to the effects of air viscosity and ground frictional damping, the mean wind-speed profile varies with height following a power-law distribution. The mean wind speed at a specified height can be calculated using Equation (5).
U z = U 10 z 10 α
where U z   represents the mean wind speed at a specified vertical height z above sea level; U 10 denotes the mean wind speed at a vertical height of 10 m above sea level; and α is the ground roughness exponent and should be taken as 0.12.

2.3. Wave Loads

For the jacket foundation OWTs, the ratio of the structural characteristic dimension to the wavelength is less than 0.2, indicating that the influence of the structure on the wave can be neglected. Therefore, the Morison [38] equation is applicable. In the Morison equation, the wave force acting on the structure is divided into two components: one is the inertia force, caused by the wave acceleration field; the other is the drag force, resulting from the viscous effects between the fluid and the structure. The detailed expression is given in Equation (6).
F H y d r o = ρ w π D 2 4 u ¨ + ρ w C m π D 2 4 u ¨ v ¨ + 0.5 ρ w C D D u ˙ v ˙ u ˙ v ˙
Here, ρw denotes the seawater density, Cm is the inertia coefficient, CD is the drag coefficient, D is the diameter of the structural member, u ¨ represents the acceleration of the water particle, u ˙ is the water particle velocity, v ¨ is the structural member acceleration, and v ˙ is the structural member velocity. The first term on the right-hand side of Equation (6) represents the Froude–Krylov force; the second term accounts for the effect of added mass on the hydrodynamic load; and the third term reflects the influence of drag force. Based on linear wave theory in deep water, the water particle acceleration can be expressed as follows:
u ¨ = ω w a v e 2 ζ e k z cos ω w a v e t k x
where (x, z) denotes the coordinates of the water particle, and the vertical coordinate z is positive upwards. ω w a v e is the wave angular frequency, ζ is the wave amplitude, k is the wave number, and t is the time.

2.4. TMD Motion Equation

To suppress the vibration responses of OWTs, TMDs are commonly employed, as illustrated in Figure 1. A TMD [39] consists of two independent single-degree-of-freedom linear mass-spring-damper elements. The position vectors of the TMD in two reference frames are expressed as shown in Equation (8).
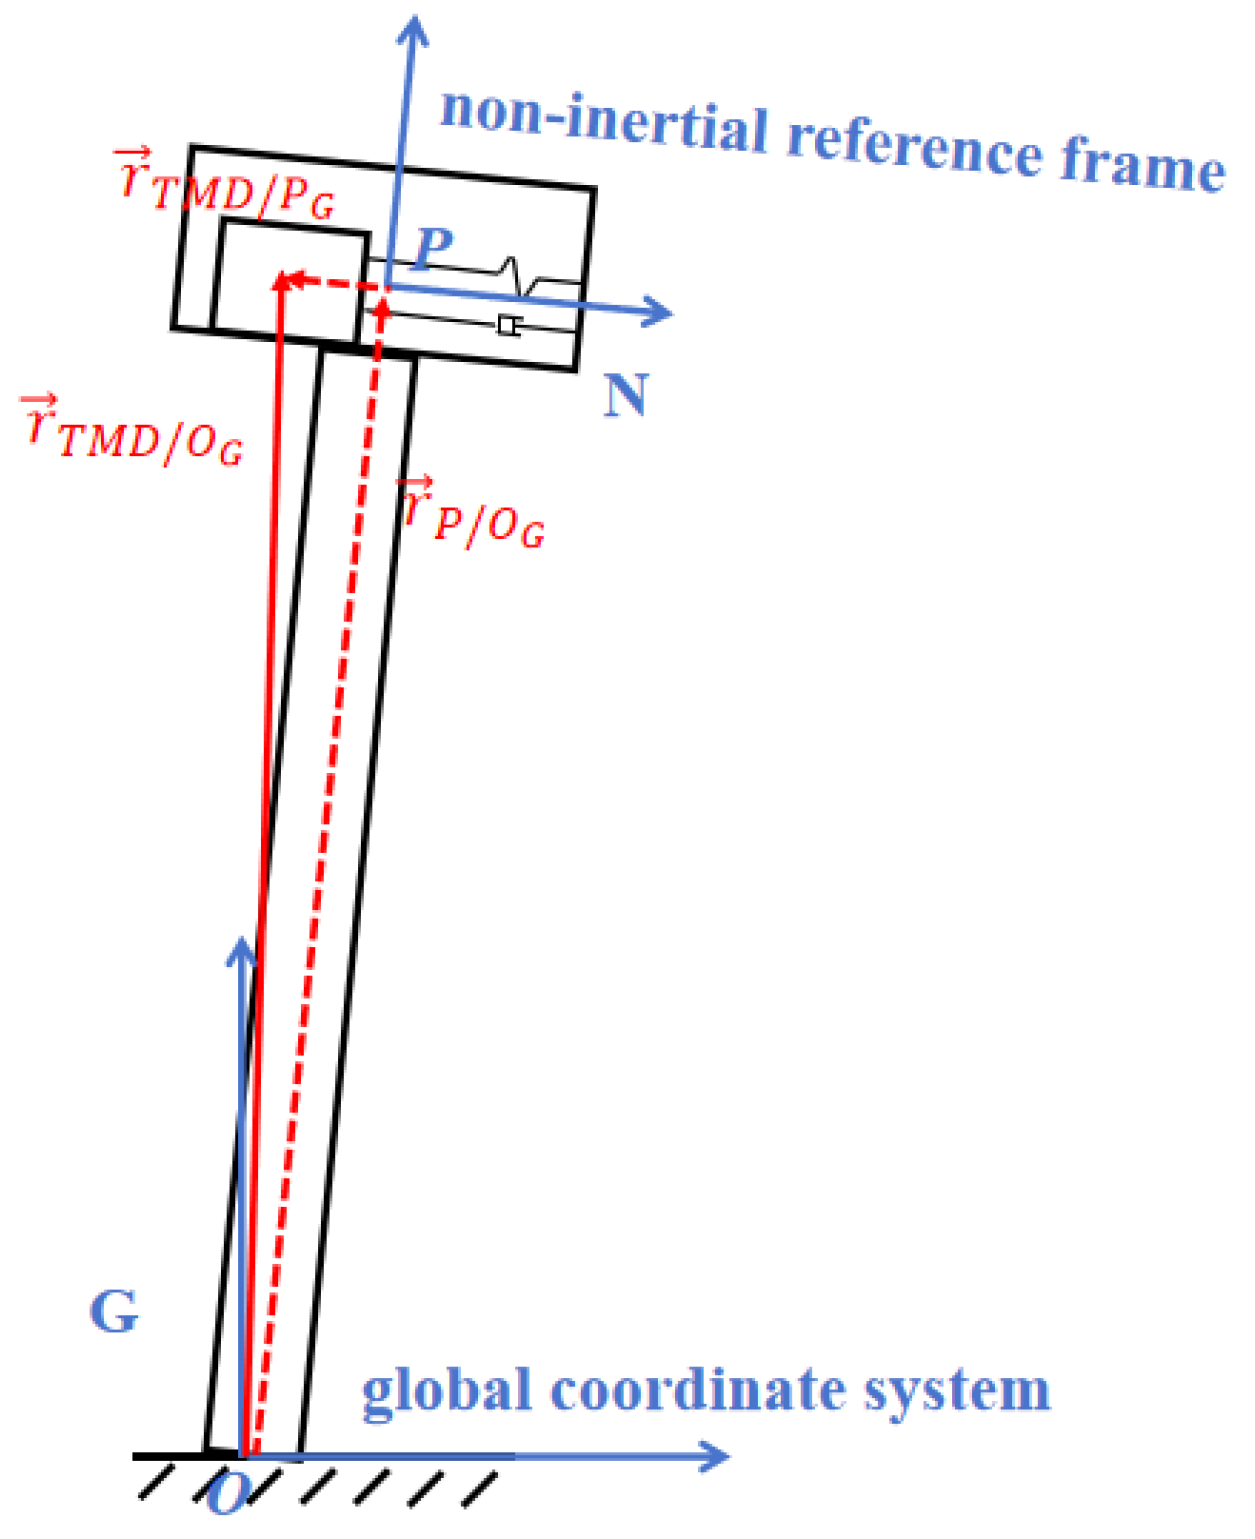
r T M D / O G = r P / O G + r T M D / P G
where O denotes the origin of the global coordinate system, and G represents the direction of the global coordinate axes. P denotes the origin of the non-inertial reference frame fixed inside the nacelle where the TMD is at rest. r T M D / O G represents the position vector of the TMD relative to point O in the global coordinate system. r T M D / P G represents the position vector of the TMD relative to point P in the global coordinate system. r P / O G represents the position vector of the nacelle relative to point O in the global coordinate system. The schematic of the coordinate systems is illustrated in Figure 2.
When the wind turbine nacelle is taken as the reference frame, the position vector of the TMD is expressed as shown in Equation (9).
r T M D / O N = r P / O N + r T M D / P N
where r T M D / O N represents the position of the TMD relative to point O in the nacelle coordinate system, r T M D / P N denotes the position of the TMD relative to point P in the nacelle coordinate system, and r P / O N indicates the nacelle position vector relative to point O in the nacelle frame. By rearranging terms in Equation (9), Equation (10) can be derived.
r T M D / P N = r T M D / O N r P / O N
The expression upon differentiating Equation (10) with respect to time is given in Equation (11).
r ˙ T M D / P N = r ˙ T M D / O N r ˙ P / O N ω N / O N × r T M D / P N
where ω N / O N denotes the angular velocity of the nacelle. r ˙ T M D / P N represents the velocity of the TMD relative to point P in the nacelle coordinate system. r ˙ T M D / O N denotes the velocity of the TMD relative to point O in the nacelle coordinate system. r ˙ P / O N indicates the velocity of the nacelle relative to point O in the nacelle coordinate system.
By further differentiating Equation (11), the acceleration of the TMD relative to point P can be obtained.
r ¨ T M D / P N = r ¨ T M D / O N r ¨ P / O N ω N / O N × ω N / O N × r T M D / P N α N / O N × r T M D / P N 2 ω N / O N × r ˙ T M D / P N
where α N / O N denotes the angular acceleration of the nacelle, r ˙ represents the velocity vector, and r ¨ represents the acceleration vector.
The acceleration in the inertial reference frame can be determined through the application of force equilibrium.
r ¨ T M D / O N = x ¨ y ¨ z ¨ T M D / O N = 1 m F x F y F z T M D / O N = 1 m F T M D / O N
Here, m denotes the mass of the TMD and F T M D / O N represents the force acting on the TMD in the nacelle coordinate system. The expression for F T M D / O N is given in Equation (14).
F T M D / O N = c x x ˙ k x x + m a x + F e x t + F s t o p
where c x and k x represent the damping and stiffness of the TMD spring, respectively; a x denotes the acceleration of the TMD; F e x t is the external force additionally applied to the TMD; and F s t o p refers to the stopping force exerted on the TMD when its stroke reaches the limit.
By substituting Equation (13) into Equation (12), the general equation of motion for the TMD is obtained, as expressed in Equation (15).
r ¨ T M D / P N = 1 m F T M D / O N r ¨ P / O N ω N / O N × ω N / O N × r T M D / P N α N / O N × r T M D / P N 2 ω N / O N × r ˙ T M D / P N

2.5. Seismic Load

Under seismic loading, the equilibrium equation of a single-degree-of-freedom system can be expressed as follows:
m v ¨ t + c v ˙ t + k v t = 0
where m, k, and c represent the mass, stiffness, and damping of the single-degree-of-freedom system, respectively; v(t) denotes the displacement relative to the global coordinate system, which is given by Equation (17).
v t = v t + v g t
Substituting Equation (17) into Equation (16), the expression is as shown in Equation (18).
m v ¨ t + m v ¨ g t + c v ˙ t + k v t = 0
where v(t) denotes the displacement of the single-degree-of-freedom system relative to the ground, and vg(t) represents the seismic ground displacement.
The equation of motion for a single-degree-of-freedom system under seismic excitation expressed in terms of relative velocity is given by Equation (19):
m v ¨ t + c v ˙ t + k v t = m v ¨ g t

2.6. Equation of Motion for Offshore Wind Turbine Structure Considering the Combined Effects of Wind, Waves, Earthquake, and TMD

The general form of the equation of motion for an OWT under the combination of aerodynamic, hydrodynamic, and seismic loads is expressed as follows:
M + m v ¨ t + C v ˙ t + K v t = f w i n d + f h y d r o + f s e i s m i c + f T M D m T M D x ¨ T M D + c T M D x ˙ T M D + k T M D x T M D = 0
Assuming that seismic effects on the seawater flow field are negligible, the Morison equation subjected to seismic excitation can be expressed as
f h y d r o = ρ w π D 2 4 u ¨ + ρ w C m π D 2 4 u ¨ v ¨ v ¨ g + 1 2 ρ w C D D u ˙ v ˙ v ˙ g u ˙ v ˙ v g
f s e i s m i c = M + m v ¨ g

2.7. TMD Parameter Optimization Method Based on the Artificial Bee Colony Algorithm

The Artificial Bee Colony (ABC) algorithm [40] is an optimization technique inspired by the intelligent foraging behavior of honeybee swarms. In solving multivariable function optimization problems, ABC demonstrates superior robustness and faster convergence compared to Genetic Algorithms, Particle Swarm Optimization, and Evolutionary Particle Swarm Optimization [41,42]. Its key advantage lies in its ability to perform both global and local searches simultaneously during each iteration, effectively avoiding entrapment in local minima. The algorithm involves three types of bees—employed, onlooker, and scout bees—that collaboratively explore and exploit potential solutions through a four-stage search process.
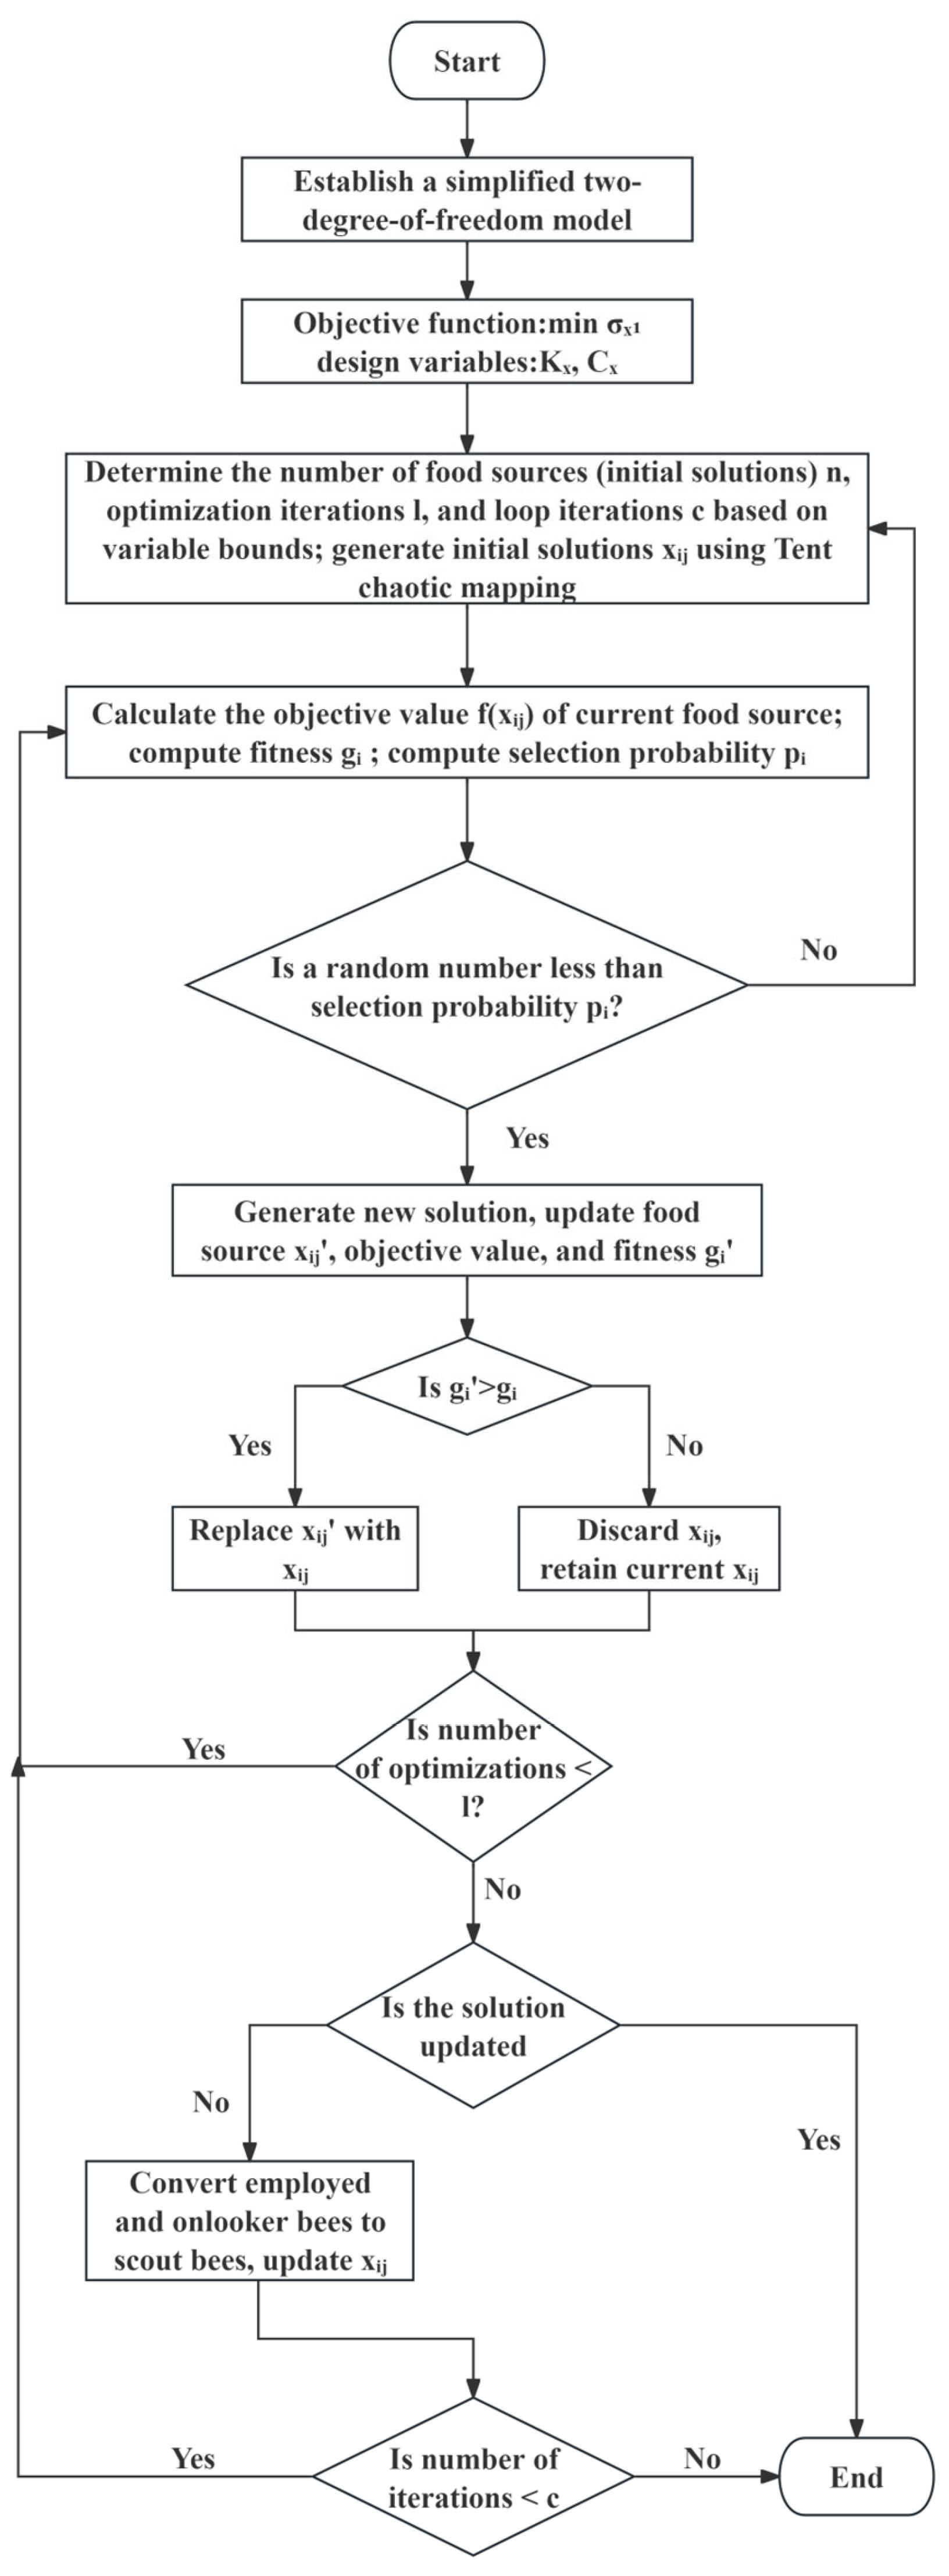
This study aims to minimize the standard deviation of structural displacement obtained from a simplified two-degree-of-freedom OWT TMD model under white noise random excitation. The ABC algorithm is employed to optimize the stiffness and damping parameters of the TMD for controlling the first-order bending mode of the OWT. The proposed optimization design procedure is illustrated in Figure 3.

3. OWT Parameters and Environmental Conditions

3.1. DTU 10MW Wind Turbine Parameters

In this study, a DTU 10 MW jacket foundation OWT is taken as the research object. It was jointly developed by the Technical University of Denmark and Vestas Wind Technology Company and has been widely adopted both domestically and internationally for research purposes due to its representative design, including a rotor diameter of 178.3 m, a rated rotational speed of 9.6 rpm, and a rated wind speed of 11.4 m/s, as summarized in Table 1.

3.2. Jacket Foundation Parameters

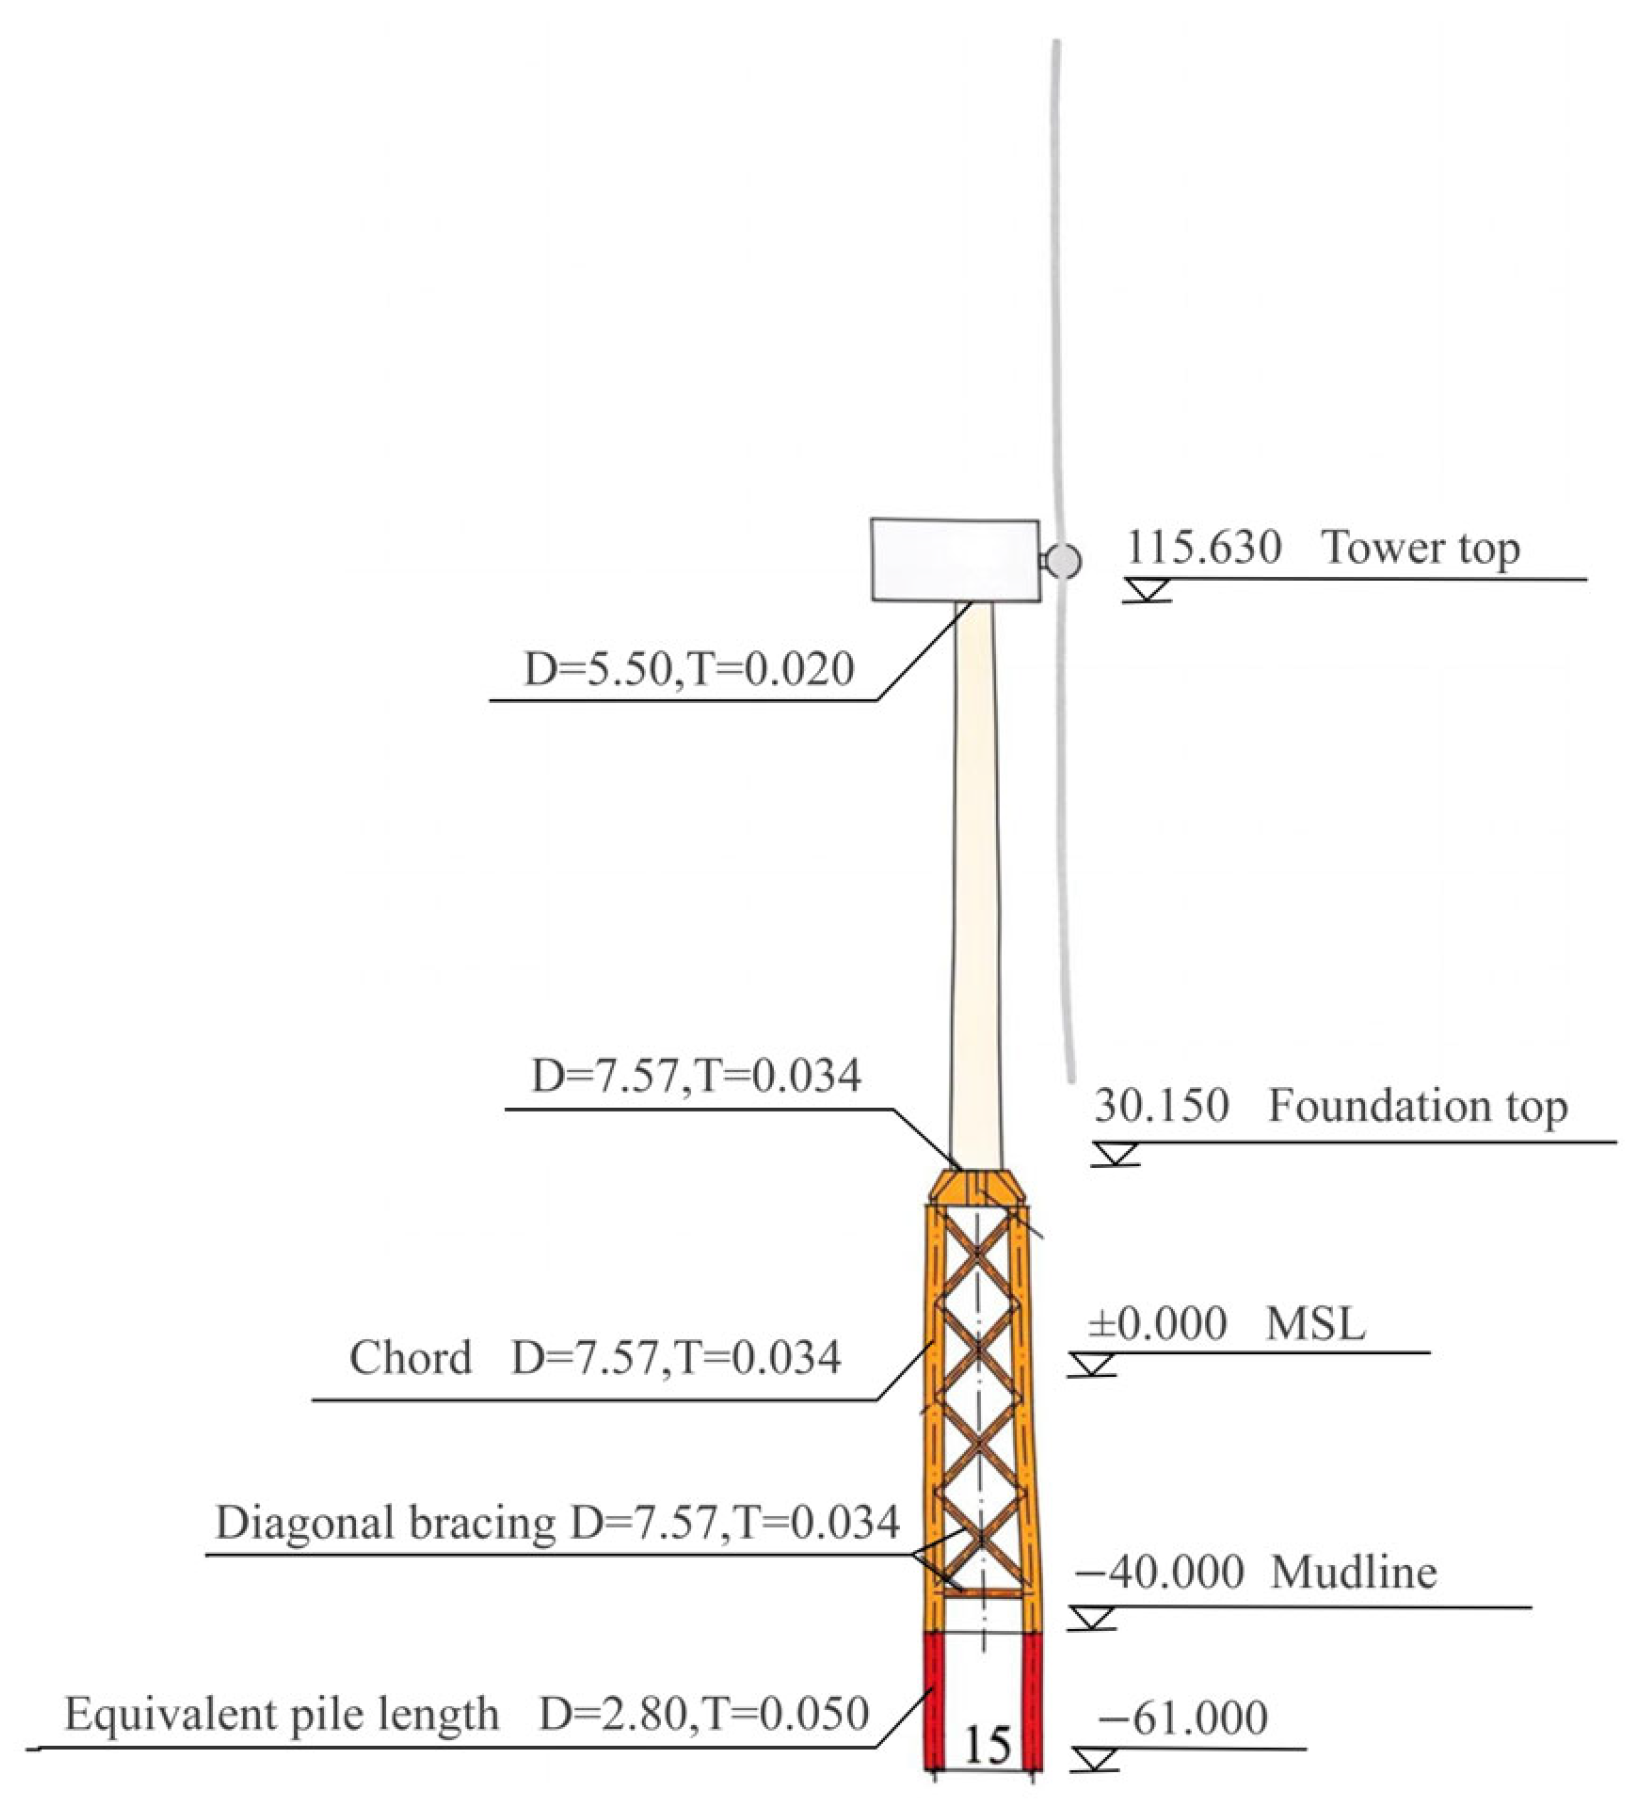
To ensure the stable operation of the wind turbine system at a water depth of 40 m, a jacket-type foundation structure is designed, as illustrated in Figure 4. Accordingly, the bottom elevation of the jacket platform is set at 30.15 m, resulting in an adjusted tower height of 85.48 m. The tower top has an outer diameter of 5.50 m with a wall thickness of 0.020 m, while the base has an outer diameter of 7.57 m and a wall thickness of 0.034 m. The total height of the jacket foundation structure is 70.15 m, with a base dimension of 15 × 15 m. The tower is made of Q355 steel, and the foundation structure is made of DH36 steel. Both steel types have an elastic modulus of 2.1 × 10¹¹ N/m2 and a Poisson’s ratio of 0.3. Considering coatings and attached components, the steel density is corrected to 8500 kg/m3. To account for the effects of pile–soil interaction without modeling the soil continuum explicitly, this study adopts a boundary condition based on the equivalent pile length method [43], in which the pile is extended to a length equivalent to seven times its diameter.

3.3. Marine Environment Conditions

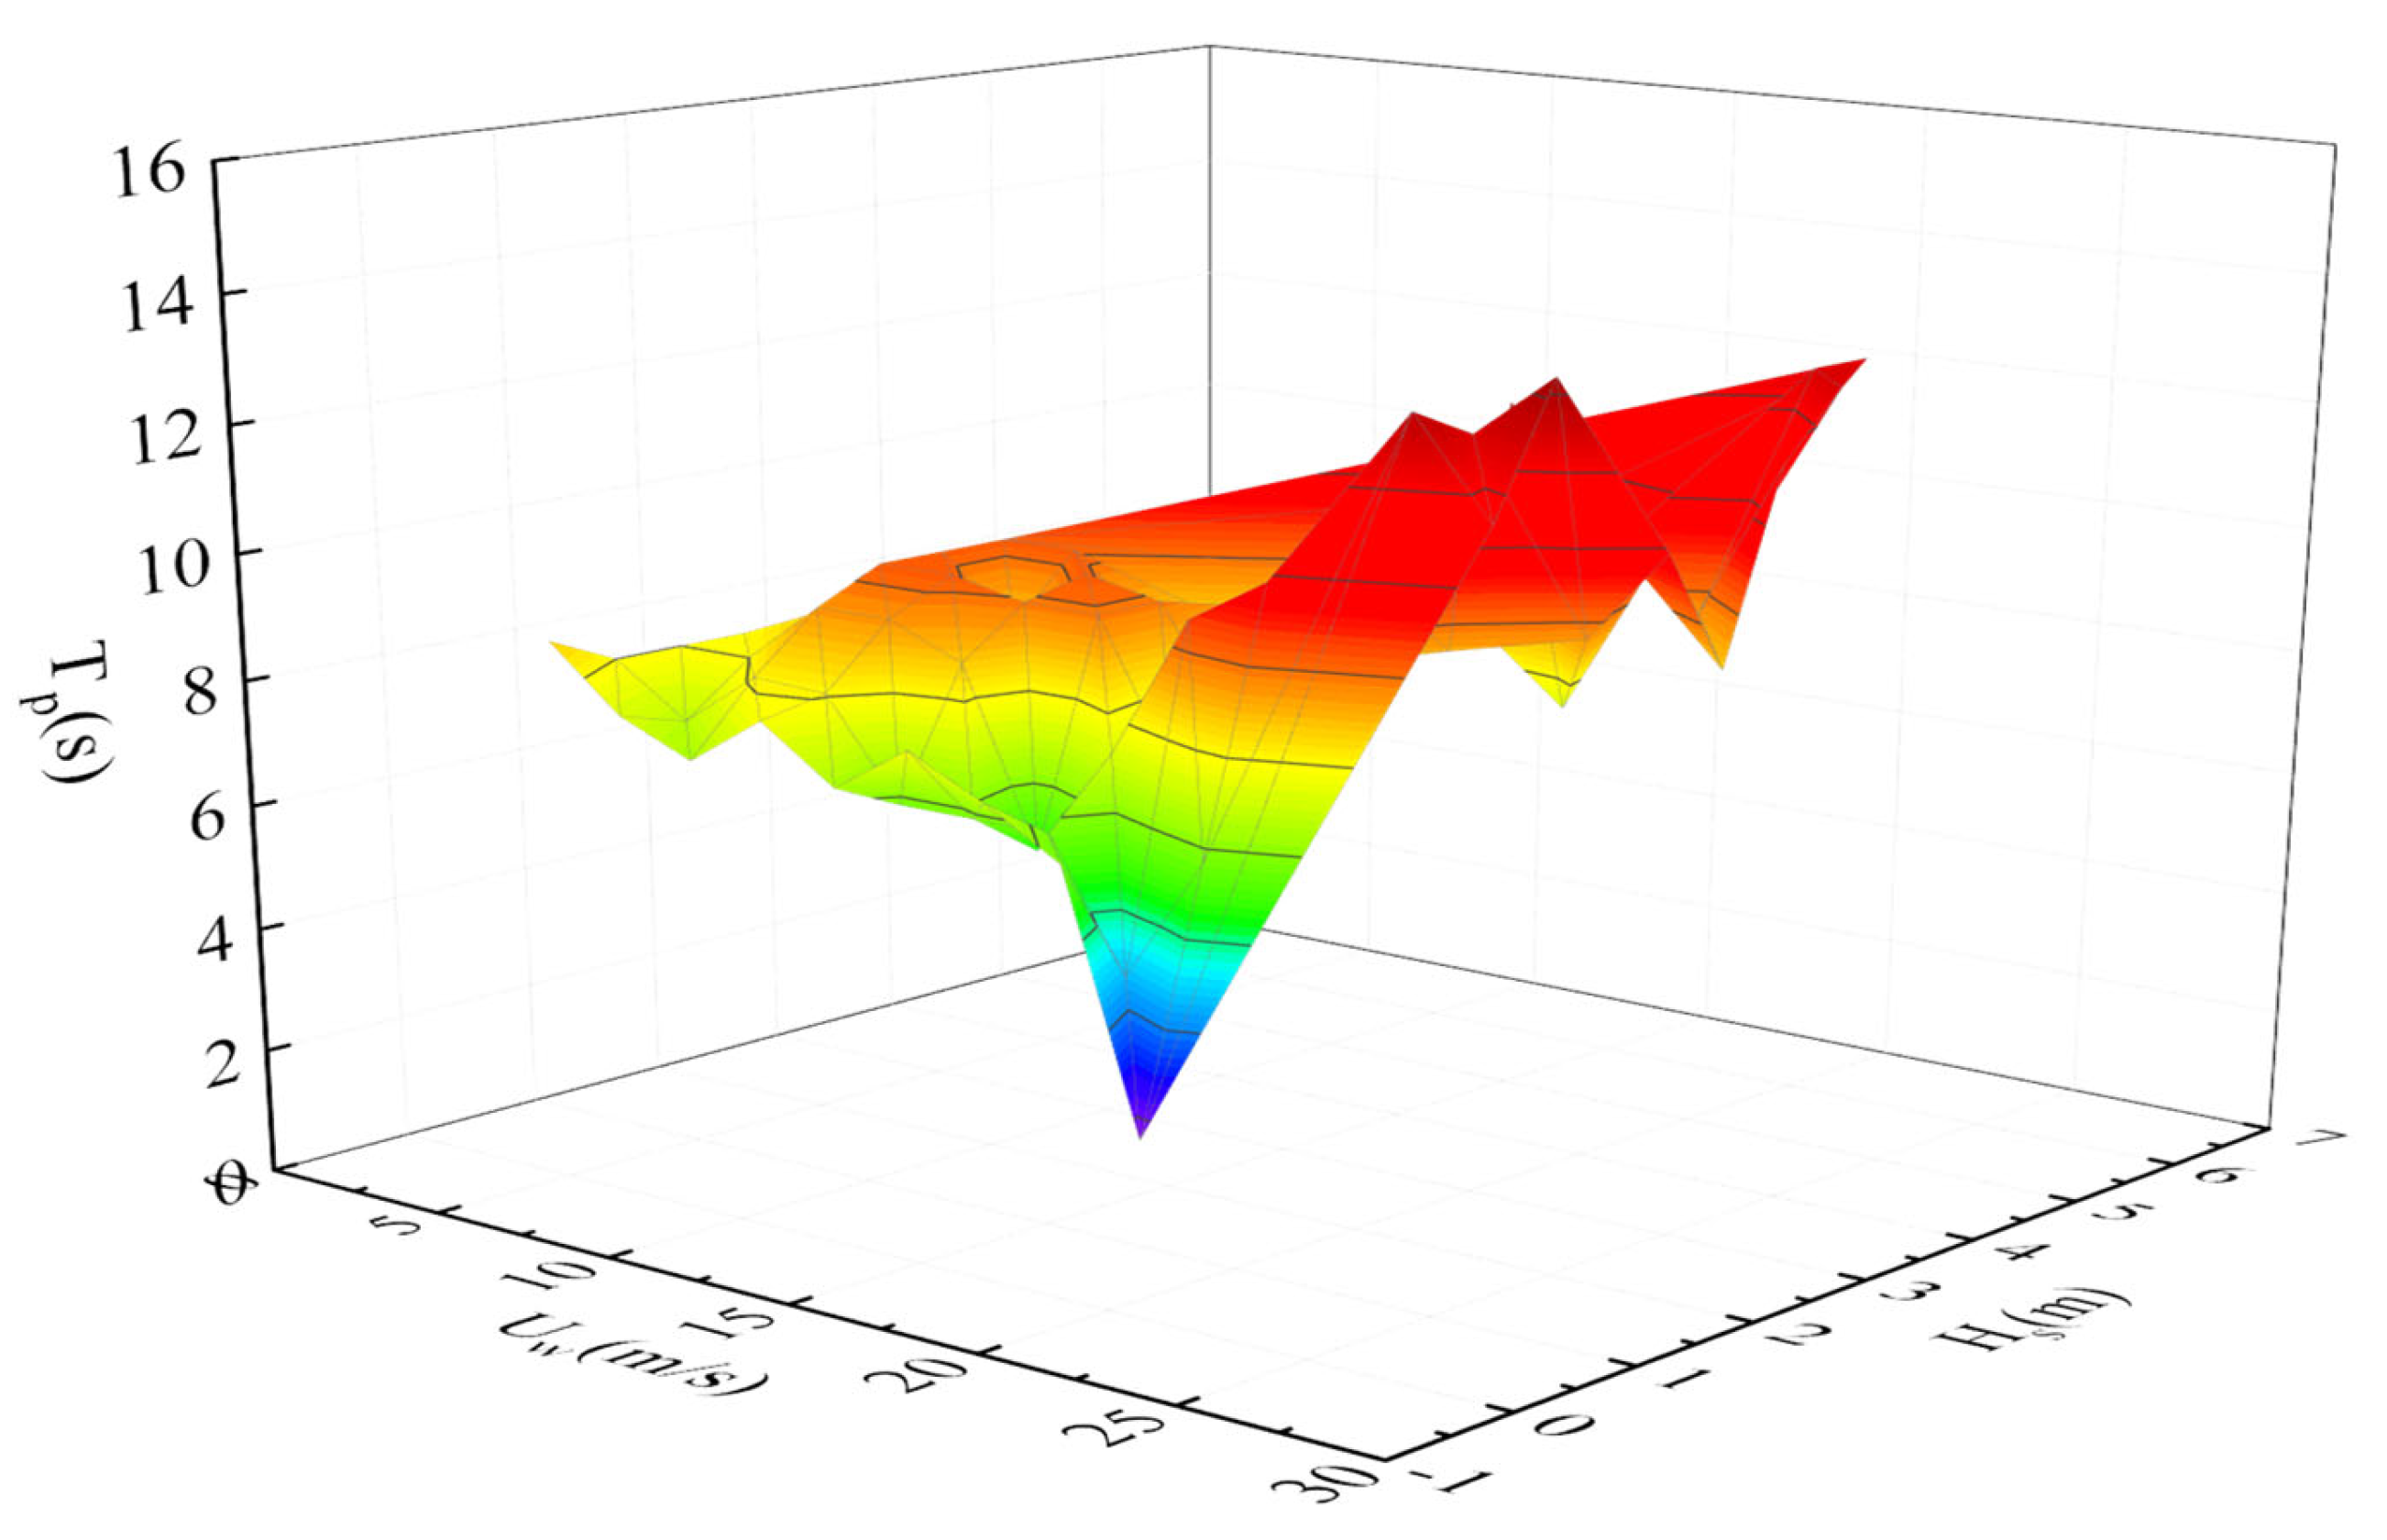
The offshore wind farm site is planned in the southeastern sea area of China. The joint distribution of measured wind speed and wave parameters in this area is illustrated in Figure 5.
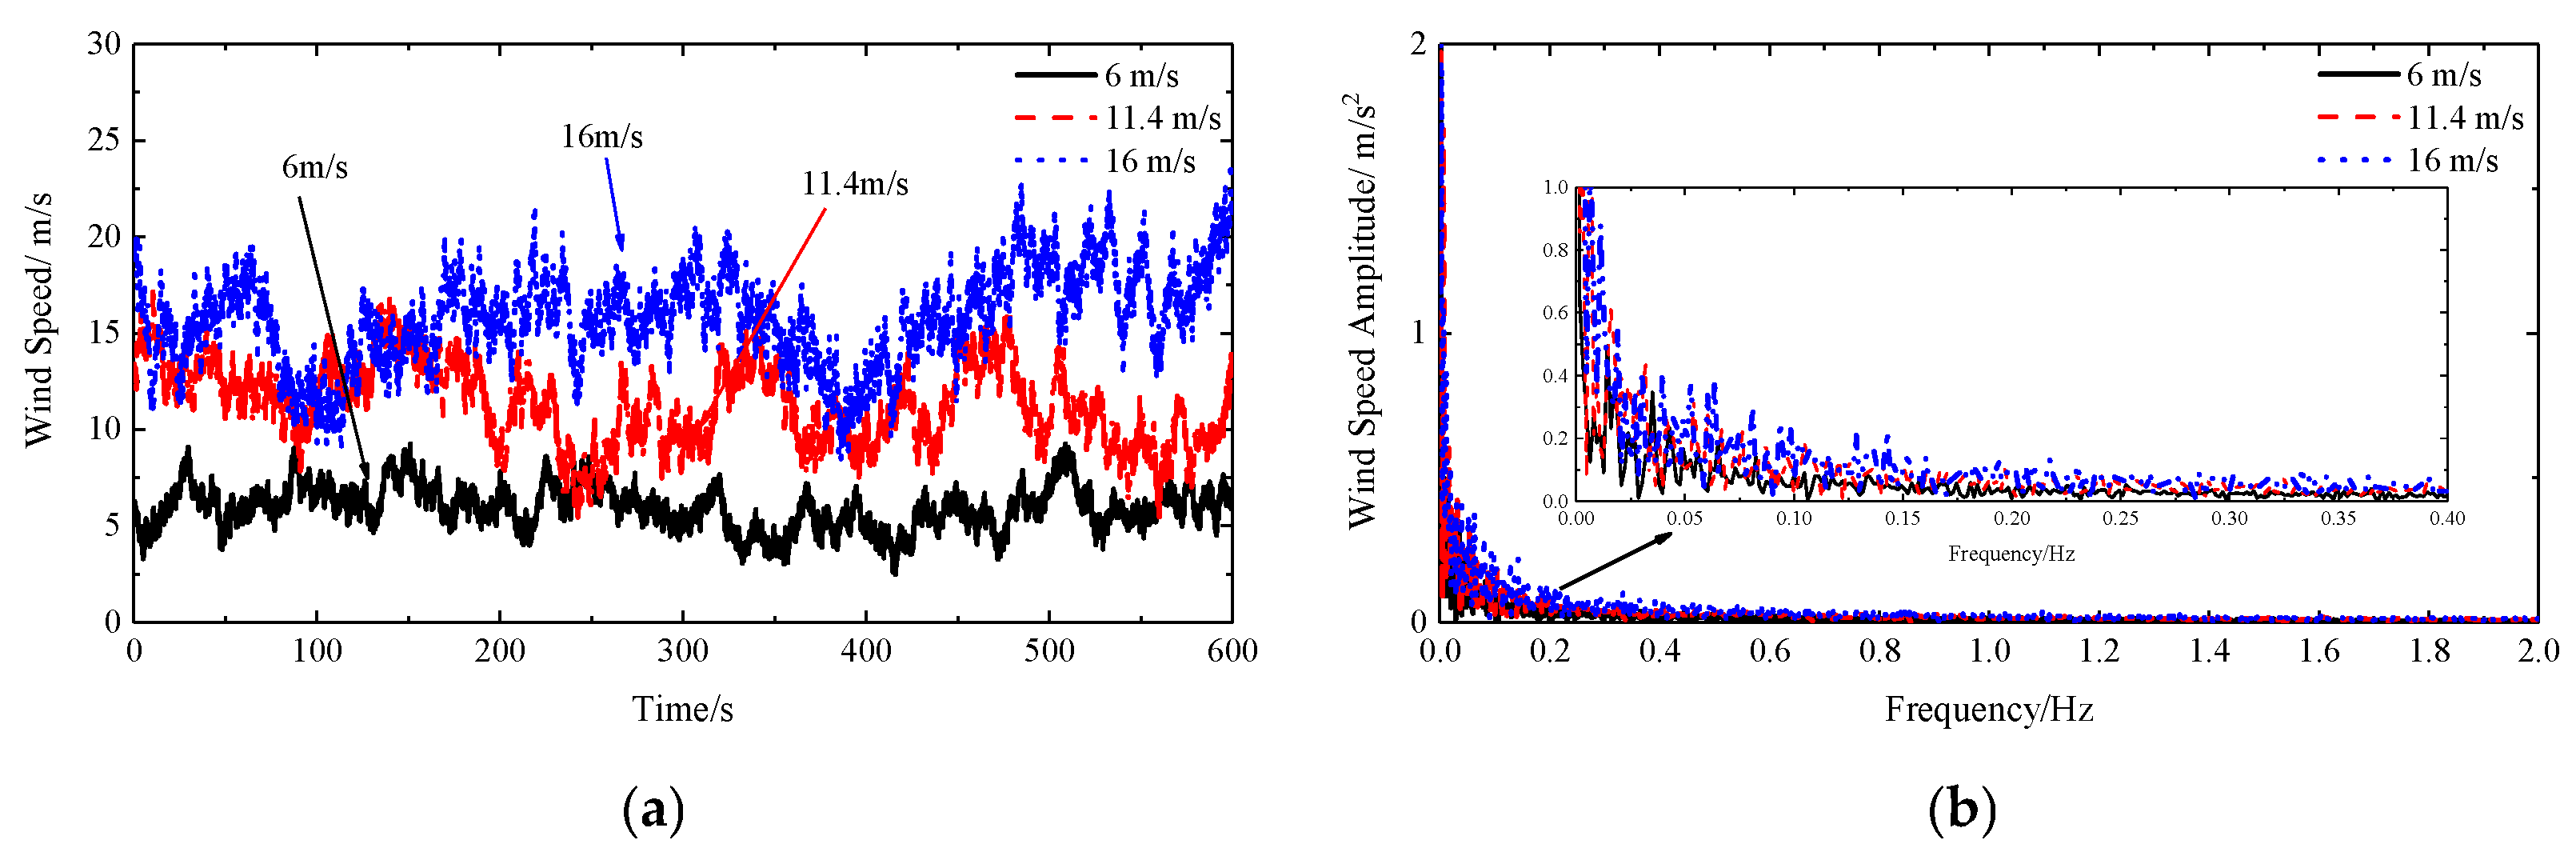
Referring to the offshore wind turbine design standard DNV GL-ST-0437, combined with measured sea condition data from a southeastern sea area in China and the operational wind speed range of the DTU 10 MW reference wind turbine, typical combined wind, wave, and seismic load cases were selected, as shown in Table 2. The design water depth is 40 m. Wind speed time histories were generated based on the IEC Kaimal spectrum [44], with three mean wind speeds of 6 m/s, 11.4 m/s, and 16 m/s, representing wind conditions below rated speed, at rated speed, and above rated speed, respectively. Irregular wave time histories were generated using the JONSWAP spectrum [45], covering both short- and long-period waves. Seismic waves were obtained from the PEER, including the Humbolt Bay, Borrego, and El Centro records. The peak ground acceleration is 1.5 m/s2, with frequencies ranging from 0 to 10 Hz, spanning low to high frequencies to effectively excite the OWT modes. The total simulation duration is 630 s, with seismic excitation applied starting at 150 s. The selected wind speed, wave, and seismic time histories and frequency domain representations are shown in Figure 6, Figure 7 and Figure 8.

4. TMD Parameter Analysis and Model Validation

4.1. TMD Parameter Analysis

Based on previous studies by relevant scholars, the mass ratio of the TMD to OWT typically ranges from 0.5% to 2%. In this study, the total mass of the OWT is 3,005,237 kg. A TMD mass ratio of 1.5% is adopted, resulting in a TMD mass of 45,078 kg. The stiffness optimization range for the TMD, using the ABC algorithm, is set between 50,000 and 300,000 N/m, and the damping optimization range is from 1000 to 80,000 N·m/s. According to the optimization algorithm described in Section 2.7, after 30 iterations, the optimized stiffness and damping values for the TMD with a mass of 45,078 kg are 159,646 N/m and 26,027 N·m/s, respectively. The iterative process of searching for the optimal damping and stiffness is illustrated in Figure 9. In this study, TMD is applied only in the X-direction.

4.2. Model Validation

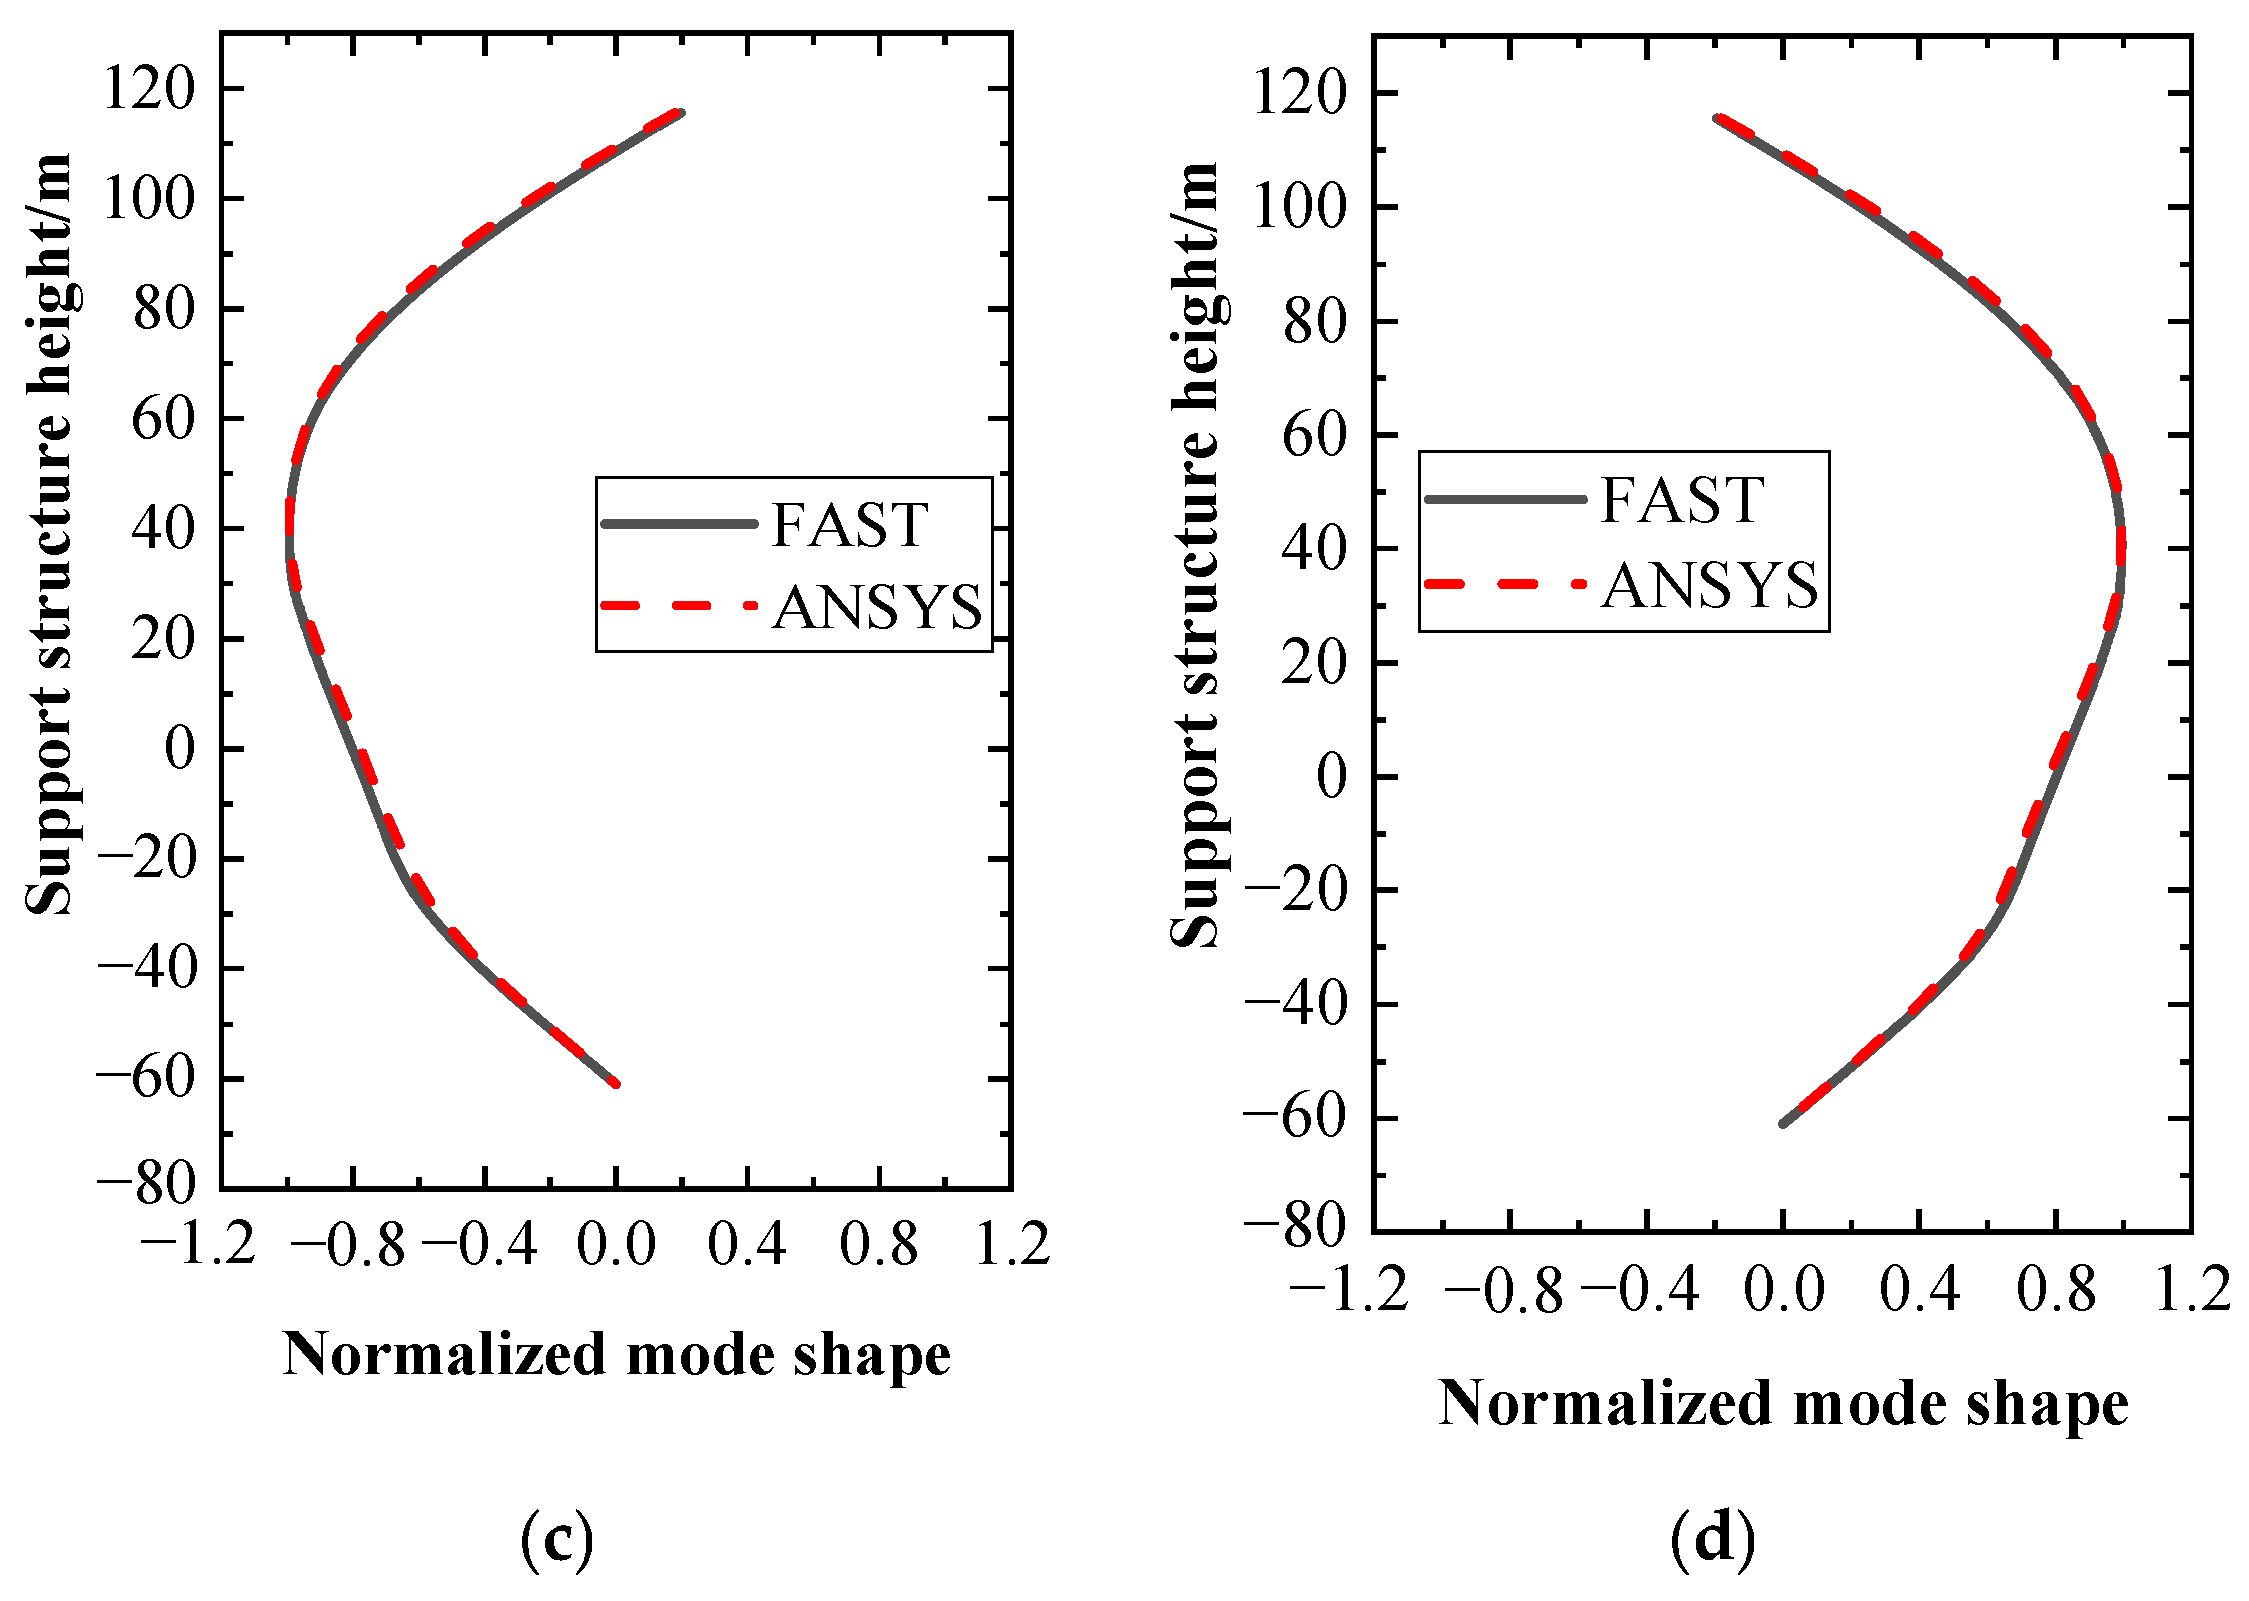
To validate the modeling accuracy, an identical jacket structure was modeled in ANSYS 19.2, and a comparative analysis of natural frequencies and mode shapes was conducted against the model developed in FAST. The comparative results of natural frequencies are summarized in Table 3, while the mode shape comparisons are illustrated in Figure 10, which depicts the first- and second-order fore–aft (F-A) and side-to-side (S-S) vibrational modes. The results indicate that the relative errors in the first two natural frequencies between the FAST and ANSYS models are 2.68% and 2.78%, respectively. These minor discrepancies can be attributed to differences in the modeling simplifications adopted by the two software tools; nevertheless, the overall consistency remains satisfactory. Furthermore, as observed in Figure 10, the first two mode shapes exhibit strong agreement between the two models, thereby providing additional confirmation of the validity of the FAST model.

5. Vibration Mitigation Analysis of OWT Considering the Combined Wind, Wave, and Seismic Loads

5.1. Tower-Top Displacement

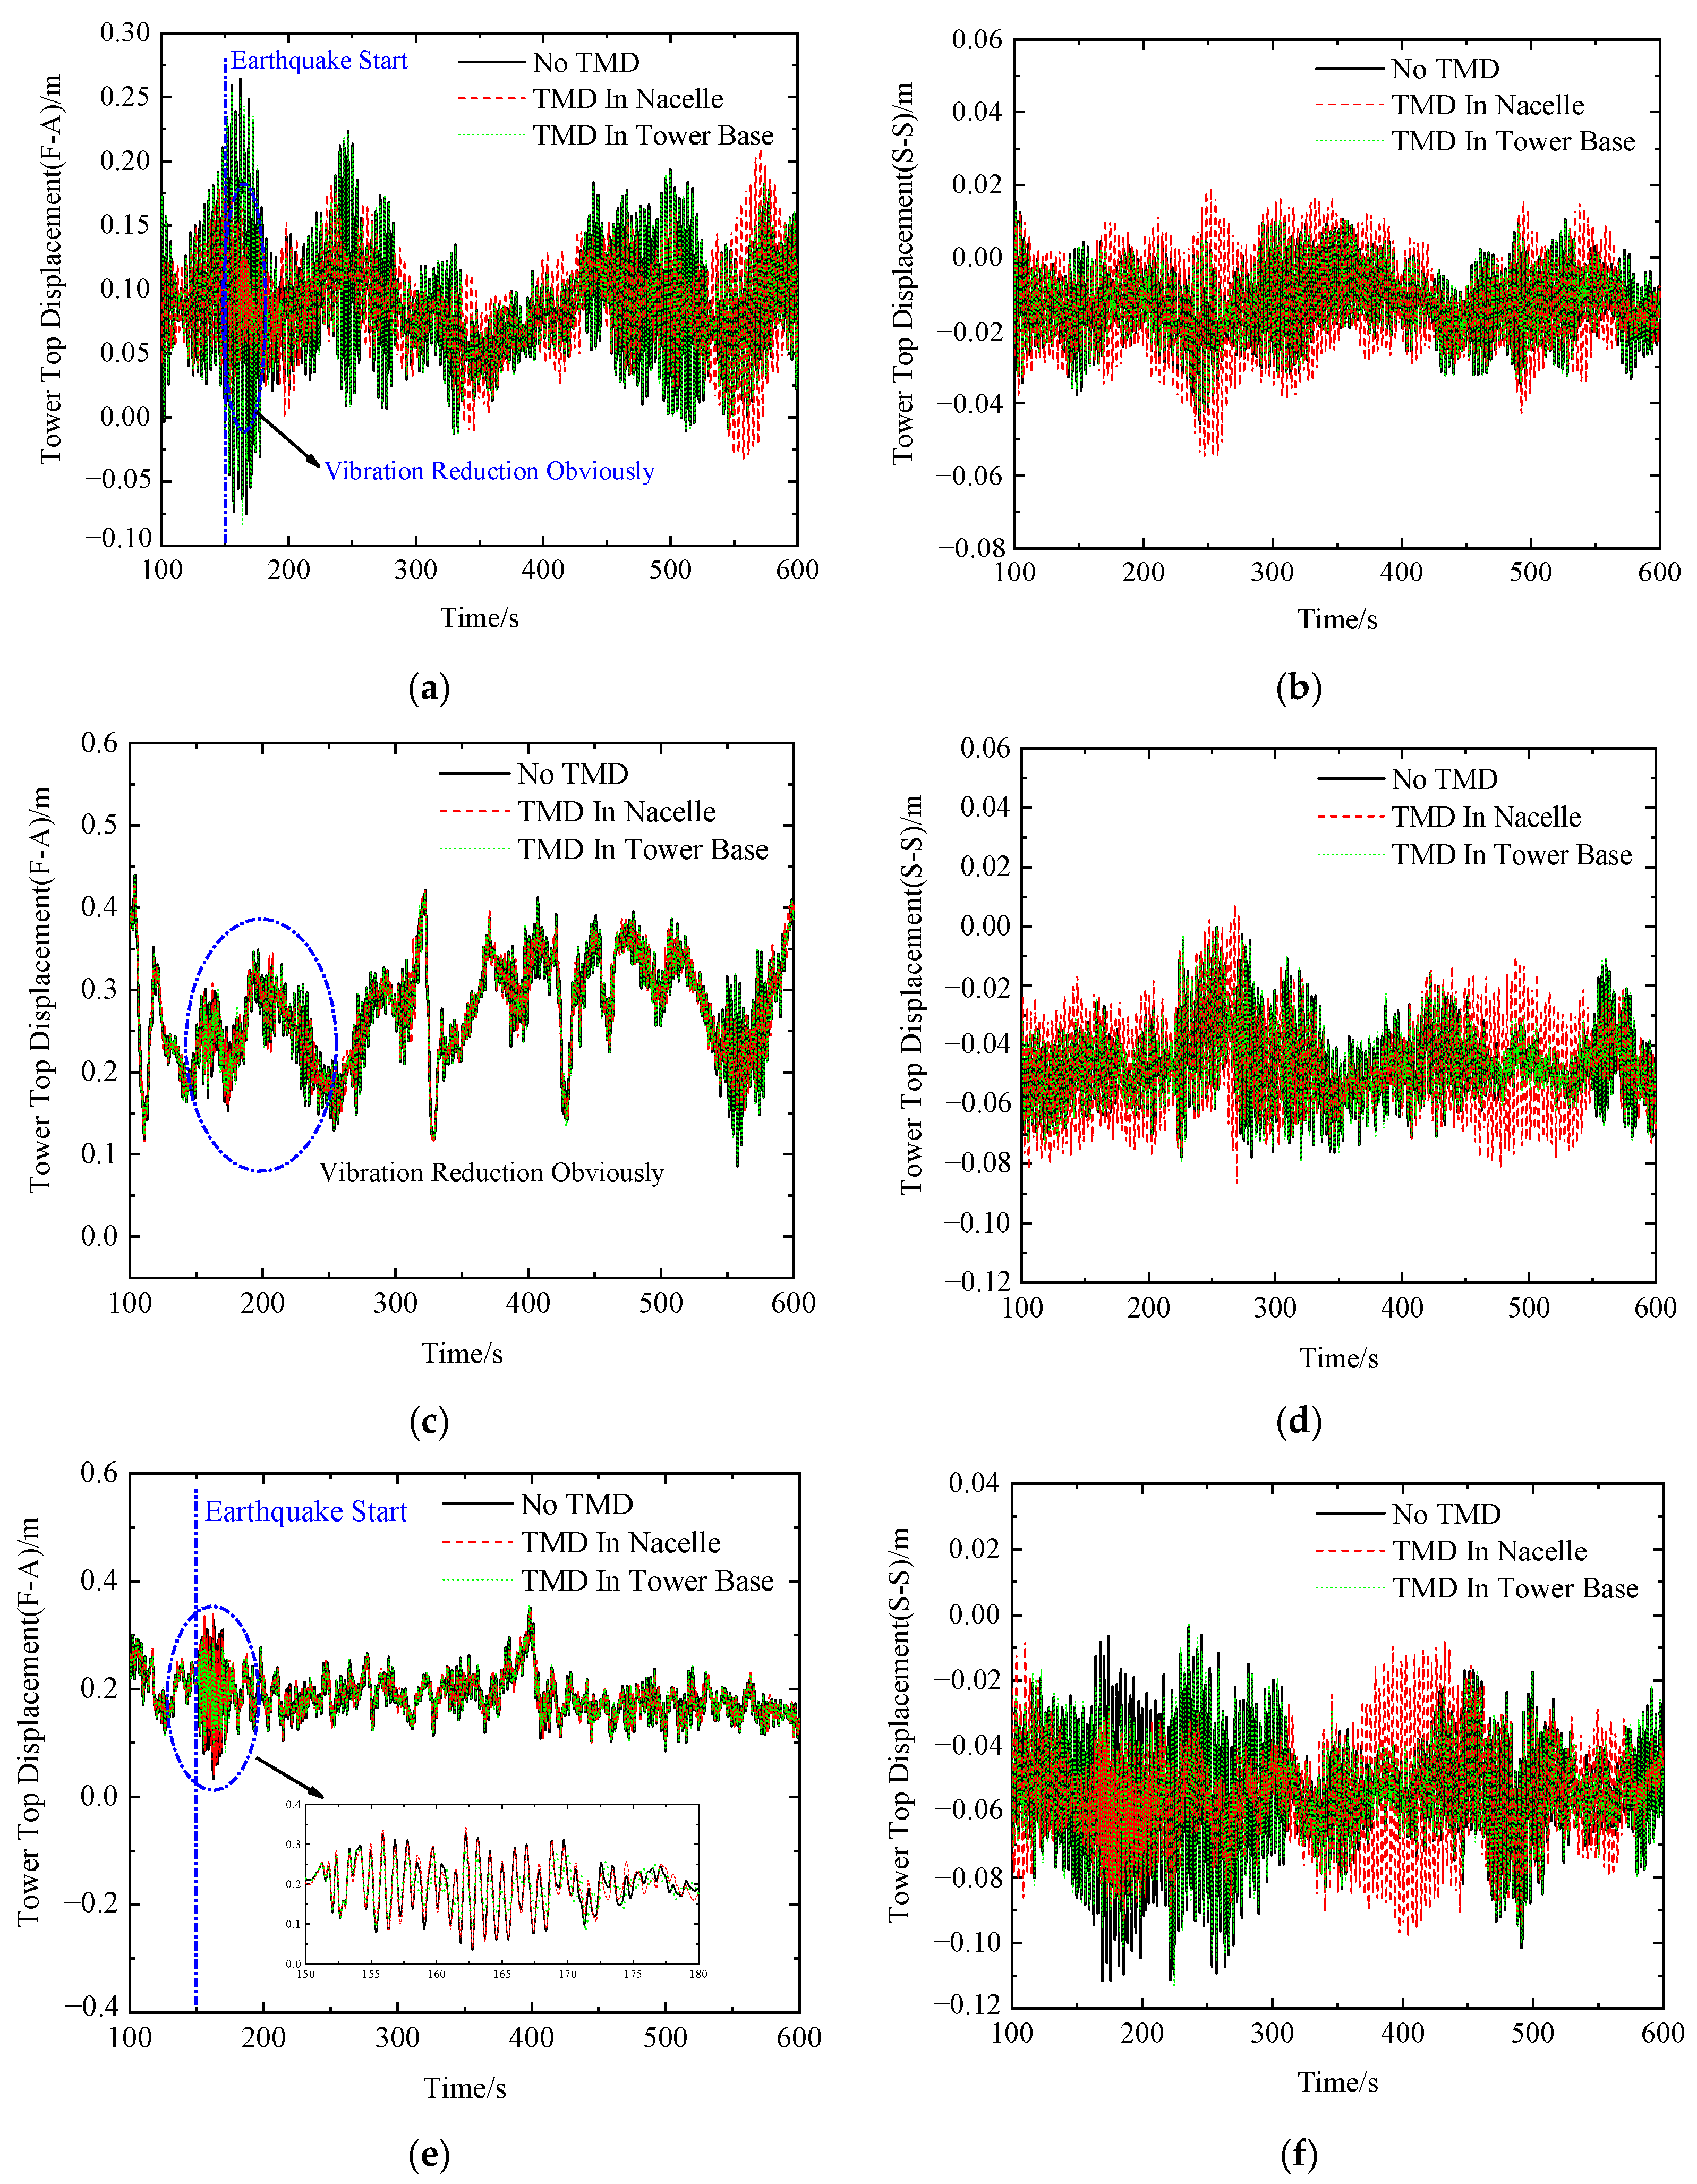
The time-history and frequency-domain responses of the tower-top displacements in the X- and Y-directions of the jacket foundation OWT under the combined action of wind, wave, and seismic excitations are illustrated in Figure 11 and Figure 12, respectively. Table 4 summarizes the mean, standard deviation, and 95th max values of the X-direction tower-top displacement. These statistics were obtained from two distinct periods: the steady-state phase between 100 s and 600 s (excluding the initial 100 s transient response) and the seismic excitation phase between 150 s and 200 s.
As shown in Figure 11a, the nacelle-mounted TMD substantially reduces the X-direction tower-top displacement when the seismic excitation begins at 150 s, compared to the uncontrolled case. During the post-earthquake stage (after 200 s), the nacelle TMD continues to suppress tower vibrations; however, a slight amplification of the response is occasionally observed. This behavior is consistent with the findings of McNamara et al. [46], who reported that, for a 5 MW monopile wind turbine, the uncontrolled configuration can sometimes exhibit better performance due to the dynamic characteristics of the tower and the specific loading conditions. Regarding the Y-direction response, although the nacelle-mounted TMD effectively mitigates vibrations in the X-direction, it leads to a slight amplification in the Y-direction since no active control is applied along that axis.
The statistical data in Table 4 further highlight the distinctive performance characteristics of the two TMD configurations. Both dampers exhibit a more pronounced effect on the standard deviation and 95th max values than on the mean displacement, with the nacelle-mounted TMD providing substantially greater mitigation than the tower-base configuration. This trend is particularly evident during the seismic excitation interval from 150 to 200 s. For instance, under DLC1 conditions, while the mean X-displacement remains approximately 0.0850 m across all configurations, the standard deviation decreases dramatically from 0.0725 m without a TMD to 0.0310 m with the nacelle-mounted TMD, whereas the tower-base configuration achieves only a minor reduction to 0.0720 m. Similar trends are observed for the 95th max values, reinforcing the performance differential.
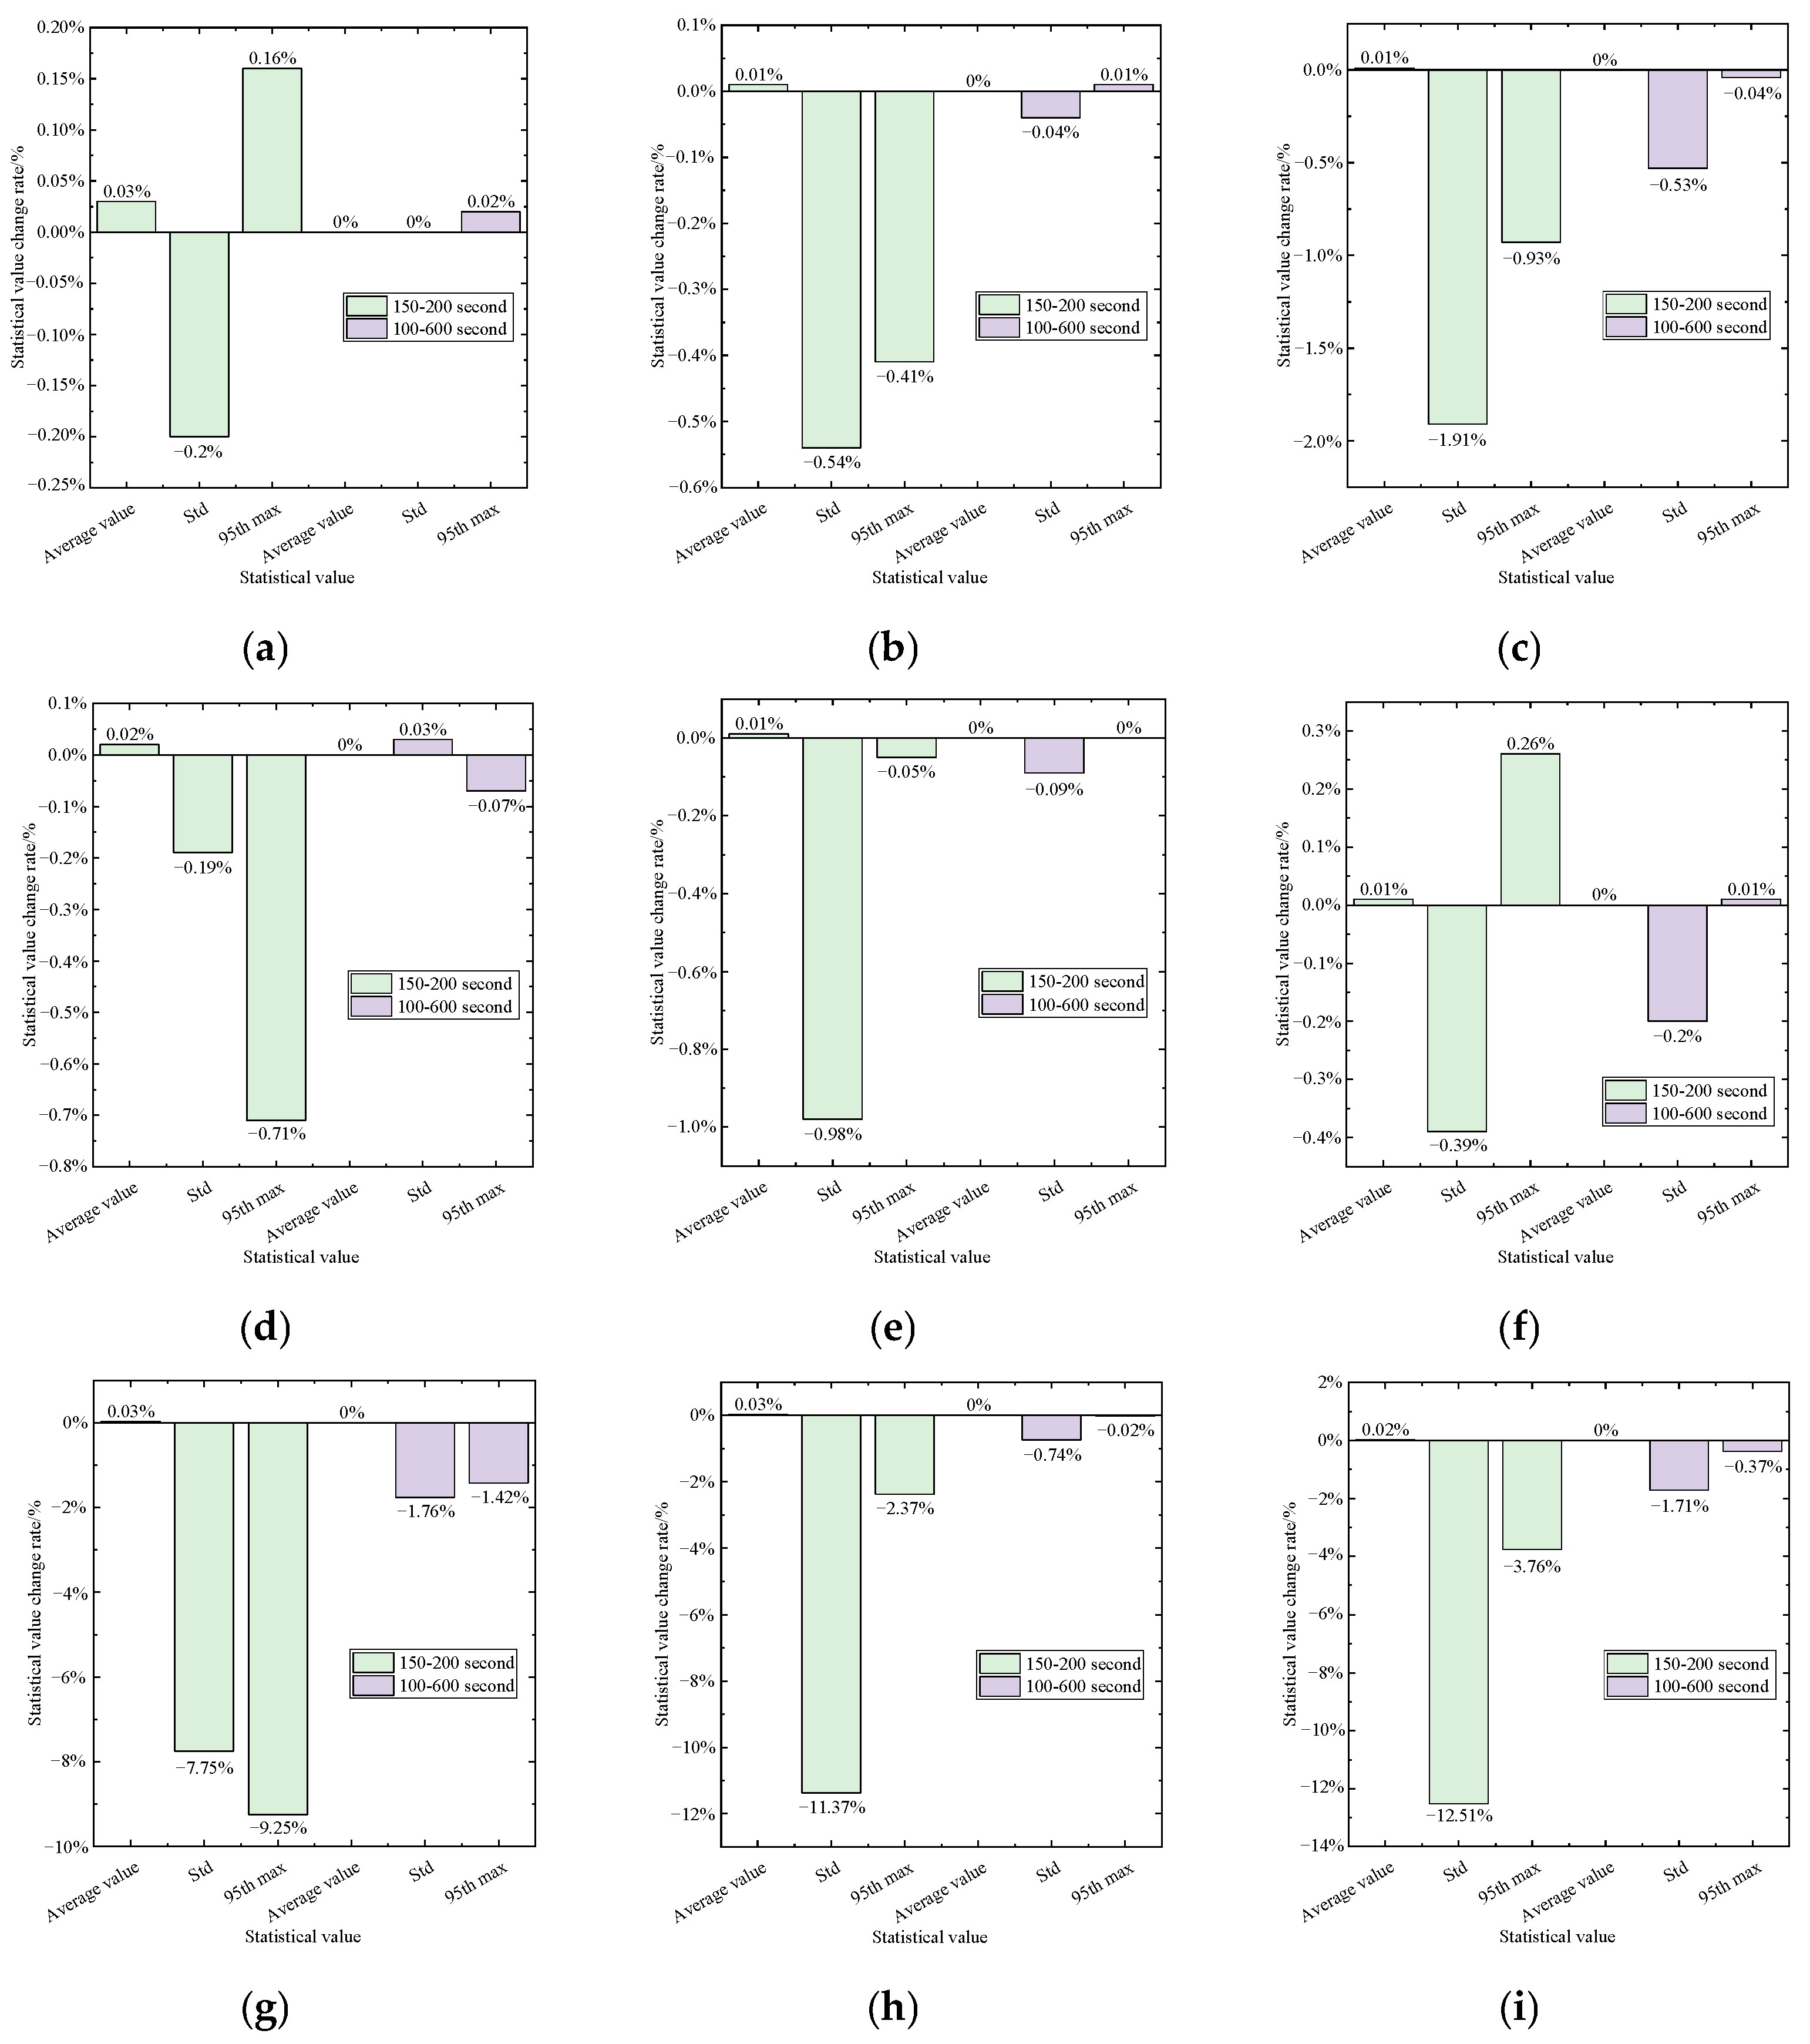
Figure 13 and Figure 14 provide further support for this behavior. Figure 13 indicates that the reduction in standard deviation under TMD control is more pronounced than the reduction in the 95th max, confirming the TMD’s particular effectiveness in suppressing fluctuations of the dynamic response, in agreement with previous studies (Xie et al., 2020 [47]). Figure 14 highlights the strong dependence of the tower-base TMD on excitation type. During the 100–600 s wind-wave-dominated interval, the tower-base TMD achieves only a 3.73% reduction in standard deviation, whereas during the 150–200 s seismic window, its mitigation efficiency rises sharply to 20.96%. This contrast demonstrates that the tower-base TMD is more effective under broadband, high-energy seismic excitations than under relatively narrow-band wind and wave loads.
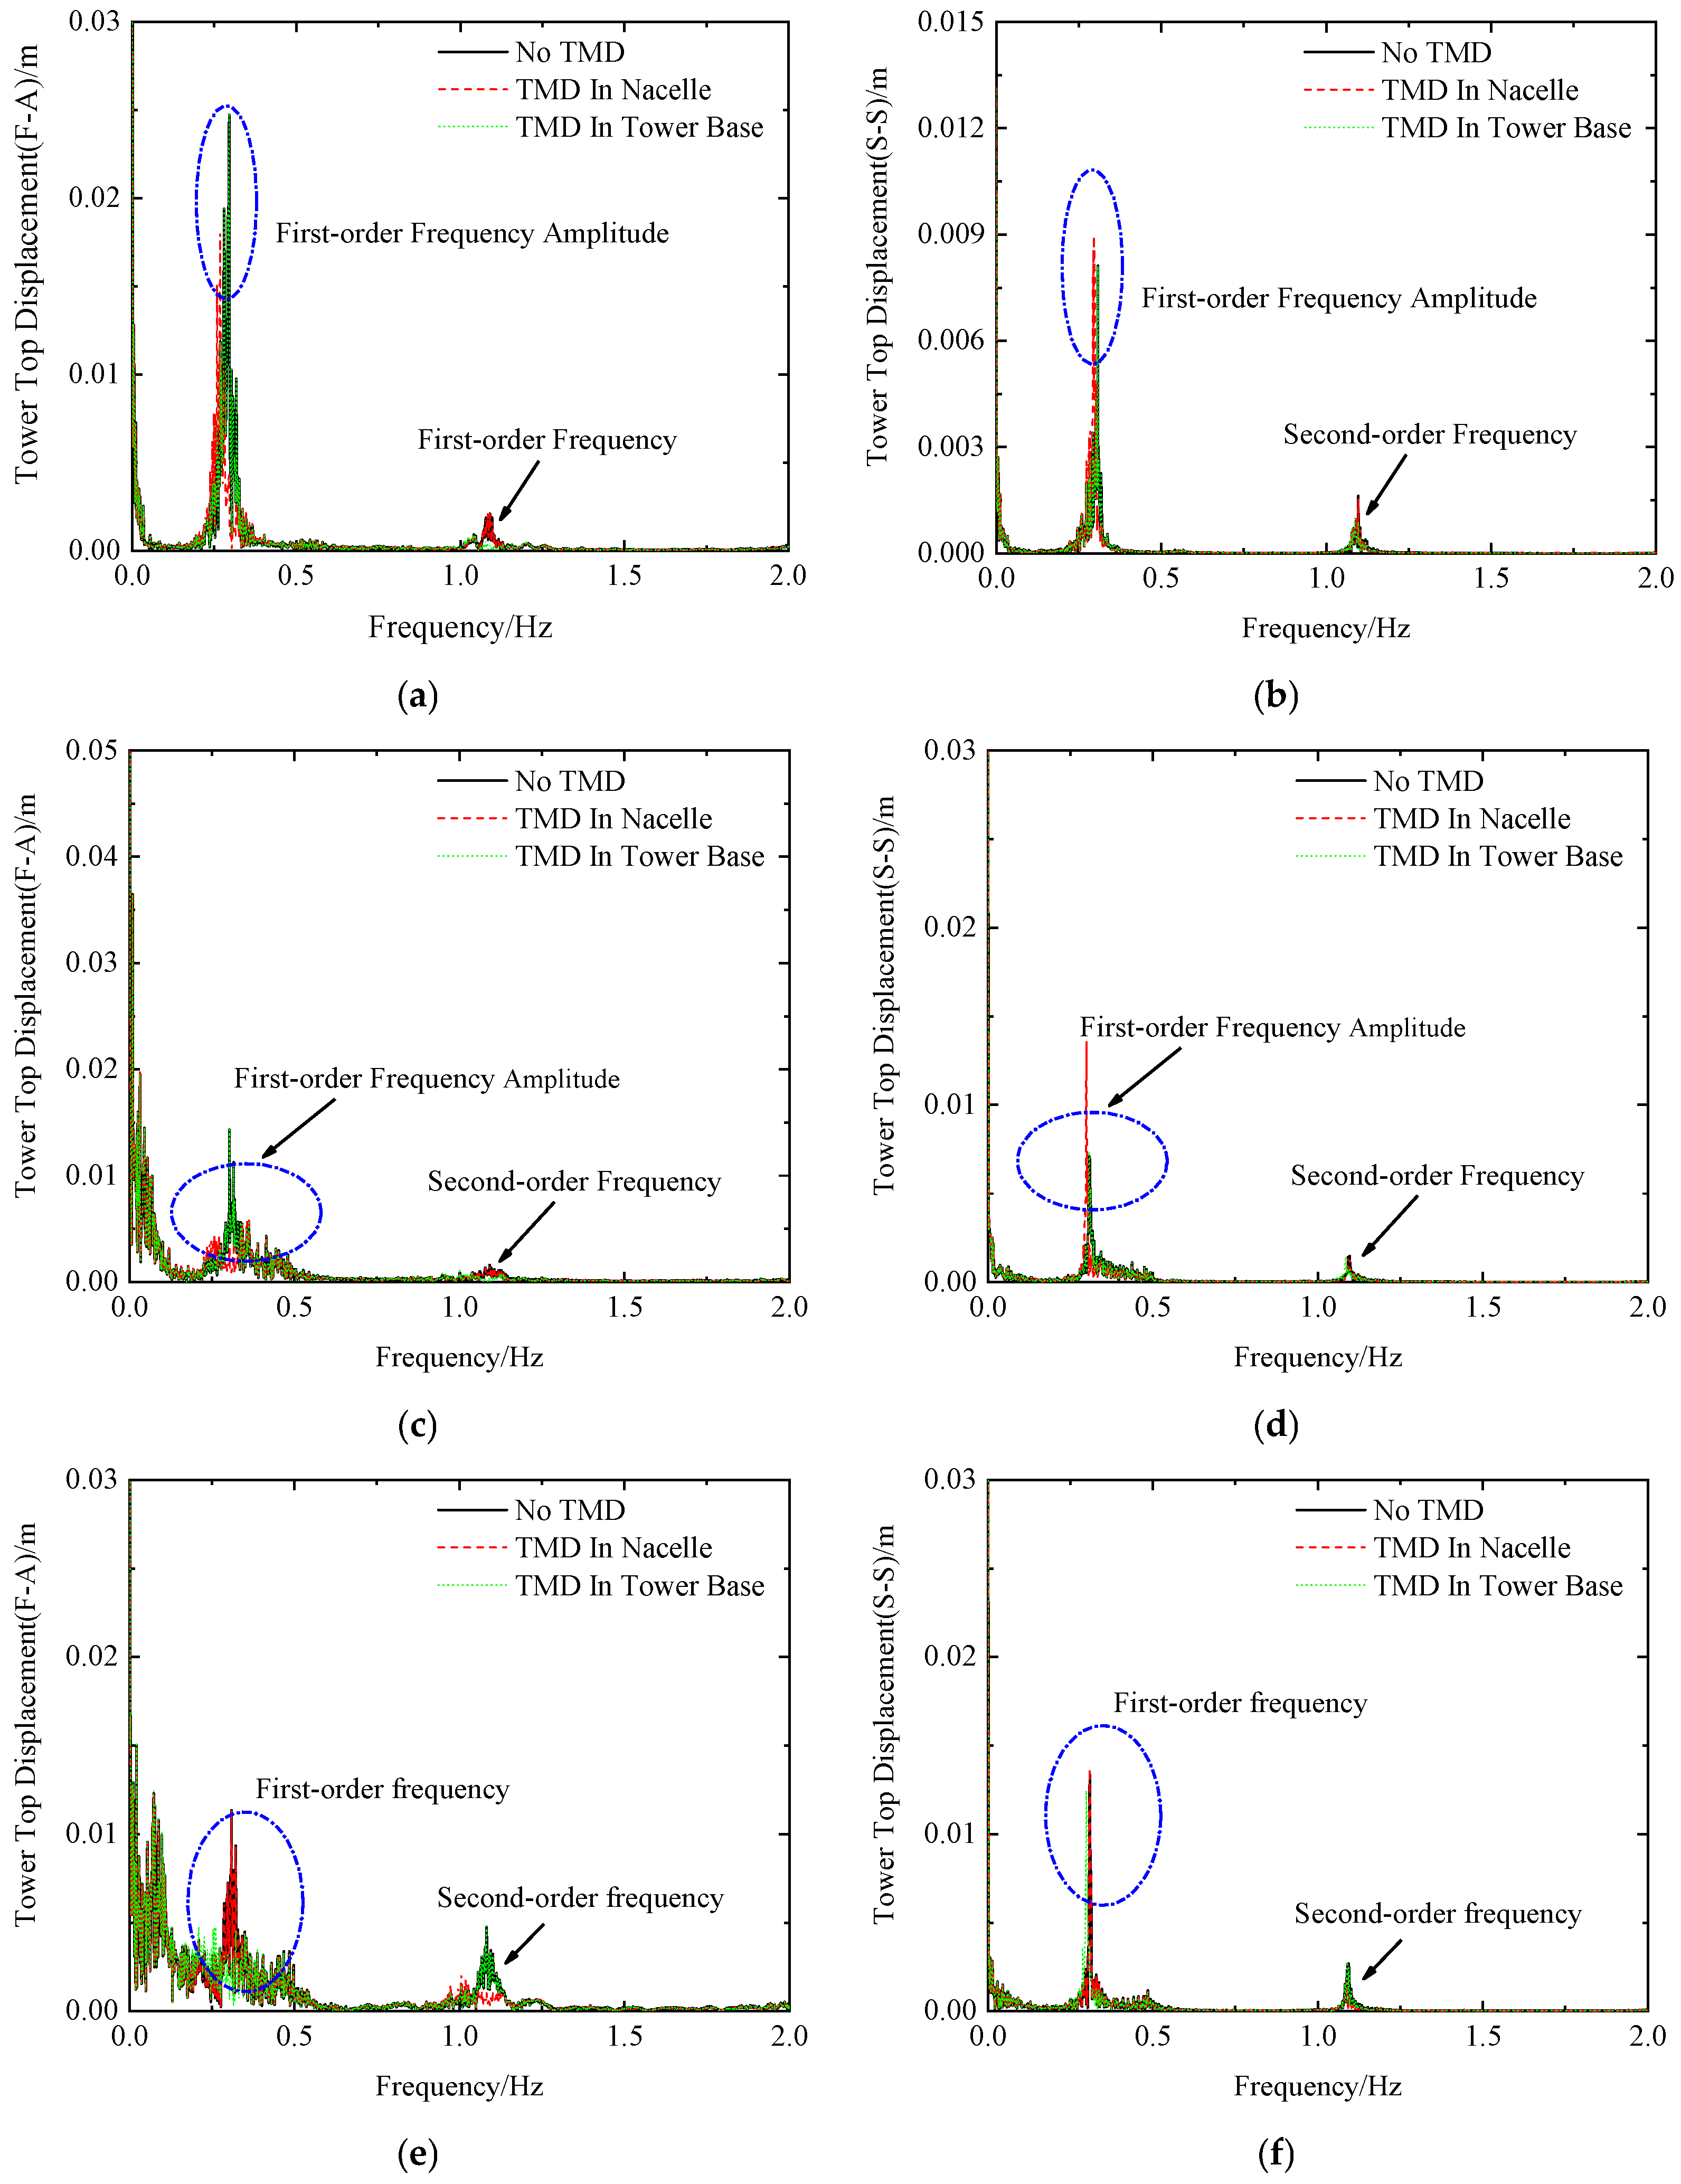
Frequency-domain responses (Figure 12) reveal that the dynamic behavior of the jacket-supported OWT under combined wind, wave, and seismic loading is governed primarily by the first- and second-order structural frequencies, along with the 3P. In the X-direction, the nacelle-mounted TMD effectively suppresses the first-order frequency amplitude while minimally affecting the second-order mode. In contrast, the tower-base TMD predominantly attenuates the second-order frequency component. Due to the relatively low energy content of the second-order mode compared with the fundamental frequency, the limited effectiveness of the tower-base TMD in reducing time-domain vibrations is clarified.
For the Y-direction, both TMD configurations have little effect on the second-order frequency. However, the nacelle-mounted TMD slightly amplifies the first-order frequency amplitude, consistent with the observed increase in time-domain vibrations, indicating modal energy redistribution. Under El-Centro excitation (Figure 12e), the nacelle TMD shows limited influence on the first-order frequency but significantly suppresses the second-order component, whereas the tower-base TMD exhibits the opposite behavior. This divergence is attributed to the distinct spectral characteristics of the El-Centro record, which contains high-frequency content and elevated amplitude, activating alternative dynamic mechanisms. These observations underscore the importance of considering ground motion spectral characteristics in TMD design, as performance is highly sensitive to seismic input. The frequency-domain trends align with previous studies, including those by Liu et al. (2024) [48] and Wang et al. (2020) [49].
Overall, the results demonstrate that both TMD configurations, and especially the nacelle-mounted variant, achieve superior vibration mitigation under seismic conditions compared with routine wind-wave loading. This discrepancy arises from the operational principle of TMDs, which attain maximum efficiency when the structure undergoes large-amplitude vibrations near the tuned frequency, a condition commonly met during strong seismic events. These findings quantify TMD performance under combined loading and advance understanding of the relationship between load type, TMD location, and control effectiveness. While conventional designs favor nacelle placement for dominant vibration modes, hybrid strategies such as deploying complementary TMDs at both the nacelle and tower base to address multiple structural modes may offer comprehensive vibration suppression under multi-hazard scenarios.

5.2. Tower-Base Bending Moment

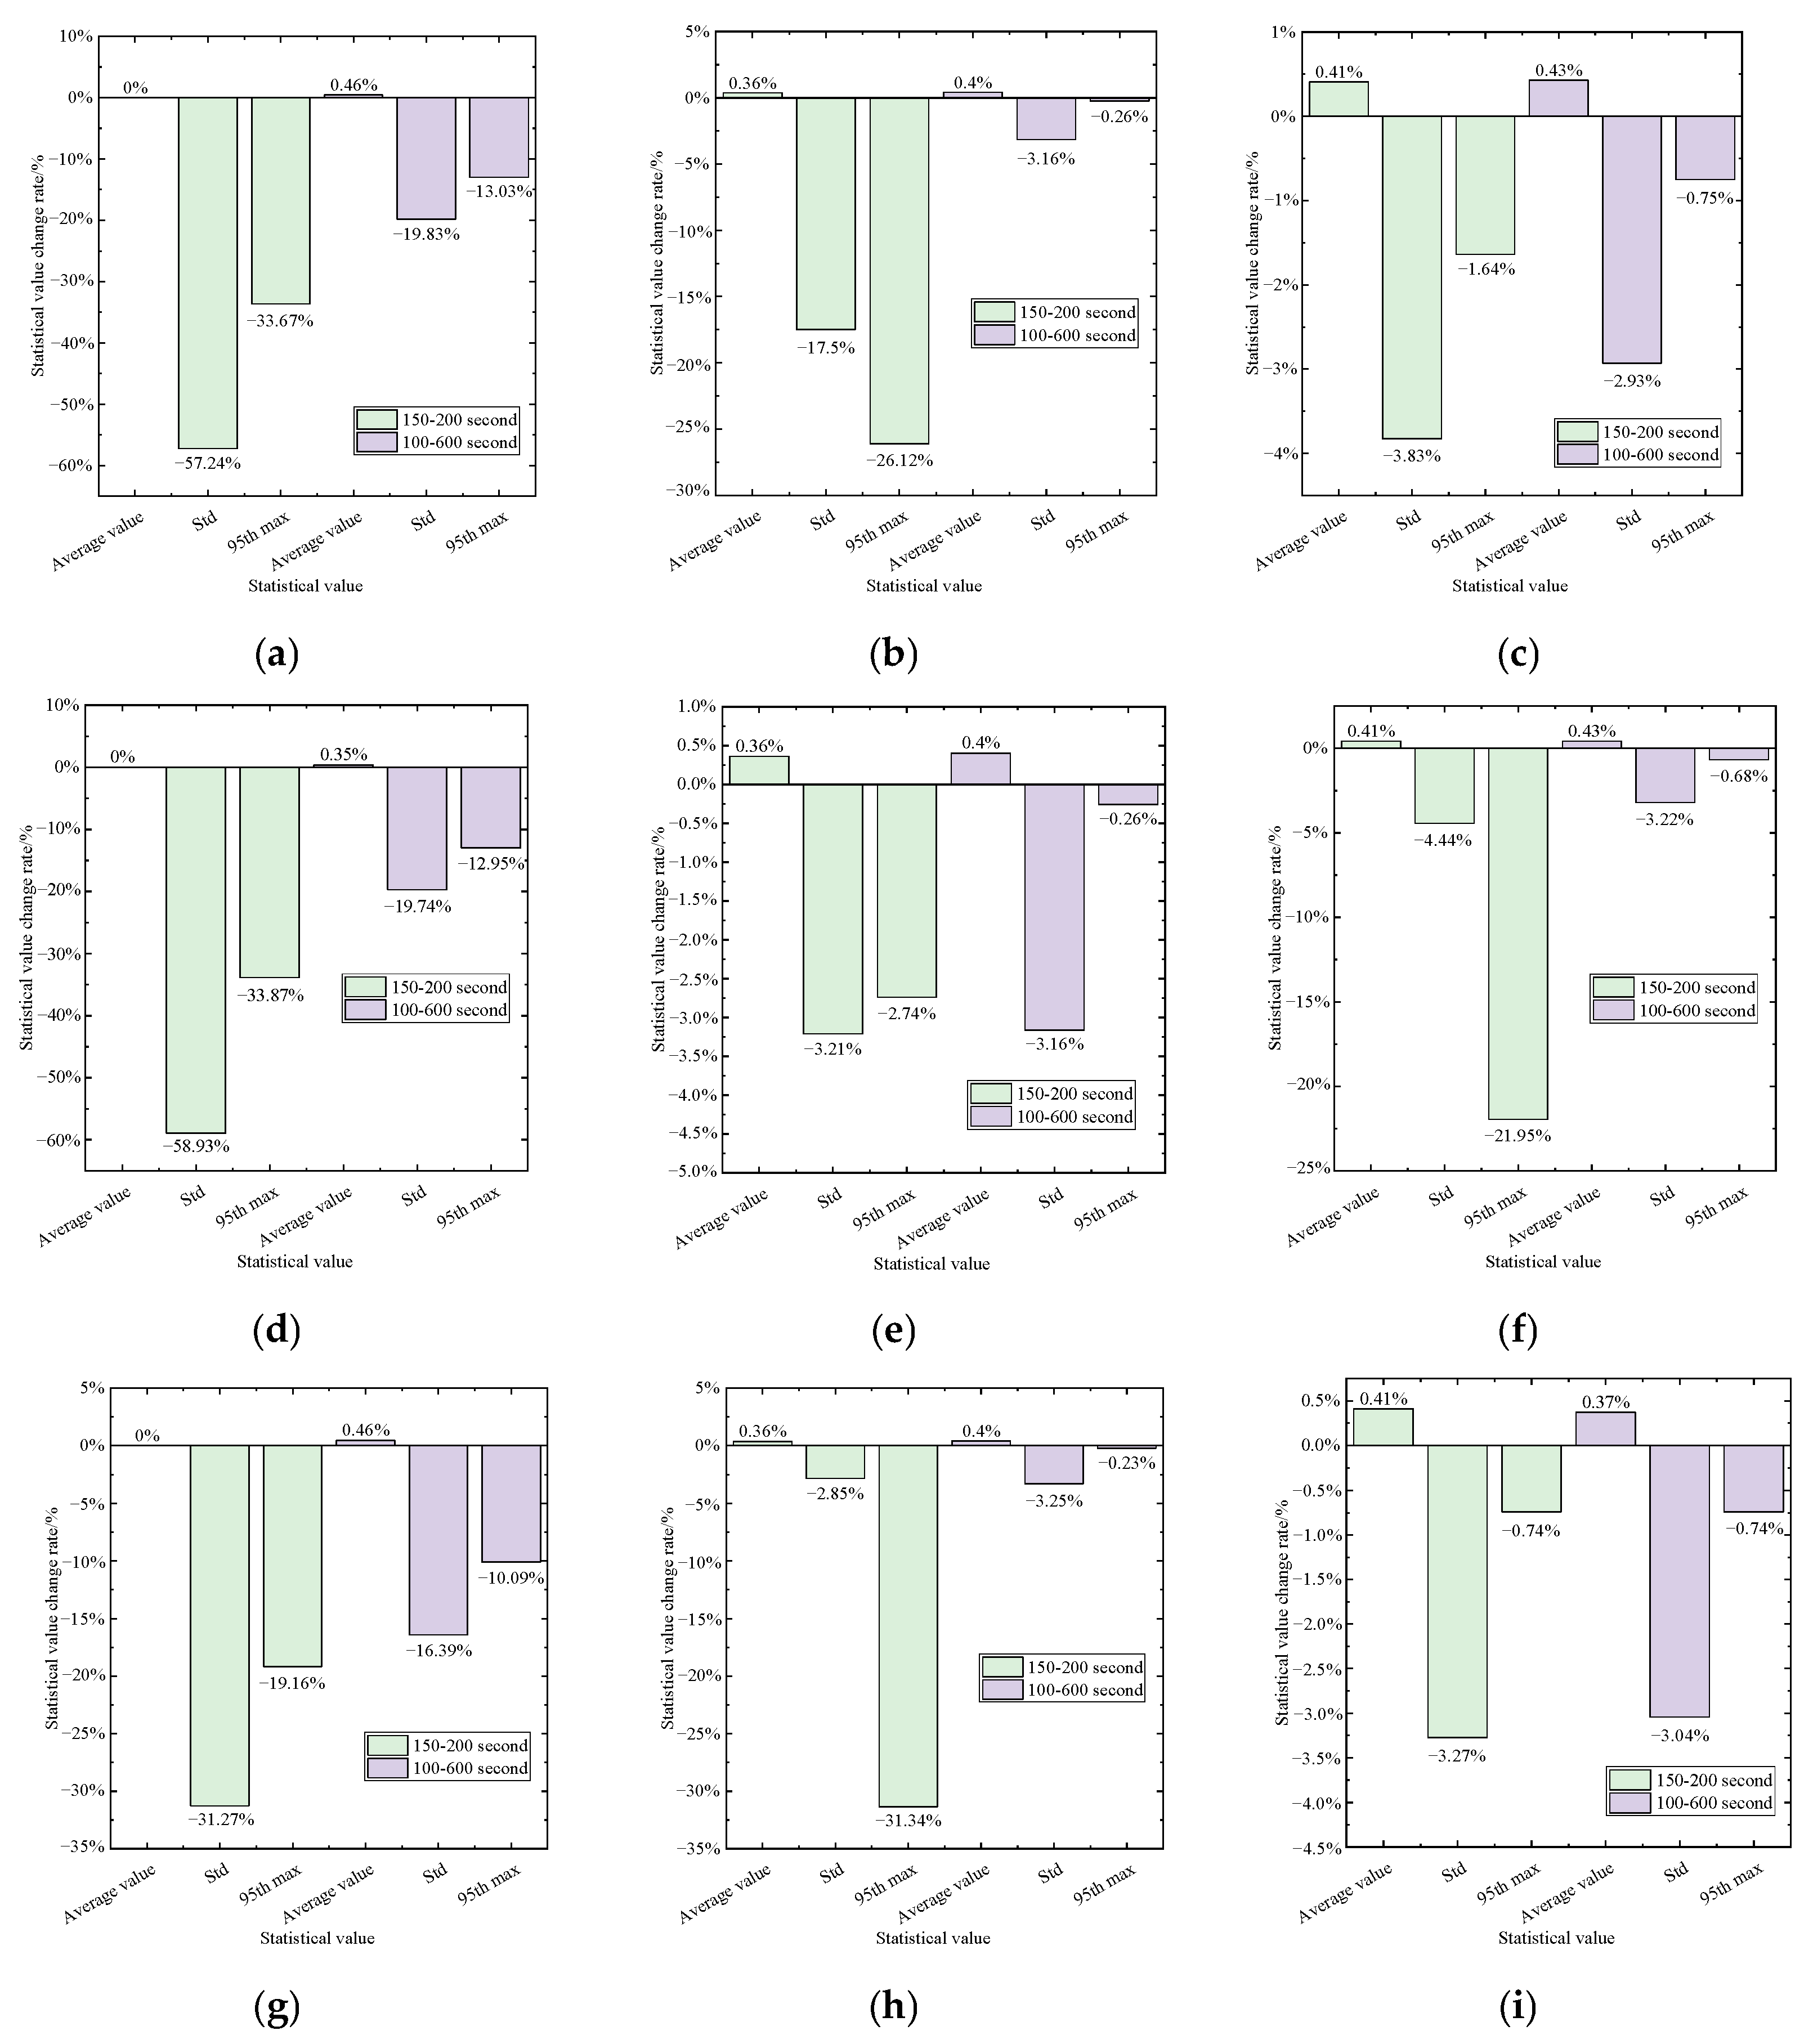
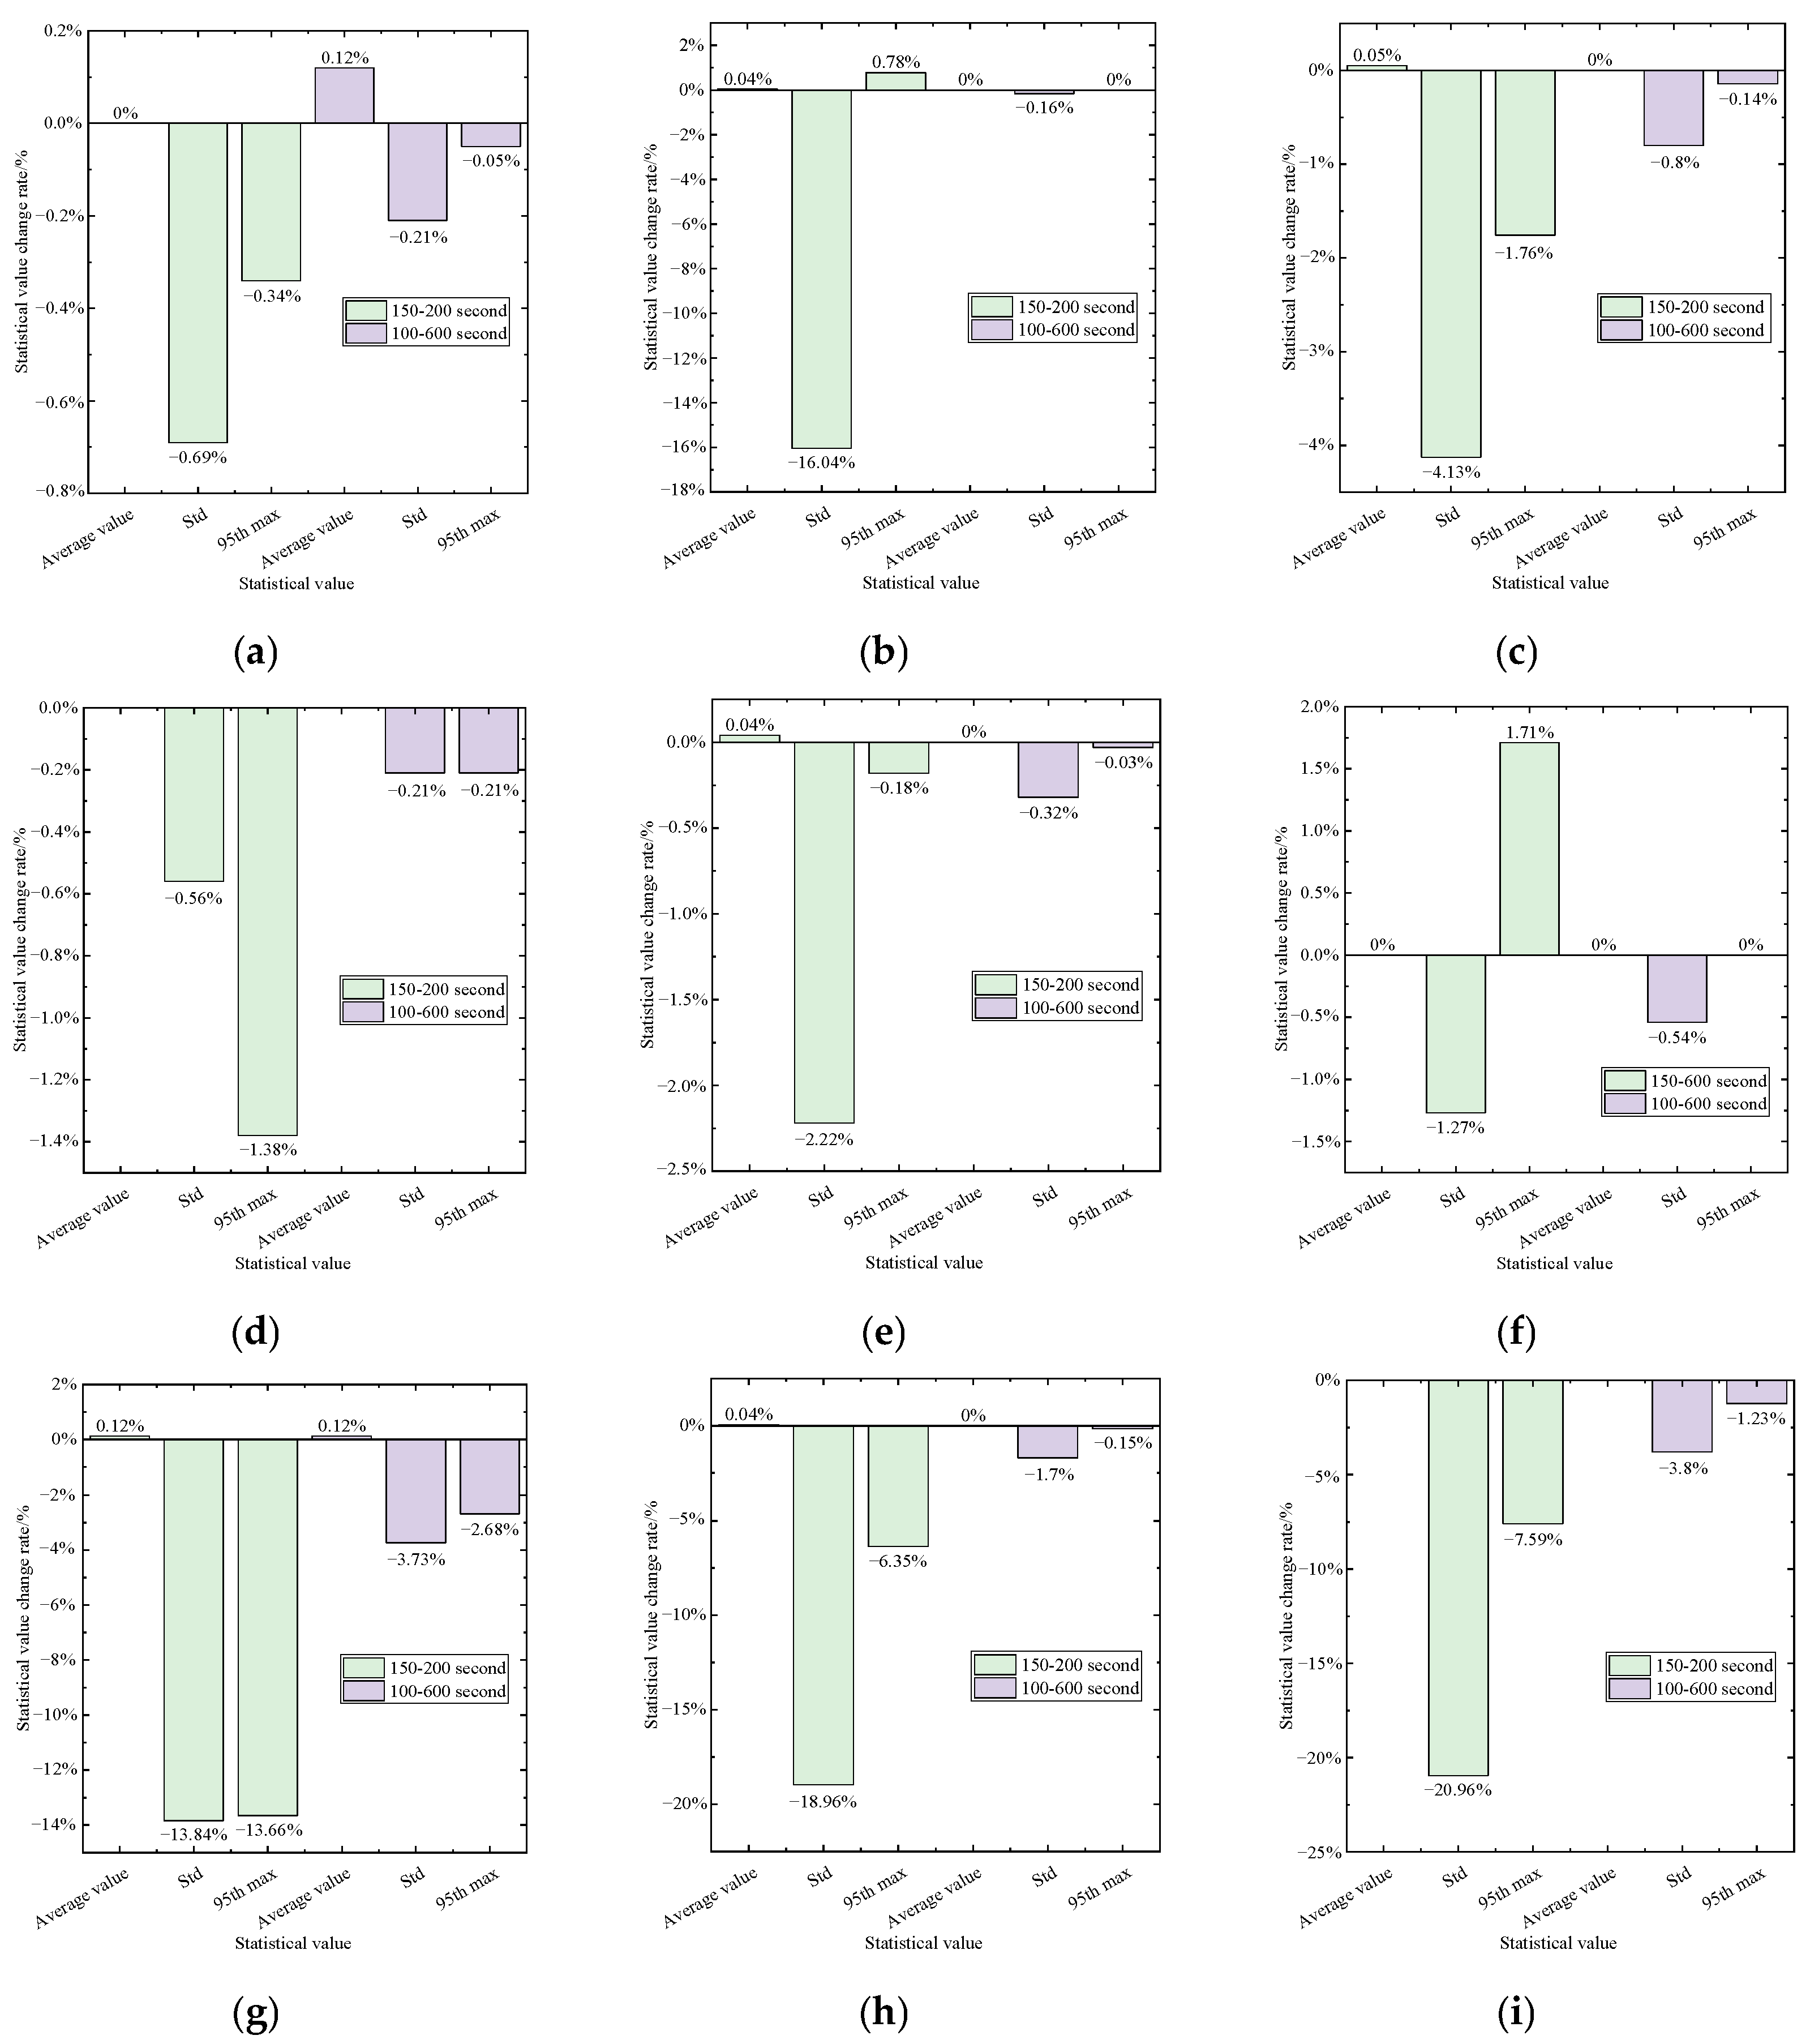
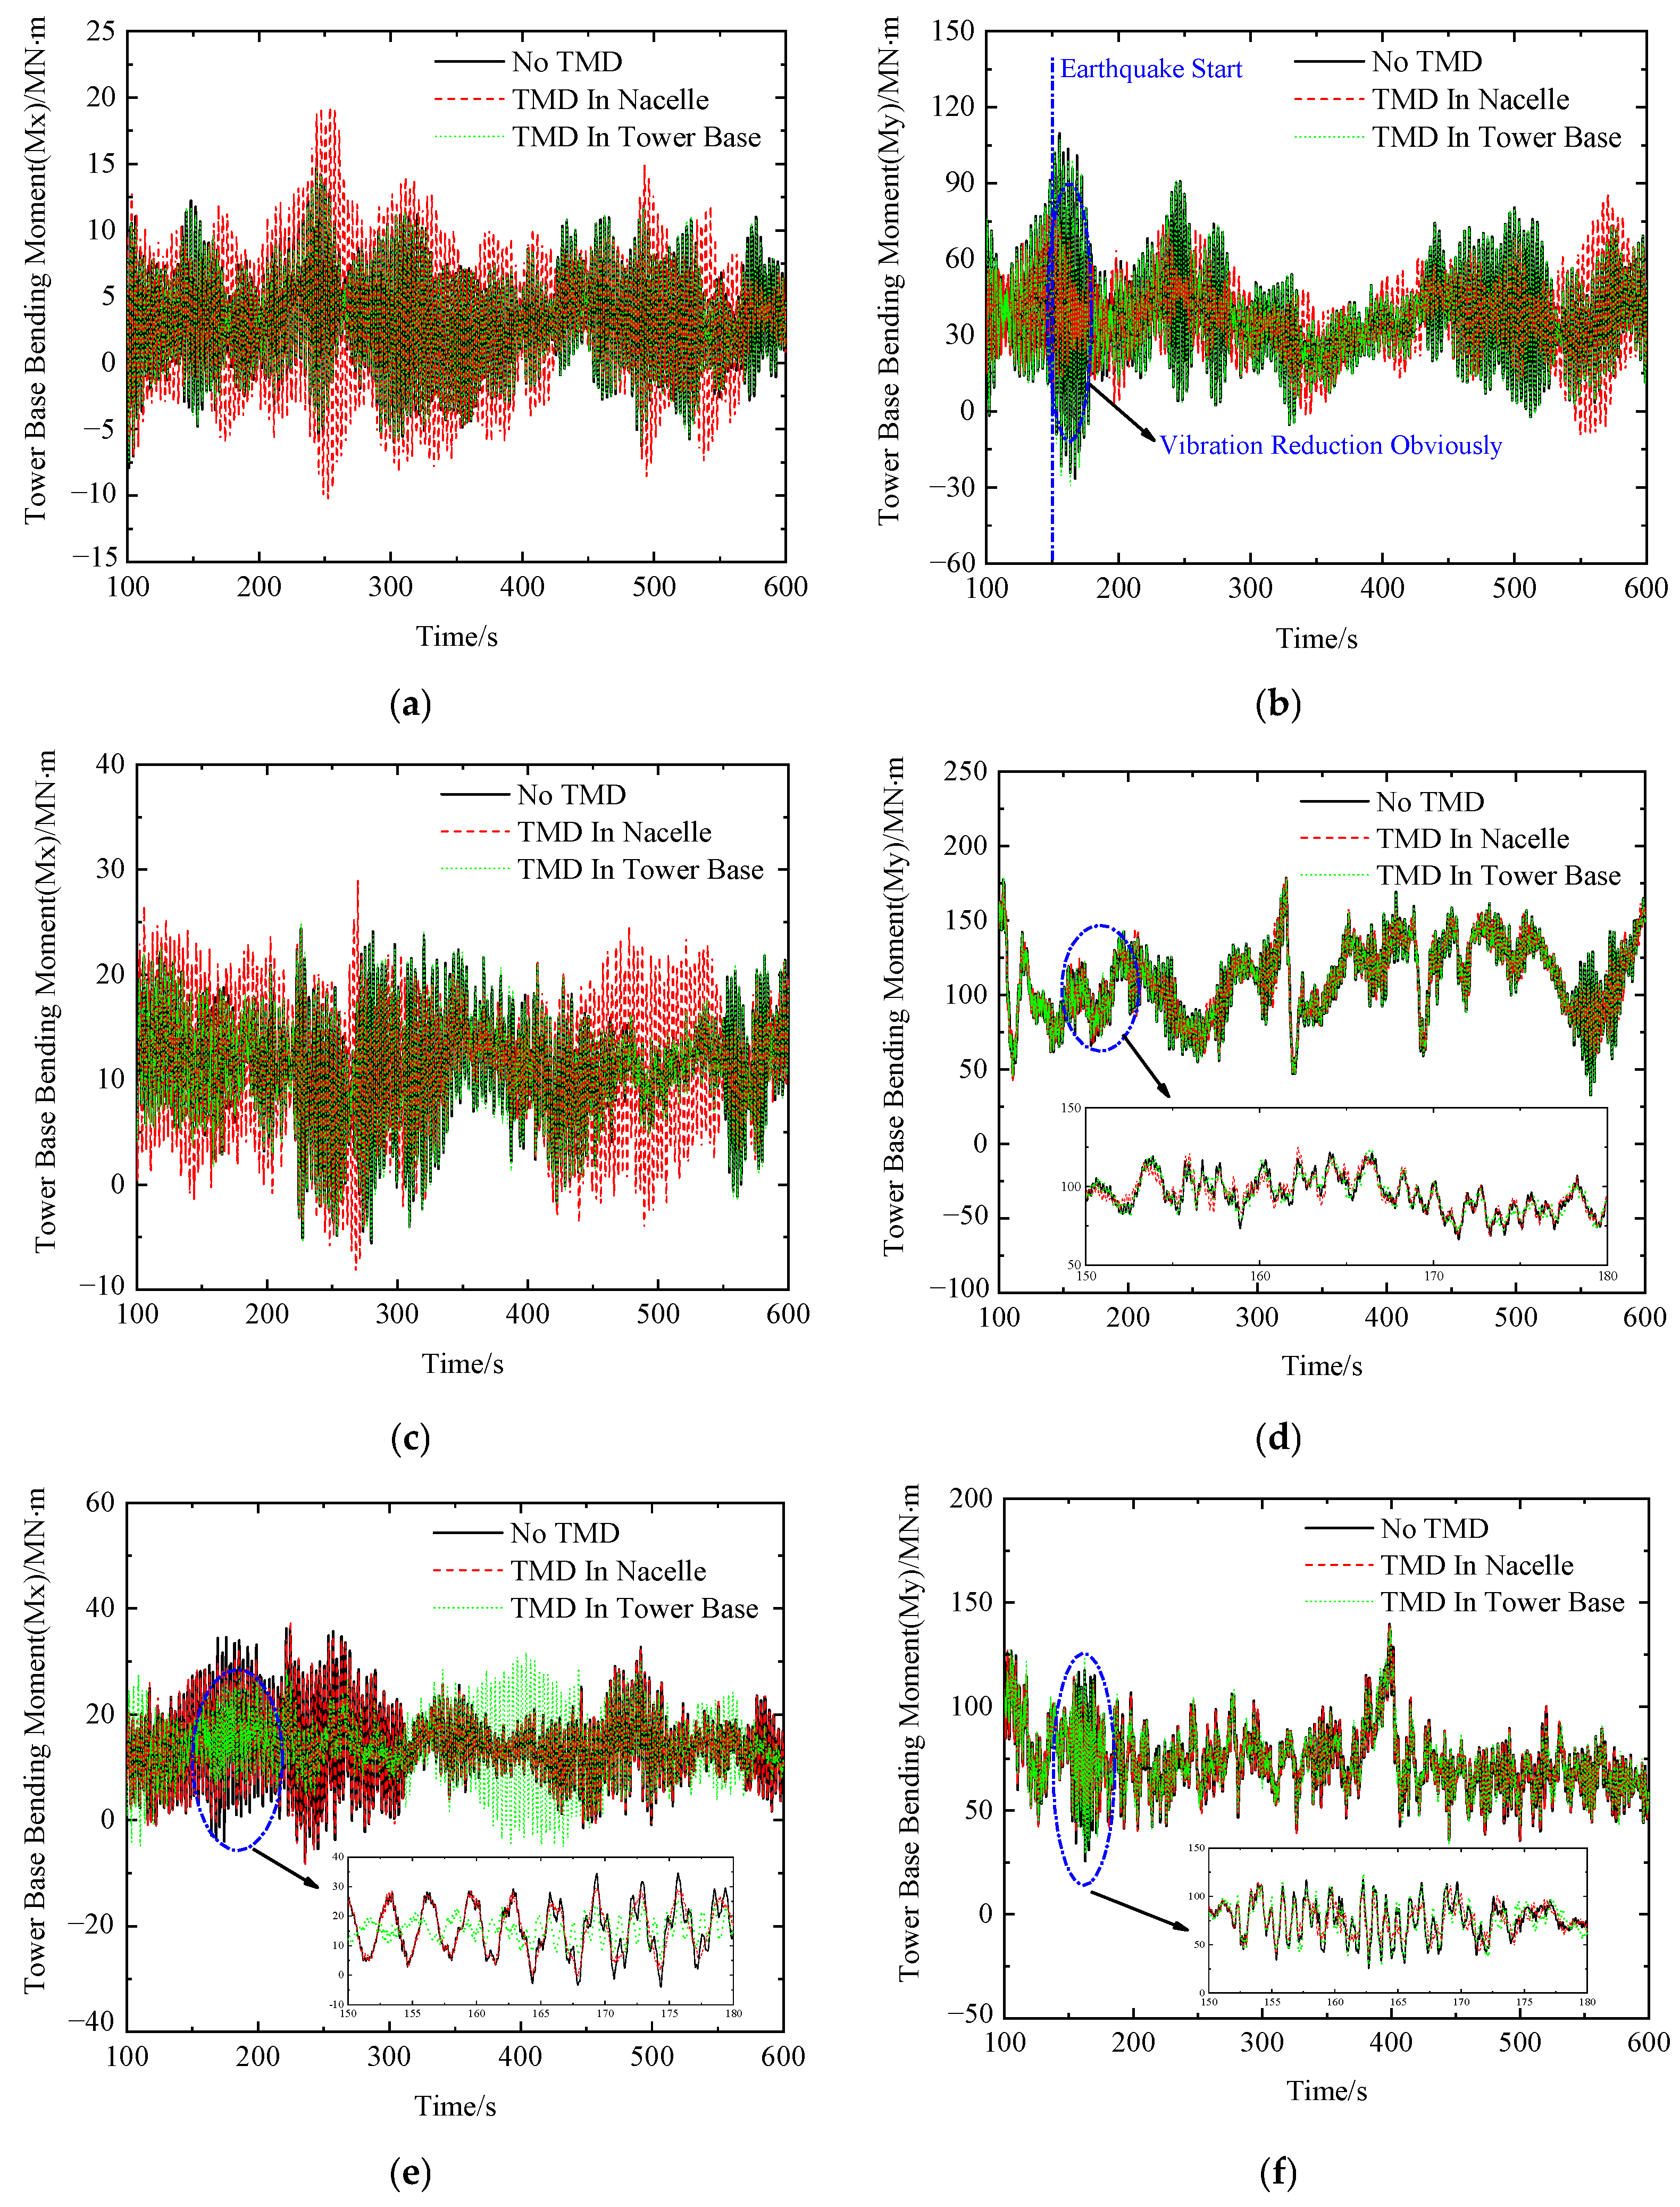
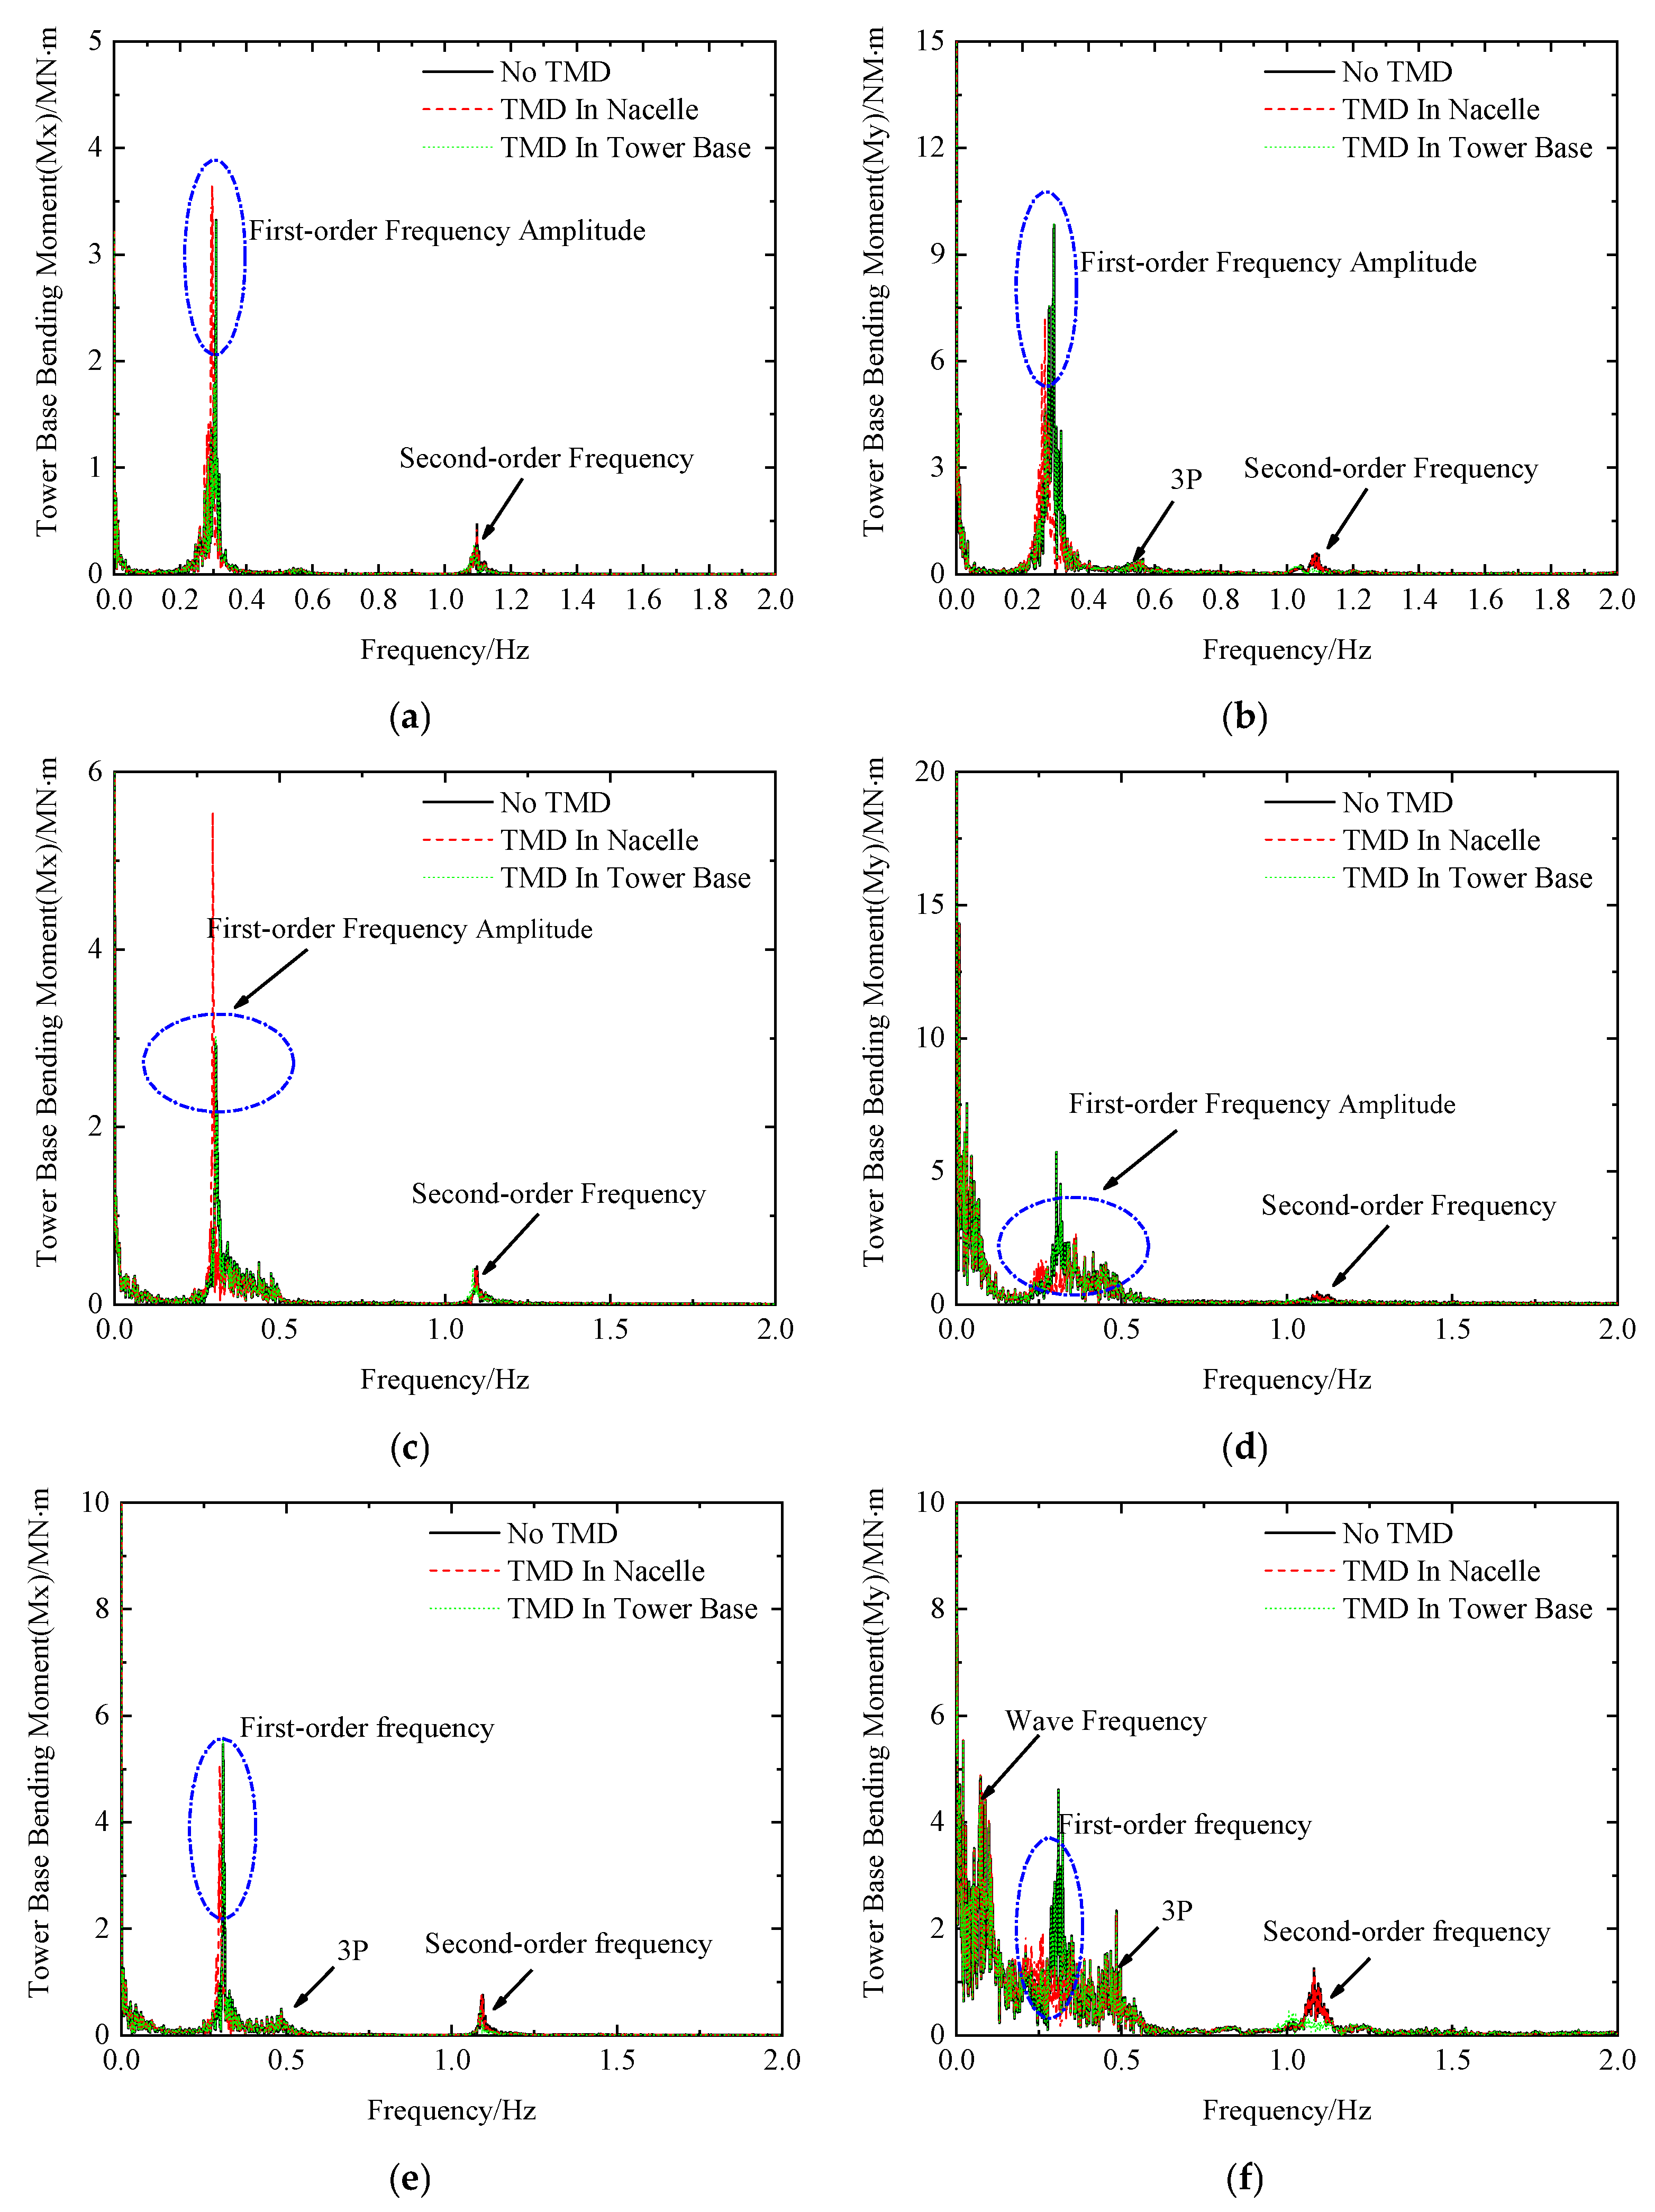
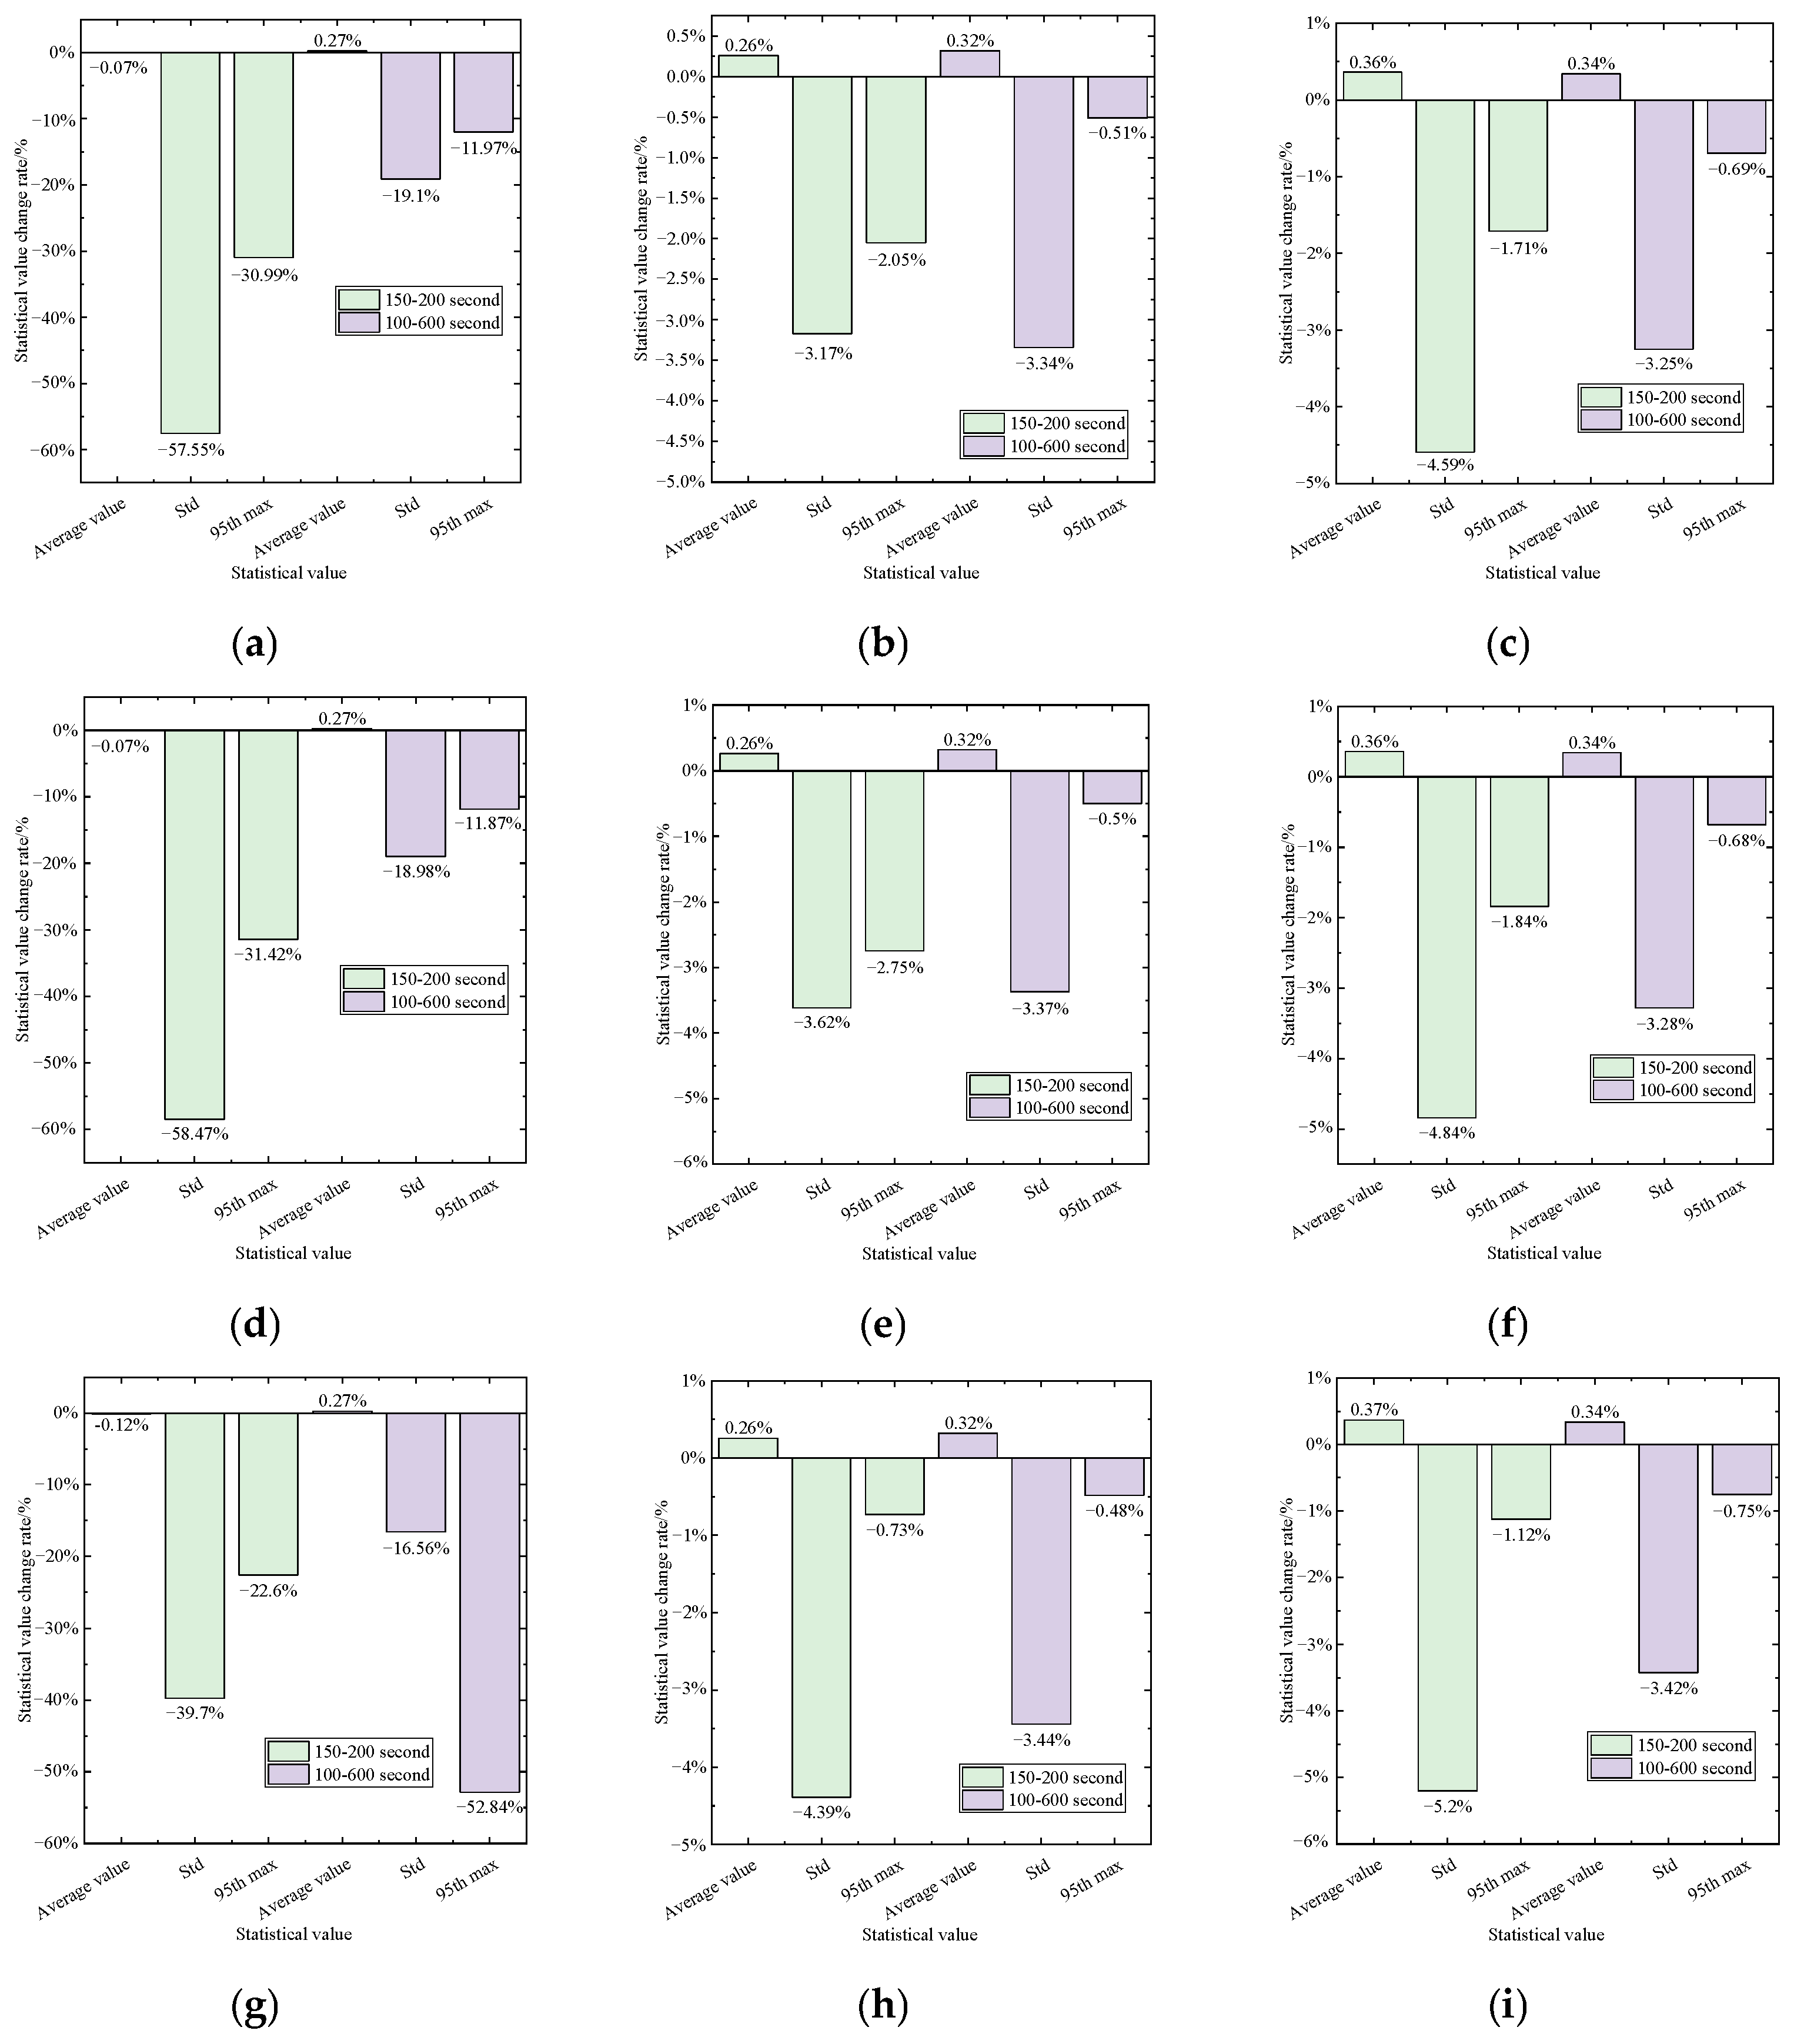
The time histories of tower-base bending moments in the X- and Y-directions under combined wind, wave, and seismic loads are presented in Figure 15a–f, and the correlated responses in the frequency domain are shown in Figure 16. The variation trends are similar to those observed for tower-top displacements. For the tower-base bending moment in the X-direction, the application of the TMD at the tower base results in limited reduction in the bending moment. In contrast, when the TMD is installed on the nacelle, a significant amplification of the tower-base response is observed. However, under the El Centro seismic excitation, the vibration mitigation effect of the TMD installed at the tower base is markedly superior to that of the nacelle-mounted configuration. Regarding the Y-direction tower-base bending moment, the TMD demonstrates more pronounced vibration reduction during the seismic loading period (150–200 s). Under combined wind and wave loading, it is observed that at certain time instants, the TMD may exacerbate the structural time history response, as illustrated in Figure 15b.
These observations are further corroborated by the statistical data summarized in Table 5. Taking DLC4 as an example, during the seismic interval of 150–200 s, the mean, standard deviation, and 95th max of the Y-direction tower-base bending moment without TMD are 37.4184 MN·m, 27.9799 MN·m, and 94.8522 MN·m, respectively. When the TMD is installed on the nacelle, the corresponding values are 37.3916 MN·m, 11.6188 MN·m, and 65.0457 MN·m, whereas for the tower-base-mounted TMD, the values are 37.4258 MN·m, 27.9256 MN·m, and 94.1754 MN·m, respectively. The TMD has a more significant effect on reducing the standard deviation. Similar patterns can be observed across other load cases. As shown by the variation rates of statistical values in Figure 17 and Figure 18, changes in standard deviation can reach up to 58% in some cases, indicating a substantial load-reduction effect of the TMD on the structure. This systematic investigation demonstrates that the control effectiveness of tuned mass dampers exhibits remarkable location dependence and frequency-spectrum sensitivity. The tower-base TMD exhibits limited effectiveness due to insufficient kinematic excitation, while the nacelle-mounted configuration, despite its global vibration suppression capability, amplifies the tower-base response through modal coupling effects. Notably, under broadband seismic excitation, the tower-base TMD demonstrates superior vibration suppression performance, revealing the crucial influence of load spectral characteristics on the control mechanism. These findings establish the principle of “location-frequency spectral adaptability,” providing a significant theoretical foundation for vibration control design in offshore wind turbine structures.
Frequency-domain analysis of the tower-base bending moment in the X-direction, as illustrated in Figure 16, reveals that the tuned mass damper (TMD) predominantly influences the structural first-order frequency component. Specifically, the nacelle-mounted TMD induces a marked amplification of the first-order frequency amplitude, consequently intensifying the corresponding time-domain response. In contrast, the tower-base TMD demonstrates negligible modification of the first-order frequency characteristics. This phenomenon elucidates the location-dependent nature of TMD effectiveness: while the nacelle position effectively controls global vibrations, it may amplify specific frequency components through modal coupling, whereas the tower-base location, limited by insufficient kinematic excitation in the first-order mode, fails to achieve meaningful control at this frequency. These findings further validate the significance of the “position–frequency spectrum adaptability” principle in vibration control of offshore wind structures, providing a theoretical basis for optimizing TMD configuration strategies. For practical engineering applications, it is recommended to select appropriate TMD locations according to target control frequency bands or consider implementing hybrid control systems to achieve more comprehensive vibration suppression.

6. Conclusions and Future Studies

A fully coupled dynamic model, developed in this study for a 10 MW jacket foundation OWT under combined environmental loading, incorporates a TMD to mitigate structural vibrations induced by wind and wave conditions, taking into account the dynamic response characteristics of the OWT. The stiffness and damping parameters of the TMD are optimized using the ABC algorithm. A comprehensive dynamic analysis is then conducted under combined wind, wave, and seismic excitations to evaluate the coupled response behavior of the structure and to validate the effectiveness of the proposed TMD configuration in vibration mitigation. The following conclusions are inferred from this study:
(1)
Under combined wind, wave, and seismic loading, the application of a TMD significantly improves the vibration mitigation performance of the structure. Compared to placing the TMD at the tower base, positioning it within the nacelle yields better damping effectiveness.
(2)
Compared to the combined wind and wave loading condition, the TMD demonstrates enhanced vibration mitigation performance under combined wind, wave, and seismic loading. When seismic excitation is applied, significant variations are observed in both tower-top displacement and tower-base bending moment. The presence of the TMD primarily influences the standard deviation and 95th max, with reductions in standard deviation reaching 50% in certain cases, while its effect on the mean value remains minimal, generally below 1%.
(3)
Based on the frequency-domain analysis, it is observed that when the TMD is installed at the nacelle, it primarily affects the first-order natural frequency of the structure. Specifically, the first-order frequency amplitude in the X-direction is significantly reduced, whereas the corresponding amplitude in the Y-direction increases. In contrast, when the TMD is located at the tower base, its influence is mainly exerted on the second-order frequency. Since the structural response is predominantly governed by the first-order frequency, the impact of base-mounted TMDs on the time-domain response and statistical parameters is generally limited; however, under seismic excitations with broad frequency content and high spectral amplitudes such as the El Centro earthquake, the tower-base TMD demonstrates significant vibration mitigation effects.
It is important to acknowledge two primary limitations of this study that also define avenues for future work. First, the analysis of the tower-base TMD was performed using parameters optimized for the nacelle position. A dedicated optimization targeting higher-order modes, for which the tower base is more effective, was beyond the scope of this research, which focused on fundamental mode control. Second, the pile–soil interaction was represented using a simplified boundary condition method rather than a more advanced model. Future studies should incorporate sophisticated soil–structure interaction models to more accurately quantify their influence on the structure dynamics response and TMD performance.

Author Contributions

Conceptualization, Z.H.; methodology, W.W.; software, D.L.; validation, Y.S., T.X. and W.W.; formal analysis, X.G.; investigation, Y.S.; resources, D.T.; data curation, C.L.; writing—original draft preparation, Z.H.; writing—review and editing, Y.S.; visualization, Y.S.; supervision, Z.H.; project administration, W.W.; funding acquisition, Z.H. All authors have read and agreed to the published version of the manuscript.

Funding

This research was funded by the Postdoctoral Science Foundation (grant no. P66525) and self-supporting research project (grant no. P48521) of PowerChina Chengdu Engineering Corporation Limited.

Data Availability Statement

The data presented in this study are available on request from the corresponding author.

Conflicts of Interest

Zhongbo Hu, Tao Xiong, Xiang Gao, Deshuai Tian and Changbo Liu were employed by PowerChina Chengdu Engineering Corporation Limited. The remaining authors declare that the research was conducted in the absence of any commercial or financial relationships that could be construed as a potential conflict of interest.

References

  1. Bento, N.; Fontes, M. Emergence of floating offshore wind energy: Technology and industry. Renew. Sustain. Energy Rev. 2019, 99, 66–82. [Google Scholar] [CrossRef]
  2. Global Wind Energy Council. Global Wind Report; Global Wind Energy Council: Brussels, Belgium, 2024. [Google Scholar]
  3. Wu, X.; Hu, Y.; Li, Y.; Yang, J.; Duan, L.; Wang, T.; Adcock, T.; Jiang, Z.; Gao, Z.; Lin, Z.; et al. Foundations of offshore wind turbines: A review. Renew. Sustain. Energy Rev. 2019, 104, 379–393. [Google Scholar] [CrossRef]
  4. Jahani, K.; Langlois, R.G.; Afagh, F.F. Structural dynamics of offshore wind turbines: A review. Ocean Eng. 2022, 251, 111136. [Google Scholar] [CrossRef]
  5. Wang, J.; Golnary, F.; Li, S.; Weerasuriya, A.; Tse, K. A review on power control of wind turbines with the perspective of dynamic load mitigation. Ocean Eng. 2024, 311, 118806. [Google Scholar] [CrossRef]
  6. Salic, T.; Charpentier, J.; Benbouzid, M.; Boulluec, M. Control strategies for floating offshore wind turbine: Challenges and trends. Electronics 2019, 8, 1185. [Google Scholar] [CrossRef]
  7. Jonkman, J.; Butterfield, S.; Musial, W.; Scott, G. Definition of a 5-MW Reference Wind Turbine for Offshore System Development; NREL: Golden, CO, USA, 2009. [Google Scholar]
  8. Girsang, I.P.; Dhupia, J.S.; Muljadi, E.; Singh, M.; Jonkman, J. Modeling and control to mitigate resonant load in variable-speed wind turbine drivetrain. IEEE J. Emerg. Sel. Top. Power Electron. 2013, 1, 277–286. [Google Scholar] [CrossRef]
  9. Yang, F.; Song, Q.; Wang, L.; Zuo, S.; Li, S. Wind and wave disturbances compensation to floating offshore wind turbine using improved individual pitch control based on fuzzy control strategy. Abstr. Appl. Anal. 2014, 2014, 968384. [Google Scholar] [CrossRef]
  10. Abbas, N.J.; Zalkind, D.S.; Wright, A. A reference open-source controller for fixed and floating offshore wind turbines. Wind Energy Sci. 2022, 7, 53–73. [Google Scholar] [CrossRef]
  11. Abbas, N.J.; Jasa, J.; Zalkind, D.S.; Wright, A.; Pao, L. Control co-design of a floating offshore wind turbine. Appl. Energy 2024, 353, 122036. [Google Scholar]
  12. Kaynia, A.M.; Pedersen, D.; Askheim, H.; Romero-Sánchez, C. Implementation of seismic soil-structure interaction in OpenFAST and application to an offshore wind turbine on jacket structure. Mar. Struct. 2025, 103, 103832. [Google Scholar]
  13. Meng, F.; Lio, W.; Barlas, T. DTUWEC: An open-source DTU Wind Energy Controller with advanced industrial features. J. Phys. Conf. Ser. 2020, 1618, 022009. [Google Scholar] [CrossRef]
  14. Mozayan, S.; Saad, M.; Vahedi, H.; Fortin-Blanchette, H.; Soltani, M. Sliding mode control of PMSG wind turbine based on enhanced exponential reaching law. IEEE Trans. Ind. Electron. 2020, 63, 6148–6159. [Google Scholar] [CrossRef]
  15. Bagherieh, O.; Nagamune, R. Gain-scheduling control of a floating offshore wind turbine above rated wind speed. Control Theory Technol. 2015, 13, 160–172. [Google Scholar] [CrossRef]
  16. Shah, K.A.; Meng, F.; Li, Y.; Nagamune, R.; Zhou, Y.; Ren, Z.; Jiang, Z. A synthesis of feasible control methods for floating offshore wind turbine system dynamics. Renew. Sustain. Energy Rev. 2021, 151, 111525. [Google Scholar] [CrossRef]
  17. Civelek, Z.; Lüy, M.; Çam, E.; Barıșçı, N. Control of pitch angle of wind turbine by fuzzy PID controller. Intell. Autom. Soft Comput. 2016, 22, 463–471. [Google Scholar] [CrossRef]
  18. Wang, L.; Zuo, S.; Song, Y.; Zhou, Z. Variable torque control of offshore wind turbine on spar floating platform using advanced RBF neural network. Abstr. Appl. Anal. 2014, 2014, 903493. [Google Scholar] [CrossRef]
  19. Sun, Y.; Zhou, Q.; Sun, L.; Sun, L.; Kang, J.; Li, H. CNN–LSTM–AM: A power prediction model for offshore wind turbines. Ocean Eng. 2024, 301, 117598. [Google Scholar] [CrossRef]
  20. Kang, Y.; Kim, H.; Lee, S. Benefits of individual pitch control on offshore wind turbine submerged in upstream wake. Renew. Energy 2023, 217, 119127. [Google Scholar] [CrossRef]
  21. Namik, H.; Stol, K. Individual blade pitch control of a spar-buoy floating wind turbine. IEEE Trans. Control Syst. Technol. 2014, 22, 214–223. [Google Scholar] [CrossRef]
  22. Han, D.; Li, X.; Wang, W.; Su, X. Dynamic modeling and vibration control of barge offshore wind turbine using tuned liquid column damper in floating platform. Ocean Eng. 2023, 276, 114299. [Google Scholar] [CrossRef]
  23. Kim, H.; Kang, J. Application of semi-active TMD to tilted high-rise building structure subjected to seismic loads. Appl. Sci. 2021, 21, 1671–1679. [Google Scholar] [CrossRef]
  24. Ramezani, M.; Bathaei, A.; Ghorbani-Tanha, A.K. Application of artificial neural networks in optimal tuning of tuned mass dampers implemented in high-rise buildings subjected to wind load. Earthq. Eng. Eng. Vib. 2018, 17, 903–915. [Google Scholar] [CrossRef]
  25. Zhu, Z.; Lei, W.; Wang, Q.; Tiwari, N.; Hazra, B. Study on wind-induced vibration control of linked high-rise buildings by using TMDI. J. Wind Eng. Ind. Aerodyn. 2020, 205, 104306. [Google Scholar] [CrossRef]
  26. Lackner, M.A.; Rotea, M.A. Structural control of floating wind turbines. Mechatronics 2011, 21, 704–719. [Google Scholar] [CrossRef]
  27. Yan, S.; Wang, Y.; Wei, F.P.; Zhang, Z. Wind and wave-induced vibration reduction control for floating offshore wind turbine using delayed signals. J. Mar. Sci. Eng. 2024, 12, 1113. [Google Scholar] [CrossRef]
  28. Luo, Y.; Qian, F.; Su, H.; Wang, X.; Chen, A.; Zuo, L. Rigid-flexible coupling multi-body dynamics modeling of a semi-submersible floating offshore wind turbine. Ocean Eng. 2023, 281, 114648. [Google Scholar] [CrossRef]
  29. Li, T.; Liu, Z.; Liu, S.; Fan, Y.; Yang, Q.; Xiao, H. Numerical study on passive structural control of semi-submersible floating wind turbine considering non-collinear wind and waves. Ocean Eng. 2022, 266, 112745. [Google Scholar] [CrossRef]
  30. Stewart, G.M.; Lackner, M.A. The impact of passive tuned mass dampers and wind–wave misalignment on offshore wind turbine loads. Eng. Struct. 2014, 73, 54–61. [Google Scholar] [CrossRef]
  31. Zhang, J.W.; Liang, X.; Wang, L.Z.; Wang, B.X.; Wang, L.L. The influence of tuned mass dampers on vibration control of monopile offshore wind turbines under wind-wave loadings. Ocean Eng. 2023, 278, 114394. [Google Scholar] [CrossRef]
  32. Hua, Y.; Wang, J.; Chen, M.; Li, Z.; Sun, Y. Load mitigation for a barge-type floating offshore wind turbine via inerter-based passive structural control. Eng. Struct. 2018, 177, 198–209. [Google Scholar] [CrossRef]
  33. Zhang, T.; Wang, W.; Li, X.; Wang, B. Vibration mitigation in offshore wind turbine under combined wind-wave-earthquake loads using the tuned mass damper inerter. Renew. Energy 2023, 216, 119050. [Google Scholar] [CrossRef]
  34. Sun, C.; Jahangiri, V. Bi-directional vibration control of offshore wind turbines using a 3D pendulum tuned mass damper. Mech. Syst. Signal Process. 2018, 105, 338–360. [Google Scholar] [CrossRef]
  35. Jahangiri, V.; Sun, C. A novel three-dimensional nonlinear tuned mass damper and its application in floating offshore wind turbines. Ocean Eng. 2022, 250, 110703. [Google Scholar] [CrossRef]
  36. Luo, Y.; Sun, H.; Hall, L.; Lambert, D.; Okuda, R.; Wang, W.; Fang, B.; Zuo, L. Vibration control for a semi-submersible floating offshore wind turbine with optimal ultra-low frequency electromagnetic tuned inerter-mass dampers. Structures 2024, 63, 106296. [Google Scholar] [CrossRef]
  37. Jonkman, J.M. Dynamics Coupled Model with Coupled Spring Boundary and Loads Analysis of an Offshore Floating Wind Turbine; NREL: Golden, CO, USA, 2007. [Google Scholar]
  38. Morison, J.R.; Johnson, J.W.; Schaaf, S.A. The force exerted by surface waves on piles. J. Petrol. Technol. 1950, 2, 149–154. [Google Scholar] [CrossRef]
  39. Cava, W.L.; Lackner, M.A. Theory Manual for the Tuned Mass Damper Module in FAST v8; NREL: Golden, CO, USA, 2015. [Google Scholar]
  40. Karaboga, D.; Basturk, B. A powerful and efficient algorithm for numerical function optimization: Artificial bee colony (ABC) algorithm. J. Glob. Optim. 2007, 39, 459–471. [Google Scholar] [CrossRef]
  41. Karaboga, D.; Basturk, B. On the performance of artificial bee colony (ABC) algorithm. Appl. Soft Comput. 2008, 8, 687–696. [Google Scholar] [CrossRef]
  42. Akay, B.; Karaboga, D. A modified artificial bee colony algorithm for real-parameter optimization. Inf. Sci. 2012, 192, 120–142. [Google Scholar] [CrossRef]
  43. Thakur, S.; Abhinav, K.A.; Saha, N. Stochastic response reduction on offshore wind turbines due to flaps including soil effects. Soil Dyn. Earthq. Eng. 2018, 114, 174–185. [Google Scholar] [CrossRef]
  44. Jonkman, B.; Kilcher, L. TurbSim User’s Guide (Draft Version); NREL: Golden, CO, USA, 2012. [Google Scholar]
  45. Jonkman, J.; Robertson, A.; Hayman, G. HydroDyn User’s Guide and Theory Manual; NREL: Golden, CO, USA, 2013. [Google Scholar]
  46. McNamara, D.; Pandit, A.; Malekjafarian, A. Optimized design of multiple tuned mass dampers for vibration control of offshore wind turbines. Ocean Eng. 2024, 305, 117912. [Google Scholar] [CrossRef]
  47. Xie, S.; Jin, X.; He, J.; Gao, J.; Zhang, C.; Yan, Y. Applying multiple tuned mass dampers to control structural loads of bottom-fixed offshore wind turbines with inclusion of soil-structure interaction. Ocean Eng. 2020, 205, 107289. [Google Scholar] [CrossRef]
  48. Liu, Y.; Li, X.; Shi, W.; Wang, W.; Jiang, Z. Vibration control of a monopile offshore wind turbines under recorded seismic waves. Renew. Energy 2024, 226, 120455. [Google Scholar] [CrossRef]
  49. Wang, W.; Li, X.; Zhao, H.; Wang, B.; Li, Y. Vibration control of a pentapod offshore wind turbine under combined seismic wind and wave loads using multiple tuned mass damper. Appl. Ocean Res. 2020, 103, 102254. [Google Scholar] [CrossRef]
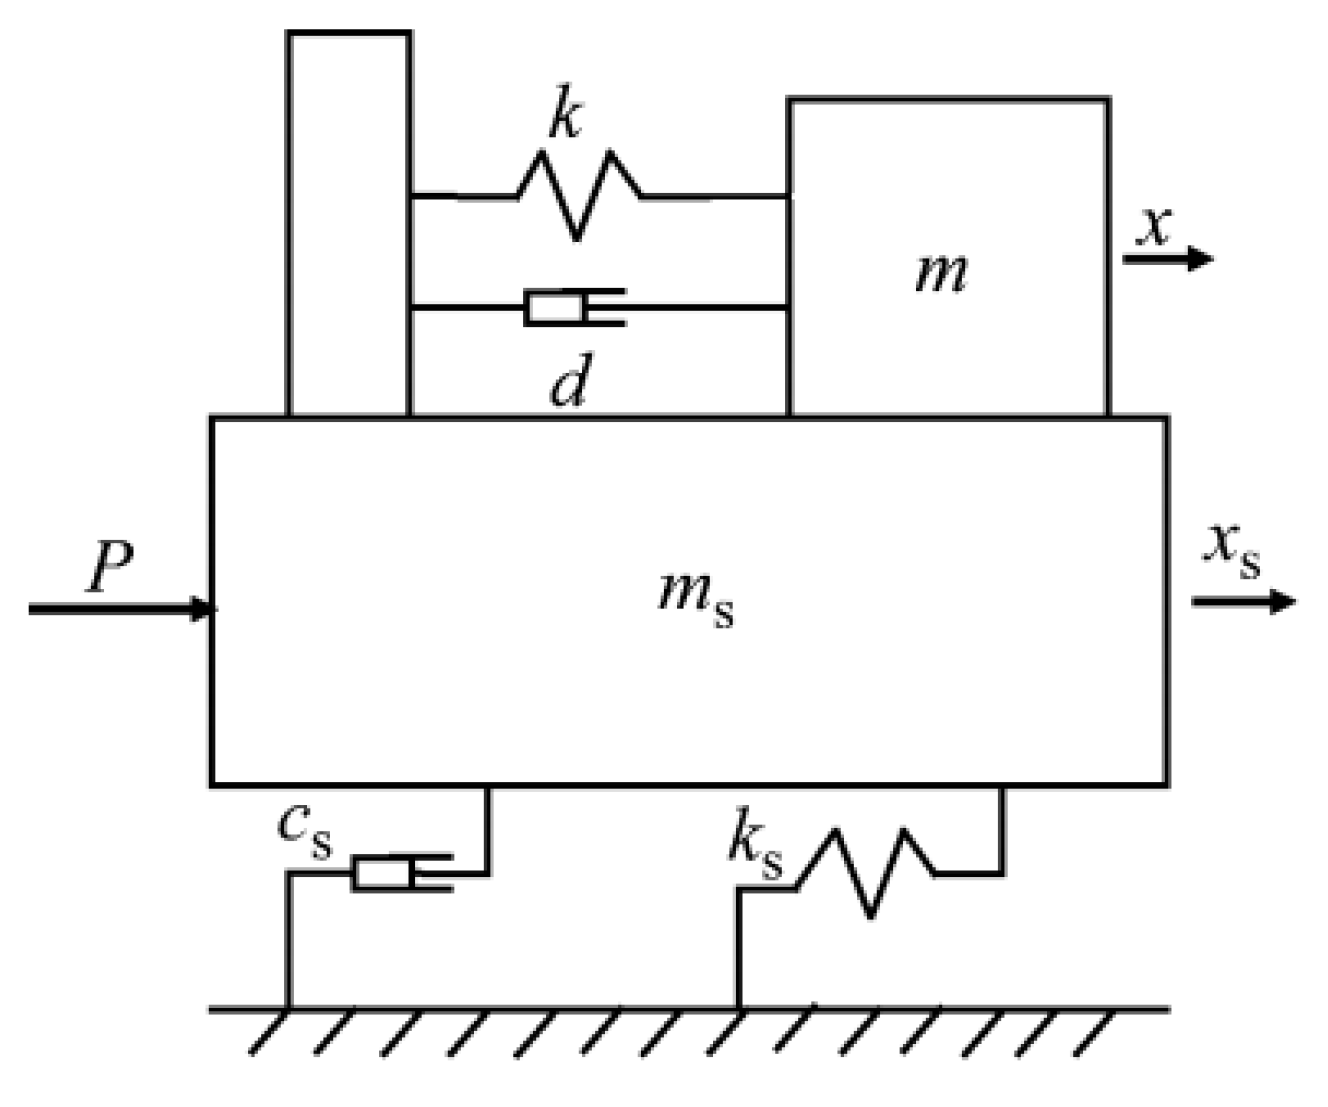
Figure 1. Simplified TMD-structure system.
Jmse 13 02112 g001
Figure 2. Schematic of the TMD coordinate systems.
Jmse 13 02112 g002
Figure 3. Flowchart of TMD parameter optimization using the ABC algorithm.
Jmse 13 02112 g003
Figure 4. Design parameters of the 10 MW Jacket-Type OWT (unit: m).
Jmse 13 02112 g004
Figure 5. Measured joint distribution of wind and waves.
Jmse 13 02112 g005
Figure 6. Selected wind-speed time history and FFT spectrum: (a) selected wind-speed time history; (b) Fourier amplitudes of selected wind speeds.
Jmse 13 02112 g006
Figure 7. Selected wave-height time history and FFT spectrum: (a) selected wave-height time history; (b) Fourier amplitudes of selected wave heights.
Jmse 13 02112 g007
Figure 8. Selected seismic time history and FFT spectrum: (a) selected seismic time history; (b) Fourier amplitudes of selected seismic data.
Jmse 13 02112 g008
Figure 9. ABC algorithm optimization iterative process: (a) TMD iterative damping coefficient; (b) TMD iterative stiffness coefficient.
Jmse 13 02112 g009
Figure 10. Modes of OWT with FAST and ANSYS: (a) First mode in F-A direction; (b) First mode in S-S direction; (c) Second mode in F-A direction; (d) Second mode in S-S direction.
Jmse 13 02112 g010aJmse 13 02112 g010b
Figure 11. Time history of tower-top displacement under combined wind, wave, and seismic loading: (a) Time history of tower-top displacement in the X-direction under DLC1 loading condition. (b) Time history of tower-top displacement in the Y-direction under DLC1 loading condition. (c) Time history of tower-top displacement in the X-direction under DLC5 loading condition. (d) Time history of tower-top displacement in the Y-direction under DLC5 loading condition. (e) Time history of tower-top displacement in the X-direction under DLC9 loading condition. (f) Time history of tower-top displacement in the Y-direction under DLC9 loading condition.
Jmse 13 02112 g011
Figure 12. Fourier amplitudes of tower-top displacement under combined wind, wave, and seismic loading: (a) Fourier amplitudes of tower-top displacement in the X-direction under DLC1 loading condition. (b) Fourier amplitudes of tower-top displacement in the Y-direction under DLC1 loading condition. (c) Fourier amplitudes of tower-top displacement in the X-direction under DLC5 loading condition. (d) Fourier amplitudes of tower-top displacement in the Y-direction under DLC5 loading condition. (e) Fourier amplitudes of tower-top displacement in the X-direction under DLC9 loading condition. (f) Fourier amplitudes of tower-top displacement in the Y-direction under DLC9 loading condition.
Jmse 13 02112 g012
Figure 13. Variation rates of tower-top displacement statistical values with TMD installed in the nacelle: (a) TMD installed in the nacelle under DLC1 load case; (b) TMD installed in the nacelle under DLC2 load case; (c) TMD installed in the nacelle under DLC3 load case; (d) TMD installed in the nacelle under DLC4 load case; (e) TMD installed in the nacelle under DLC5 load case; (f) TMD installed in the nacelle under DLC6 load case; (g) TMD installed in the nacelle under DLC7 load case; (h) TMD installed in the nacelle under DLC8 load case; (i) TMD installed in the nacelle under DLC9 load case.
Jmse 13 02112 g013
Figure 14. Variation rates of tower-base statistical values with TMD installed in the nacelle: (a) TMD installed in the tower base under DLC1 load case e; (b) TMD installed in the tower base under DLC2 load case; (c) TMD installed in the tower base under DLC3 load case; (d) TMD installed in the tower base under DLC4 load case; (e) TMD installed in the tower base under DLC5 load case; (f) TMD installed in the tower base under DLC6 load case; (g) TMD installed in the tower base under DLC7 load case; (h) TMD installed in the tower base under DLC8 load case; (i) TMD installed in the tower base under DLC9 load case.
Jmse 13 02112 g014
Figure 15. Time history of tower-base bending moment under combined wind, wave, and seismic loading: (a) Time history of tower-base bending moment in the X-direction under DLC1 loading condition. (b) Time history of tower-base bending moment in the Y-direction under DLC1 loading condition. (c) Time history of tower-base bending moment in the X-direction under DLC5 loading condition. (d) Time history of tower-base bending moment in the Y-direction under DLC5 loading condition. (e) Time history of tower-base bending moment in the X-direction under DLC9 loading condition. (f) Time history of tower-base bending moment in the Y-direction under DLC9 loading condition.
Jmse 13 02112 g015
Figure 16. Fourier amplitudes of tower-base bending moment under combined wind, wave, and seismic loading: (a) Fourier amplitudes of tower-base bending moment in the X-direction under DLC1 loading condition; (b) Fourier amplitudes of tower-base bending moment in the Y-direction under DLC1 loading condition; (c) Fourier amplitudes of tower-base bending moment in the X-direction under DLC5 loading condition; (d) Fourier amplitudes of tower-base bending moment in the Y-direction under DLC5 loading condition; (e) Fourier amplitudes of tower-base bending moment in the X-direction under DLC9 loading condition; (f) Fourier amplitudes of tower-base bending moment in the Y-direction under DLC9 loading condition.
Jmse 13 02112 g016
Figure 17. Variation rate of statistical values of tower-base bending moment with TMD installed in the nacelle: (a) TMD installed in the nacelle under DLC1 load case; (b) TMD installed in the nacelle under DLC2 load case; (c) TMD installed in the nacelle under DLC3 load case; (d) TMD installed in the nacelle under DLC4 load case; (e) TMD installed in the nacelle under DLC5 load case; (f) TMD installed in the nacelle under DLC6 load case; (g) TMD installed in the nacelle under DLC7 load case; (h) TMD installed in the nacelle under DLC8 load case; (i) TMD installed in the nacelle under DLC9 load case.
Jmse 13 02112 g017
Figure 18. Variation rate of statistical tower-base bending moment with TMD installed in the tower base: (a) TMD installed in the tower base under DLC1 load case; (b) TMD installed in the tower base under DLC2 load case; (c) TMD installed in the tower base under DLC3 load case; (d) TMD installed in the tower base under DLC4 load case; (e) TMD installed in the tower base under DLC5 load case; (f) TMD installed in the tower base under DLC6 load case; (g) TMD installed in the tower base under DLC7 load case; (h) TMD installed in the tower base under DLC8 load case; (i) TMD installed in the tower base under DLC9 load case.
Jmse 13 02112 g018
Table 1. DTU 10 MW OWT parameters.
ParameterValue
Rated power10 MW
Rotor configuration and orientation3 blades, upwind
Control strategyVariable speed, variable pitch
Mass of single blade, hub, nacelle41,732, 105,520, 446,036 kg
Rated thrust1500 kN
Rotor diameter, hub diameter178.3, 5.6 m
Hub height119 m
Cut-in, rated, cut-out wind speeds4.0, 11.4, 25.0 m/s
Cut-in, rated rotor speeds6.0, 9.6 rpm
Table 2. Selected typical combined wind, wave, and earthquake load cases.
Load Case No.Wind-Wave
Direction
Wind Speed
(m/s)
Wave Height
(m)
Peak Period (s)Seismic WaveOperational
Condition
TMD Location
DLC1Aligned at 0°6.00.456.00Humbolt BayOperationnacelle/tower base
DLC211.42.008.50nacelle/tower base
DLC316.03.7512.50nacelle/tower base
DLC46.00.456.00Borregonacelle/tower base
DLC511.42.008.50nacelle/tower base
DLC616.03.7512.50nacelle/tower base
DLC76.00.456.00El Centronacelle/tower base
DLC811.42.008.50nacelle/tower base
DLC916.03.7512.50nacelle/tower base
Table 3. Frequency comparison between the FAST and ANSYS models.
ModalANSYS (Hz)FAST (Hz)Relative Error (%)
First in F-A0.2900.2982.68%
First in S-S0.2900.2982.68%
Second in F-A1.051.082.78%
Second in S-S1.051.082.78%
Table 4. Statistical values of tower-top displacement in the X-direction.
Load Case No.TMD Location MeanStd.95%th MaxMeanStd.95%th Max
150–200 s100–600 s
DLC1No TMD0.08500.07250.23460.08650.04690.1903
Nacelle0.08500.03100.15560.08690.03760.1655
Tower base0.08500.07200.23380.08660.04680.1902
DLC2No TMD0.25150.04800.33230.27430.06320.3885
Nacelle0.25240.03960.24550.27540.06120.3875
Tower base0.25160.04030.33490.27430.06310.3885
DLC3No TMD0.19640.03390.26200.18680.03750.2790
Nacelle0.19720.03260.25770.18760.03640.2769
Tower base0.19650.03250.25740.18680.03720.2786
DLC4No TMD0.08500.07110.23180.08660.04660.1900
Nacelle0.08500.02920.15330.08690.03740.1654
Tower base0.08500.07070.22860.08660.04650.1896
DLC5No TMD0.25150.04050.33560.27430.06320.3886
Nacelle0.25240.03920.32640.27540.06120.3876
Tower base0.25160.03960.33500.27430.06300.3885
DLC6No TMD0.19650.03150.25150.18680.03730.2784
Nacelle0.19730.03010.19630.18760.03610.2765
Tower base0.19650.03110.25580.18680.03710.2784
DLC7No TMD0.08500.08090.27970.08650.04820.1942
Nacelle0.08500.05560.22610.08690.04030.1746
Tower base0.08510.06970.24150.08660.04640.1890
DLC8No TMD0.25140.05960.36380.27430.06470.3891
Nacelle0.25230.05790.24980.27540.06260.3882
Tower base0.25150.04830.34070.27430.06360.3885
DLC9No TMD0.19640.05200.29910.18680.03950.2840
Nacelle0.19720.05030.29690.18750.03830.2819
Tower base0.19640.04110.27640.18680.03800.2805
Table 5. Statistical values of tower-base bending moment in the Y-direction.
Load Case No.TMD Location MeanStd.95%th MaxMeanStd.95%th Max
150–200 s100–600 s
DLC1No TMD37.414528.428395.750437.089418.413878.2758
Nacelle37.387412.069266.074737.188314.897668.9055
Tower base37.427228.371695.907237.090218.414578.2899
DLC2No TMD101.643015.8349135.2358110.295725.2618156.2874
Nacelle101.906815.3333132.4681110.647024.4185155.4948
Tower base101.657015.7495134.6816110.294525.2522156.2965
DLC3No TMD75.262713.1137100.726473.619414.9428111.7320
Nacelle75.534912.511399.005173.873014.4567110.9582
Tower base75.273812.863499.786873.618814.8638111.6897
DLC4No TMD37.418427.979994.852237.090418.329878.1225
Nacelle37.391611.618865.045737.189414.851268.8532
Tower base37.425827.925694.175437.089818.334878.0695
DLC5No TMD101.644615.7249135.0917110.295025.2603156.2891
Nacelle101.911915.1552131.3715110.646724.4084155.5014
Tower base101.657615.5704135.0228110.295425.2375156.2844
DLC6No TMD75.270212.616998.966173.619514.8996111.6597
Nacelle75.544312.006597.141473.873214.4114110.9057
Tower base75.279812.567899.218573.618914.8697111.6763
DLC7No TMD37.429828.9081104.383137.089718.480278.2265
Nacelle37.385117.431880.789137.188015.419136.8900
Tower base37.441026.667094.732037.090418.154877.1172
DLC8No TMD101.611720.3121138.5718110.291625.5905156.3217
Nacelle101.879119.4210137.5667110.644024.7104155.5664
Tower base101.642618.0034135.2906110.293125.3999156.2861
DLC9No TMD75.247917.4619108.518773.617515.3834112.3833
Nacelle75.524816.5537107.299573.871214.8566111.5355
Tower base75.261615.2771104.434173.617915.1204111.9657
Disclaimer/Publisher’s Note: The statements, opinions and data contained in all publications are solely those of the individual author(s) and contributor(s) and not of MDPI and/or the editor(s). MDPI and/or the editor(s) disclaim responsibility for any injury to people or property resulting from any ideas, methods, instructions or products referred to in the content.