Article

Imaging Ocean-Bottom Seismic Data with Acoustic Kirchhoff Pre-Stack Depth Migration: A Numerical Investigation of Migration Responses and Crosstalk Artifacts

1
Research Center for Computational and Exploration Geophysics, State Key Laboratory of Precision Geodesy, Innovation Academy for Precision Measurement Science and Technology, Chinese Academy of Sciences, Wuhan 430077, China
2
Institute of Marine Geology and Resources, Ocean College, Zhejiang University, Zhoushan 316021, China
*
Author to whom correspondence should be addressed.
J. Mar. Sci. Eng. 2025, 13(11), 2109; https://doi.org/10.3390/jmse13112109
Submission received: 30 September 2025 / Revised: 31 October 2025 / Accepted: 3 November 2025 / Published: 6 November 2025
(This article belongs to the Special Issue Modeling and Waveform Inversion of Marine Seismic Data)

Abstract

Ocean-bottom seismic (OBS) surveys have been applied in marine oil and gas exploration. In the typical OBS observation geometry, the source and receiver are located on/near different datums, i.e., the sea surface and the seafloor. Besides the desired primary reflections, abundant water-layer-related multiples (WLRMs) are the dominant noises. The demultiple processing for OBS data is a long-standing challenging task. If these WLRMs are not properly suppressed, they will be projected into the subsurface domain by the pre-stack depth migration (PSDM) engine, forming crosstalk imaging artifacts. By combining a finite-difference-based wave simulator and an acoustic Kirchhoff PSDM engine, we propose to build up a numerical analysis workflow to address the influence of WLRMs on depth images. We make a classification of typical WLRMs. Through an integrated numerical investigation, we conduct a detailed analysis of basic migration responses, wave-mode crosstalk, and effective artifact suppression solutions. With a generalized mirror migration approach, we emphasize the potential application of turning WLRMs into effective signals. The built-up investigation method and the obtained understanding of multiples can further benefit in suppressing and utilizing multiples in OBS datasets.

1. Introduction

Marine seismic data acquisition and processing play a crucial role in oil and gas exploration due to their irreplaceable ability to provide high-resolution images of subsurface structures. Recently, ocean-bottom seismic (OBS) surveys have been more widely advocated, ranging from shallow to deep sea exploration blocks, owing to the advantages over the traditional marine towed-streamer observations [1], including the acquired multicomponent dataset, higher signal-to-noise ratio, wide to full azimuth illumination, effective coverage of obstruction areas, and time-lapse monitoring.
In the typical OBS observation geometry, sources, such as airguns, are excited below the sea surface with a specific depth, while the receivers, such as multicomponent sensors along ocean-bottom cable (OBC) or in ocean-bottom node (OBN) units, are deployed on the seafloor. Multicomponent seismic signals are acquired under this observation geometry, including the single-component (1C) acoustic pressure and the three-component (3C) elastic particle velocities (or displacements, or accelerations). Moreover, a distinctive feature is that the sources and receivers are not on the same datum. Meanwhile, the sea surface, corresponding to a free surface, and the seafloor, corresponding to a coupled fluid–solid surface, are both good reflectors. As a result, abundant up-/down-going acoustic/elastic events are recorded and highly mixed in the space–time domain. Besides the primary reflections that are effective signals, there is a series of events related to the water layer [1,2,3]. These water-layer-related multiples (WLRMs) are dominant noises in OBS records.
Along the seismic data processing routine, seismic migration imaging plays an important role in obtaining the short-wavelength subsurface structures. In theory, the seismic records are treated as boundary values of the wave equation under specific assumptions to retrieve subsurface parameters through the imaging condition; in other words, an inverse problem is constructed and solved [4,5]. Recently, the utilization of ocean-bottom multicomponent seismic data in pre-stack depth migration (PSDM) has been widely discussed. Theoretically, a straightforward solution is to conduct elastic PSDM using the complete 4C OBS dataset, generating depth images between different wave modes (e.g., PP and PS). Under this category, advanced PSDM engines are required to propagate the multicomponent records to the subsurface domain, such as the high-frequency rays [6,7,8], beam-based propagator [9,10,11,12], one-way elastic wave equation propagator [13,14], and the full elastic-wave propagator [15,16,17]. Under the frame of full-waveform inversion (FWI), high-resolution images can be derived from the updated profiles, providing quantitative interpretations of the subsurface structures and reservoirs [18,19,20]. By using the elastic-wave propagator in the seismic imaging methods, in theory, we can describe the subsurface media more accurately, extract more useful information, and output more diverse image attributes. However, in practice, the elastic PSDM and FWI require much more computational costs, are influenced by the crosstalk between multiparameters, and are usually difficult to fully utilize the OBS data. Especially, these issues will be aggravated if the WLRMs are not properly handled in the elastic propagators. Alternatively, under the acoustic approximation, more practical solutions are still necessary.
Acoustic imaging methods are widely used to process the multicomponent datasets in the conventional scalar-based processing workflow [21,22]. Rather than taking advantage of the intrinsic elasticity of the data, other merits of the OBS observation geometry can be addressed. In this category, specific reflection events are extracted, such as the data-domain up-/down-going separation [23,24,25] and P-/S-wave decomposition [17,26,27], followed by the acoustic migration imaging. Usually, the pre-imaging processes are quite challenging due to the complicated events in the OBS records. The accuracy of some wave separation and decomposition approaches is highly dependent on the effective estimation of seafloor properties [25,28,29,30]. A crude strategy is to use the acoustic pressure component only under the traditional processing workflow. An essential step is suppressing the multiples, namely the demultiple processing, as the conventional acoustic PSDM engine requires the input as primary reflections. Model- and data-driven demultiple techniques are widely investigated for the marine towed-streamer observations, such as model-based multiple prediction and subtraction [31,32,33], filtering in various transformed domains [34,35,36], the surface-related multiple elimination (SRME) [37,38], approaches built upon inverse scattering series [39,40,41], Marchenko-based demultipling methods [42,43], as well as novel approaches based on deep learning [44,45,46,47]. However, for demultiples of OBS data, due to the nature that sources and receivers are not on the same datum, specific modifications to these conventional demultiple methods are required; and even worse, some theoretical bases break down. Under these circumstances, residual multiples will be projected to the subsurface image domain. In this study, we mimic the scenario that the multiples in OBS records are not properly suppressed and further investigate the resulting imaging artifacts from the acoustic PSDM engine. It provides us with another perspective to understand the characteristics of multiples in a transformed domain, where the PSDM is interpreted as a high-dimensional transformation [4,5]. In this study, we focus on the projection process of the WLRMs.
Compared to the elastic-wave simulator in the elastic PSDM and FWI, the acoustic PSDMs reduce the computational costs by employing specific acoustic or scalar wave propagators. Wave-equation-based PSDM methods, such as the reverse-time migration (RTM), are ideal for generating high-quality depth images. Nevertheless, the RTM is still less computationally efficient as the full-wave solver is required, such as the finite-difference (FD) solver [48]. Additional drawbacks remain. The RTM is influenced by the well-known low-wavenumber artifacts [49]. It is difficult to extract stable and accurate wave propagation angles in the subsurface domain [50], which are the key parameters for extracting angle-domain common image gathers (ADCIGs). To overcome these difficulties, additional efforts are necessary. Our objective is to construct an efficient numerical investigation workflow to evaluate the influence of WLRMs on the depth images. Therefore, we turn to using ray-based wave propagators. Though the seismic imaging methods based on the ray theory are mature, the Kirchhoff PSDM is still the working horse in practice for industrial-scale applications. The Kirchhoff migration is computationally efficient as it invokes a ray-tracing solver or a traveltime calculator of the ordinary differential equation system. Meanwhile, the directional attributes of rays or the gradient of traveltimes naturally provide the wave propagation angles; thereby being convenient to output ADCIGs from the Kirchhoff migration. It also has high flexibility for various datasets as inputs, such as the common-shot gather (CSG), common-receiver-gather (CRG), and common-offset gather (COG). These advantages benefit our investigation, and we choose the acoustic Kirchhoff migration as the PSDM engine in our investigation. In detail, we generate the synthetic OBS datasets through the FD simulator. We employ a multiple wave simulator to generate both primary reflections and specific types of WLRMs [51]. These reflection records are injected into the acoustic Kirchhoff PSDM engine to generate the depth images and the pre-stack ADCIGs. The associated imaging artifacts caused by WLRMs are evaluated in the depth image domain.
The rest of this paper is organized as follows. We begin with a graphic analysis of typical OBS events, including primary reflections and typical multiples. Then, we introduce the FD-based wave simulator for generating individual seismic events and the Kirchhoff PSDM system for calculating depth images and ADCIGs. The two basic tools are used to build an analysis framework for conducting an integrated numerical investigation on the acoustic imaging results of various OBS events. Specifically, we first focus on the basic migration responses, wave-mode crosstalks, and associated artifacts. Then, we demonstrate potential applications of using WLRMs as effective signals in a generalized mirror migration system. We also demonstrate the capability of imaging sparse OBN CRG through the acoustic Kirchhoff migration.

2. Methodology

2.1. A Graphic Dissection of Typical OBS Events

In the ocean-bottom observation geometry, the sources and receivers are not located at different datums. Specifically, the airgun source (or airgun array) is excited near the sea surface, while the receivers (i.e., multicomponent sensors) are deployed on the seafloor. The sea surface, usually treated as a free surface, and the seafloor, usually treated as a fluid–solid interface, are both good reflectors. Consequently, besides the up-going primary reflections, water-layer-related records are pronounced [1,2,3].
We conclude typical reflection events in Figure 1. In detail, in a conventional seismic data processing routine [22], the up-going primary reflections are treated as effective signals, the ray path of which is illustrated in Figure 1a. The up-going reflections will inevitably be reflected by the free surface, forming the corresponding down-going reflections, as illustrated in Figure 1b, and we refer to this type of reflection as receiver-side 1st-order WLRM, as it interacts with the free surface once. Similarly, the up-going source-side 1st-order WLRM is illustrated in Figure 1c. The ray path includes both source- and receiver-side 1st-order WLRM as shown in Figure 1d, which is a down-going event. The events throughout Figure 1b–d are similar to the peg-leg-type multiples in the marine streamer observation [31,33]. On the other hand, specific waves also propagate in the water layer only, forming water reverberations. Shown in Figure 1e and Figure 1f are the 1st- and 2nd-order water reverberations, respectively.
More kinds of events with complicated ray paths can be interpreted as combinations of the basic OBS events shown in class I in Figure 1. In class II, we list some derived wavepaths in the OBS observation geometry. For instance, 2nd-order WLRM from the receiver and source sides are illustrated in Figure 1g and Figure 1h, respectively. A combination of 2nd-order source-side WLRM and 1st-order receiver-side WLRM is shown in Figure 1i. The ray path of high-order, e.g., 3rd-order, water reverberations is shown in Figure 1j. More complicated wavepaths are composed of multiple reflections between the free surface and subsurface reflectors. In classic towed-streamer observation geometry, they are usually referred to as the free-surface-related multiples, or long-term multiples [1,28]. In the OBS observation geometry, the long-term multiples can be either up-going or down-going, as illustrated in Figure 1k,l.
Besides the mixture of primary and multiple reflections in the time–space domain, they can be recorded with different propagation directions, either up-going or down-going. Moreover, the seafloor can be treated as a fluid–solid interface, on which the multicomponent sensors acquire boundary values. In theory, they are a summation of up-/down-going acoustic and elastic waves [15,16,17]. The hydrophone component can be treated as the acoustic pressure dataset [1,16,52]. Furthermore, the up-going multicomponent records contain elastic responses, such as up-going elastic P- and S-waves, by using which imaging with multi-mode waves (e.g., PP and PS) can be conducted.

2.2. Numerical Simulation of OBS Events Based on the FD Method

We express the wave simulation of ocean-bottom records as follows [1,28,33,53]
D ( x r , x s , ω ) = s ( x s , ω ) G s ( x , x s , ω ) R ( x ) G r ( x r , x , ω ) ,
where s ( x s , ω ) indicate the source signal emitted at the source location x s , and ω denotes the frequency, G s ( x , x s , ω ) indicates the Green’s function for the incident wave, corresponding to the propagator from the source to the subsurface location x , while G r ( x r , x , ω ) indicate the Green’s function for the reflected/scattered wave, corresponding to the wave propagator from x to the receiver location x r , and R ( x ) indicates the model perturbation in the subsurface, such as the reflectivities and scattering potentials. In this roughly expressed system, implicit surface or volume integrals are embedded when describing the reflections or scatterings.
Additionally, specific instructions of the equation are addressed as follows. As mentioned previously, the sources are excited near the sea surface, while the multicomponent receivers are deployed on the seafloor; namely, the x s and x r are not on the same datum. The multicomponent records, D ( x r , x s , ω ) intrinsically include the acoustic pressure p and three-component particle velocities v . The Green’s functions G s and G r play the role of wave extrapolators, and they can contain the effects of the free-surface boundary condition and fluid–solid boundary condition. When describing the multiple wave paths, they include multiple wave paths. We use the MacCormack-type FD propagators to implement the above wave simulation process. Specifically, the acoustic wave equation and elastic wave equation are separately solved by the FD method, and the wavefields (boundary values) are welded by fluid–solid boundary conditions [17,54,55,56,57]. Moreover, its collocated-grid nature guarantees the accuracy in dealing with the boundary conditions. Especially, it is convenient to extract multicomponent records, both of acoustic pressure and elastic particle velocities, at the collocated spatial location (i.e., the same FD grid).
For multiple reflections, we use the scheme of wave path decomposition [51], where the full wave path is decomposed into a series of sequential wave paths, and they are seamlessly connected based on the representation theorem. By using this scheme, specific wave events, including the primary reflections, WLRMs, and long-term free-surface-related multiples, can be simulated.

2.3. Kirchhoff Pre-Stack Depth Migration

We conduct a numerical investigation of these synthetic OBS events in an acoustic PSDM system. Considering the relatively complete and continuous sources and receivers in observation geometries, the Kirchhoff pre-stack depth migration imaging formula can be expressed under the asymptotic inversion imaging frame as follows [4,5]
I ( y , θ , x s ) = W cos α s 0 cos α r 0 v s 0 ( x s ) v r 0 ( x r ) A s A r e i ω ( τ s + τ r ) Q ( x r , x s , ω ) δ ( θ θ ) d ω d θ d x r ,
where y indicates the location of subsurface imaging target, which distinguishes with the subsurface target x in the forward modeling Equation (1), Q ( x r , x s , ω ) indicates the records in the frequency domain that inputted into the migration system; under the high-frequency regime, α s 0 and α r 0 are the take-off angles of ray trajectories from x s and x r , and v s 0 ( x s ) and v r 0 ( x r ) represent the velocities, A s = A ( y , x s ) and A r = A ( y , x r ) indicates the asymptotic amplitudes, while τ s = τ ( x , x s ) and τ r = τ ( x , x r ) are traveltimes; θ ( y , x r , x s ) is the subsurface scattering angle at y , it is related to the subsurface propagation angles ( β s , β r ) from the source and receiver ( x s , x r ) ; in the subsurface domain, the geometric relationship θ = β s β r is satisfied, representing the open angle; W indicates a weighting factor that can be related to subsurface properties (e.g., velocity and scattering angle).
Here, in Equation (2), we take the common-shot imaging formula as an example. Correspondingly, the multi-shot imaging results can be obtained by stacking individual single-shot profiles as follows. For angle-domain depth images (e.g., the ADCIGs)
I ( y , θ ) = x s I ( y , θ , x s ) ,
and the final stacked depth images
I ( y ) = θ I ( y , θ ) .

2.4. The Numerical Investigation Workflow

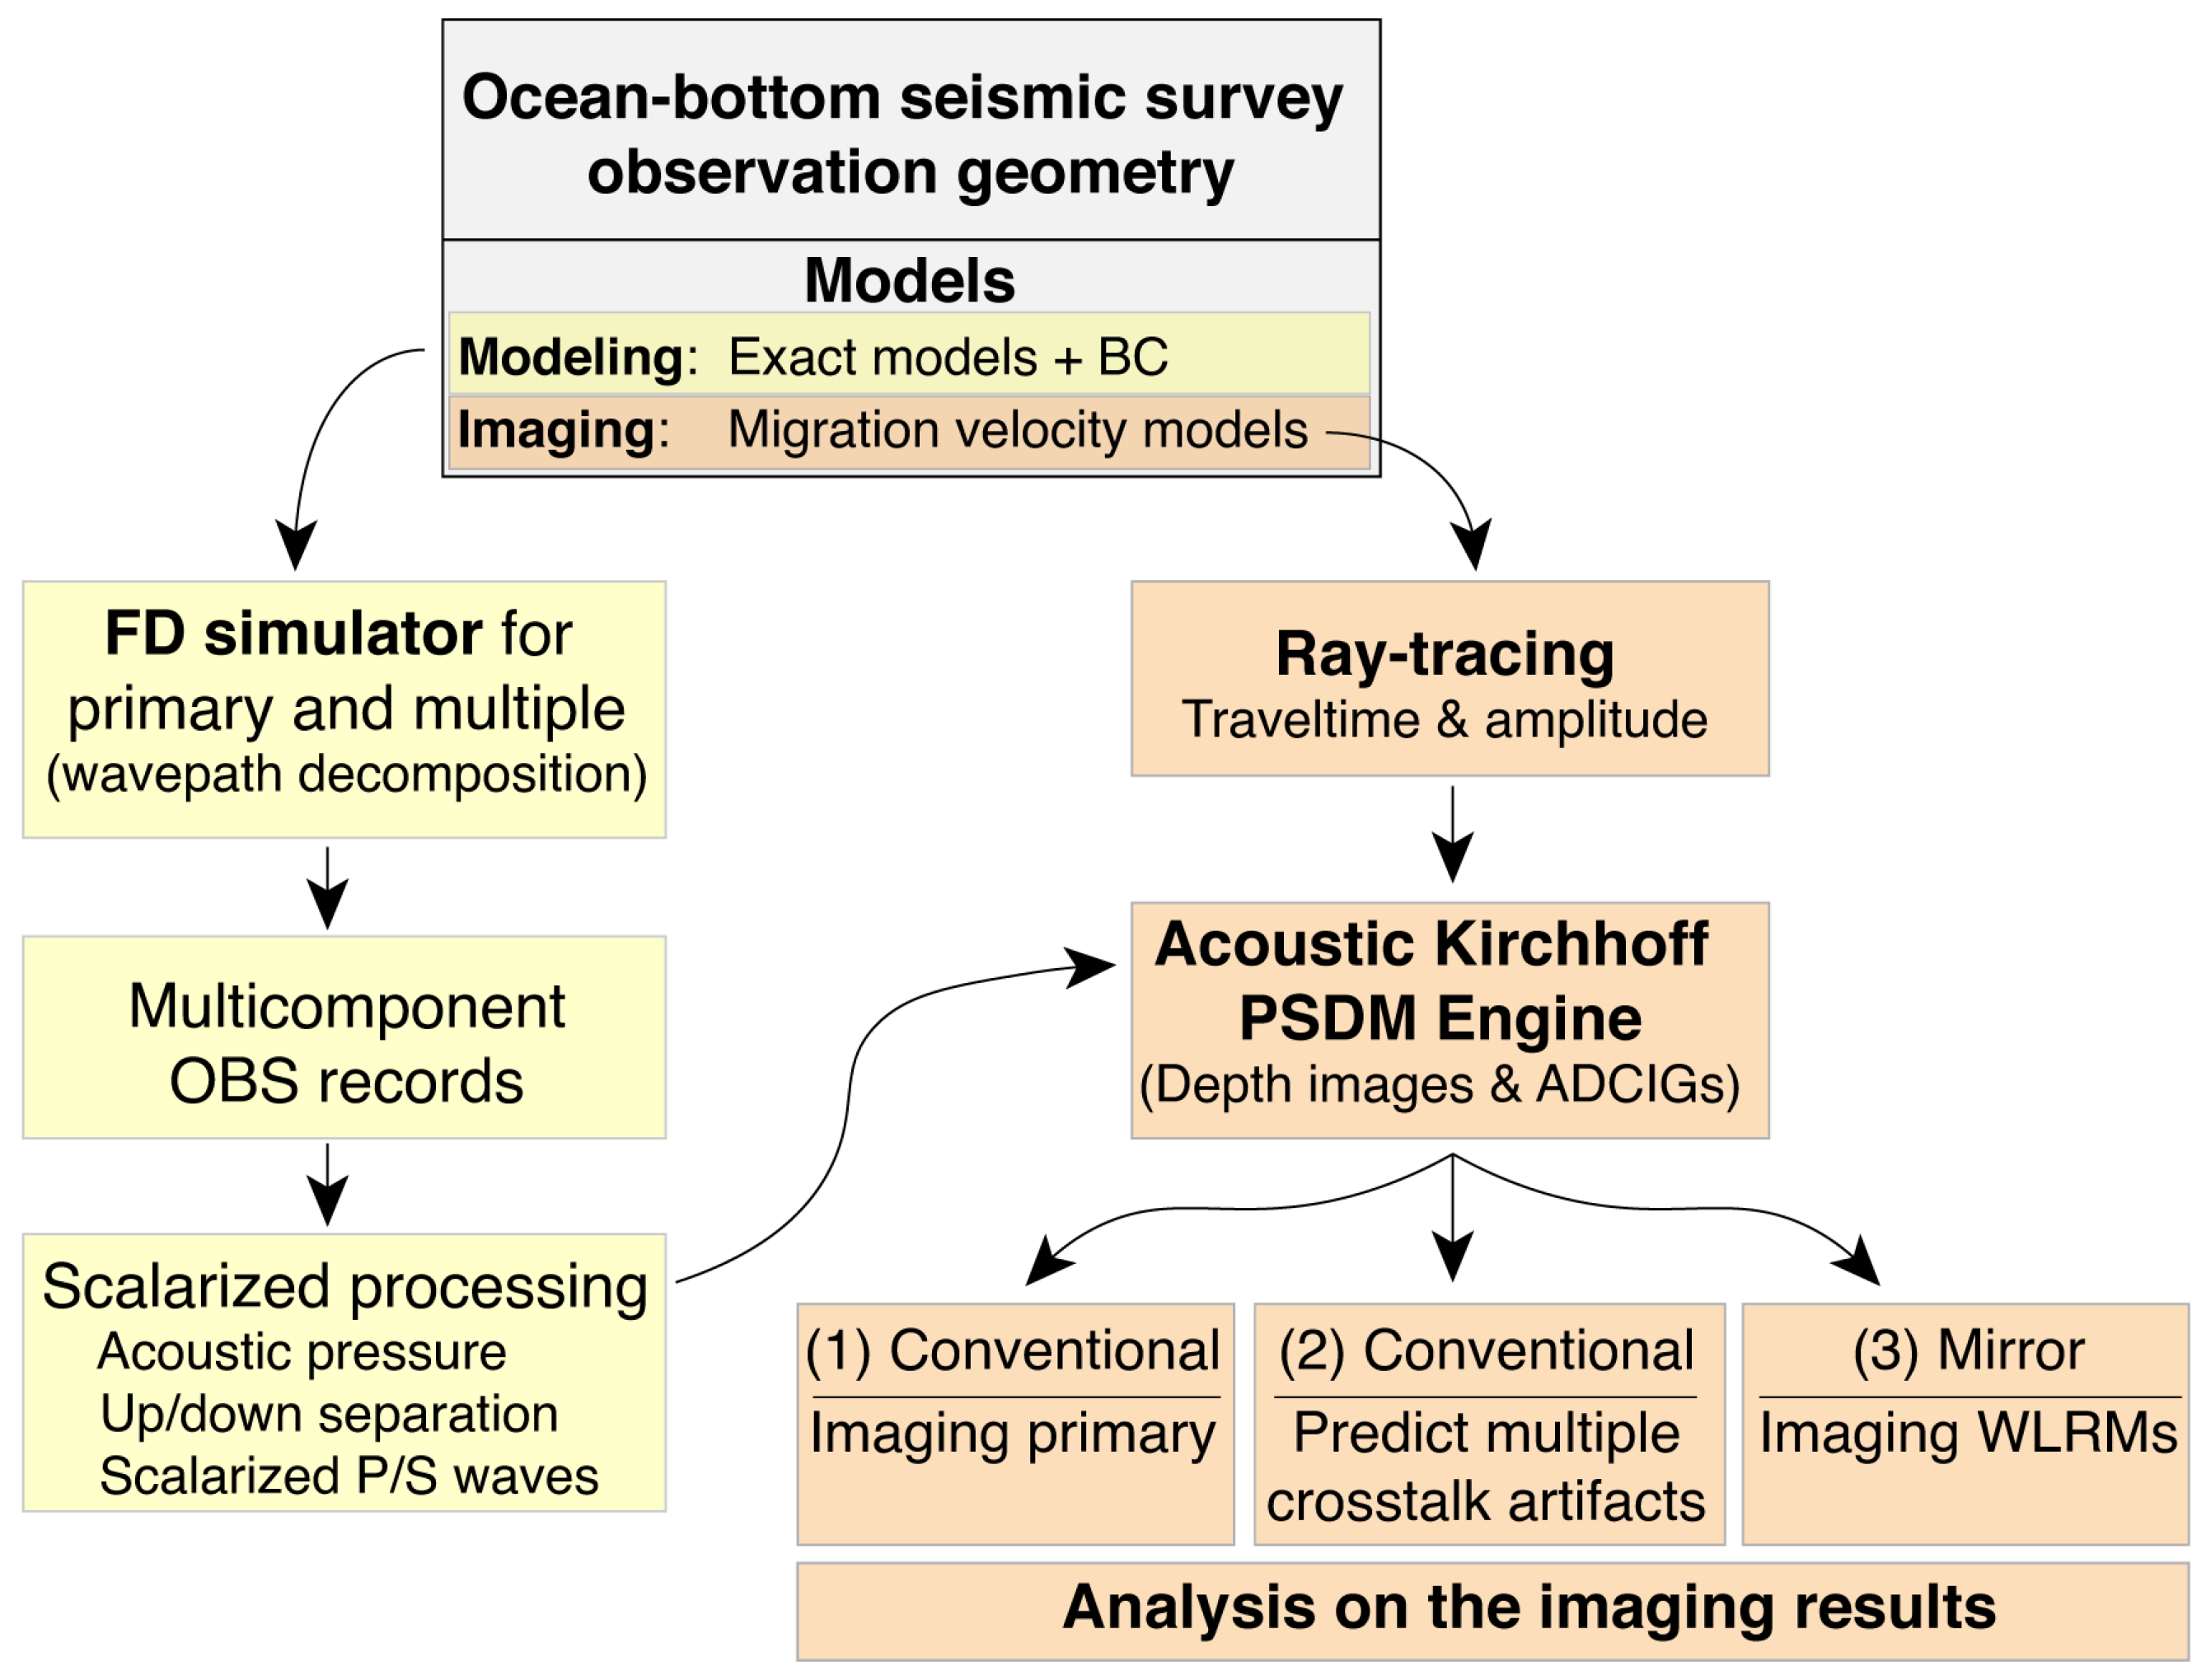
We build up a numerical investigation workflow as illustrated in Figure 2. It combines the FD-based wave simulator (the yellow stream in Figure 2) and the above acoustic Kirchhoff PSDM engine (the orange stream in Figure 2). To image the elastic OBS data, some specific instructions are addressed as follows. There are several types of input data Q. First, in a routine scalar-based treatment, the acoustic pressure component Q = p is input into the migration system. They can be the primary reflections p P or multiple reflections p M . For migrating multiples, our investigation is based on two objectives. One is to predict multiple-related crosstalk artifacts and analyze their characteristics, especially for the WLRMs. The other one is to use the WLRMs as effective signals through the mirror migration scheme.
Alternatively, up-going scalar P- and S-waves separated from the multicomponent OBS dataset can be treated as input records, as Q = { U P , U S } . For convert-wave imaging [10], the polarity reversal issue will occur at normal incidence, and the multi-shot stacking will be influenced. As the ray-based propagator can naturally contain propagation angle information, the polarity reversals can be corrected according to the subsurface angular relationship.
The original mirror migration scheme was designed for imaging down-going ocean-bottom records [58,59,60], in which the processing datum is modified by filling an imaginary water column above the original sea surface, and receiver points are mirrored into the imaginary locations [61,62,63]. In this study, we extended the concept of mirror migration to construct equivalent primary reflection wave paths from WLRM wave paths through mirroring both sources and receivers.

3. An Integrated Investigation with Numerical Examples

Following the basic analysis of multiple reflection events, we conduct an integrated investigation with the Kirchhoff PSDM engine, focusing on simulating the migration responses, predicting multiple artifacts in depth profiles and potential mitigation of the artifacts.

3.1. Migration Responses

3.1.1. Migration Responses of Kirchhoff PSDM for Primary (P-Wave) Reflections

Modeling the migration responses of various events provides us opportunities to distinguish the characteristics of effective signals and multiple-related artifacts. We begin with a simple three-layer model example. The model is shown in Figure 3a, with its model parameters of each layer listed. Here, we consider a configuration consisting of a pair of source and receiver, and their locations are set as x s = (1.3 km, 0.05 km) and x r = (3.7 km, 0.5 km), respectively. According to the six basic wavepaths in class I of Figure 1, we calculate corresponding synthetic multicomponent records. The acoustic pressure traces of the primary reflection and WLRMs are listed in Figure 3b, as numbered from 1 to 6.
First, we calculate the migration responses of the six typical events, as shown in Figure 4. Purposely, we do not distinguish the responses from the primary reflection and multiple reflections. Instead, all the types of records are individually injected into the Kirchhoff PSDM engine, assuming that they are primary reflections. Shown in Figure 4a is the true response, in which the migration ellipse is tangent to the reflector at a depth of 1.25 km. In contrast, artificial migration ellipses are shown in Figure 4b–f.
For this pair of source and receiver, the foci of migration ellipses are fixed; namely, the distance | x s x r | is a constant. The traveltimes ( τ s + τ r ) of the events and the migration velocity control the shape of the migration ellipses. Generally, as the length of the ray path increases, the size of the ellipse becomes larger, spreading to the deeper part. Specifically, both of the ellipses in Figure 4b,c have negative values, as compared to that in Figure 4a, owing to the corresponding ray paths containing one time of reflection at the free surface. Note that the traveltimes are comparable for the receiver- or source-side 1st-order WLRMs; as a result, the ellipses (in Figure 4b,c) have a similar size. As shown in Figure 4d, the migration ellipse of source- and receiver-side 1st-order WLRMs (refer to Figure 1d) has a positive value of the migrated events, as the ray path contains two times of free-surface reflections. Meanwhile, it spreads to the deep part of the model. The events of water reverberations are also projected to the subsurface region under the seafloor, as illustrated in Figure 4e,f. As the two reverberation events have different orders, i.e., 1st-order and 2nd-order, the phases of the migration ellipses are opposite.

3.1.2. Mirror Migration Responses

Next, we try to convert these multiple events into effective signals through a mirror migration strategy [58,59,60,61,62,63].
(1) Mirror migration ellipses in an analytical perspective
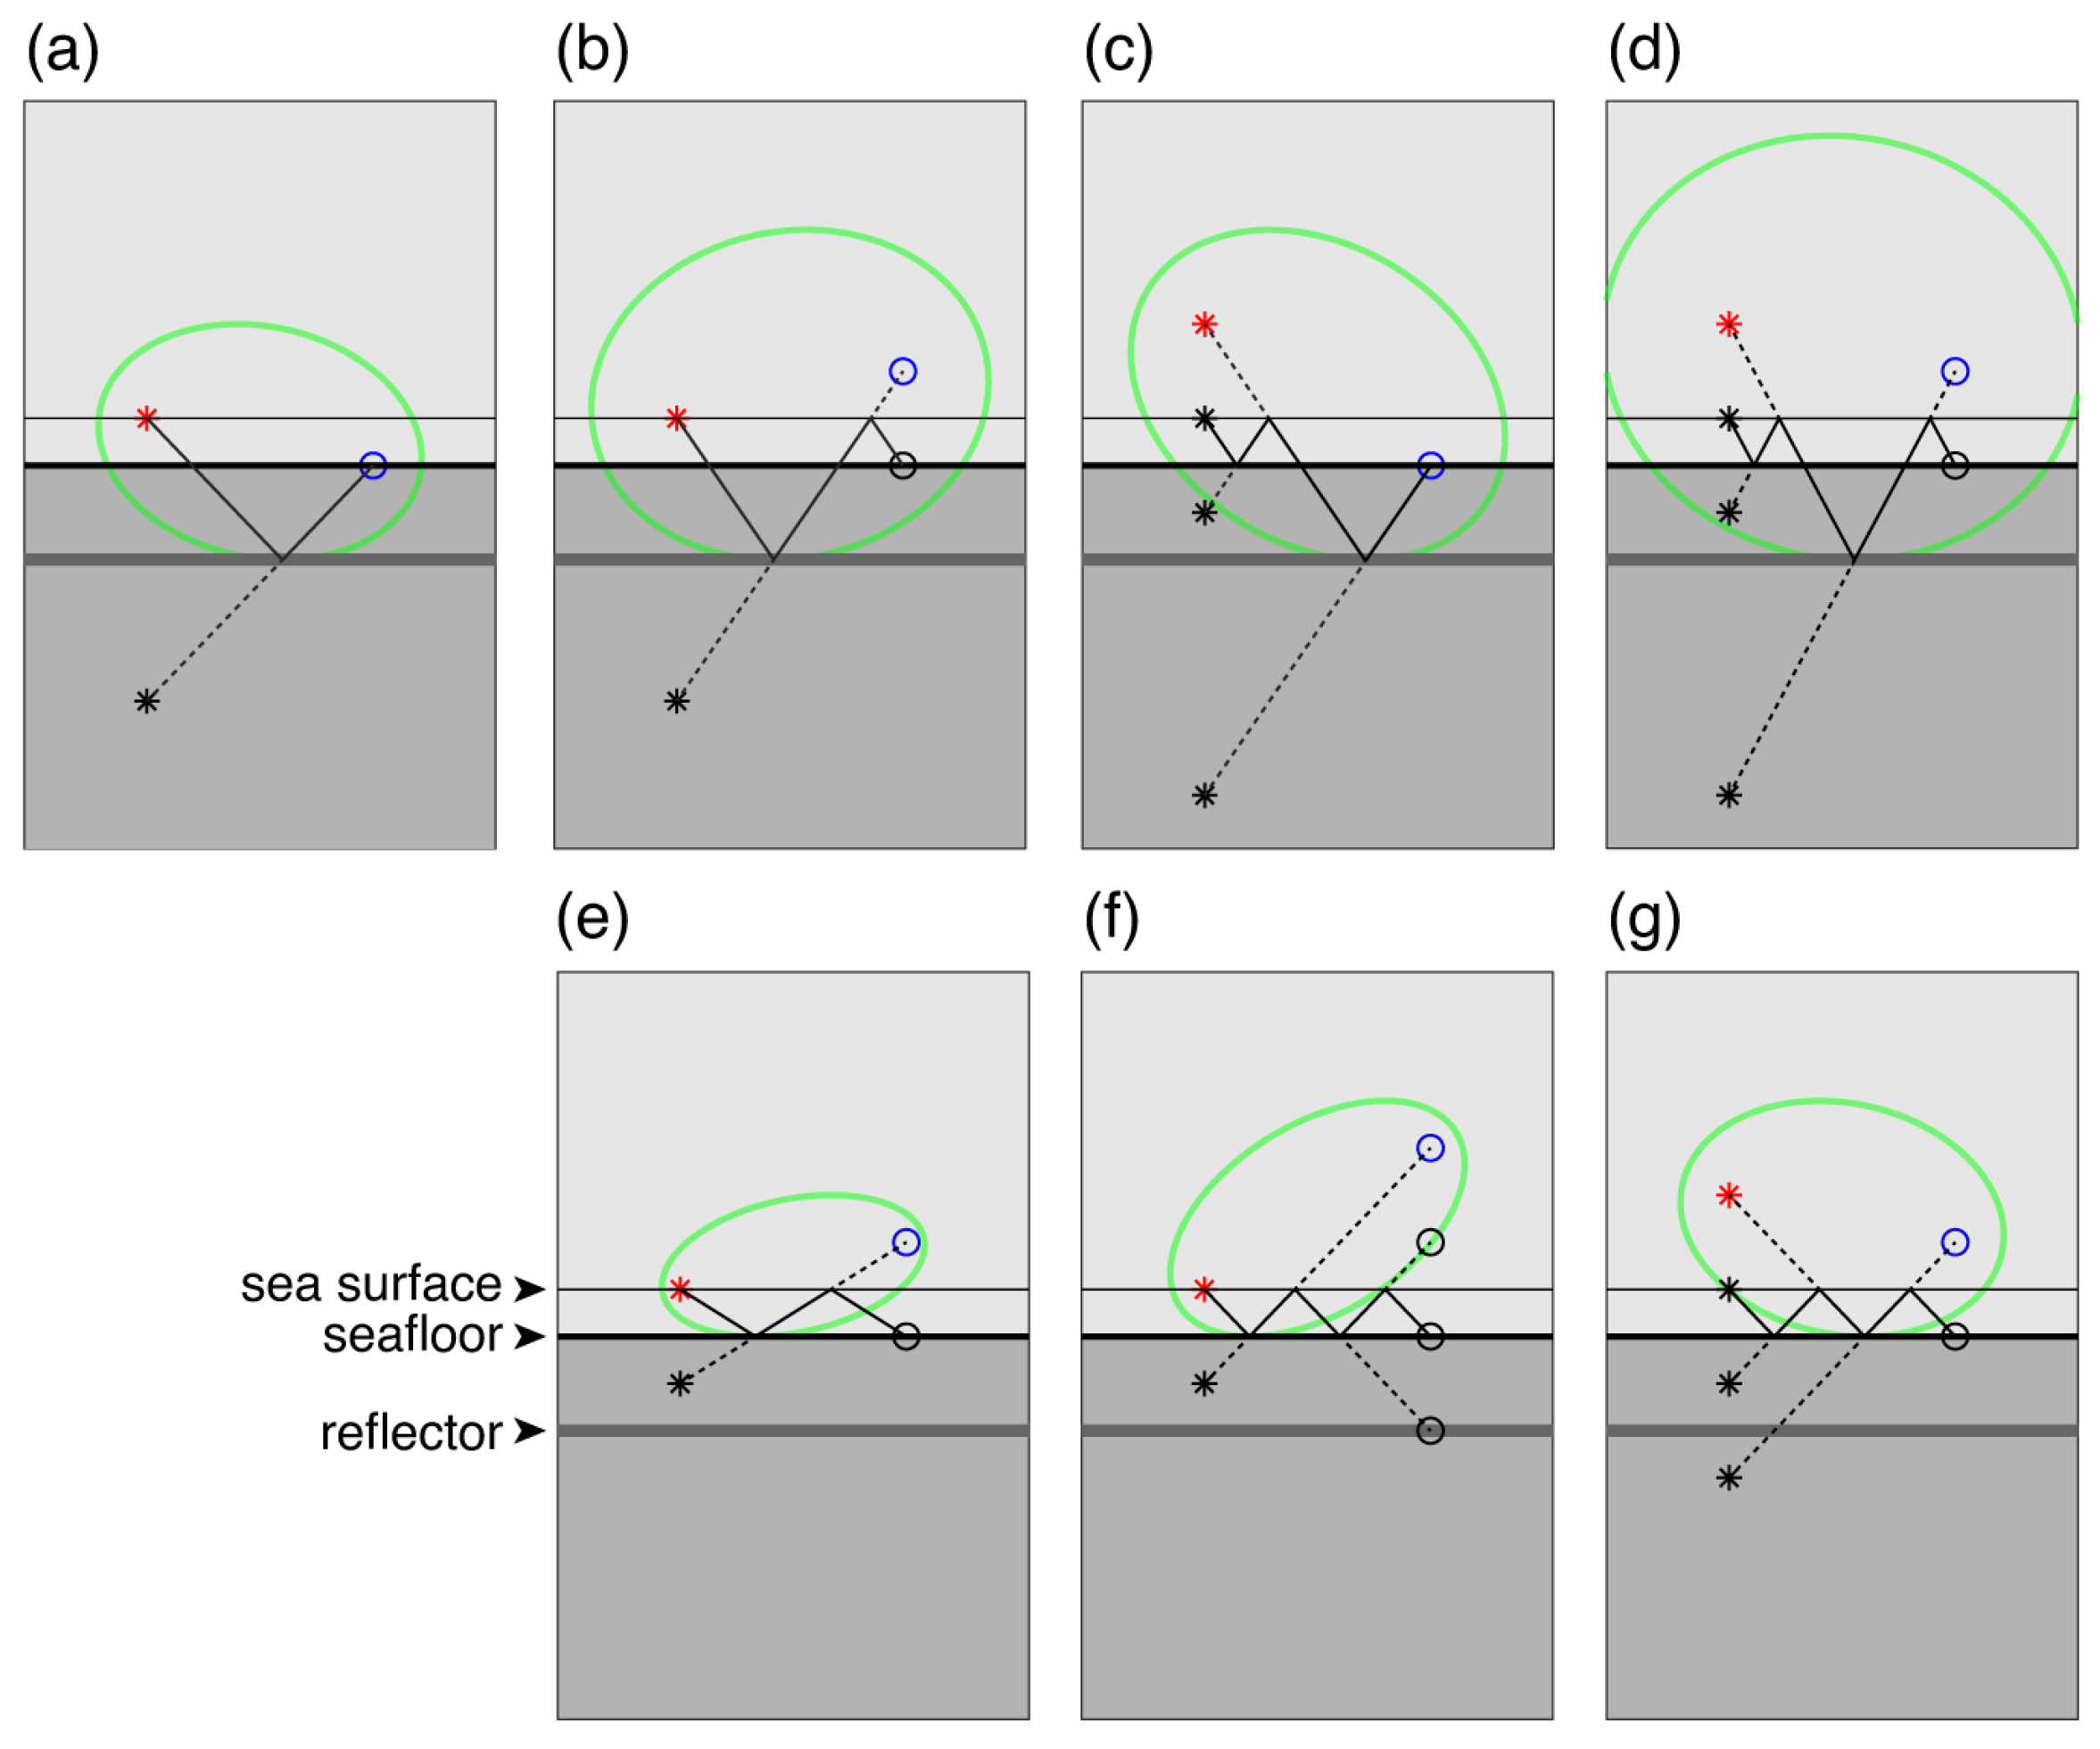
We first conduct an analysis of a generalized mirror migration system from a geometric perspective. Shown in Figure 5 are the analytical ellipses formed by mirrored sources and/or receivers. Specifically, we list the ellipse of the primary up-going P-wave event (pPP reflection) in Figure 5a for a comparison benchmark, corresponding to the scenario in Figure 1a and Figure 4a. Illustrated in Figure 5b,c are the ellipses of receiver- or source-side 1st-order WLRMs, in which the receiver or source is mirrored above the sea surface. The 1st-order WLRMs of the receiver- or source-side are converted to equivalent primary reflections. In this illustration figure, the red asterisk and blue circle are used to indicate the source and receiver in the equivalent primary ray path, while black asterisks and circles, as well as dashed rays, are used to highlight the mirror process. The migration ellipses are highlighted in green. In a more complicated case shown in Figure 5d, where both source- and receiver-side 1st-order WLRMs are included in the ray path. Correspondingly, the migration ellipse is constructed through mirroring both the source and receiver. As the ocean-bottom multicomponent receivers are deployed on the seafloor, primary reflections of the seafloor cannot be recorded as the conventional marine towed-streamer acquisition does. Multiples in the water layer, e.g., water reverberations, are usually used for imaging the seafloor, as well as the fine structures below the seafloor. For example, by mirroring the receiver, the 1st-order water reverberations can be used as equivalent primary reflections to image the seafloor, the mirror migration ellipse is illustrated in Figure 5e. For higher-order reverberations, the ray path interacts with the seafloor more than once. Consequently, a specific reflection at the seafloor can be reconstructed for imaging the seafloor. Taking the 2nd-order water reverberation as an example, Figure 5f,g show the migration ellipses associated with the first and second reflection points, respectively. Based on the geometric relationship, the above analysis on migration ellipses benefits in understanding the contribution of WLRMs in mirror migrations.
(2) Mirror migration responses of Kirchhoff PSDM
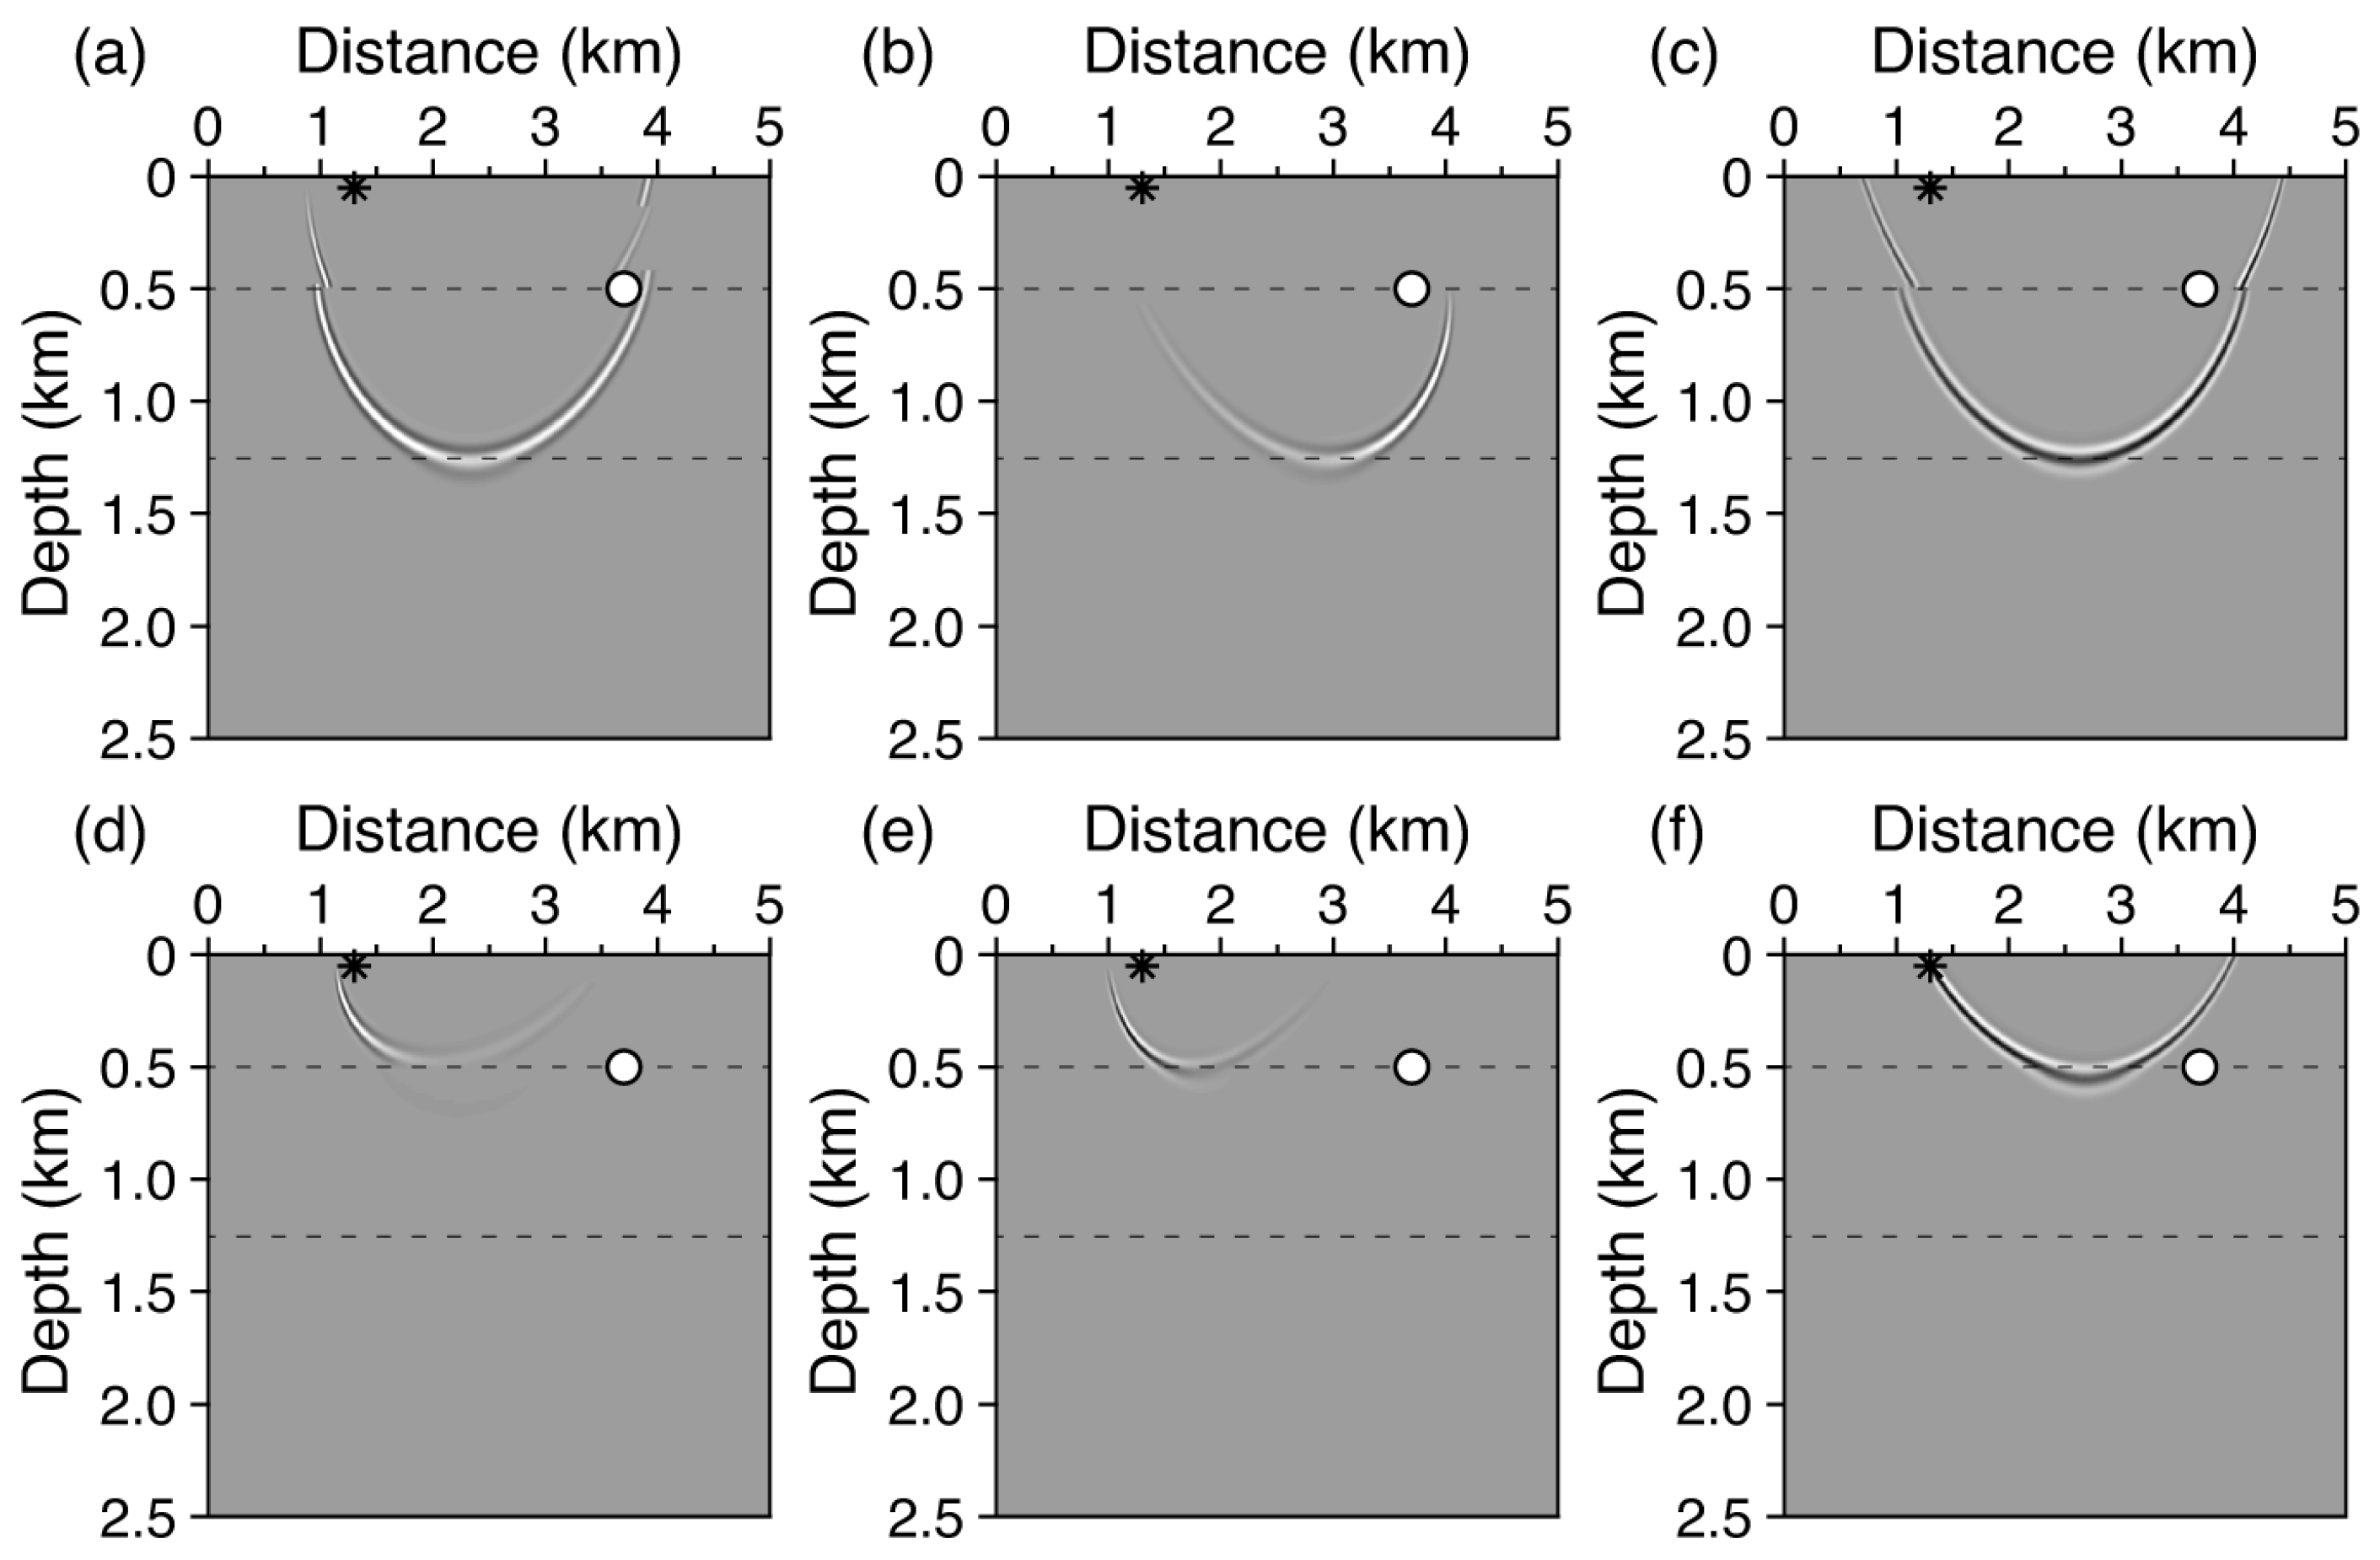
Following the above geometric analysis, through the mirror Kirchhoff PSDM engine, we calculate the mirror migration responses of P-wave reflections in Figure 6. In detail, the receiver- or source-side 1st-order WLRMs are converted to the equivalent primary reflections, as illustrated in Figure 6a and Figure 6b, respectively. Note that the points of tangency (i.e., the effective image point y ) between the ellipse and the reflector are different; specifically, the former is horizontally close to the source location x s , while the latter is close to the receiver location x r . This difference is due to the dip of the major axis of the mirror migration ellipses. The mirror migration response of the source- and receiver-side 1st-order WLRM is shown in Figure 6c, in which the imaging point is horizontally closer to the middle location of x s and x r . The mirror migration responses of the 1st- and 2nd-order water reverberations are shown in Figure 6d–f, where the effective imaging points y are located on the seafloor.

3.1.3. Imaging Elastic-Wave Reflections

In the previous experiments, the migration responses were obtained by projecting the acoustic pressure component to the subsurface under the acoustic assumption. We turn to calculate the migration responses of scalarized elastic waves extracted from the multicomponent ocean-bottom dataset.
(1) Elastic wave modes pPP, pPS, pSP, and pSS
First, we consider the up-going reflections, the basic ray path of which is illustrated in Figure 1a. The acoustic signal emitted from the source propagates downward and interacts with the seafloor, generating the down-going transmission waves, namely, the pP and pS waves. Then, they act as incident waves to the reflector, where reflections between different wave modes are generated, forming the pPP, pPS, pSP, and pSS events, as illustrated in the top row of Figure 7. Through our FD-based wave simulator, we generate the up-going P- and S-wave reflections, and separate the specific events according to their traveltimes. We calculate the migration responses using the Kirchhoff PSDM engine, in which the specific wave paths are determined through the associated P- and S-wave velocities.
Shown in the bottom row of Figure 7 are the elastic migration responses. The elastic pPP response in Figure 7a is similar to the image from the acoustic pressure component in Figure 4a. For the responses of convert-wave events, pPS in Figure 7b and pSP in Figure 7c, they have different conversion points on the reflector, corresponding to different locations of tangency between the migration ellipse and the reflector, as referred to the ray paths. The pSS response is illustrated in Figure 7d. Compared to the other three response patterns, the pSS pattern has the highest resolution, i.e., the shortest wavelength, following the relationship λ ( pPP ) > λ ( pPS , pSP ) > λ ( pSS ) .
(2) Convert-wave PS responses
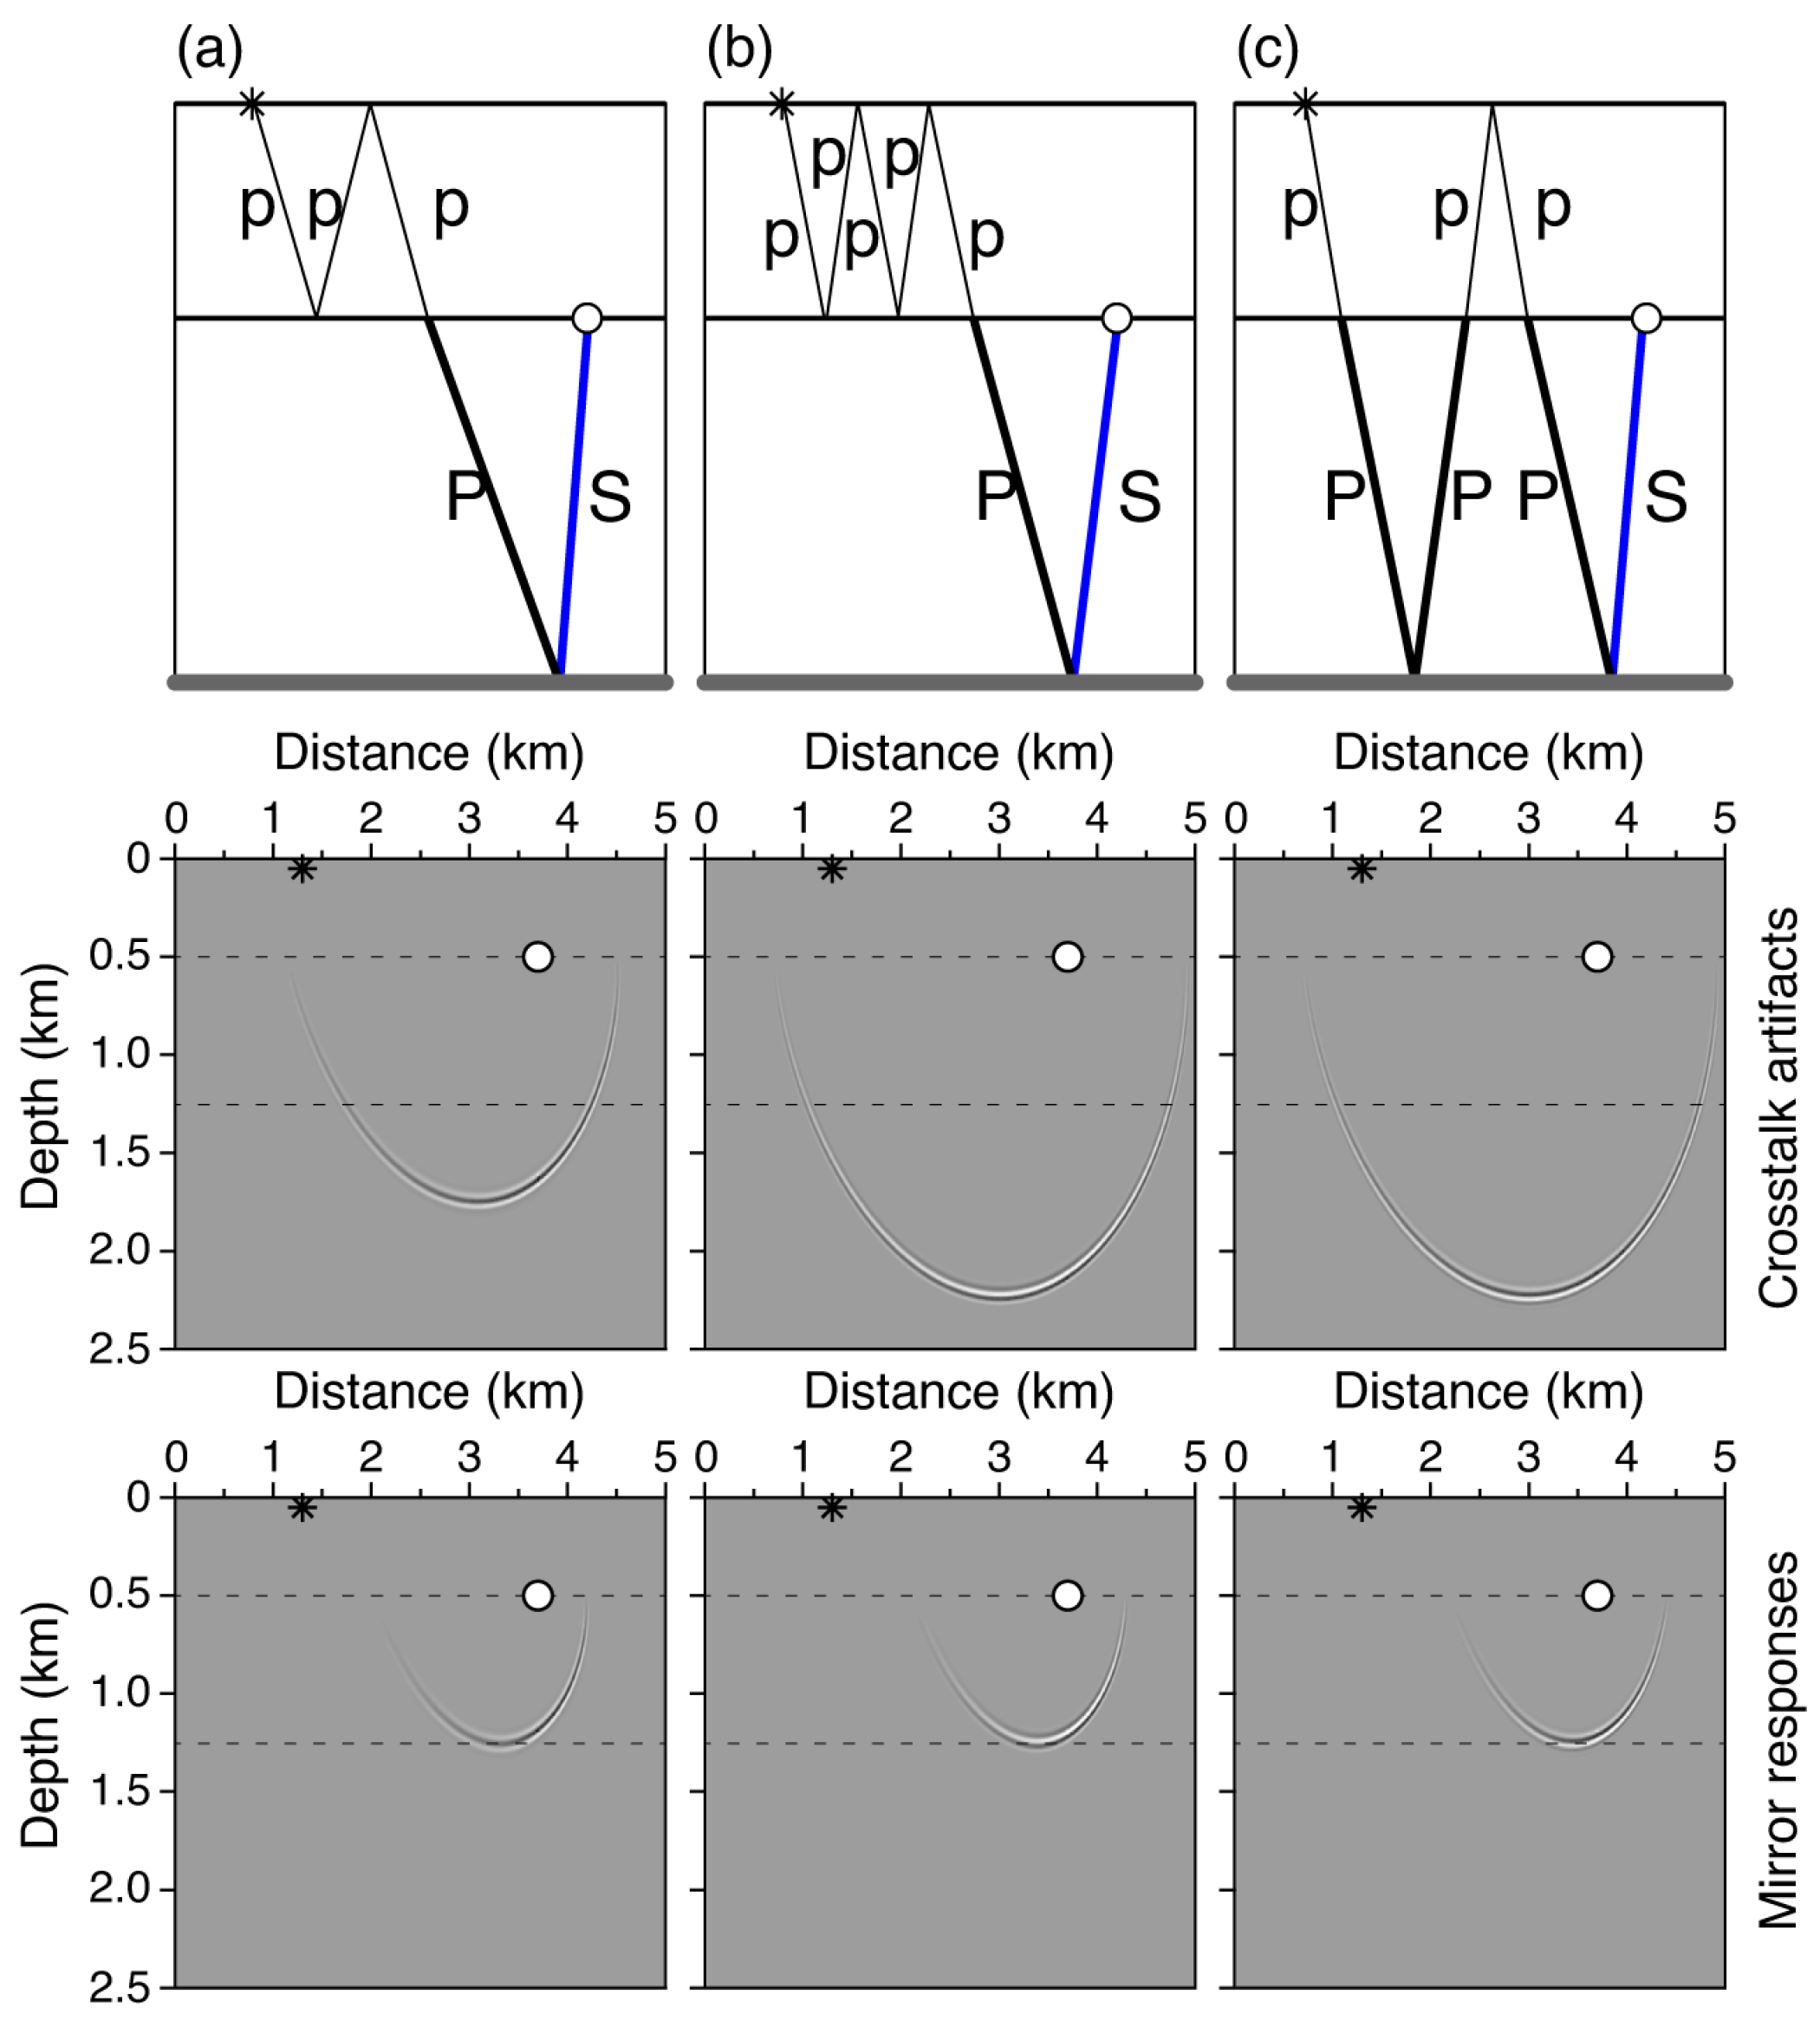
One of the advantages of the OBS surveys is that the multicomponent records contain S-wave events. Hence, we turn our focus to the up-going S-wave records. Besides the convert-wave event pPS, the ray path of which is illustrated in Figure 7b, multiple reflections may also contain PS segments, such as the source-side 1st-order (top diagram in Figure 8a) and 2nd-order (top diagram in Figure 8b) WLRMs, and the long-term free-surface-related multiple (top diagram in Figure 8c). During the forward modeling of these events, we extract the corresponding up-going S-wave records. Next, we mimic two specific application scenarios. First, if these multiple PS events cannot be effectively identified, they will be treated as primary PS reflection events and projected to the subsurface. By using the acoustic Kirchhoff PSDM, we calculate the migration responses of the three events, as shown in middle row of panels in Figure 8a–c. The multiple PS wave paths are mistakenly reconstructed by the primary pPS wave path, forming incorrect responses.
On the contrary, in the second scenario, if the proper PS wave paths are reconstructed, these convert-wave reflections can provide effective images of the subsurface reflectors. Similar to the previous experiment, we reconstruct proper wave paths under a mirror Kirchhoff PSDM frame, and the S-wave ray paths are taken into consideration. The effective migration responses of the multiple convert-wave events are illustrated in the bottom row of panels in Figure 8a–c. By comparing the PS conversion points in the migration responses, we demonstrate that the multiples provide wider illumination ranges.

3.2. Wave-Mode Crosstalks and Artifact Characteristics

3.2.1. WLRM Crosstalk Artifacts

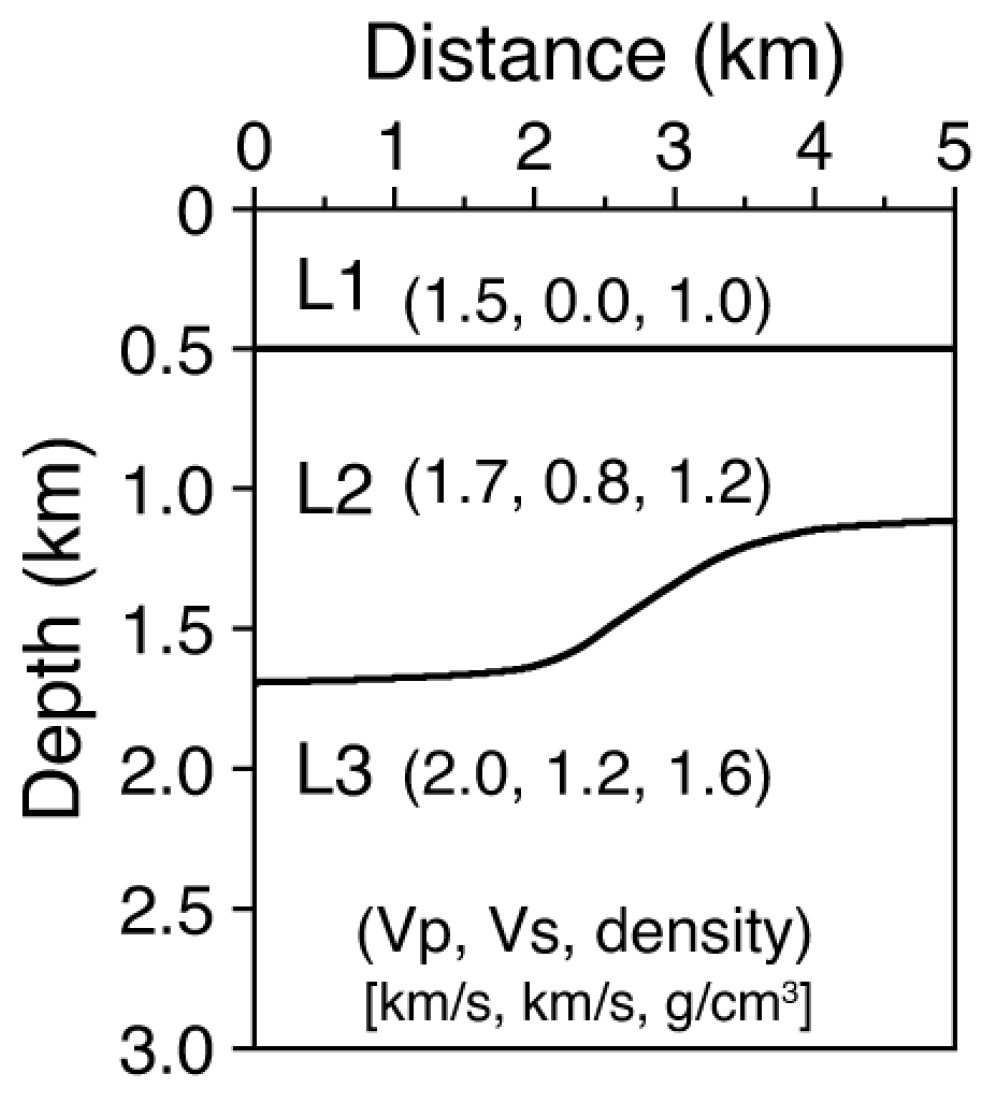
In this section, we investigate the wave-mode crosstalk artifacts through a model with simple structures. Shown in Figure 9 is a three-layer model, with its model parameters listed in the figure. The top layer is a constant water layer that is overlaid on the elastic domain. A curved interface is set in the deeper part to mimic a bottom simulating reflector (BSR) [64,65,66]. The grid size of the model is set as 5 m. By using the FD wave simulator, we calculate the six types of synthetic datasets following class I in Figure 1. For each specific simulation, 41 explosive sources are excited just below the sea surface within the horizontal range between 0.5 km and 4.5 km, with an interval of 0.1 km. Multicomponent receivers are evenly distributed along the flat seafloor at a depth of 0.5 km. Both the acoustic pressures and the elastic particle velocities are recorded.
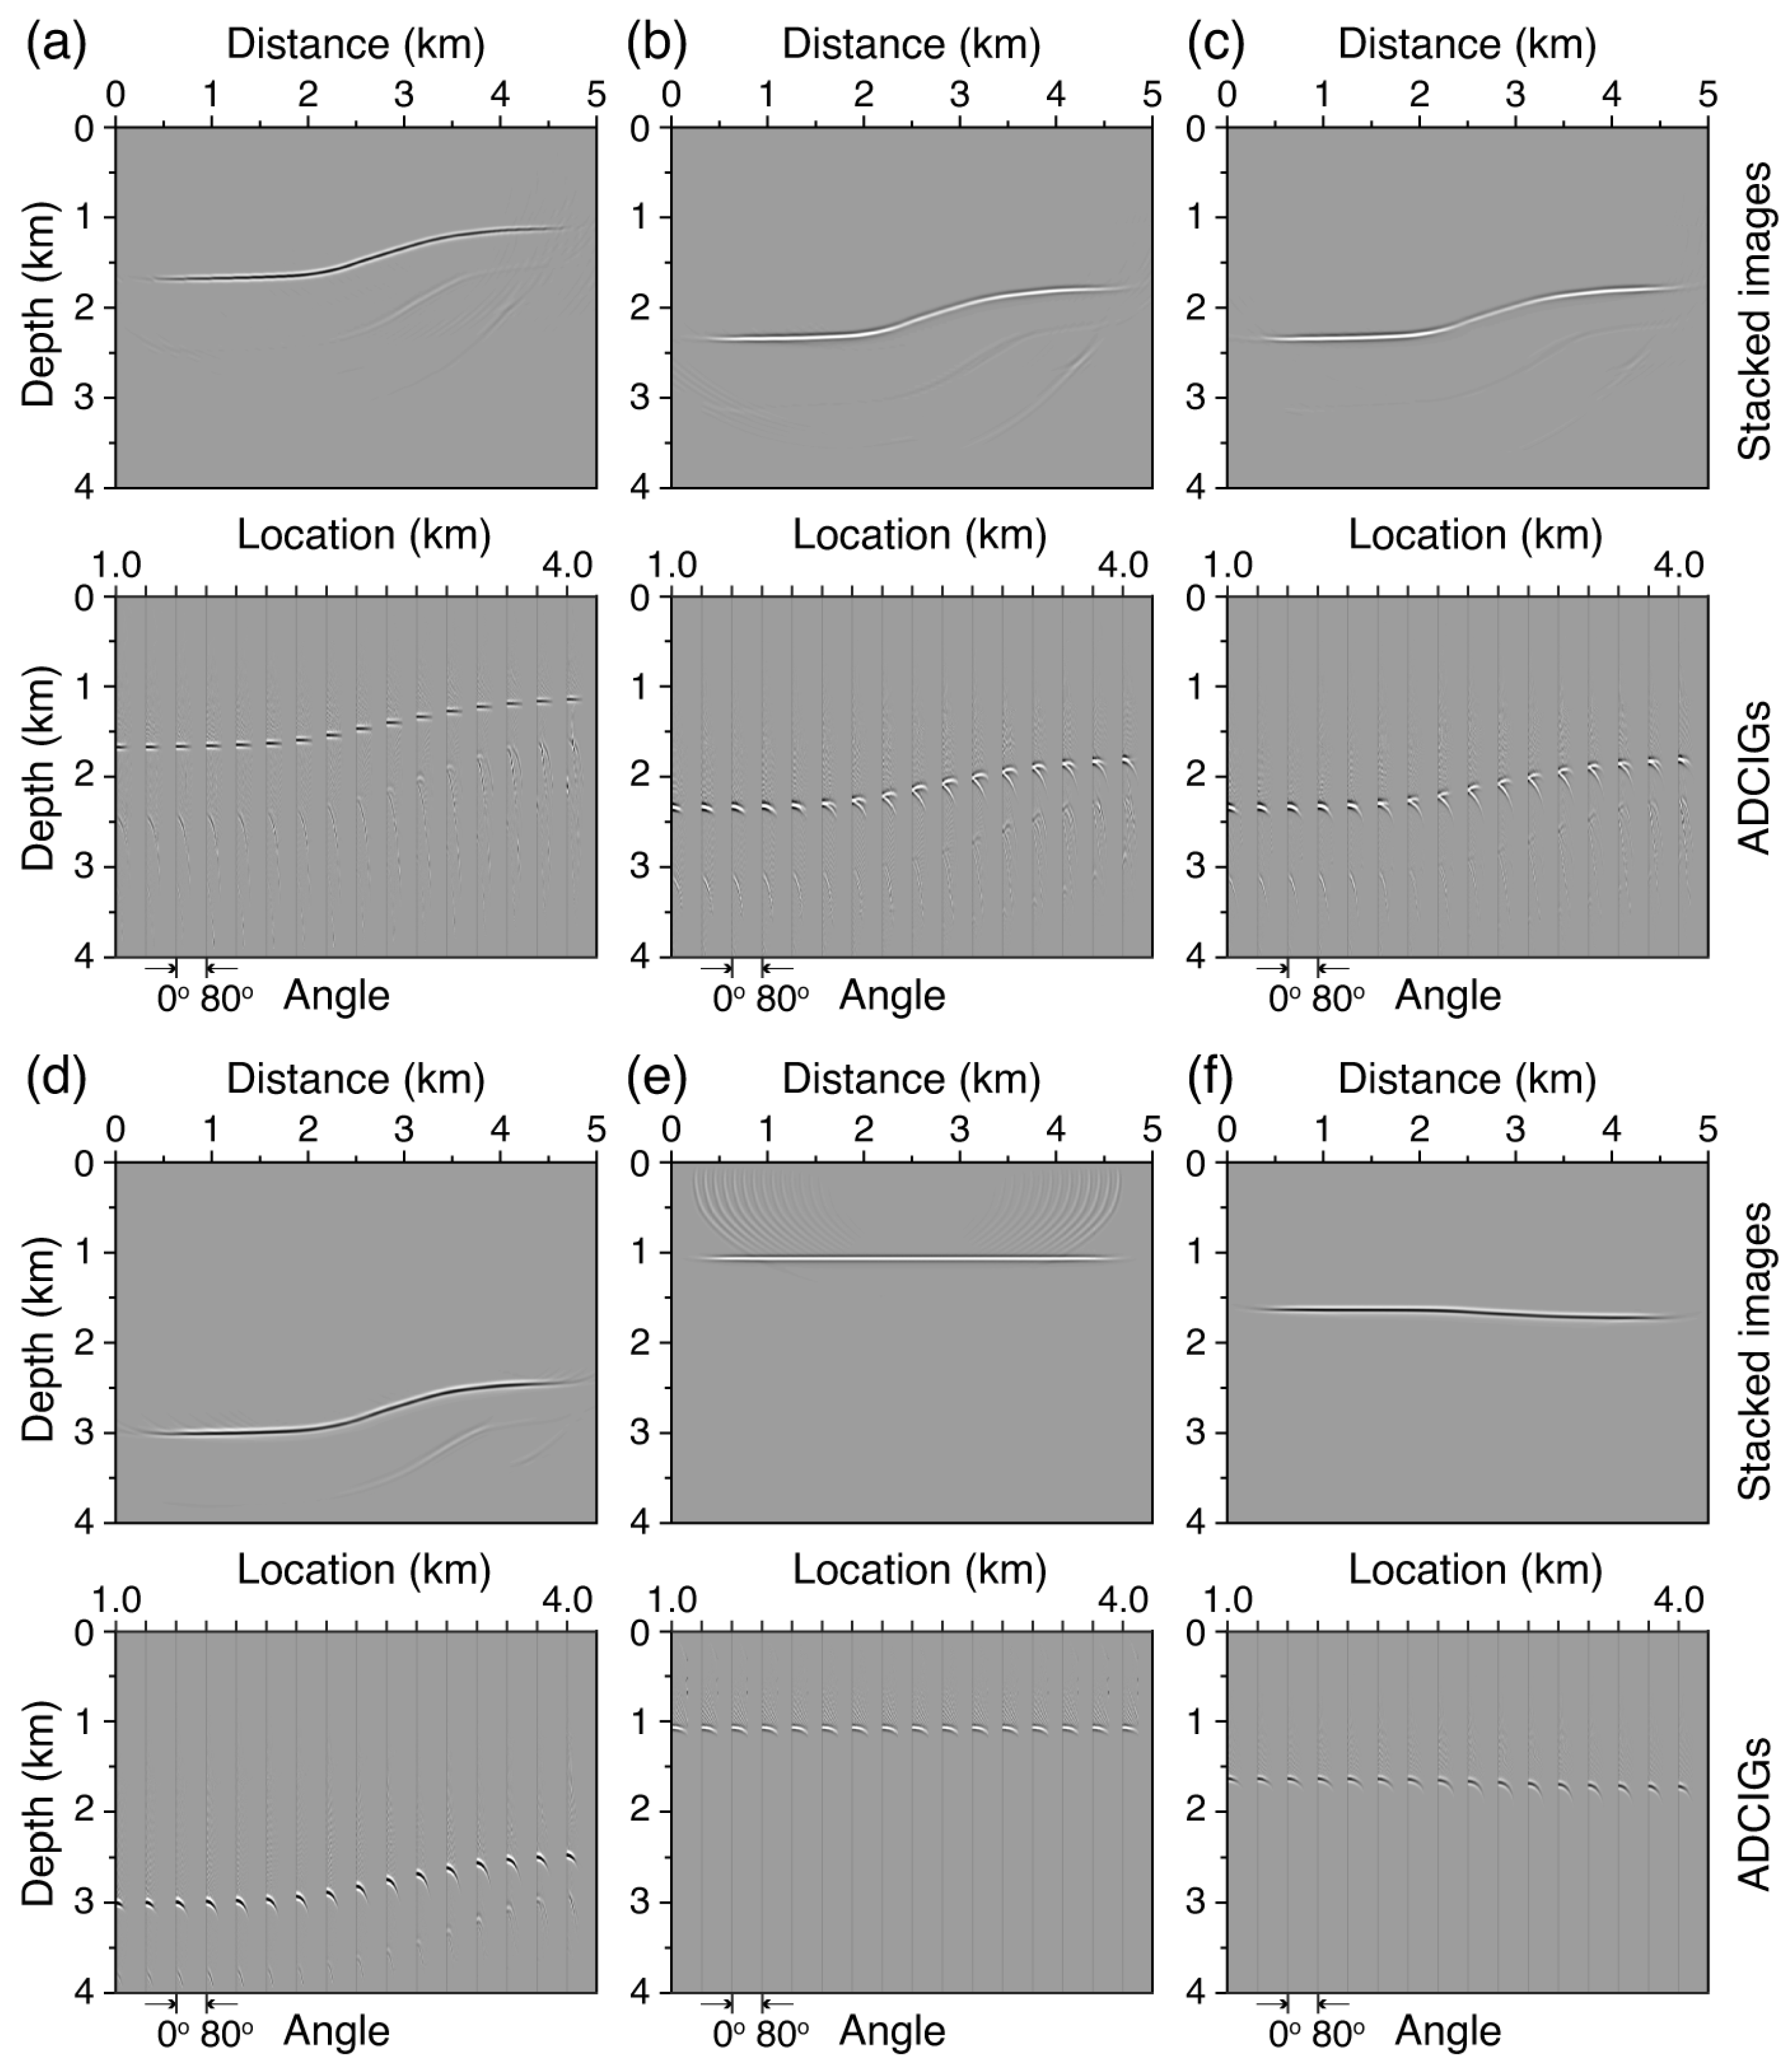
One of our objectives is to investigate the crosstalk artifacts caused by various types of WLRMs. We input the acoustic pressure component into a conventional Kirchhoff PSDM engine and perform a series of depth migrations. Namely, we only use the P-wave velocity model to conduct PP imaging. Shown in Figure 10 are the stacked multi-shot depth images (top subplot) and ADCIGs (bottom subplot) of the six types of synthetic datasets.
The depth image of the primary reflections properly reveals the true structure of BSR. However, there are additional artifacts caused by convert-wave events, such as the pPS, pSP, and pSS, as illustrated in Figure 10a. The other multiple wave events result in crosstalk artifacts. Specifically, the receiver-side (Figure 10b) or the source-side (Figure 10c) 1st-order WLRMs have similar recording time, thereby causing imaging artifacts in a relatively deep part with approximately the same location. The crosstalk artifacts caused by source- and receiver-side 1st-order WLRMs appear deeper in Figure 10d, which may contaminate the potential true images in the deep parts. In these depth images and ADCIGs, the convert-wave artifacts appear below the artificial BSR events. Specifically, the downward curvature of the artifacts in ADCIGs can be quite large. Water reverberations are projected into the solid domain, below the true location of the seafloor. As the order of reverberation increases, the artifacts move deeper, as shown in Figure 10e,f. Meanwhile, the moveout in ADCIGs increases in Figure 10f, compared to that in Figure 10e. Note that the horizontal variations in the migration velocity model result in a slightly bent artifact from the 2nd-order water reverberations in Figure 10f. The phases of artifacts are consistent with that of the migration responses in Figure 4.

3.2.2. Using WLRMs as Effective Signals Through the Mirror Kirchhoff Migration

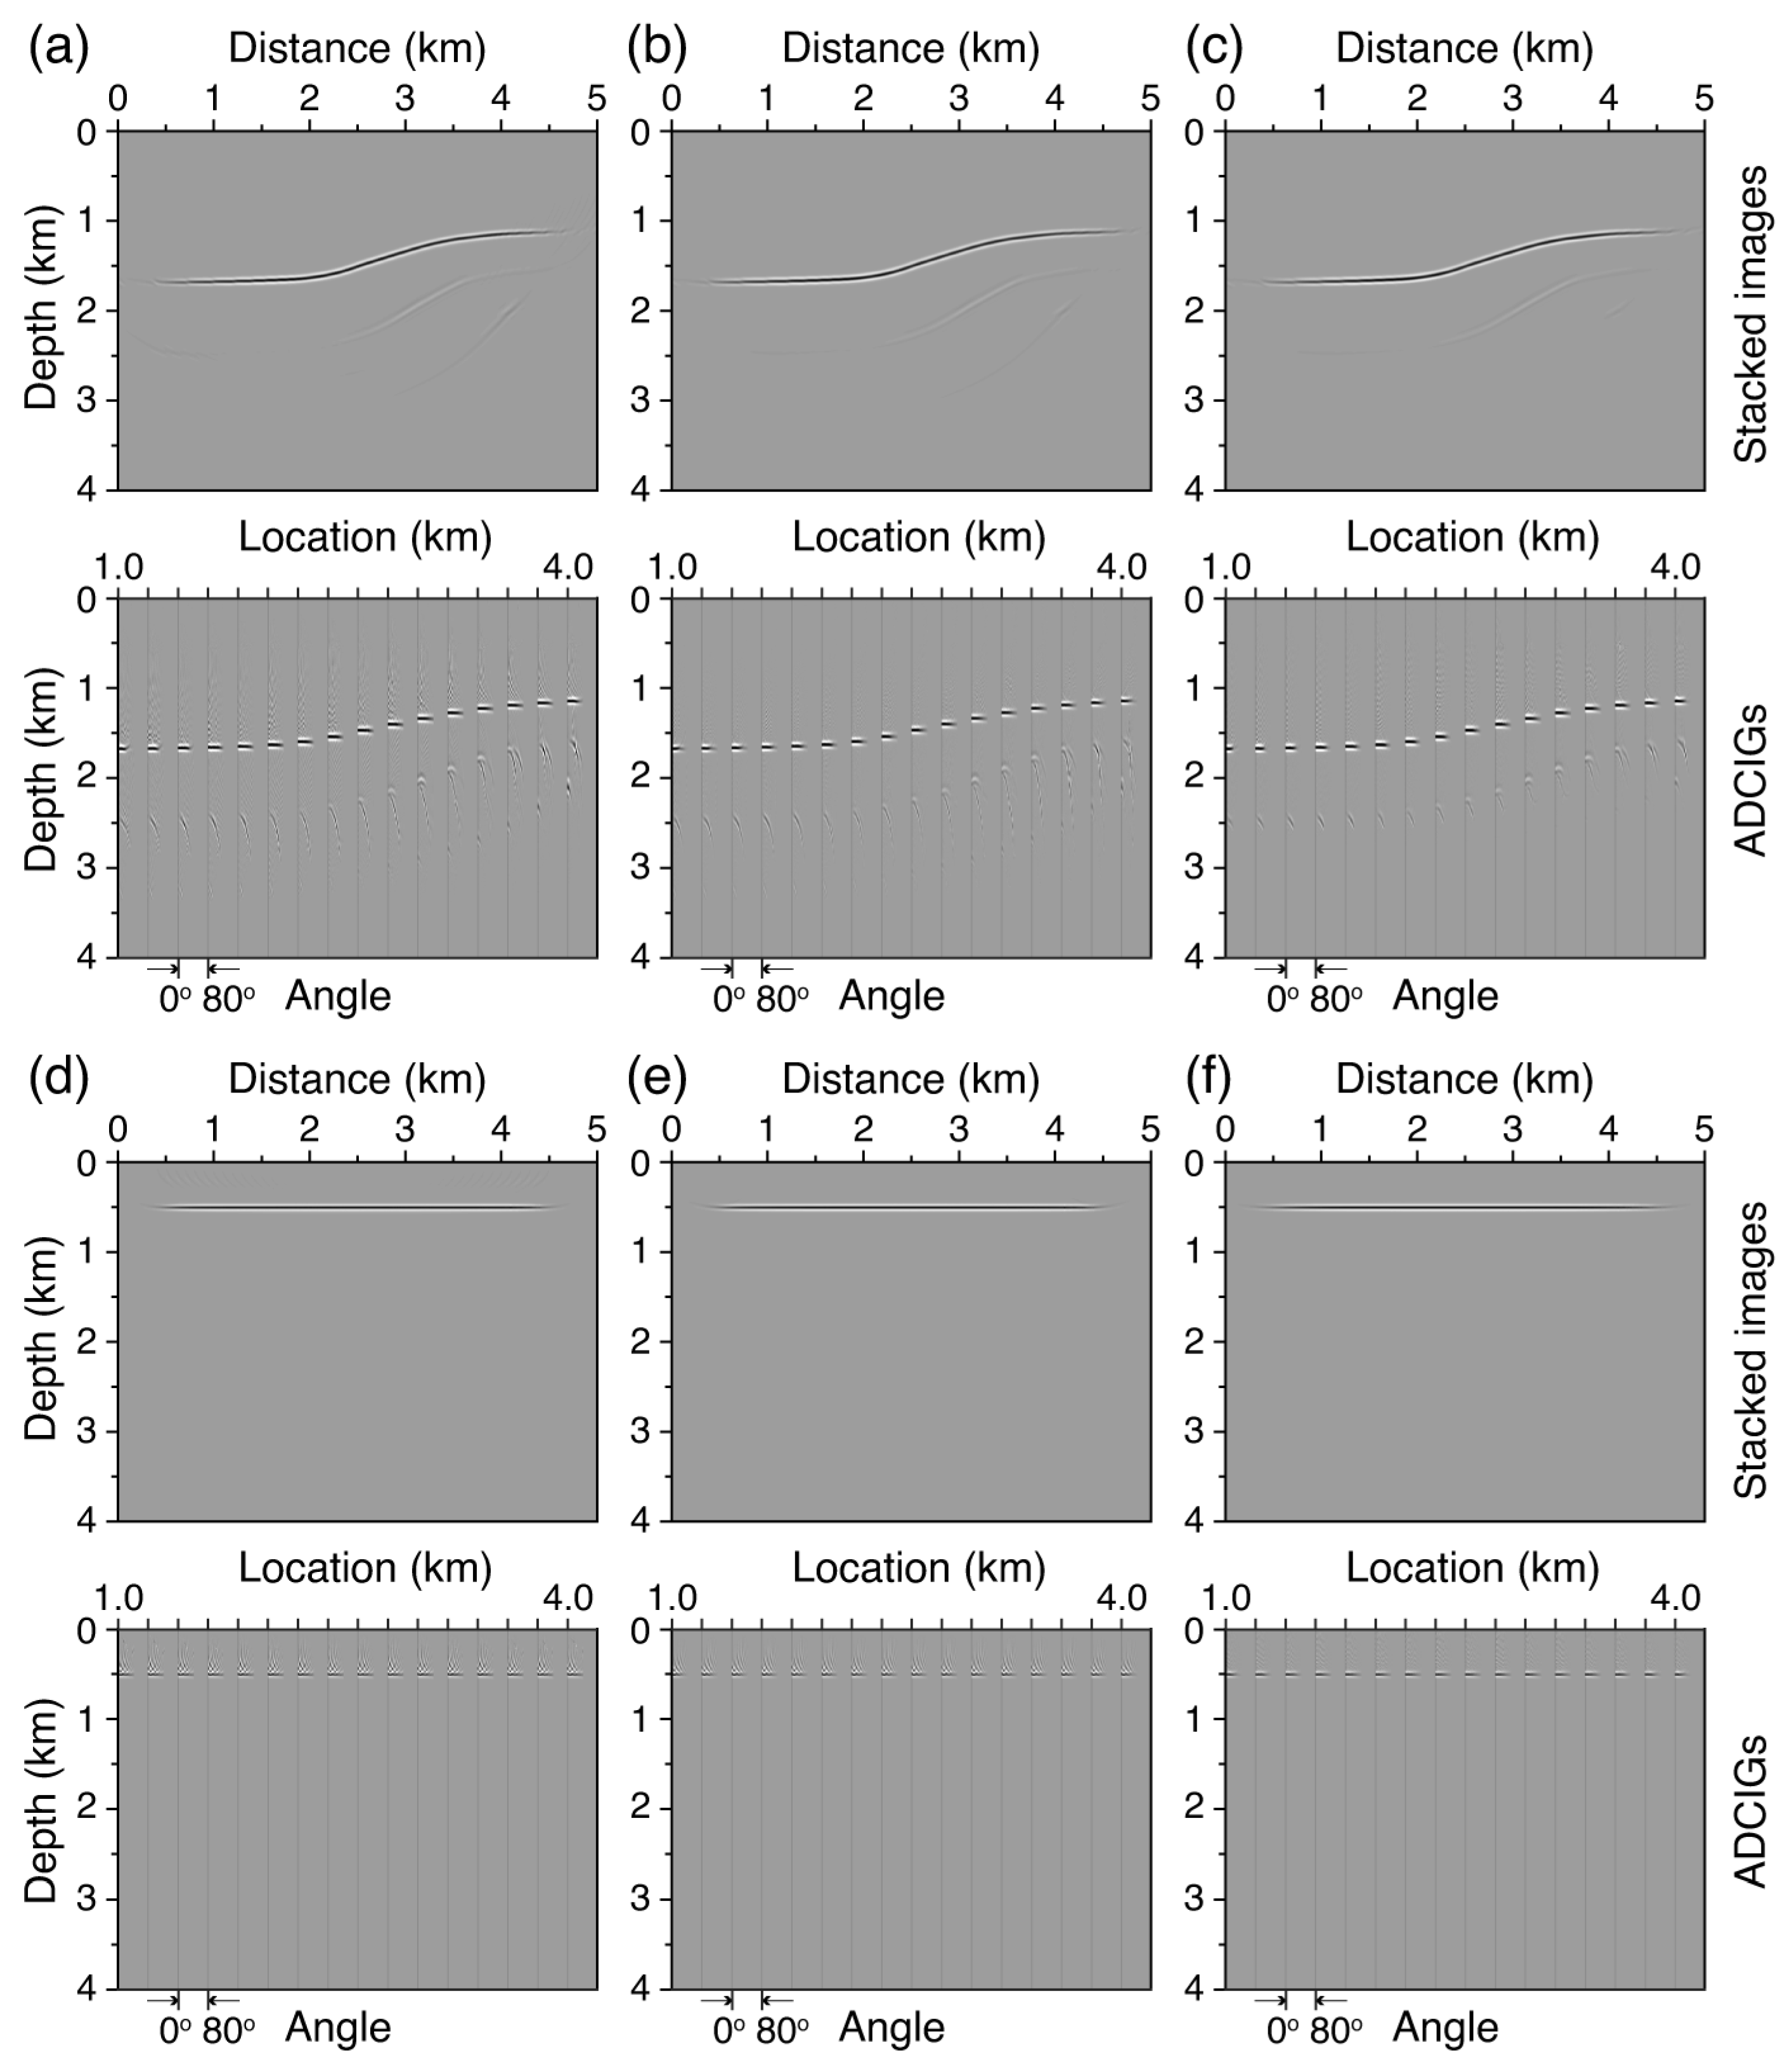
Following the previous analysis on the mirror migration responses in Figure 5 and Figure 6, we migrate the WLRMs with the mirror Kirchhoff PSDM. Namely, we try to convert the multiple crosstalk artifacts in Figure 10 into effective images. For the receiver- or source-side 1st-order WLRMs, the receivers or sources are, respectively, mirror-positioned, thereby converting them into equivalent (up-going) primary reflection, and the associated depth images and ADCIGs are shown in Figure 11a,b. Similarly, the source- and receiver-side 1st-order WLRMs can be properly imaged by simultaneously mirroring the sources and receivers. The proper depth image and ADCIGs are obtained in Figure 11c. Since the ocean-bottom receivers are mirrored to the location above the sea surface, the seafloor can be imaged through water reverberations of different orders. Following the explanations in Figure 5e, Figure 5f, and Figure 5g, we perform mirror Kirchhoff migrations to the down-going water reverberations, and the depth images and ADCIGs are illustrated in Figure 11d, Figure 11e, and Figure 11f, respectively. Through the mirror migration, the artifacts in the depth profiles are projected to the correct location, and the corresponding angle gathers are flattened at the correct depth. In this experiment (Figure 11), the phases in the mirror migration images are corrected with the consistent sign, according to the migration responses (Figure 6) as a prior constraint.

3.2.3. PP and PS Imaging with Acoustic Kirchhoff PSDM

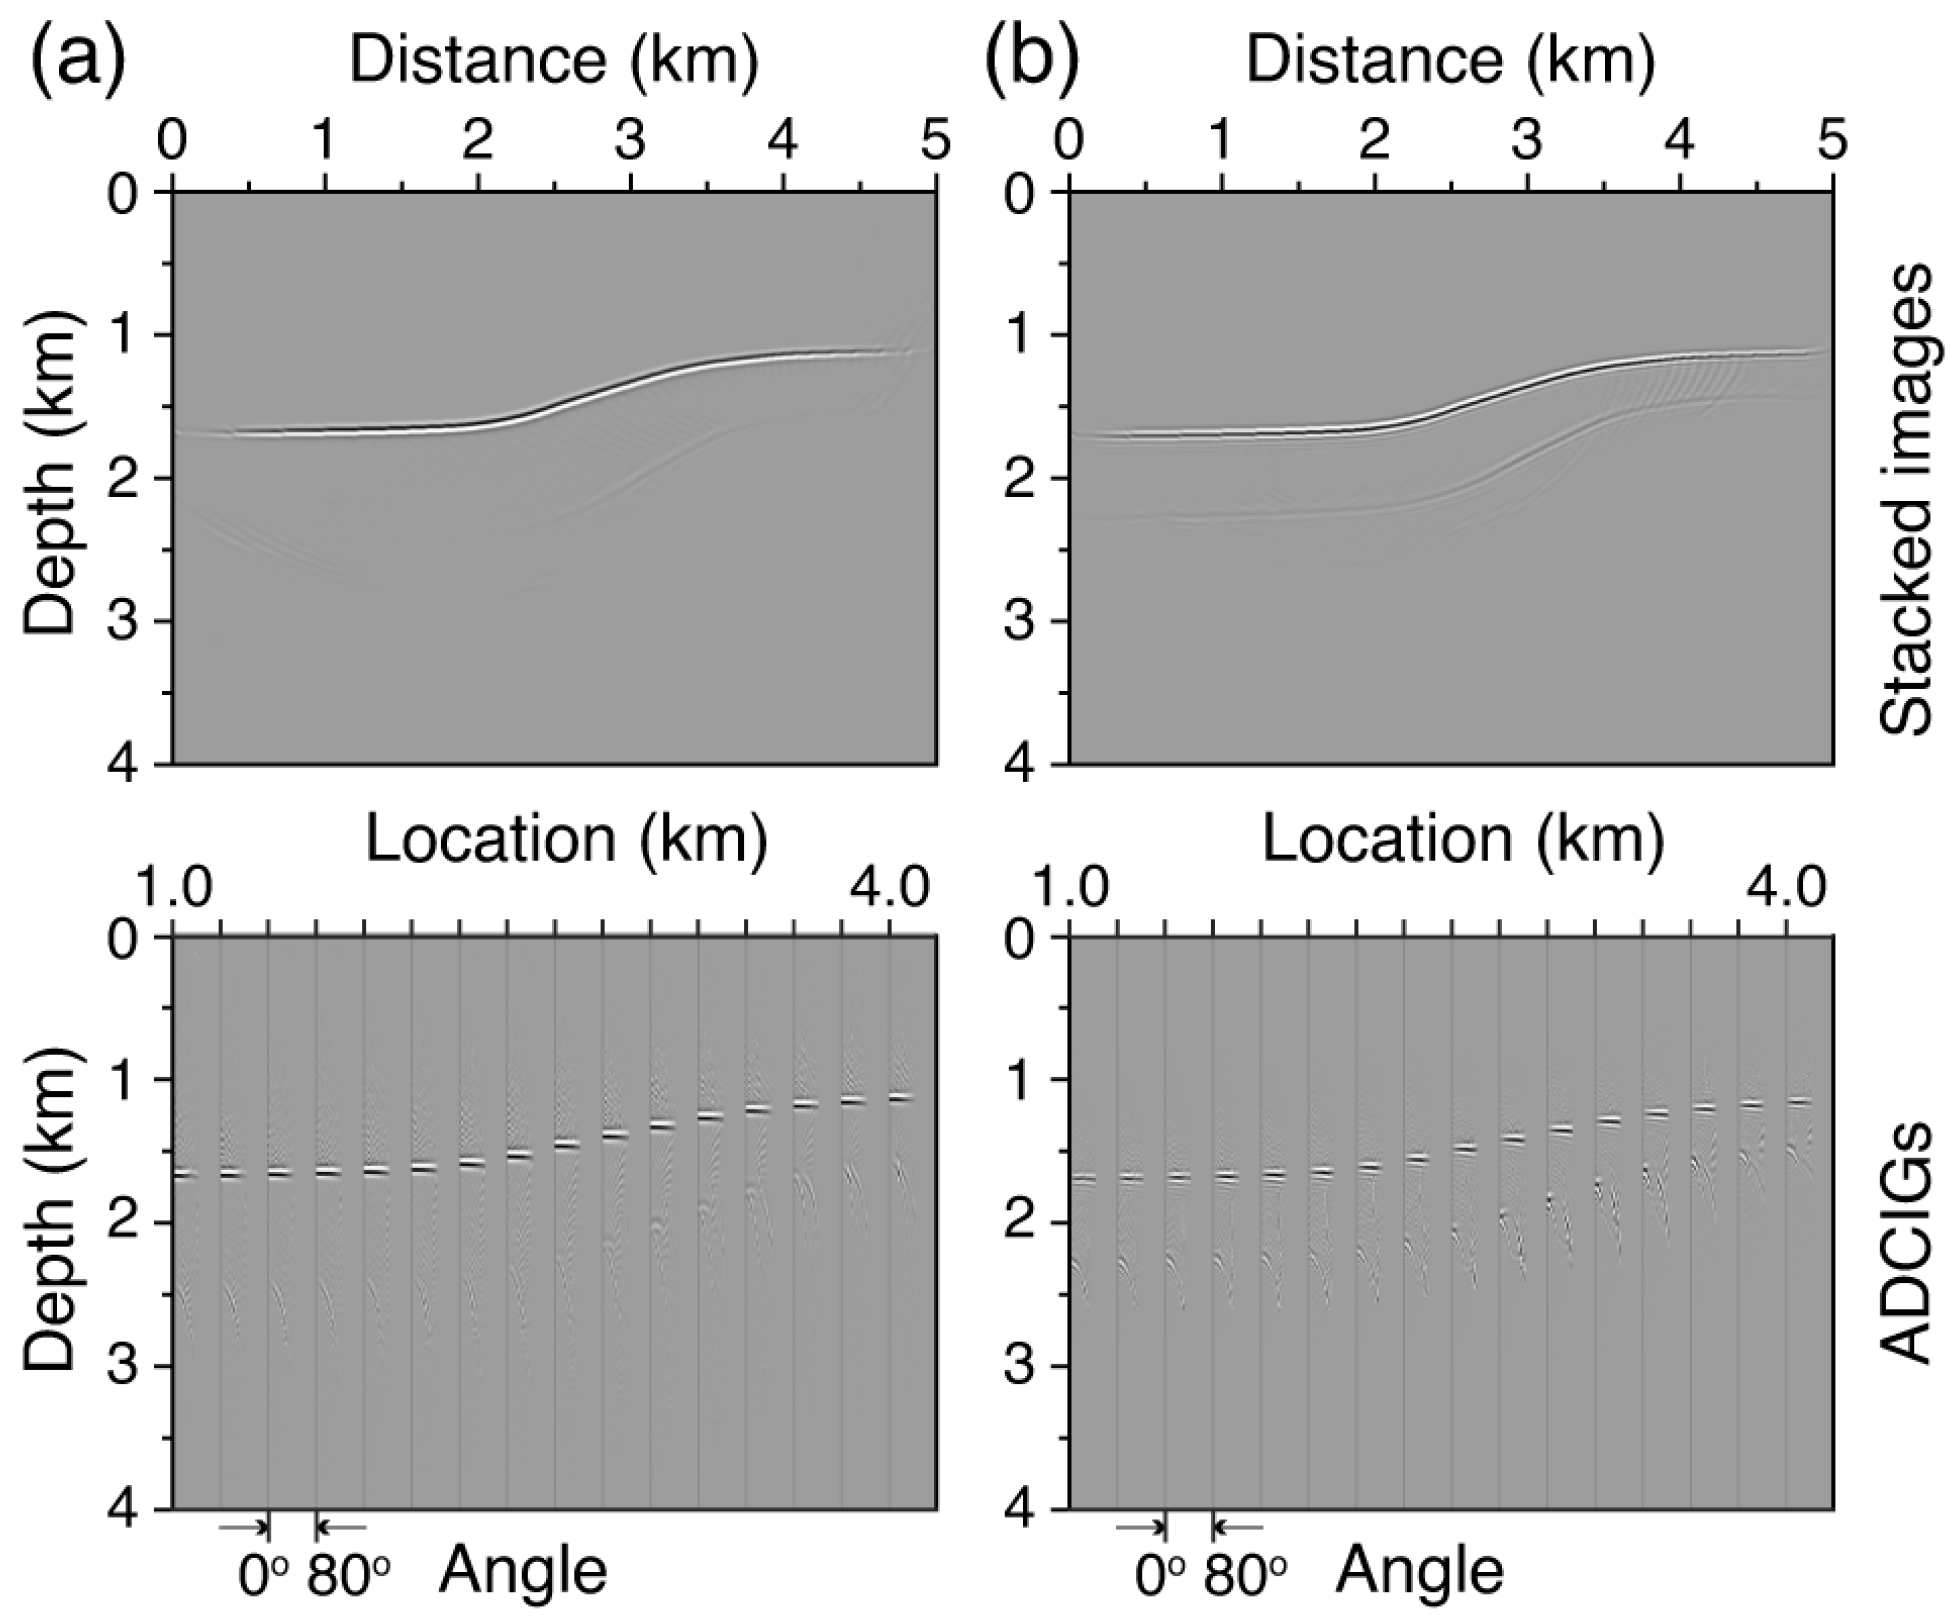
According to the analysis of migration responses of the acoustic components, we continue to image PP and PS primary reflections with acoustic Kirchhoff PSDMs. The up-going P and S waves are extracted during the forward simulation of synthetic datasets. Then, we use the P-wave reflections to conduct PP imaging, and use the S-wave reflections to conduct PS imaging. The depth images and ADCIGs are shown in Figure 12a and Figure 12b, respectively. We mimic a data-domain wave-mode separation before the depth migration step; thereby, for instance, reducing artifacts caused by WLRMs. However, crosstalk artifacts from convert-wave modes remain. Specifically, the pSP reflections are wrongly projected below the true location of the BSR, but less focused in the depth image, as illustrated in Figure 12a. Similarly, the pSS reflections are introduced into the PS depth image as artifacts in Figure 12b. For further suppression of these crosstalk artifacts, more accurate identification and separation of reflection events are necessary.

3.3. Extended Applications to Sparse OBN Data: The Truncated Marmousi2 Model Example

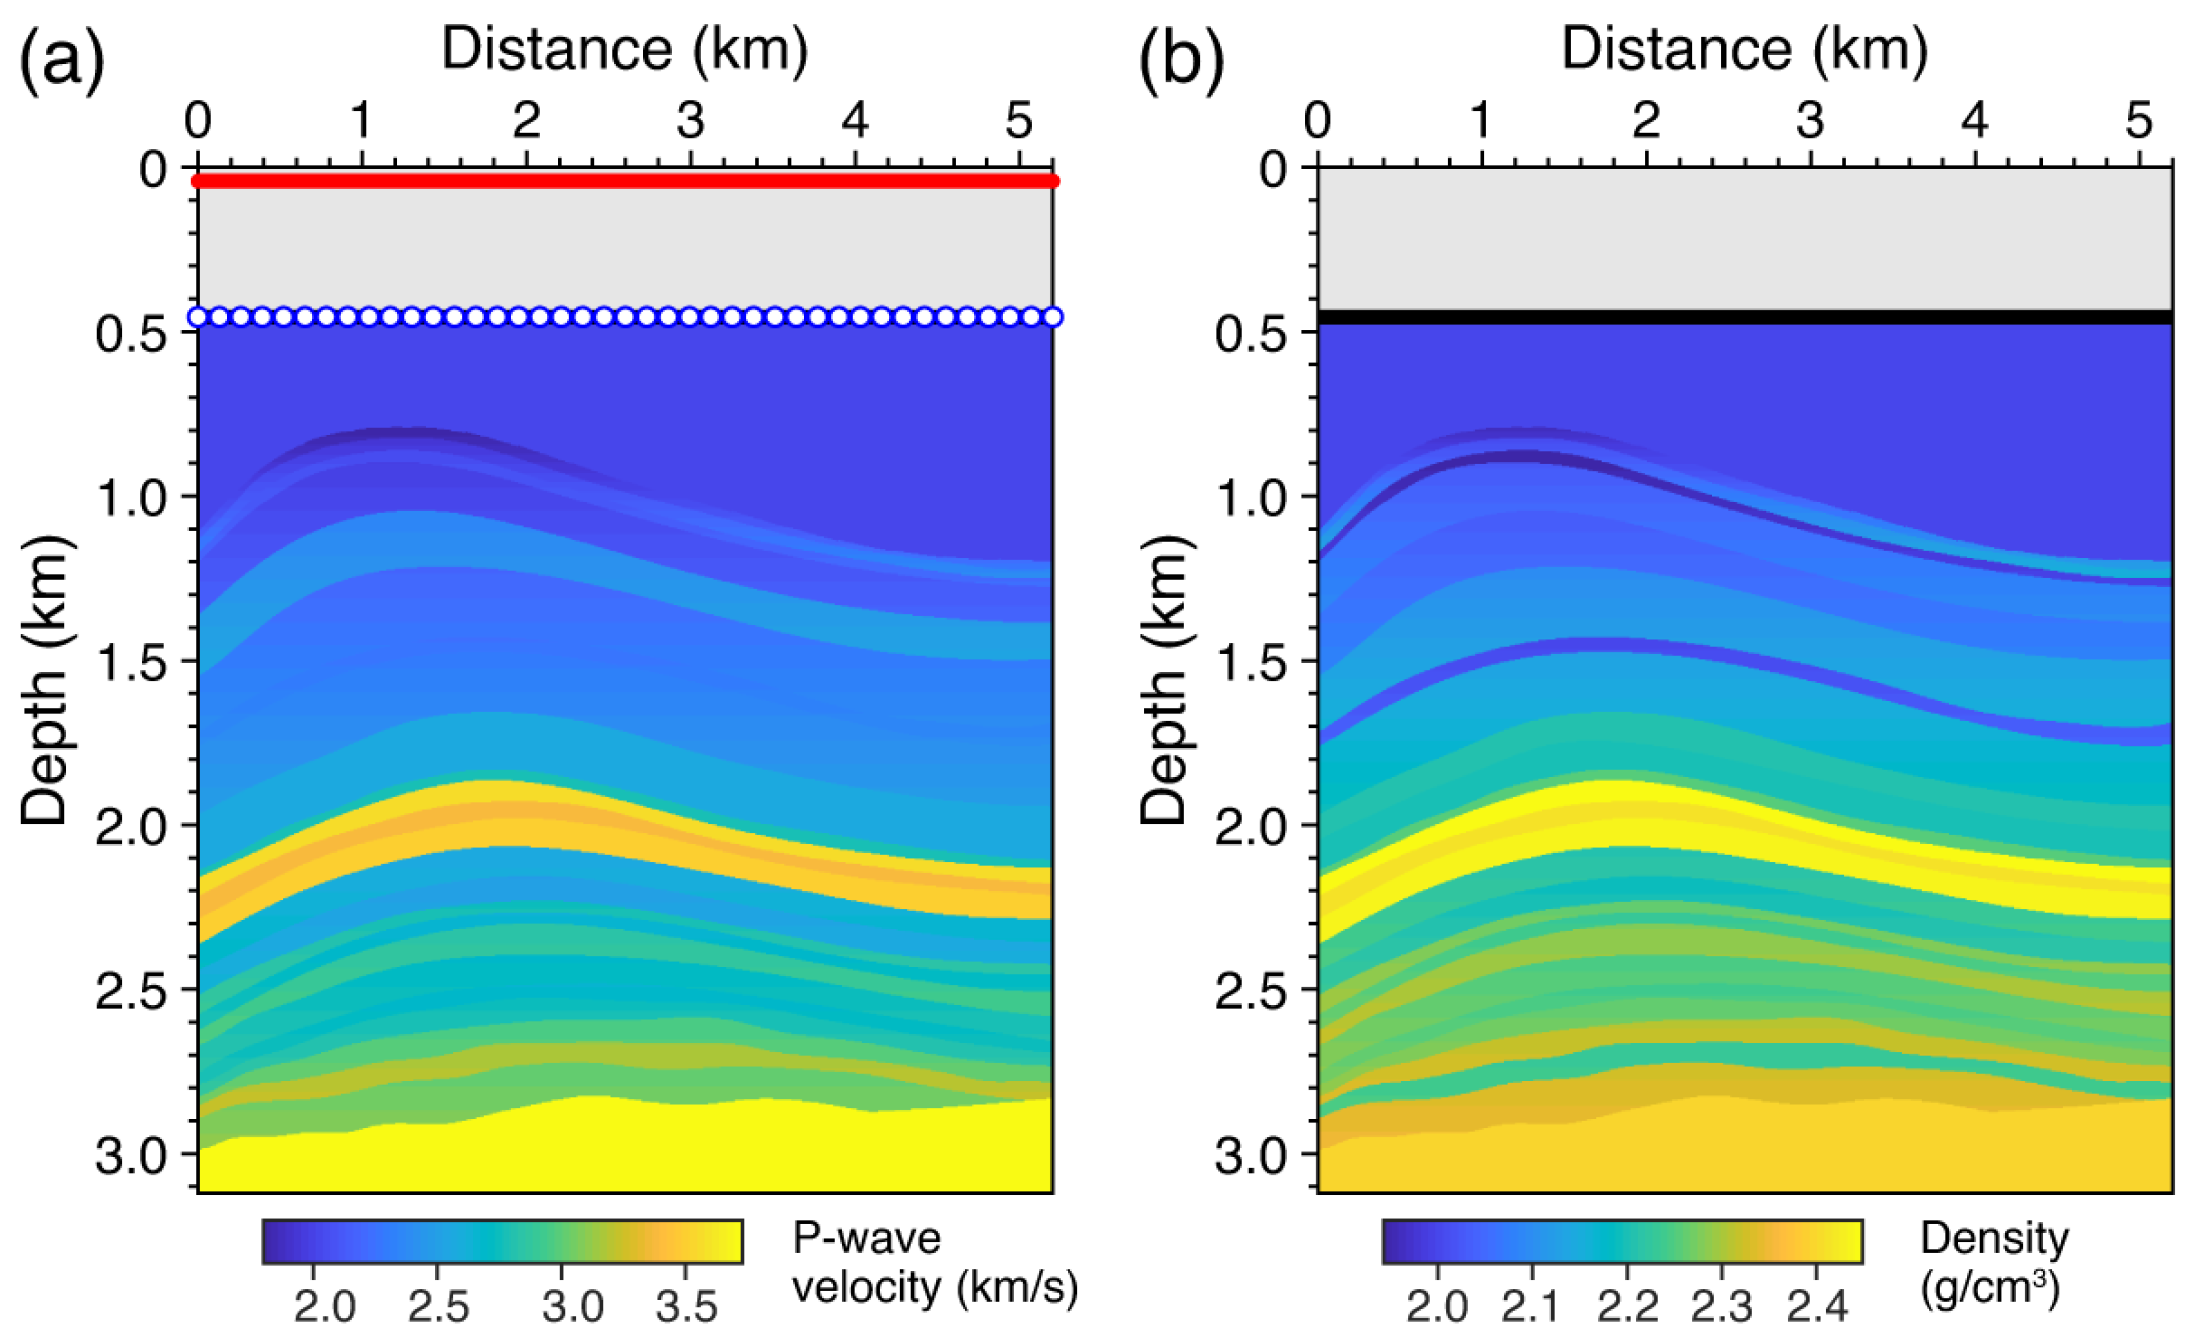
Last, we conduct an investigation in an extended application scenario under a sparse OBN observation geometry. Typically, in the sparse OBN surveys, the number of sources is much larger than that of OBNs. Considering the computational costs, CRGs are usually sorted and migrated according to the reciprocity. This requirement can be easily satisfied by the Kirchhoff migration. We illustrate the migration imaging process through a truncated Marmousi2 model [67]. Shown in Figure 13a and Figure 13b are the P-wave velocity model and the density model, respectively, while the S-wave velocity model is scaled from the P-wave velocity model by assuming a Poisson solid for the elastic domain under the seafloor. The top water layer is set as a constant (indicated by the gray layer), with the P-wave velocity, S-wave velocity, and density set as 1.5 km/s, 0.0 km/s, and 1.0 g/cm3, respectively. The grid size of the model is set as 3.25 m. Again, we use the FD propagators to generate the synthetic multicomponent elastic records. Totally, 1601 explosive sources are excited near the sea surface, while 41 OBNs are evenly distributed on the seafloor to acquire the ocean-bottom multicomponent records. The source array is indicated by the red line, while the locations of sparse OBNs are highlighted by white dots in Figure 13a. The migration models are set as smoothed versions of the P- and S-wave velocity models. In such a complex model, we focus on the artifacts when imaging OBN data with the acoustic Kirchhoff PSDM engine and potential mitigation strategies.

3.3.1. Conventional Migration of Acoustic Pressure Component

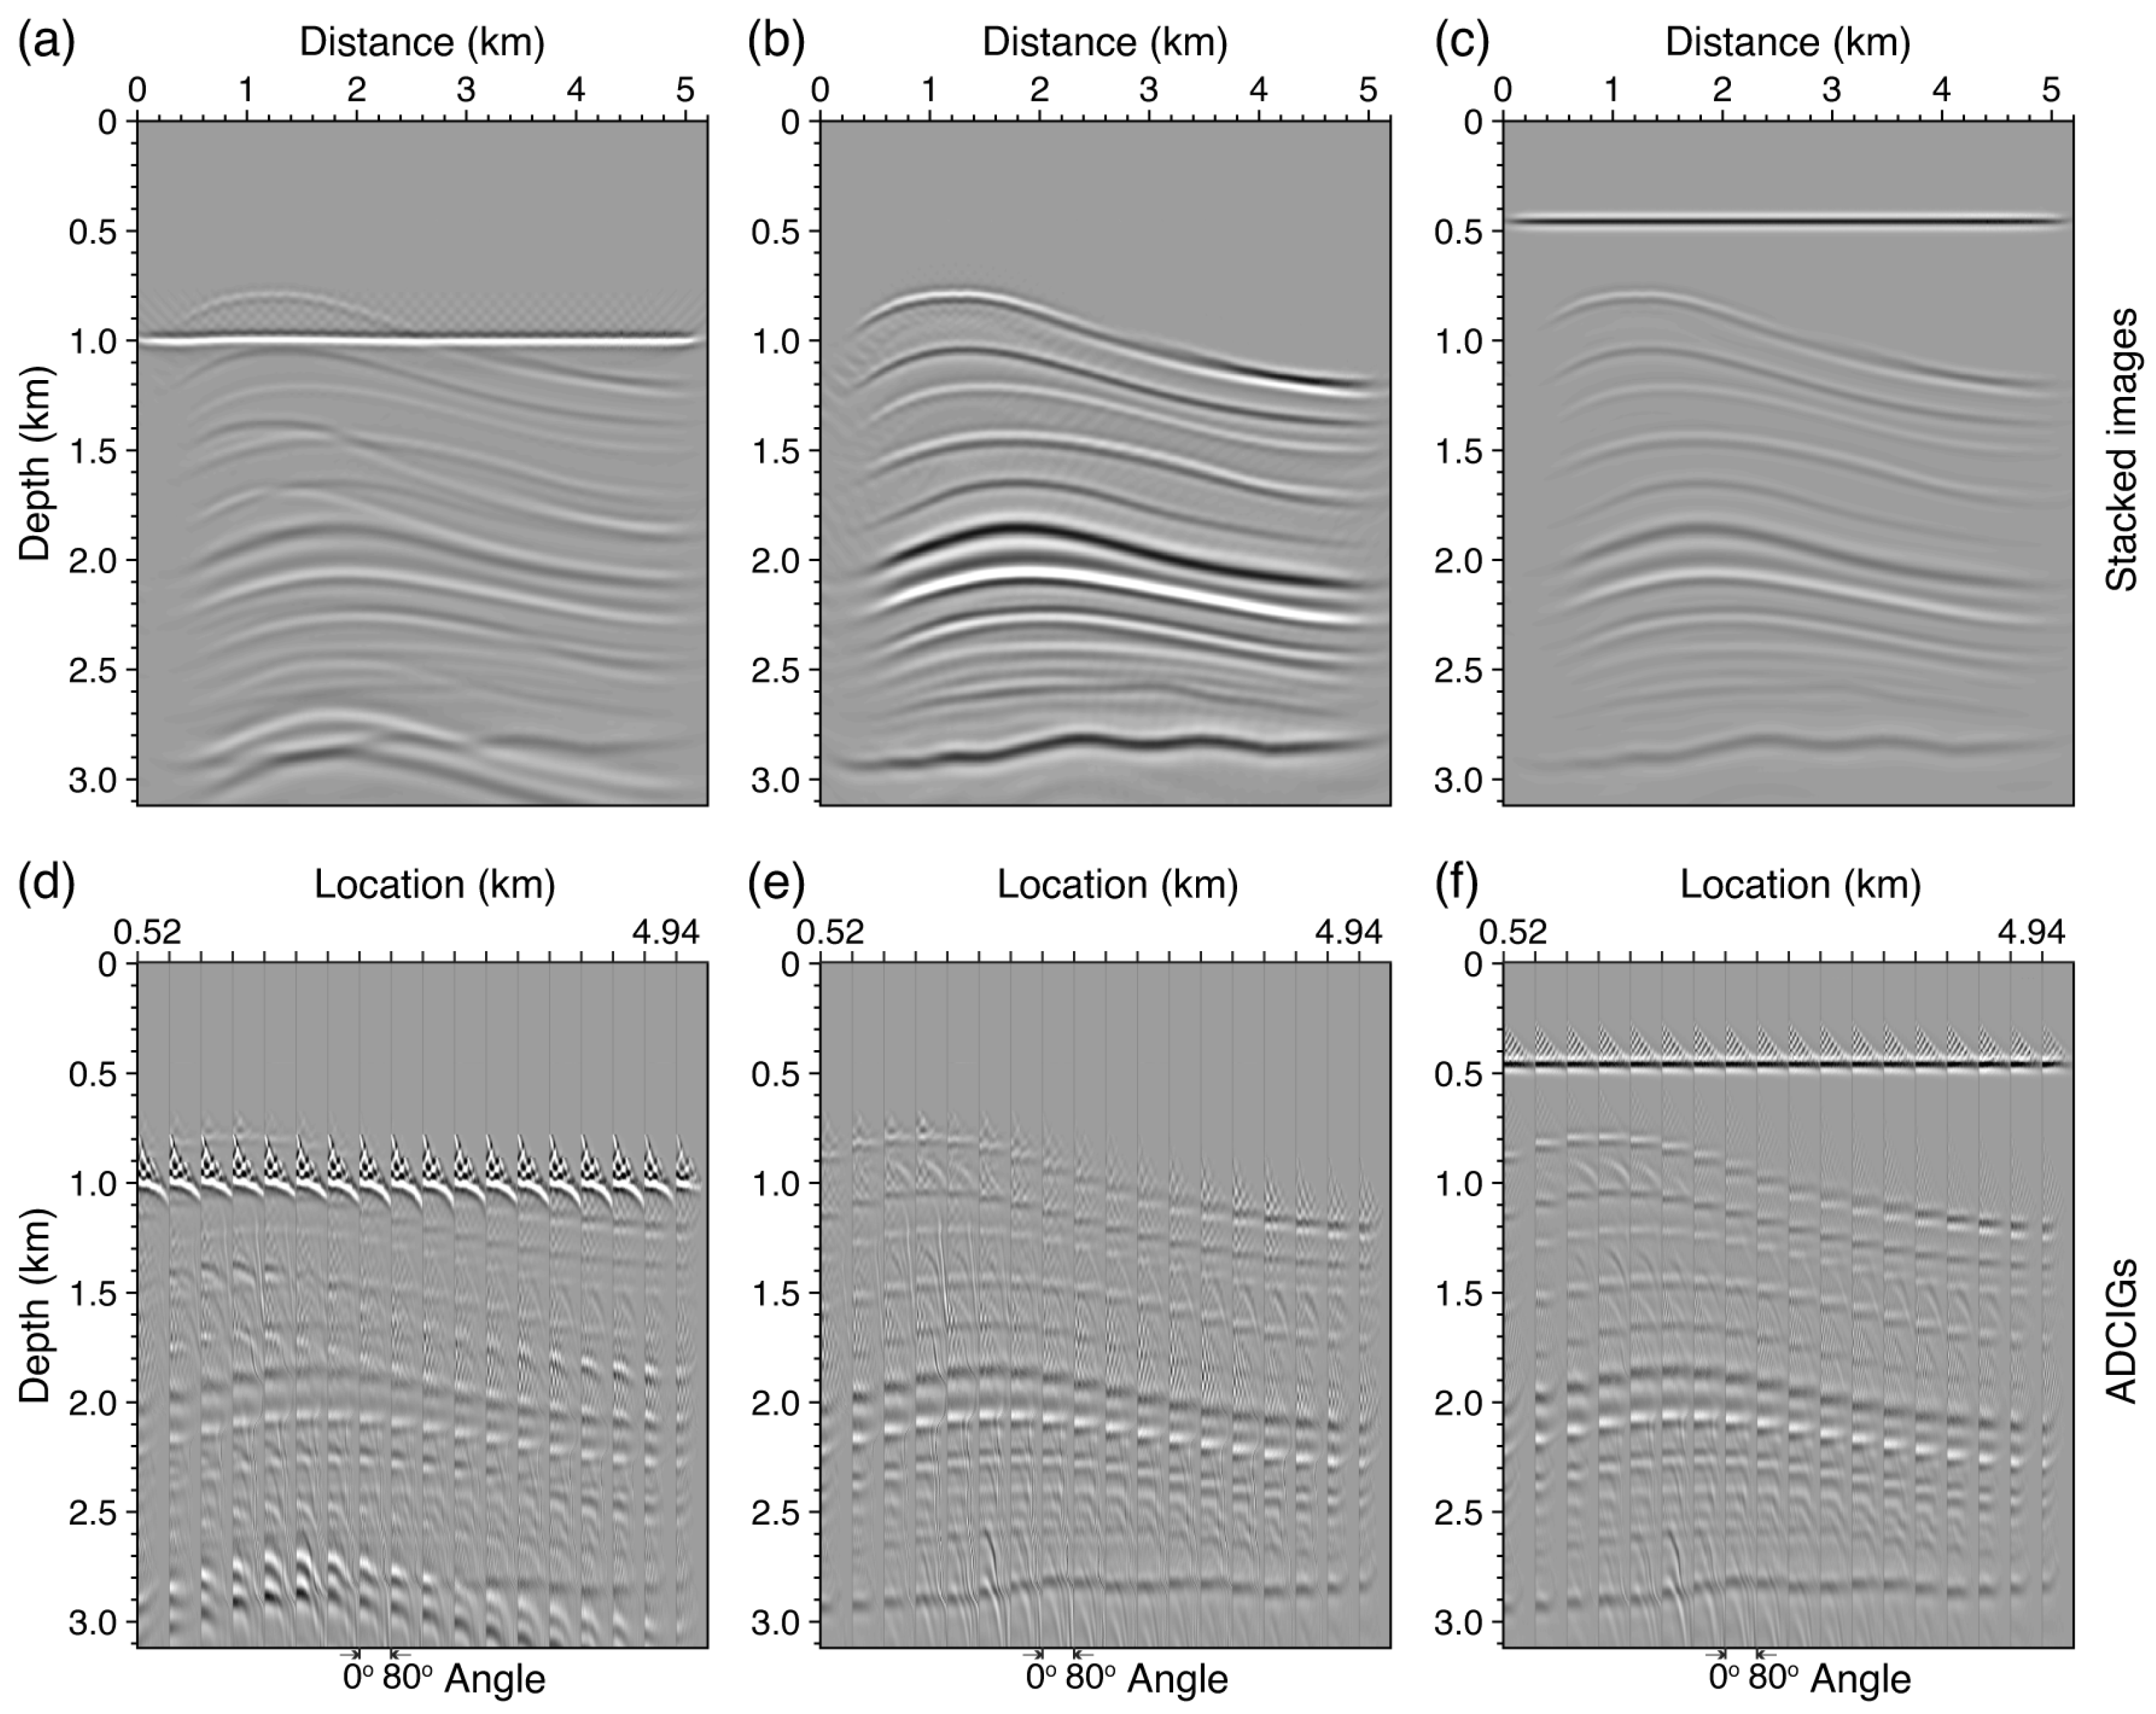
In the first experiment, we inject the mixed acoustic pressure component into a conventional Kirchhoff PSDM engine. The pressure data include three types of events: the up-going primary reflections, the down-going receiver-side 1st-order WLRMs, and the down-going 1st-order water reverberations. We migrate the mixed acoustic pressure data with the conventional Kirchhoff PSDM using the smoothed version of P-wave velocity (Figure 13a) as the migration velocity. Shown in Figure 14a,d are the stacked depth image and pre-stack ADCIGs. We notice that most of the P-wave primary reflections are properly migrated, revealing the subsurface structures. However, various imaging artifacts are introduced. The artificial image of the sea surface has high values that are quite pronounced in the depth profile and ADCIGs. The artifacts from receiver-side 1st-order WLRMs are distributed in the relatively deep parts. Also note that the convert-wave events (e.g., the PS, SP, and SS) are migrated with incorrect wave paths. Most of them are less focused on the final stacked depth profiles. Correspondingly, they are curved down in the ADCIGs, and moveouts in the deep parts are quite obvious. Then, we try to suppress these artifacts under the acoustic Kirchhoff PSDM workflow.

3.3.2. Migration and Mirror Migration of Elastic Pressures After the Up-/Down-Going Separation

A straightforward strategy is to perform up-/down-going separation before the migration process. By using the properties of the multicomponent ocean-bottom records, directional filtering can be conducted using the acoustic pressure component and the z-component particle velocities under the acoustic assumption. We mimic this scenario through imaging individual up- and down-going records. In detail, the up-going primary reflections can be migrated through the conventional Kirchhoff PSDM engine without modifications to the migration algorithm. The depth image and ADCIGs are shown in Figure 14b,e, where the artifacts from down-going events are excluded. Meanwhile, those down-going events can also be correctly imaged through the mirror migrations. We input the mixed receiver-side 1st-order WLRMs and the 1st-order water reverberations into a mirror Kirchhoff PSDM engine, in which the mirrored OBNs are treated as virtual sources, while the airguns are treated as virtual receivers. The corresponding depth image and ADCIGs are shown in Figure 14c,f. We see that both the flat seafloor and sub-seafloor structures are properly imaged. Especially, the ADCIGs are flattened and with correct phases, as compared to artificial events in Figure 14d. As the effective contributions from the up- and down-going records are separated, the residual artifacts mainly come from the convert-wave reflections. In this experiment, the crosstalks are not obvious in the stacked depth images, whereas they can be clearly identified in the ADCIGs. The curved-down gathers intersect with the flat gathers, especially at intermediate to large angles. Compared to the images from up-going reflections, the down-going images are less influenced.

3.3.3. Joint PP and PS Migration of Separated Elastic P and S Data

The third experiment illustrates the use of separated P- and S-wave events from the OBN CRGs. In a practical processing workflow, the P and S waves can be separated from the multicomponent ocean-bottom records through pre-image processing steps or built-in directional propagators in PSDMs. We mimic the former data-domain wave decomposition, in which up-going P- and S-wave reflections are extracted during the forward simulation of synthetic data. Then, the scalarized P- and S-wave records are migrated by a Kirchhoff PSDM. Specifically, for PP migration imaging, ray traveltimes and amplitudes for the virtual sources (i.e., exact OBNs) and virtual receivers (i.e., exact sources) are calculated using P-wave velocity model. For PS migration imaging, ray traveltimes and amplitudes for the virtual sources (i.e., exact OBNs) are calculated based on the S-wave velocity model, while those for the virtual receivers (i.e., exact sources) are calculated based on P-wave velocity model. Shown in Figure 15a,b are the PP and PS images, while the corresponding PP and PS ADCIGs are illustrated in Figure 15c,d. Both of them properly reveal the sub-seafloor structures. The PS image has a higher resolution compared to the PP image since the S-wave has a shorter wavelength. In the PP images, the wave-mode crosstalks are mitigated, as compared to those in Figure 14a,d to some extent. On the other hand, the crosstalks are more obvious in the PS image, and some of them are mainly caused by projecting SS reflections along improper wave paths. The acoustic Kirchhoff PSDM provides effective and flexible solutions to image the sparse OBN dataset. By combining various pre-imaging processing steps, the imaging artifacts from multiples and converted waves can be suppressed.

4. Discussion

We interpret the Kirchhoff PSDM as a high-dimensional transform from the time-space domain to the depth image domain. The recorded OBS records, whether the primary reflections or the multiples, are projected to the subsurface domain. In such a transformed domain, we evaluate the effective images or artifacts. Provided that the migration velocity is relatively accurate, the ADCIGs of primary reflections are relatively flat, whereas the ADCIGs of multiples are curved down with certain residual moveouts. Based on the discrimination in extended image gathers, specific filters can be designed to suppress multiple artifacts, including separators based on deterministic physical bases [68,69] and those represented by deep neural networks [46,47]. In turn, in the deep-learning-based demultiple approaches, feature engineering and the preparation of the training set are the key steps. Our method can generate depth images and extended image gathers that contain specific types of WLRMs. They can be used as effective samples for training demultiple neural networks in the depth image domain. We set it as the study in the next step.
In our investigation, we chose the acoustic Kirchhoff migration as the basic PSDM engine based on the consideration of its advantages, including its computational efficiency, convenience for generating ADCIGs, and flexibility to various datasets, especially for the OBN CRGs, as illustrated in the truncated Marmousi2 example. For further improvements of the ray-based Kirchhoff imaging engine, one can consider the band-limited ray tracing [70,71,72] and the wave-equation-based traveltime and amplitudes to represent the Green’s functions [73,74,75,76]. Also, acceleration strategies should be addressed to improve the computational efficiency [48,77,78,79], especially for the 3D case. On the other hand, considering the requirements of PSDM engines in practical imaging tasks, the RTM can also be used to handle the complex geological structures. Then, some critical technical steps should be addressed, such as the angle-domain wavefield decomposition for outputting ADCIGs from RTM. Along the other avenue, the elastic migration of multicomponent OBS records requires advanced elastic-wave propagators. Parallelly, under a similar analysis workflow tailored for elastic imaging, we can investigate elastic migration responses, wave-mode crosstalk, and related multiple artifacts. The wave phenomena may be much more complicated, as the elastic PSDM algorithms can be influenced by more factors, such as the accurate estimation of seafloor properties. We leave it as a separate research topic.
When transferring our experience and understanding to practical applications, more detailed factors should be taken into consideration. For instance, the energy of different WLRMs can vary with the water depth and the properties of the seafloor [3,25,29,30]. Generally, receiver-side WLRMs are dominant in a deep-water layer with a “soft” seafloor, while a “hard” seafloor will amplify the energy of source-side WLRMs and water reverberations. These characteristics can be quantified by numerical investigations using our method. Task-oriented simulation based on prior models may guide practical demultipling for OBS data. The proposed method can also be extended to investigate free-surface-related multiples, in which the seafloor is replaced by subsurface characteristic reflectors.
The mirror migration examples are implemented under the condition of a flat seafloor. In practical applications, its validation will be influenced by the rough sea surface, the tidal effect in shallow water environment, and the ocean-bottom bathymetry. Compared to the conventional marine towed-streamer system, the OBS survey is less influenced by the sea states. But the rough sea surface can still influence the down-going waves, such as the receiver-side 1st-order WLRMs. Specific pre-processing steps are necessary, such as the static correction. Otherwise, the effect of the rough sea surface will be projected to the images of the seafloor and nearby structures. Detailed quantifications of these effects need more accurate wave simulators, explicitly considering the static or dynamic sea state model [80,81,82,83,84]. For the other strong reflector, the topographic seafloor will also complicate the OBS records. The mirroring of receivers, such as OBNs on a rough seafloor, is straightforward; however, modifications should be introduced when mirroring the sources or constructing mirror wave paths of higher-order multiples. Moreover, the depth migration imaging algorithm should properly deal with the multi-arrivals caused by prism wave paths and more common scatterings between different wave modes [85,86]. Once these issues are well addressed, the mirror migration can be used in broader imaging tasks for OBS data, such as the quick quality control tool for OBS data obtained in situ and more advanced joint primary and multiple least-square migration [87,88]. However, developing more accurate wave simulators and migration algorithms is out of the scope of this study. We leave them as potential topics.

5. Conclusions

We have built up a numerical investigation approach by combining an FD-based wave simulator and the acoustic Kirchhoff migration for imaging OBS data. We perform a comprehensive analysis of the migration responses and crosstalk artifacts caused by WLRMs. Under a generalized mirror migration system, we demonstrate the capability for turning the dominant WLRMs into useful signals for illuminating the subsurface structures, especially for effectively imaging the seafloor. Multi-mode depth images (PP and PS) indicate that the complex elastic effect contained in OBS data should not be ignored in a traditional acoustic-based processing workflow. We also demonstrate the broad and flexible application scenarios of acoustic Kirchhoff PSDM in the data processing of modern OBN surveys. Moreover, our method also provides a basis for identifying and suppressing WLRMs in the subsurface depth image domain. Potentially, the understanding from this study benefits in examining and developing demultiple approaches.

Author Contributions

Conceptualization, B.H. and Q.L.; methodology, B.H. and Q.L.; software, B.H. and Q.L.; validation, B.H. and Q.L.; investigation, B.H., Q.L. and G.C.; writing—original draft preparation, B.H.; writing—review and editing, B.H., Q.L., W.M. and G.C.; project administration, B.H. and W.M.; funding acquisition, B.H. and W.M. All authors have read and agreed to the published version of the manuscript.

Funding

The research reported in this publication was supported in part by the National Natural Science Foundation of China under Grant Nos. 42404138 and 42130808, and in part by the China Postdoctoral Science Foundation under Grant No. 2023M743582.

Institutional Review Board Statement

Not applicable.

Informed Consent Statement

Not applicable.

Data Availability Statement

The data associated with this paper are available by contacting the corresponding author.

Acknowledgments

We appreciate the discussions with Zhiwei Gu, Jian Xiang, Jinlong Yang, Xiang Li, and Yaofeng He on water-layer-related multiples in ocean-bottom seismic surveys. Bingkai Han thanks the positive feedback and suggestions from the audiences at IMAGE 2025 in Houston when presenting related works.

Conflicts of Interest

The authors declare no conflicts of interest.

Abbreviations

The following abbreviations are used in this manuscript:
OBSOcean-bottom seismic
OBNOcean-bottom node
WLRMWater-layer-related multiple
PSDMPre-stack depth migration
ADCIGsAngle-domain common image gathers
CRGCommon-receiver gather

References

  1. Ikelle, L.T.; Amundsen, L. Introduction to Petroleum Seismology; Society of Exploration Geophysicists: Houston, TX, USA, 2018. [Google Scholar]
  2. Wang, H.; Xiang, J.; Shi, Y. Basic logic and key methods of OBN seismic data imaging processing. Geophys. Prospect. Pet. 2024, 63, 12–29. (In Chinese) [Google Scholar]
  3. Wang, T.; Liu, X.; Cheng, J. Wave modes of multi-component OBC/OBN data under typical water depth and bottom medium conditions. Geophys. Prospect. Pet. 2024, 63, 45–60. (In Chinese) [Google Scholar]
  4. Beylkin, G. Imaging of discontinuities in the inverse scattering problem by inversion of a causal generalized Radon transform. J. Math. Phys. 1985, 26, 99–108. [Google Scholar] [CrossRef]
  5. Bleistein, N.; Stockwell, J.; Cohen, J. Multidimensional seismic inversion. In Mathematics of Multidimensional Seismic Imaging, Migration, and Inversion; Springer: New York, NY, USA; Berlin/Heidelberg, Germany, 2001. [Google Scholar]
  6. Kuo, J.T.; Dai, T.f. Kirchhoff elastic wave migration for the case of noncoincident source and receiver. Geophysics 1984, 49, 1223–1238. [Google Scholar] [CrossRef]
  7. Hokstad, K. Multicomponent Kirchhoff migration. Geophysics 2000, 65, 861–873. [Google Scholar] [CrossRef]
  8. Du, Q.; Li, F.; Ba, J.; Zhu, Y.; Hou, B. Multicomponent joint migration velocity analysis in the angle domain for PP-waves and PS-waves. Geophysics 2012, 77, U1–U13. [Google Scholar] [CrossRef]
  9. Protasov, M.; Tcheverda, V. True amplitude elastic Gaussian beam imaging of multicomponent walkaway vertical seismic profiling data. Geophys. Prospect. 2012, 60, 1030–1042. [Google Scholar] [CrossRef]
  10. Casasanta, L.; Gray, S.H. Converted-wave beam migration with sparse sources or receivers. Geophys. Prospect. 2015, 63, 534–551. [Google Scholar] [CrossRef]
  11. Li, X.; Mao, W.; Shi, X.; Yue, Y. Elastic 3D PS converted-wave Gaussian beam migration. Geophysics 2018, 83, S213–S225. [Google Scholar] [CrossRef]
  12. Shi, X.; Mao, W.; Li, X. Elastic Gaussian-beam migration for four-component ocean-bottom seismic data. Geophysics 2020, 85, S11–S19. [Google Scholar] [CrossRef]
  13. Xie, X.B.; Wu, R.S. Multicomponent prestack depth migration using the elastic screen method. Geophysics 2005, 70, S30–S37. [Google Scholar] [CrossRef]
  14. Stanton, A.; Sacchi, M.D. Elastic least-squares one-way wave-equation migration. Geophysics 2017, 82, S293–S305. [Google Scholar] [CrossRef]
  15. Ravasi, M.; Curtis, A. Elastic imaging with exact wavefield extrapolation for application to ocean-bottom 4C seismic data. Geophysics 2013, 78, S265–S284. [Google Scholar] [CrossRef]
  16. Yu, P.; Geng, J.; Li, X.; Wang, C. Acoustic-elastic coupled equation for ocean bottom seismic data elastic reverse time migration. Geophysics 2016, 81, S333–S345. [Google Scholar] [CrossRef]
  17. Han, B.; Mao, W.; Xie, X.B. Acoustic/elastic wavefield injection and reconstruction from ocean-bottom data for elastic RTM. In Proceedings of the Fourth International Meeting for Applied Geoscience & Energy, Houston, TX, USA, 26–29 August 2024; Society of Exploration Geophysicists: Houston, TX, USA, 2024; pp. 2239–2243. [Google Scholar]
  18. Huang, R.; Zhang, Z.; Wu, Z.; Wei, Z.; Mei, J.; Wang, P. Full-waveform inversion for full-wavefield imaging: Decades in the making. Lead. Edge 2021, 40, 324–334. [Google Scholar] [CrossRef]
  19. Jin, H.; Luo, S.; Liao, Q.; Shen, X.; Xia, G.; Vyas, M. FWI derived reflectivity gathers in angle domain. In Proceedings of the Fourth International Meeting for Applied Geoscience & Energy, Houston, TX, USA, 26–29 August 2024; Society of Exploration Geophysicists: Houston, TX, USA, 2024; pp. 935–939. [Google Scholar]
  20. Cheng, X.; Mao, J.; Feng, Z.; Vigh, D.; Glaccum, K.; Yu, Y. Advancing seismic imaging: From kinematics to dynamics with elastic full-waveform inversion. Lead. Edge 2025, 44, 362–370. [Google Scholar] [CrossRef]
  21. Hou, A.; Marfurt, K.J. Multicomponent prestack depth migration by scalar wavefield extrapolation. Geophysics 2002, 67, 1886–1894. [Google Scholar] [CrossRef]
  22. Zhang, D.; Tsingas, C.; Ghamdi, A.A.; Huang, M.; Jeong, W.; Sliz, K.K.; Aldeghaither, S.M.; Zahrani, S.A. A review of OBN processing: Challenges and solutions. J. Geophys. Eng. 2021, 18, 492–502. [Google Scholar] [CrossRef]
  23. Osen, A.; Amundsen, L.; Reitan, A. Removal of water-layer multiples from multicomponent sea-bottom data. Geophysics 1999, 64, 838–851. [Google Scholar] [CrossRef]
  24. Muijs, R.; Robertsson, A.J.O.; Holliger, K. Prestack depth migration of primary and surface-related multiple reflections: Part II—Identification and removal of residual multiples. Geophysics 2007, 72, S71–S76. [Google Scholar] [CrossRef]
  25. Yu, P.; Chu, M.; Jiang, J. Multicomponent ocean-bottom seismic data decomposition using separate calibration filters. Pure Appl. Geophys. 2023, 180, 41–57. [Google Scholar] [CrossRef]
  26. Amundsen, L.; Ikelle, L.T.; Martin, J. Multiple attenuation and P/S splitting of multicomponent OBC data at a heterogeneous sea floor. Wave Motion 2000, 32, 67–78. [Google Scholar] [CrossRef]
  27. Schalkwijk, K.; Wapenaar, C.; Verschuur, D. Adaptive decomposition of multicomponent ocean-bottom seismic data into downgoing and upgoing P-and S-waves. Geophysics 2003, 68, 1091–1102. [Google Scholar] [CrossRef]
  28. Wang, T.; Liu, X.; Cheng, J. Converted-wave reflection traveltime inversion with free-surface multiples for ocean-bottom-node data. Geophysics 2024, 89, U1–U15. [Google Scholar] [CrossRef]
  29. Liu, Y.; Zhong, Y.; Liu, K.; Hua, Q. Seafloor elastic-parameter estimation based on a regularized AVO inversion method. Mar. Geophys. Res. 2020, 41, 5. [Google Scholar] [CrossRef]
  30. Chen, G.; Li, J.; Chen, J.; Du, R.; Liu, Y.; Qi, Y.; Li, C.F.; Huang, X. High-precision sub-seafloor velocity building based on joint tomography and deep learning on OBS data in the South China Sea. J. Earth Sci. 2025, 36, 830–834. [Google Scholar] [CrossRef]
  31. Wiggins, J.W. Attenuation of complex water-bottom multiples by wave-equation-based prediction and subtraction. Geophysics 1988, 53, 1527–1539. [Google Scholar] [CrossRef]
  32. Spadavecchia, E.; Lipari, V.; Bienati, N.; Drufuca, G. Water-bottom multiple attenuation by Kirchhoff extrapolation. Geophys. Prospect. 2013, 61, 725–734. [Google Scholar] [CrossRef]
  33. Xiang, J.; Wang, H.; Wu, C.; Feng, B. Prediction method for water-layer-related multiple of rugged seabed based on Born simulation using phase shift operator. IEEE Trans. Geosci. Remote Sens. 2025, 63, 5911912. [Google Scholar] [CrossRef]
  34. Foster, D.J.; Mosher, C.C. Suppression of multiple reflections using the Radon transform. Geophysics 1992, 57, 386–395. [Google Scholar] [CrossRef]
  35. Schonewille, M.; Aaron, P. Applications of time-domain high-resolution Radon demultiple. In SEG Technical Program Expanded Abstracts 2007; Society of Exploration Geophysicists: Houston, TX, USA, 2007; pp. 2565–2569. [Google Scholar]
  36. Song, H.; Mao, W.; Tang, H.; Xu, Q.; Ouyang, W. Multiple attenuation based on connected-component analysis and high-resolution parabolic Radon transform. J. Appl. Geophys. 2022, 199, 104580. [Google Scholar] [CrossRef]
  37. Berkhout, A.J.; Verschuur, D. Estimation of multiple scattering by iterative inversion, Part I: Theoretical considerations. Geophysics 1997, 62, 1586–1595. [Google Scholar] [CrossRef]
  38. Verschuur, D.J.; Berkhout, A.; Wapenaar, C. Adaptive surface-related multiple elimination. Geophysics 1992, 57, 1166–1177. [Google Scholar] [CrossRef]
  39. Weglein, A.B.; Gasparotto, F.A.; Carvalho, P.M.; Stolt, R.H. An inverse-scattering series method for attenuating multiples in seismic reflection data. Geophysics 1997, 62, 1975–1989. [Google Scholar] [CrossRef]
  40. Ikelle, L.T.; Amundsen, L.; Gangi, A.; Wyatt, S.B. Kirchhoff scattering series: Insight into the multiple attenuation method. Geophysics 2003, 68, 16–28. [Google Scholar] [CrossRef]
  41. Innanen, K.A. Born series forward modelling of seismic primary and multiple reflections: An inverse scattering shortcut. Geophys. J. Int. 2009, 177, 1197–1204. [Google Scholar] [CrossRef]
  42. Ravasi, M. Rayleigh-Marchenko redatuming for target-oriented, true-amplitude imaging. Geophysics 2017, 82, S439–S452. [Google Scholar] [CrossRef]
  43. Singh, S.; Snieder, R.; van der Neut, J.; Thorbecke, J.; Slob, E.; Wapenaar, K. Accounting for free-surface multiples in Marchenko imaging. Geophysics 2017, 82, R19–R30. [Google Scholar] [CrossRef]
  44. Li, Z.; Sun, N.; Gao, H.; Qin, N.; Li, Z. Adaptive subtraction based on U-Net for removing seismic multiples. IEEE Trans. Geosci. Remote Sens. 2021, 59, 9796–9812. [Google Scholar] [CrossRef]
  45. Kiraz, M.S.; Snieder, R.; Sheiman, J. Attenuating free-surface multiples and ghost reflection from seismic data using a trace-by-trace convolutional neural network approach. Geophys. Prospect. 2024, 72, 908–937. [Google Scholar] [CrossRef]
  46. Durall, R.; Ghanim, A.; Ettrich, N.; Keuper, J. An in-depth study of U-net for seismic data conditioning: Multiple removal by moveout discrimination. Geophysics 2024, 89, WA233–WA246. [Google Scholar] [CrossRef]
  47. Fernandez, M.R.; Ettrich, N.; Delescluse, M.; Rabaute, A.; Keuper, J. Towards deep learning for seismic demultiple. Geophys. Prospect. 2025, 73, 1185–1203. [Google Scholar] [CrossRef]
  48. Etgen, J.T.; O’Brien, M.J. Computational methods for large-scale 3D acoustic finite-difference modeling: A tutorial. Geophysics 2007, 72, SM223–SM230. [Google Scholar] [CrossRef]
  49. Liu, F.; Zhang, G.; Morton, S.A.; Leveille, J.P. An effective imaging condition for reverse-time migration using wavefield decomposition. Geophysics 2011, 76, S29–S39. [Google Scholar] [CrossRef]
  50. Yoon, K.; Marfurt, K.J. Reverse-time migration using the Poynting vector. Explor. Geophys. 2006, 37, 102–107. [Google Scholar] [CrossRef]
  51. Han, B.; Xie, X.B.; Liu, S.; Mao, W. Modelling separated orders of free-surface multiples by sequential finite-difference propagators and its applications to multiple imaging. In Proceedings of the 86th EAGE Annual Conference & Exhibition, Toulouse, France, 2–5 June 2025; European Association of Geoscientists & Engineers: Toulouse, France; Volume 2025, pp. 1–5. [Google Scholar]
  52. Biondi, E.; Meadows, M.A.; Biondi, B. True-amplitude migration through regularized extended linearized waveform inversion. Geophysics 2022, 87, S1–S20. [Google Scholar] [CrossRef]
  53. Stolt, R.H.; Weglein, A.B. Seismic Imaging and Inversion: Volume 1: Application of Linear Inverse Theory; Cambridge University Press: Cambridge, UK, 2012. [Google Scholar]
  54. De Basabe, J.D.; Sen, M.K. A comparison of finite-difference and spectral-element methods for elastic wave propagation in media with a fluid-solid interface. Geophys. J. Int. 2015, 200, 278–298. [Google Scholar] [CrossRef]
  55. Qu, Y.; Huang, J.; Li, Z.; Li, J. A hybrid grid method in an auxiliary coordinate system for irregular fluid-solid interface modeling. Geophys. J. Int. 2016, 208, 1540–1556. [Google Scholar] [CrossRef]
  56. Sun, Y.C.; Zhang, W.; Xu, J.K.; Chen, X. Numerical simulation of 2-D seismic wave propagation in the presence of a topographic fluid–solid interface at the sea bottom by the curvilinear grid finite-difference method. Geophys. J. Int. 2017, 210, 1721–1738. [Google Scholar] [CrossRef]
  57. Sethi, H.; Shragge, J.; Tsvankin, I. Mimetic finite-difference coupled-domain solver for anisotropic media. Geophysics 2021, 86, T45–T59. [Google Scholar] [CrossRef]
  58. Ronen, S.; Comeaux, L.; Miao, X.G. Imaging downgoing waves from ocean bottom stations. In SEG Technical Program Expanded Abstracts 2005; Society of Exploration Geophysicists: Houston, TX, USA, 2005; pp. 963–966. [Google Scholar]
  59. Grion, S.; Exley, R.; Manin, M.; Miao, X.; Pica, A.; Wang, Y.; Granger, P.; Ronen, S. Mirror imaging of OBS data. First Break 2007, 25, 37–42. [Google Scholar] [CrossRef]
  60. Dash, R.; Spence, G.; Hyndman, R.; Grion, S.; Wang, Y.; Ronen, S. Wide-area imaging from OBS multiples. Geophysics 2009, 74, Q41–Q47. [Google Scholar] [CrossRef]
  61. Ravasi, M.; Vasconcelos, I.; Curtis, A.; Kritski, A. Vector-acoustic reverse time migration of Volve ocean-bottom cable data set without up/down decomposed wavefields. Geophysics 2015, 80, S137–S150. [Google Scholar] [CrossRef]
  62. Jamali H, E.; Katou, M.; Tara, K.; Asakawa, E.; Mikada, H. Mirror reverse time migration using vertical cable seismic data for methane hydrate exploration. Geophysics 2019, 84, B447–B460. [Google Scholar] [CrossRef]
  63. Zhong, Y.; Gu, H.; Liu, Y.; Mao, Q. A new joint reverse time migration method to improve vertical seismic profile image quality. J. Pet. Sci. Eng. 2022, 214, 110546. [Google Scholar] [CrossRef]
  64. Grion, S.; Böhm, G.; Rossi, G.; Tinivella, U.; Mazzotti, A. Tomographic and AVO analyses of bottom simulating reflectors (BSR) on real data. In SEG Technical Program Expanded Abstracts 1997; Society of Exploration Geophysicists: Houston, TX, USA, 1997; pp. 171–174. [Google Scholar]
  65. Chen, M.A.P.; Riedel, M.; Hyndman, R.D.; Dosso, S.E. AVO inversion of BSRs in marine gas hydrate studies. Geophysics 2007, 72, C31–C43. [Google Scholar] [CrossRef]
  66. Shi, S.; Zhan, L.; Cai, W.; Yang, R.; Lu, H. Bottom-Simulating Reflectors (BSRs) in Gas Hydrate Systems: A Comprehensive Review. J. Mar. Sci. Eng. 2025, 13, 1137. [Google Scholar] [CrossRef]
  67. Martin, G.S.; Wiley, R.; Marfurt, K.J. Marmousi2: An elastic upgrade for Marmousi. Lead. Edge 2006, 25, 156–166. [Google Scholar] [CrossRef]
  68. Sava, P.; Guitton, A. Multiple attenuation in the image space. Geophysics 2005, 70, V10–V20. [Google Scholar] [CrossRef]
  69. Wang, Y.; Zheng, Y.; Zhang, L.; Chang, X.; Yao, Z. Reverse time migration of multiples: Eliminating migration artifacts in angle domain common image gathers. Geophysics 2014, 79, S263–S270. [Google Scholar] [CrossRef]
  70. Protasov, M.; Yarman, C.; Nichols, D.; Osypov, K.; Cheng, X. Frequency-dependent ray-tracing through rugose interfaces. In SEG Technical Program Expanded Abstracts 2011; Society of Exploration Geophysicists: Houston, TX, USA, 2011; pp. 2992–2996. [Google Scholar]
  71. Yarman, C.E.; Cheng, X.; Osypov, K.; Nichols, D.; Protasov, M. Band-limited ray tracing. Geophys. Prospect. 2013, 61, 1194–1205. [Google Scholar] [CrossRef]
  72. Liu, S.; Gu, H.; Han, B.; Yan, Z.; Liu, D.; Cai, J. Band-limited beam propagator and its application to seismic migration. Geophysics 2018, 83, S311–S319. [Google Scholar] [CrossRef]
  73. Etgen, J.T. 3D wave equation Kirchhoff migration. In SEG Technical Program Expanded Abstracts 2012; Society of Exploration Geophysicists: Houston, TX, USA, 2012; pp. 1–5. [Google Scholar]
  74. Jin, H.; Etgen, J. Evaluating Kirchhoff migration using wave-equation generated maximum amplitude traveltimes. In SEG Technical Program Expanded Abstracts 2020; Society of Exploration Geophysicists: Houston, TX, USA, 2020; pp. 2968–2972. [Google Scholar]
  75. Wang, Y.; He, Y.; Yeh, A.; Liu, F.; Wang, B.; Calderón, C. Improve Kirchhoff depth imaging using full-wave-equation traveltimes. In Proceedings of the Third International Meeting for Applied Geoscience & Energy, Houston, TX, USA, 28 August–1 September 2023; Society of Exploration Geophysicists: Houston, TX, USA, 2023; pp. 1598–1602. [Google Scholar]
  76. Cunha, C.; Ritter, G.; Sardinha, A.; Dias, B.P.; Guerra, C.; Thedy, F.; Hargreaves, N.; Coacci, R. Multi-image, reverse time, and Kirchhoff migrations with compact Green’s functions. Geophysics 2024, 89, S99–S118. [Google Scholar] [CrossRef]
  77. Rastogi, R.; Londhe, A.; Srivastava, A.; Sirasala, K.M.; Khonde, K. 3D Kirchhoff depth migration algorithm: A new scalable approach for parallelization on multicore CPU based cluster. Comput. Geosci. 2017, 100, 67–75. [Google Scholar] [CrossRef]
  78. Basnet, M.B.; Anas, M.; Rizvi, Z.H.; Ali, A.H.; Zain, M.; Cascante, G.; Wuttke, F. Enhancement of in-plane seismic full waveform inversion with CPU and GPU parallelization. Appl. Sci. 2022, 12, 8844. [Google Scholar] [CrossRef]
  79. Liu, Y.; Liu, H.; He, Y.; Qin, F.; Du, Y. Accelerated Kirchhoff depth migration on CPU-GPU heterogeneous computing systems. In Proceedings of the SEG International Exposition and Annual Meeting, Houston, TX, USA, 28 August–1 September 2022; Society of Exploration Geophysicists: Houston, TX, USA, 2022; pp. 2724–2728. [Google Scholar]
  80. Robertsson, J.O.; Laws, R.; Chapman, C.; Vilotte, J.P.; Delavaud, E. Modelling of scattering of seismic waves from a corrugated rough sea surface: A comparison of three methods. Geophys. J. Int. 2006, 167, 70–76. [Google Scholar] [CrossRef]
  81. Orji, O.C.; Söllner, W.; Gelius, L.J. Effects of time-varying sea surface in marine seismic data. Geophysics 2012, 77, P33–P43. [Google Scholar] [CrossRef]
  82. Blacquière, G.; Sertlek, H.Ö. Modeling and assessing the effects of the sea surface, from being flat to being rough and dynamic. Geophysics 2019, 84, T13–T27. [Google Scholar] [CrossRef]
  83. Konuk, T.; Shragge, J. Modeling full-wavefield time-varying sea-surface effects on seismic data: A mimetic finite-difference approach. Geophysics 2020, 85, T45–T55. [Google Scholar] [CrossRef]
  84. Han, B.; Xie, X.B. The effect of free-surface reflections on depth images for acquisition with buried sources and receivers: Investigation through the point spread function. Geophys. Prospect. 2023, 71, 414–430. [Google Scholar] [CrossRef]
  85. Deeks, J.; Lumley, D. Prism waves in seafloor canyons and their effects on seismic imaging. Geophysics 2015, 80, S213–S222. [Google Scholar] [CrossRef]
  86. Ursin, B.; Favretto-Cristini, N.; Cristini, P. Amplitude and phase changes for reflected and transmitted waves from a curved interface in anisotropic media. Geophys. J. Int. 2021, 224, 719–737. [Google Scholar] [CrossRef]
  87. Wong, M.; Biondi, B.L.; Ronen, S. Imaging with primaries and free-surface multiples by joint least-squares reverse time migration. Geophysics 2015, 80, S223–S235. [Google Scholar] [CrossRef]
  88. Yang, J.; Huang, J.; Zhu, H.; Li, Z.; Lu, S.; Mao, W.; Zhou, H.; Qin, N.; Tian, K. Review on the progress of least-squares migration in exploration seismology. Rev. Geophys. Planet. Phys. 2025, 56, 1–29. (In Chinese) [Google Scholar]
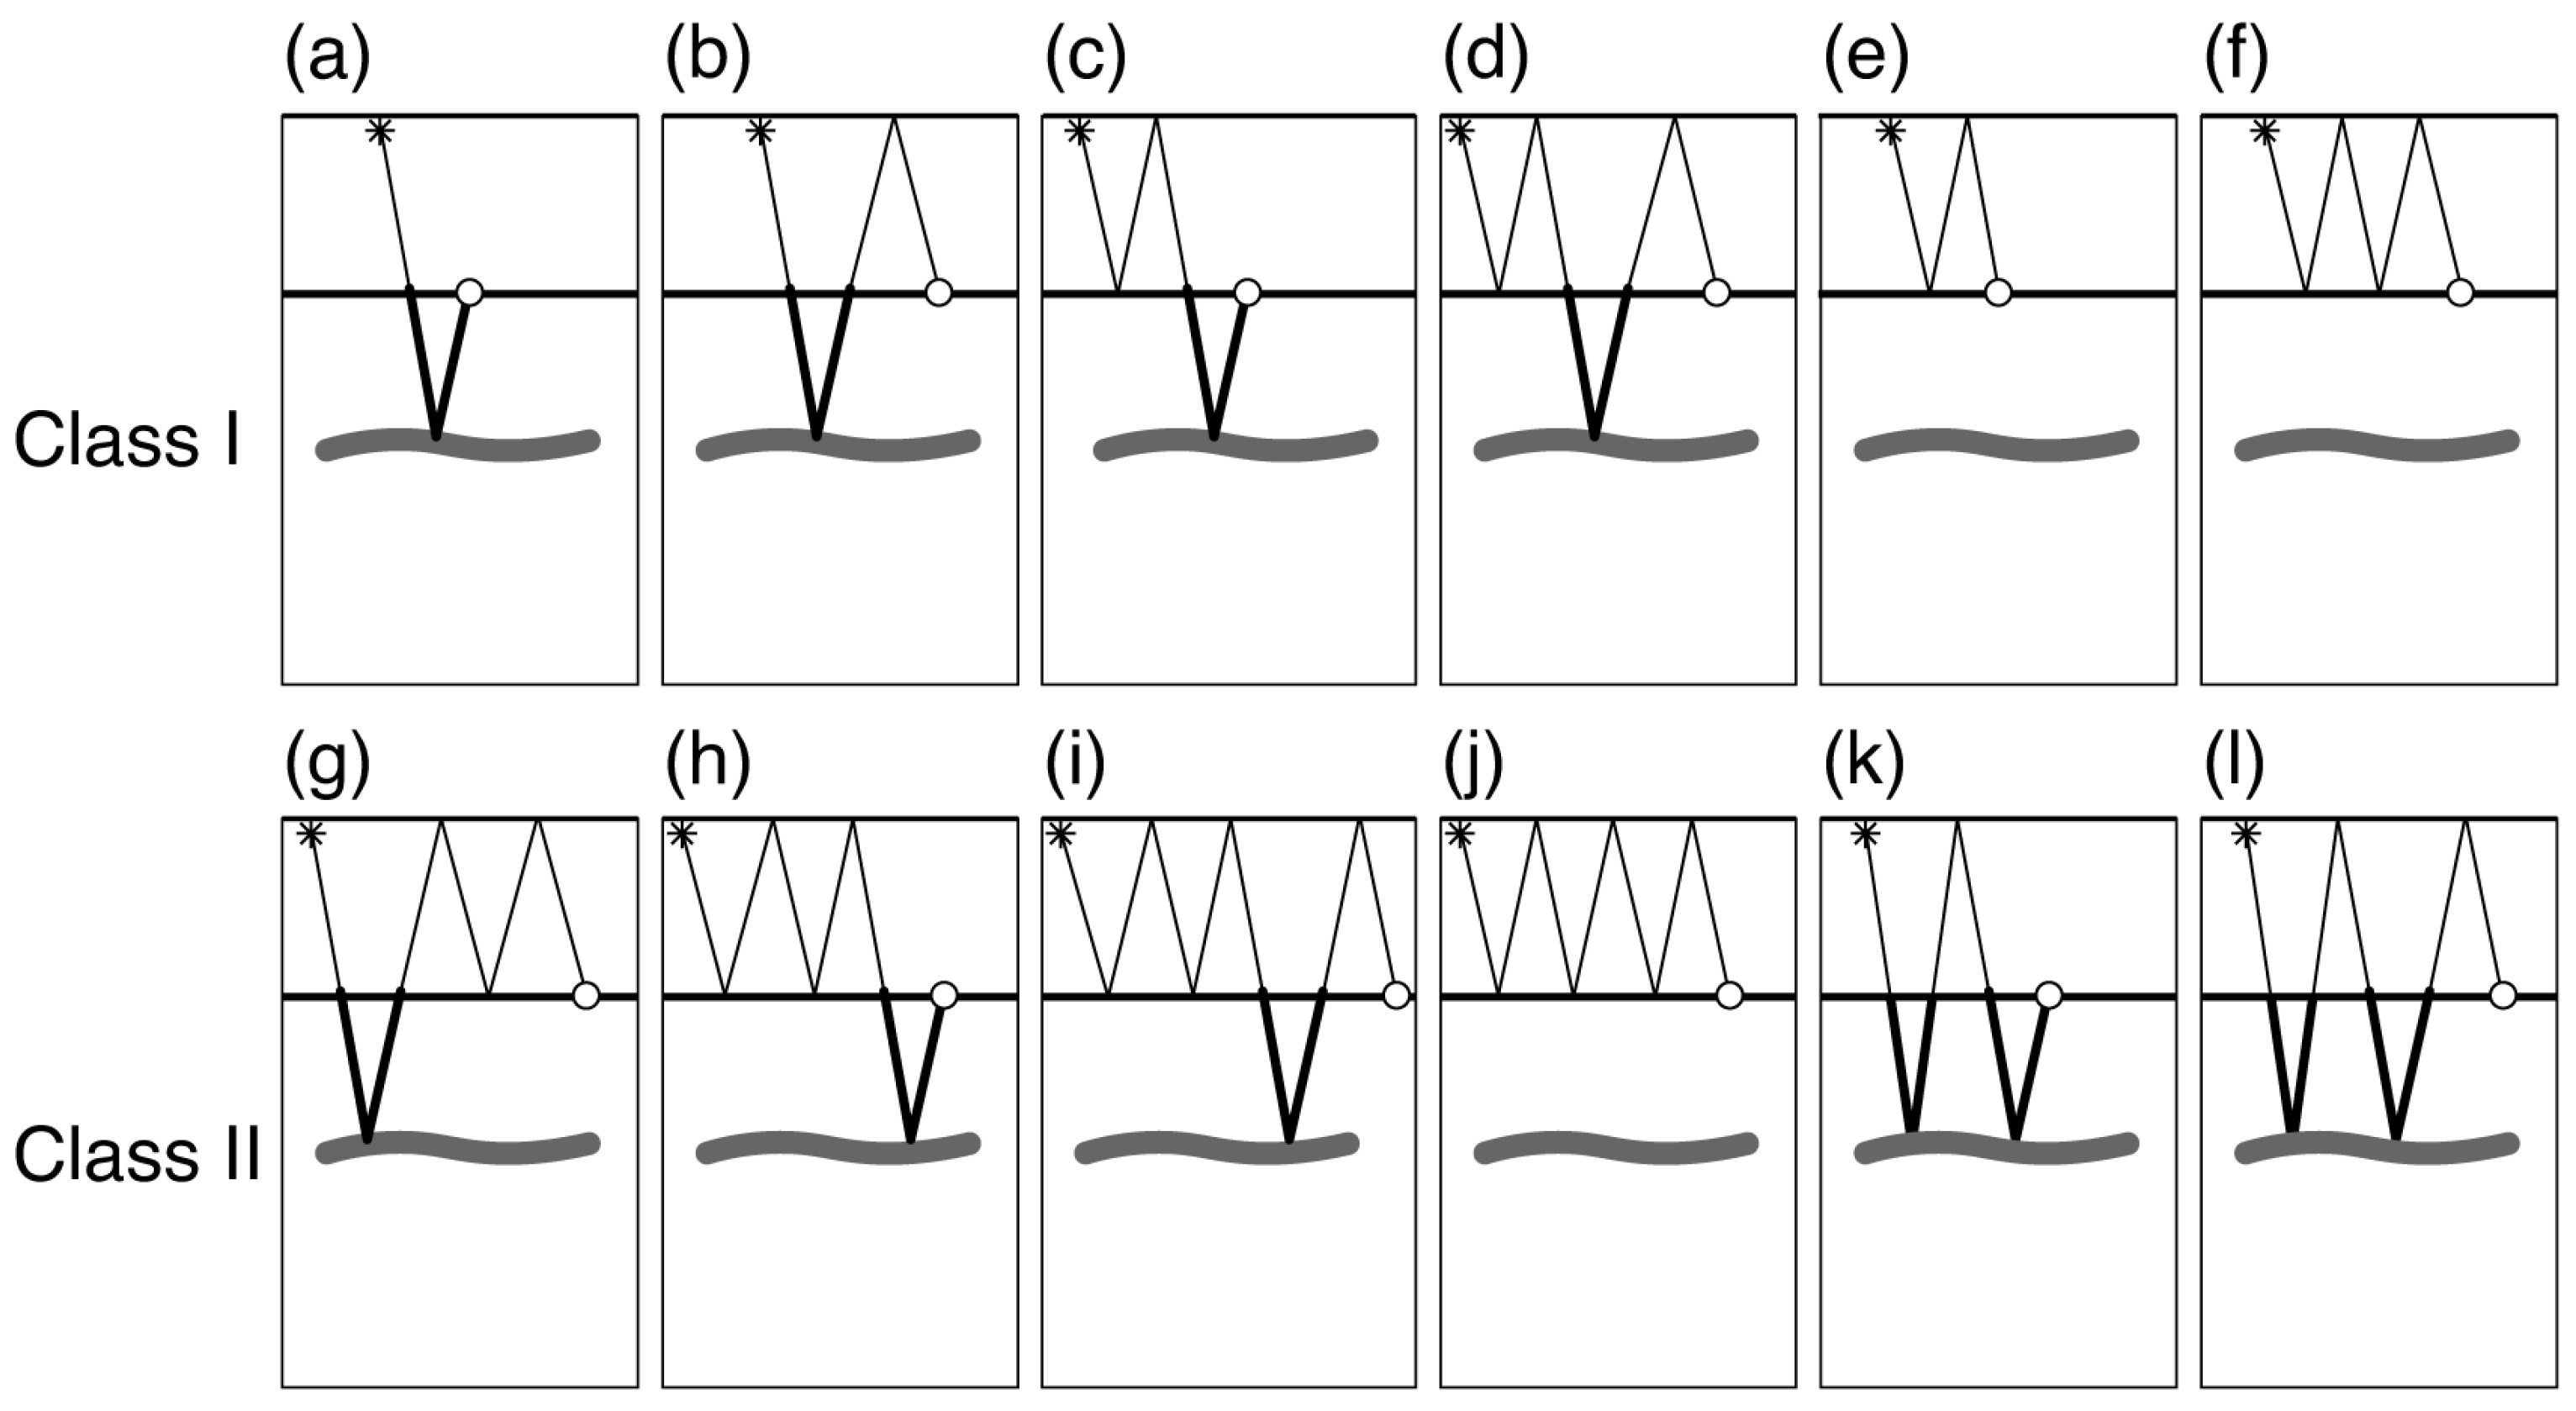
Figure 1. Typical wavepaths in the OBS observation geometry. Specifically, in class I, (a) primary reflection, (b) down-going receiver-side 1st-order WLRM, (c) up-going source-side 1st-order WLRM, (d) down-going source- and receiver-side 1st-order WLRM, (e) 1st-order water reverberation, and (f) 2nd-order water reverberation. In class II, (g) receiver-side 2nd-order WLRMs, (h) source-side 2nd-order WLRMs, (i) source-side 2nd-order plus receiver-side 1st-order WLRMs, (j) 3rd-order water reverberations, (k) up-going, and (l) down-going long-term free-surface-related multiples. The asterisks and circles indicate the sources and receivers, respectively.
Jmse 13 02109 g001
Figure 2. Flowchart of the investigation workflow. The yellow stream indicates the wave modeling process, while the orange stream indicates the imaging process.
Jmse 13 02109 g002
Figure 3. The three-layer model and traces of data from a single pair of source and receiver. (a) The three-layer model and model parameters (Vp, Vs, Density) of each layer are listed in the figure; the source and receiver are highlighted by the black asterisk and white dot, respectively. (b) Acoustic pressure traces of six events corresponding to Figure 1a–f. (c) Elastic P-/S-wave traces of pPP, pPS, pSP, and pSS events corresponding to the primary reflection. (d) Elastic PS-reflection traces corresponding to the multiple wave paths. In panels (b,c), some traces are scaled in comparison to the first traces, as demonstrated in the notations by the side of wiggles.
Jmse 13 02109 g003
Figure 4. Migration responses of typical wavepaths in the OBS observation geometry. Specifically, (a) primary reflection, (b) down-going receiver-side 1st-order WLRM, (c) up-going source-side 1st-order WLRM, (d) down-going source- and receiver-side 1st-order WLRM, (e) 1st-order water reverberation, and (f) 2nd-order water reverberation. The source and receiver are highlighted by the black asterisk and white dot, respectively. The horizontal dashed lines indicate the depth of seafloor and subsurface reflector.
Jmse 13 02109 g004
Figure 5. Illustrative showing mirror migration responses. Specifically, (a) primary reflection, (b) down-going receiver-side 1st-order WLRM, (c) up-going source-side 1st-order WLRM, (d) down-going source- and receiver-side 1st-order WLRM, (e) 1st-order water reverberation, and (f,g) 2nd-order water reverberation. The red asterisk and blue circle indicate the source and receiver in the mirrored migration, while the black symbols and dashed lines highlight the mirror geometry. The migration responses are highlighted in green.
Jmse 13 02109 g005
Figure 6. Mirror migration responses. Specifically, (a) down-going receiver-side 1st-order WLRM, (b) up-going source-side 1st-order WLRM, (c) down-going source- and receiver-side 1st-order WLRM, (d) 1st-order water reverberation, and (e,f) 2nd-order water reverberation. The source and receiver are highlighted by the black asterisk and white dot, respectively. The horizontal dashed lines indicate the depth of seafloor and subsurface reflector.
Jmse 13 02109 g006
Figure 7. Migration responses of up-going elastic primary reflections. (a) pPP, (b) pPS, (c) pSP, and (d) pSS. The source and receiver are highlighted by the black asterisk and white dot, respectively. In each panel, the top diagram indicates the elastic ray path, while the bottom is the depth image. The horizontal dashed lines indicate the depth of the seafloor and subsurface reflector.
Jmse 13 02109 g007
Figure 8. Migration responses of up-going convert-wave reflections. PS convert-wave reflection in the source-side (a) 1st-order and (b) 2nd-order WLRMs, and (c) the long-period multiples. The top row shows the ray paths. Correspondingly, the middle row shows the migration responses of crosstalk artifacts, and the bottom row shows the correct mirror migration responses. The source and receiver are highlighted by the black asterisk and white dot, respectively. The horizontal dashed lines indicate the depth of seafloor and subsurface reflector.
Jmse 13 02109 g008
Figure 9. The BSR model and its parameters are listed in the figure.
Jmse 13 02109 g009
Figure 10. Depth images and ADCIGs from a conventional Kirchhoff PSDM engine. (a) Primary reflection, (b) down-going receiver-side 1st-order WLRM, (c) up-going source-side 1st-order WLRM, (d) down-going source- and receiver-side 1st-order WLRM, (e) 1st-order water reverberation, and (f) 2nd-order water reverberation. In each panel, the top subplot indicates the stacked depth image, and the bottom subplot indicates the pre-stack ADCIGs.
Jmse 13 02109 g010
Figure 11. Depth images and ADCIGs from a mirror Kirchhoff PSDM engine. (a) Down-going receiver-side 1st-order WLRMs, (b) up-going source-side 1st-order WLRMs, (c) down-going source- and receiver-side 1st-order WLRMs, (d) 1st-order water reverberations, and (e,f) 2nd-order water reverberations. In each panel, the top subplot indicates the stacked depth image, and the bottom subplot indicates the pre-stack ADCIGs.
Jmse 13 02109 g011
Figure 12. Depth images and ADCIGs from separated P- and S-wave reflections. (a) PP and (b) PS imaging results. In each panel, the top and bottom subplot indicates the stacked image and ADCIGs.
Jmse 13 02109 g012
Figure 13. The truncated Marmousi2 model. (a) The P-wave velocity model and (b) the density model. The S-wave velocity model is scaled from the P-wave velocity model by assuming the elastic domain as a Poisson solid. The water layer is indicated by gray, with constant model parameters, Vp = 1.5 km/s, Vs = 0.0 km/s, and density = 1.0 g/cm3. The dense source array is indicated by the red line on the top of the model, and 41 OBNs are indicated by white dots on the seafloor. Common-receiver gathers are sorted and imaged.
Jmse 13 02109 g013
Figure 14. Depth images and ADCIGs of mixed acoustic pressure data. (a) Stacked image and (d) ADCIGs for mixed up- and down-going records. (b) Stacked image and (e) ADCIGs for up-going records. (c) Stacked image and (f) ADCIGs for down-going records. The ADCIGs are extracted between x = 0.52 km and x = 4.94 km, with an interval of 0.26 km, and the open angle range is [ 0 , 80 ] .
Jmse 13 02109 g014
Figure 15. Depth images and ADCIGs for imaging separated elastic P- and S-wave records. (a) Stacked image and (c) ADCIGs for up-going PP imaging, (b) stacked image and (d) ADCIGs for up-going PS imaging. The ADCIGs are extracted between x = 0.52 km and x = 4.94 km, with an interval of 0.26 km, and the open angle range is [ 0 ° , 80 ° ] .
Jmse 13 02109 g015
Disclaimer/Publisher’s Note: The statements, opinions and data contained in all publications are solely those of the individual author(s) and contributor(s) and not of MDPI and/or the editor(s). MDPI and/or the editor(s) disclaim responsibility for any injury to people or property resulting from any ideas, methods, instructions or products referred to in the content.