Article

DLC-Organized Tower Base Forces and Moments for the IEA-15 MW on a Jack-up-Type Support (K-Wind): Integrated Analyses and Cross-Code Verification

1
KOMS Co., Ltd., Saenggok-ro, 189beon-gil, Gangseo-gu, Busan 46729, Republic of Korea
2
Institute for Advanced Engineering, 175-28, Goan-ro 51beon-gil, Baegam-myen, Cheoin-gu, Yongin-si 17180, Gyeonggi-do, Republic of Korea
*
Author to whom correspondence should be addressed.
J. Mar. Sci. Eng. 2025, 13(11), 2077; https://doi.org/10.3390/jmse13112077
Submission received: 2 October 2025 / Revised: 22 October 2025 / Accepted: 28 October 2025 / Published: 31 October 2025

Abstract

Offshore wind turbines are rapidly scaling in size, which amplifies the need for credible integrated load analyses that consistently resolve the coupled dynamics among rotor–nacelle–tower systems and their support substructures. This study presents a comprehensive ultimate limit state (ULS) load assessment for a fixed jack-up-type substructure (hereafter referred to as K-wind) coupled with the IEA 15 MW reference wind turbine. Unlike conventional monopile or jacket configurations, the K-wind concept adopts a self-installable triangular jack-up foundation with spudcan anchorage, enabling efficient transport, rapid deployment, and structural reusability. Yet such a configuration has never been systematically analyzed through full aero-hydro-servo-elastic coupling before. Hence, this work represents the first integrated load analysis ever reported for a jack-up-type offshore wind substructure, addressing both its unique load-transfer behavior and its viability for multi-MW-class turbines. To ensure numerical robustness and cross-code reproducibility, steady-state verifications were performed under constant-wind benchmarks, followed by time-domain simulations of standard prescribed Design Load Case (DLC), encompassing power-producing extreme turbulence, coherent gusts with directional change, and parked/idling directional sweeps. The analyses were independently executed using two industry-validated solvers (Deeplines Wind v5.8.5 and OrcaFlex v11.5e), allowing direct solver-to-solver comparison and establishing confidence in the obtained dynamic responses. Loads were extracted at the transition-piece reference point in a global coordinate frame, and six key components (Fx, Fy, Fz, Mx, My, and Mz) were processed into seed-averaged signed envelopes for systematic ULS evaluation. Beyond its methodological completeness, the present study introduces a validated framework for analyzing next-generation jack-up-type foundations for offshore wind turbines, establishing a new reference point for integrated load assessments that can accelerate the industrial adoption of modular and re-deployable support structures such as K-wind.

1. Introduction

Offshore wind energy is scaling rapidly in turbine size and project capacity. A total of 15 MW-class machines with ~240 m rotors and ~150 m hub heights are moving from design to demonstration, promising levelized cost of energy (LCOE) reductions but also amplifying coupled aero-hydro gravity loads that govern support-structure certification. This scale-up sharpens the need for credible integrated load analyses that resolve rotor–nacelle assembly (RNA), tower, and substructure interactions and that are traceable across tools [1,2].
Standards-compliant ultimate limit state (ULS) assessment requires both coverage and traceability. The IEC and DNV frameworks define minimum ULS cases for fixed-bottom turbines and prescribe environmental modeling and metocean pairing rules; in practice, DLC 1.3/1.4/6.1/6.2 are central to site suitability and design verification, while wave kinematics and spectral choices (e.g., JONSWAP) follow recommended practices. These prescriptions motivate the DLC coverage and pairing choices adopted in this work [3,4,5,6].
At the same time, agreement across analysis tools depends on harmonized coordinate frames, extraction planes, controller implementations, and stochastic-seed treatment. Prior validation and code-to-code studies—ranging from DeepCwind/OC5 wave-tank comparisons to monopile ULS envelopes and recent IEA 15 MW intercomparisons—show that component-resolved reporting and explicit sign/heading conventions are essential to reproducibility. They also document that cross-tool spreads concentrate in lateral yaw-plane channels if conventions and short-rise inputs differ [7,8,9,10,11].
Against this backdrop, jack-up-type fixed-bottom concepts remain underdocumented in the public literature relative to monopiles and jackets, especially at the tower base, where component-resolved ULS data are seldom tabulated. In Korea, a multi-gigawatt offshore build-out is planned on an accelerated timeline along the southwest coast; soft sedimentary seabeds and constrained heavy-lift availability challenge conventional monopile/jacket installation. The K-wind concept—a triangular jack-up foundation with spudcan anchorage—targets LCOE reduction via onshore pre-assembly, towing, and self-installation without a wind turbine installation vessel (WTIV). The platform deck is set 14 m above MSL, so wave actions on the superstructure are avoided by design, and hydrodynamics are confined to slender legs, for which Morison-type modeling is appropriate when member diameters are small relative to local wavelengths [2,6].
To ensure reproducibility, we employed the public IEA 15 MW turbine and the ROSCO baseline controller (variable-speed/collective-pitch). This pairing mirrors the current community practice for benchmarking and facilitates cross-tool comparison in ULS simulations [2,12,13].
This paper fills the documentation gap with a standards-compliant, DLC-organized, component-resolved ULS dataset at the tower base for a jack-up-type fixed-bottom support coupled to the IEA 15 MW, reported with explicit coordinate/sign conventions and seed-averaged signed envelopes:
To our knowledge, this is the first DLC-organized, component-resolved tower base ULS dataset for a jack-up-type fixed-bottom concept coupled with the IEA 15 MW, documented for cross-solver reproducibility and intended to complement monopile and floating benchmarks [2,7,8,9,10,11].
We analyzed DLC 1.3 (ETM), DLC 1.4 (ECD), DLC 6.1 (parked EWM), and DLC 6.2 (parked EWM grid), following IEC 61400-1/-3-1 and DNV-ST-0437 for inflow definitions, metocean pairing, and directional sweeps; wave kinematics followed DNV-RP-C205 [3,4,5,6].
Time-domain ULS simulations were executed independently in Deeplines Wind and OrcaFlex after steady-state verification and constant-wind benchmarks. Loads were extracted at the transition-piece top in a right-handed global frame and reported as seed-averaged signed envelopes for Fx, Fy, Fz, Mx, My, and Mz, aligning with intercomparison good practice [7,8,9,10,11].
Beyond governing fore–aft channels (Fx and My), we tracked Mx and Mz, where cross-tool spreads tend to concentrate under short-rise or misaligned inputs, clarifying the implementation sensitivities highlighted in prior intercomparisons [7,8,9,10,11].
The resulting dataset provides an early-stage verification benchmark for cross-tool validation, structural scaling, and standardization on 15 MW-class systems [1,11,14].
We use steady/constant-wind baselines to support interpretation; fatigue (FLS) and extended misalignment studies are outside the current scope and identified as future work [1,11,14].

2. Materials and Methods

2.1. Turbine and Substructure Models

The turbine model was the IEA 15 MW Reference Wind Turbine (IEA-15-240-RWT) released under IEA Wind Task 37 and published by NREL as an open, community benchmark to ensure reproducible research and cross-study comparison. The publicly released dataset provides the geometry and mass properties of the RNA and tower together with input files for common aero-servo-hydro-elastic tools, which we adopted here without modification for the RNA and with coupling at the tower-top interface. Key characteristics are summarized in Table 1 [2]. The baseline controller was the ROSCO reference pitch–torque controller configured for this turbine; below rated, generator torque control performs tip-speed ratio tracking, and above rated, collective pitch regulation is applied with gain scheduling and auxiliary modules as in the open-source implementation. This choice reflects the current practice for benchmark studies and facilitates reproducibility across codes [12,13].
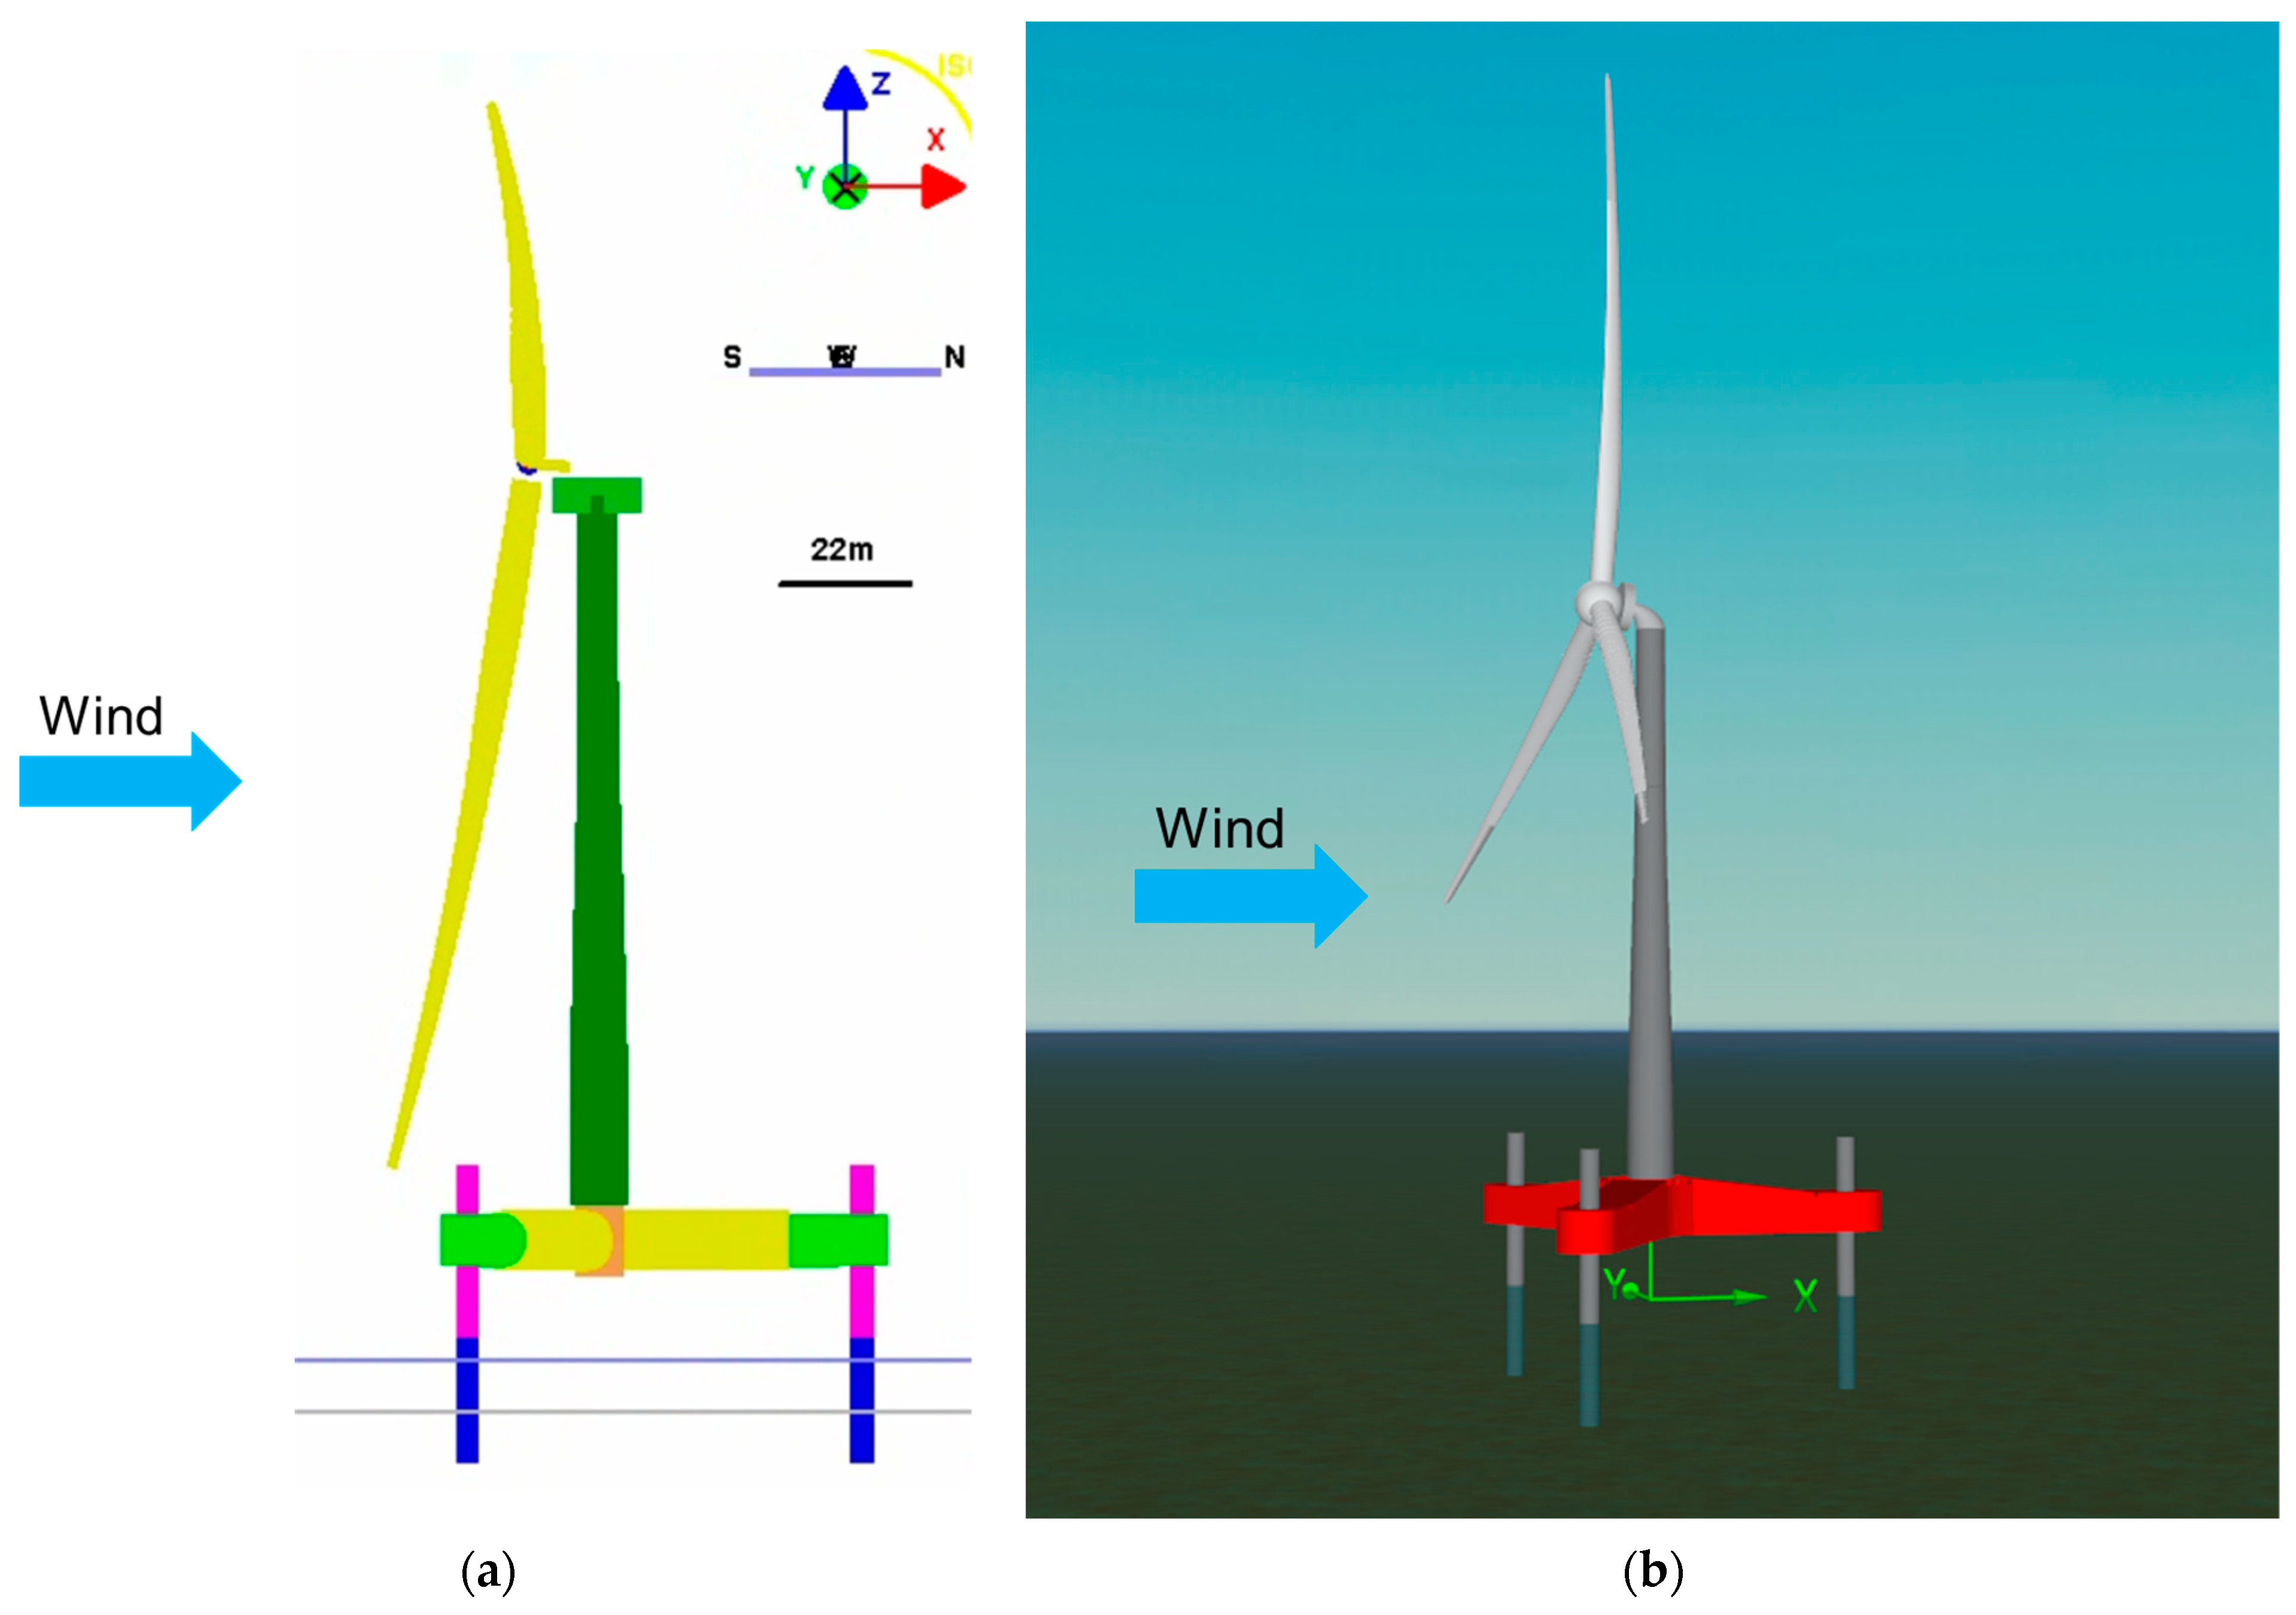
The substructure investigated was K-wind, a fixed jack-up-type concept developed for cost-efficient batch installation. It comprised three slender legs on a triangular platform; the legs were positioned at a radial distance of 36 m from the platform center, and the tower was connected at the platform centerline (Figure 1). The platform deck was located 14 m above mean sea level (MSL), providing a design air gap such that the deck/superstructure was governed by wind-induced loading, while wave loading was confined to the submerged legs. Accordingly, hydrodynamics was represented by a slender-member (Morison-type) formulation applied to the legs in the time-domain simulations, consistent with recommended practice for members with a small diameter relative to local wavelength [6]. Global axes and sign conventions follow the Deeplines Wind model used in this work: X is positive downwind (forward) from the tower center, Y is to port (left), and Z is upward; a right-handed convention is used throughout. The XY-plane origin is the tower center, and the vertical datum is defined with Z = 0 at the bottom of the pontoon body. Tower base loads were extracted at the tower base in this global frame and are reported as forces (Fx, Fy, and Fz) and moments (Mx, My, and Mz). Deck interactions gave the 14 m air gap. The right-handed global frame and TP-top extraction aligned the reported tower base ULS loads with standard IEC/DNV verification practice and enabled transparent cross-code comparisons (Deeplines Wind vs. OrcaFlex) presented later. Where applicable, environmental inputs (wind, waves, current, and directions) followed the DLC matrix defined for this study, with irregular JONSWAP seas and turbulence models per DLC to ensure standards-compliant ULS assessment. (Details are provided in Section 2.3).
In this study, Deeplines Wind v5.8.5 and OrcaFlex v11.5e are employed as independent time-domain solvers with aero-hydro-servo-elastic coupling under a unified coordinate frame, extraction plane, controller setup, and DLC matrix. OrcaFlex, widely used in offshore engineering, provides mature hydrodynamics and line/mooring dynamics (Morison-type with advanced line models) and robust nonlinear time integration; when applied to wind-turbine systems via aerodynamic modules and controller coupling, yaw/veer conventions and unsteady-aero options must be harmonized to limit spread in lateral/yaw-plane channels. Deeplines Wind offers workflows tailored for offshore-wind coupled analysis with integrated turbine–substructure modeling and transparent global frame definitions that facilitate component-resolved reporting. Using both tools in parallel increases confidence in the governing fore–aft channels (Fx/My) and localizes residual spreads mainly to Mx/Mz, which are known to be more sensitive to short-rise inputs and sign/heading conventions [7,8,9,10,11].

2.2. Environmental Conditions and Design Load Cases (DLCs)

The project site is located off Korea’s southwest coast between Jaeundo and Bigeumdo (Sinan County, Jeollanam-do, Republic of Korea). A design water depth of 20 m referenced to MSL was used in the simulations, and the platform deck was set 14 m above MSL as the design air gap. Environmental processes and DLCs were specified per IEC 61400-1/-3-1 and DNV-ST-0437 [3,4,5]; wave kinematics followed DNV-RP-C205 [6]. These specifications are summarized in Table 2 and Table 3. Only ULS cases are addressed in this paper. NTM/ETM/EWM were applied according to the governing DLC [3]. Above-hub wind profiles were modeled with a power-law shear referenced to hub height; veer was included when required by the inflow generator. (Controller settings are summarized in Section 2.1). For production ULS (DLC 1.3/1.4), irregular JONSWAP seas were paired co-directed with the mean wind unless noted; for parked ULS (DLC 6.1/6.2), heading sweeps (from 0° to 180°) were applied, and the thrust/drag resultant was resolved onto the global axes. Given the 14 m air gap, no direct wave loading acted on the deck/tower base; hydrodynamic contributions entered indirectly through the slender legs (Morison-type), and their influence under misaligned seas was flagged as a planned sensitivity analysis.
Irregular seas used JONSWAP spectra with peak-enhancement factor γ per DNV-RP-C205; long-crested waves were assumed unless a directional spread is prescribed [6]. Normal and extreme current and water-level ranges followed DNV-ST-0437 [5]. Each transient realization had a physical duration of 3600 s. Tower base loads were extracted at the tower base in the global frame defined in Section 2.2.
We prioritized ULS-controlling cases at the tower base that were required or strongly recommended by standards and that captured the governing physical channels. This selection also aligned with component-wise driver guidance in DNV-RP-0286 [15].
DLC 1.3 (ETM, power-producing) was multiple mean wind bins between cut-in and cut-out with ETM turbulence; irregular JONSWAP seas co-directed with the wind unless noted. Part of the minimum ULS set for site suitability in IEC 61400-1; near rated, ETM coincided with the torque-to-pitch hand-over and frequently governed fore–aft shear and bending (Fx, My) at the tower base [3,16,17].
DLC 1.4 (ECD, power-producing) was ECD events superimposed on operating conditions, concurrent sea state, and water level per the standards’ prescription. It captured rapid veer and yaw-plane/lateral excitation (Fy, Mx, and Mz) around the control transition, widely employed in code-to-code studies to probe secondary channels and controller sensitivity [4,16,18].
DLC 6.1/6.2 (parked/idling) was EWM with direction sweeps, irregular seas and water levels per normal/extreme specifications, and currents per normal/extreme models. DLC 6.2 included grid-loss/fault variants and could bound upper-end responses under directional sweeps. For traceability, the DLC matrix (wind bins, water levels, and wave pairs used in the runs) is provided in Table 2 and Table 3 [3,4,5,16].
DLC 1.3 and DLC 1.4 constituted dynamic, time-domain verification cases, ETM turbulence realizations, and short-duration ECD pulses run in parallel in Deeplines Wind and OrcaFlex to establish cross-code parity under stochastic/impulsive ULS inflow.

2.3. Steady-State Operating Points and Controller

Before the time-domain ULS simulations, we verified the steady-state operating points of the ROSCO baseline controller configured for the IEA 15 MW RWT. The controller implemented a standard variable-speed/collective-pitch strategy: below the rated wind speed, the generator torque command follows the quadratic law.
T g = K o p t ω g 2
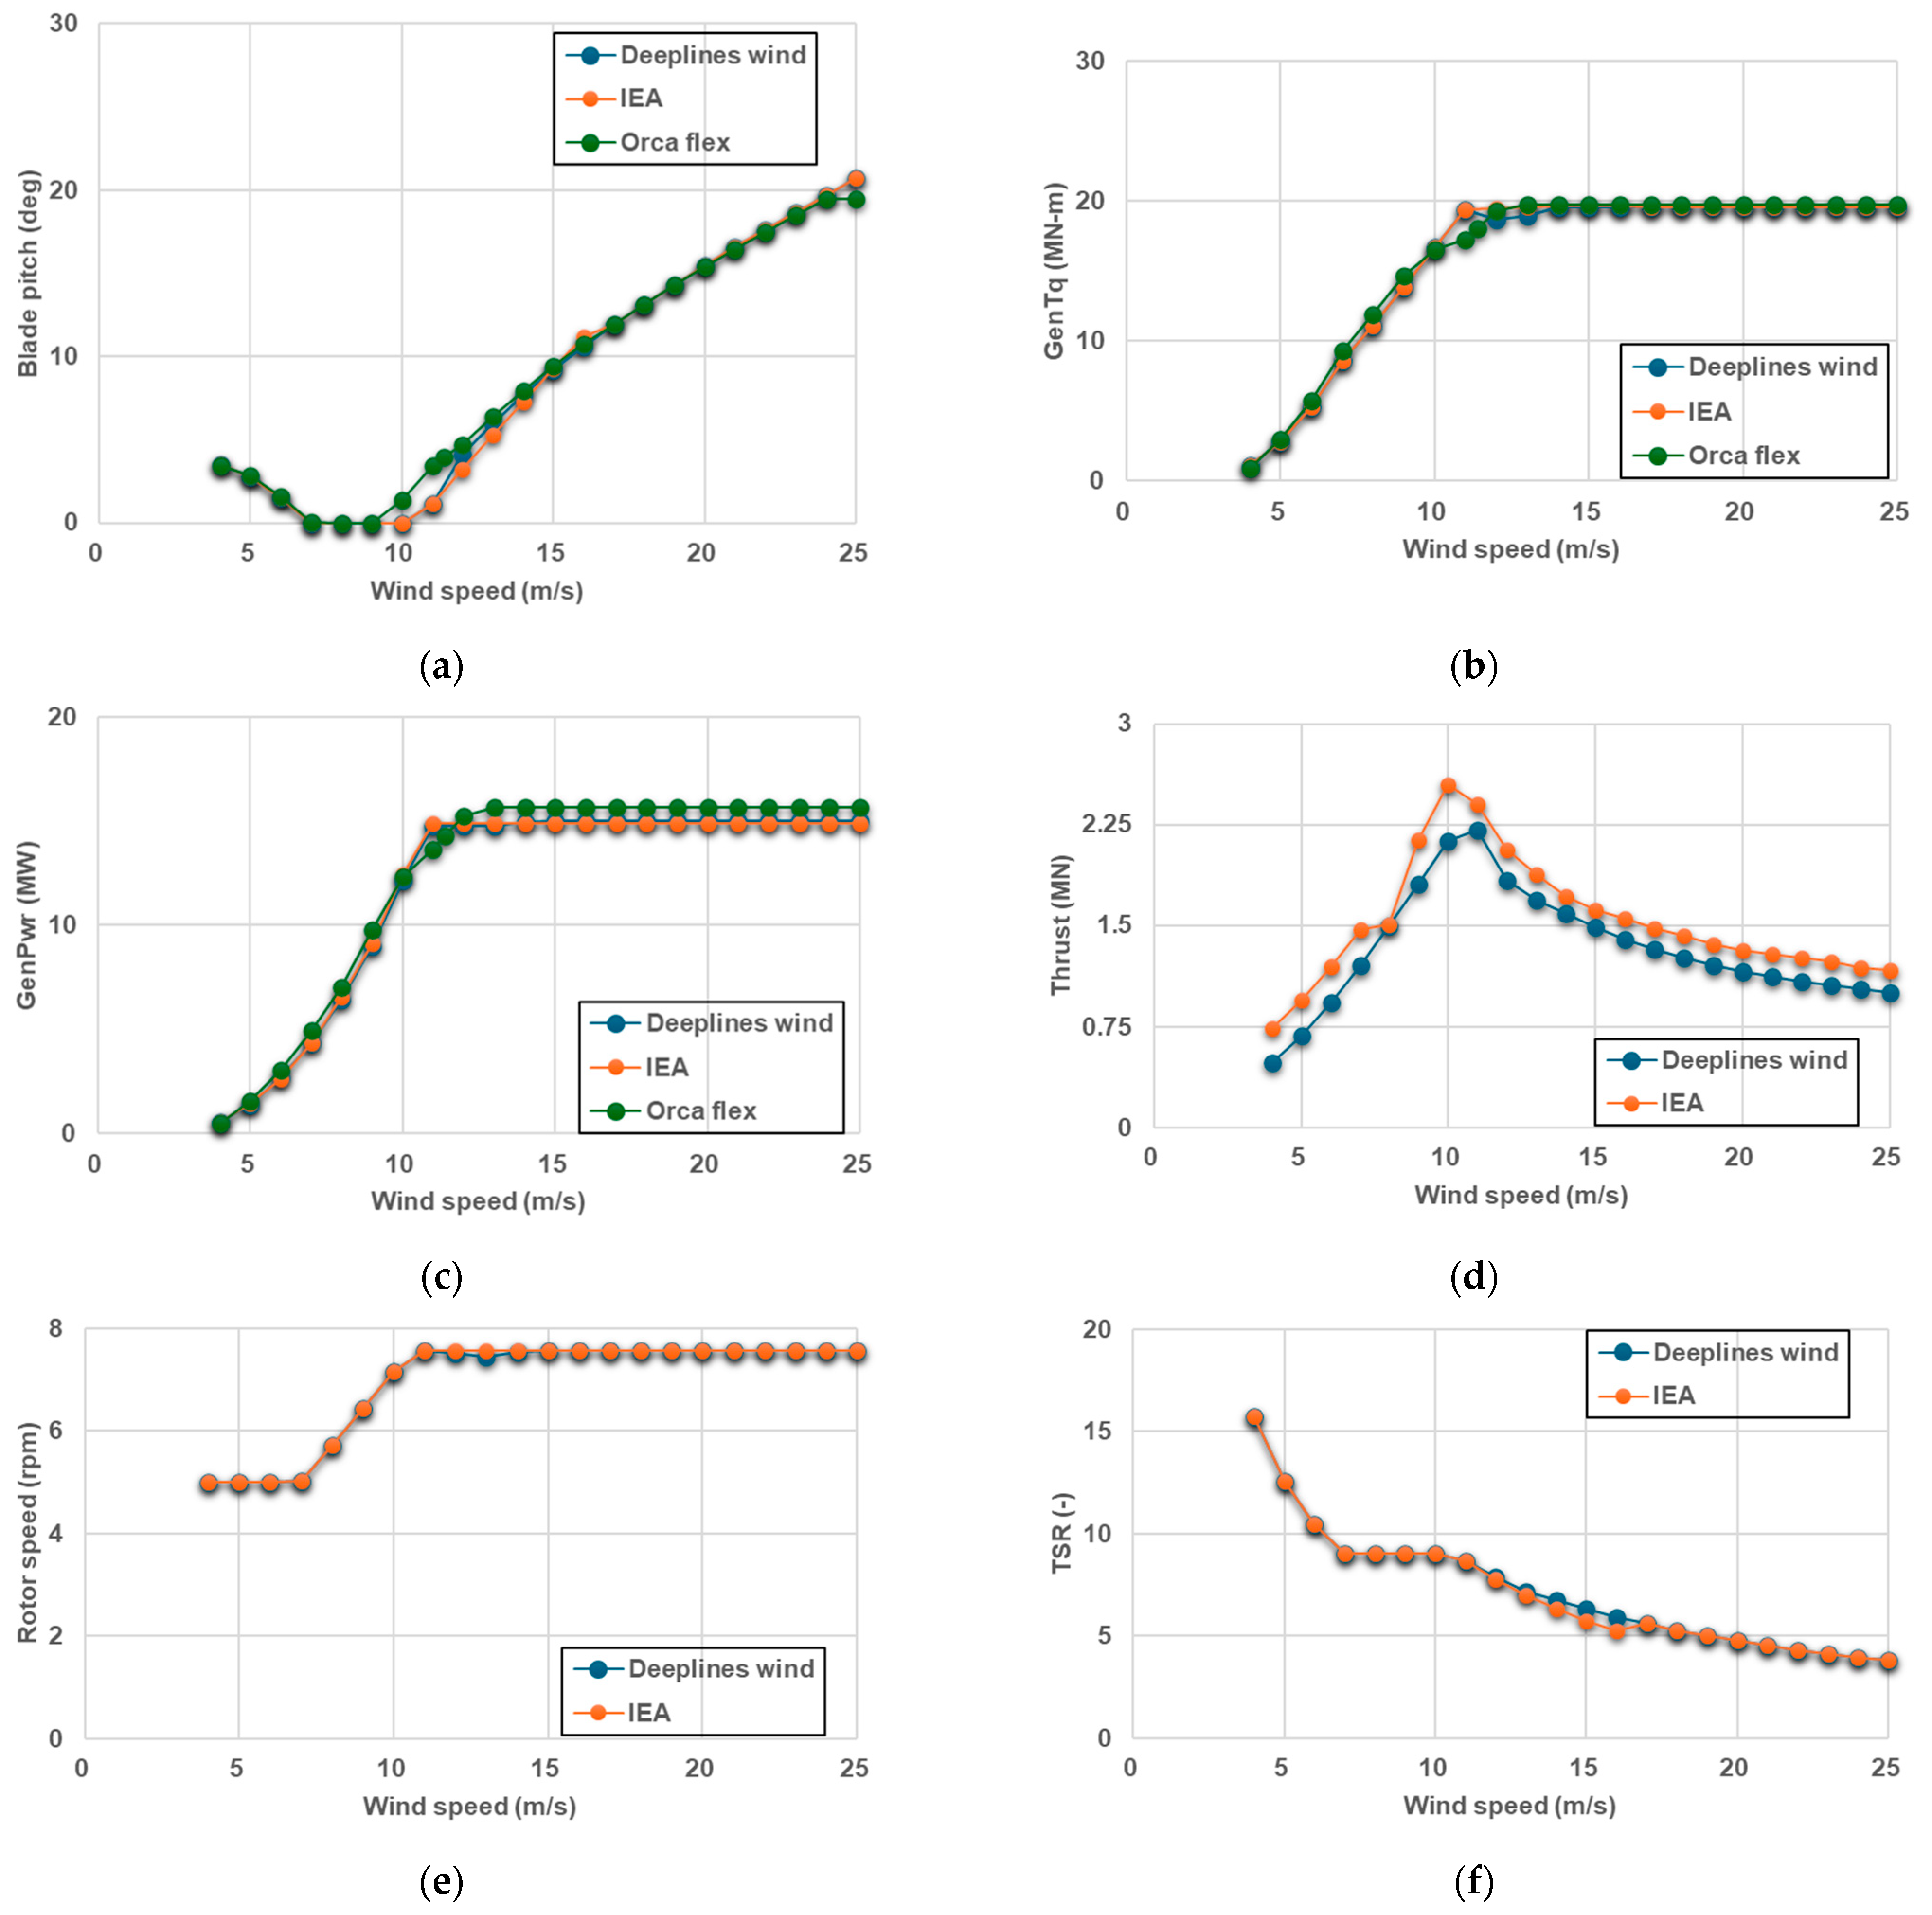
which tracks the aerodynamic maximum-power point via an optimal tip-speed ratio; at and above the rated wind speed, a collective-pitch loop with gain scheduling regulates generator speed and electrical power to their rated set-points (with rate limits and minimum-pitch scheduling as in the public implementation) [2,12,13]. Steady-state curves were computed for uniform inflow across the operating range (e.g., from 4 to 25 m/s) using the same turbine–controller pairing as in the ULS cases. The trajectories exhibit the expected behaviors of a modern variable-speed, pitch-regulated machine: (i) below rated, rotor speed and electrical power increase with wind speed, while the torque command follows T g ω g 2 ; (ii) near the rated transition (≈10.6 m/s for the IEA 15 MW), control authority shifts from torque to pitch; (iii) above rated, generator speed and electrical power remain effectively constant, collective pitch increases with wind speed, and rotor thrust decreases under pitch regulation [2,12,13]. These steady-state trajectories (collective blade pitch, generator torque, generator power, rotor thrust, rotor speed, and tip-speed ratio versus wind speed) provide the operating-point baseline for interpreting the ULS envelopes in Section 3 and confirm that the Deeplines Wind implementation reproduces the public IEA-15 MW specification to plotting resolution.

2.4. Constant-Wind Cross-Code Benchmark (Production and Parked)

To quantify the agreement between the two aero-servo-elastic solvers (Deeplines Wind, OrcaFlex) used in this work, we ran a controlled code-to-code benchmark under constant-wind inputs before the stochastic DLC analyses. Such solver intercomparisons are a standard step in the IEA Wind Task 30 OC projects and are also used pervasively in public IEA 15 MW studies to establish model-form parity without the confounding effects of turbulence or wave variability [7,9,14]. Loads were extracted at the tower/transition-piece interface (tower base) defined in Section 2.2: +X downwind (incoming wind direction), +Y to port (left), and +Z upward. The reported channels were the six tower base components (Fx, Fy, Fz, Mx, My, and Mz) [2,5].
Production (1.x, wind-only) mode was uniform, steady inflow U = 4~26 m/s (integer bins), and direction 0° aligned with +X. Turbulence, waves, and current were disabled to isolate solver implementation differences. Yaw behavior followed the ROSCO baseline controller (Section 2.1); all other settings matched the public IEA-15 MW configuration. Each case was simulated for 3600 s and post-processed per Section 2.5.
Parked (6.x, wind-only) was uniform, and steady inflow U = 46.8 m/s. The nacelle yaw was held at 0°, while the wind heading was swept from 0° to 180° in 30° steps (0°, 30°, 60°, 90°, 120°, 150°, and 180°). Waves and currents were disabled. Each case ran for 3600 s, with post-processing per Section 2.5 [3,7,9,14].

2.5. Post-Processing of Stochastic Realizations and ULS Envelope Post-Processing and Statistical Treatment

ULS tower base loads were reported for the six components (Fx, Fy, Fz, Mx, My, and Mz) in the global frame defined in Section 2.2. We followed the established practice in offshore load analysis to aggregate stochastic realizations (“seeds”) within each DLC before cross-code comparisons [7,9,14].
Three or six independent stochastic realizations (seeds) were used per ULS case. For the parked-turbine storm cases DLC 6.1 and DLC 6.2, three realizations were used owing to computational constraints; this reduced sample size was noted as a limitation when interpreting spread-sensitive channels.
For a given DLC case j and load component C, let C denote the 3600 s time series for seed s { 1 ,   2 , S } . The seed-averaged positive/negative extremes are given below.
C ¯ m a x ( j ) = 1 S s = 1 S max C j , s t , C ¯ m i n ( j ) = 1 S s = 1 S min C j , s t .
The reported ULS value for component C is the single signed extreme of larger magnitude,
C ¯ m a x ( j ) = C ¯ m a x ( j ) ,   if   C ¯ m a x ( j )   C ¯ m i n ( j ) C ¯ m i n ( j ) ,       Otherwise
which yields one signed envelope per component and DLC. This average of extremes then envelops the summary and mirrors the characteristic-load reporting adopted.

3. Results

3.1. Steady-State Response

Steady-state operating points of the IEA-15 MW reference wind turbine were computed under uniform inflow using the public ROSCO baseline controller configuration. The six standard channels—collective blade pitch, generator torque, generator power, rotor thrust, rotor speed, and tip-speed ratio (TSR)—were plotted versus wind speed with Deeplines Wind (blue) and OrcaFlex (green) overlaid on the public IEA 15 MW trajectories (orange) (Figure 2).
Across the operating range, the Deeplines Wind implementation reproduced the reference trajectories to plotting resolution. Below rated, generator torque control tracked the maximum-power point/TSR schedule while collective pitch remained near zero; above rated, torque saturates at the rated level and blade pitch increased monotonically to maintain rated rotor speed, as specified for the IEA 15 MW with ROSCO.
Across the operating range, both Deeplines Wind and OrcaFlex reproduced the IEA 15 MW steady-state schedules to plotting resolution: (i) below the rated wind speed, torque followed the quadratic law [Equation (1)] (maximum-power point/TSR tracking) while collective pitch remained near zero; (ii) at the rated transition the controller authority shifted from torque to pitch; and (iii) above rated, generator speed and electrical power were held essentially constant while pitch increased monotonically and rotor thrust decreased. These behaviors match the public IEA 15 MW definition and the ROSCO controller description. Minor local differences at the rated transition (e.g., small offsets in thrust or pitch at 10, 12 m/s) were consistent with discrete gain-scheduling and implementation specifics and sit within code-to-code spreads reported for reference models.
The near-coincident steady-state trajectories across the two solvers establish parity of controller/plant implementation and provide a compact baseline for interpreting the ULS tower base loads reported in Section 3.2, Section 3.3, Section 3.4, Section 3.5, Section 3.6, Section 3.7.

3.2. Constant-Wind Production Benchmark (Deeplines Wind vs. OrcaFlex)

The coordinate systems of Deeplines Wind and OrcaFlex under constant wind conditions are shown in Figure 3. Uniform aligned inflow along +X was applied at from 4 to 26 m/s (Δ = 2 m/s), with ROSCO active and waves/currents disabled (Section 2.4).
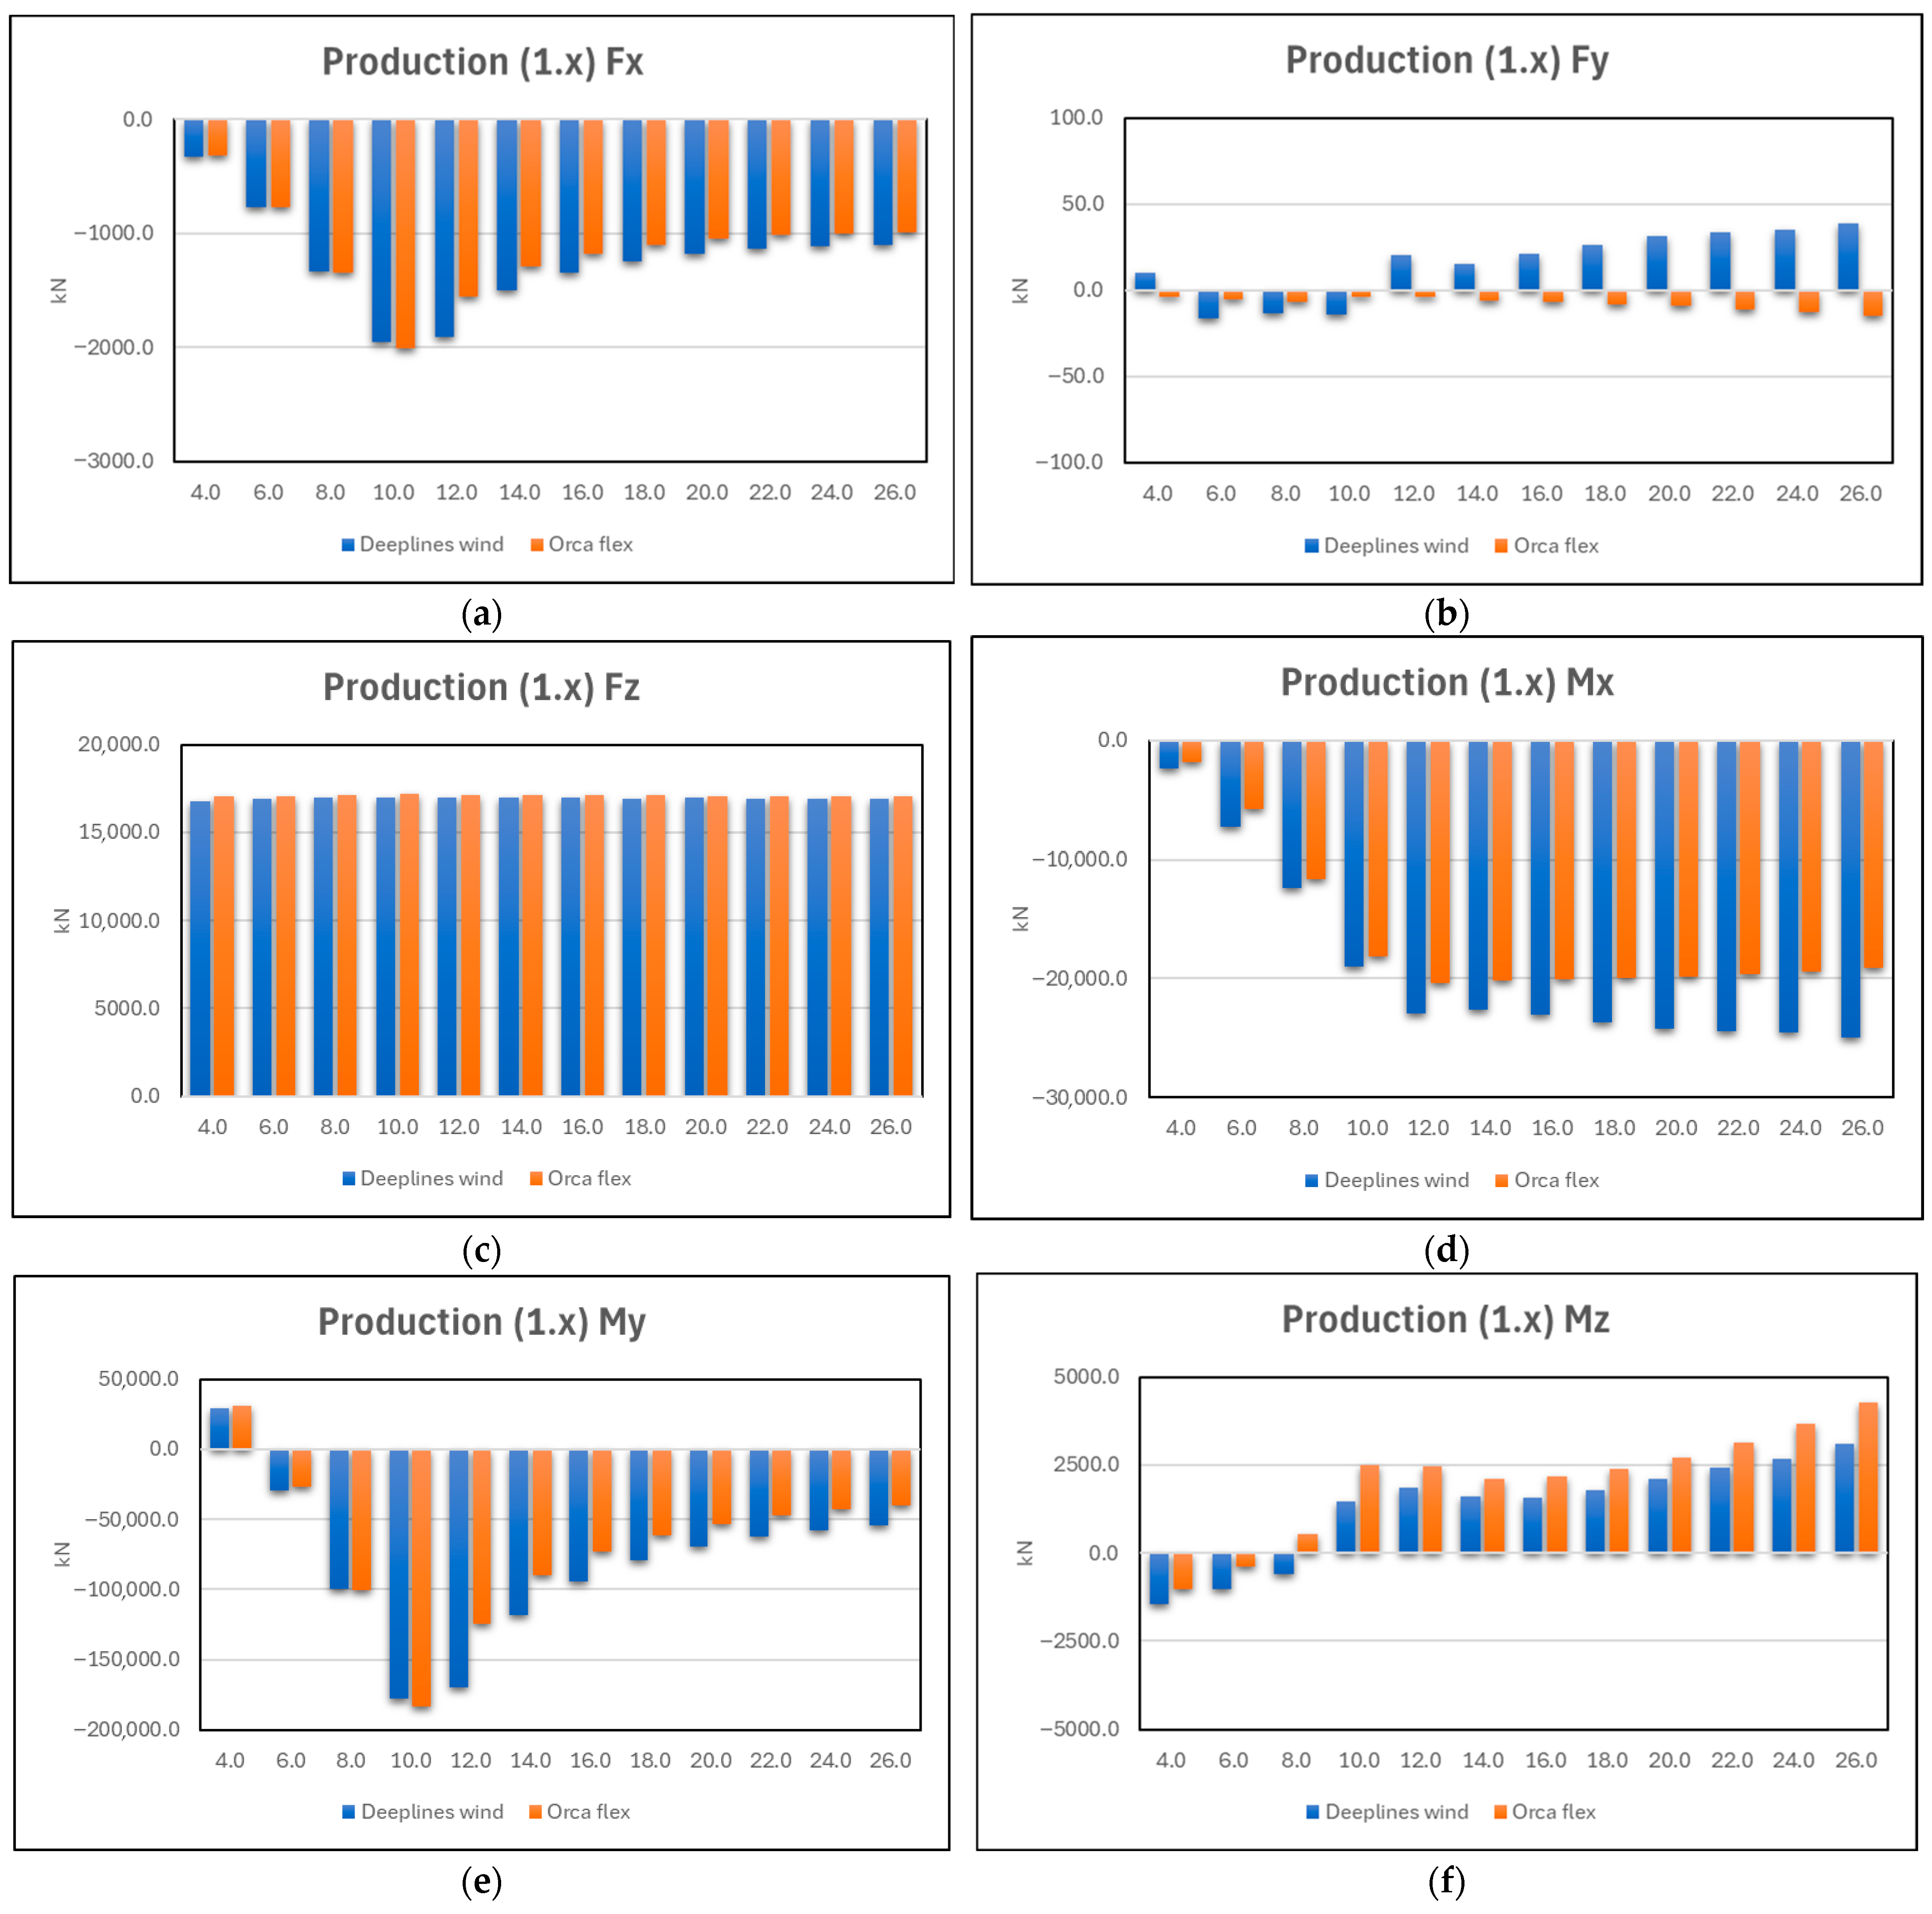
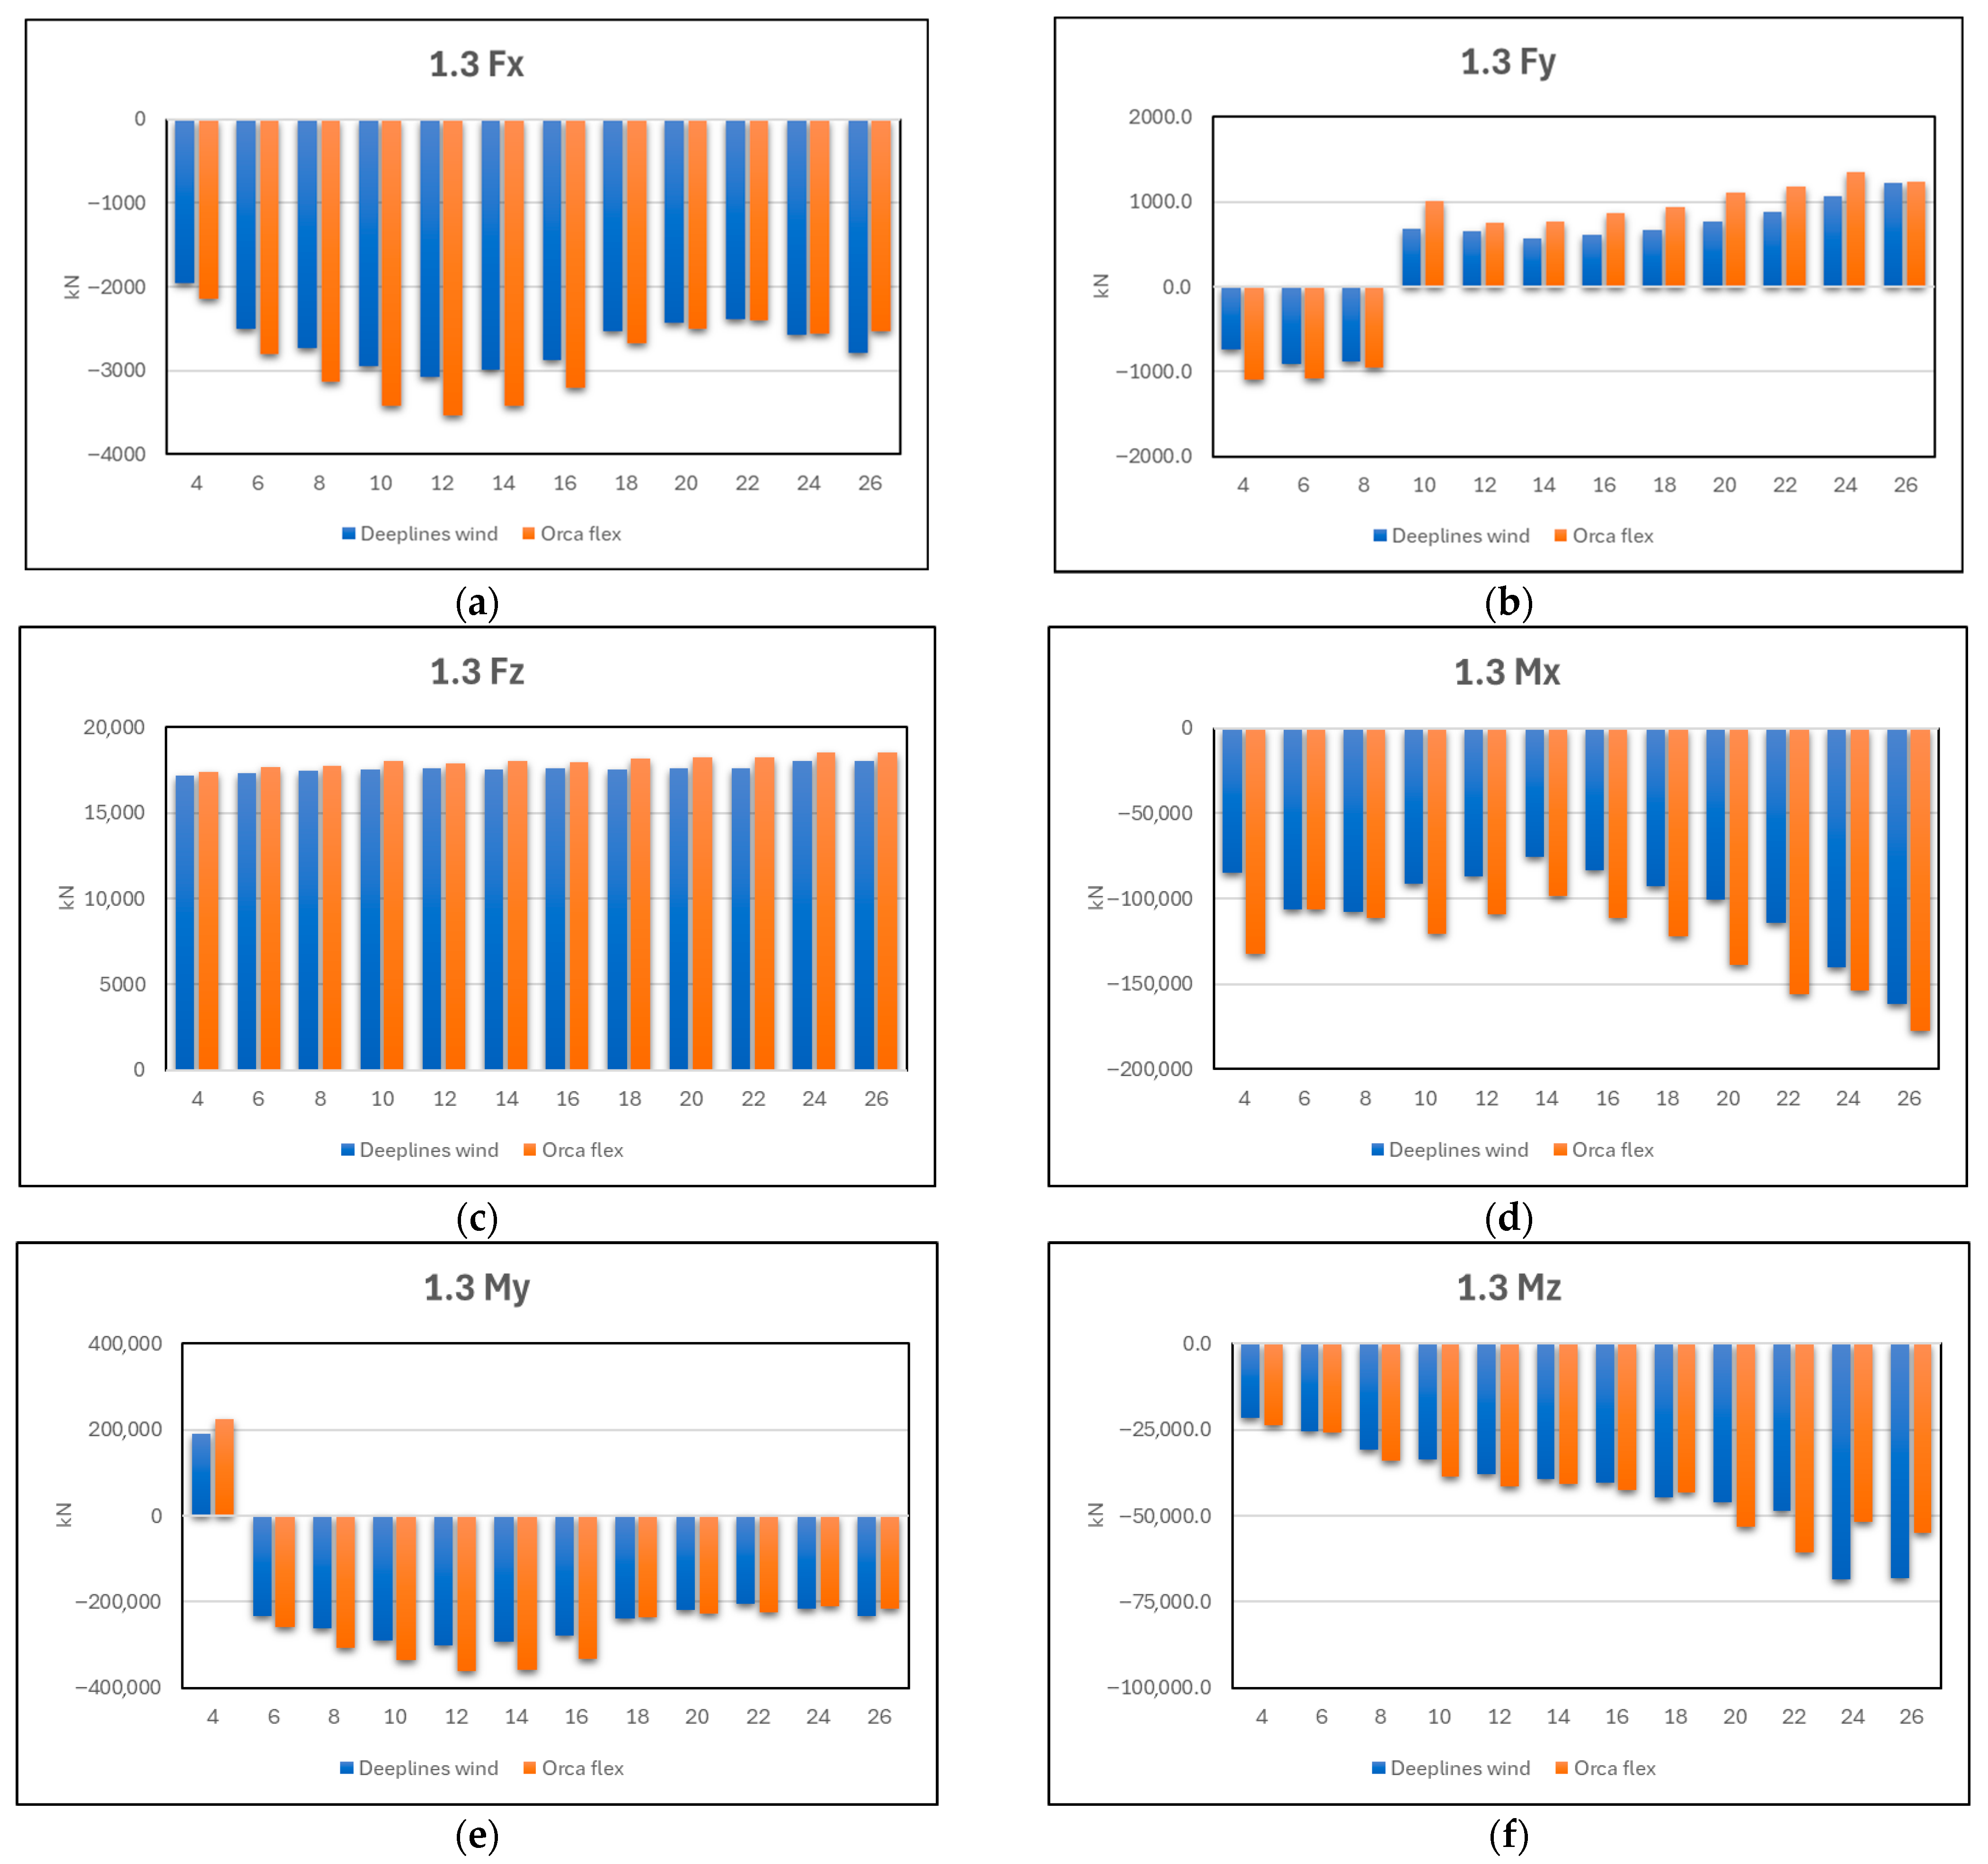
Tower base loads were post-processed per Section 2.5 [Equations (1) and (2)]. Figure 4 shows the seed-averaged extreme maxima/minima of the six tower base components versus wind speed for Deeplines Wind and OrcaFlex.
The fore–aft shear Fx strengthened as wind speed approached the rated region and then softened above rated, while the corresponding fore–aft bending My followed the same regime transition. This reflects the well-known evolution of rotor thrust—increasing up to the rated transition and decreasing under pitch regulation at higher winds—with the tower reaction mirroring that aerodynamic driver. Axial force Fz remained nearly constant because it was dominated by the RNA/tower weight with only a small contribution from thrust tilt.
After the broad reduction from ~12 to ~22 m/s, ∣Fx∣ (and, proportionally, ∣My∣) exhibited a small uptick at 24, 26 m/s. As blade pitch increased, the rotor-thrust component fell, but the aerodynamic drag on exposed structures (tower, nacelle, hub) grew approximately with U2. Beyond ~22 m/s, this non-rotor drag became non-negligible and partially offset the thrust reduction, yielding a shallow re-increase of the fore–aft reaction.

3.3. Constant-Wind Parked Benchmark (Deeplines Wind vs. OrcaFlex)

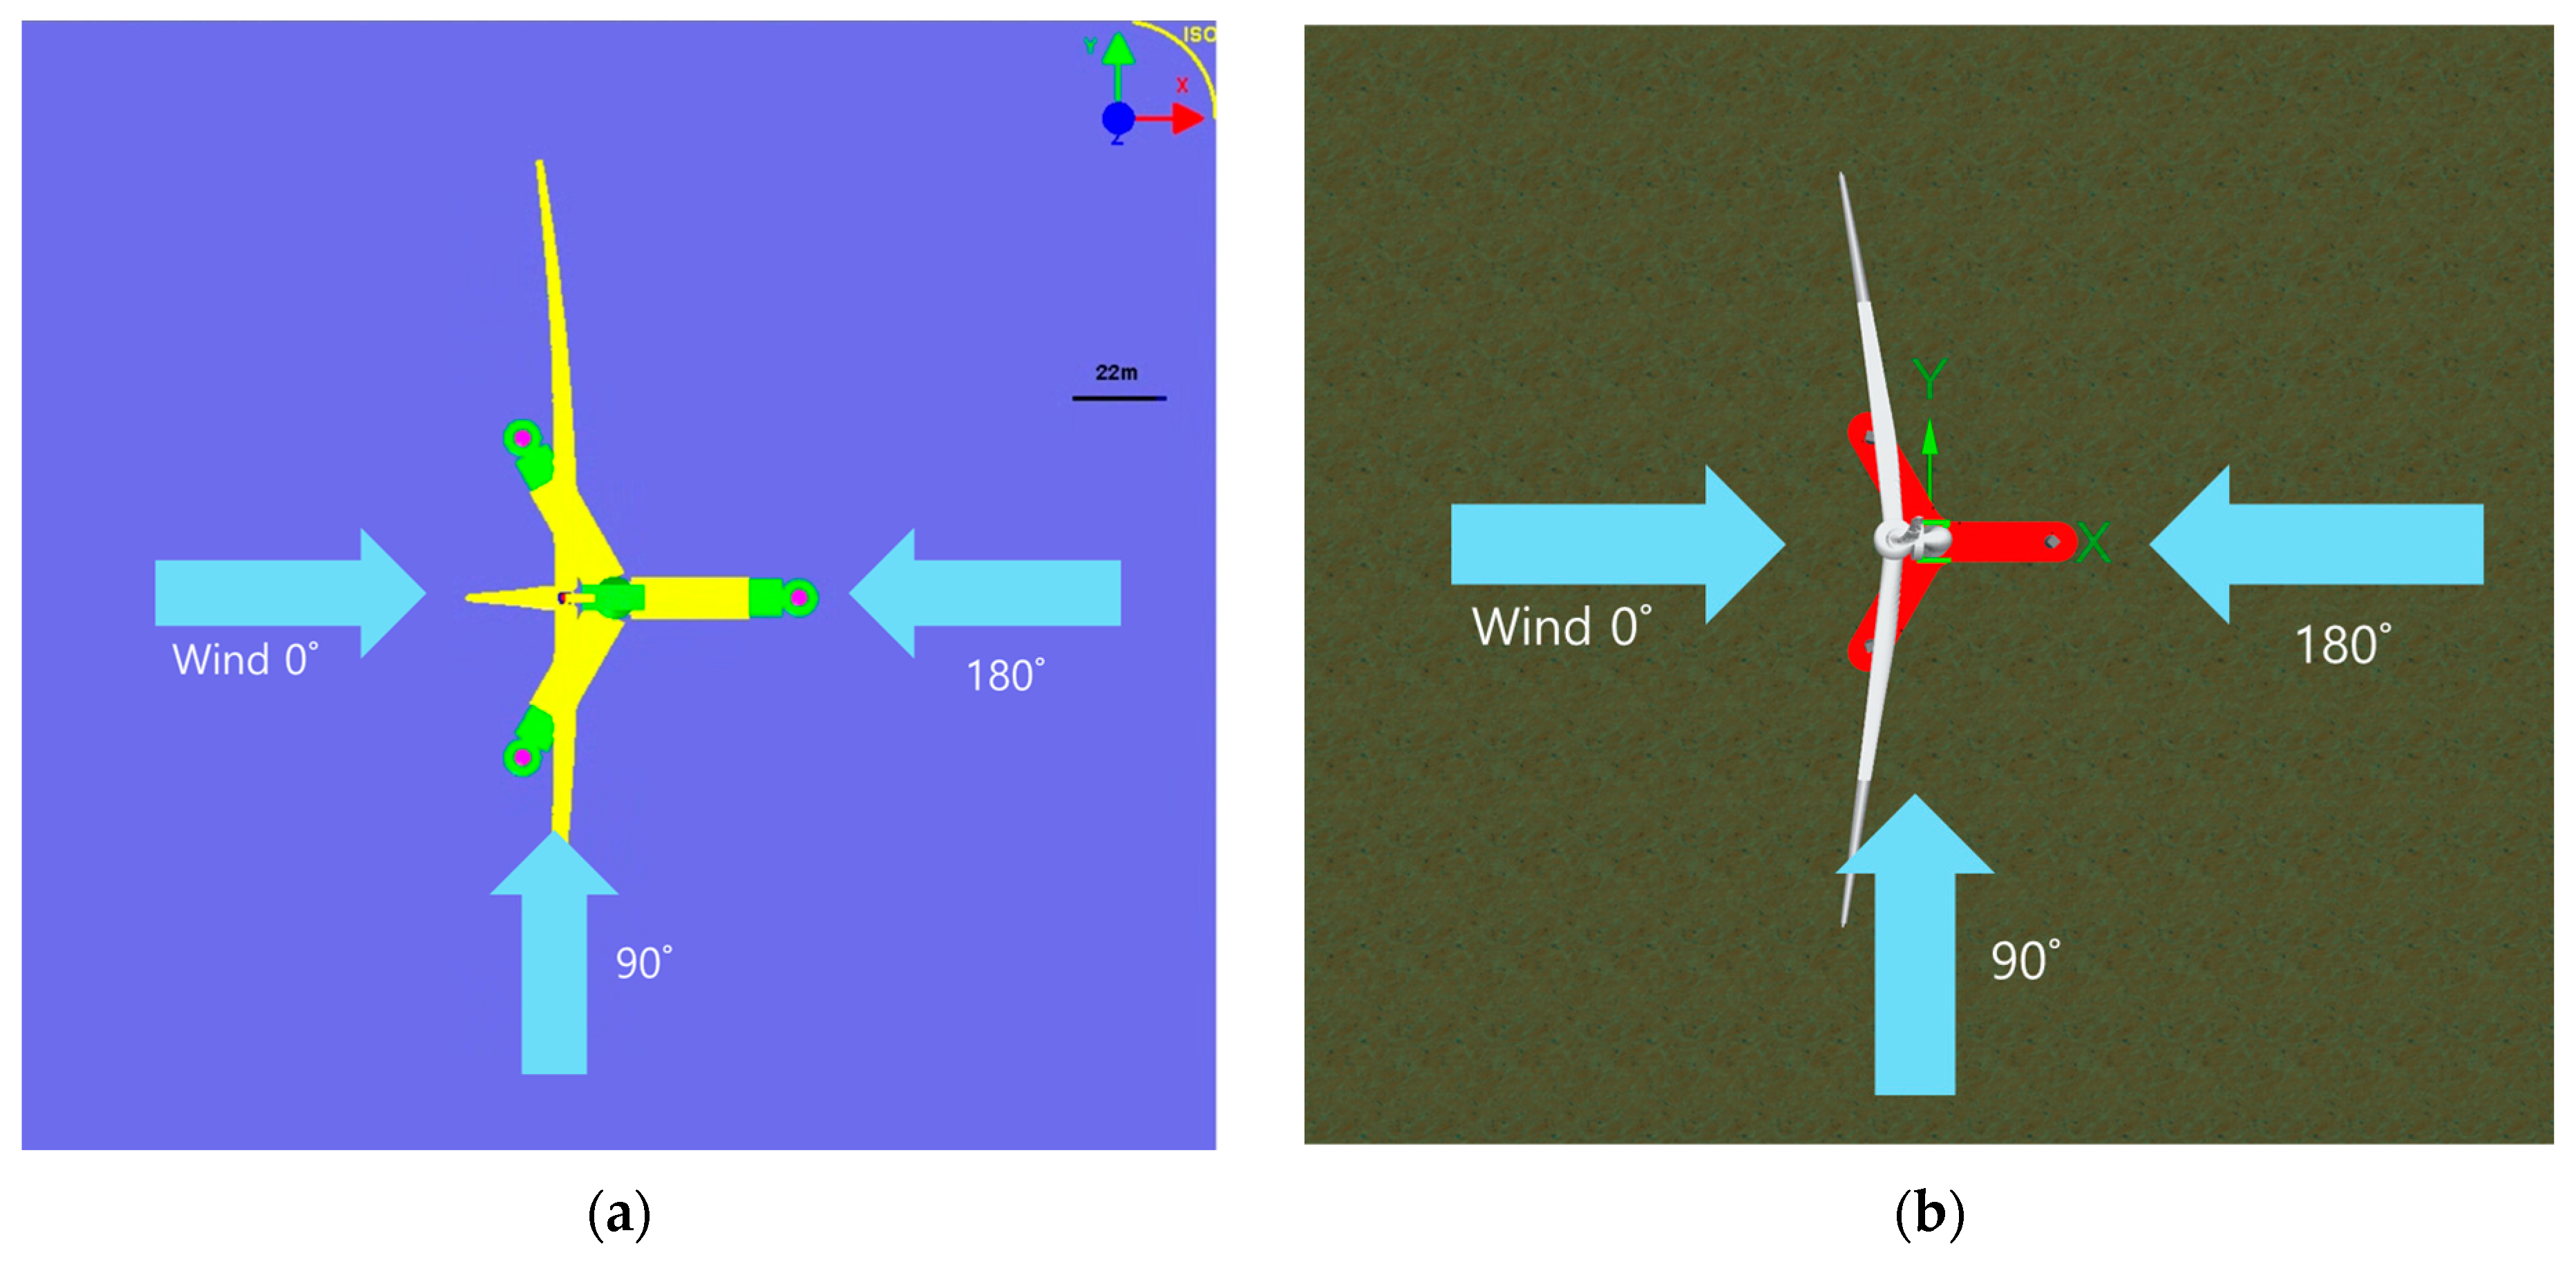
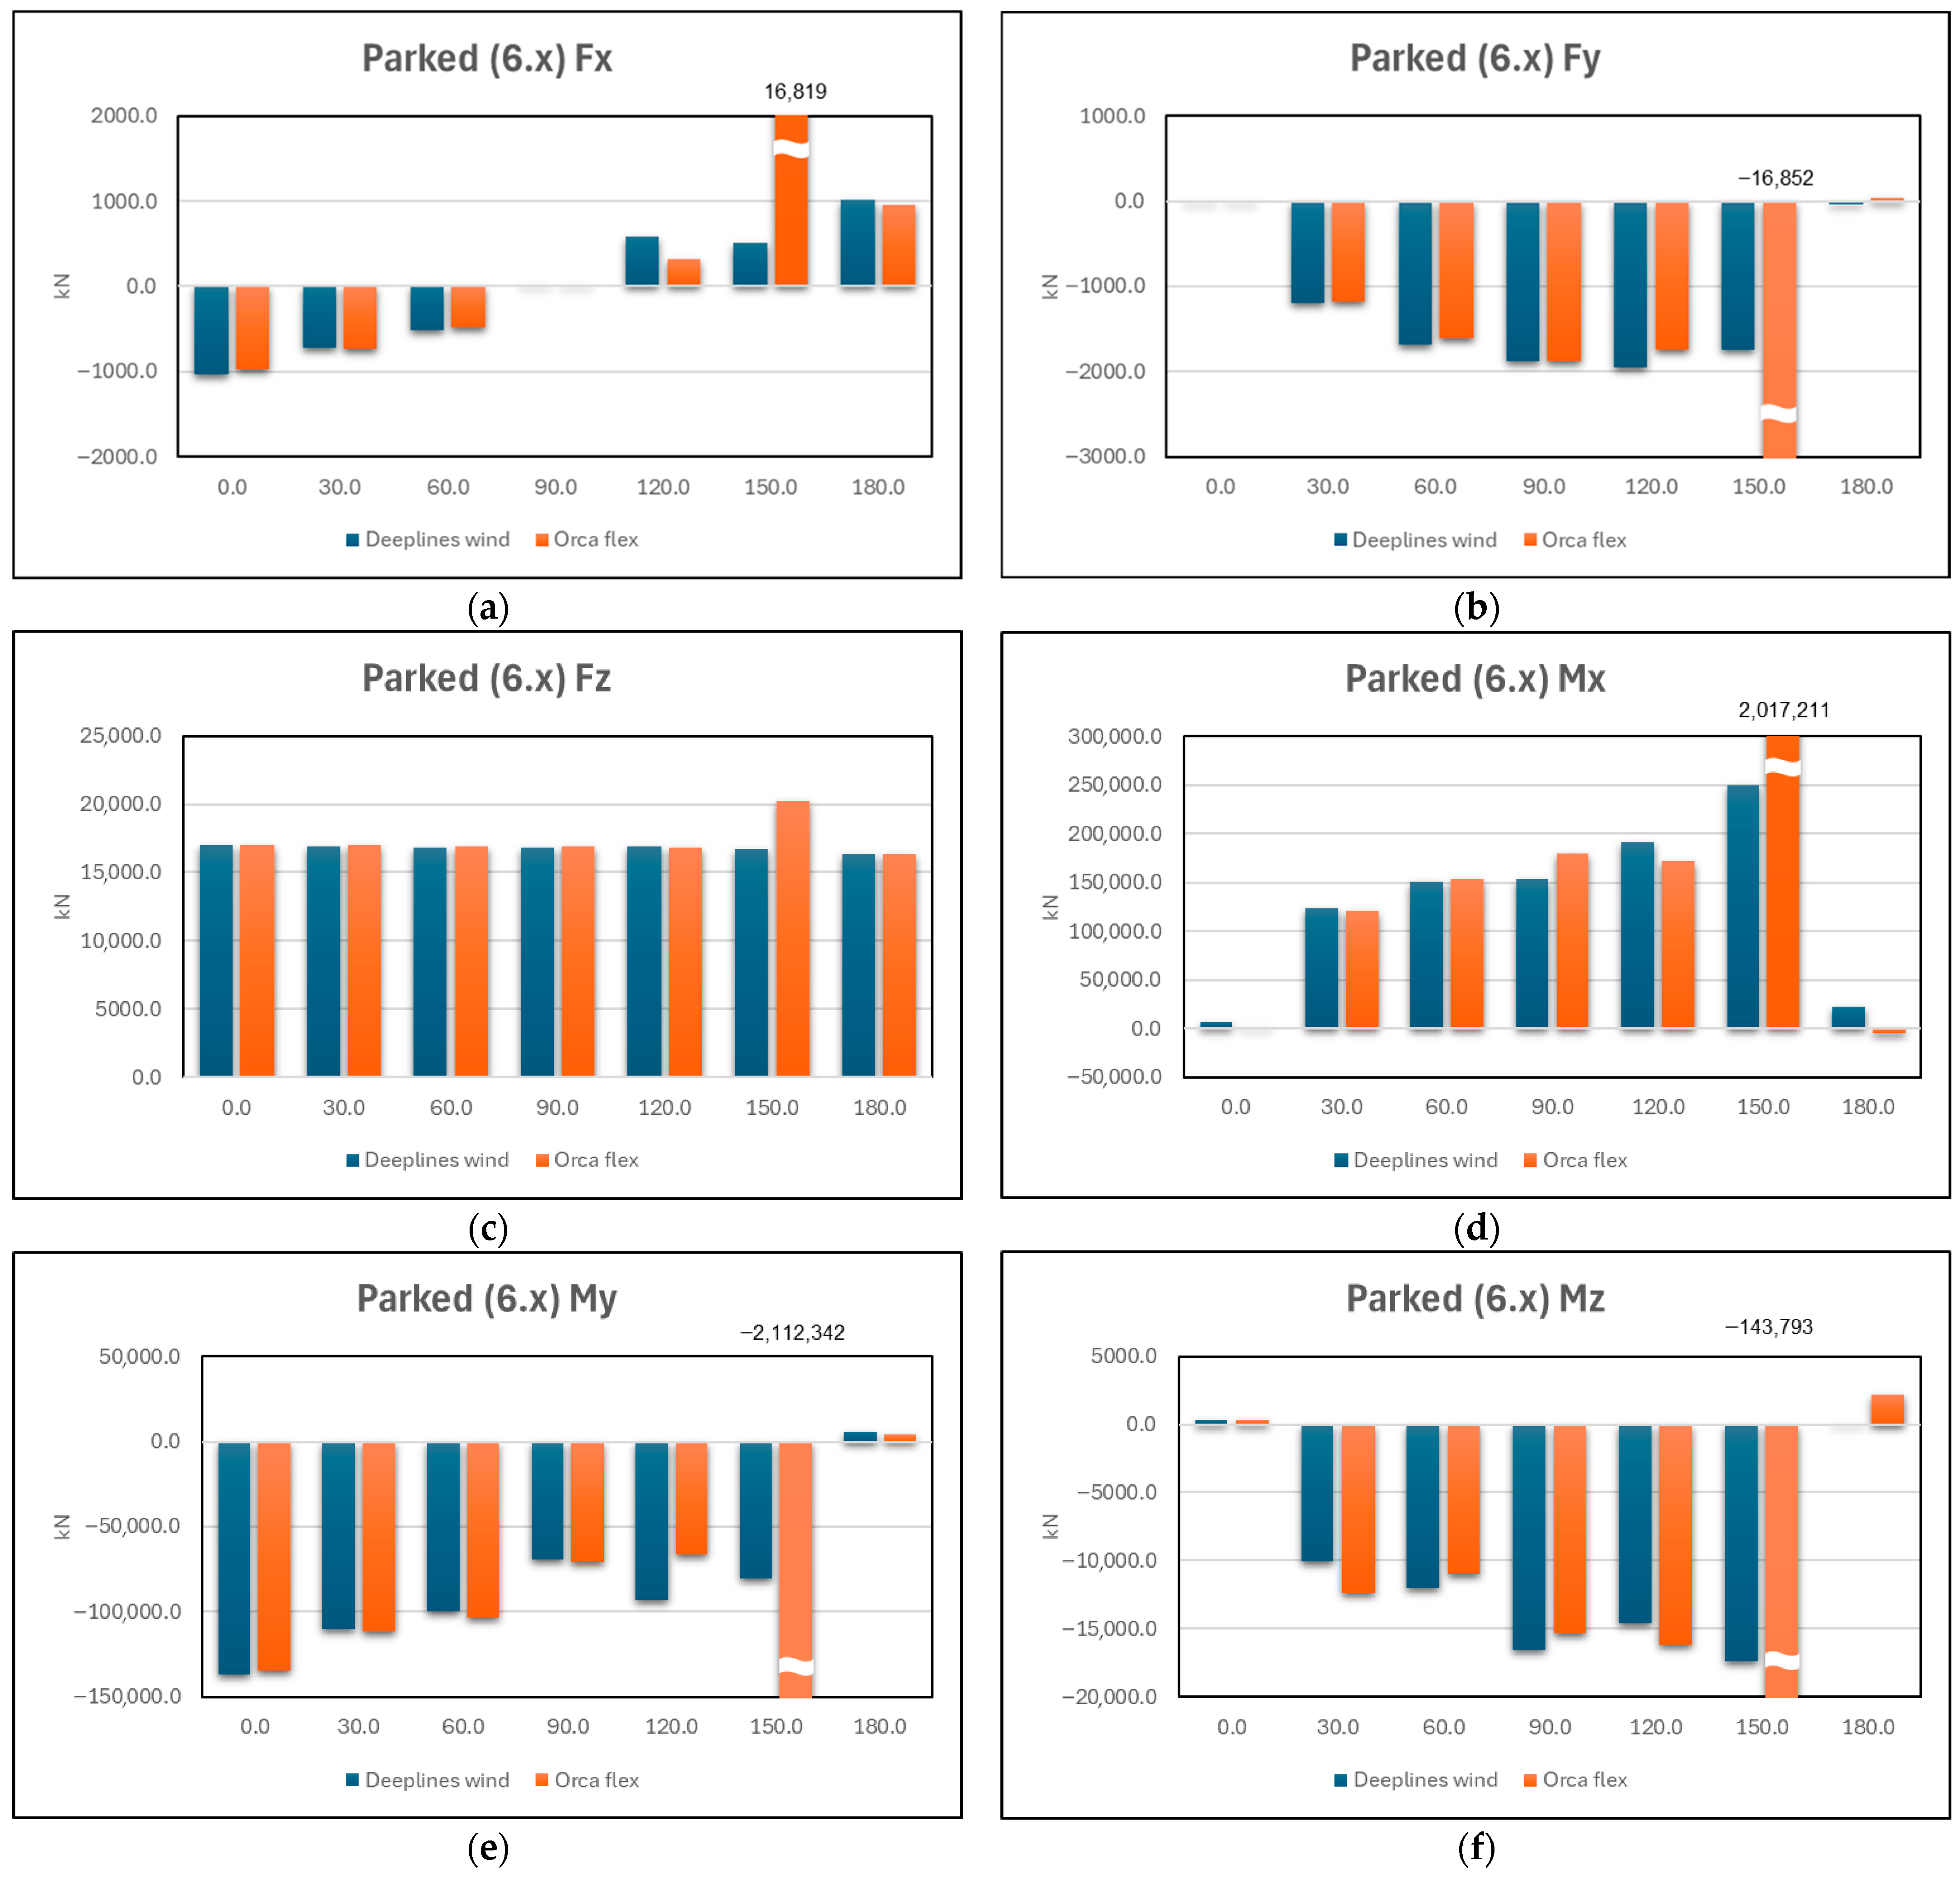
The turbine was parked (feathered and braked), the nacelle yaw was fixed at 0°, and a uniform wind of U = 46.8   m / s was applied while the wind heading was swept in 30° steps from 0° to 180° (schematic in Figure 5). With the nacelle fixed, the fore–aft axis aligned with +X (incoming wind at 0°); projecting the parked-rotor thrust onto the global axes produced the expected trigonometric pattern across headings. Specifically, the magnitude of the fore–aft shear ∣Fx∣ was largest when the wind was aligned with +X or −X and reached a minimum near 90°, while the lateral component ∣Fy∣ exhibited the complementary behavior, peaking near 90° and diminishing toward 0°/180°. The corresponding bending moments followed the same projections: ∣My∣ (fore–aft bending) was largest when the wind was along X, and ∣Mx∣ (side-to-side) grew as the heading approached 90°. Axial load Fz remained nearly constant across headings—dominated by RNA weight with a small contribution from rotor tilt and nacelle/tower drag—whereas the yaw moment Mz showed modest, sign-consistent variation with heading (Figure 6). Overall, the heading-dependent ordering of the six components was the same in both solvers, supporting consistency of the implemented parked configuration and the tower base.
With the nacelle fixed, the fore–aft axis aligned with +X (incoming wind at 0°); projecting the parked-rotor thrust onto the global axes produced the expected trigonometric pattern across headings. Specifically, the magnitude of the fore–aft shear ∣Fx∣ was largest when the wind was aligned with +X or −X and reached a minimum near 90°, while the lateral component ∣Fy∣ exhibited the complementary behavior, peaking near 90° and diminishing toward 0°/180°. The corresponding bending moments followed the same projections: ∣My∣ (fore–aft bending) was largest when the wind was along X, and ∣Mx∣ (side-to-side) grew as the heading approached 90°. Axial load Fz remained nearly constant across headings—dominated by RNA weight with a small contribution from rotor tilt and nacelle/tower drag—whereas the yaw moment Mz showed modest, sign-consistent variation with heading (Figure 6). Overall, the heading-dependent ordering of the six components was the same in both solvers, supporting consistency of the implemented parked configuration and the tower base.

3.4. ULS Tower Base Loads Under DLC 1.3

Table 4 summarizes the environmental conditions of DLC 1.3, including wind speed and wave parameters. With the mean inflow aligned with +X (toward the rotor), Figure 7 presents the seed-averaged extreme maximum and minimum of the six tower base components as a function of wind speed for Deeplines Wind and OrcaFlex (post-processing per Section 2.5). The horizontal action is governed by the fore–aft direction. The envelope shows a clear strengthening toward the near-rated bins, followed by a gradual softening at higher winds. The associated fore–aft bending moment forms the dominant moment envelope over the entire range. Axial force remains the largest in magnitude but varies only weakly with wind speed, whereas the lateral shear and yaw moment are smaller in comparison and increase more steadily with wind speed.

3.5. ULS Tower Base Loads Under DLC 1.4

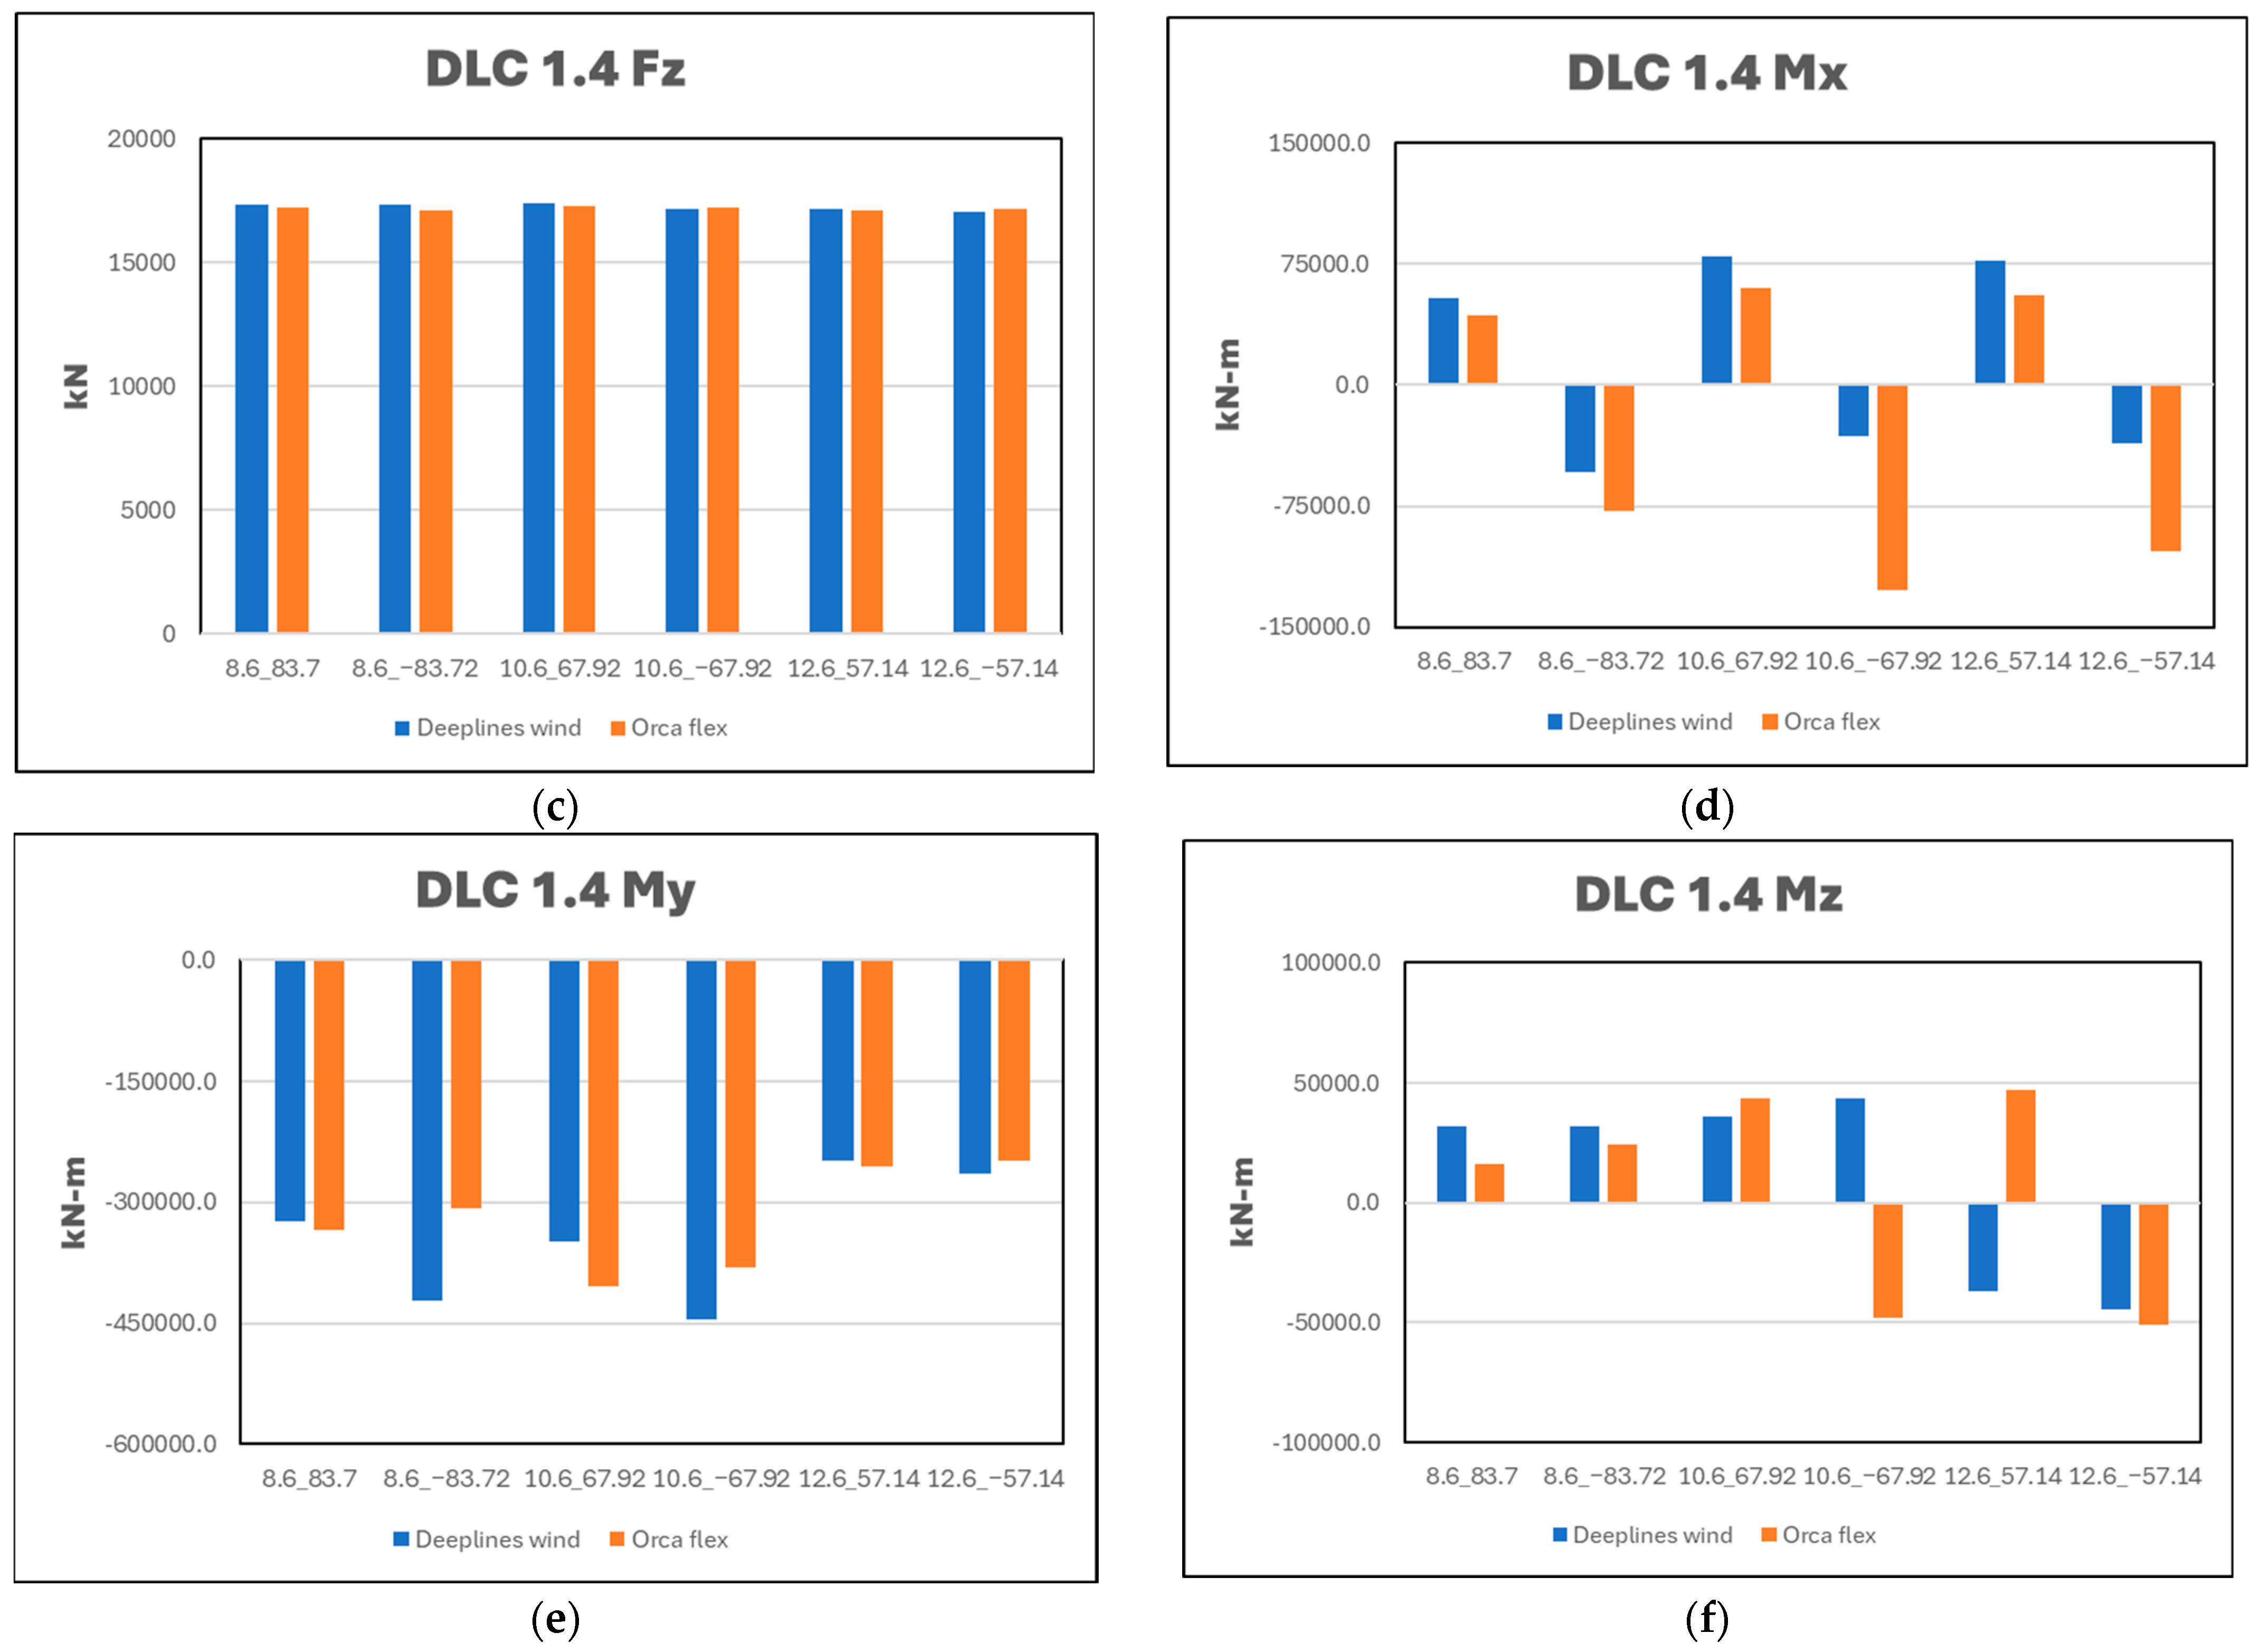
DLC 1.4 imposed an extreme coherent gust with direction change (ECD) superimposed on operating conditions. We evaluated three mean wind speeds (8.6, 10.6, and 12.6 m/s) with co-occurring spectral seas and the ROSCO baseline controller of the IEA 15 MW model. Each realization lasted 3600 s. Loads were extracted at the tower base in the global right-handed frame defined in Section 2.2 and processed as seed-averaged signed envelopes (Section 2.5). Deeplines Wind results were cross-checked with OrcaFlex under identical inputs. DLC 1.4 Matrix refers to Table 5. Figure 8 shows, for each mean wind case, the seed-averaged extreme maximum and minimum of the six components (Fx, Fy, Fz, Mx, My, Mz).
Across the three wind-speed cases, the fore–aft direction governed the horizontal action under aligned inflow with ECD: the magnitude ordering of the downwind shear was ∣Fx∣ (10.6) > ∣Fx∣ (8.6) > ∣Fx∣ (12.6). The associated fore–aft bending My displayed the same ordering and remained the dominant moment. Axial force Fz was effectively constant (compressive) across the cases. Lateral/shear and yaw components (Fy, Mx, and Mz) varied with the imposed ECD direction change (veer) and showed case-dependent signs but remained secondary to My in the ULS envelope. Cross-code parity was close for Fx, Fz, and My and moderate for Mx/Mz, with the latter’s spread reflecting sensitivity of lateral/yaw channels to the short-rise ECD input and sign conventions.

3.6. ULS Tower Base Loads Under DLC 6.1

DLC 6.1 was evaluated with the IEC/DNV Extreme Wind Model (EWM) at a constant wind speed U = 46.8 m/s in parked/idling configuration (blades feathered, generator idle). For each heading, the nacelle yaw was aligned with the wind (−8, 0, +8 yaw error), and the pair (nacelle, wind heading) was rotated in the global frame through 0°, 30°, 60°, 90°, 120°, 150°, 180°. Loads were extracted at the tower base in the global, right-handed frame defined in Section 2.2. Each realization ran for 3600 s and was post-processed with the seed-averaging and signed-envelope procedure in Section 2.5 (three seeds for DLC 6.1). The directional sweep matrix used here is summarized in Table 6 (DLC 6.1 matrix).
Figure 9 presents the seed-averaged extreme maximum/minimum versus heading. The horizontal shears follow the projection of the parked thrust/drag resultant onto the global axes. The fore–aft shear Fx attains its largest magnitude in the negative direction at 0°, decreases in magnitude toward 90° where the along-wind action is orthogonal to +X, and changes sign to become positive between 120° and 180° as the global +X component reverses. Fy shows the complementary pattern. It is small near 0°, attaining its largest magnitude in the negative direction for quartering winds (90–120°), and then approaching zero toward 180°.
The axial force Fz remains compressive and nearly constant, reflecting the RNA/tower weight with only a weak dependence on aerodynamic down-tilt in the feathered state. Among moments, My is negative over most headings and approaches its largest magnitude near 90°, where the thrust line affords the longest lever arm in the global X–Z plane. It decreases in magnitude toward 0° and 180°. Mx increases monotonically with heading and peaks near 150° in step with lateral shear, while Mz reaches a minimum near 150° and changes sign to positive at 180° as the yaw-plane moment reverses. Deeplines Wind and OrcaFlex reproduce the same heading-dependent ordering and closely matched magnitudes across the sweep. Detailed interpretation is given in Section 4 (Discussion).
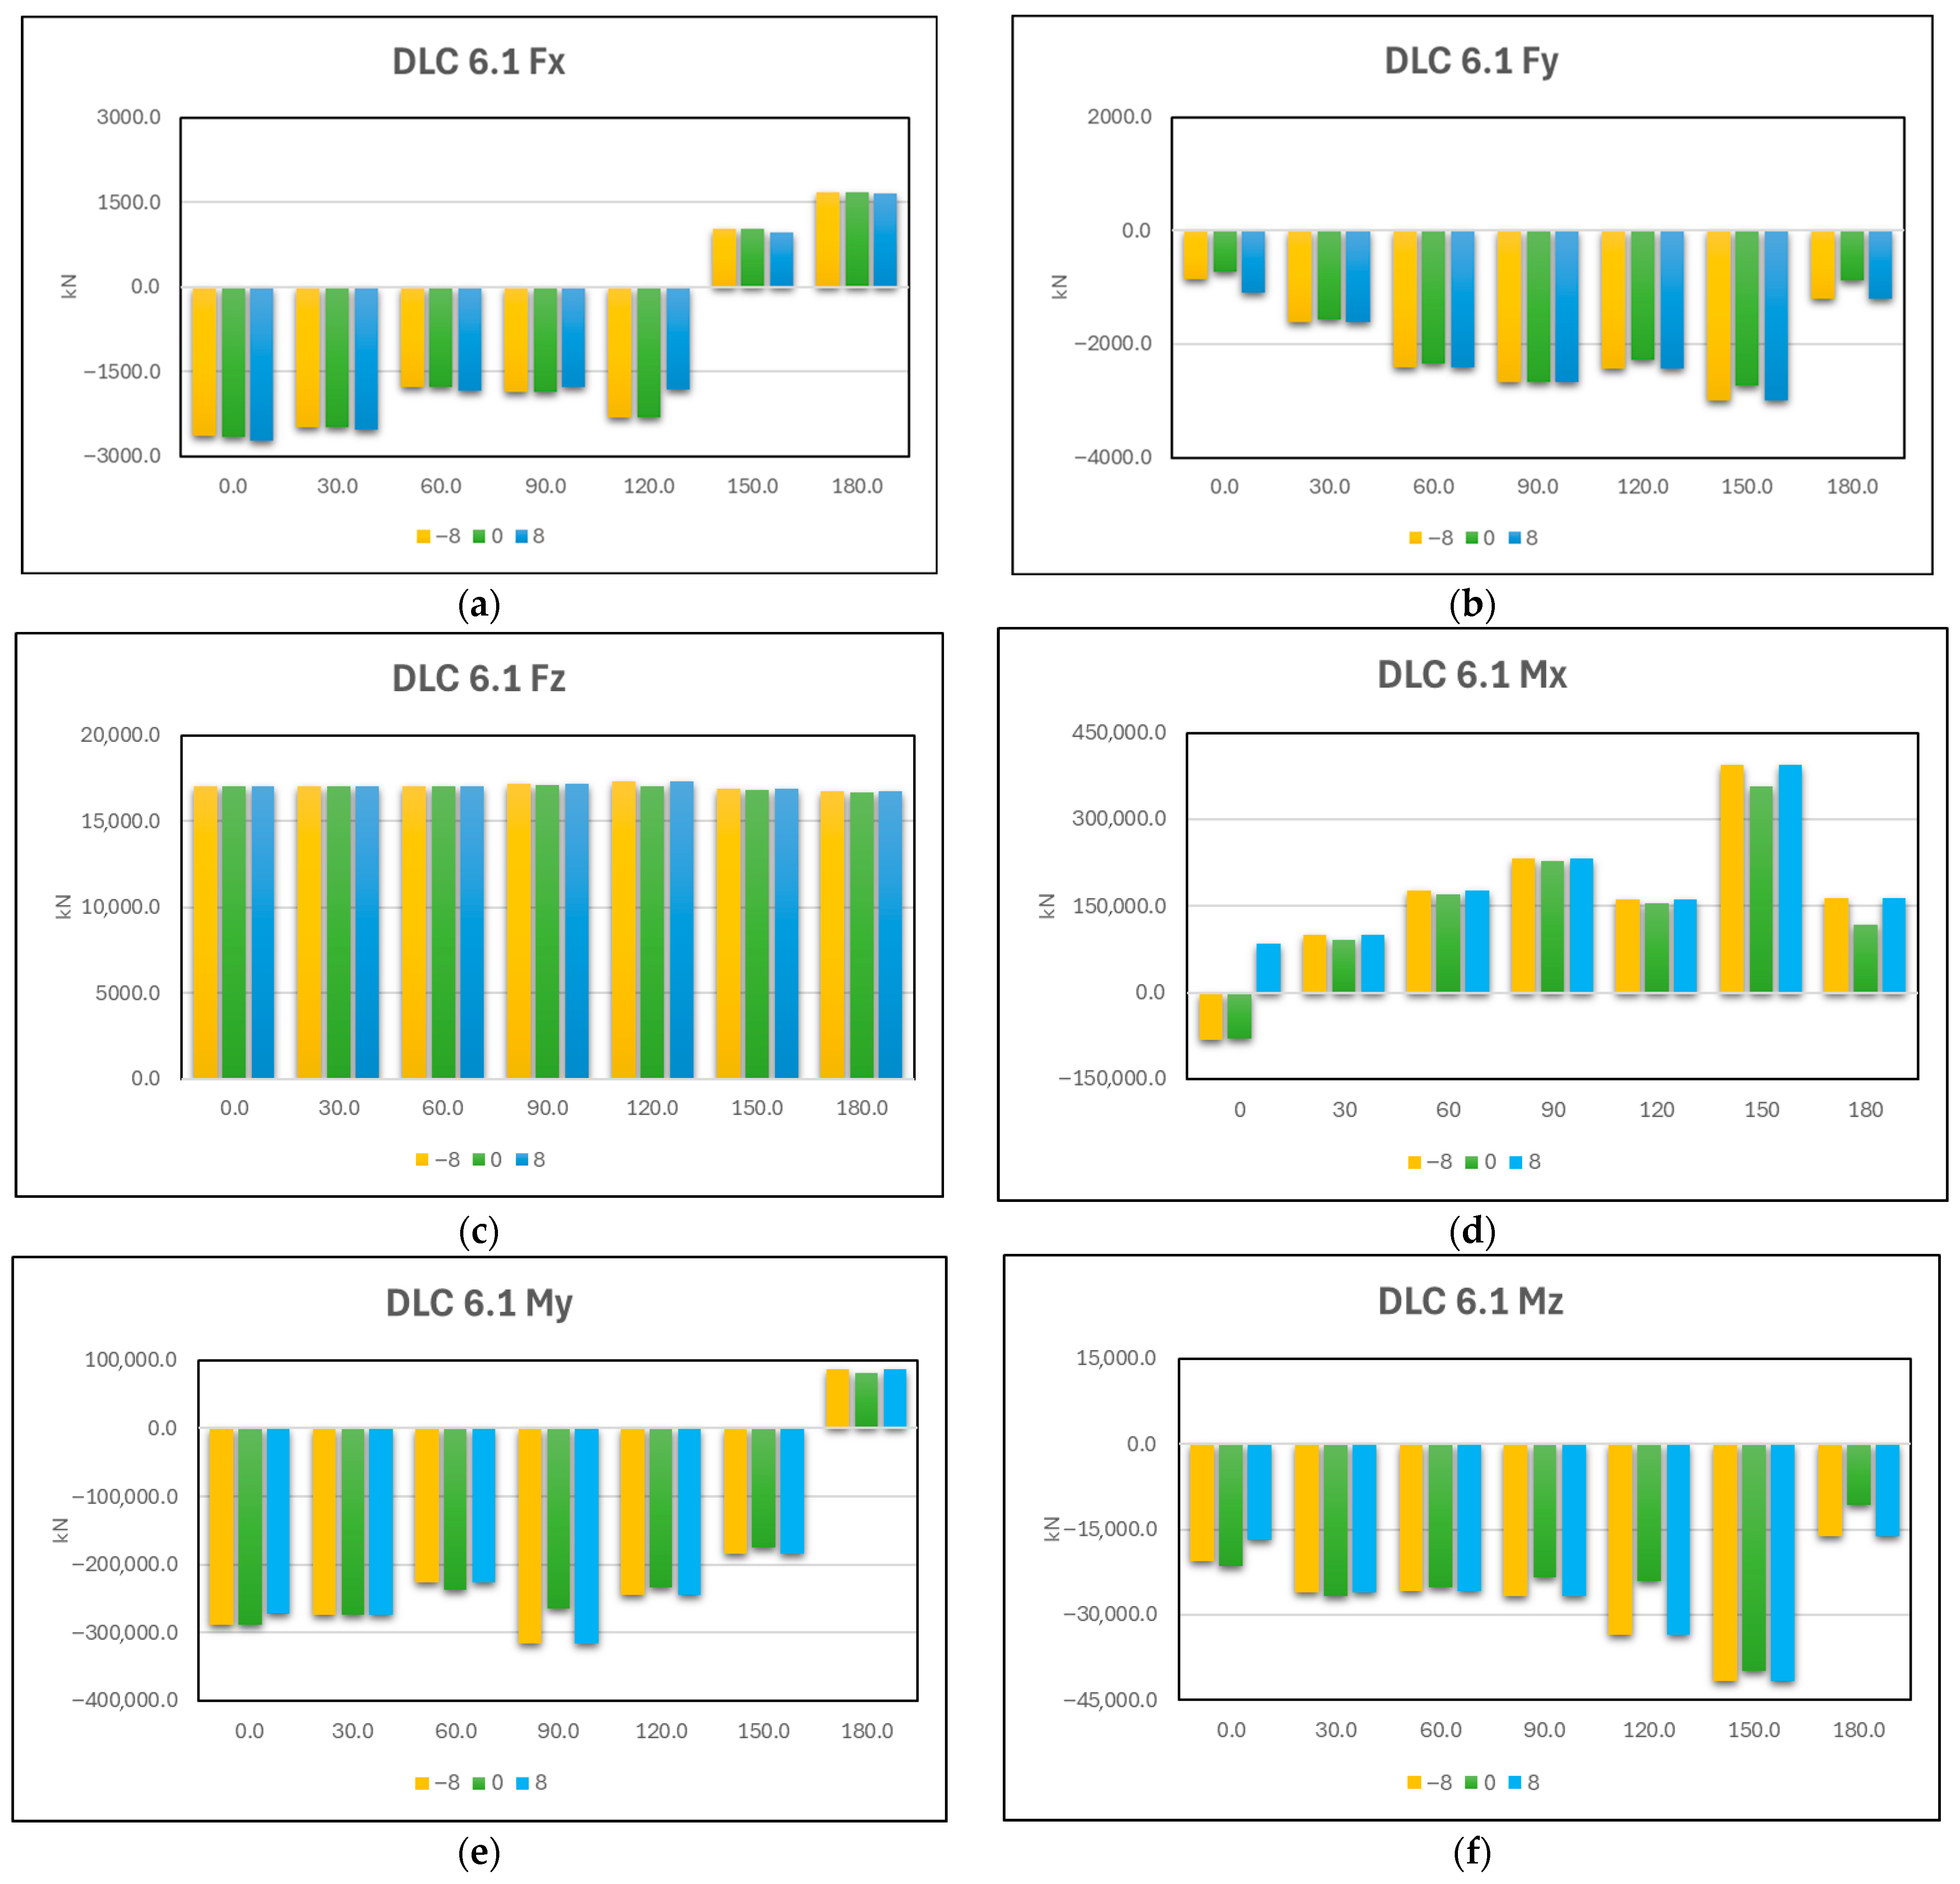
Figure 10 presents the results under the DLC 6.1 condition for yaw misalignments of ±8° about each heading. Small, intentional yaw misalignments of ±8° about each heading preserved the heading-dependent envelopes described above and produced only minor, non-governing adjustments to the shear forces and bending moments. Across headings, Fx, Fy, Fz, and My varied weakly with the imposed yaw error, and the ordering of governing channels did not change. The most noticeable sensitivity appeared in Mx, which increased in magnitude for non-zero misalignment and was largest near quartering winds, where lateral inflow and the yaw-plane lever arm were maximized.

3.7. ULS Tower Base Loads Under DLC 6.2

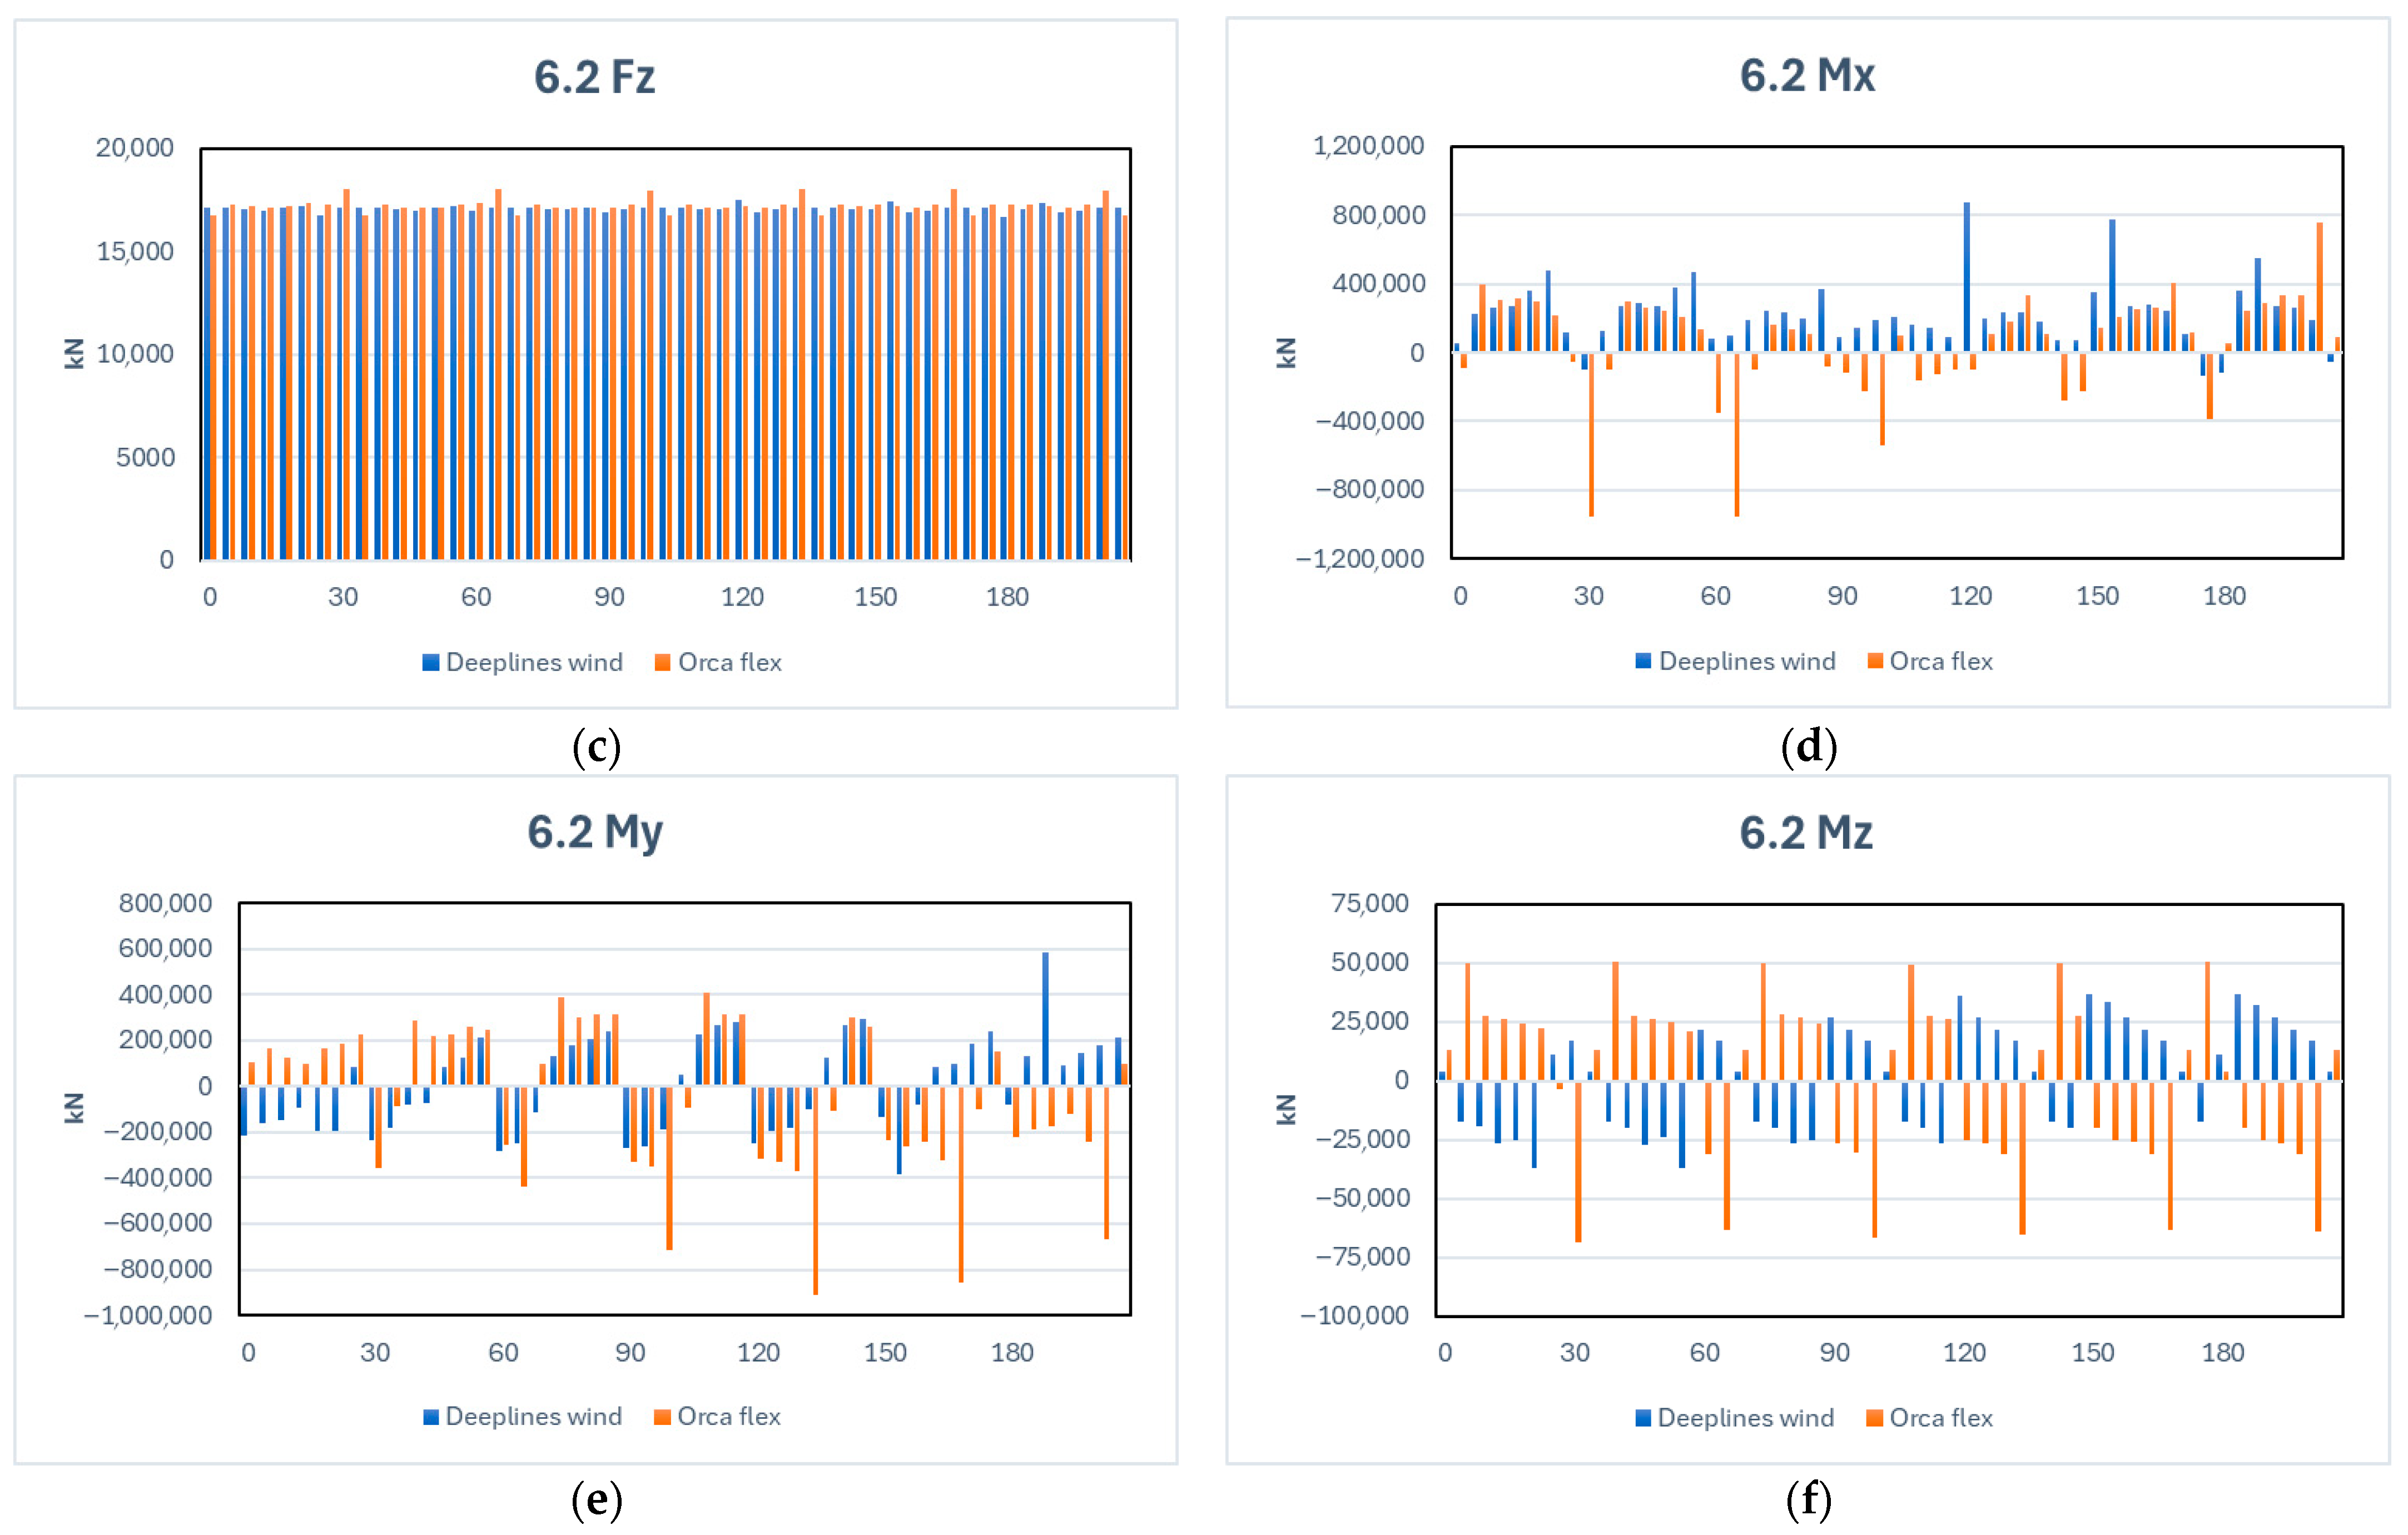
DLC 6.2 represents parked/idling operation under an extreme wind model. In the present study, we combined a wide sweep of wind headings with nacelle yaw misalignment. The cases are denoted by the pair (heading, yaw error) in degrees. Each realization was 3600 s and processed with the seed-averaging envelope of Section 2.5. Loads were extracted at the tower base in the global right-handed frame; six tower base components are (Fx, Fy, Fz, Mx, My, and Mz). Figure 11 compiles the seed-averaged extreme maximum/minimum per component for Deeplines Wind and OrcaFlex across the full (heading, yaw error) set, and Table 7 lists the DLC 6.2 matrix. Across the matrix, axial force Fz was nearly invariant in magnitude and showed cross-code parity. This reflects dominance of RNA/tower weight and weak dependence on the feathered aerodynamics in the parked state.
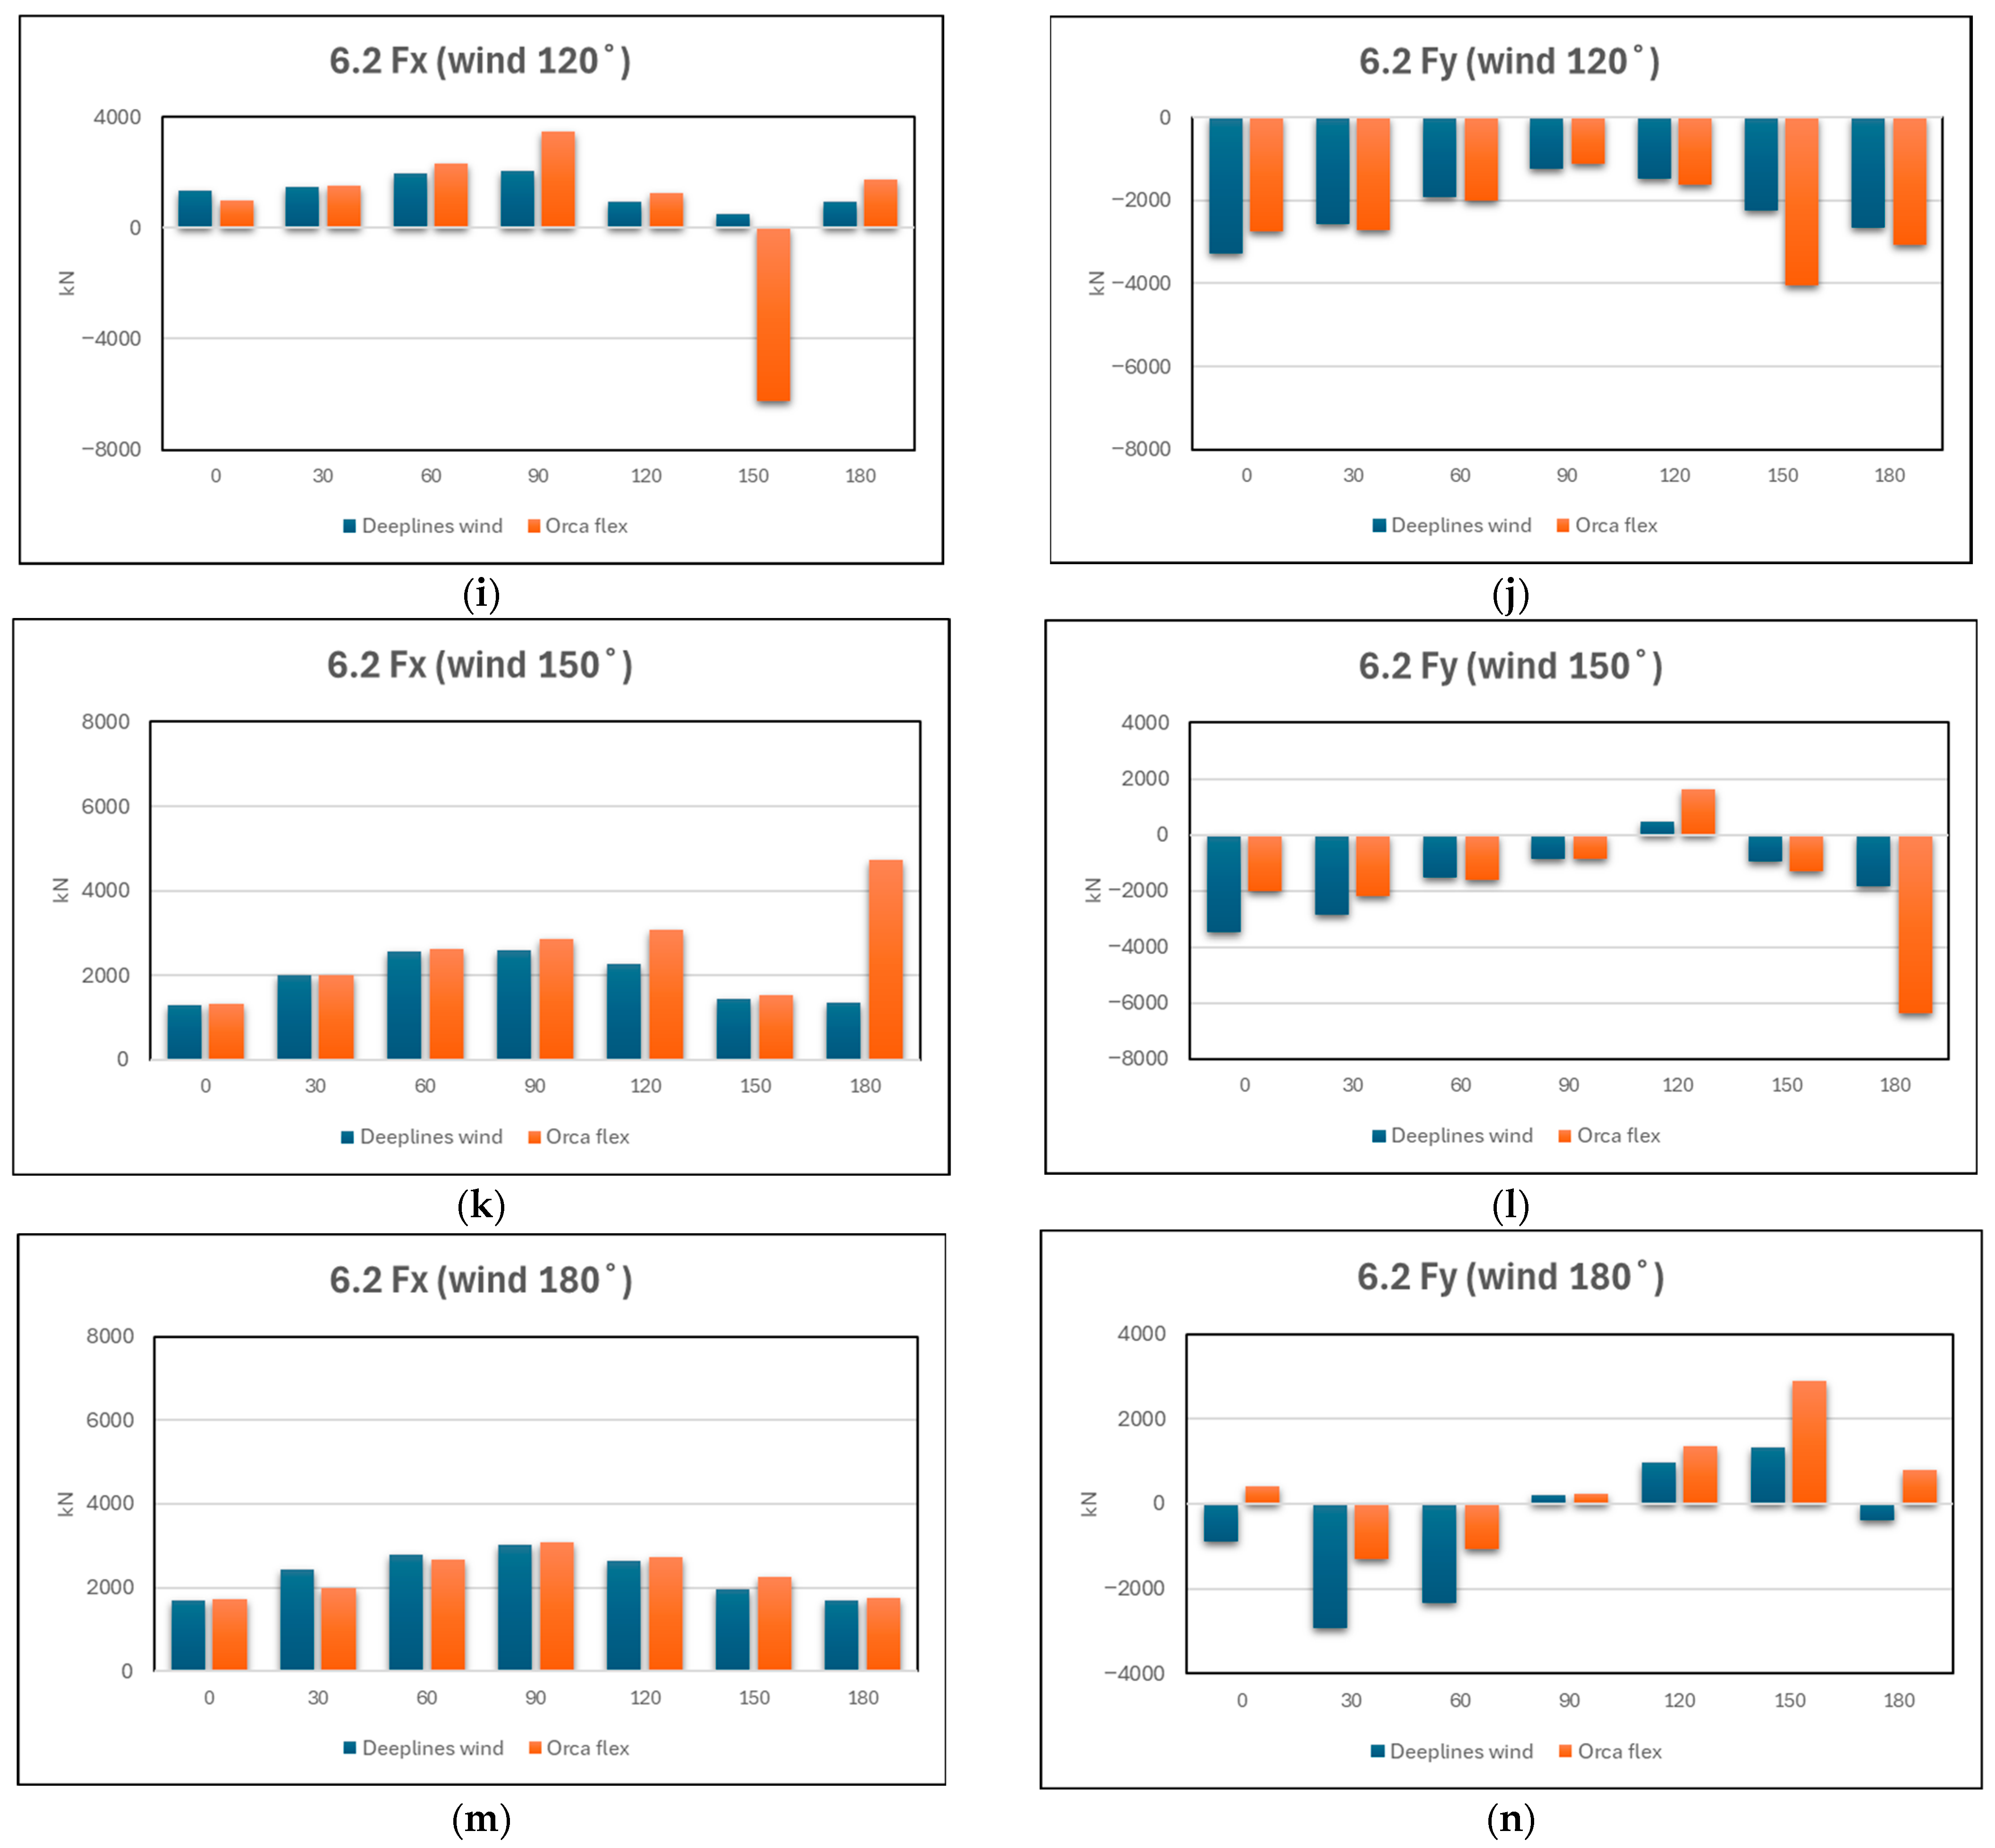
Figure 12 summarizes, for all the heading pairs, the seed-averaged extreme maxima/minima of the six tower base components for Deeplines Wind and OrcaFlex. The principal trends are governed by the projection of the parked thrust/drag resultant onto the global axes: Fx assumes negative values when the along-wind action aligns with +X, approaches zero near cross-flow, and becomes positive as the global +X component reverses; Fy exhibits the complementary pattern with the largest magnitudes under quartering winds. The axial force Fz remains compressive and nearly constant across headings. Among bending moments, My (fore–aft) is typically the dominant contributor to the ULS envelope, attaining large magnitudes when the thrust line offers the maximum lever arm in the X–Z plane; Mx (side–side) grows with the lateral shear and generally peaks under quartering winds. Yaw moment Mz changes sign as the heading crosses the downwind axis, with moderate solver spread at some headings.
Beyond these baseline patterns, consistent solver-specific amplifications were observed at yaw misalignment bands. OrcaFlex showed amplified Fx and Fy for cases with Δψ = 30° (i.e., quartering inflow relative to the nacelle), with magnitudes that can exceed Deeplines Wind by approximately a factor of two in the corresponding bins. Deeplines Wind showed enhanced lateral shear (and related bending) for several headings with Δψ ≈ 120° (cross-flow band), with one isolated outlier at wind = 180°, Δψ = 150°. Outside these bands, the two solvers exhibited close agreement in both trends and magnitudes for Fx, Fz, and My. Modest spreads were confined mostly to Mx/Mz at the selected headings.

4. Discussion

4.1. Constant-Wind (Production 1.x; Parked 6.x)

The constant-wind benchmarks establish that both solvers reproduce the expected operating-point physics and yield consistent tower base trends before the ULS cases. In the production set (aligned, 4–26 m/s, wind-only), Deeplines Wind and OrcaFlex produce near-coincident Fx–My evolution with wind speed: strengthening from cut-in to the vicinity of rated, and softening at higher winds under pitch regulation. Fz is quasi-constant (RNA weight with modest thrust-tilt contribution), while lateral/yaw components remain secondary under alignment. In the parked set (EWM, 46.8 m/s, wind-only), the heading-resolved envelopes follow the resolution of a thrust/drag resultant into the global axes. |Fx| largest near 0°, relaxing toward 90°, and reversing sign toward 180°, with complementary trends in Fy and corresponding bending. A localized exception is evident in the parked benchmark at the 150° heading, where the OrcaFlex bars depart from the Deeplines Wind trend (Figure 5). We judge that this amplification is consistent with a stall-dominated, low-damping regime of the idling rotor under a large cross-flow angle; within the IEA 15 MW/ROSCO aero-servo-elastic chain and the unsteady-aerodynamics settings used here, such conditions are known from code-to-code campaigns to reduce or even reverse aerodynamic damping in parked states.

4.2. DLC 1.3 (Production with ETM)

Under ETM, the tower base envelope is fore–aft dominated and follows the controller regime change. Fx and My strengthen from cut-in to the vicinity of rated, crest near the torque to pitch hand-over, and then soften above rated under pitch regulation (Figure 7a,e). Fz is nearly constant (RNA/tower weight with minor thrust tilt), while lateral/yaw channels (Fy, Mx, Mz) remain secondary in aligned inflow. A shallow re-increase of the seed-averaged extreme Fx (and proportionally My) appears at 24–26 m s−1 even as the mean thrust decreases. The observed pattern arises from two primary aerodynamic/control mechanisms:
Controller transition with short-rise events. Near rated, instantaneous thrust spikes can coincide with the torque → pitch hand-over. With pitch-rate limits, short-rise gust/ramp events can momentarily outpace load shedding, so the extremes increase even while the means decline above rated (Figure 7a,e).
With increasing wind speed, form drag on non-rotating structures (tower, nacelle, hub) scales approximately with U2 and partly offsets the rotor-thrust reduction, producing the modest high-wind uptick in the fore–aft reaction.
Deeplines Wind and OrcaFlex show the same bin-wise ordering and magnitudes for Fx, Fz, and My, establishing parity for the governing channels. The residual solver spread is primarily confined to Mx and Mz in the highest wind bins, consistent with secondary lateral/yaw sensitivity to short rise events and implementation details (Figure 7d,f).

4.3. DLC 1.4 (Production with ECD)

Superimposing an extreme coherent gust with direction change (ECD) on operation yields a rated-bin crest in the tower base envelope: across the three mean wind cases (8.6, 10.6, 12.6 m/s), the ordering of the downwind shear is |Fx|(10.6) > |Fx|(8.6) > |Fx|(12.6), and My mirrors this ordering while remaining the dominant moment (Figure 8a,e). Fz is effectively constant (compressive), whereas Fy, Mx, and Mz show case-dependent signs and magnitudes consistent with the prescribed direction change magnitudes in Table 5. These patterns are reproduced by both solvers in the governing fore–aft channels.
Based on the data in Figure 8 and the inputs in Table 5, we judge that the crest and the behavior of secondary channels under ECD can be interpreted by the following: The ordering above coincides with the rated transition at Vr ≈ 10.59 m/s (Table 1). We therefore assess that the ECD pulse interacts with the controller hand-over so that short-rise loading near rated can temporarily outpace full pitch load-shedding, producing the rated-bin crest observed in Figure 8a,e. This interpretation is consistent with the IEC definition of ECD as a short-duration, coherent event intended to probe control-transition behavior. Resolution of the direction change into lateral, yaw channels. With veer magnitudes ≈ ±57~83° (Table 5), part of the aerodynamic resultant is resolved into Fy, Mx, and Mz. This judgment aligns with the case-dependent signs and magnitudes seen in Figure 8b,d,f, while My remains dominant at the tower base. Sensitivity of lateral, yaw channels. Compared with ETM (Figure 7), Mx and Mz under ECD show moderate cross-solver spread (Figure 8d,f). We consider this consistent with the higher sensitivity of lateral, yaw responses to short-rise directional inputs and to sign/heading conventions.

4.4. DLC 6.1 (Parked/Idling with EWM, Directional Sweep)

In the parked and feathered state under the extreme wind model, the load patterns versus heading are governed by the projection of a nearly constant resultant (thrust + form drag) onto the global axes. As the wind–nacelle heading θ rotates from 0° to 180°, Fx follows the cos θ projection (most negative at 0°, relaxing toward 90°, and reversing sign by 150–180°), while Fy exhibits the complementary −sin θ trend (small at 0°, with largest magnitudes for quartering winds). The axial force Fz remains compressive and nearly constant, reflecting RNA/tower weight. Among moments, My becomes largest near 90°, where the thrust line provides the longest lever arm in the X–Z plane; Mx and Mz increase with heading in step with lateral/yaw components and show the largest solver-spread, a known sensitivity of parked conditions. These behaviors are consistent with IEC/DNV guidance for ULS parked states and with code-comparison experience.
Consistent with the constant-wind parked benchmark, the largest cross-solver spread under DLC 6.1 appears near 150°, especially in Mx/Mz. We assess this as the same stall-driven reduction of aerodynamic damping in an idling, feathered rotor at large cross-flow angles; under our present unsteady-aerodynamics choices, this regime is particularly sensitive and can amplify lateral/yaw-plane responses.

4.5. DLC 6.2 (Parked/Idling with EWM, Wind, and Nacelle Heading Yaw Error)

When the wind and nacelle headings are varied on a 7 × 7 (wind 0° to 180°, nacelle 0° to 180°), the baseline trends of Section 4.3 persist across all cases. Fx/Fy follow the heading projections, Fz is nearly constant, and My dominates the bending envelope. Beyond these trends, systematic outliers emerge in specific yaw error bands. For OrcaFlex, multiple wind headings show amplified Fx/Fy at Δψ ≈ 30°, at times exceeding the Deeplines Wind values by a factor of two in the corresponding bins; for Deeplines Wind, enhanced Fy and associated bending are observed at Δψ ≈ 120°, with an isolated large deviation at wind = 180°, Δψ = 150°. Everywhere else, the two solvers agree closely in trends and magnitudes for Fx, Fz, and My, with modest solver spread in Mx/Mz at some headings.
Across the DLC 6.2 matrix, both solvers reproduce the expected projection of parked thrust/drag into the global axes. However, two families of outliers are evident. OrcaFlex shows amplified Fx/Fy responses for yaw errors near 30°, whereas Deeplines Wind presents intermittent peaks near 120°. These clusters are consistent with prior observations that idling rotors can experience reduced or negative aerodynamic damping for yaw misalignments around 20–40°, which in extreme winds increases the sensitivity of tower/edgewise modes; they are also consistent with differences in tower-aerodynamic treatment and inflow-veer/yaw convention that become most influential at large cross-flow angles. We therefore regard the anomalies as modeling-sensitive regimes rather than coding errors.

5. Conclusions

We reported ULS tower base loads at the transition-piece top for the IEA-15 MW on the fixed jack-up-type K-WIND concept using seed-averaged signed envelopes over the six components (Fx, Fy, Fz, Mx, My, and Mz) in a consistent right-handed global frame. The workflow combined steady-state verification, constant-wind benchmarks (production and parked, wind-only), and standards-compliant ULS simulations (DLC 1.3, 1.4, 6.1, and 6.2) with Deeplines Wind cross-checked against OrcaFlex. Steady and constant-wind benchmarks established baseline parity in governing channels prior to the stochastic ULS cases (Figure 2, Figure 3, Figure 4, Figure 5 and Figure 6).
For DLC 1.3, the fore–aft shear Fx and bending My strengthen from cut-in to the rated vicinity, crest near 10–12 m/s, and soften above rated under pitch regulation; Fz remains nearly constant (RNA/tower weight), and lateral, yaw channels are secondary. A shallow high-wind re-increase of the extremes appears at 24, 26 m/s, which we interpret as short-rise events interacting with pitch-rate limits and a non-rotor drag (~U2) contribution. Cross-code parity is close for Fx/My/Fz, with modest spread confined to Mx/Mz in the highest bins (Figure 4 and Figure 7).
For DLC 1.4, superimposing ECD yields a rated-bin crest. |Fx|(10.6) > |Fx|(8.6) > |Fx|(12.6). My mirrors this ordering and remain dominant, while Fy/Mx/Mz vary with the prescribed direction change (±57–84°) but stay secondary at the tower base. Cross-code parity remains close in Fx/Fz/My; Mx/Mz shows a moderate spread, consistent with lateral/yaw sensitivity to short-rise directional inputs, sign/heading conventions, and unsteady-aero options (Figure 8; Table 5).
For DLC 6.1, with the turbine feathered and parked at U = 46.8 m/s, the heading-sweep response follows the projection of a near-constant thrust/drag resultant onto the global axes: Fx is most negative near 0°, relaxes toward 90°, and reverses sign toward 150–180°; Fy exhibits the complementary pattern. Fz remains compressive and nearly constant. Among moments, My is largest near 90° (longest X–Z lever arm), Mx grows with heading in step with lateral shear, and Mz changes sign across the downwind axis. Cross-code agreement is close for Fx/Fz/My across headings, while Mx/Mz exhibit the largest spread—a known sensitivity under parked conditions. Small yaw misalignment of ±8° induces second-order changes overall but amplifies |Mz| near quartering headings (Figure 9 and Figure 10; Table 6).
For DLC 6.2, the full wind–nacelle grid largely preserves the baseline projection patterns and shows close agreement between solvers in the governing fore–aft components across most bins. Superimposed on this baseline, solver-specific outlier bands are confined to narrow yaw misalignment ranges. Δψ ≈ 30° in OrcaFlex (amplified horizontal shears with occasional bending increases) and Δψ ≈ 120° in Deeplines Wind (enhanced lateral shear), with one isolated case at (wind = 180°, Δψ = 150°). These bins are explicitly flagged in the reported ULS envelopes and identified as targets for cross-calibration of unsteady-aerodynamics options, pitch-rate limits, and time-integration settings before repeating the parked sweeps. ULS demonstrates that Deeplines Wind and OrcaFlex produce consistent magnitudes and trends for the governing fore–aft components at the tower base. Solver spread is mainly limited to lateral/yaw components and to the flagged Δψ bands in parked conditions. By publishing the coordinate conventions, sign definitions, DLC matrices, and seed-averaging rules used, this work provides a reproducible reference dataset for tower base ULS envelopes—addressing a recognized gap where tower base force/moment data are seldom tabulated—and a baseline for future cross-code verification on the IEA-15 MW.
Finally, the scope here is ULS only. Future work will extend the analysis to FLS, increase the number of stochastic realizations for spread-sensitive parked states, and carry out the targeted cross-calibration outlined above to resolve the Δψ-band outliers.

Author Contributions

Conceptualization, J.-Y.S.; methodology, J.-Y.S. and J.-S.L.; software, J.-Y.S. and J.-S.L.; validation, C.-I.P., M.-Y.S. and H.-J.K.; formal analysis, J.-Y.S. and J.-S.L.; investigation, J.-Y.S. and C.-I.P.; resources, C.-I.P. and H.-J.K.; data curation, J.-Y.S.; writing—original draft preparation, J.-Y.S.; writing—review and editing, C.-I.P., M.-Y.S. and H.-J.K.; visualization, J.-Y.S.; supervision, C.-I.P.; project administration, J.-Y.S. and C.-I.P.; funding acquisition, C.-I.P. All authors have read and agreed to the published version of the manuscript.

Funding

This work was supported by the Korea Institute of Energy Technology Evaluation and Planning (KETEP) grant funded by the Korean Government (MOTIE) (20223030020240, Development of 10 MW or higher offshore wind power upper and lower package installation support structure system for LCOE reduction).

Data Availability Statement

The data presented in this study are available upon request from the corresponding author.

Conflicts of Interest

Authors Jin-Young Sung, Chan-Il Park and Min-Yong Shin were employed by the company KOMS Co., Ltd. The remaining authors declare that the research was conducted in the absence of any commercial or financial relationships that could be construed as a potential conflict of interest.

Abbreviations

The following abbreviations are used in this manuscript:
DLCDesign Load Case
ULSUltimate Limit State
FLSFatigue Limit State
RNARotor Nacelle Assembly
LCOELevelized Cost of Energy
WTIVWind Turbine Installation Vessels
IEAInternational Energy Agency
RWTReference Wind Turbine
IECInternational Electrotechnical Commission
ROSCOReference Open-Source Controller for Wind Turbines
NTMNormal Turbulence Model
ETMExtreme Turbulence Model
EWMExtreme Wind Model
ECDExtreme Coherent Gust with Direction Change
NSSNormal Sea State
ESSExtreme Sea State
JONSWAPJoint North Sea Wave Project spectrum
MSLMean Sea Level
TSRTip Speed Ratio
U, VhubWind speed at hub height
HsSignificant wave height
TpPeak spectral period
VrRated wind speed
ΔψYaw misalignment

References

  1. Veers, P.; Dykes, K.; Lantz, E.; Naughton, J.; Pao, L.; Paquette, J.; Robertson, A.; Robinson, M.; Ananthan, S.; Barlas, T.; et al. Grand Challenges in the Design, Manufacture, and Operation of Future Wind Turbine Systems. Wind. Energy Sci. 2023, 8, 1945–1984. [Google Scholar] [CrossRef]
  2. Gaertner, E.; Rinker, J.; Sethuraman, L.; Zahle, F.; Anderson, B.; Barter, G.; Abbas, N.; Meng, F.; Bortolotti, P.; Skrzypinski, W.; et al. IEA 15-MW Offshore Reference Wind Turbine; NREL/TP-5000-75698; National Renewable Energy Laboratory: Golden, CO, USA, 2020.
  3. IEC 61400-1:2019; Wind Energy Generation Systems—Part 1: Design Requirements. International Electrotechnical Commission: Geneva, Switzerland, 2019.
  4. IEC 61400-3-1:2019; Wind Energy Generation Systems—Part 3-1: Design Requirements for Fixed Offshore Wind Turbines. International Electrotechnical Commission: Geneva, Switzerland, 2019.
  5. DNV-ST-0437; Loads and Site Conditions for Wind Turbines. DNV: Oslo, Norway, 2024.
  6. DNV-RP-C205; Environmental Conditions and Environmental Loads. DNV: Oslo, Norway, 2019.
  7. Coulling, A.J.; Goupee, A.; Robertson, A.; Jonkman, J.; Dagher, H. Validation of a FAST Semi-Submersible Floating Wind Turbine Numerical Model with DeepCwind Test Data. J. Renew. Sustain. Energy 2013, 5, 023116. [Google Scholar] [CrossRef]
  8. Page, A.M.; Næss, V.; De Vaal, J.B.; Eiksund, G.R.; Nygaard, T.A. Impact of Foundation Modelling in Offshore Wind Turbines: Comparison Between Simulations and Field Data. Mar. Struct. 2019, 64, 379–400. [Google Scholar] [CrossRef]
  9. Wendt, F.F.; Robertson, A.N.; Jonkman, J.M. FAST Model Calibration and Validation of the OC5-DeepCwind Floating Offshore Wind System Against Wave Tank Test Data. Int. J. Offshore Polar Eng. 2019, 29, 15–23. [Google Scholar] [CrossRef]
  10. Wang, S.; Larsen, T.J.; Bredmose, H. Ultimate load analysis of a 10 MW offshore monopile wind turbine incorporating fully nonlinear irregular wave kinematics. Mar. Struct. 2021, 76, 102922. [Google Scholar] [CrossRef]
  11. Bergua, R.; Wiley, W.; Robertson, A.N.; Jonkman, J.; Brun, C.; Pineau, J.P.; Qian, Q.; Maoshi, W.; Beardsell, A.; Cutler, J.; et al. OC6 Project Phase IV: Validation of numerical models for novel floating offshore wind support structures. Wind. Energy Sci. 2024, 9, 1025–1051. [Google Scholar] [CrossRef]
  12. Abbas, N.; Zalkind, D.; Pao, L.Y.; Wright, A.D. A Reference Open-Source Controller for Wind Turbines (ROSCO). Wind. Energy Sci. 2020, 5, 1327–1346. [Google Scholar]
  13. NREL. ROSCO User Guide (Reference Open-Source Controller for Wind Turbines); National Renewable Energy Laboratory: Golden, CO, USA, 2021.
  14. Darling, H.; Schmidt, D.P.; Xie, S.; Sadique, J.; Koop, A.; Wang, L.; Wiley, W.; Archeli, R.B.; Robertson, A.N.; Tran, T.T. OC6 Phase IV: Validation of CFD Models for Stiesdal TetraSpar Floating Offshore Wind Platform. Wind. Energy Sci. 2024, 28, e2966. [Google Scholar] [CrossRef]
  15. DNV-RP-0286; Coupled Analysis of Floating Wind Turbines. DNV: Oslo, Norway, 2019.
  16. Yoshida, S.; Fekry, M. Influence of Excitation by Idling Rotor on Wind Turbine Ultimate Loads in Storm Conditions. Energies 2024, 17, 1030. [Google Scholar] [CrossRef]
  17. Hannesdóttir, Á.; Kelly, M.; Dimitrov, N. Extreme Wind Fluctuations: Joint Statistics, Extreme Turbulence, and Impact on Wind Turbine Loads. Wind. Energy Sci. 2019, 4, 325–350. [Google Scholar] [CrossRef]
  18. Papi, F.; Troise, G.; Behrens de Luna, R.; Saverin, J.; Perez-Becker, S.; Marten, D.; Ducasse, M.-L.; Bianchini, A. Quantifying the Impact of Modeling Fidelity on Different Substructure Concepts—Part 2: Code-to-Code Comparison in Realistic Environmental Conditions. Wind. Energy Sci. 2024, 9, 981–1004. [Google Scholar] [CrossRef]
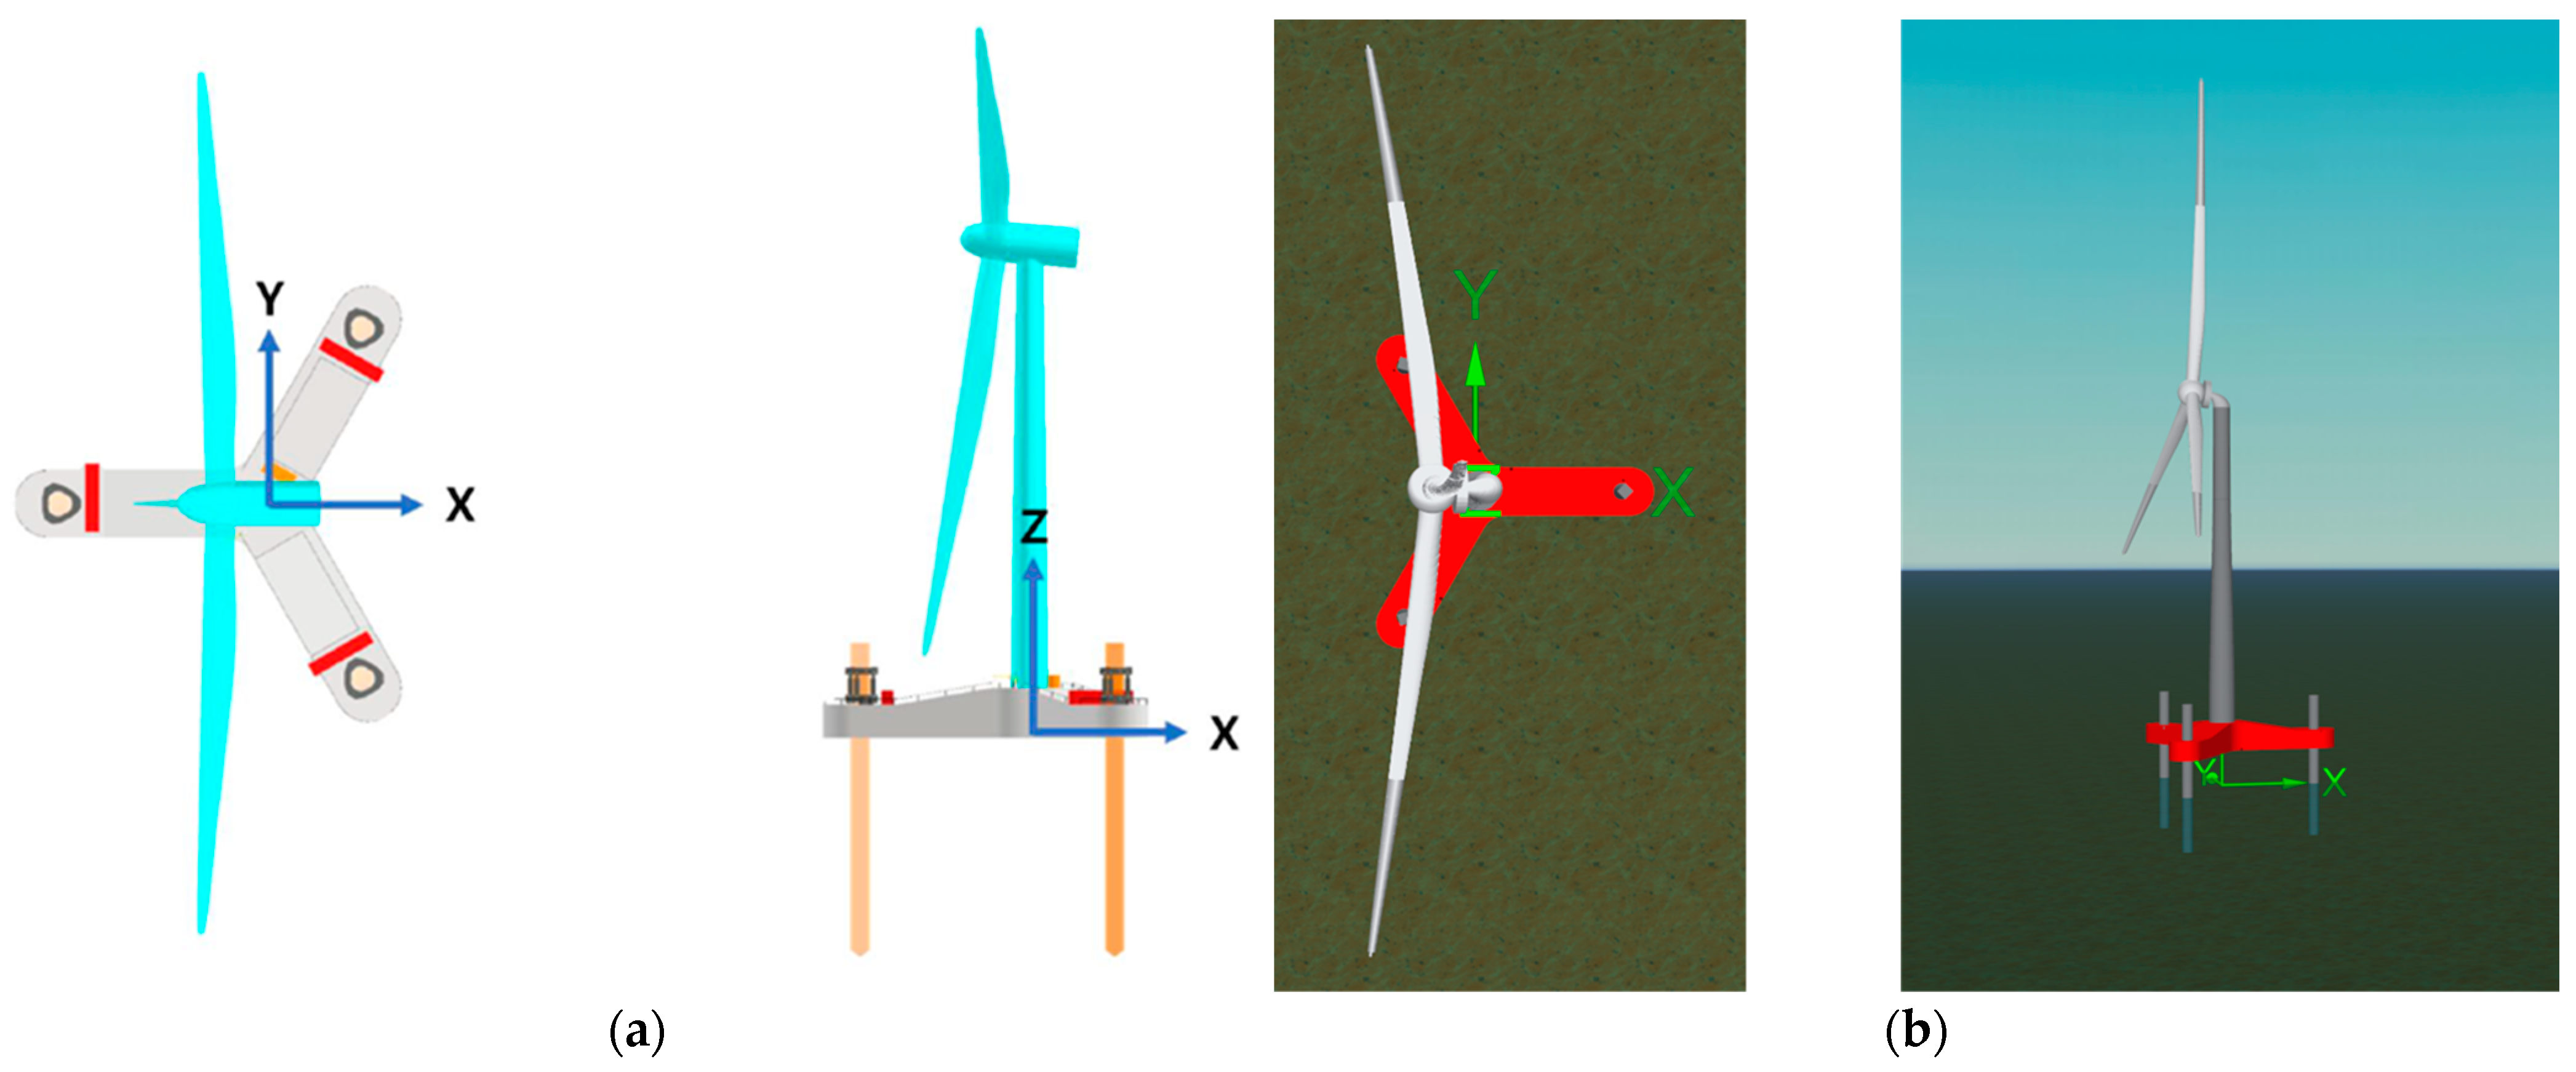
Figure 1. K-wind support-structure global coordinate system: (a) Deeplines Wind, (b) OrcaFlex.
Jmse 13 02077 g001
Figure 2. Steady-state operating points for the IEA 15 MW turbine under uniform inflow: (a) collective blade pitch [deg], (b) generator torque [MN·m], (c) generator power [MW], (d) rotor thrust [MN], (e) rotor speed [rpm], (f) tip-speed ratio [-]. Deeplines Wind (blue), OrcaFlex (green), and IEA-15 MW reference (orange).
Jmse 13 02077 g002
Figure 3. Constant wind production, wind coordinate, and wind aligned with +X: (a) Deeplines Wind model, (b) Orca flex model.
Jmse 13 02077 g003
Figure 4. Seed-averaged extreme maximum/minimum of tower base load wind speed under constant, aligned inflow (Series 1.x), Deeplines Wind (blue) and OrcaFlex (orange): (a) Fx (kN), (b) Fy (kN), (c) Fz (kN), (d) Mx (kN-m), (e) My (kN-m), (f) Mz (kN-m).
Jmse 13 02077 g004
Figure 5. Constant parked, heading convention and wind headings (0°, 90°, and 180°) referenced to +X: (a) Deeplines Wind model, (b) Orca flex model.
Jmse 13 02077 g005
Figure 6. Seed-averaged extreme maximum/minimum of tower base load wind speed under constant, aligned inflow (Series 6.x), Deeplines Wind (blue) and OrcaFlex (orange): (a) Fx (kN), (b) Fy (kN), (c) Fz (kN), (d) Mx (kN-m), (e) My (kN-m), (f) Mz (kN-m).
Jmse 13 02077 g006
Figure 7. DLC 1.3 (power-producing, ETM). Seedseed-averaged extreme maximum/minimum of the six tower base components by mean wind speed, Deeplines Wind (blue) and OrcaFlex (orange): (a) Fx (kN), (b) Fy (kN), (c) Fz (kN), (d) Mx (kN-m), (e) My (kN-m), (f) Mz (kN-m).
Jmse 13 02077 g007
Figure 8. DLC 1.4 (power-producing, ECD). Seed-averaged extreme maximum/minimum of the six tower base components by mean wind speed, Deeplines Wind (green) and OrcaFlex (orange): (a) Fx (kN), (b) Fy (kN), (c) Fz (kN), (d) Mx (kN-m), (e) My (kN-m), (f) Mz (kN-m).
Jmse 13 02077 g008aJmse 13 02077 g008b
Figure 9. DLC 6.1 (Parked, EWM). Seed-averaged extreme maximum/minimum of the six tower base components heading-sweep envelopes (0°, 30°, 60°, 90°, 120°, 150°, and 180°) for Deeplines Wind (Green) and OrcaFlex (blue): (a) Fx (kN), (b) Fy (kN), (c) Fz (kN), (d) Mx (kN-m), (e) My (kN-m), (f) Mz (kN-m).
Jmse 13 02077 g009aJmse 13 02077 g009b
Figure 10. DLC 6.1. Seed-averaged extreme maximum/minimum of tower base loads yaw error sensitivity (Δψ = −8°, 0°, +8°), −8° (yellow), 0° (green), and +8° (blue): (a) Fx (kN), (b) Fy (kN), (c) Fz (kN), (d) Mx (kN-m), (e) My (kN-m), (f) Mz (kN-m).
Jmse 13 02077 g010
Figure 11. DLC 6.2 (parked/idling, EWM with yaw error). Seed-averaged extreme maximum/minimum of tower base loads of all six components for the wind (0° to 180°) and nacelle (0° to 180°) pairing set, Deeplines Wind (blue) and OrcaFlex (orange): (a) Fx (kN), (b) Fy (kN), (c) Fz (kN), (d) Mx (kN-m), (e) My (kN-m), (f) Mz (kN-m).
Jmse 13 02077 g011aJmse 13 02077 g011b
Figure 12. DLC 6.2 (parked/idling, EWM with yaw error grid), (0°, 30°, 60°, 90°, 120°, 150°, and 180°). seed-averaged Fx (kN, left) and Fy (kN, right) versus nacelle heading, Deeplines Wind (blue) and OrcaFlex (orange): (a) wind 0° Fx (kN), (b) wind 0° Fy (kN), (c) wind 30° Fx (kN), (d) wind 30° Fy (kN), (e) wind 60° Fx (kN), (f) wind 60° Fy (kN), (g) wind 90° Fx (kN), (h) wind 90° Fy (kN), (i) wind 120° Fx (kN), (j) wind 120° Fy (kN), (k) wind 150° Fx (kN), (l) wind 150° Fy (kN), (m) wind 180° Fx (kN), (n) wind 180° Fy (kN).
Jmse 13 02077 g012aJmse 13 02077 g012b
Table 1. Key parameter of IEA 15 MW reference turbine.
ParameterUnitValue
Power ratingMW15
Turbine Class-IEC Class 1B
Rotor diameterm240
Hub heightm150
Cut-in wind speedm/s3
Rated wind speedm/s10.59
Cut-out wind speedm/s25
Maximum rotor speedrpm7.56
Table 2. Metocean inputs used for ULS.
Wind Speed [m/s]Hs [m]Tp [s]
41.149.58
61.3810.15
81.337.82
101.687.92
121.957.84
142.528.86
163.089.68
183.6710.28
204.4611.07
224.9111.37
245.4515.70
266.1013.00
46.8
(Extreme 50-y return)
7.6210.46
Table 3. DLC matrix.
DLCDesign
Situation
Wind ConditionWind SpeedWavesAdditional SettingSeedsSimulations
1.3Power
production
ETM4:2:26NSS
Hs = E[Hs|Vhub]
672
1.4Power
production
ECDVr, Vr ± 2 m/sNSS
Hs = E[Hs|Vhub]
±direction change618
6.1ParkedEWMV50ESS
Hs = Hs,50
Mean yaw misalignment of ±8°363
6.2ParkedEWMV50ESS
Hs = Hs,50
Yaw misalignment of 0~180°3216
Table 4. DLC 1.3 matrix.
Wind Speed (m/s)Wind Direction [deg]Hs [m]Tp [s]Wave Direction [deg]Current Speed [m/s]
401.149.5802.06
601.3810.1502.06
801.337.8202.06
1001.687.9202.06
1201.957.8402.06
1402.528.8602.06
1603.089.6802.06
1803.6710.2802.06
2004.4611.0702.06
2204.9111.3702.06
2405.4515.7002.06
2606.1013.0002.06
Table 5. DLC 1.4 matrix.
Wind Speed (m/s)Wind Direction Change [deg]Gust Speed [m/s]Hs [m]Tp [s]Wave Direction [deg]Current Speed [m/s]
8.683.72151.337.8202.06
10.667.92151.337.8202.06
12.657.14151.337.8202.06
8.6−83.72151.337.8202.06
10.6−67.92151.337.8202.06
12.6−57.14151.337.8202.06
Table 6. DLC 6.1 matrix.
Wind Speed (m/s)Wind Direction Change [deg]Hs [m]Tp [s]Wave Direction [deg]Current Speed [m/s]Yaw Error [deg]
46.80:30:1807.6210.4602.56±8°
Table 7. DLC 6.2 matrix.
Wind Speed (m/s)Wind Direction Change [deg]Hs [m]Tp [s]Wave Direction [deg]Current Speed [m/s]Yaw Error [deg]
46.80:30:1807.6210.4602.560:30:180
Disclaimer/Publisher’s Note: The statements, opinions and data contained in all publications are solely those of the individual author(s) and contributor(s) and not of MDPI and/or the editor(s). MDPI and/or the editor(s) disclaim responsibility for any injury to people or property resulting from any ideas, methods, instructions or products referred to in the content.