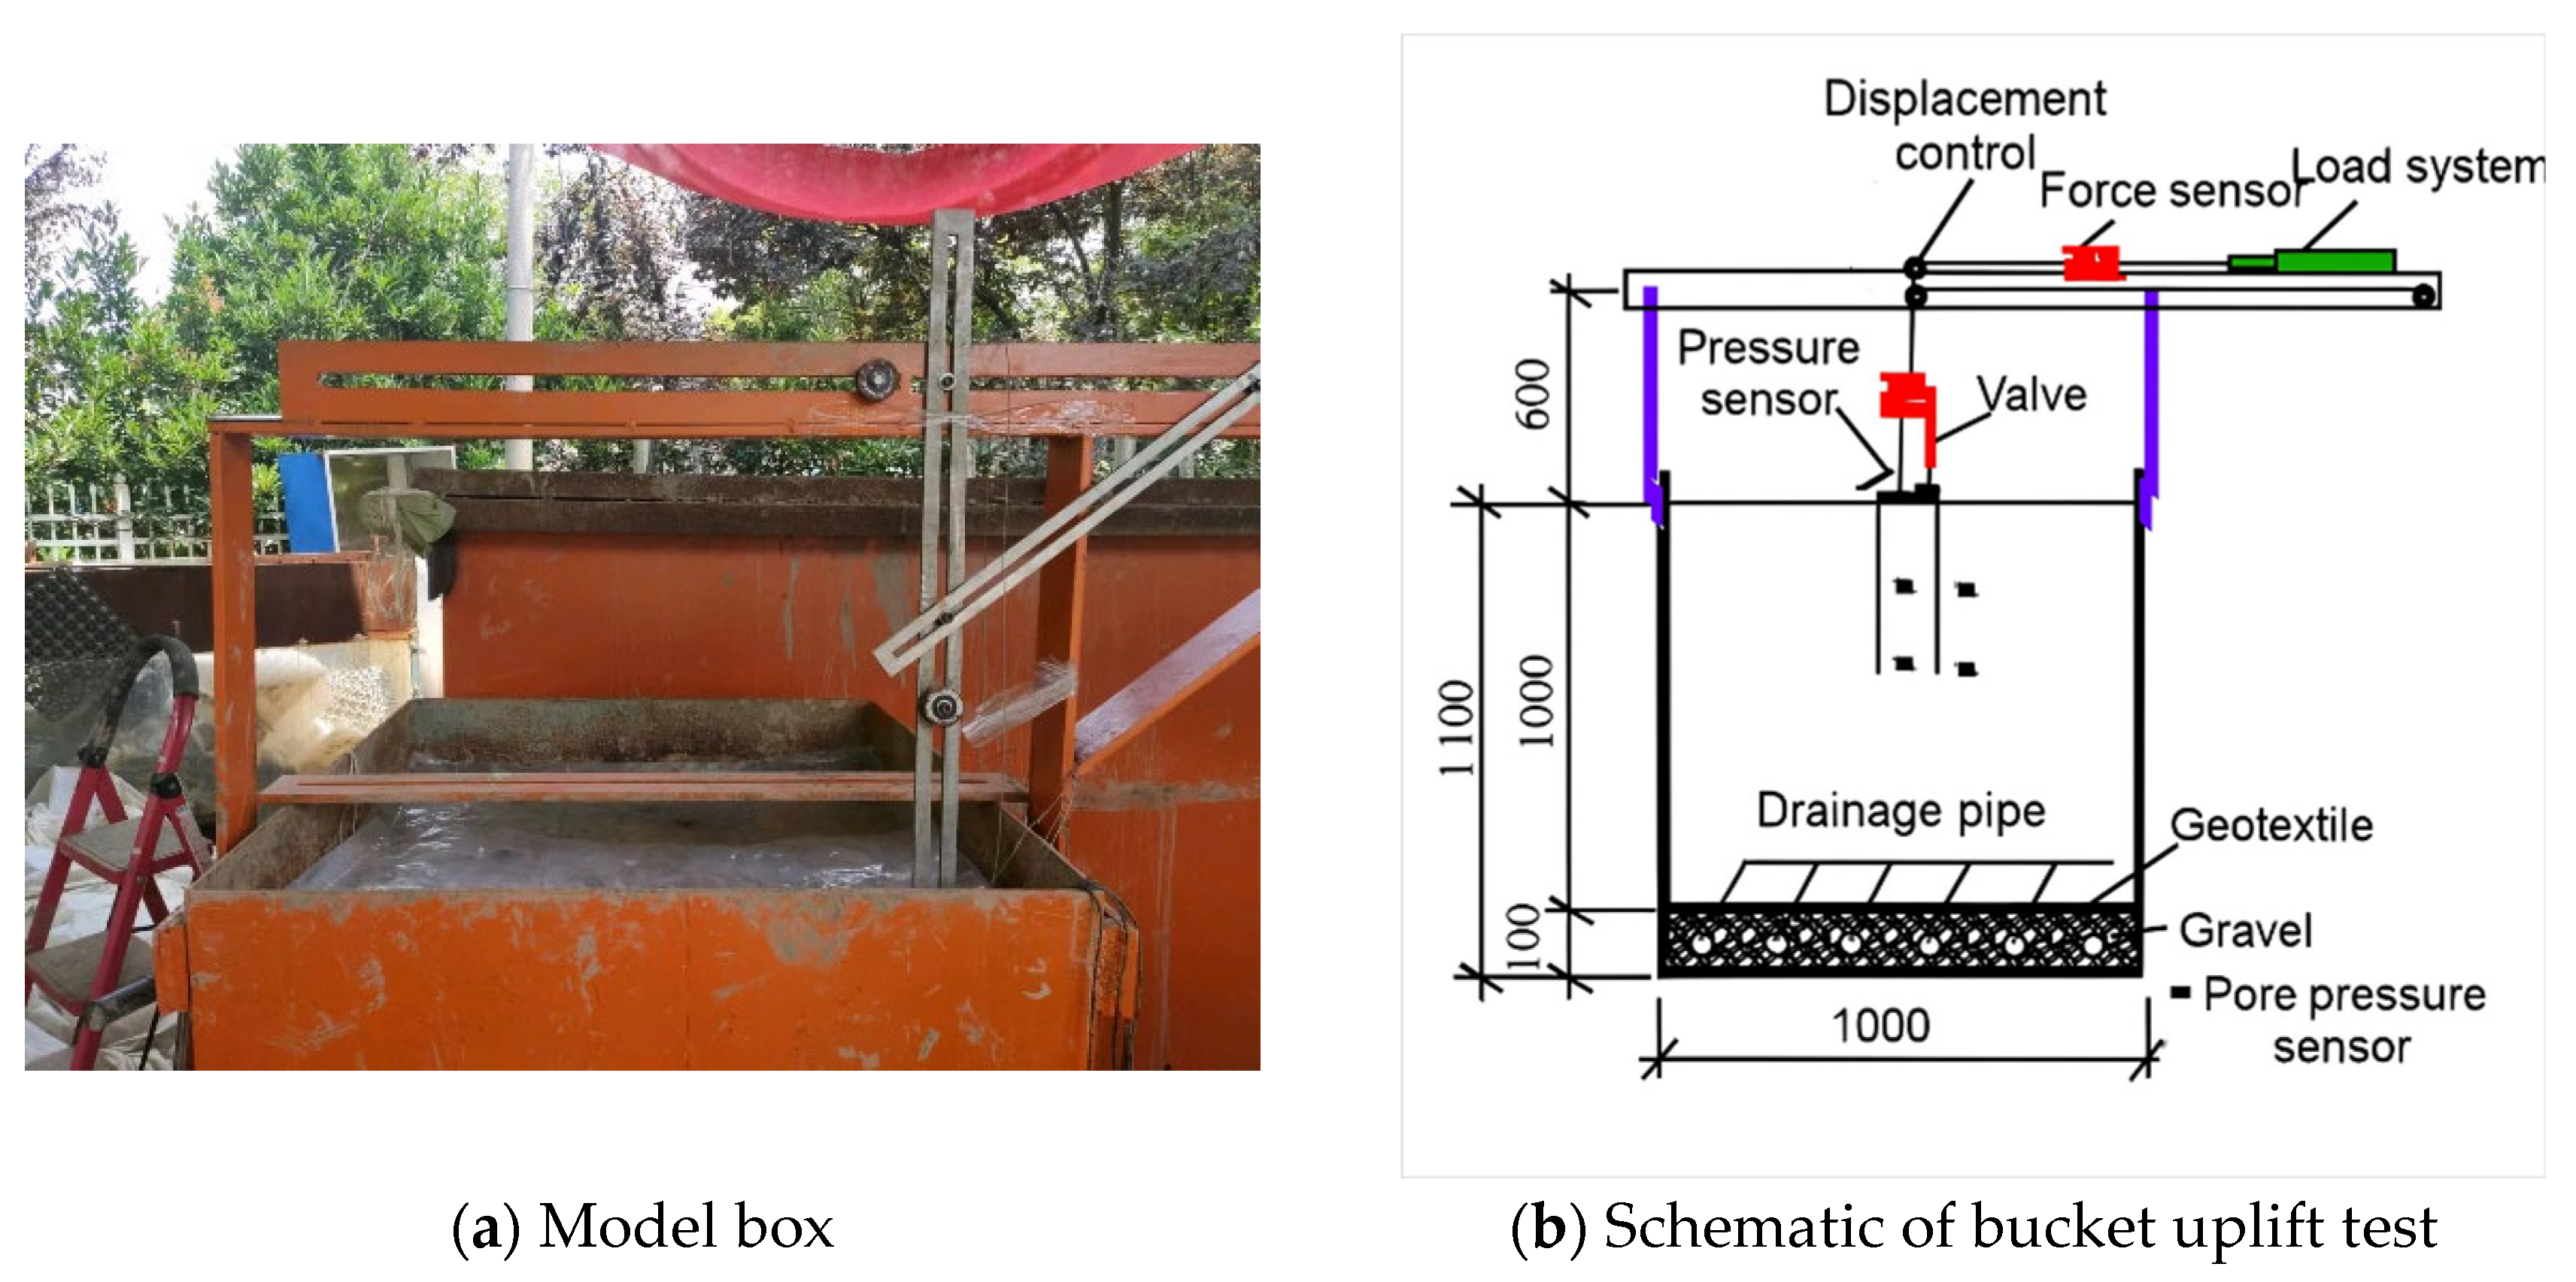
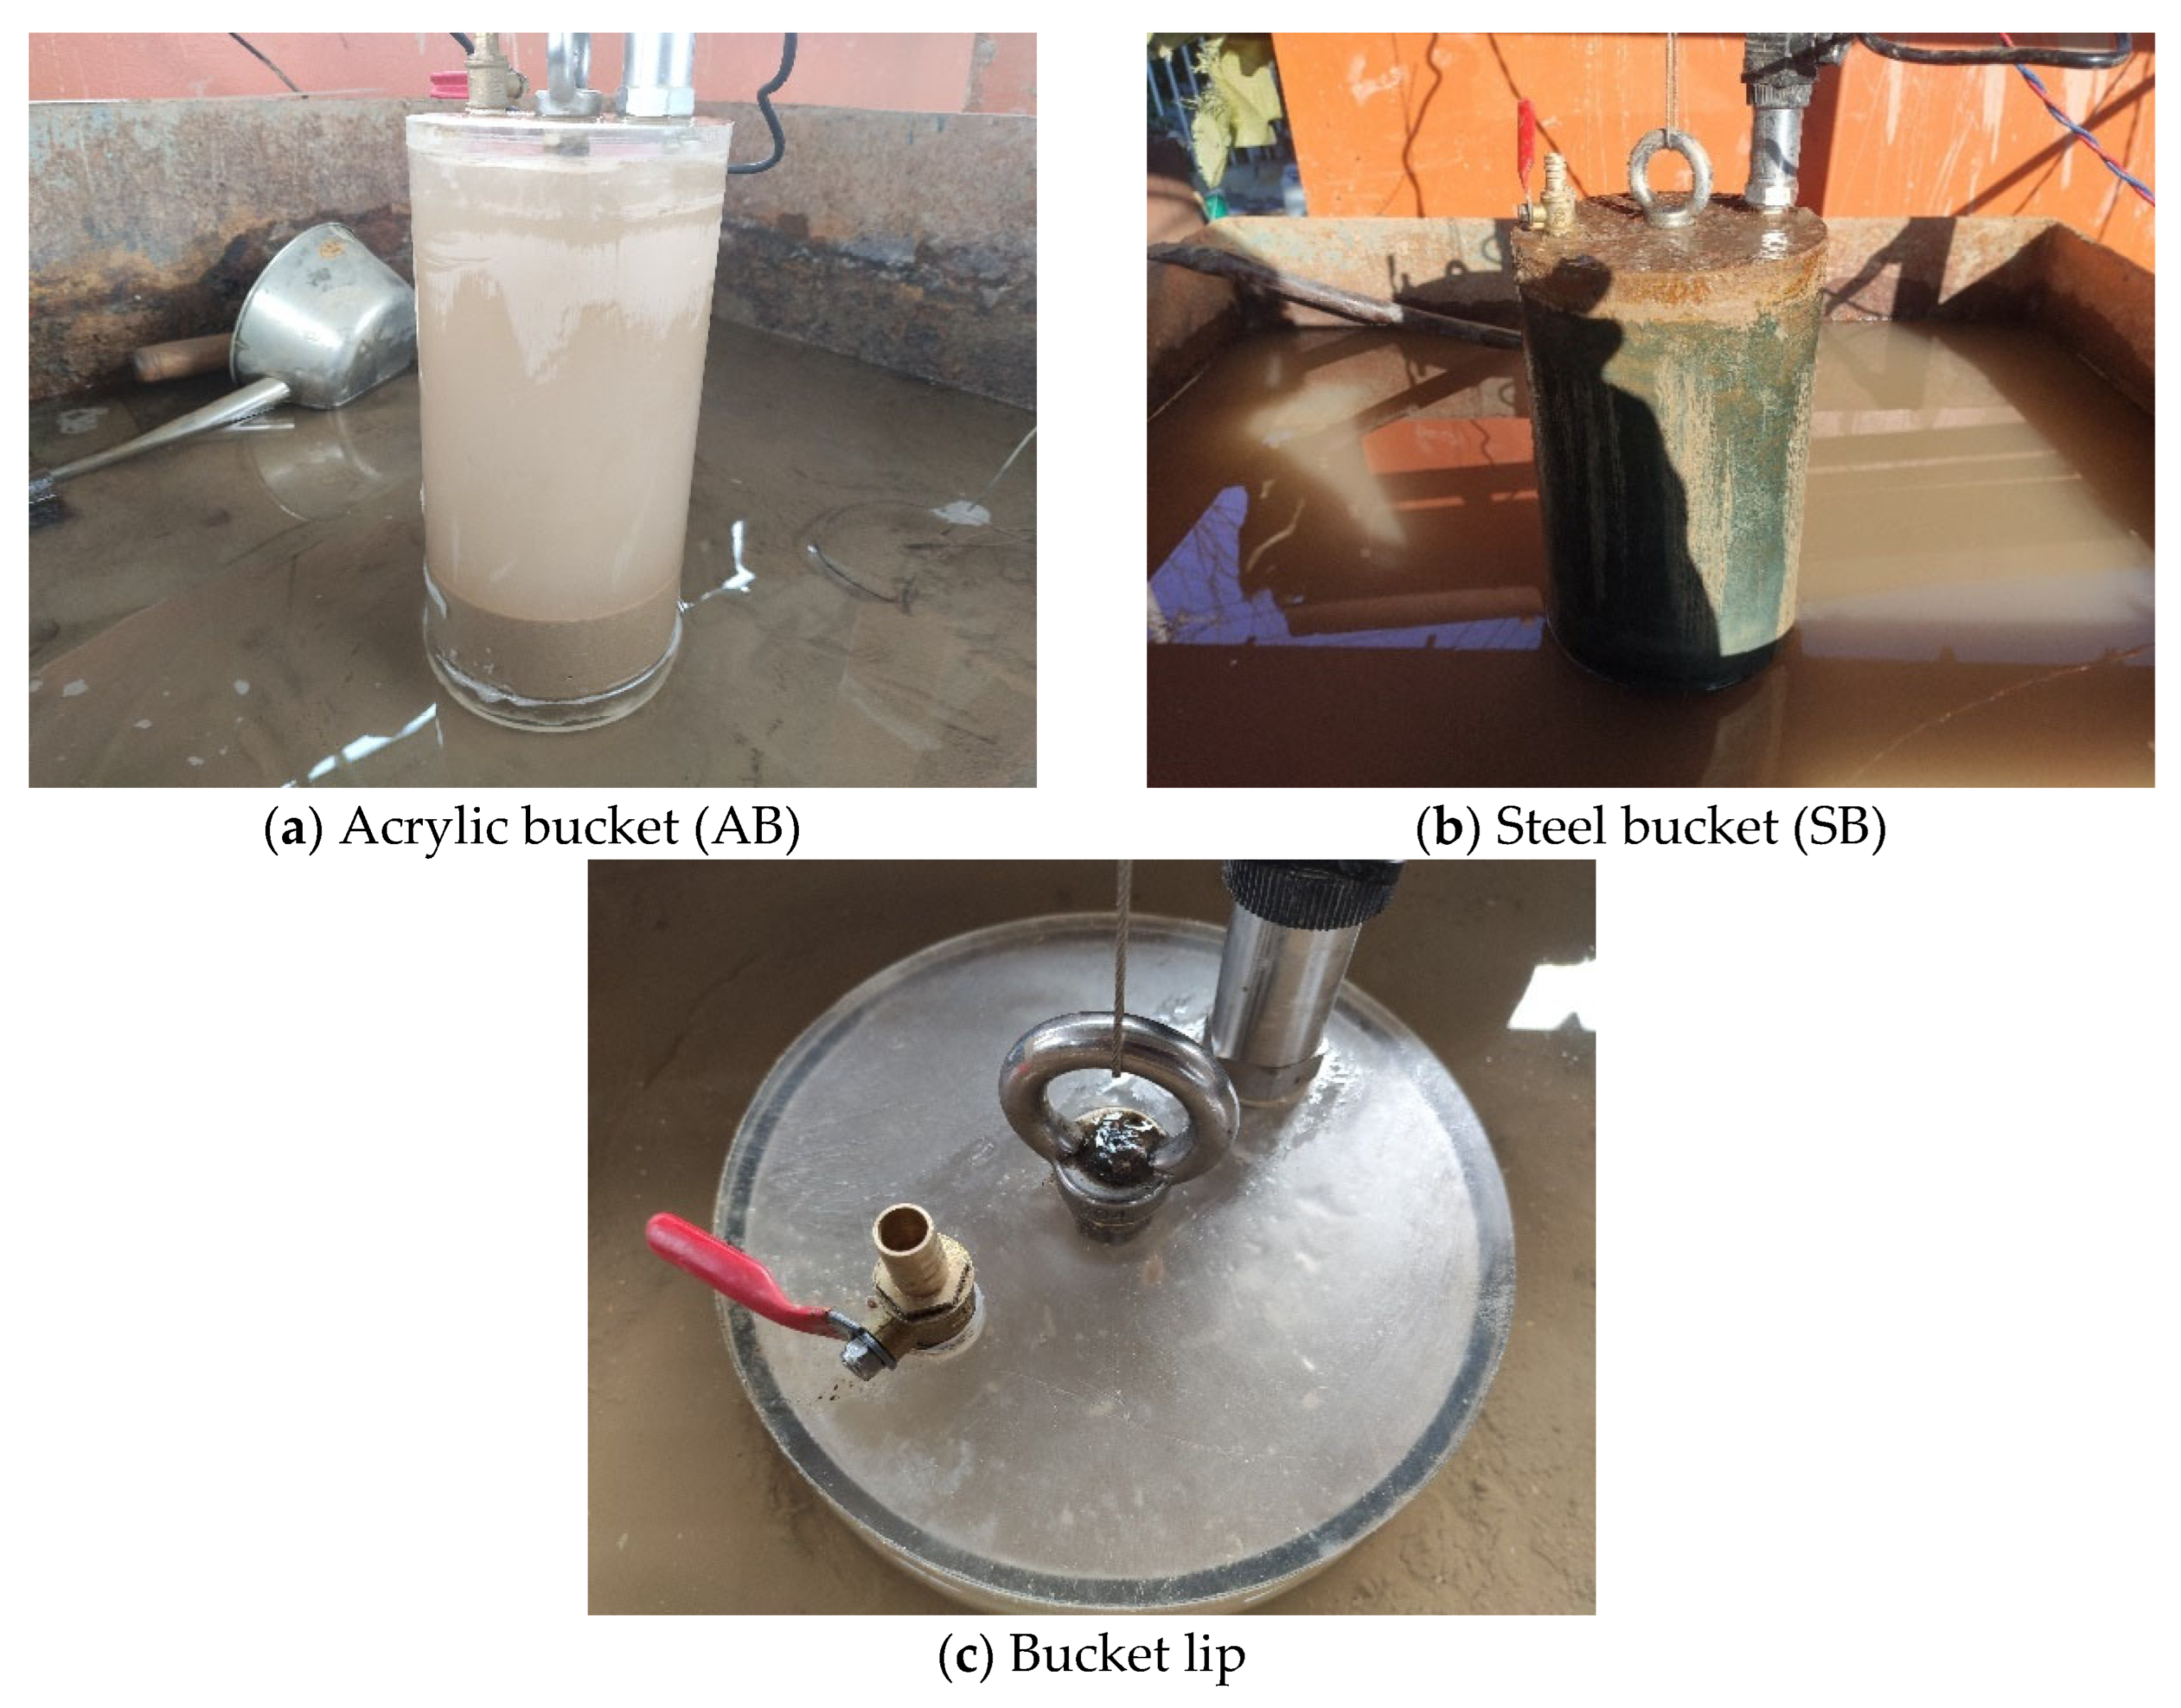
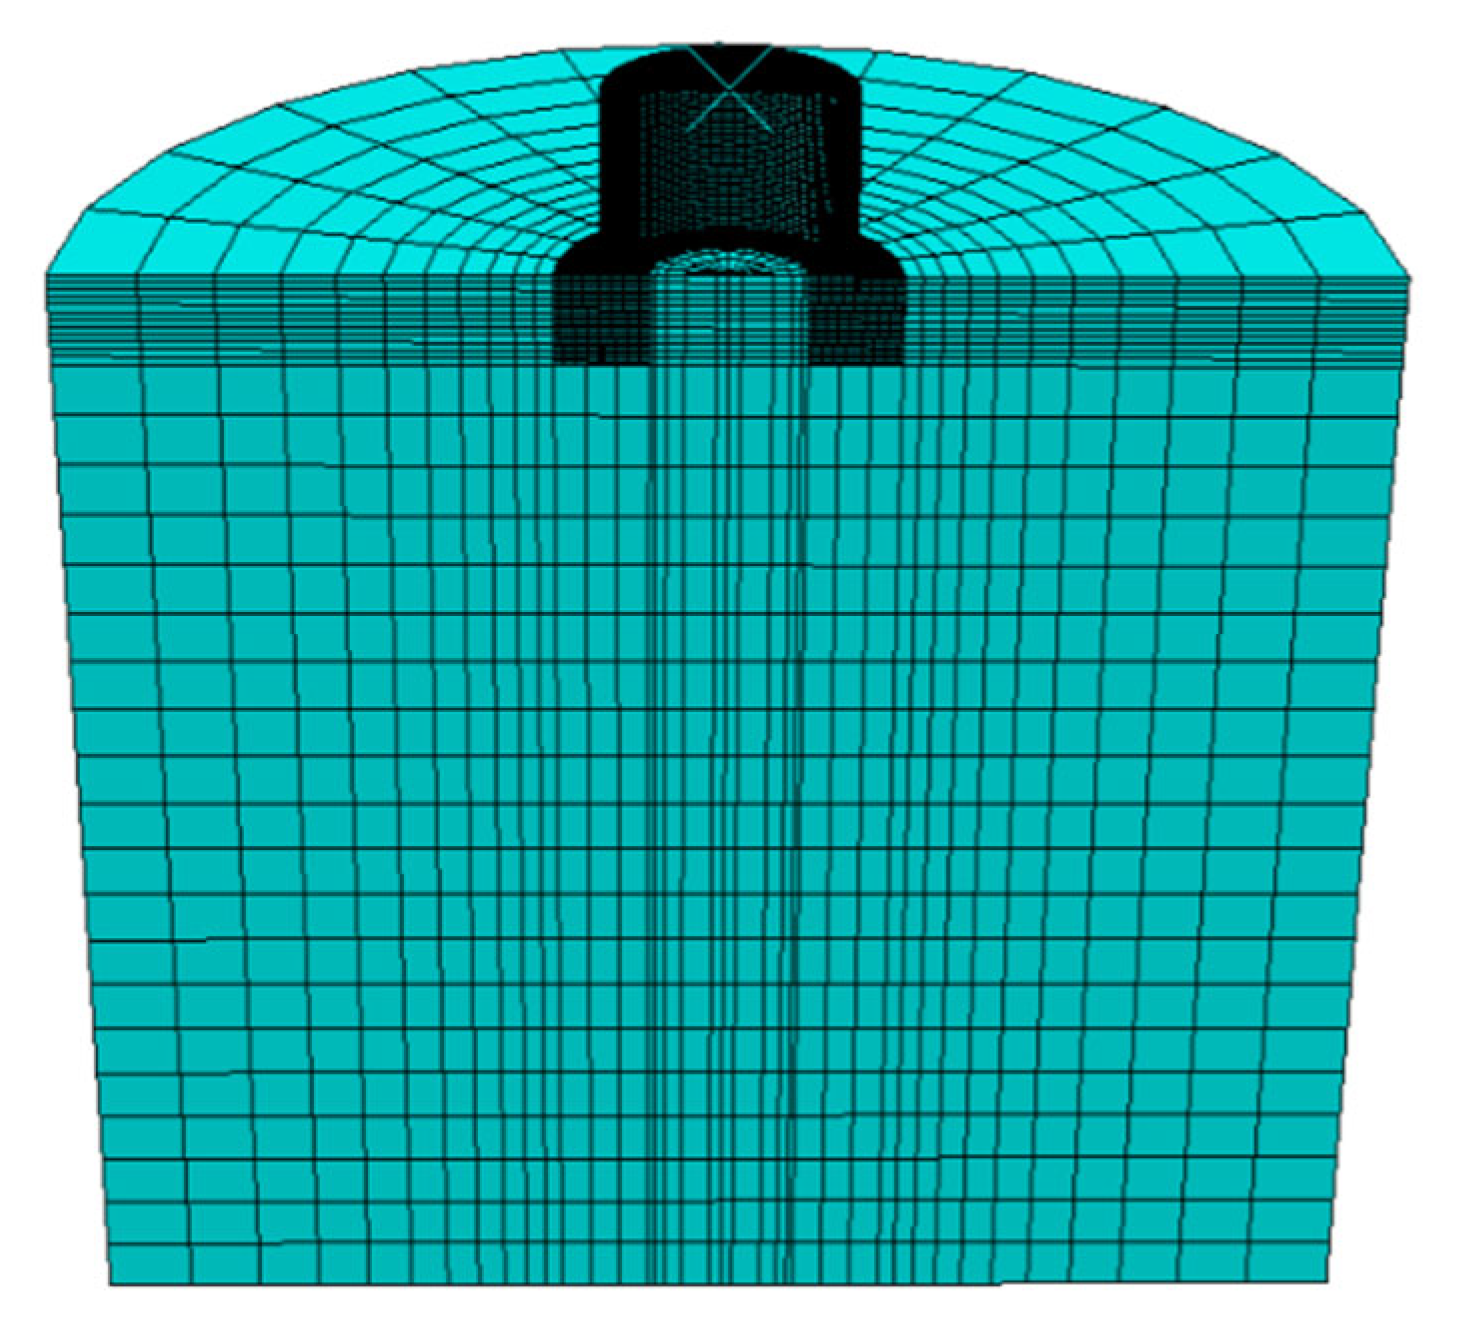
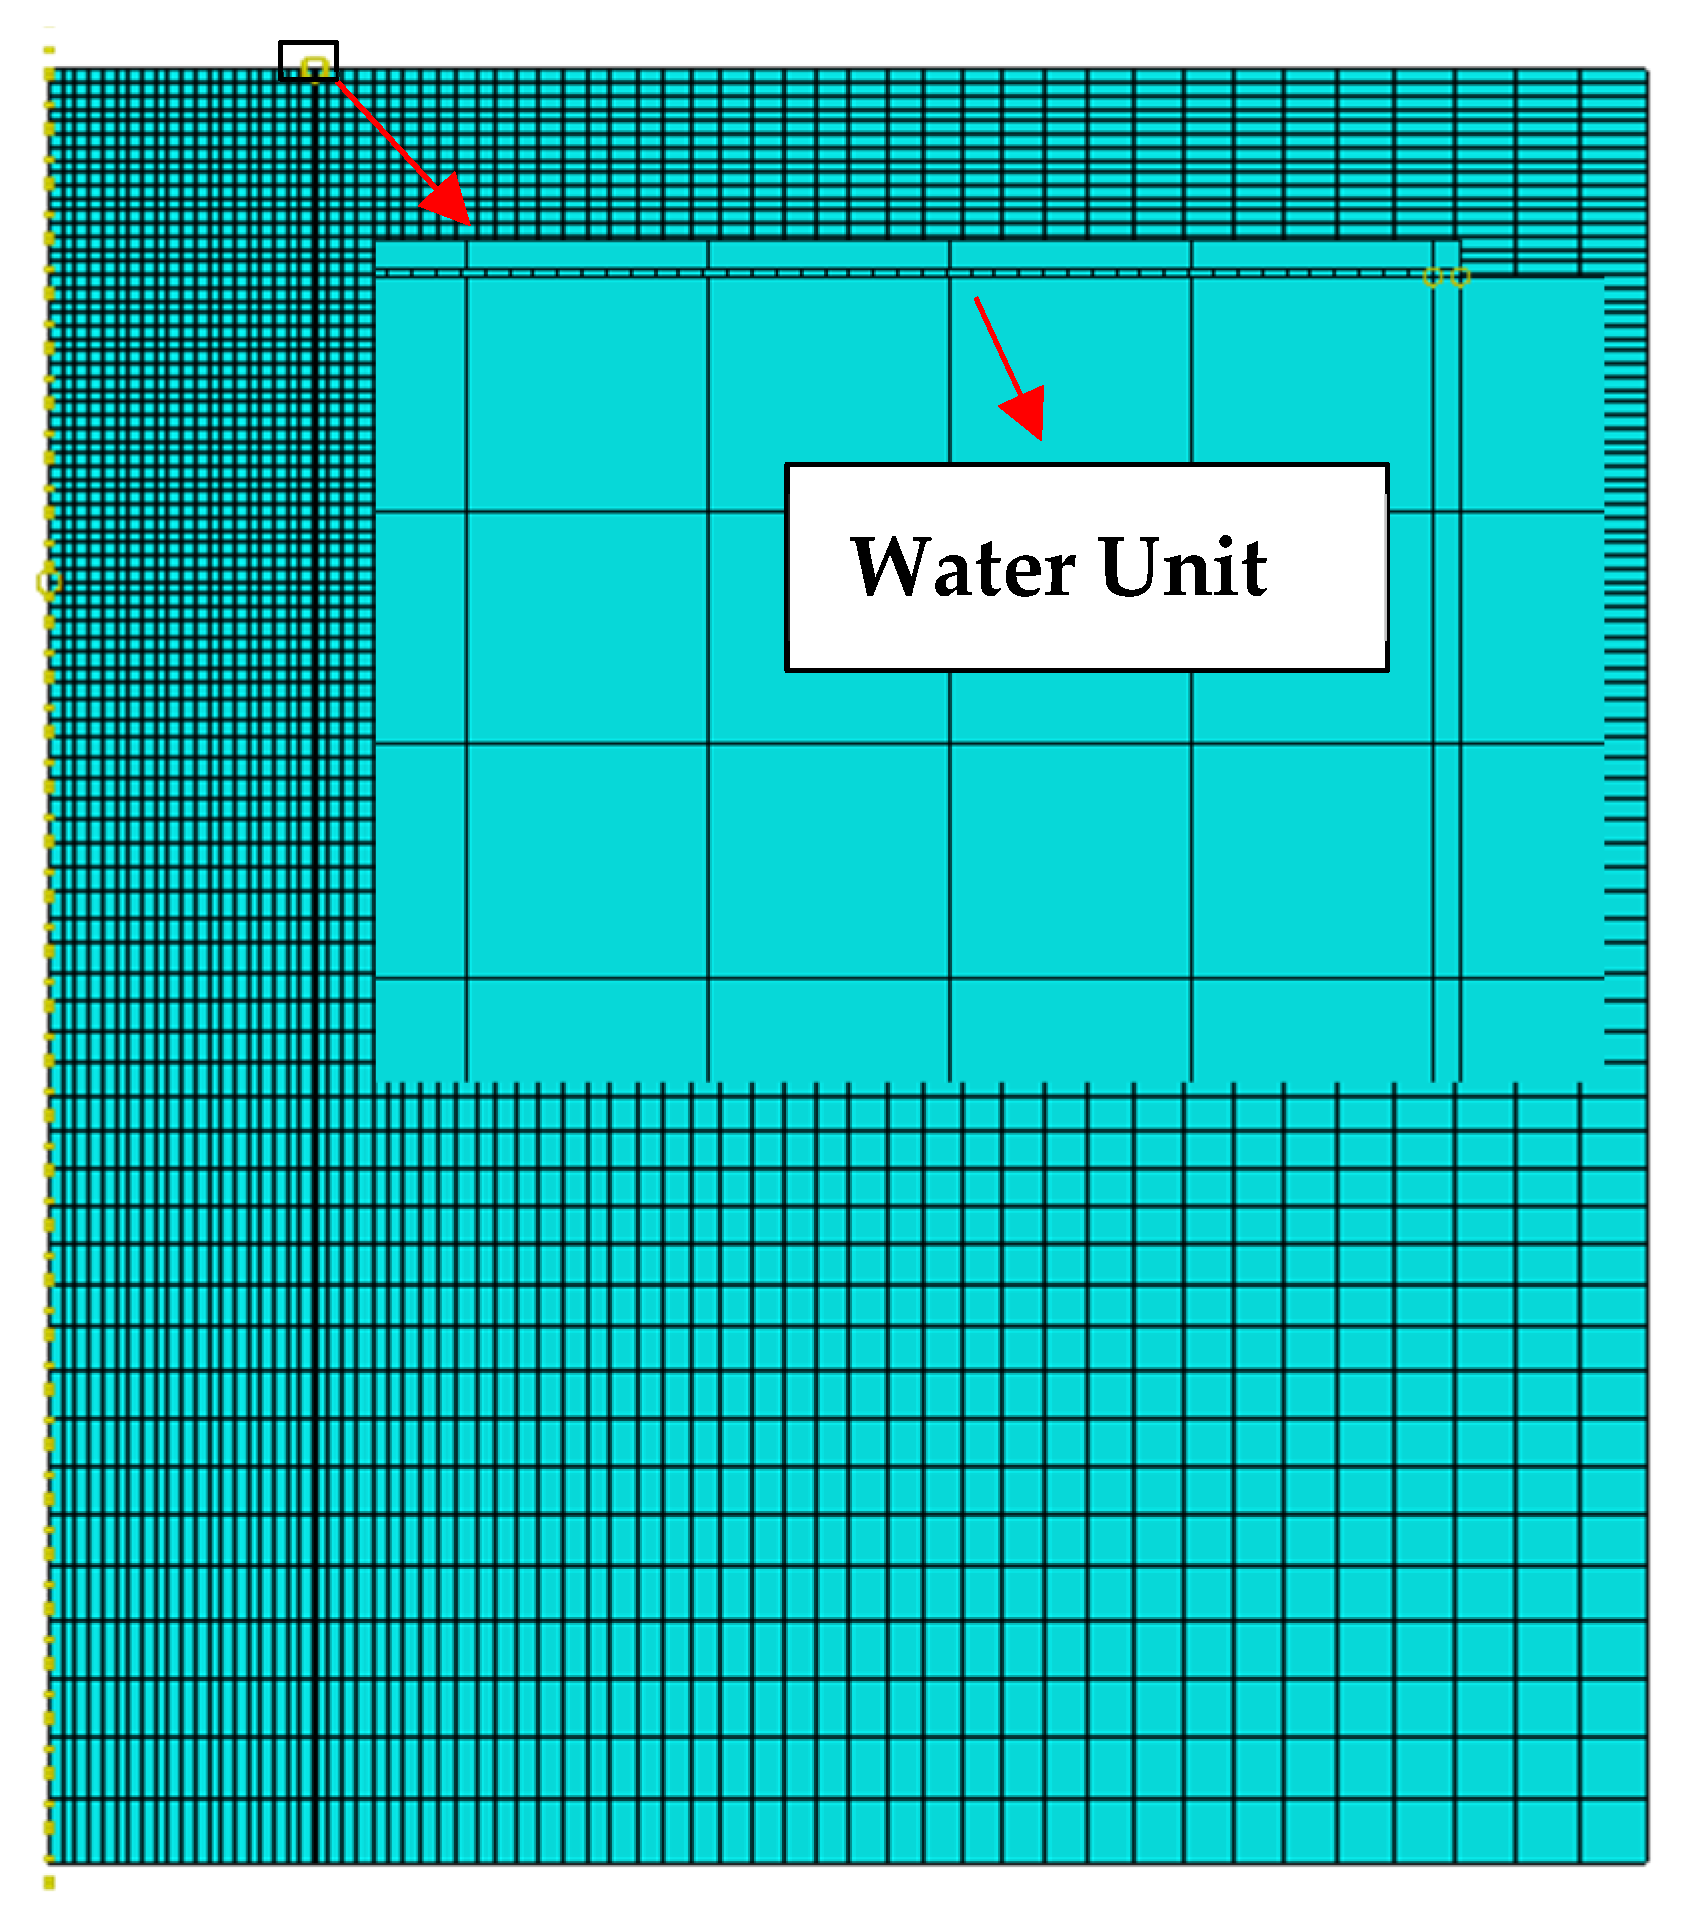
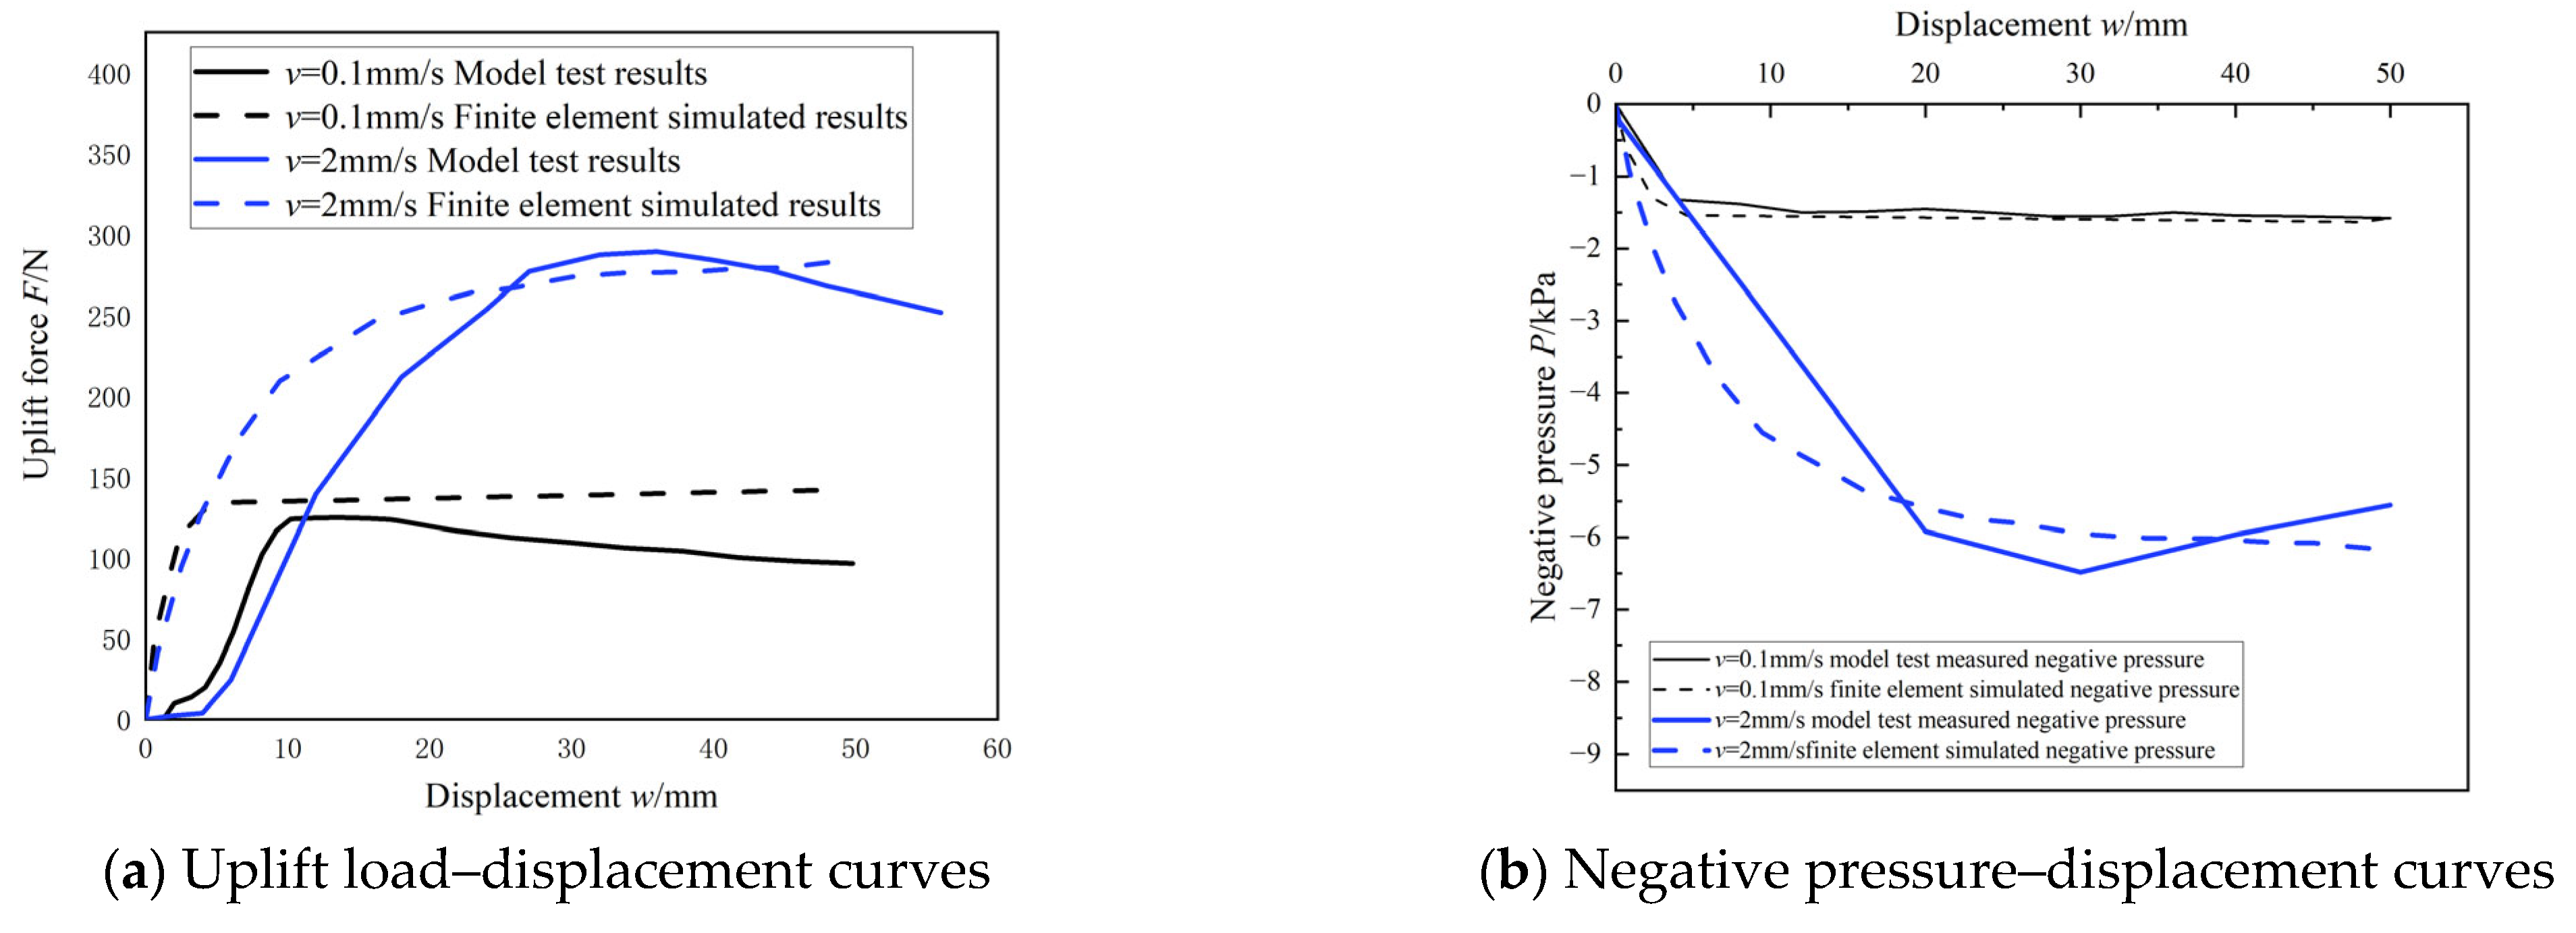
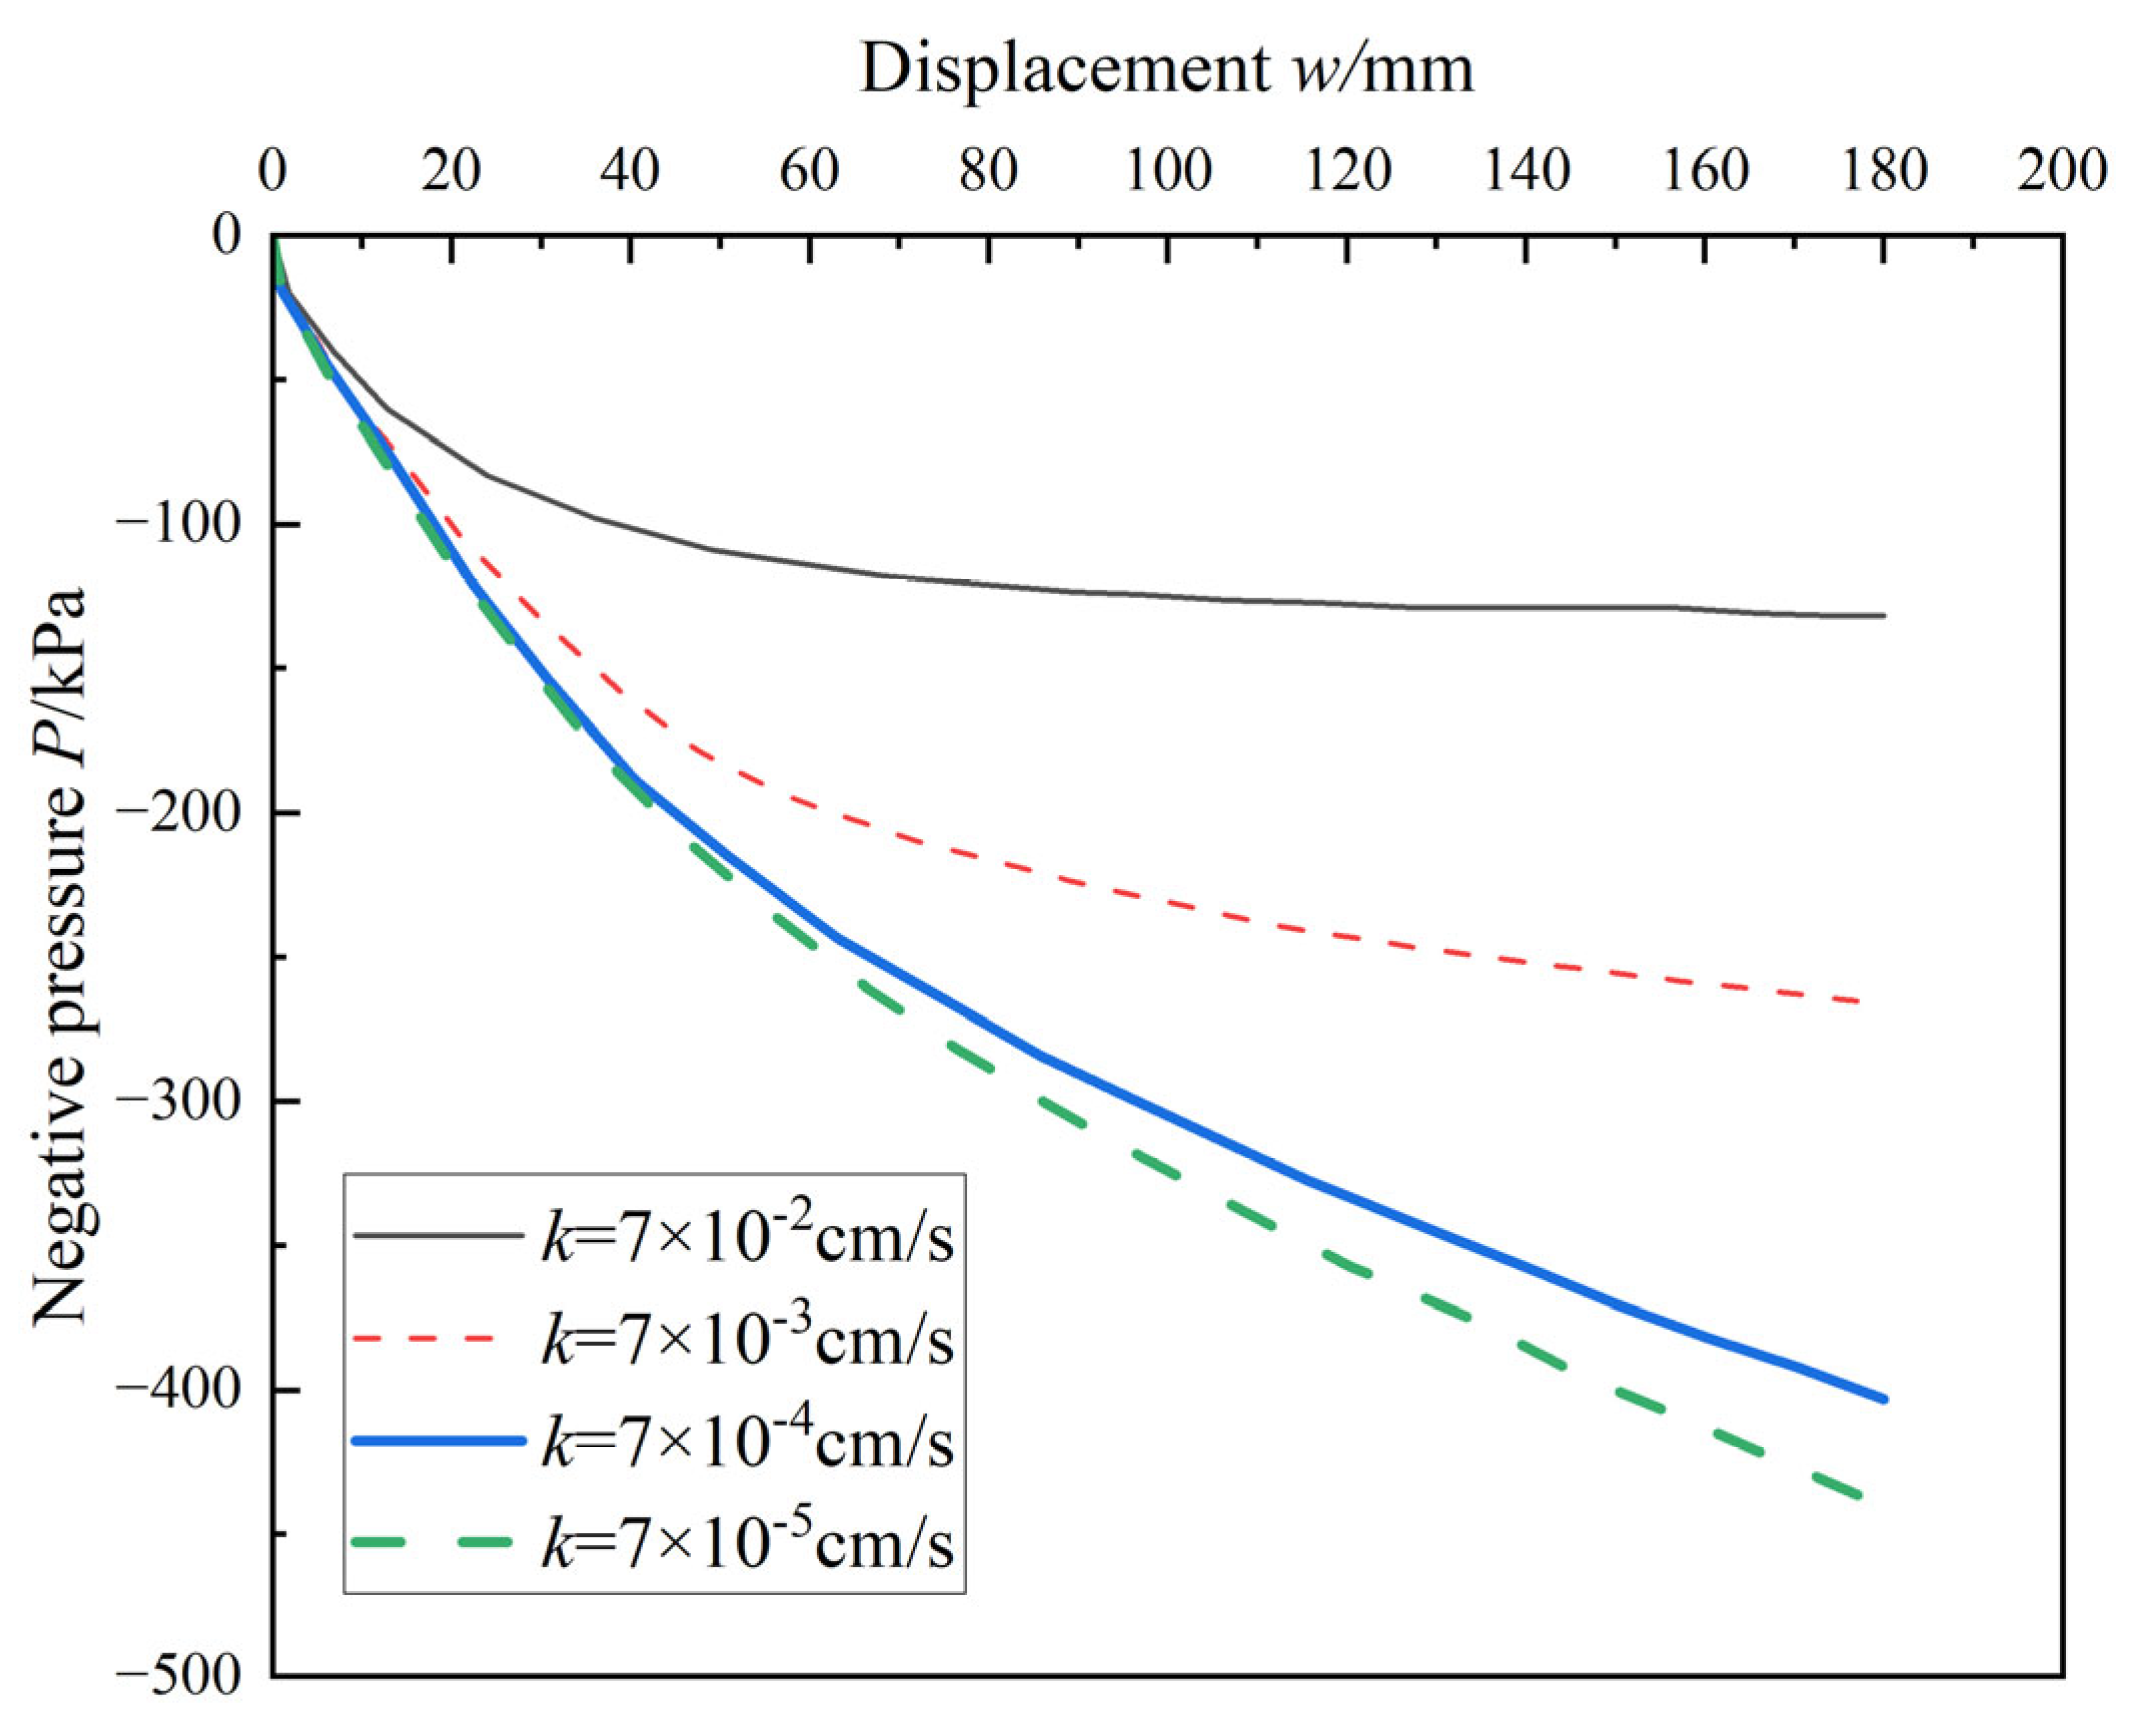
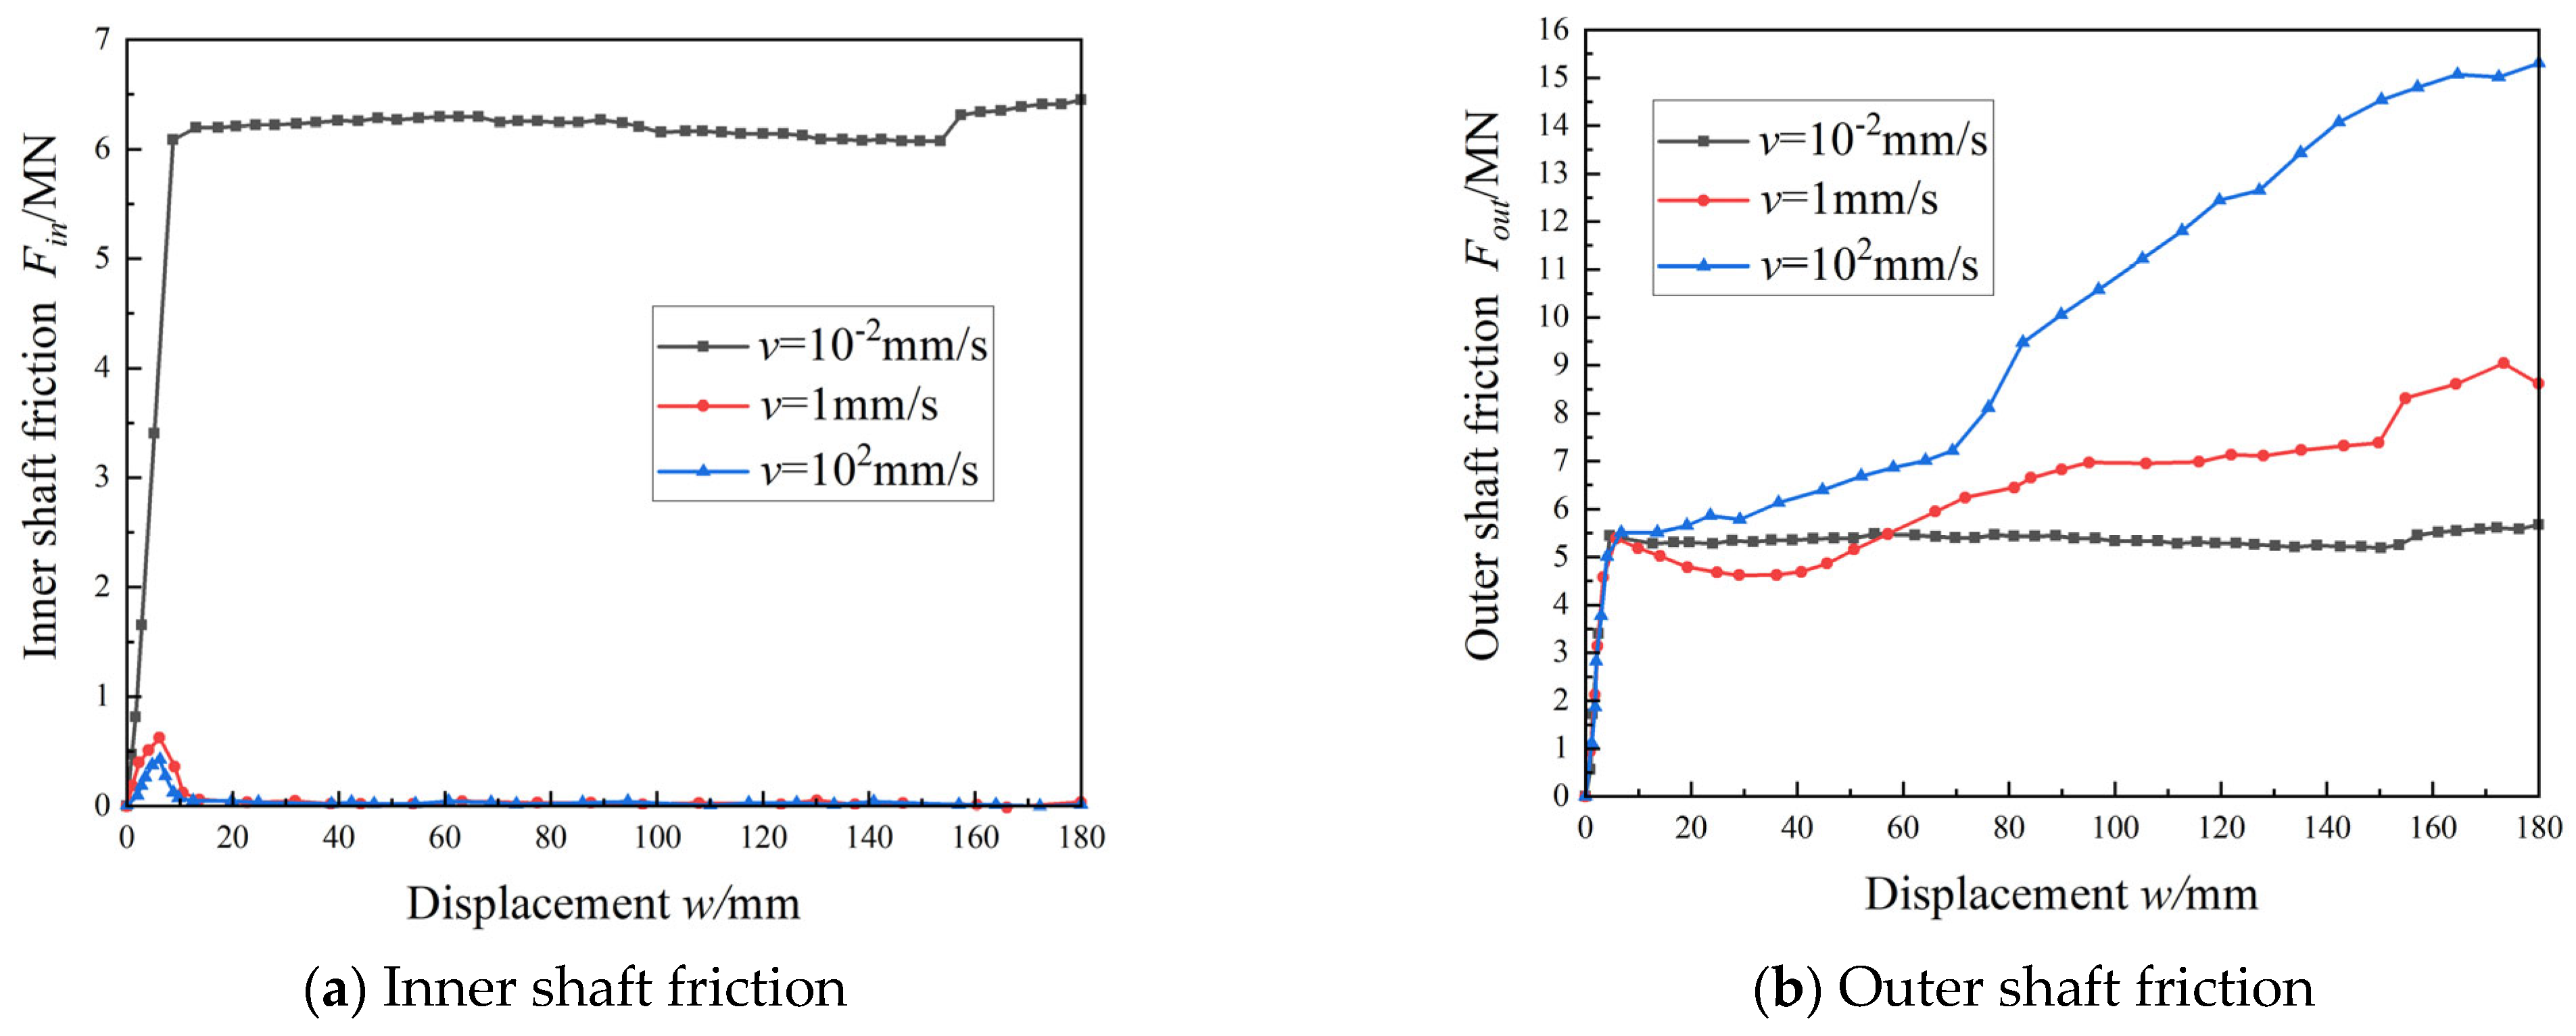
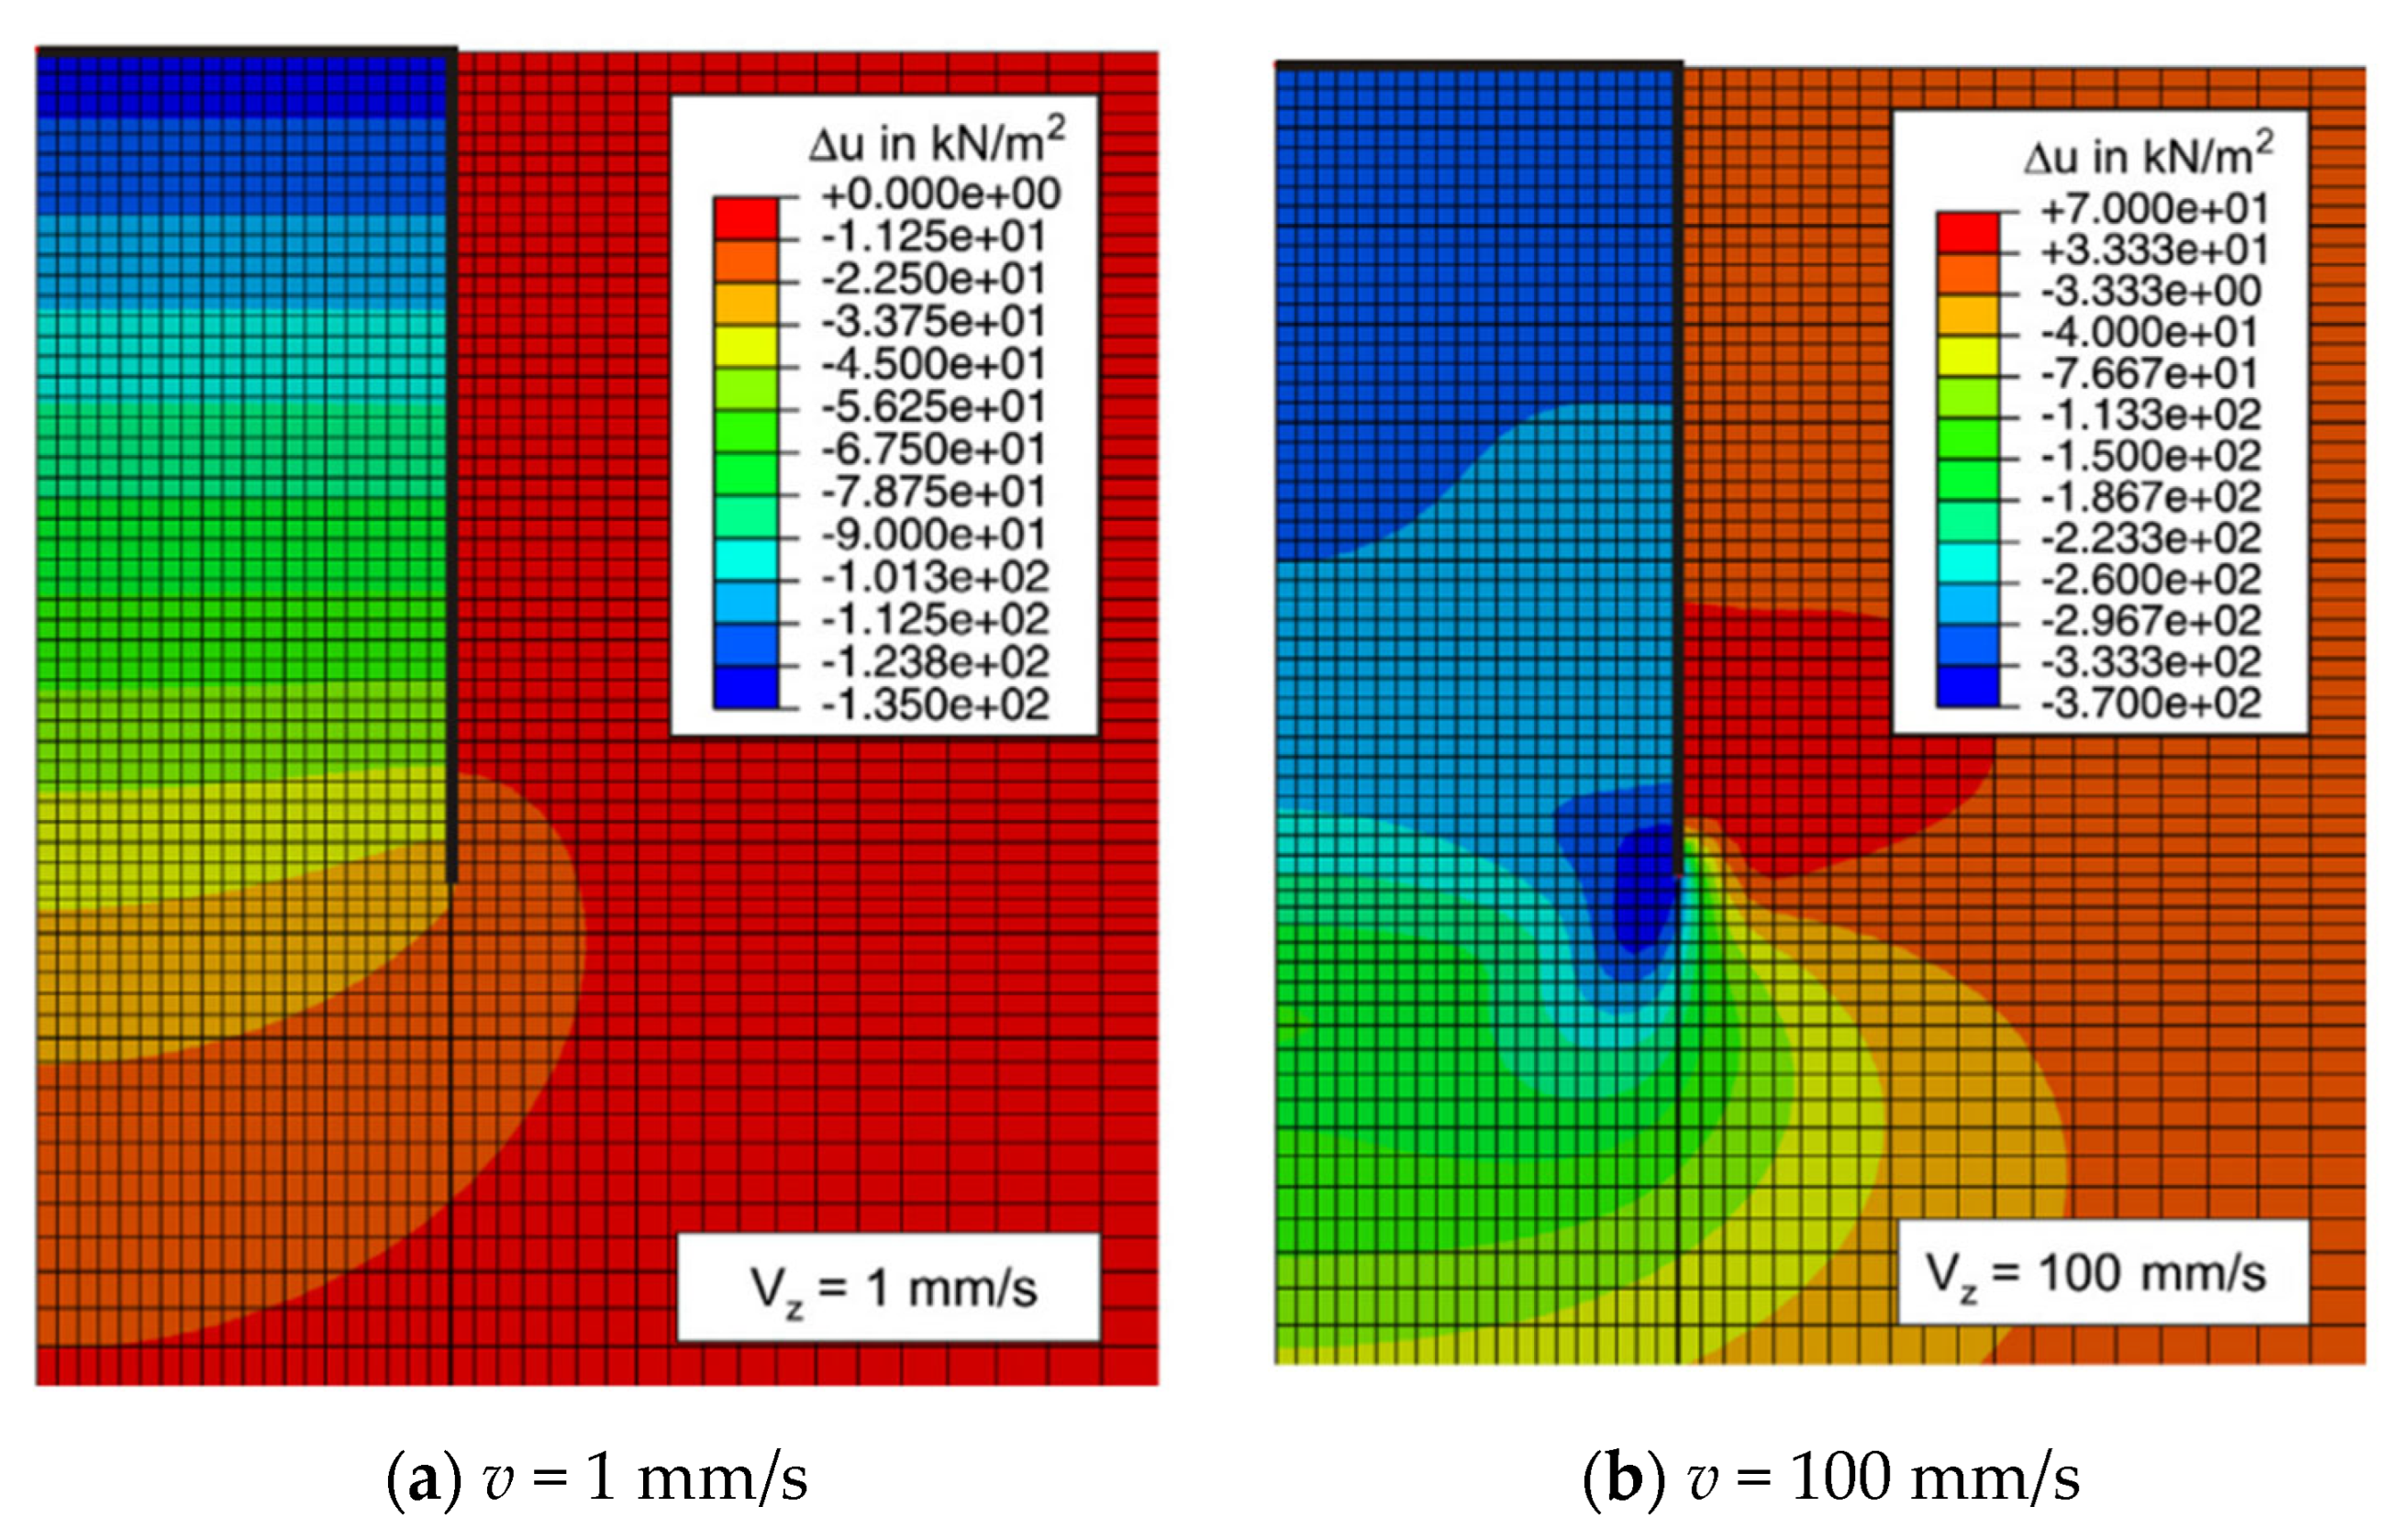
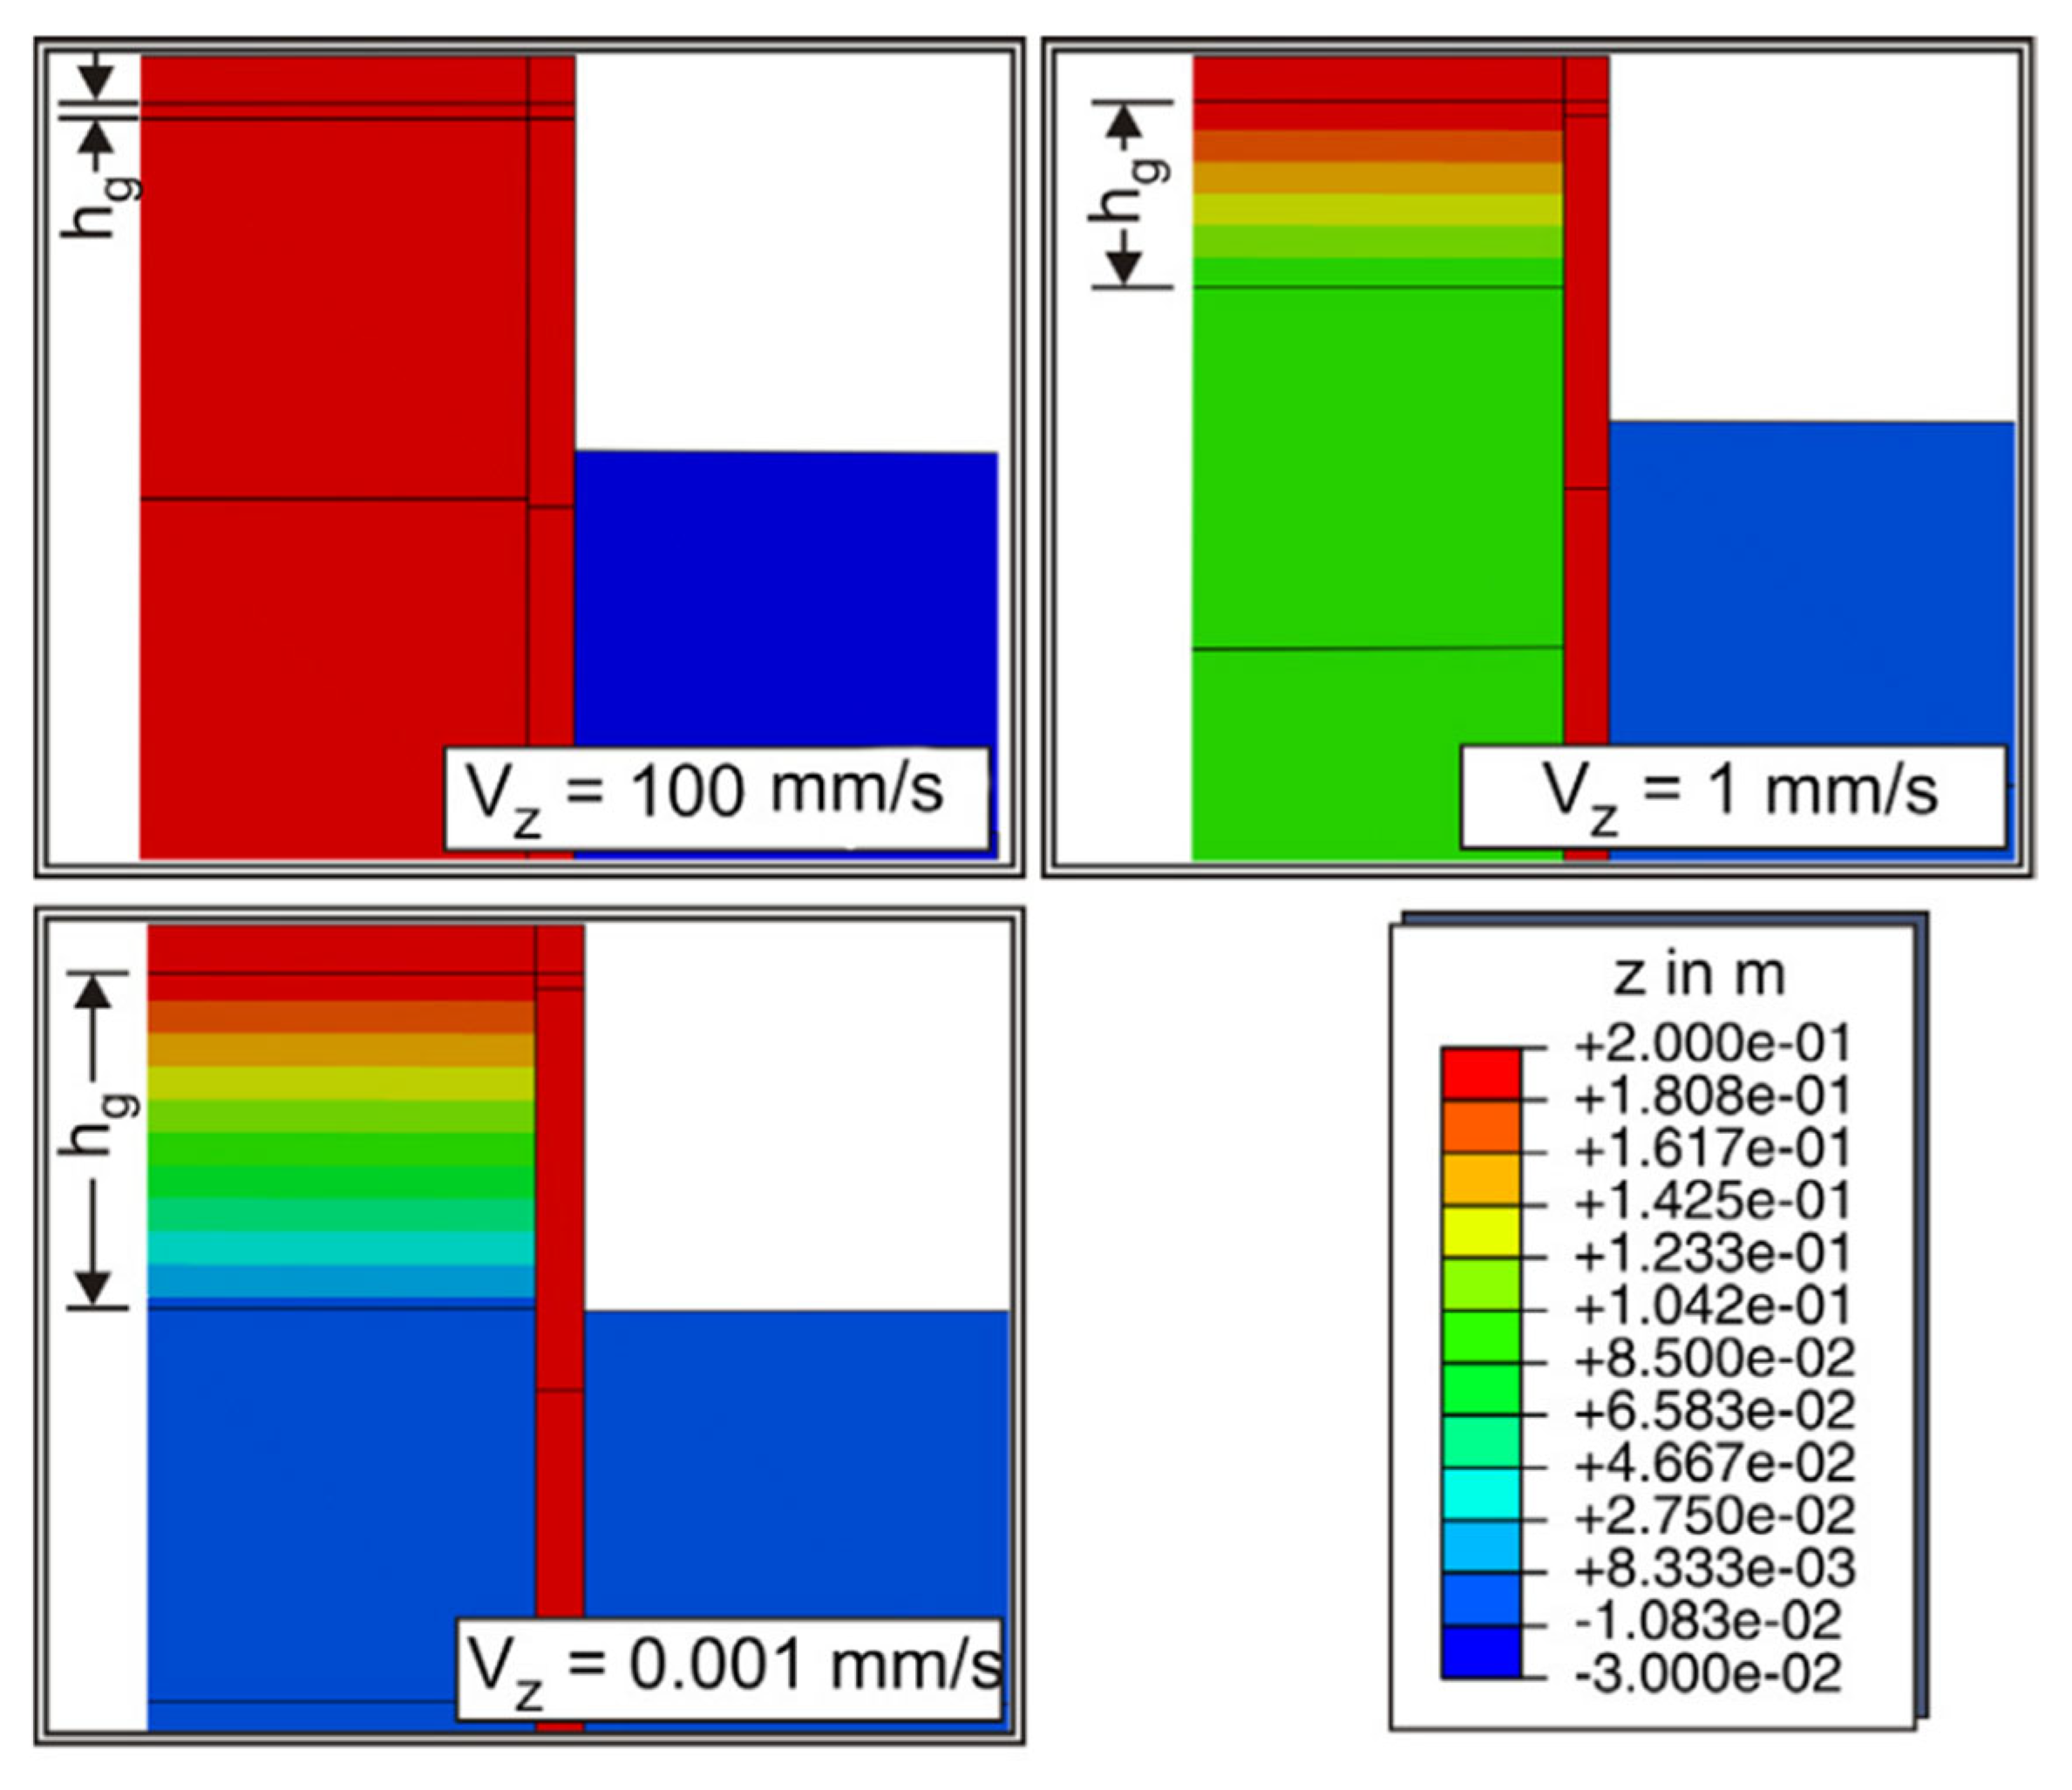
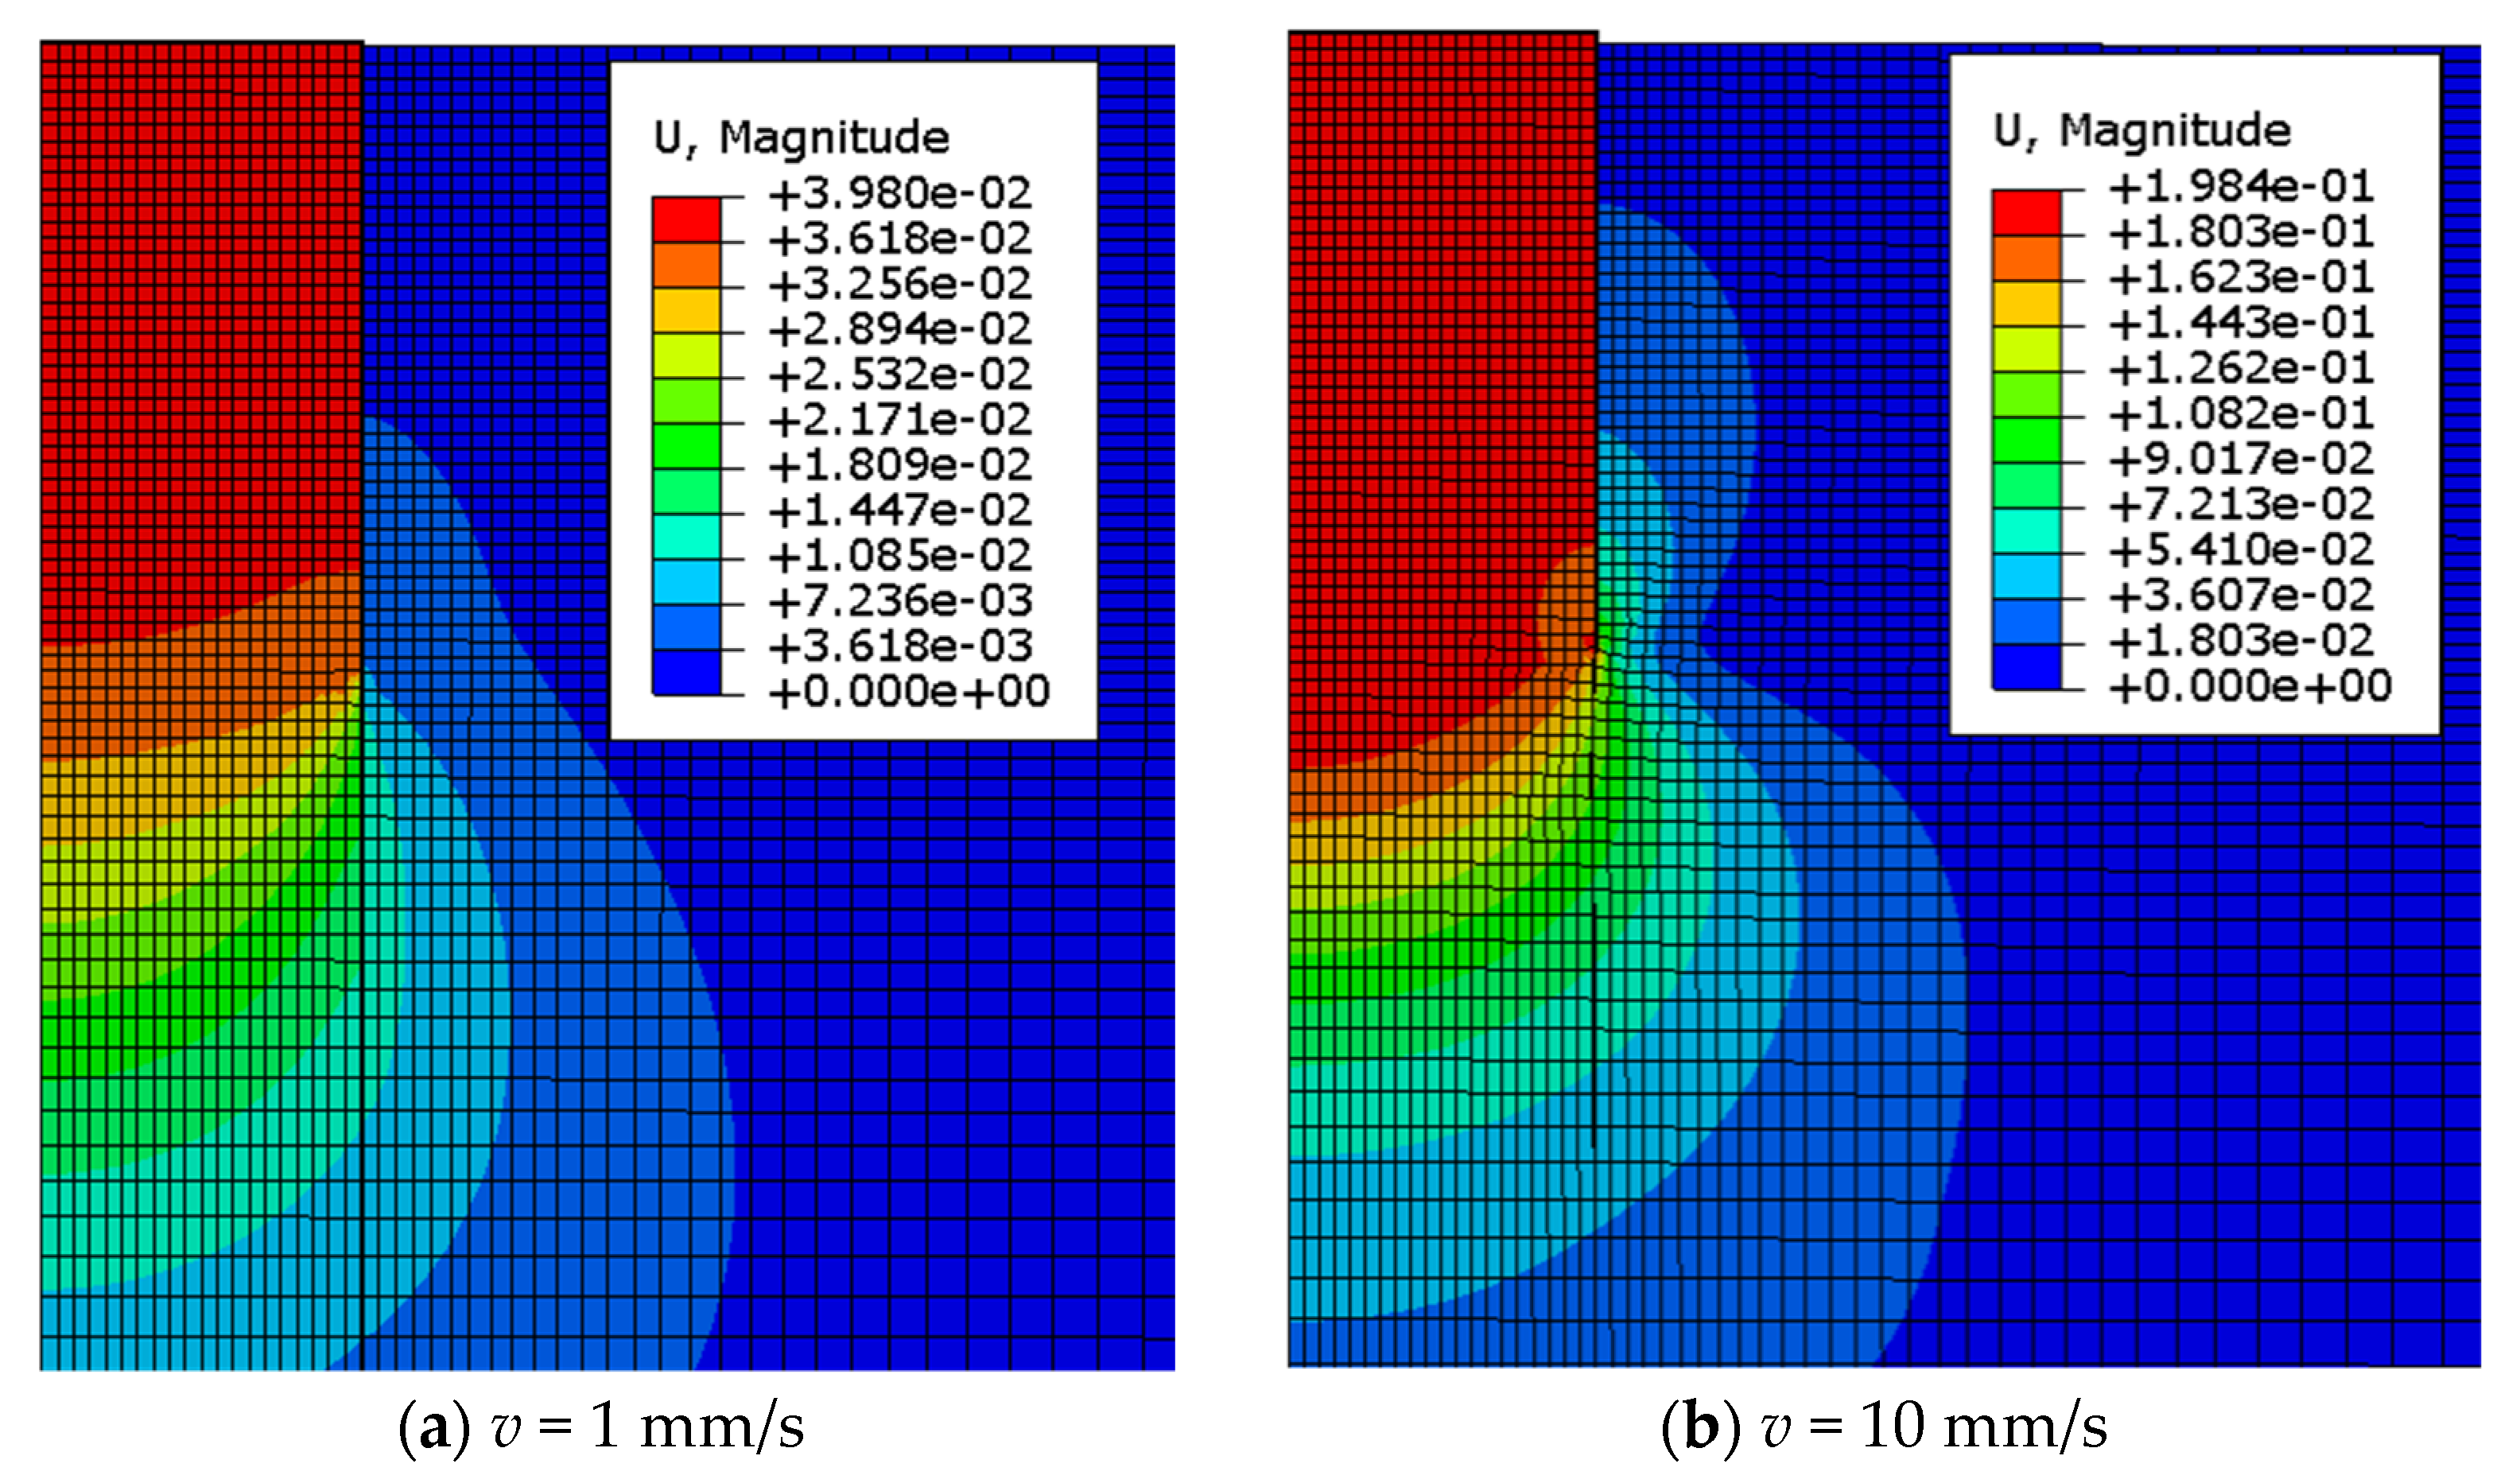
The uplift failure mechanisms of suction bucket foundations were analyzed by examining the evolution of negative pressure at the bucket lid and pore water pressure inside and outside the caisson during loading. Observations from the physical tests were used to support the interpretation of the results.
3.1.1. Results of Open-Top (Vented-Lid) Uplift Tests
To examine shaft friction development without the influence of internal suction, open-top uplift tests were conducted using the acrylic model caisson AB-1 (aspect ratio
L/
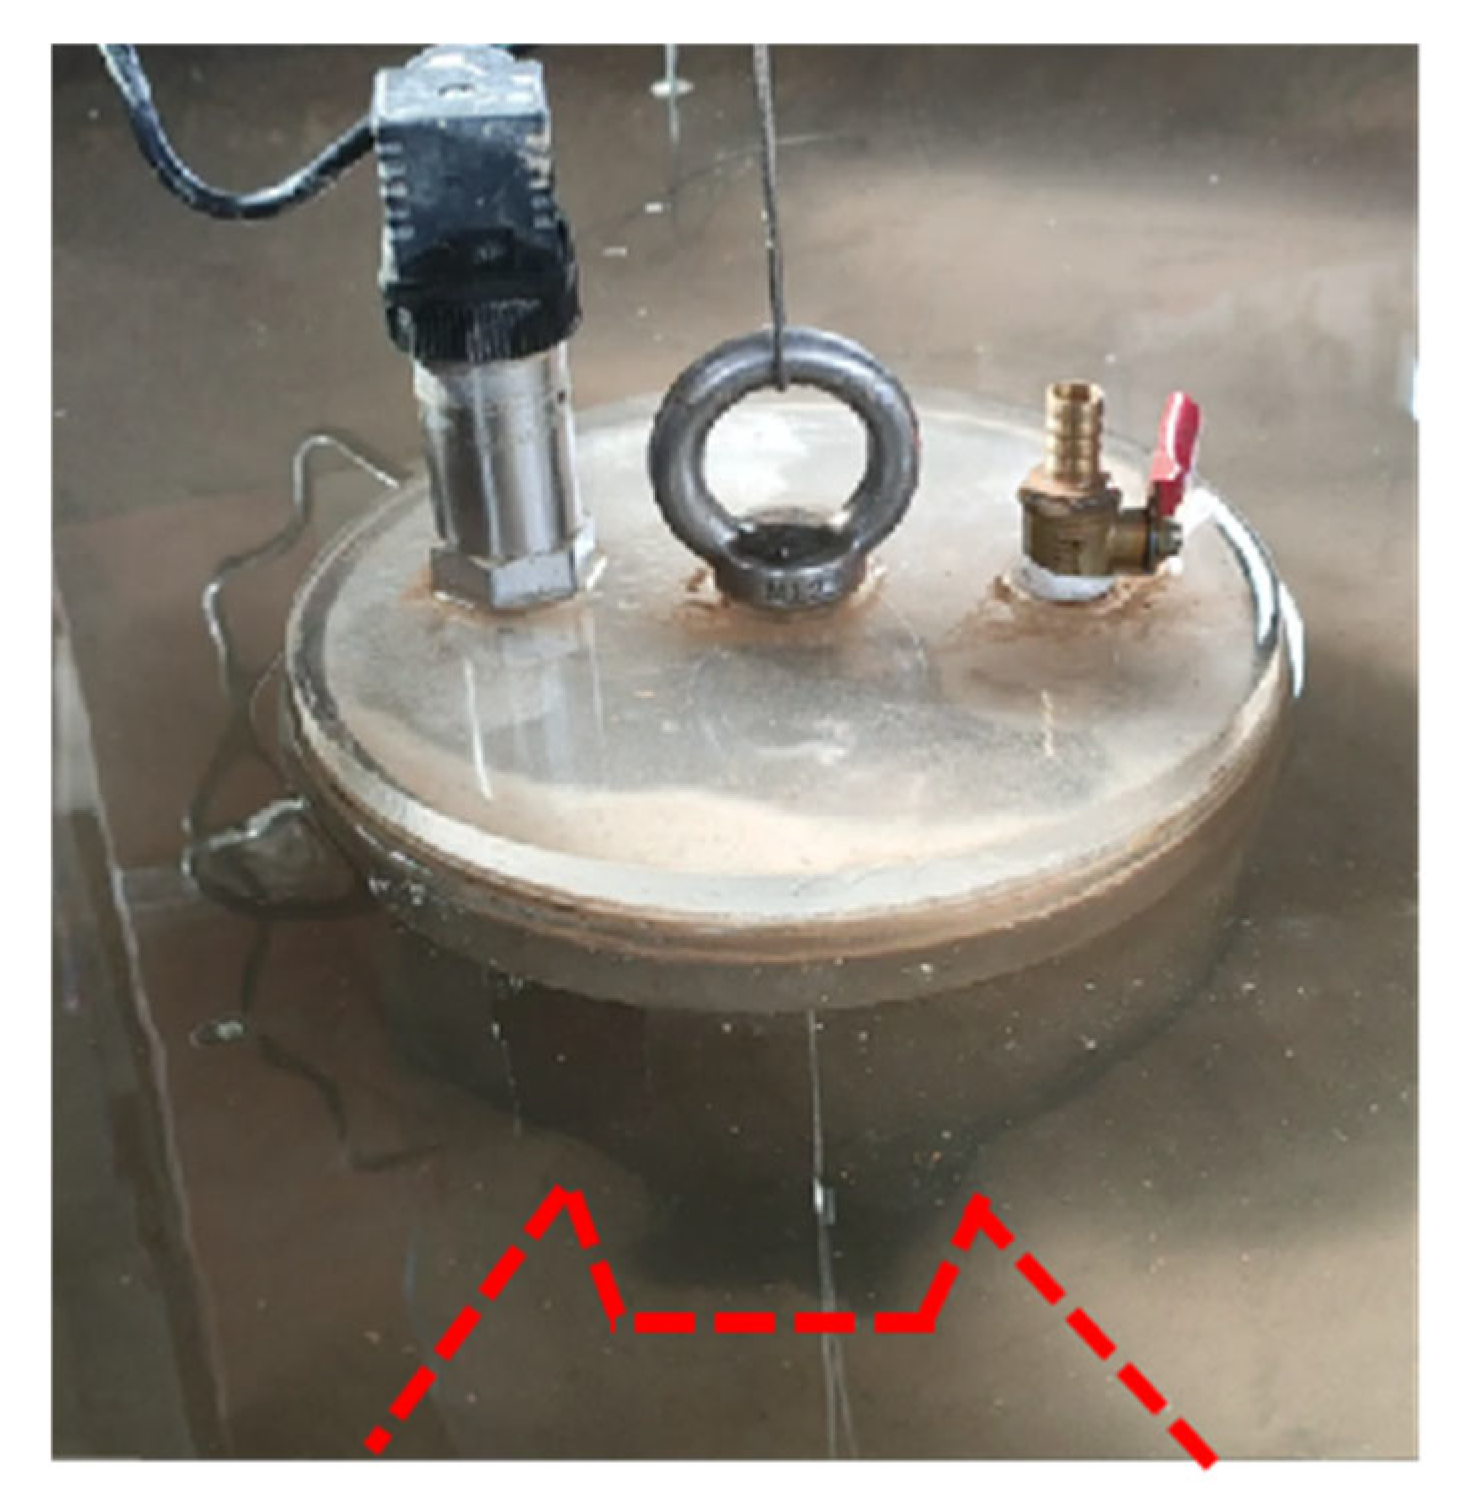
D = 1.5). In these tests, the caisson was fully extracted without carrying the soil plug (
Figure 7). The measured uplift load corresponded primarily to the caisson’s self-weight and any frictional resistance.
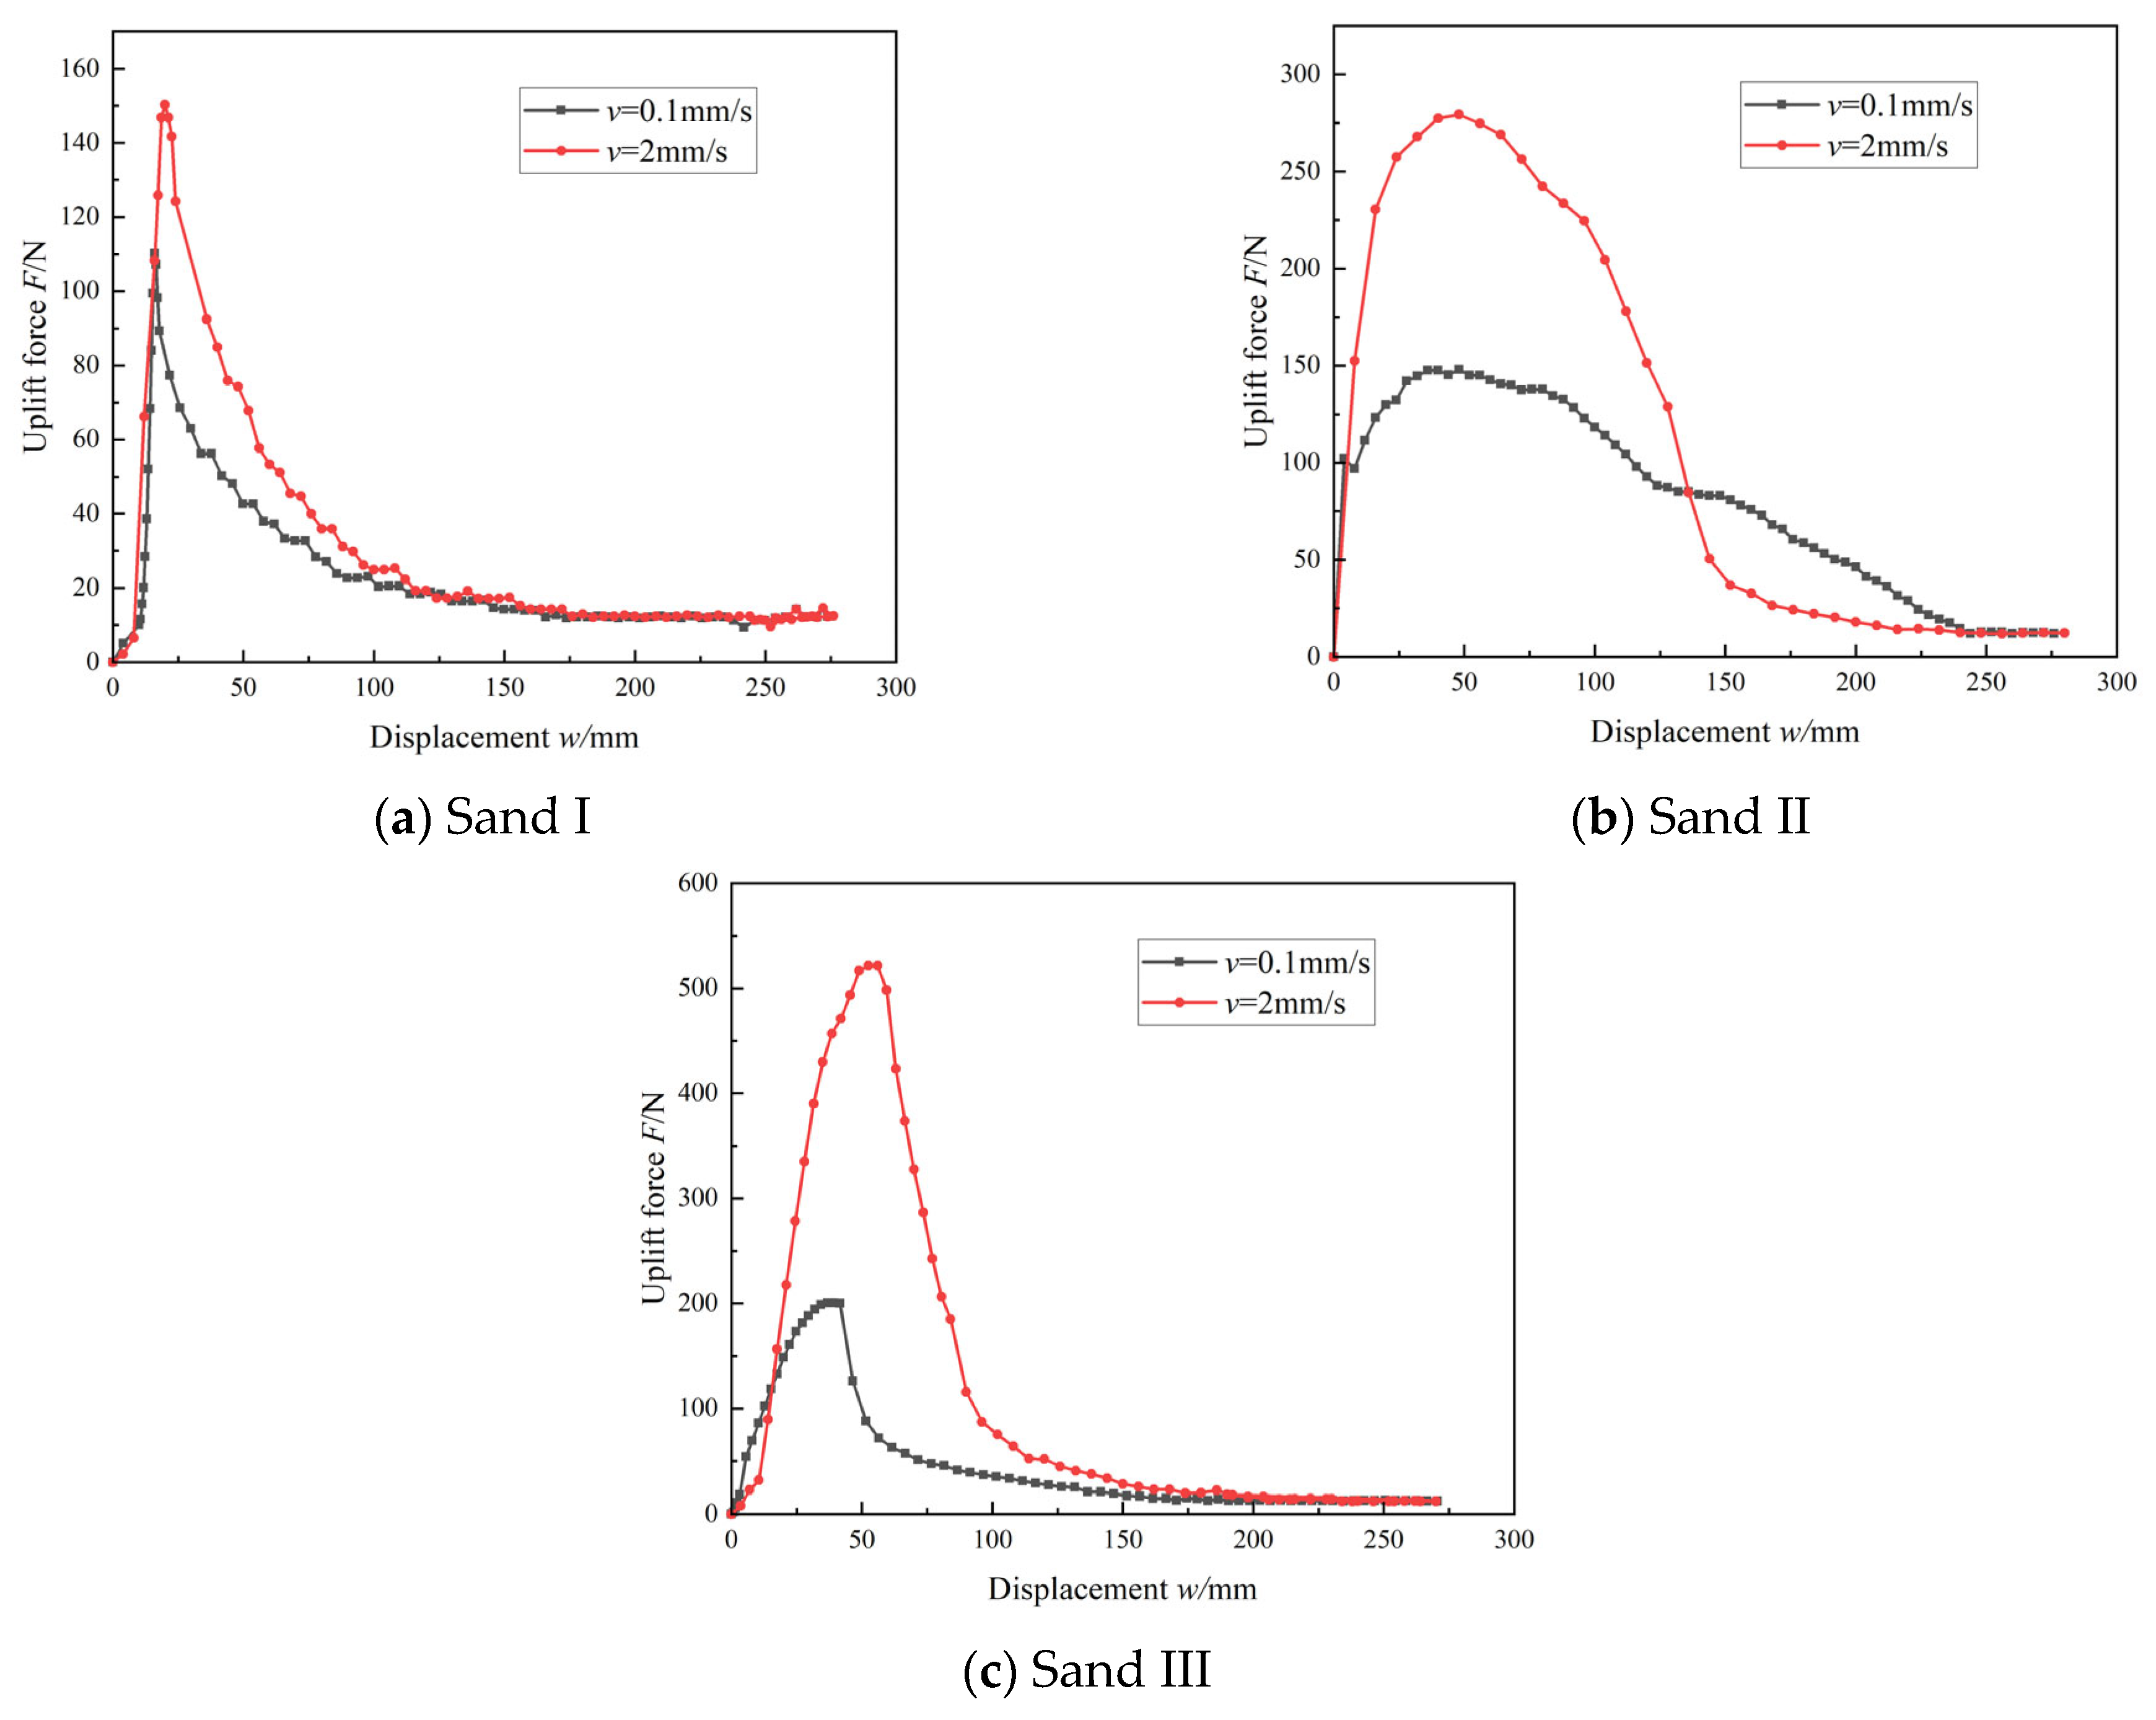
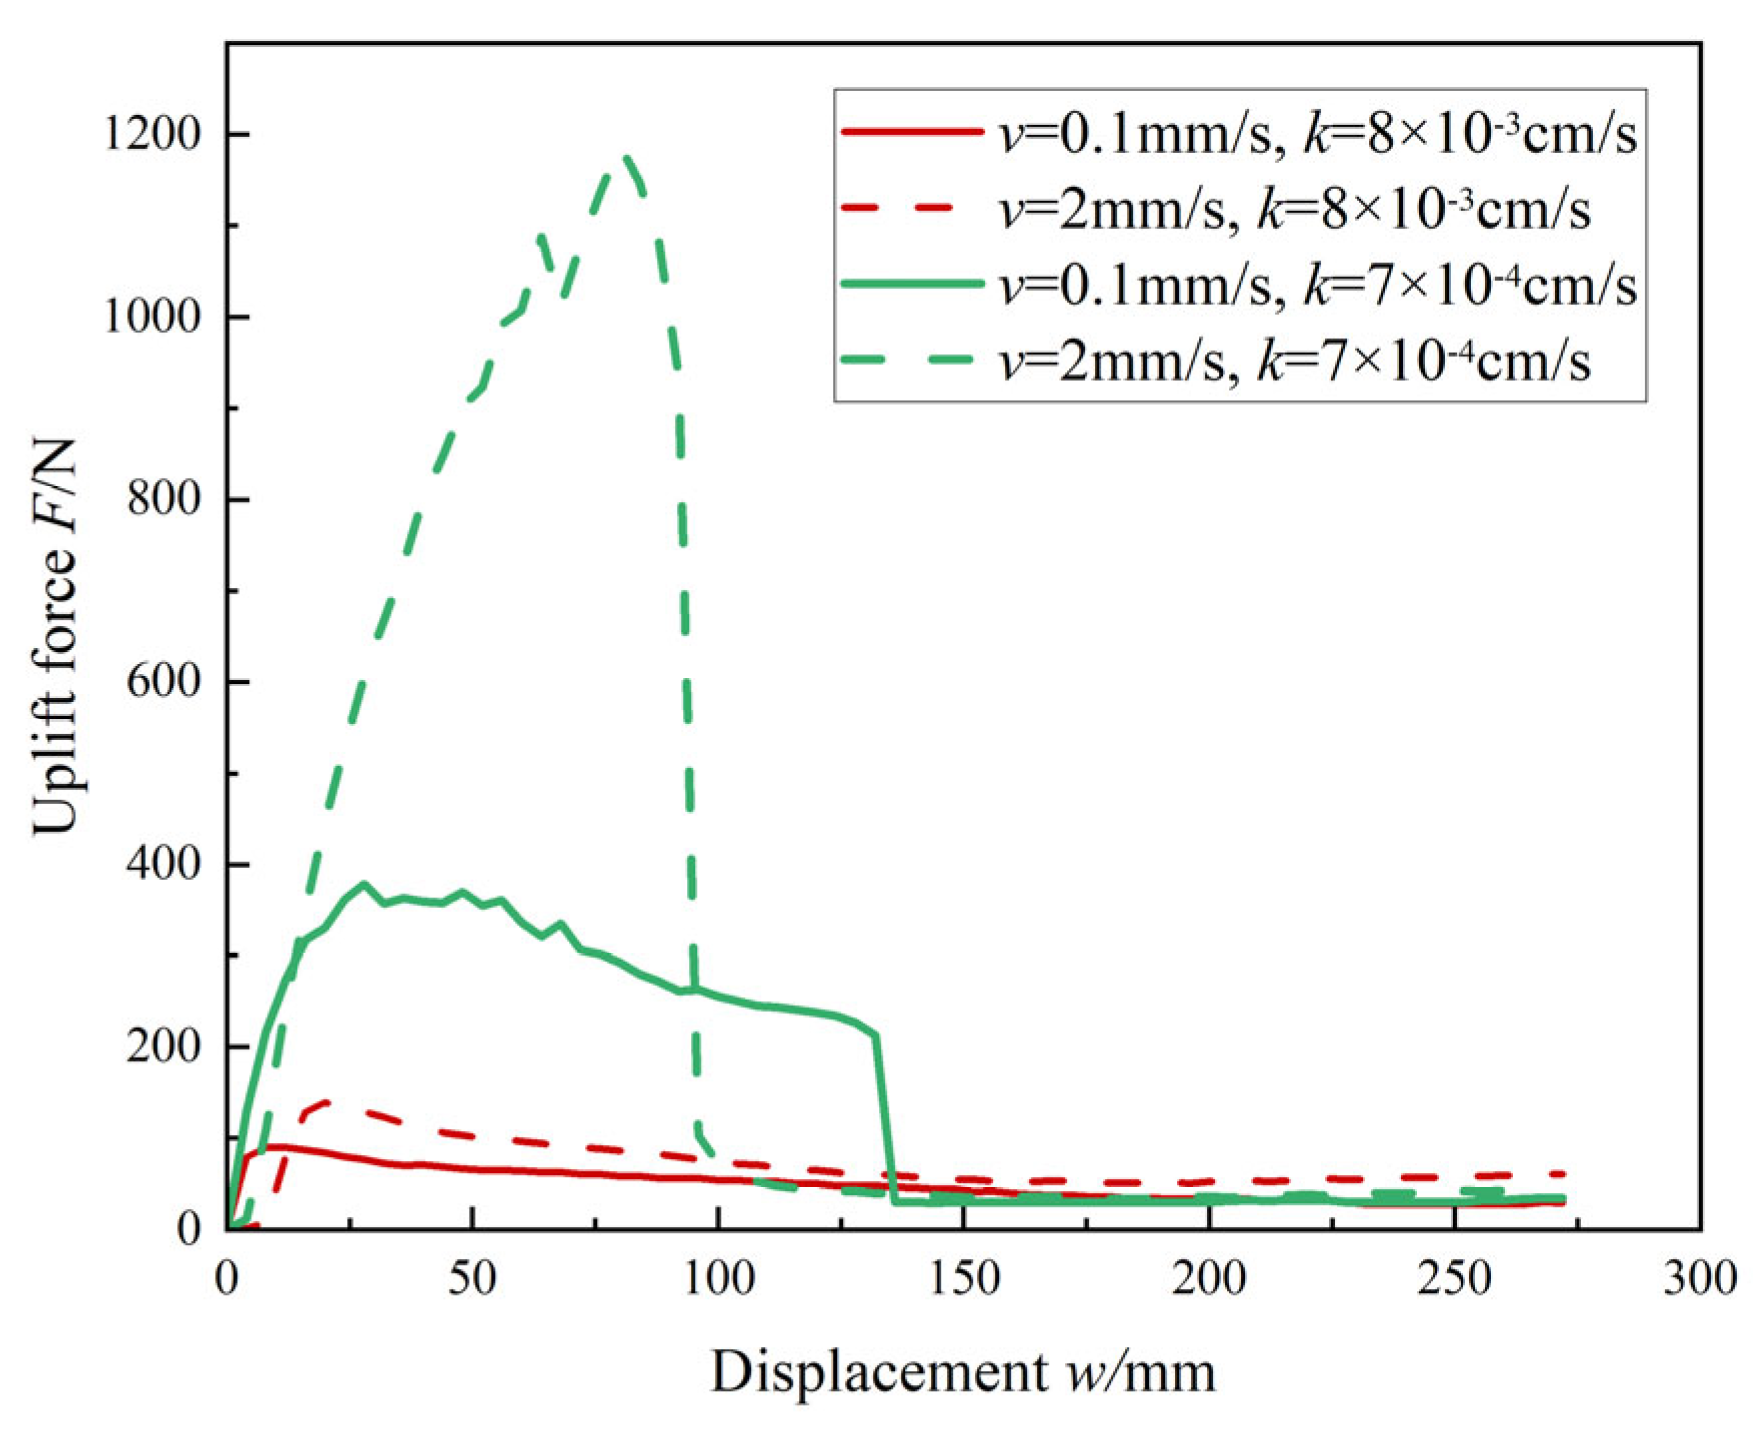
Figure 8 shows the load–displacement curves for different sand types (I, II, and III) under uplift rates of 0.1 mm/s and 2 mm/s. According to the local shear failure mode proposed by Deng et al. [
16], when there is no negative pressure at the lid, the uplift bearing capacity mainly consists of the caisson’s self-weight and shaft friction along both the inner and outer walls. These components should theoretically not be sensitive to the uplift rate. However, test results demonstrated that higher uplift rates resulted in significantly larger uplift loads, particularly in low-permeability soils. This implies that, in addition to shaft friction and self-weight, other resistance mechanisms contributed to the overall uplift resistance.
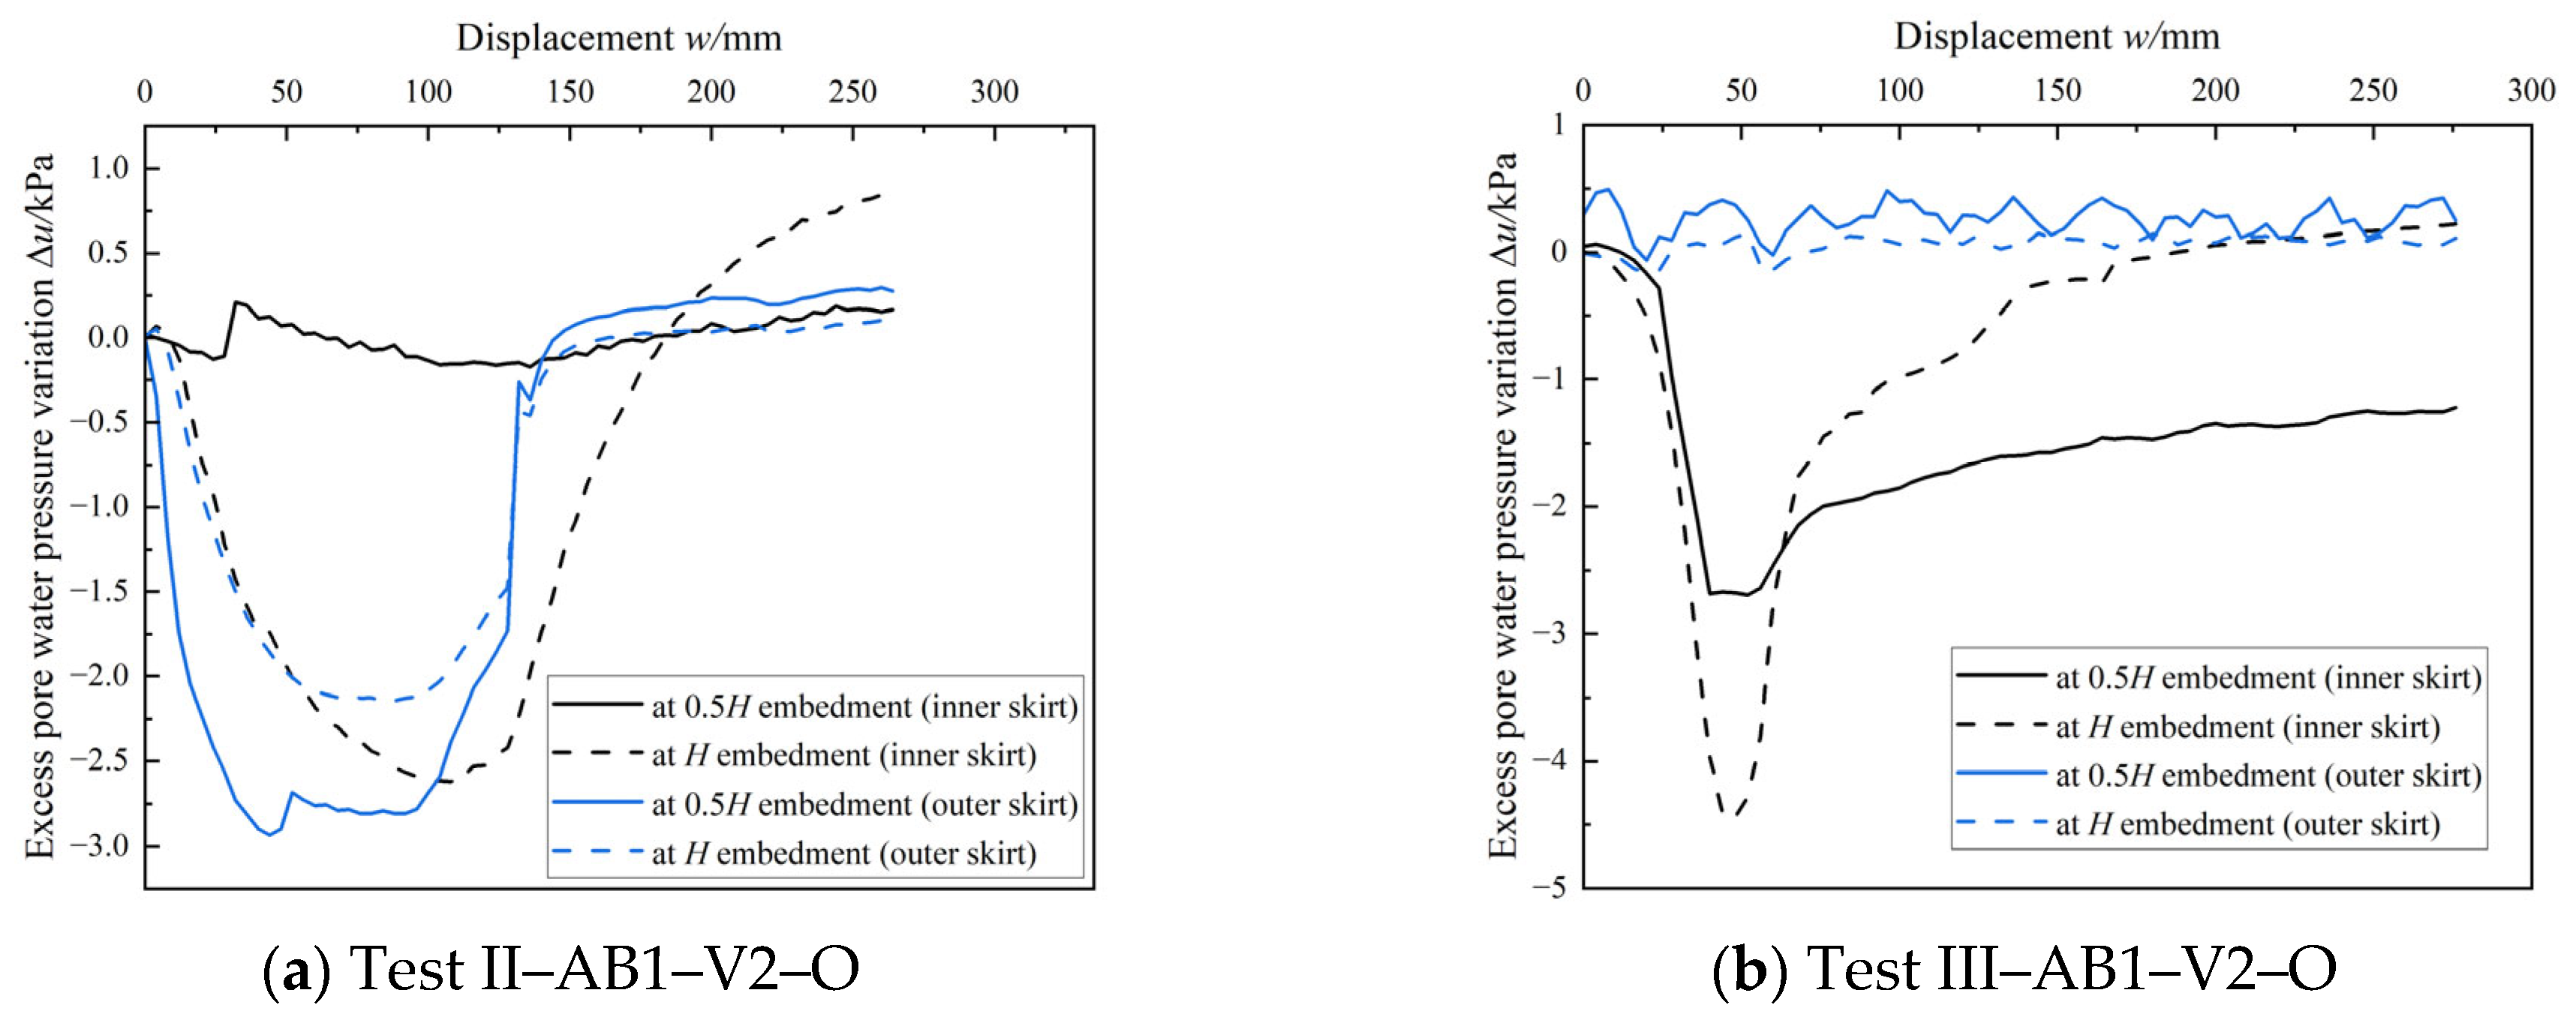
Further analysis of pore pressure data (
Figure 9) showed negative pore pressure developing near the base of the caisson during the 2 mm/s tests. This indicates reverse end-bearing resistance, even without a soil plug. In contrast, no obvious pore pressure change was observed at the lower uplift rate (0.1 mm/s), suggesting the end-bearing effect could be neglected.
Based on these results, shaft friction in each sand type at low uplift rate (0.1 mm/s) was estimated as follows:
- (a)
Sand I (k = 8 × 10⁻³ cm/s): approximately 108.3 N;
- (b)
Sand II (k = 7 × 10⁻⁴ cm/s): approximately 147.84 N;
- (c)
Sand III (k = 7 × 10⁻⁵ cm/s): approximately 200.2 N.
These values show a clear trend of increasing shaft friction with decreasing permeability, which can be attributed to reduced seepage loss and higher effective stress along the bucket-soil interface.
To explore shaft friction evolution during uplift, soil pressure tests were conducted for caisson AB-1 in Sands II and III. Since earth pressure cells can detach or disturb soil during rapid motion, tests were conducted at an uplift rate of 0.1 mm/s with a target displacement of 30 mm. All measurements were recorded as relative changes, with the system zeroed before testing.
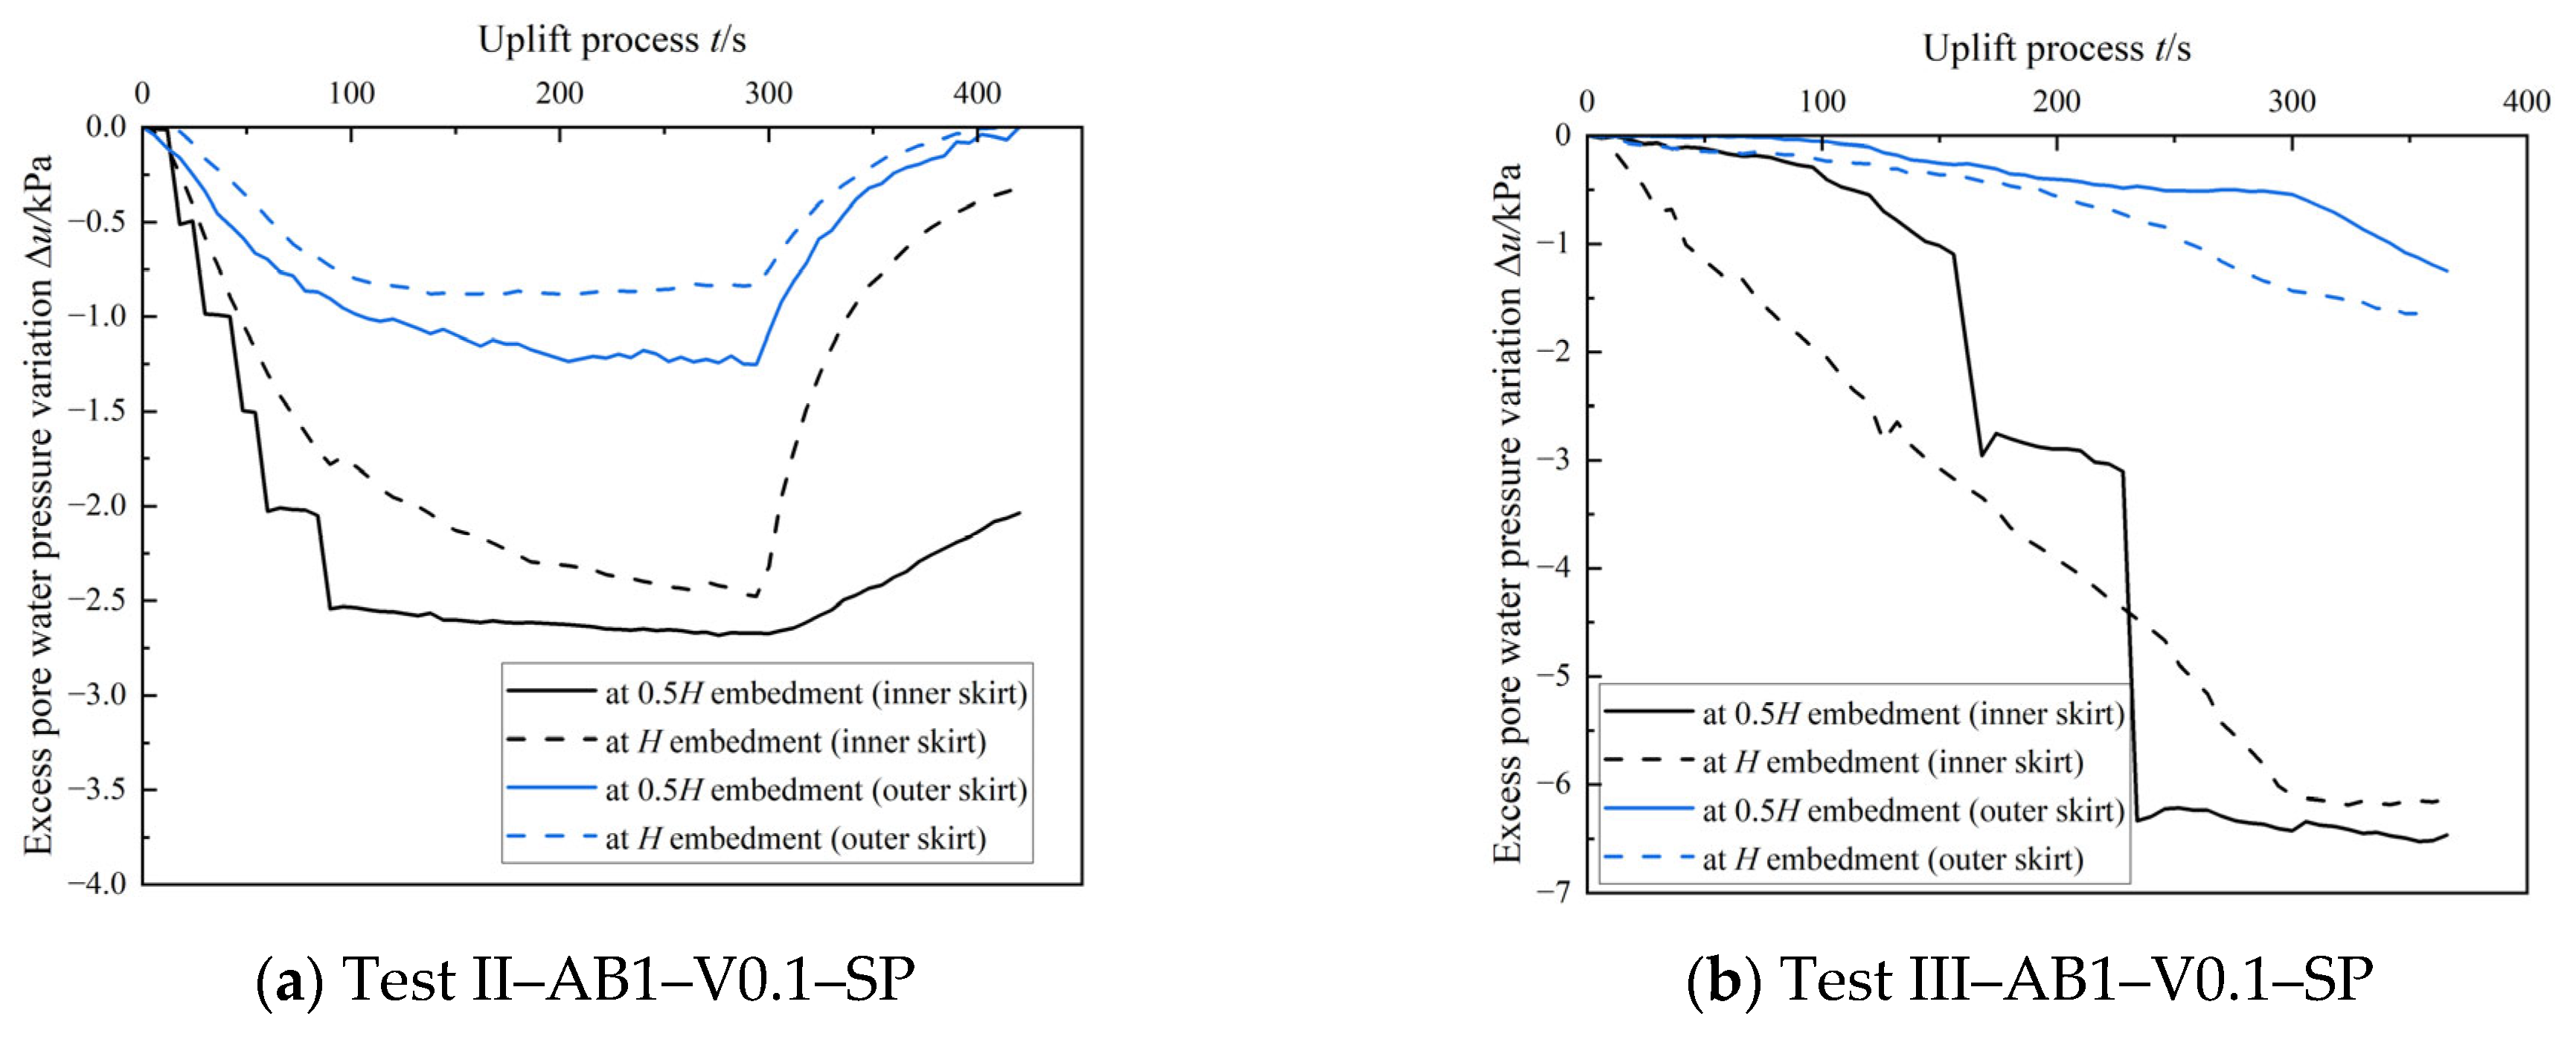
As shown in
Figure 10, pore water pressure on both the inner and outer sides of the caisson gradually decreased, eventually becoming negative. For Sand II, pore pressures at 0.5
H and
H depths inside the caisson were −2.68 kPa and −2.48 kPa, respectively. For Sand III, corresponding values were −6.52 kPa and −6.19 kPa. The pressure gradient was small in both cases, indicating uniform negative pressure distribution inside the caisson. Moreover, the magnitude of negative pressure increased with decreasing permeability.
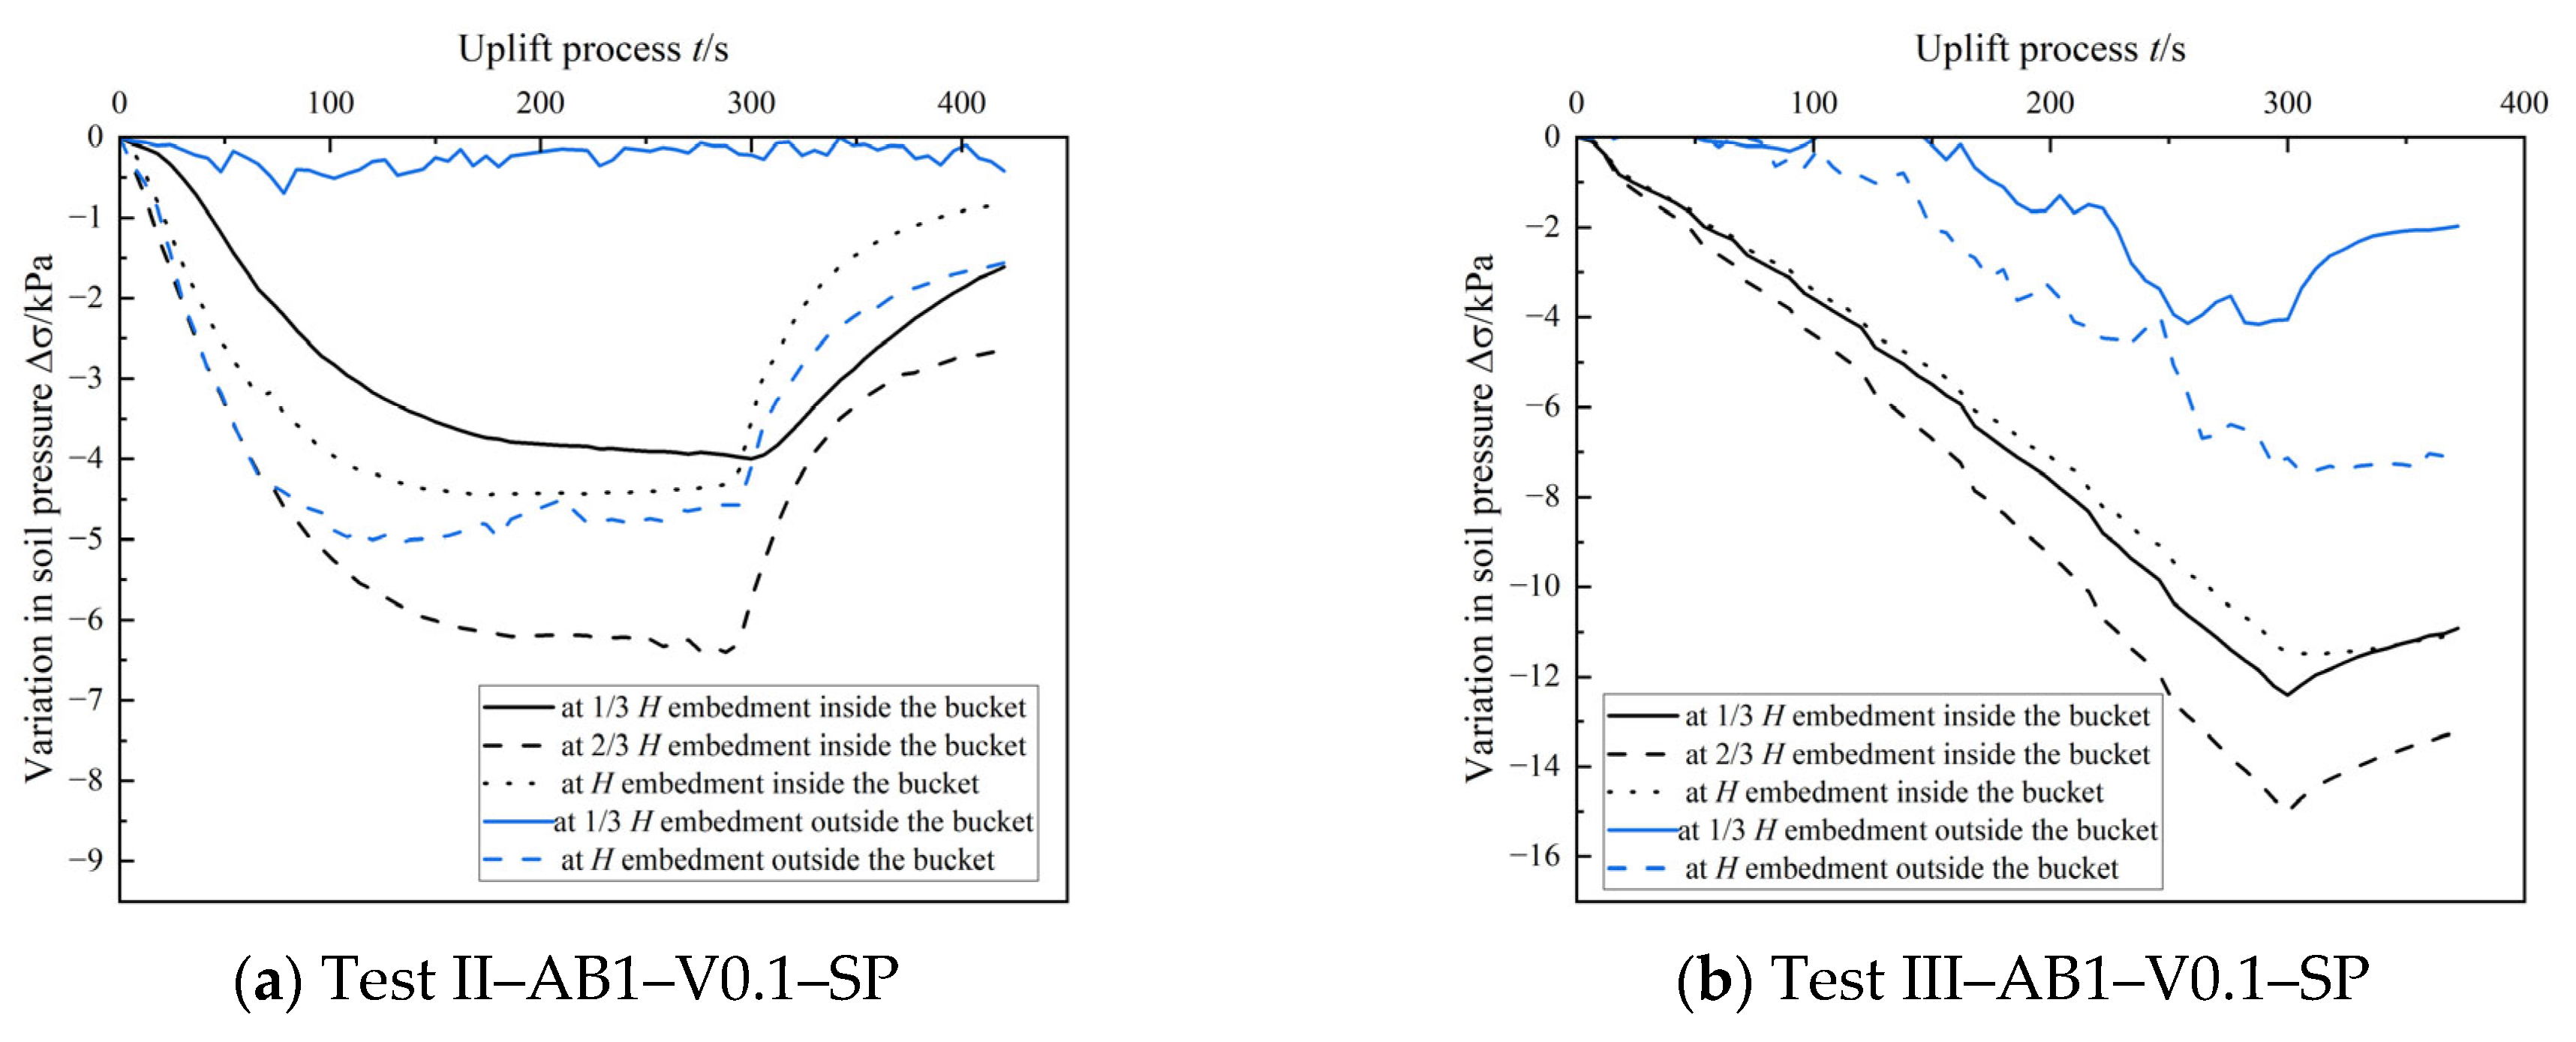
The soil pressure variations measured during uplift are shown in
Figure 11. Some abnormal values were excluded from analysis (e.g., outer 2/3
H sensor in Test II, and outer 1/3
H sensor in Test III). In general, soil pressure decreased with uplift, and the reduction was more pronounced on the inner wall.
Since total stress was measured by the sensors, and frictional resistance depends on effective stress, effective stress was estimated based on the difference between total and pore water pressure at each depth. The results are summarized in
Table 7.
In all cases, the reduction in effective stress was greater in Sand III than in Sand II, and the greatest drop occurred at the 2/3H position inside the caisson. Overall, the inner wall experienced more stress reduction than the outer wall, and this difference became more prominent in lower-permeability soils.
This trend may be attributed to the negative pressure formed inside the caisson, as well as upward drag forces. These results suggest that using pre-uplift effective stress alone may underestimate or misrepresent the actual shaft resistance, especially under partially drained or undrained conditions.
3.1.2. Results of Closed-Top (Sealed-Lid) Uplift Tests
As revealed in the vented-lid tests, the total uplift resistance F primarily consists of the bucket self-weight
Wf, inner and outer shaft friction
Fs, and reverse end bearing resistance
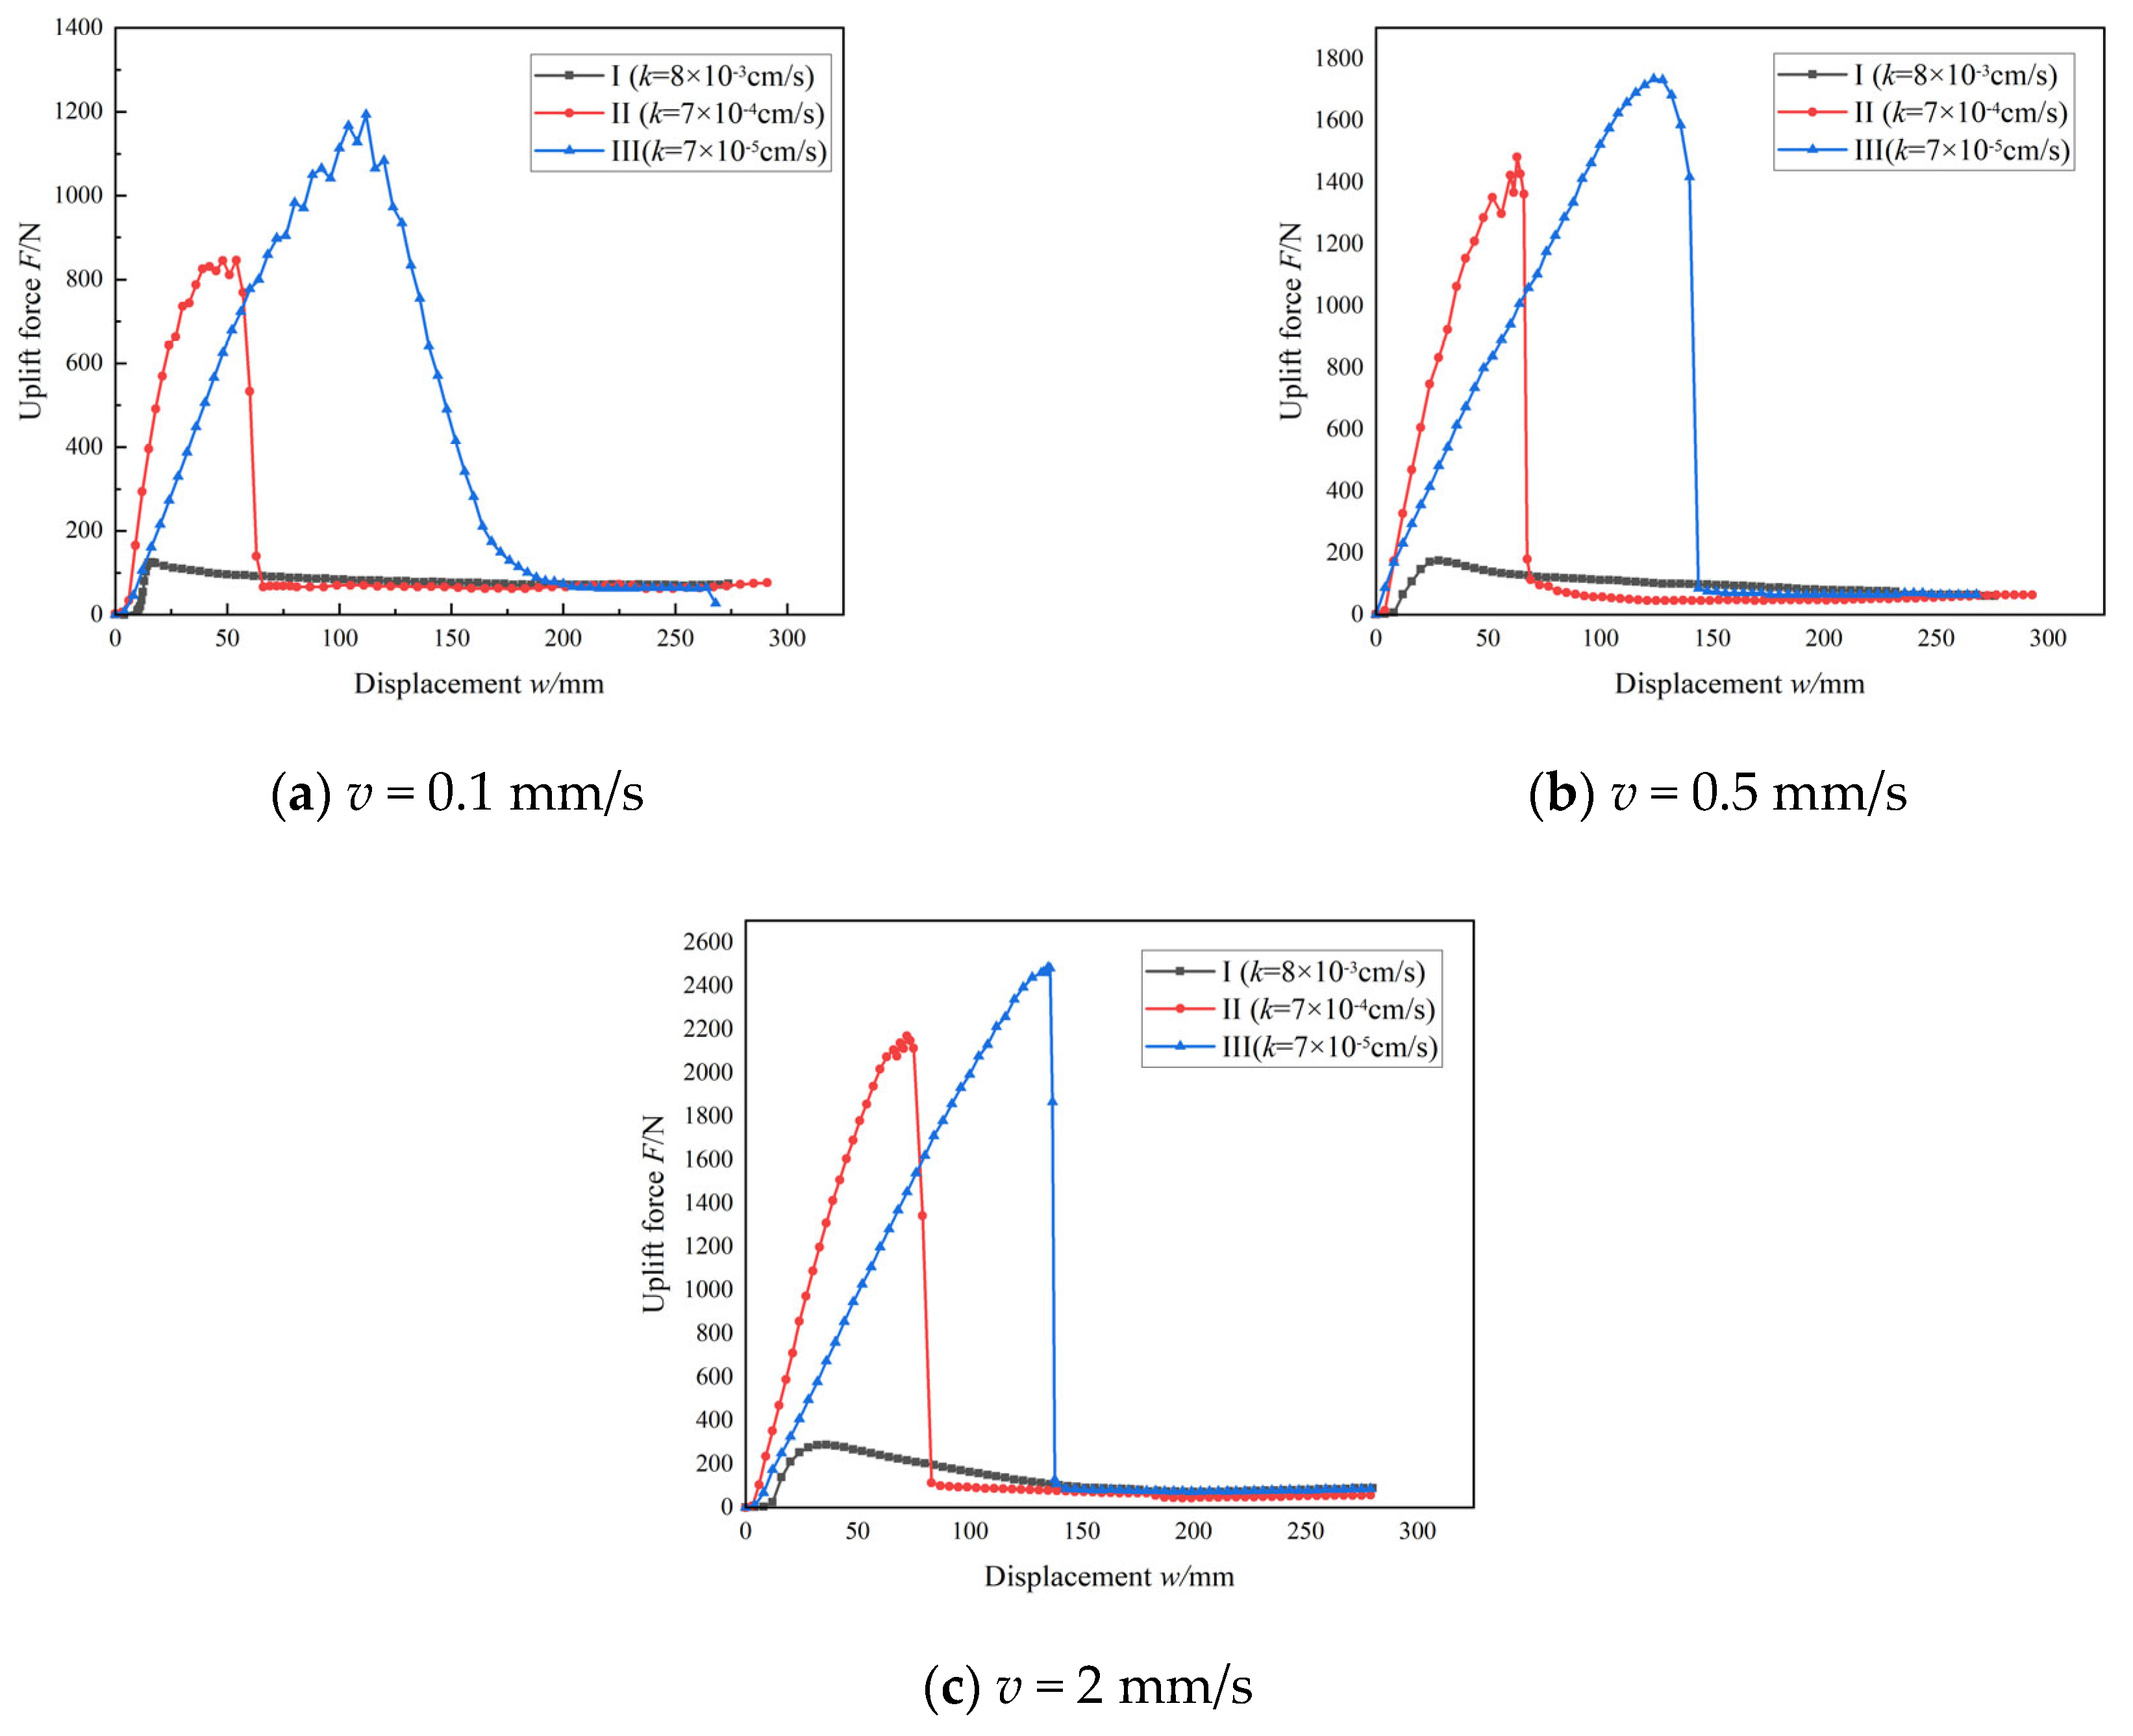
Ffb (excluding the soil plug). In Sand I, under an uplift rate of 0.1 mm/s, the excess pore water pressure remained nearly constant, allowing the end bearing resistance to be considered negligible. Thus, the load–displacement curve primarily reflects the evolution of shaft friction, which peaked at 110.2 N when the displacement reached 16 mm, indicating full mobilization of shaft friction (
Figure 8a).
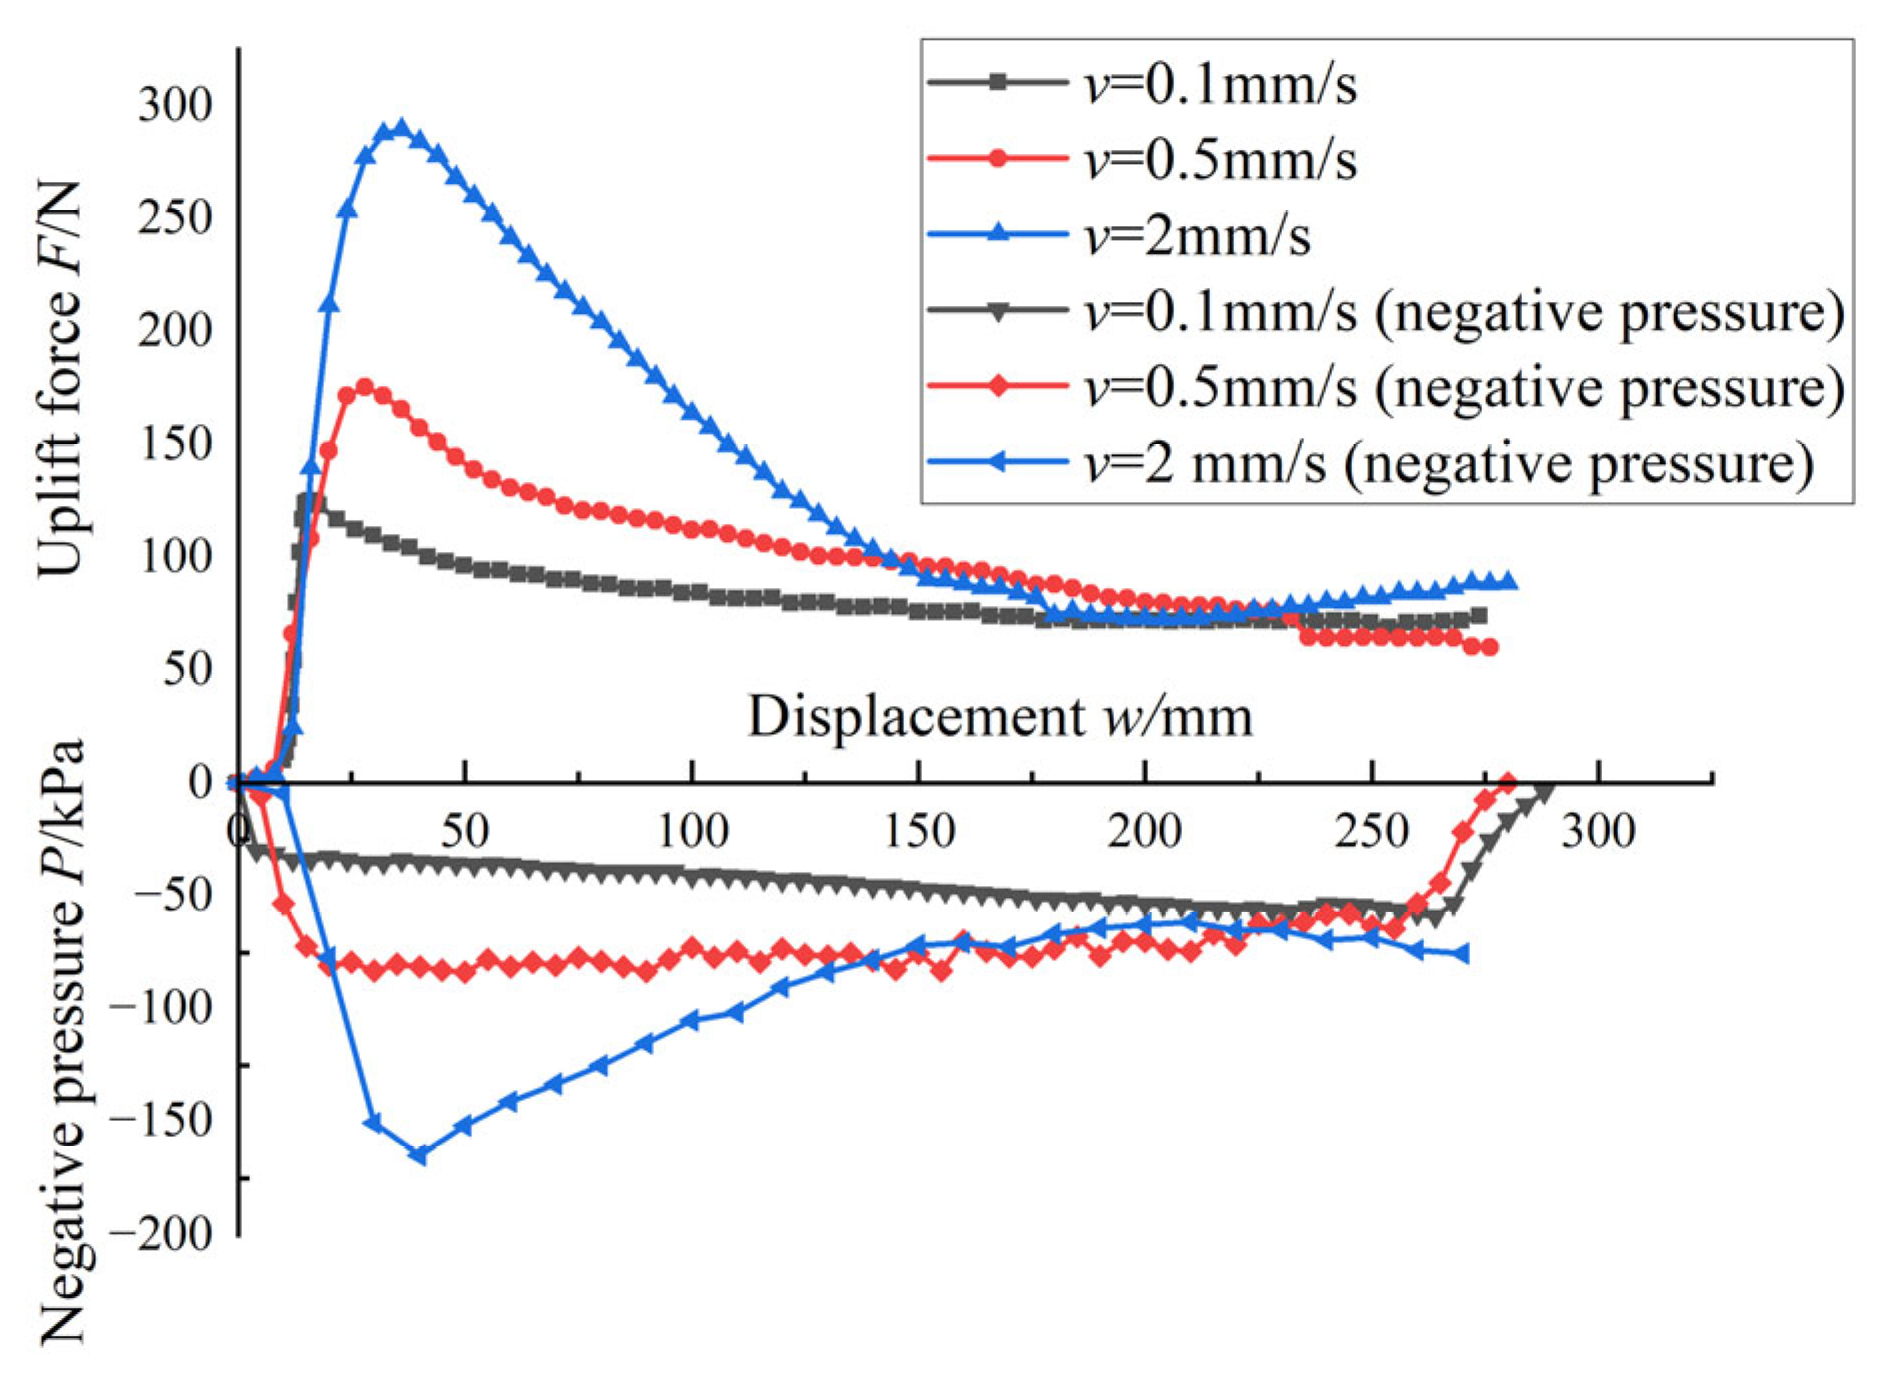
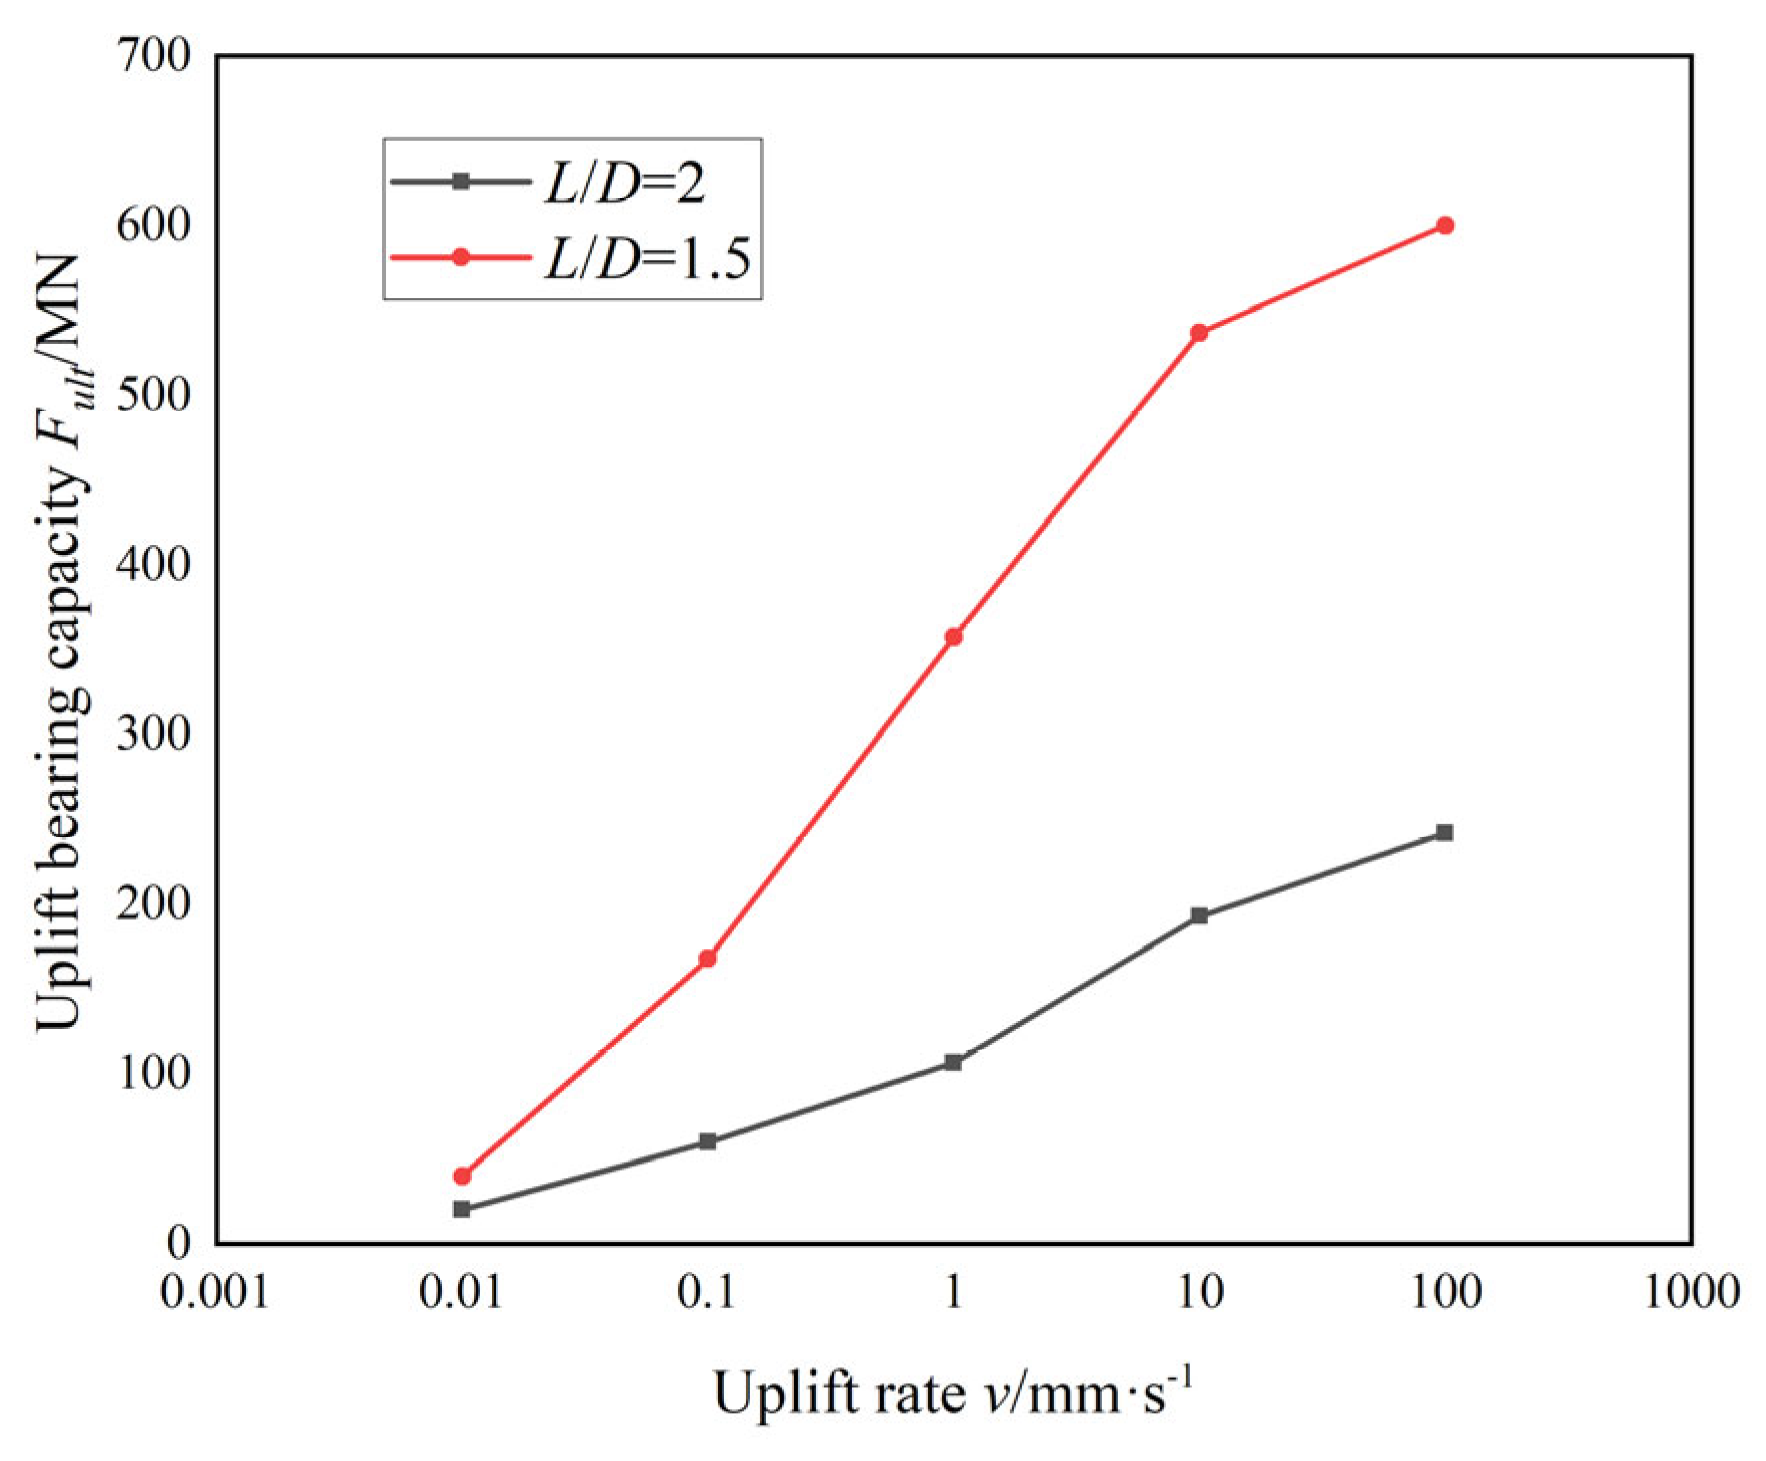
In the sealed-lid uplift tests, load and negative pressure at the bucket lid were recorded under different uplift rates (
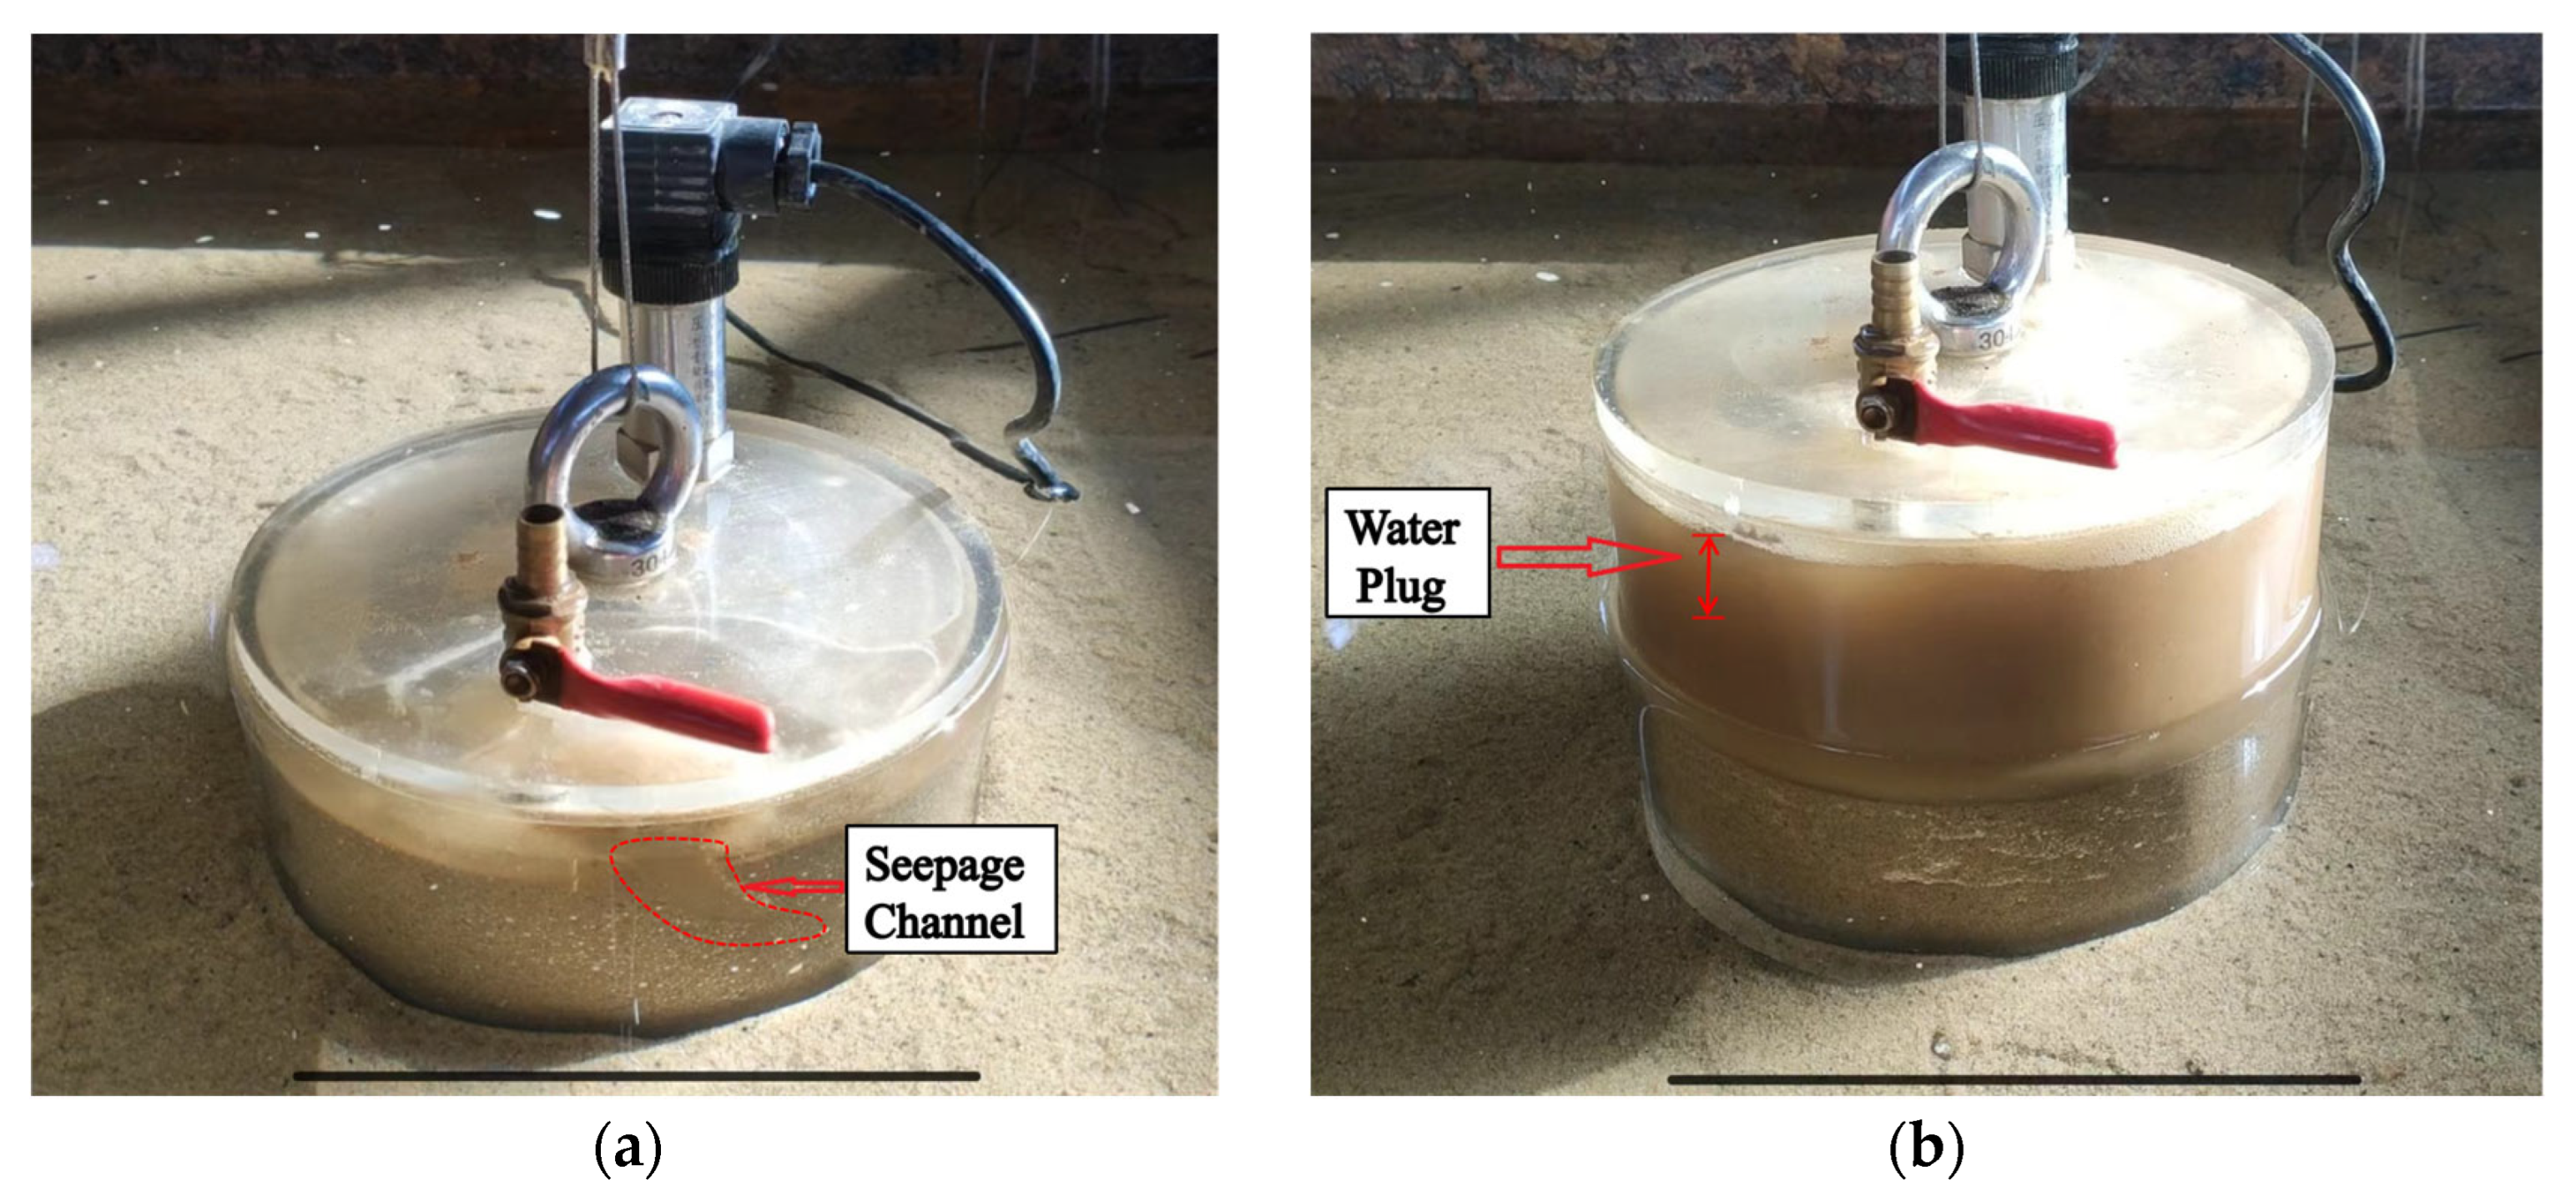
Figure 12). At 0.1 mm/s, the test condition corresponded to fully drained behavior, and failure occurred through localized shear. Initially, a water plug formed within the bucket. As uplift progressed, the contact area between the soil and shaft decreased, leading to a reduction in shaft friction. Meanwhile, the elevation difference between the water plug and the free surface increased, requiring higher negative pressure to maintain equilibrium. When uplift reached 175 mm, the load stabilized, suggesting complete loss of shaft friction. At this point, the uplift resistance was mainly attributed to the weight of the bucket and the water plug, with the surrounding soil becoming disturbed and detached.
When the uplift rate increased to 0.5 mm/s, noticeable negative pressure developed at the bucket lid, indicating partially drained conditions. At the initial stage, the soil plug was dragged upward, providing additional end resistance. The uplift load and negative pressure peaked simultaneously at a displacement of 28 mm, with values exceeding those in the 0.1 mm/s test (
Figure 12). Observations (
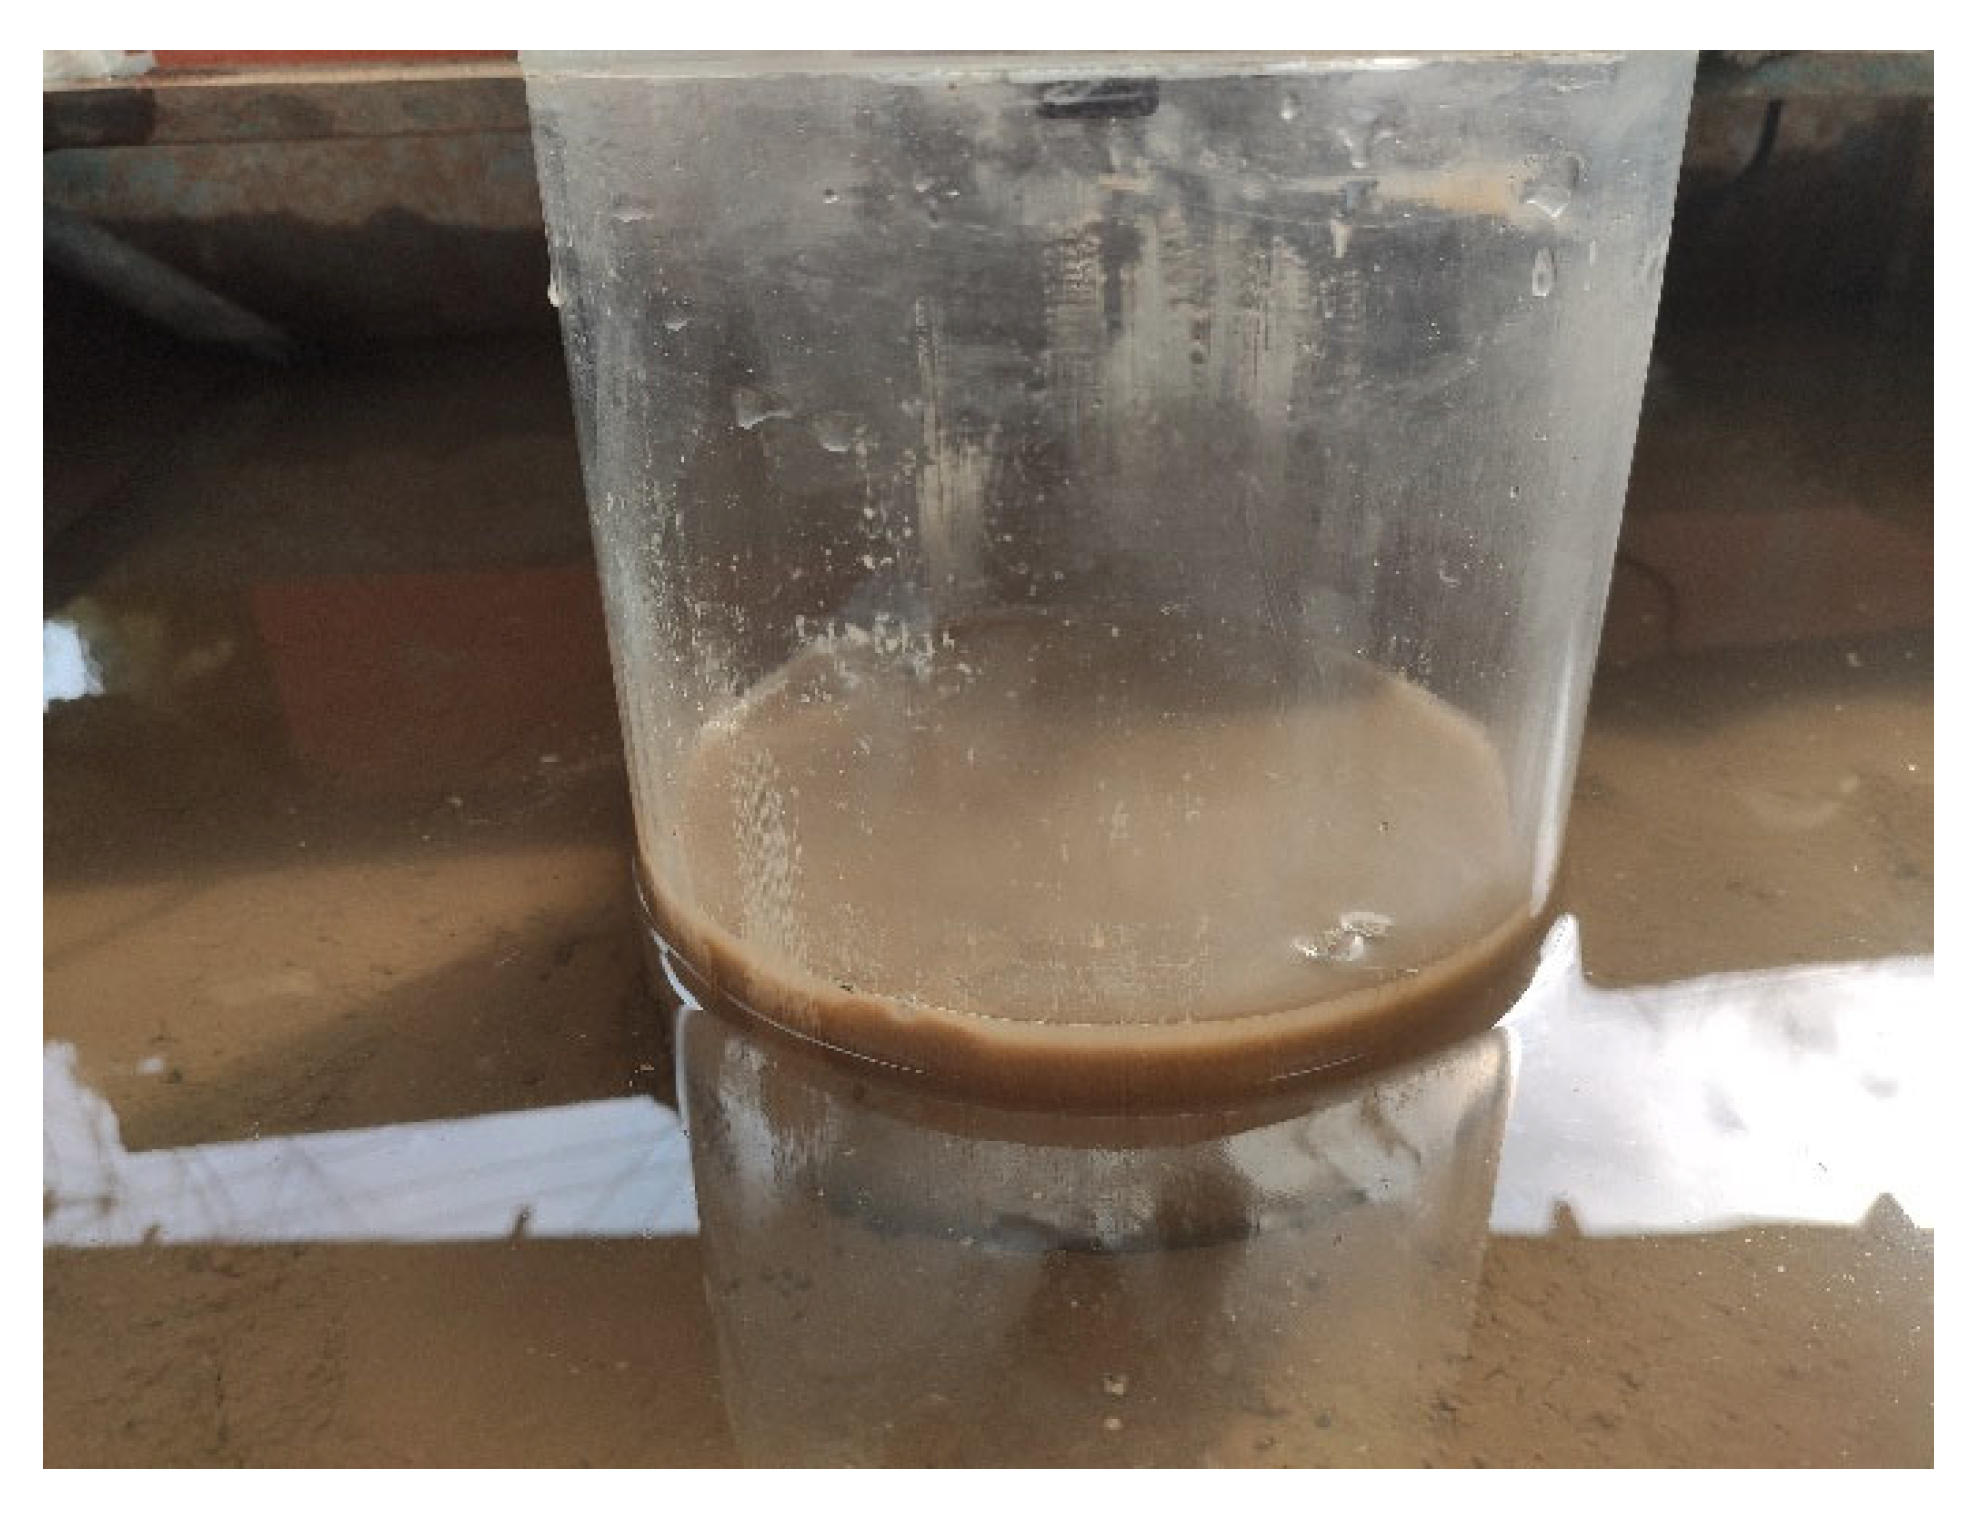
Figure 13) revealed the formation of seepage channels between the inner wall and the soil plug, through which sand particles were carried upward. The space between the lid and the plug was rapidly filled with water. After this stage, the height of the soil plug remained unchanged, and end resistance gradually dissipated, causing the load to decline. However, the sustained seepage maintained high negative pressure, contrasting with the fully drained case.
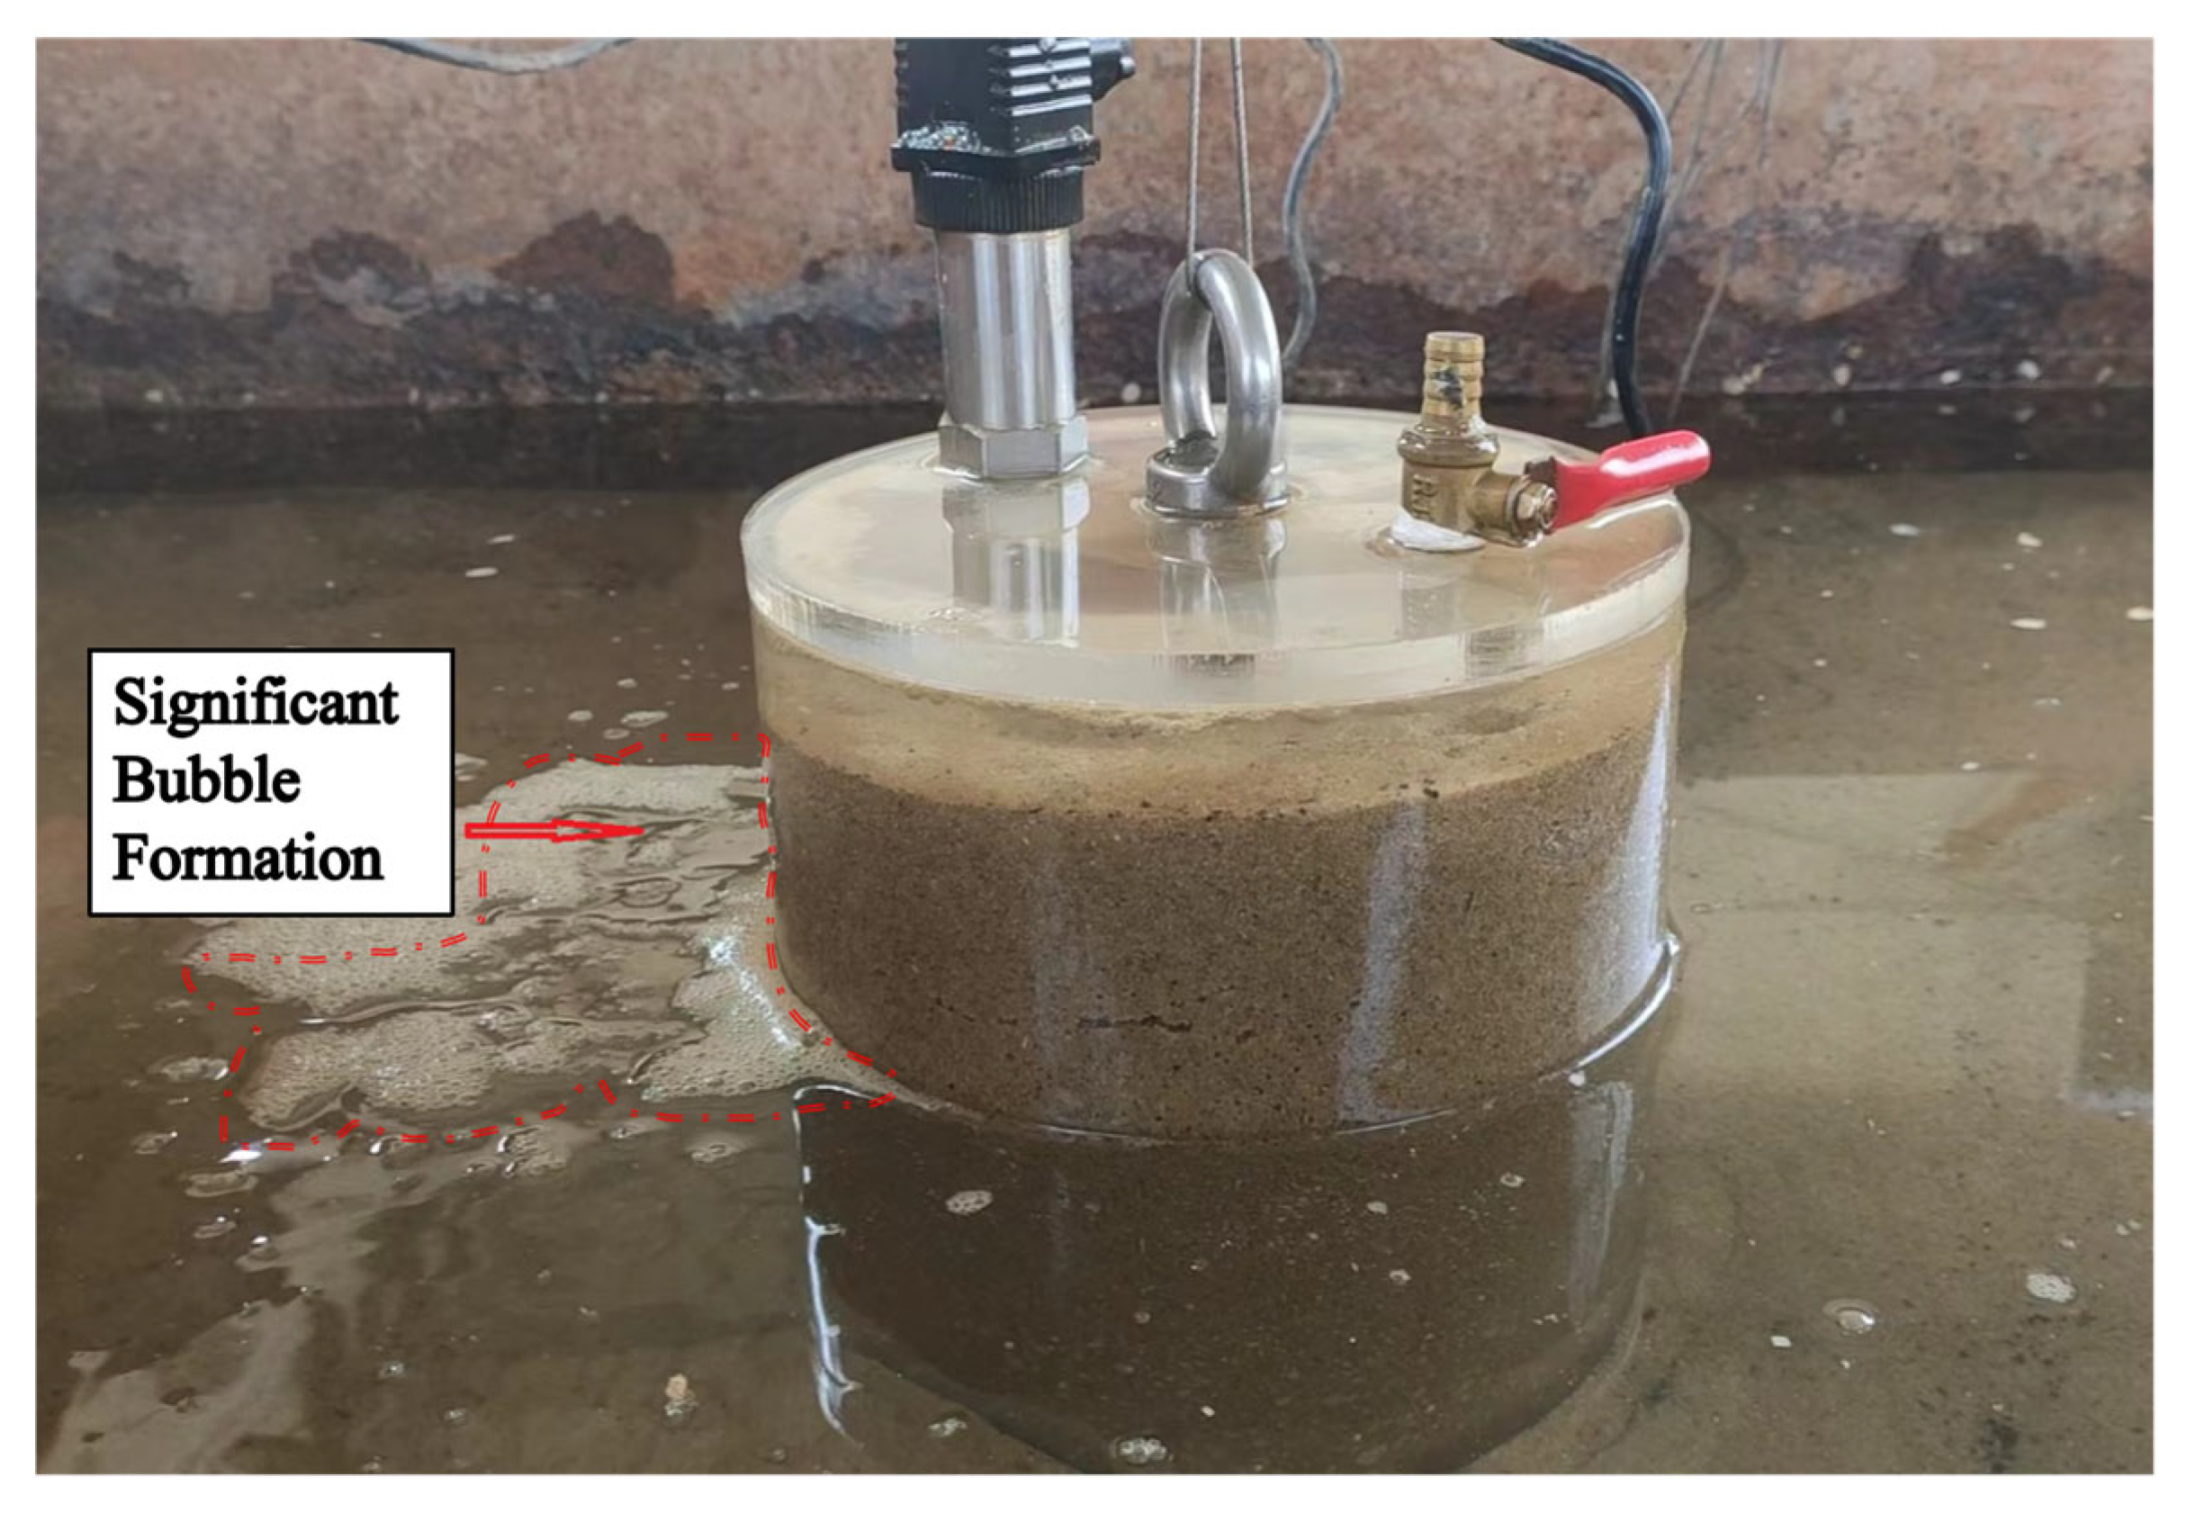
At a higher rate of 2 mm/s, suction developed before the uplift capacity reached its peak, indicating the test remained under partially drained conditions. The soil plug was also pulled out. At 36 mm of uplift, both uplift load and negative pressure reached maximum values. Air bubbles were observed outside the bucket, suggesting the development of seepage channels along the outer shaft wall (
Figure 14), although no significant seepage failure was observed within the soil plug. After the peak, the plug continued to rise, but both load and suction dropped sharply, indicating rapid dissipation of bottom resistance.
In Sand II (k = 7 × 10
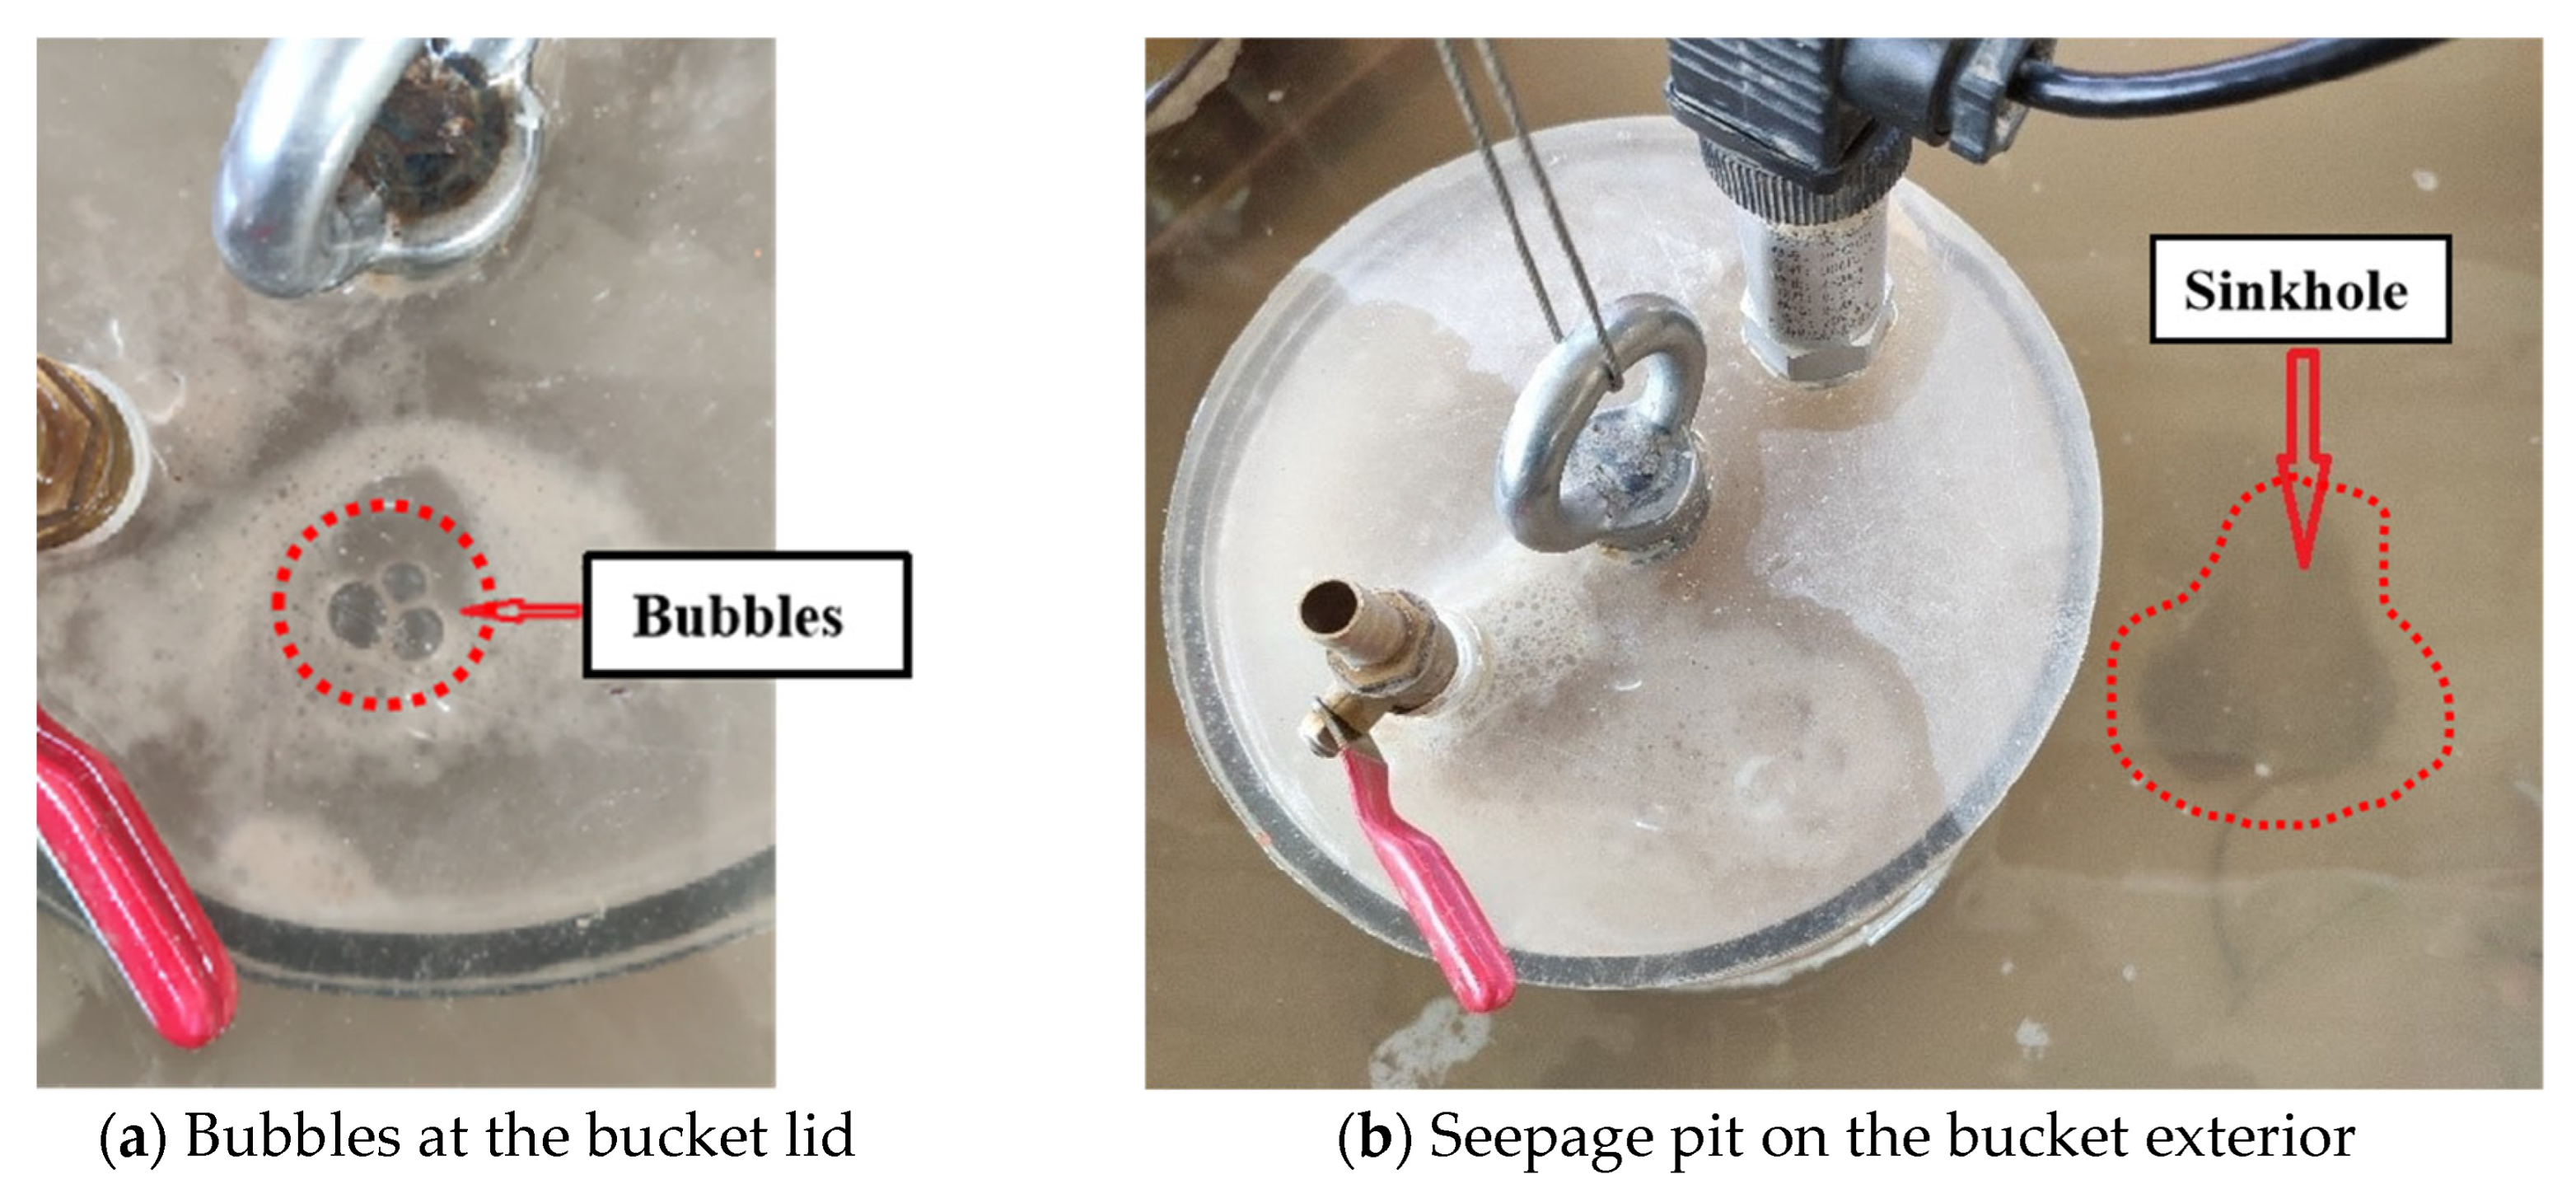
−4 cm/s), sealed-lid uplift tests showed that under 0.1 mm/s loading, clear suction developed at the lid, implying partially drained conditions. The soil plug was pulled upward early in the test, and both uplift load and negative pressure rose sharply, then entered a plateau stage before peaking at 54 mm displacement (
Figure 15). Seepage was observed from the top of the bucket, and a pit formed 0.25
D away from the shaft wall, accompanied by visible seepage (
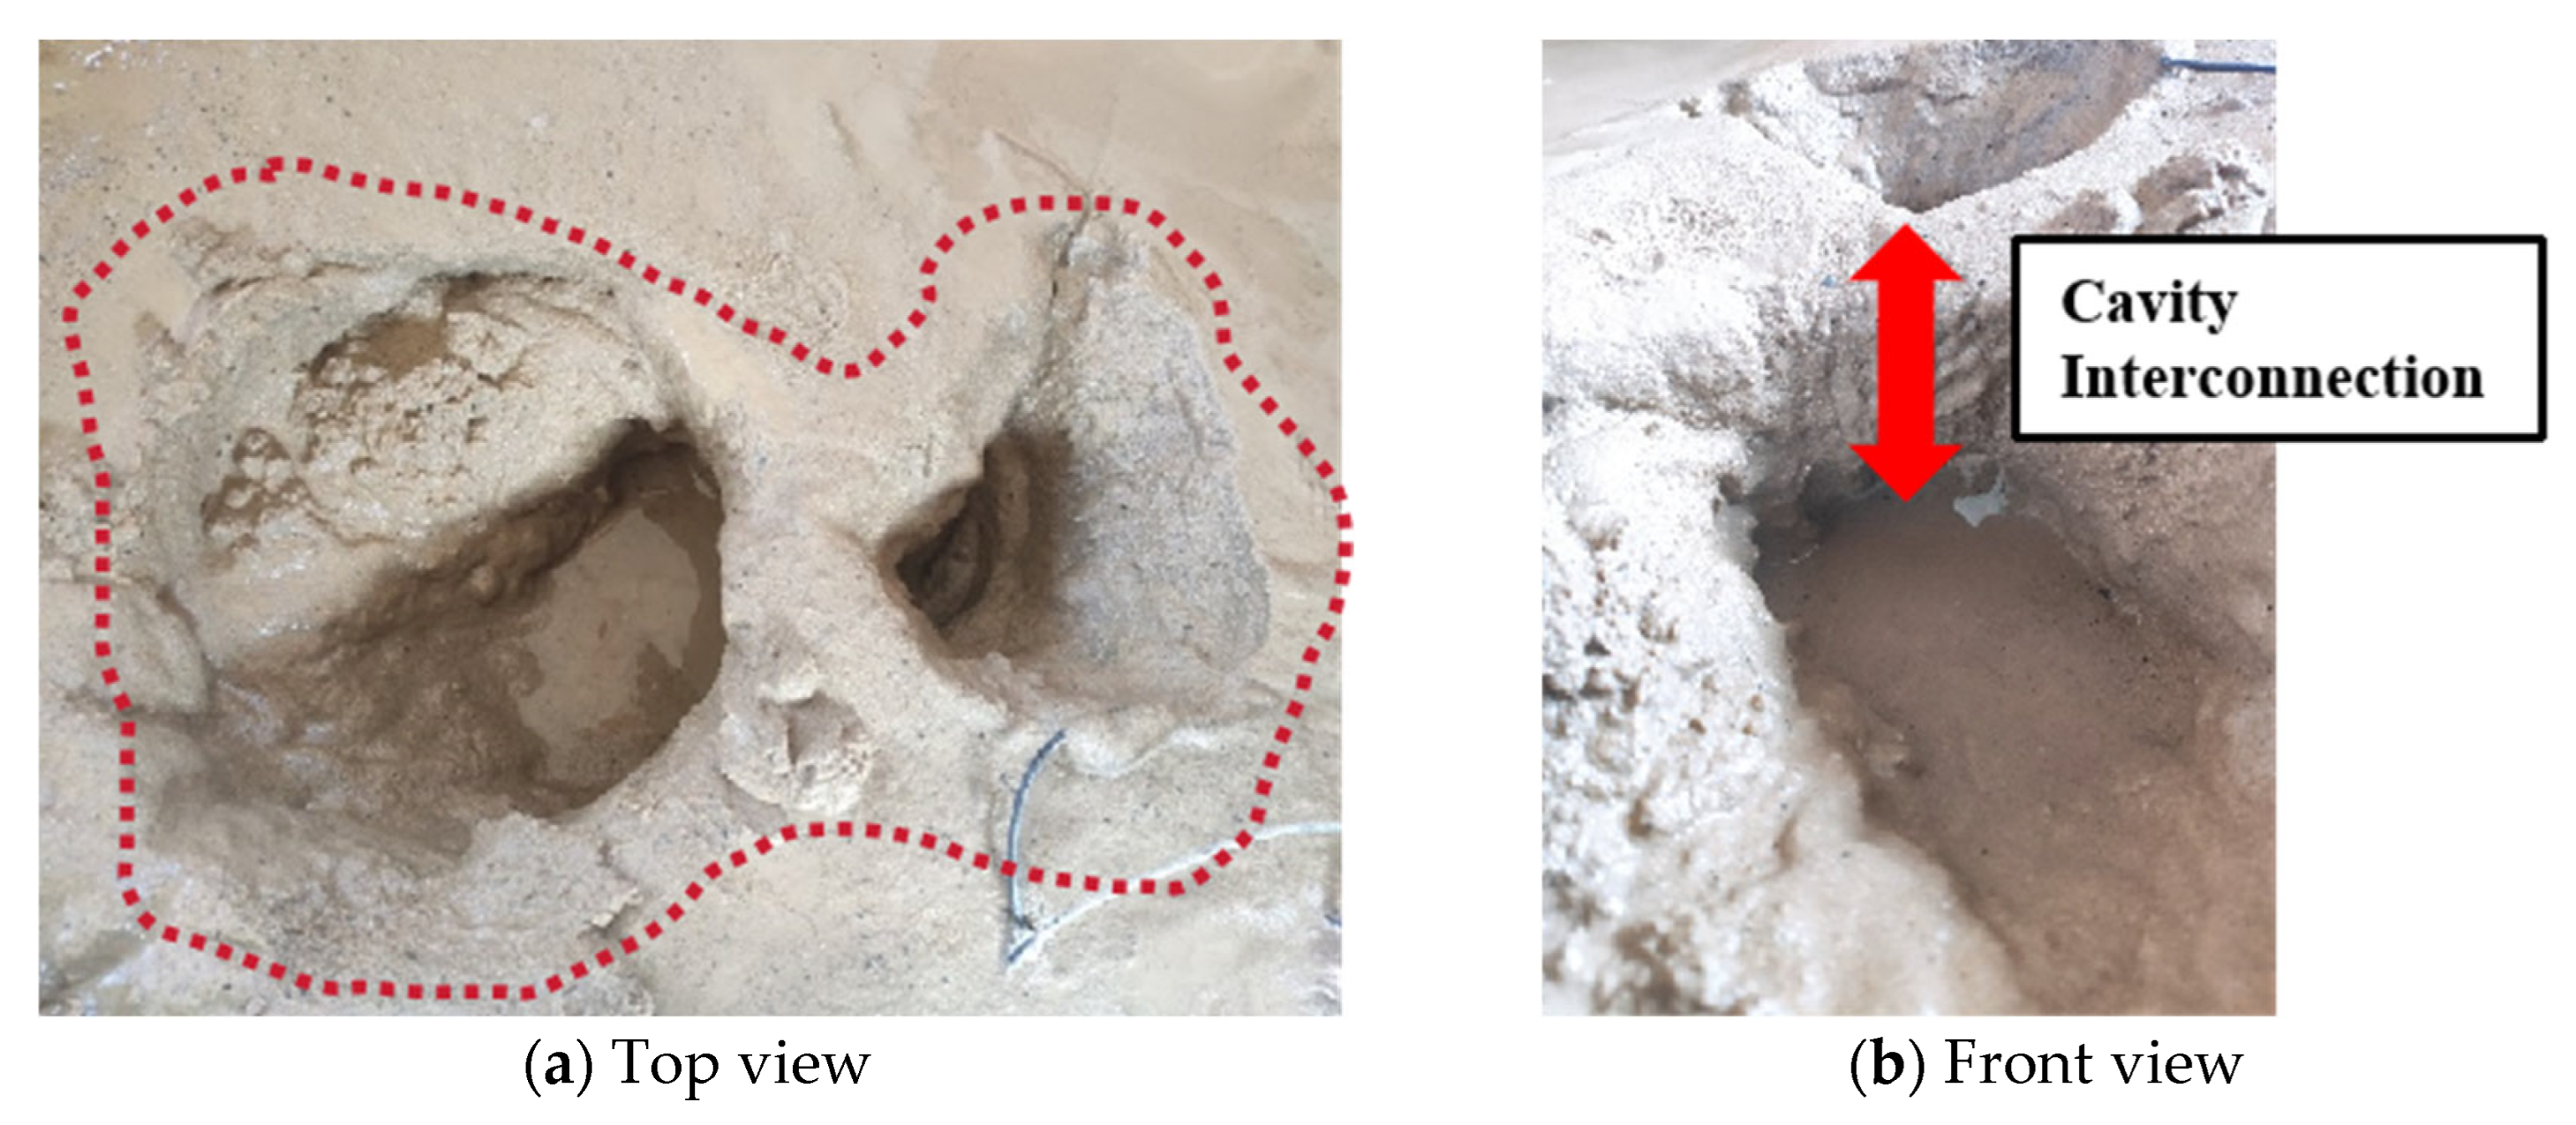
Figure 16). After peaking, bottom resistance rapidly dissipated, and both load and suction dropped to near zero. After the test, the water in the box was drained to observe residual failure features. A pit was found to have penetrated from the ground surface to the outer wall of the bucket (
Figure 17), validating a through-going failure path formed by negative pressure-driven seepage.
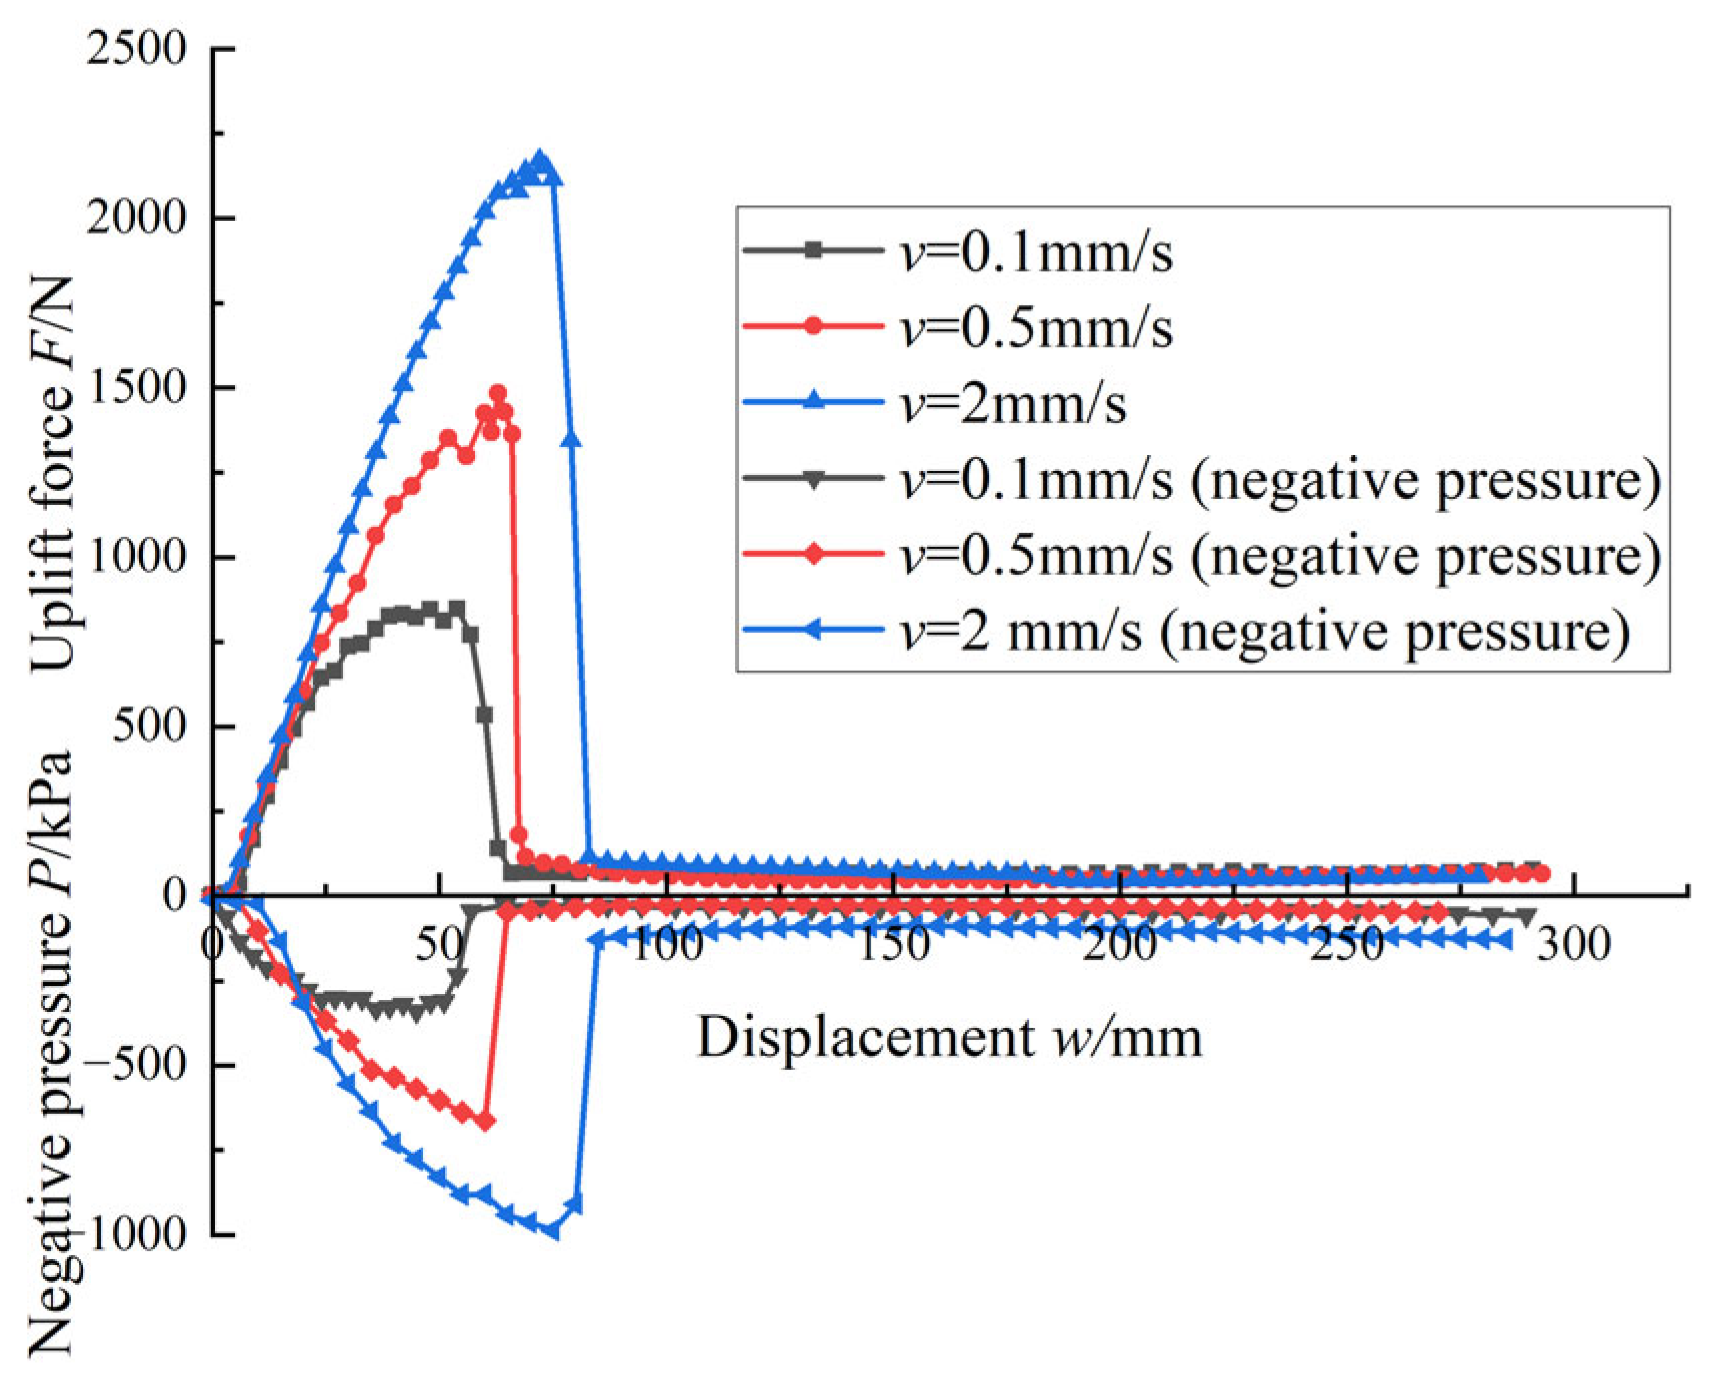
When the uplift rate increased to 0.5 mm/s, the test still showed partially drained behavior. Uplift load and suction rose rapidly and peaked at 63 mm of uplift, followed by a sharp decline. Collapse of the surrounding soil was observed, but the soil plug remained intact (
Figure 18), similar to the 0.1 mm/s condition.
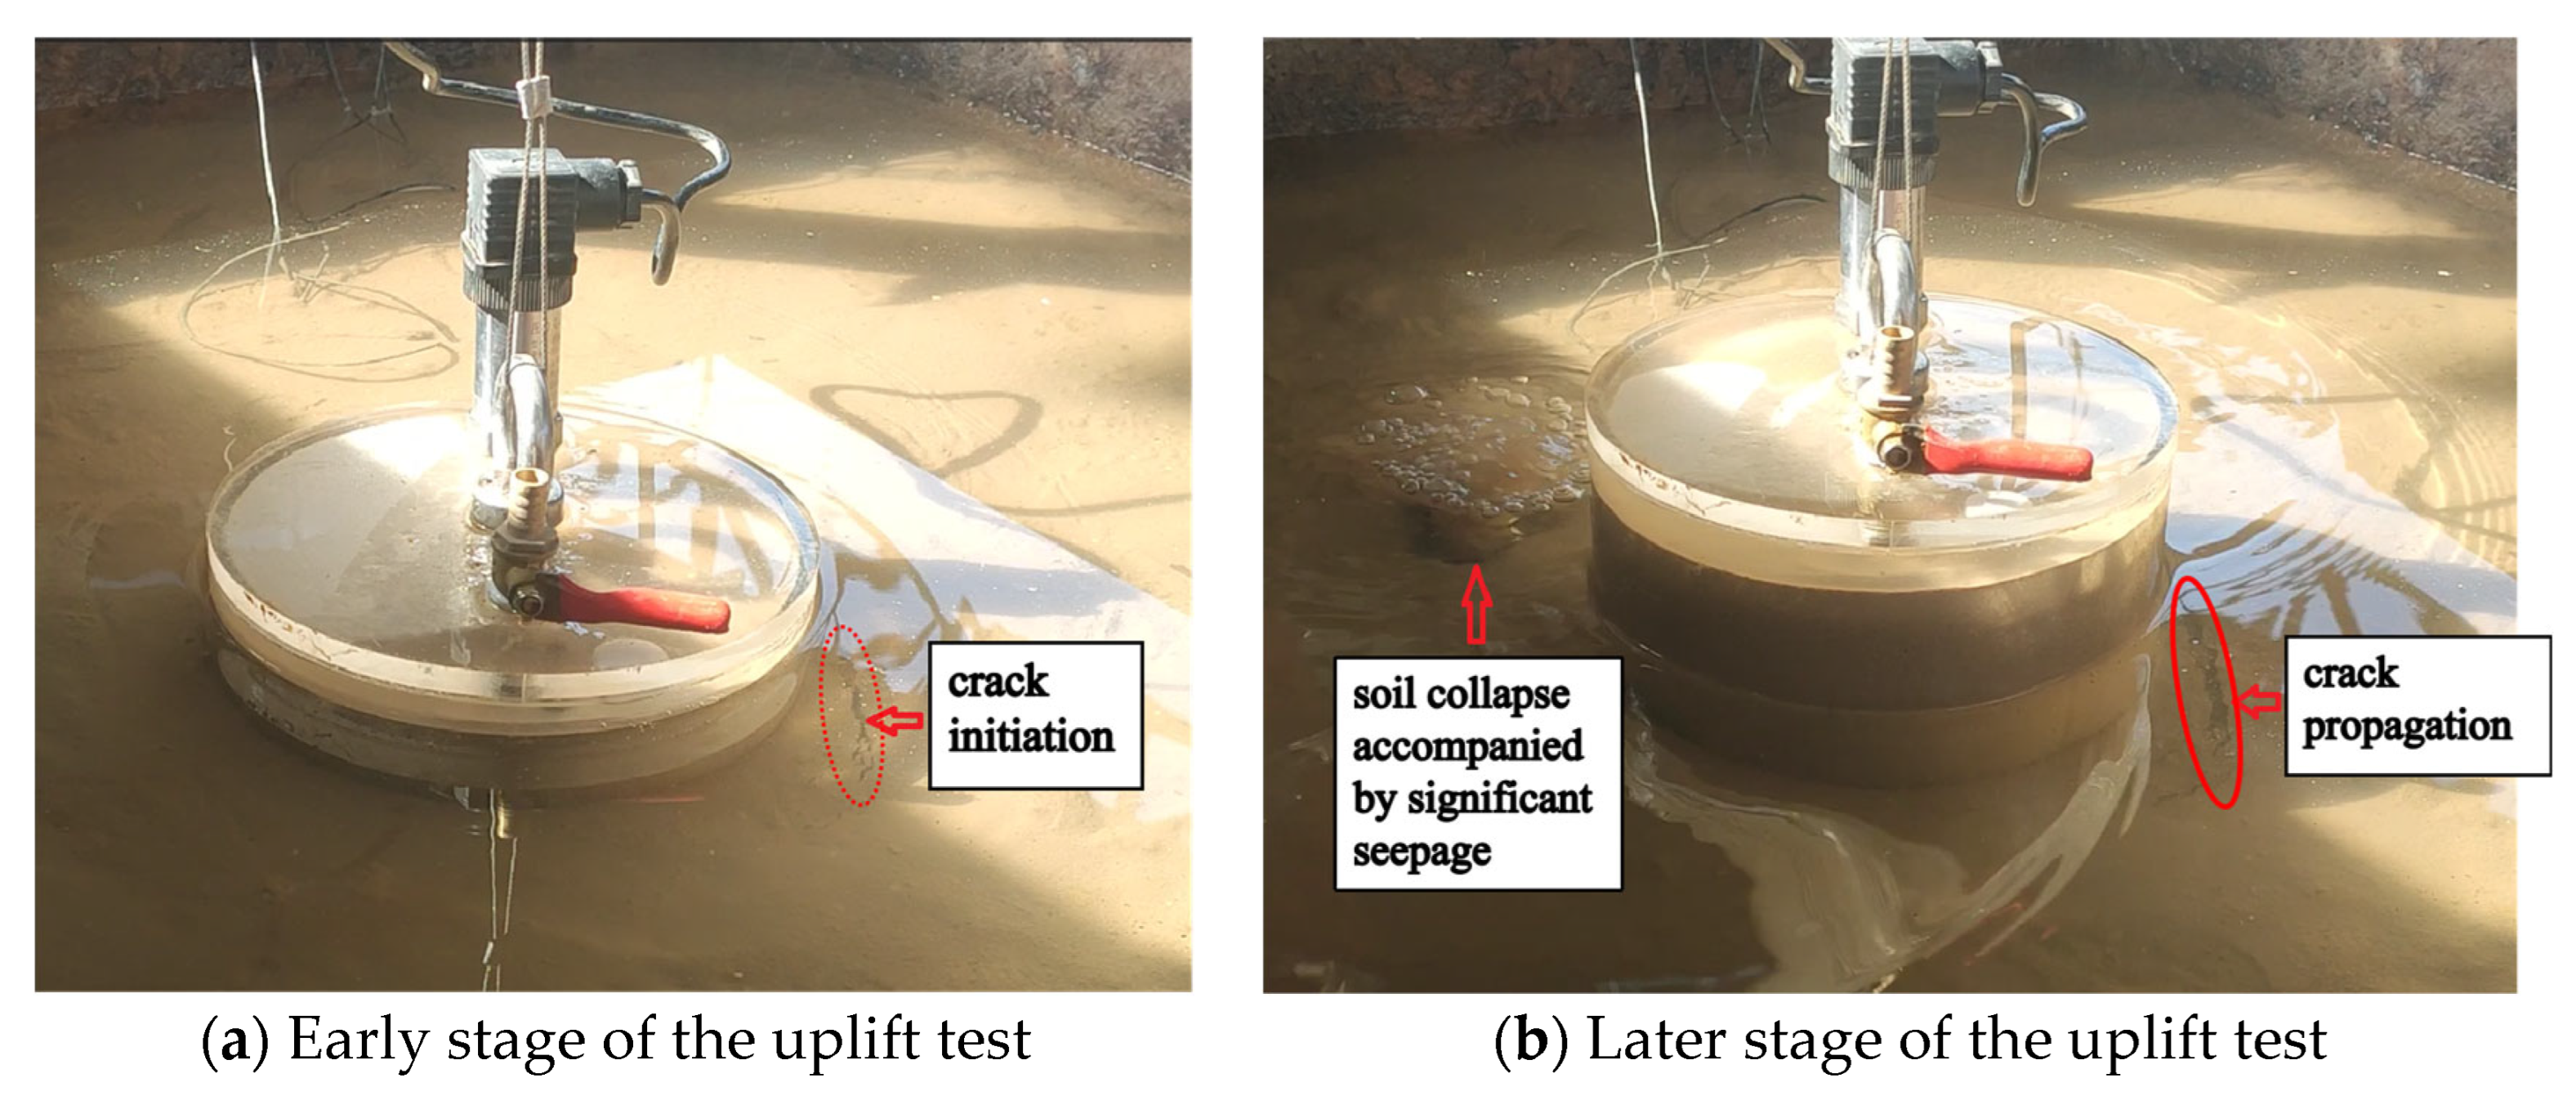
At 2 mm/s, peak uplift load and suction occurred at 72 mm. Prior to the peak, cracks formed around the outer shaft wall, eventually developing into a collapse pit with strong seepage (
Figure 19). The sudden post-peak drop in capacity suggests a large void channel had formed between the bucket and surrounding soil, releasing suction rapidly.
In the low-permeability Sand III (k = 7 × 10
−5 cm/s), the load and suction response is shown in
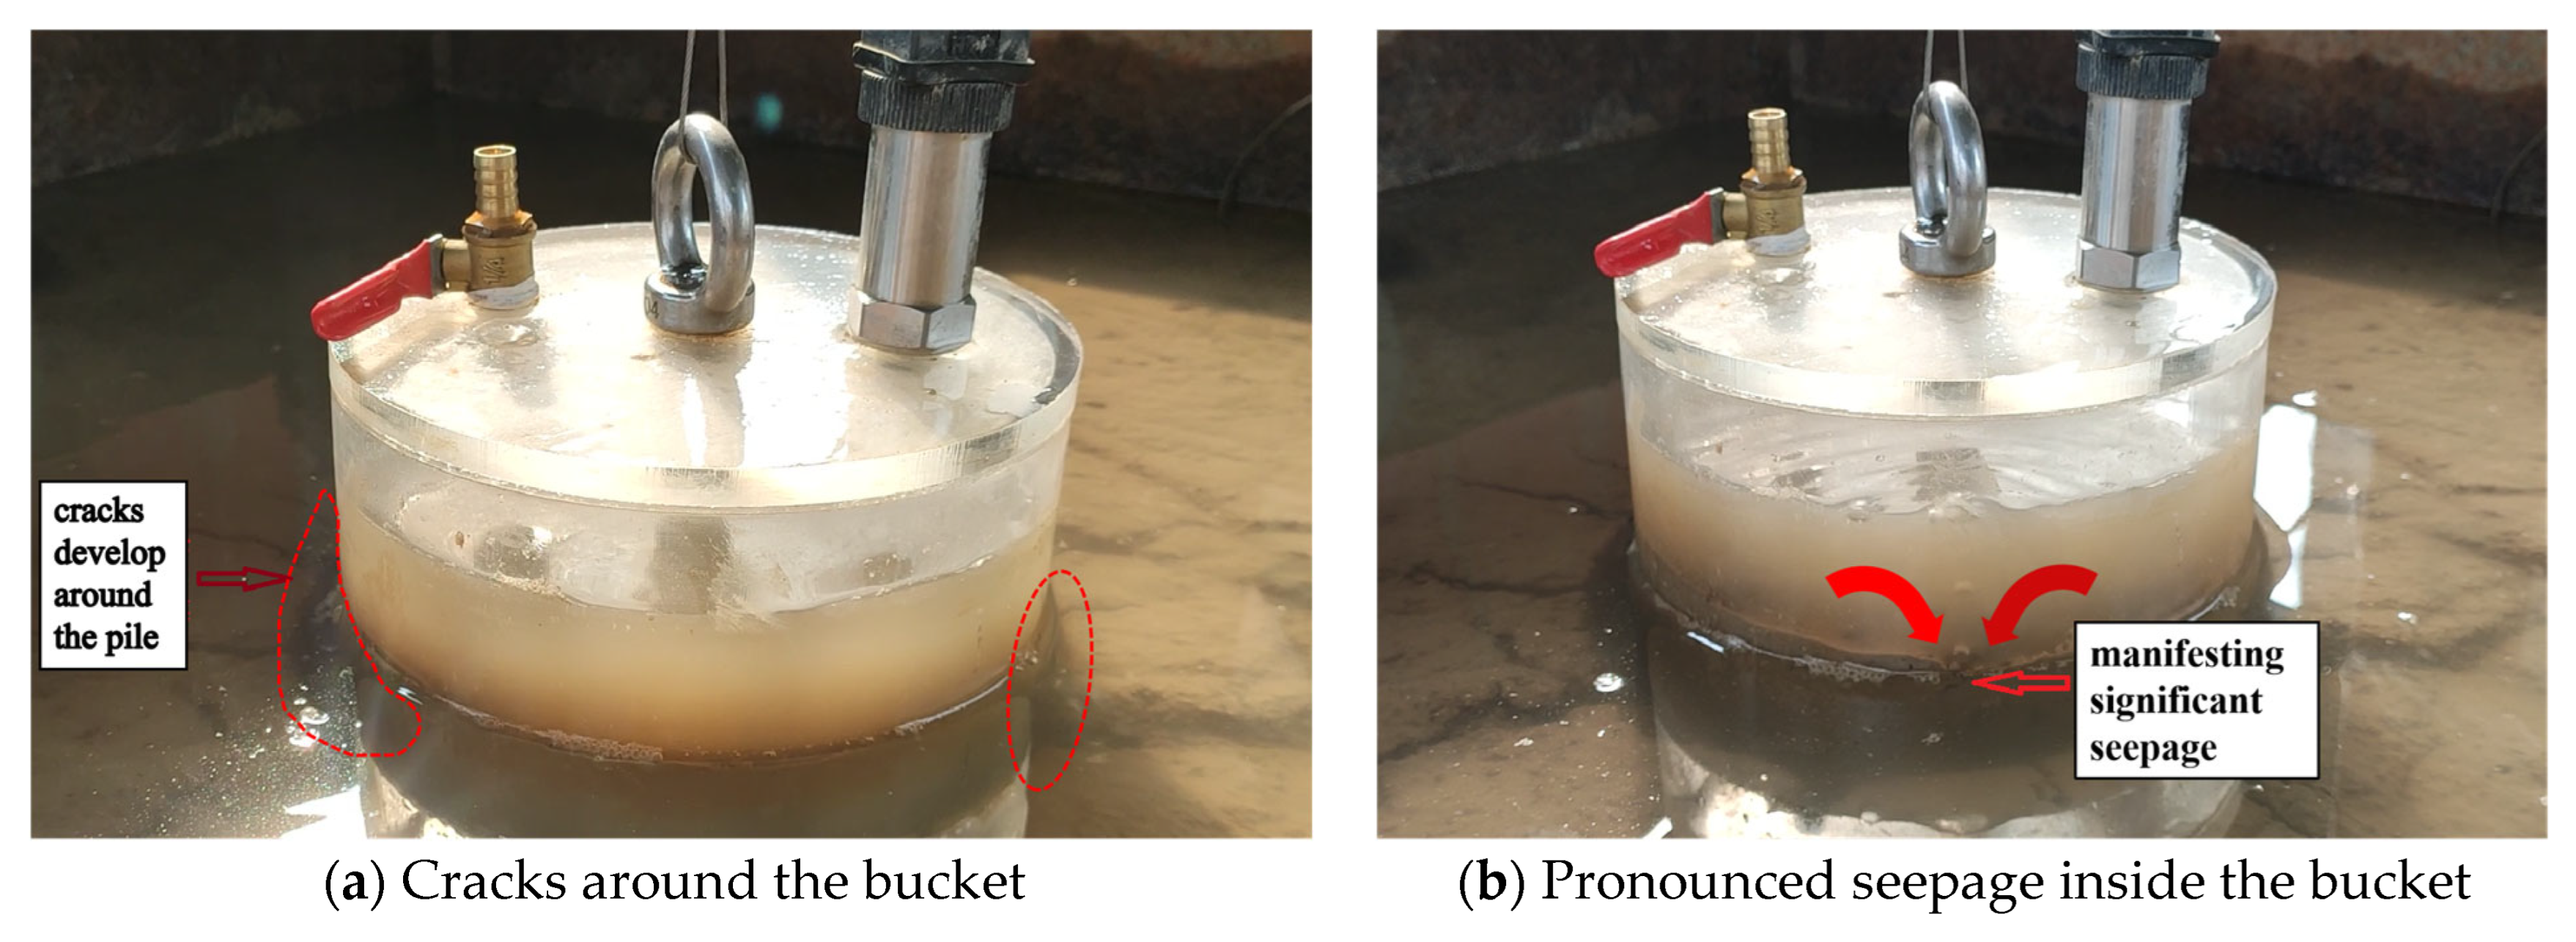
Figure 20. At 0.1 mm/s, the soil plug was pulled out, but peak capacity was delayed until 112 mm of uplift. Before reaching the peak, cracks were observed between the outer shaft and surrounding soil, without obvious seepage. Observations (
Figure 21) revealed intermittent seepage between the soil plug and inner wall, indicating alternating blockage and reopening of seepage channels. This likely results from temporary formation of channels during uplift, allowing pressure to partially dissipate. As seepage slows, channels are re-blocked by soil particles. When suction reaccumulates, new channels reopen. This cycle of buildup and release causes the gradual decline in uplift load and suction.
At higher uplift rates (0.5 mm/s and 2 mm/s), Sand III showed similar behavior to Sand II. Outer soil collapse was observed after the peak, but the soil plug remained intact. The rapid decline in load and suction was again caused by the formation of continuous seepage channels, leading to suction loss.
Across all nine sealed-lid uplift scenarios, two failure modes were identified:
- (a).
Shear failure under fully drained conditions;
- (b).
Base resistance failure under partially drained conditions.
In partially drained conditions, negative pressure forms in two key areas:
- (a).
Between the bucket lid and soil plug, where limited water inflow prevents pressure equalization and causes the plug to be lifted.
- (b).
At the bucket base, where suction forms due to water replenishment lag, increasing the uplift capacity.
Two mechanisms for suction dissipation were identified:
- (I).
Seepage-induced piping: Water flow along the bucket–soil interface carries particles away, forming continuous flow paths and releasing suction.
- (II).
Soil collapse: Uplift-induced deformation creates voids connecting the bucket base to the surface, leading to rapid pressure equalization.
The first mechanism tends to occur under lower uplift rates with longer durations.
Comparing sealed- and vented-lid tests shows that in vented-lid tests, free drainage at the lid prevents soil plug mobilization, resulting in localized shear failure. Uplift resistance primarily comes from shaft friction and bucket self-weight. In contrast, sealed-lid tests promote negative pressure buildup at both the lid and base, often leading to soil plug uplift, seepage channel development, and outer soil collapse. Uplift resistance arises from combined contributions of shaft friction, suction at the lid and base, and plug self-weight, producing more complex mechanical responses. Moreover, uplift rate and soil permeability significantly influence suction development and seepage formation in sealed-lid conditions, while their effect is limited in vented-lid tests.
The identification of distinct uplift failure modes under drained and partially drained conditions provides critical guidance for retrieval strategy selection. In high-permeability soils, uplift resistance is predominantly governed by shaft friction, indicating that retrieval loads can be reduced by minimizing wall–soil adhesion through pre-loosening measures or lid venting. In contrast, in low-permeability soils where suction-induced base resistance dominates, gradual depressurization or controlled creation of seepage paths is advisable to prevent excessive extraction forces and mitigate seabed disturbance.
