Article

Methodological Overview of Hydrodynamic Loading on Seabed Structures in the South-East Mediterranean

by
Constantine D. Memos
1,
Ioannis P. Roupas
2,* and
Antonios Mylonas
1
1
School of Civil Engineering, National Technical University of Athens, 15780 Athens, Greece
2
Department of Civil Engineering, Aristotle University of Thessaloniki, University Campus, 54124 Thessaloniki, Greece
*
Author to whom correspondence should be addressed.
J. Mar. Sci. Eng. 2025, 13(11), 2057; https://doi.org/10.3390/jmse13112057
Submission received: 26 September 2025 / Revised: 22 October 2025 / Accepted: 24 October 2025 / Published: 28 October 2025
(This article belongs to the Section Ocean Engineering)

Abstract

This article presents a methodological framework for evaluating hydrodynamic loading on seabed structures in the eastern Mediterranean, originally motivated by the design requirements of special protective structures for a planned high-voltage subsea interconnection between Crete and the Greek mainland. The associated study highlighted the need for a comprehensive evaluation of hydrodynamic loading on seabed structures in the South-East Mediterranean. A methodology is presented for determining representative design kinematics near the seabed, accounting for large-scale oceanic circulation, local wind-induced currents, wind-generated surface waves, and tsunami effects. The method integrates long-term metocean datasets, spectral wave modelling, and reliability-based combinations of critical processes, with adjustments for anticipated climate change impacts. The approach is demonstrated through two case studies involving an electrode protective cage and a submarine electricity transmission cable, both representative of components in subsea power connections. The analysis provides design values of velocities, accelerations, and hydrodynamic forces, with typical checks against sliding, uplift, and vibration. Results highlight the depth-dependent magnitude interplay between ocean circulation and wave-induced particle motions, as well as the importance of biofouling and marine growth. The findings aim to support the safe and sustainable design of offshore energy infrastructure in the eastern Mediterranean and similar marine environments.

1. Introduction

Nowadays, an increasing effort can be observed regarding energy transfer projects involving cables or conduits laid on the ocean floor over quite long distances. Such activity is particularly noted in the eastern Mediterranean basin, where proposed linear south–north or east–west crossings can reach sea depths up to 3 km. Therefore, it is imperative to study the hydrodynamic conditions close to the seabed, so that the loading upon the electric cables or other components of energy connection schemes be credibly evaluated.
This article presents the results of a technical study for an electric connection between Crete and the Greek mainland, along with a wider evaluation of hydrodynamic conditions applicable to similar projects foreseen to be materialized in the said basin.

2. Scope

The scope of this study is to present methodological guidance for evaluating the hydrodynamic actions upon seabed structures, taking into account (a) the influence of critical hydrodynamic processes, and (b) considerations of the impact of climate change upon the design parameters. To specify the applied methodology, case studies will be presented here below, concerning real conditions in the eastern Mediterranean of two types of structures: rectangular electrode-protection-cage structures and electrical cylindrical cables. Finally, insights and recommendations will be given regarding the reliability, against slipping and/or uplifting, of potential energy interconnection components in the above area. This would hopefully help engineers in optimizing their design, by identifying eventual critical issues and suggesting possible solutions by considering both technical requirements and the sensitivities of the local environment.

3. Methodology Applied

3.1. General Considerations

In order to be able to evaluate the actions upon the seabed structures considered herein, it is imperative to obtain the sea kinematics at the area, especially their extreme values during the envisaged design life of the works. To this end, we should define credible design values of the seawater velocities and accelerations close to the seabed. These kinematics are evaluated in the framework of the main physical processes that induce them.

3.2. Oceanic Circulation

The global movement of the planet’s oceans provides a part of the total water velocities at any considered site. To assess those, data from the Mediterranean Monitoring Forecasting Centre (MED MFC)’s coupled wave-current model were used. The model is based on the Navier–Stokes equations of momentum and continuity along with equations for heat and salt conservation. Results, including tidal currents of both astronomical and meteorological origin, are for daily means and presently cover a period of around 35 years. Those values were used in this exercise to evaluate extremes since deviations from daily means significant for the design are not expected for general oceanic circulation. It is noted that when this loading is not the leading action, the mean value of the oceanic circulation over the time range adopted can be utilized.
In order to be able to determine the oceanic current velocity at an appropriate water depth for the seabed structures, it is safely assumed that the above velocities adhere to a logarithmic vertical distribution. Transfer of existing data from adjacent points to the site considered can be made by interpolation and assuming similarity between velocity distributions of this kind along the vertical. For sites close to the coastline, the said interpolation was made upon the depth-wise maximum or daily mean velocities at the two closest points of the MED MFC’s model grid to the site examined. A simple distance-weighted mean was assumed at the examined location, quite sufficient for the purpose of this study. For sites in the open sea, where the flow is less complex, the point closest to the site grid was assumed to be quite representative of the conditions at the site considered. In fact, the grid size of the above model is about 4.6 km x 4.6 km, i.e., dense enough to accurately exhibit the behaviour of a slow varying quantity as the general oceanic circulation. Then, by applying a logarithmic profile along the vertical, quite plausible for uniform flow [1], one can arrive with satisfactory approximation to the velocity value at the required depth near the seabed at the site considered. Close proximity of the coastline was taken into account when significant—when accordingly modifying the velocity direction.

3.3. Local Contributions

3.3.1. Wind-Induced Currents

Since the Med MFC’s model considers a planetary wind field as a driving factor, it cannot take into account local perturbations. Thus, a check on the streaming that local winds can generate close to the seabed is required. Relevant wind data from nearby meteo-stations were used. These can give, by using the graph of Fig. II-2-5 of the Coastal Engineering Manual (CEM) [2], the sea surface geostrophic velocity. Following Ekman’s theory, whereby internal friction is balanced by the Coriolis effect, the current components at any depth in an open ocean can be obtained. If the latter is lower than the depth of frictional influence, then a quadratic distribution of the velocity can be used instead. The current components along the x and y axes at depth z over the bottom can be written as [3]
u E = u g   1 exp π z / D E cos π z / D E ,
v E = u g exp π z D E sin π z D E
where DE is the depth (in m) of frictional influence, equal to 4.3 W/(sinφ)1/2, W the wind speed (in m/s) and φ the latitude.

3.3.2. Tsunamis

Severe tsunamis or similar local processes of extreme intensity that could generate long waves are rare in the eastern Mediterranean. However, for comparison reasons we estimated the water velocities of tsunamis, assuming an initial surface superelevation characteristic for the site considered. The vertical distribution of particle velocities was taken logarithmic as in the oceanic circulation.

3.3.3. Surface Waves

Surface wave datasets from the Copernicus Marine multi-year reanalysis product of the Mediterranean Sea Waves forecasting system (Med-WAV) were used for obtaining values of wave heights and periods of wind-generated waves (https://doi.org/10.25423/cmcc/medsea_multiyear_wav_006_012). The values cover a continuous period of nearly 30 years (1993–2021). The most severe events during that period were accounted for by employing extreme value analysis. The Weibull distribution was assumed for the extrapolation of wave heights. Wave transformation from the given grid points to the site considered was evaluated through SwanOne [4], a third-generation spectral wave model. When in-house built or academic models are used, their validation in the study area would be required prior to application. The required bathymetric profiles were constructed mainly from Nautical Charts obtained by the Navionics Web-App. The particle velocities and accelerations induced by surface waves were evaluated by applying the Stokes theory, with its order depending on the actual water depth conditions.

3.4. Design Values

The design values of the kinematics appropriate to calculate the hydrodynamic loading upon the seabed structures depend on the required reliability level of the latter. In any case the procedure followed here to derive a design value, representative of the contributing processes mentioned above, can be summarized by the following steps: (i) identify for each site considered the most critical action, the leading action, among the four processes noted previously; (ii) select up to one accompanying action among the remaining three processes that has the highest dependence on the leading one; (iii) derive the joint effect of the leading action and its dependent one; (iv) add to the result any of the remaining two processes that can be typically present during the design event. The probability of occurrence for step (i) can be a high return period, say 200 y, while that for the accompanying action in step (ii) should be obtained based on the probability of the joint event, e.g., 700 y, as well as on the interdependence level between the two processes. Finally, the probability for the add-ons of step (iv) can be an average value of the added variables.
In this study the joint event was treated by the Gumbel–Hougaard copula, linking firstly its dependence parameter m to the actual correlation factor between the two processes. It was assumed that wind waves (including swells) and local wind-induced currents are moderately correlated, with m close to 1.2 that corresponds to a Pearson’s correlation ρ about 0.25, while in all other process pairs the associated processes were assumed practically independent from one another.

3.5. Climate Change

Current climate trends may have some impact on the parameters examined in this study. The direct impact of the above trends on our design parameters would be confined to the following issues:
(a)
The currently acceptable trend of the increase in seawater temperature would correspondingly boost marine growth. Estimates of that increase are available at present, dependent on future carbon emissions. The issue is quite significant since the eastern Mediterranean is prone to high marine fouling due to the expected intense warming process of its waters in the years to come.
(b)
The stochastic met-ocean processes that affect seawater kinematics at our site, and thus should be considered in the context of climate change, include the atmospheric pressure field that mainly drives the general oceanic circulation; the local winds; and the wind-generated surface gravity waves.
Estimates of the climate change impact on the relevant kinematics at the locations considered here are based on [5,6,7,8,9]. The adopted values averaged over the whole region studied are for a reference period over the next 100 years:
  • An increase of 14% to be adopted for the general oceanic circulation, given that model results for the maximum storm surges forecast an increase of about 3.5% for the South Aegean for the next 25 years [9].
  • A wind-wave height increase of 12%, given that relative studies are expecting a tentative increase in the order of 3% in wave height Hs over the next 25 years [8].
  • Based on data given in [6], a reduction by 12% of the return time in wind-induced currents’ extreme events is assumed in the present study.

4. Applications

The above methodology was applied to two distinct structures: one relatively light and the other rather heavy. Both are directly related to power subsea connections: the light structure represents a protective cage for electrode modules, while the heavy one an electricity cable section. The main shape characteristics of the aforementioned structures are the following:
  • Protective Cage: This structure has an orthogonal shape measuring 11.1 m × 8.1 m × 1.68 m (height), and is made of light material grid panels, while all faces of the structure are covered by a side protection grid. The outline shape of the protective cage is presented in Figure 1.
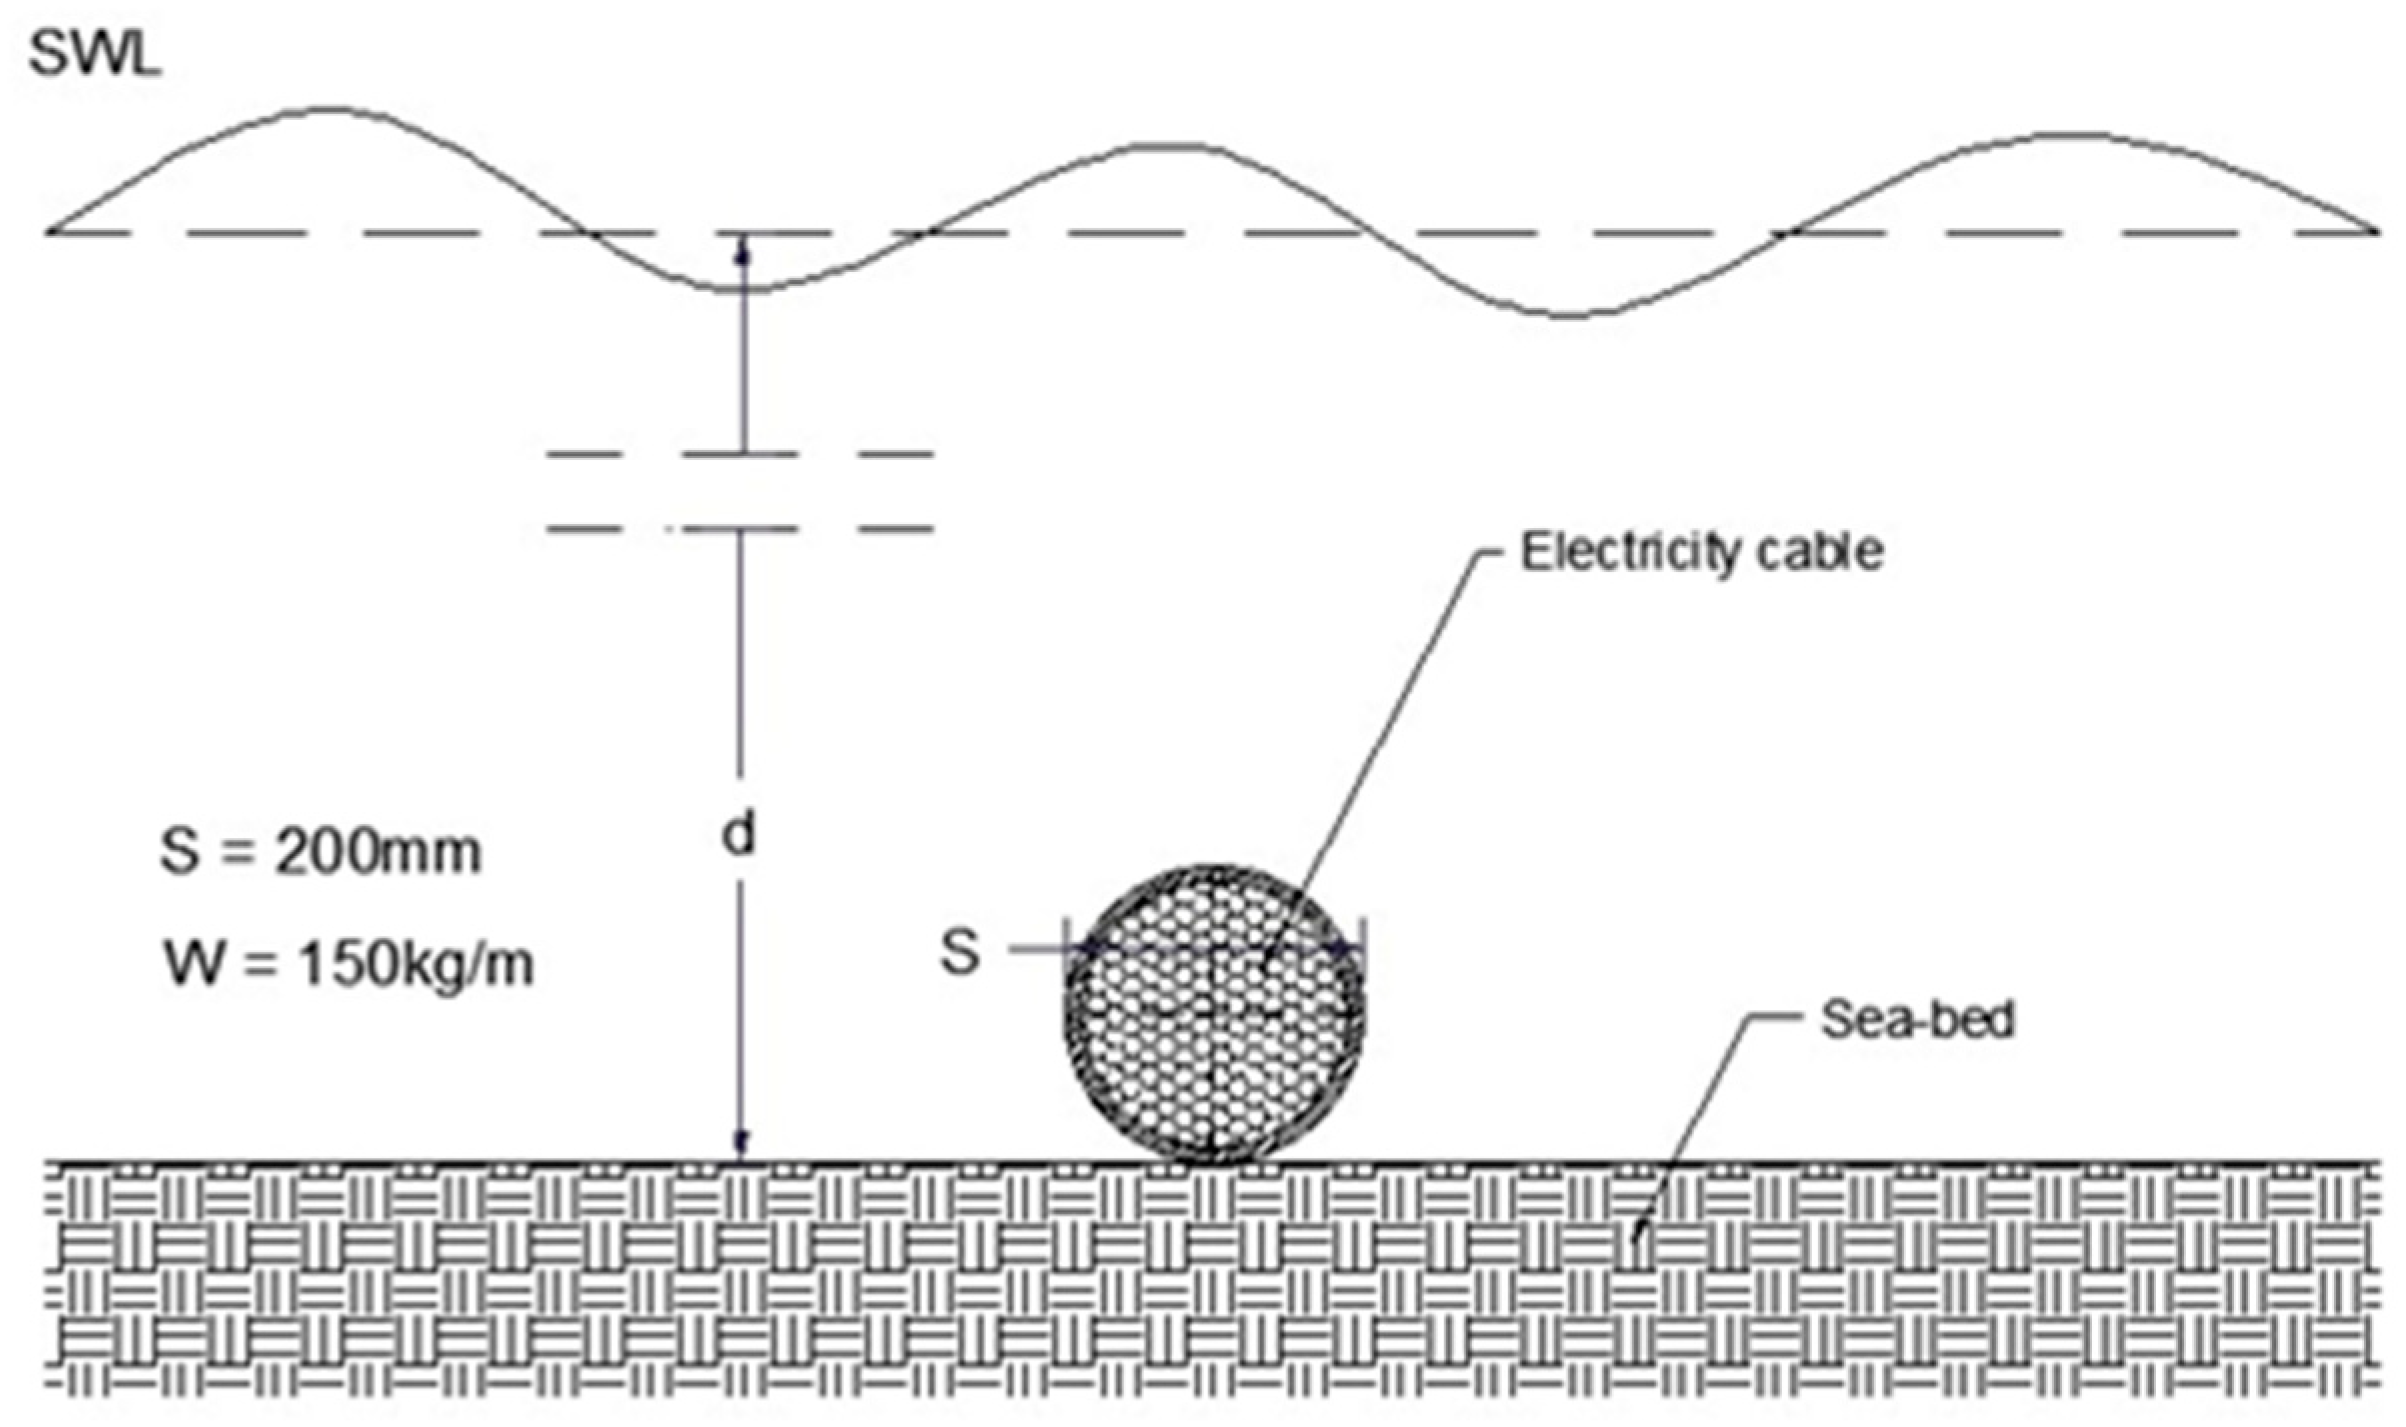
  • Electricity cable: Regarding the main characteristics of the electricity cable, it was assumed to have a cylindrical cross section, with a diameter of 200 mm and a linear mass of 150 kg/m, representing the heavier structure of the aforementioned two design cases (see Figure 2).
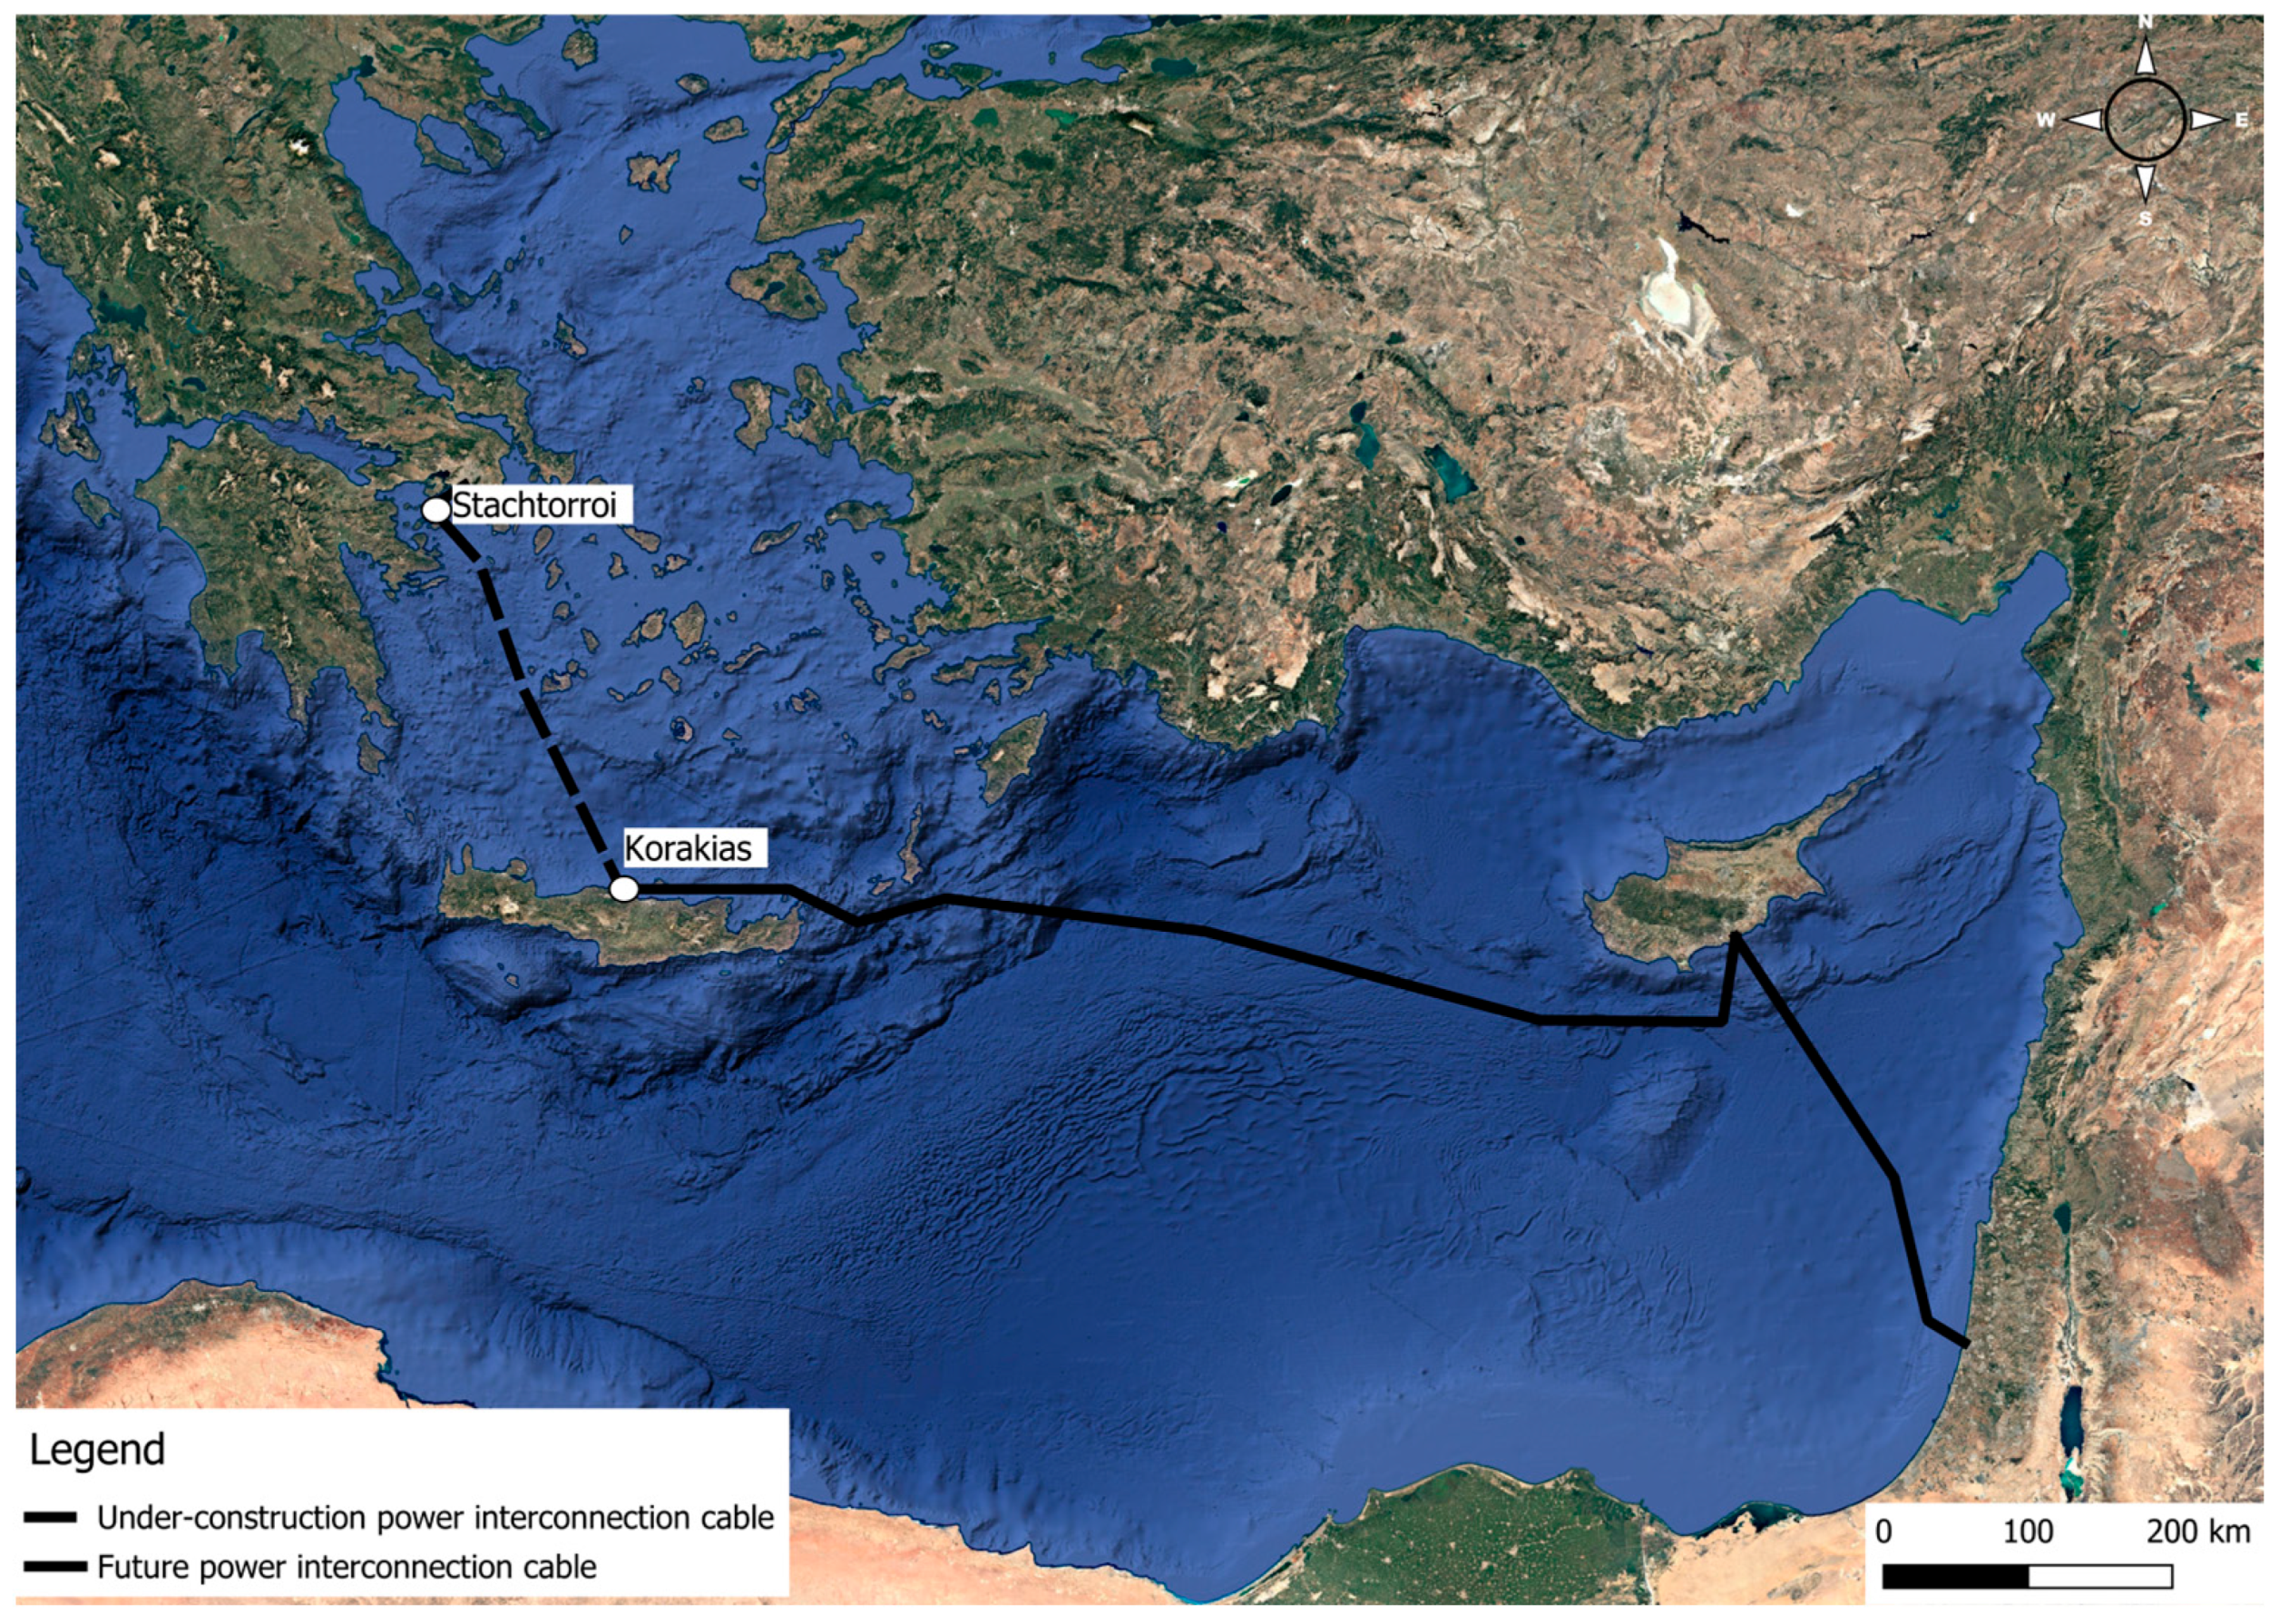
The environmental conditions were tested for a semi-protected site of moderate depth in Saronikos Gulf near Stachtorroi island (site #1), and a site exposed to waves in shallow water near the Korakias location at the northern coast of Crete Island (site #2). Those sites can be seen in Figure 3, where the whole route of the Great Sea Interconnector in the eastern Mediterranean is depicted.

4.1. Hydrodynamic Parameters

The parameters previously defined were evaluated for the two sites, at depths 40 m and 23 m, for the case of the protective cage (a) and the case of the electricity cable (b), as follows:
Site #1a (velocities at a depth of 38.3 m):
  • Oceanic circulation, ui = 0.13 m/s maximum daily mean over 33 years of data.
  • Local wind-generated current, uii = 0.03 m/s maximum value over 67 years of data.
  • Tsunami effect, uiii = 0.16 m/s for a superelevation in the open sea of 0.40 m.
  • Wind–waves motion, uiv = 0.12 m/s for Hm0 = 1.95 m, Tp = 8 s related to a return period of 200 years. The associated particle accelerations along the horizontal and the vertical are, respectively, ah = 0.10 m/s2 and av = 0.01 m/s2.
Site #2a (velocities at a depth of 21.0 m):
  • Oceanic circulation, ui negligible along wave direction, maximum daily mean over 34.5 years of data.
  • Local wind-generated current, uii = 0.10 m/s maximum value over 68 years of data.
  • Tsunami effect, uiii = 0.72 m/s for a superelevation in the open sea of 1.5 m.
  • Wind–waves motion, uiv = 1.10 m/s for Hm0 = 4.5 m, Tp = 11 s related to a return period of 50 years. The associated particle accelerations along the horizontal and the vertical are, respectively, ah = 0.62 m/s2 and av = 0.06 m/s2.
Site #1b (velocities at a depth of 39.8 m):
  • Oceanic circulation, ui = 0.11 m/s maximum daily mean over 33 years of data.
  • Local wind-generated current, uii = 0.005 m/s maximum value over 67 years of data.
  • Tsunami effect, uiii = 0.09 m/s for a superelevation in the open sea of 0.40 m.
  • Wind–waves motion, uiv = 0.12 m/s for Hm0 = 1.95 m, Tp = 8 s related to a return period of 200 years. The associated particle accelerations along the horizontal and the vertical are, respectively, ah = 0.09 m/s2 and av = 0.001 m/s2.
Site #2b (velocities at a depth of 22.8 m):
(a)
Oceanic circulation, ui negligible along wave direction maximum daily mean over 34.5 years of data.
(b)
Local wind-generated current, uii = 0.005 m/s maximum value over 68 years of data.
(c)
Tsunami effect, uiii = 0.65 m/s for a superelevation in the open sea of 1.5 m.
(d)
Wind–waves motion, uiv = 1.00 m/s for Hm0 = 4.5 m, Tp = 11 s related to a return period of 50 years. The associated particle accelerations along the horizontal and the vertical are, respectively, ah = 0.57 m/s2 and av = 0.005 m/s2.
The effect of climate change upon the parameters discussed herein has been evaluated for a 100-year lifetime. The values mentioned previously in Section 3.4 were applied.

4.2. Hydrodynamic Actions

The above calculated values of hydrodynamic parameters can lead to the evaluation of actions upon structural elements placed on the seabed. The two such elements mentioned above have been studied: a light box cage intended for holding and protecting the electrode modules of an undersea electric power connection, as well as a typical section of the electric cable itself.
An additional parameter that can modify the hydrodynamic actions, depending on the given structure considered, refers to marine growth. The thickness and mass of the latter depend on the specific location under study. This parameter can severely alter the relevant design loading values, e.g., by switching from drag to inertia-controlled process or from Morison’s to diffraction-based evaluation [10,11,12].

4.2.1. Protective Cage

The central values used in the applications for the drag, inertia, and lift coefficients, in the open field are 1.2, 1.0, and 0.36, respectively, based on the current literature: [12,13,14,15].
  • Site #1a: The most critical action comes from the combination of the general oceanic circulation with the wave action and the addition to this result of the local wind-generated current. This yields a water particle design velocity of 0.30 m/s, while the associated accelerations due to waves are ah = 0.09 m/s2 and av = 0.01 m/s2. The leading action was evaluated for a 200y return period (RP), the accompanying action for 15y RP and the additional one for 60y RP. For the above design values the total horizontal load was estimated by Morison’s hypothesis, applicable to the structural components of the cage, to about 5 kN and the uplift to 1.5 kN. The design value of marine growth adopted here was of 4 cm thickness, assuming that the material to be used (polymers) will not be attracting high biofouling, as well as that frequent maintenance cleaning will be implemented.
  • Site #2a: The most critical action comes from the combination of the general oceanic circulation with the wave action and the addition to this result of the local wind-generated current. This yields a particle design velocity of 0.30 m/s, while the associated accelerations due to waves are ah = 0.09 m/s2 and av = 0.01 m/s2. The leading action was evaluated for a 200y return period, the accompanying action for 15 y RP and the additional one for 60 y RP. For the above design values the total horizontal load was estimated by Morison’s hypothesis to 60 kN and the uplift to 18 kN. The design value of marine growth adopted here was 5 cm thick, assuming that the material to be used (polymers) will not be attracting high biofouling, as well as that frequent maintenance cleaning will be implemented.
  • Sliding: A quick check of resistance against sliding leads to an underwater weight requirement for the cage of the order of 13 kN and 150 kN for sites #1a and #2a, respectively. It became evident that, for the case of site #2a, the structure under consideration should display an underwater weight more than 100 kN to resist sliding on a horizontal seabed of favourable soil composition. However, the protective cage was designed of quite light PVC, meaning that drastic intervention was needed to counteract any risk of sliding. The main option proposed was to place 4 mass structures (dead-men) of a layout embracing the corners of the cage, providing enough weight to safeguard the non-sliding of the protective structure. For a horizontal seabed with a sliding coefficient 0.4, the required weight of each concrete unit would be of the order of 5 tf in air. Four typical precast concrete units placed on the seabed around the modules were proposed, with nylon ropes anchoring the protective cage on those units.
  • Vibrations: The possibility of vibrations developing on members of the cage can be ignored. This is because the natural frequency of the upper horizontal beams, most prone to be excited by this process, is an order of magnitude higher than that of the driving action due to waves. Also, the mode of eddy shedding is redundant due again to the higher, by an order of magnitude, critical velocity required for the inception of vibration. The above result holds for both sites #1a, #2a.

4.2.2. Electricity Cable

Some adjustments need to be made to the hydrodynamic parameters here, since the drag, inertia, and lift coefficients of the hydrodynamic actions should account for the difference in geometry of the cable-structures in question and their proximity to the seabed. The parameters defined previously were re-evaluated for the two sites, at depths 40 m (site #1b) and 23 m (site #2b).
The primary values used in the applications for the drag and inertia coefficients, in the open field, were determined through the recommended practice of [12], which refers to free spanning pipelines, such as our design case, considering the proximity of the cable to the seabed, its roughness and the resulting effect of marine growth, the state of flow regime through the Keulegan–Carpenter number, and the flow-induced vibrations. It is noted that in the context of [12], actions are determined per unit length of a pipe free span, followed in our own design case.
According to the aforementioned recommendation, the drag coefficient CD was taken as
C D = C D 0 ( k / D ) · ψ K C , a C D · ψ p r o x i C D · ψ t r e n c h C D · ψ V I V C D
where C D 0 ( k / D ) is the basic drag coefficient for steady flow as a function of roughness k / D (in our case k / D = 1/200 accounting for marine growth), ψ K C , a C D a correction factor accounting for the unsteadiness of the flow, by including the effects of the Keulegan–Carpenter number and the current–wave velocity ratio a = U c / U c + U w ( U c   is the current velocity normal to the pipe and U w   is the significant wave-induced velocity amplitude normal to the pipe), ψ p r o x i C D   is a correction factor accounting for the seabed proximity ( ψ p r o x i C D = 1.4 for a pipeline resting directly on the seabed), ψ t r e n c h C D is a correction factor responsible for the effect of a pipe in a trench ( ψ t r e n c h C D     = 1.0 for a pipeline in contact with the seabed outside a trench) and ψ V I V C D   is an amplification factor due to cross-flow vibrations.
Respectively, the inertia coefficient C M was taken as
C M = C M , 0 · ψ k C M · ψ p r o x i C M · ψ t r e n c h C M
where C M , 0   is the basic inertia coefficient as a function of the current–wave velocity ratio α , ψ k C M   is a correction factor accounting for the pipe roughness, ψ p r o x i C M   is a correction factor accounting for the seabed proximity ( ψ p r o x i C M   = 1.64 for a pipeline resting directly on the seabed) and ψ t r e n c h C M   is a correction factor considering the effect of a pipe in a trench ( ψ t r e n c h C M   = 1.0 for a pipeline in contact with the seabed outside a trench). The input values of the above coefficients, along with their respective factors, for each site, are presented in Table 1 and Table 2.
The resulting values for the drag and inertia coefficients, as presented above, are 3.34 and 1.78, respectively, for site #1b, and 3.07 and 2.69, respectively, for site #2b. For the cable case, site #2b belongs to a larger grid to be presented in the following. In order to be able to obtain a preliminary overview of the potential hydrodynamic actions over the whole basin, two sets of constant values of C D   and C M were introduced based on data as those presented in Table 1 and Table 2. Regarding the drag coefficient, and according to historical data of previous research [13], the calculated value of 3.34, in the case of site #1b, was considered quite high and possibly would overestimate the hydrodynamic loads on the cable. Finally, for depths shallower than 50 m, a value of 3.0 was chosen for the drag coefficient C D , while for the inertia coefficient C M , a representative value of 2.3 was applied over the basin of the eastern Mediterranean at the above depths; see Section 4.2.3 below. Consequently, the said approximate values were applied to sites #2a and #2b as well.
Finally, the lift coefficient C L   was estimated, in relation to the drag coefficient and the Keulegan–Carpenter number, using the results of the research carried out in [13], to a value of 0.3 for both sites.
  • Site #1b: The most critical action comes from the combination of the general oceanic circulation with the wave action and the addition to this result of the local wind-generated current. This yields a particle design velocity of 0.26 m/s, while the associated accelerations due to waves are ah = 0.1 m/s2 and av = 0.001 m/s2. The leading action was evaluated for a 200 y return period, the accompanying action for 15 y RP and the additional one for 60 y RP. The total resulting load on the electricity cable at site #1b, estimated by Morison’s hypothesis, is presented in Table 3. It is noted that the values presented in Table 3 and Table 4 refer to the instant when the maximum total action occurs.
  • Site #2b: The most critical action comes from the combination of wind waves with the local wind-generated current. This yields a particle design velocity of 1.12 m/s, while the associated accelerations due to waves are ah = 0.65 m/s2 and av = 0.005 m/s2. The leading action was evaluated for a 200 y return period, the accompanying one for 15 y RP. The total resulting load on the electricity cable at site #2b, estimated by Morison’s hypothesis, is presented in Table 4.
  • Sliding: A quick check of resistance against sliding with sliding coefficient 0.33, confirms that the considerable weight of the electricity cable is enough to achieve stability at site #1b, without the need of an external stabilization scheme. However, at site #2b the prevalent wave conditions constitute a loading environment that leads to the need of external stabilization. It is noted at this point that the results of the stability checks can vary at waters of intermediate depth, such as in the above sites, due to the strong correlation of the hydrodynamic forces with the characteristics of the design wave and the respective water particle velocities.

4.2.3. Cable Stability on a Greater Scale

In order to obtain a greater insight on the parameters that affect the stability of a structure, such as a seabed electricity cable in open waters, and the relationship of dominance between the hydrodynamic parameters in regard to the water depth, the aforementioned methodology was applied to multiple sites at the South Cretan Sea and beyond, with depths ranging between 15 m and 3.000 m. A few of those are presented in Table 5. As stated in Section 4.2.2, in a preliminary stage the values of the hydrodynamic coefficients C D ,     C M , C L were assumed to be constant within certain depth ranges. The values of C L were estimated by applying the relevant diagrams of [15] for low KC-numbers and [13] for high KC-numbers. Analyzing the obtained results, and taking into account the prevailing wave conditions over the study area, we can deduce that the dominance relationship between the oceanic circulation velocity and the wind-wave associated particle velocity changes at around the 80 m water mark, between points I and M.
In shallower waters, the wind–wave induced particle velocities are typically expected to be the most critical actions, whereas at deeper waters the oceanic circulation velocities become prevalent. Comparing the computational results between sites #1b and #2b with sites of similar depth, as presented in Table 5, notable differences can be identified regarding the magnitude of the critical velocities and the resulting loads on the structure. In point I for instance, which is located in the southern region of the study area and therefore is exposed to more severe wave incidents than sites #1b and #2b, the design velocities appear to be remarkably higher, resulting in more intense actions on the structure and, consequently, widening the depth range where external stabilization would be required. Thus, the stability of the electricity cable against sliding can be compromised by that increase in the total load, as seen for site L in Table 5. In any case the evaluation of velocities and hence forces are strongly site-specific, a fact that should be considered in studies of this nature.
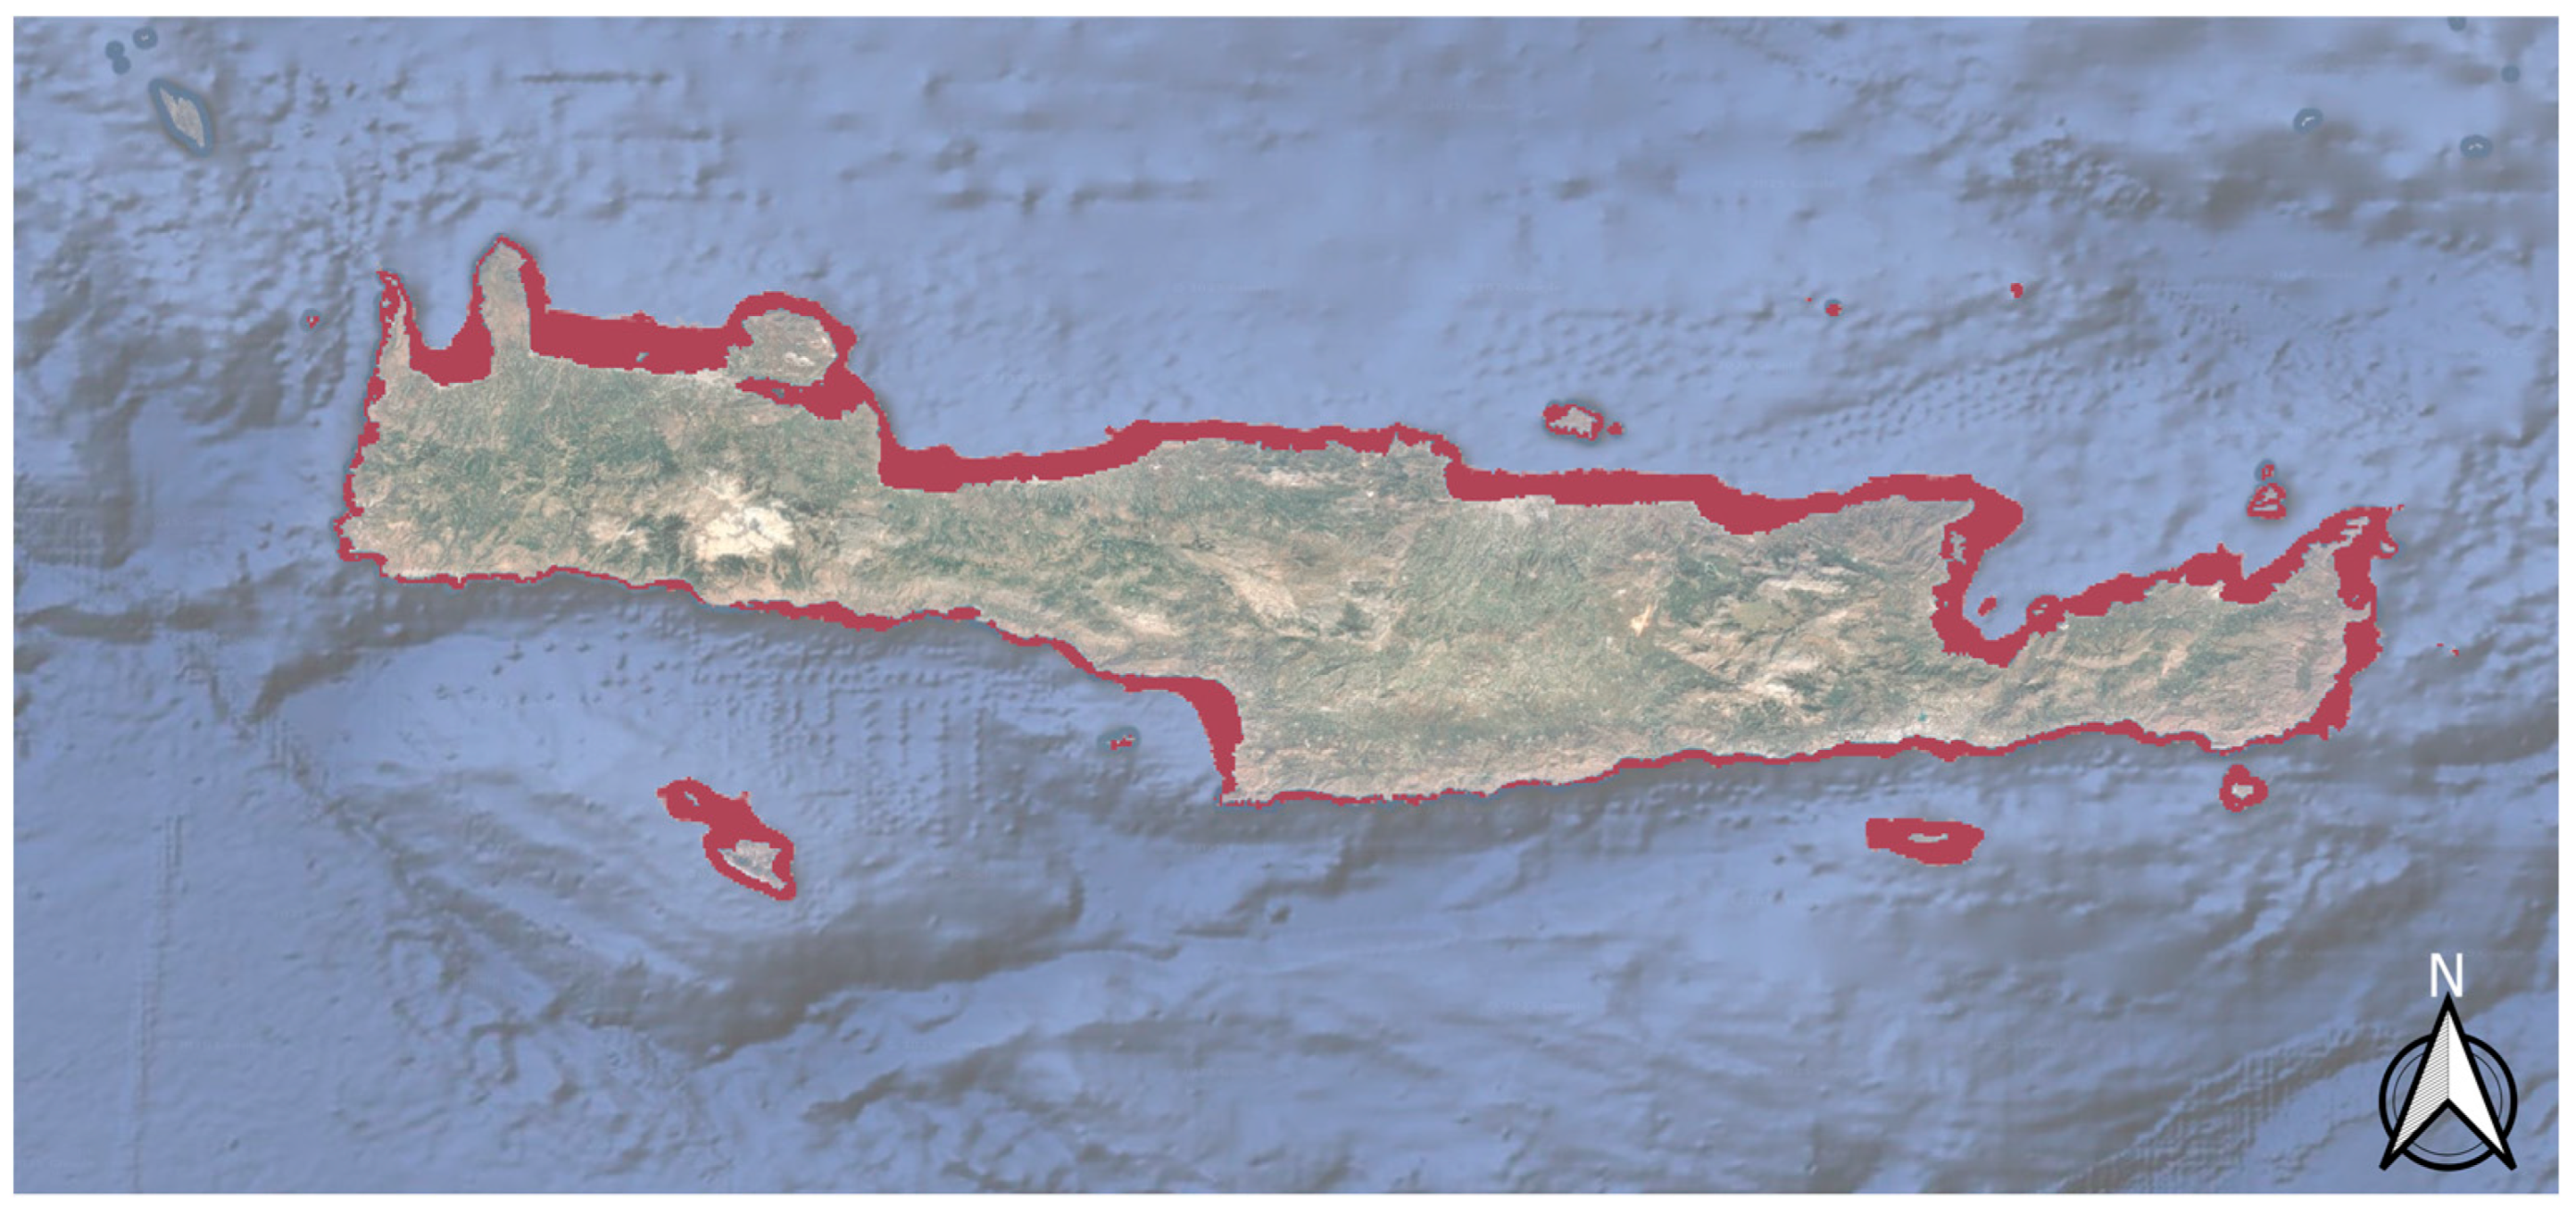
Figure 4 gives a general configuration of the coastal areas around Crete, where the wave induced action prevails among the rest loading drivers. In this zone, a preliminary check of resistance against sliding is advisable in order to ascertain whether an external stabilization scheme would be required.

5. Discussion

The comprehensive methodology applied in this study allows a straightforward identification of the critical hydrodynamic parameters upon which the design of seabed structures should be based. The presented results show that it is advisable to examine the full range of the said parameters instead of preselecting the “right” design criteria, based on experience and local conditions. This is so since the associated amount of experience among the profession is still inadequate to support presumptive identification of those criteria.
It can be seen from the applications given above that, frequently, the major interplay between hydrodynamic processes holds between oceanic circulation and wave-induced kinematics, governed by water depth. Such quantitative comparisons in terms of particle velocity can reveal that wind waves may be of primary importance in exposed sites up to intermediate depths. In such shallow depths, anchoring of the structure onto the sea floor may be required, as shown in the previous applications. This depends, as expected, on the actual loading received by the structure, including hydrodynamic along with actions of other origins. The former depends, as suggested by the results given, on the shape of the structure considered: the circular cylinder, commonly used in applications, offers a rather favourable shape in respect to the associated hydrodynamic resistance it provides. The latter actions can include non-hydrodynamic effects such as seabed scouring, earthquake effect, soil failure, etc., not dealt with in this article. Finally, the results show that the uplift forces should also be considered, especially in light structures, where an increase in their weight might be needed.

6. Conclusions

Based on the above exposition, the following concluding remarks can be drawn:
(a)
In order to address the hydrodynamic loading on seabed structures, a comprehensive methodology should be applied, like the one presented herein, rather than an empirical approach.
(b)
The effect of biofouling on the action values should be considered, especially in shallow and warm waters.
(c)
The effect of flow-induced vibrations can be negligible in the case of a protective cage but should be considered in the case of a free spanning cable, especially in shallow waters, where the increased water particle velocities are of the same order of magnitude as the critical flow velocity inducing cable vibration.
(d)
The approach presented in this article can also be applied to conduits of a tubular shape sitting on the sea floor; in such cases hydrostatic actions should also be taken into account.
(e)
In real-life applications, loads due to processes of other origin, e.g., seismic excitations, should be included in the method presented.
The present study employs theories based on simplified assumptions. Effects such as turbulence due to bed friction, upwelling in wind-generated flow, tidal contribution, interaction between the examined processes, etc., were not considered. Therefore, in design applications, it is advisable to incorporate generous safety margins, especially in shallow and tidal waters.

Author Contributions

Methodology, C.D.M.; Software, I.P.R.; Data curation, I.P.R. and A.M.; Writing—original draft, I.P.R. and A.M.; Writing—review & editing, C.D.M.; Supervision, C.D.M.; Project administration, C.D.M. All authors have read and agreed to the published version of the manuscript.

Funding

This research received no external funding.

Data Availability Statement

Datasets derived from publicly available sources were used in this study, including ocean circulation and current data from the Mediterranean Monitoring Forecasting Centre (MED MFC). Surface wave datasets were retrieved from the Copernicus Marine multi-year reanalysis product of the Mediterranean Sea Waves forecasting system (Med-WAV) available on the Marine Data Store (https://doi.org/10.25423/cmcc/medsea_multiyear_wav_006_012). Bathymetric data were based on Navionics Web-App nautical charts (https://webapp.navionics.com/?lang=en#boating, accessed on 25 September 2025). Data generated from the calculations conducted in this study are available from the corresponding author upon reasonable request.

Acknowledgments

The companies ECOS Consulting SA, Prysmian Group, and Electromed, are kindly acknowledged for providing data on the Attica–Crete electric connection.

Conflicts of Interest

The authors declare no conflict of interest.

References

  1. Koutitas, C. Mathematical Models in Coastal Engineering; Pentech Press: London, UK, 1988. [Google Scholar]
  2. US Army Corps of Engineers. Coastal Engineering Manual (CEM); U.S. Government Printing Office: Washington, DC, USA, 2003; Volume 6.
  3. Pond, S.; Pickard, G.L. Introductory Dynamical Oceanography, 2nd ed.; Pergamon Press: Oxford, UK, 1983. [Google Scholar]
  4. TU Delft. SwanOne User Manual, version 1.3; TU Delft: Delft, The Netherlands, 2018.
  5. IPCC. Climate Change 2023: Synthesis Report. Contribution of Working Groups I, II and III to the Sixth Assessment Report of the Intergovernmental Panel on Climate Change; Core Writing Team, Lee, H., Romero, J., Eds.; IPCC: Geneva, Switzerland, 2023. [Google Scholar]
  6. Makris, C.; Tolika, K.; Baltikas, V.; Velikou, K.; Krestenitis, Y. The impact of climate change on the storm surges of the Mediterranean Sea: Coastal sea level responses to deep depression atmospheric systems. Ocean Model. 2022, 178, 102149. [Google Scholar] [CrossRef]
  7. Makris, C.; Tolika, K.; Baltikas, V.; Velikou, K.; Krestenitis, Y. Climate change impacts on the coastal sea level extremes of the East-Central Mediterranean Sea. In Proceedings of the Protection and Restoration of the Environment XIV, Thessaloniki, Greece, 3–6 July 2018; pp. 695–704. [Google Scholar]
  8. Makris, C.; Nittis, K.; Lykos, A.; Papadopoulos, A.; Krestenitis, Y. Climate change effects on the marine characteristics of the Aegean and Ionian Seas. Ocean Dyn. 2016, 66, 1603–1635. [Google Scholar] [CrossRef]
  9. Galiatsatou, P.; Prinos, P. Estimating the effects of climate change on storm surge extremes in the Greek Seas. In Proceedings of the 36th IAHR World Congress, The Hague, The Netherlands, 28 June–3 July 2015; pp. 6825–6836. [Google Scholar]
  10. British Standards Institution. BS 6349-1-2: Maritime Works—Part 1–2: General—Code of Practice for Assessment of Actions; BSI: London, UK, 2016. [Google Scholar]
  11. Standards Norway. NORSOK Standard N-003: Actions and Action Effects; Standards Norway: Lysaker, Norway, 2017. [Google Scholar]
  12. DNVGL. Recommended Practice DNVGL-RP-F105: Free Spanning Pipelines; DNV GL: Høvik, Norway, 2017. [Google Scholar]
  13. Sarpkaya, T. In-line and transverse forces on cylinders in oscillatory flow at high Reynolds numbers. In Proceedings of the Offshore Technology Conference, Houston, TX, USA, 2–5 May 1976. [Google Scholar] [CrossRef]
  14. Dean, R.G.; Dalrymple, R.A. Water Wave Mechanics for Engineers and Scientists; World Scientific Publishing: Singapore, 1991. [Google Scholar]
  15. US Army Corps of Engineers. Shore Protection Manual, 4th ed.; U.S. Government Printing Office: Washington, DC, USA, 1984; Volume 2.
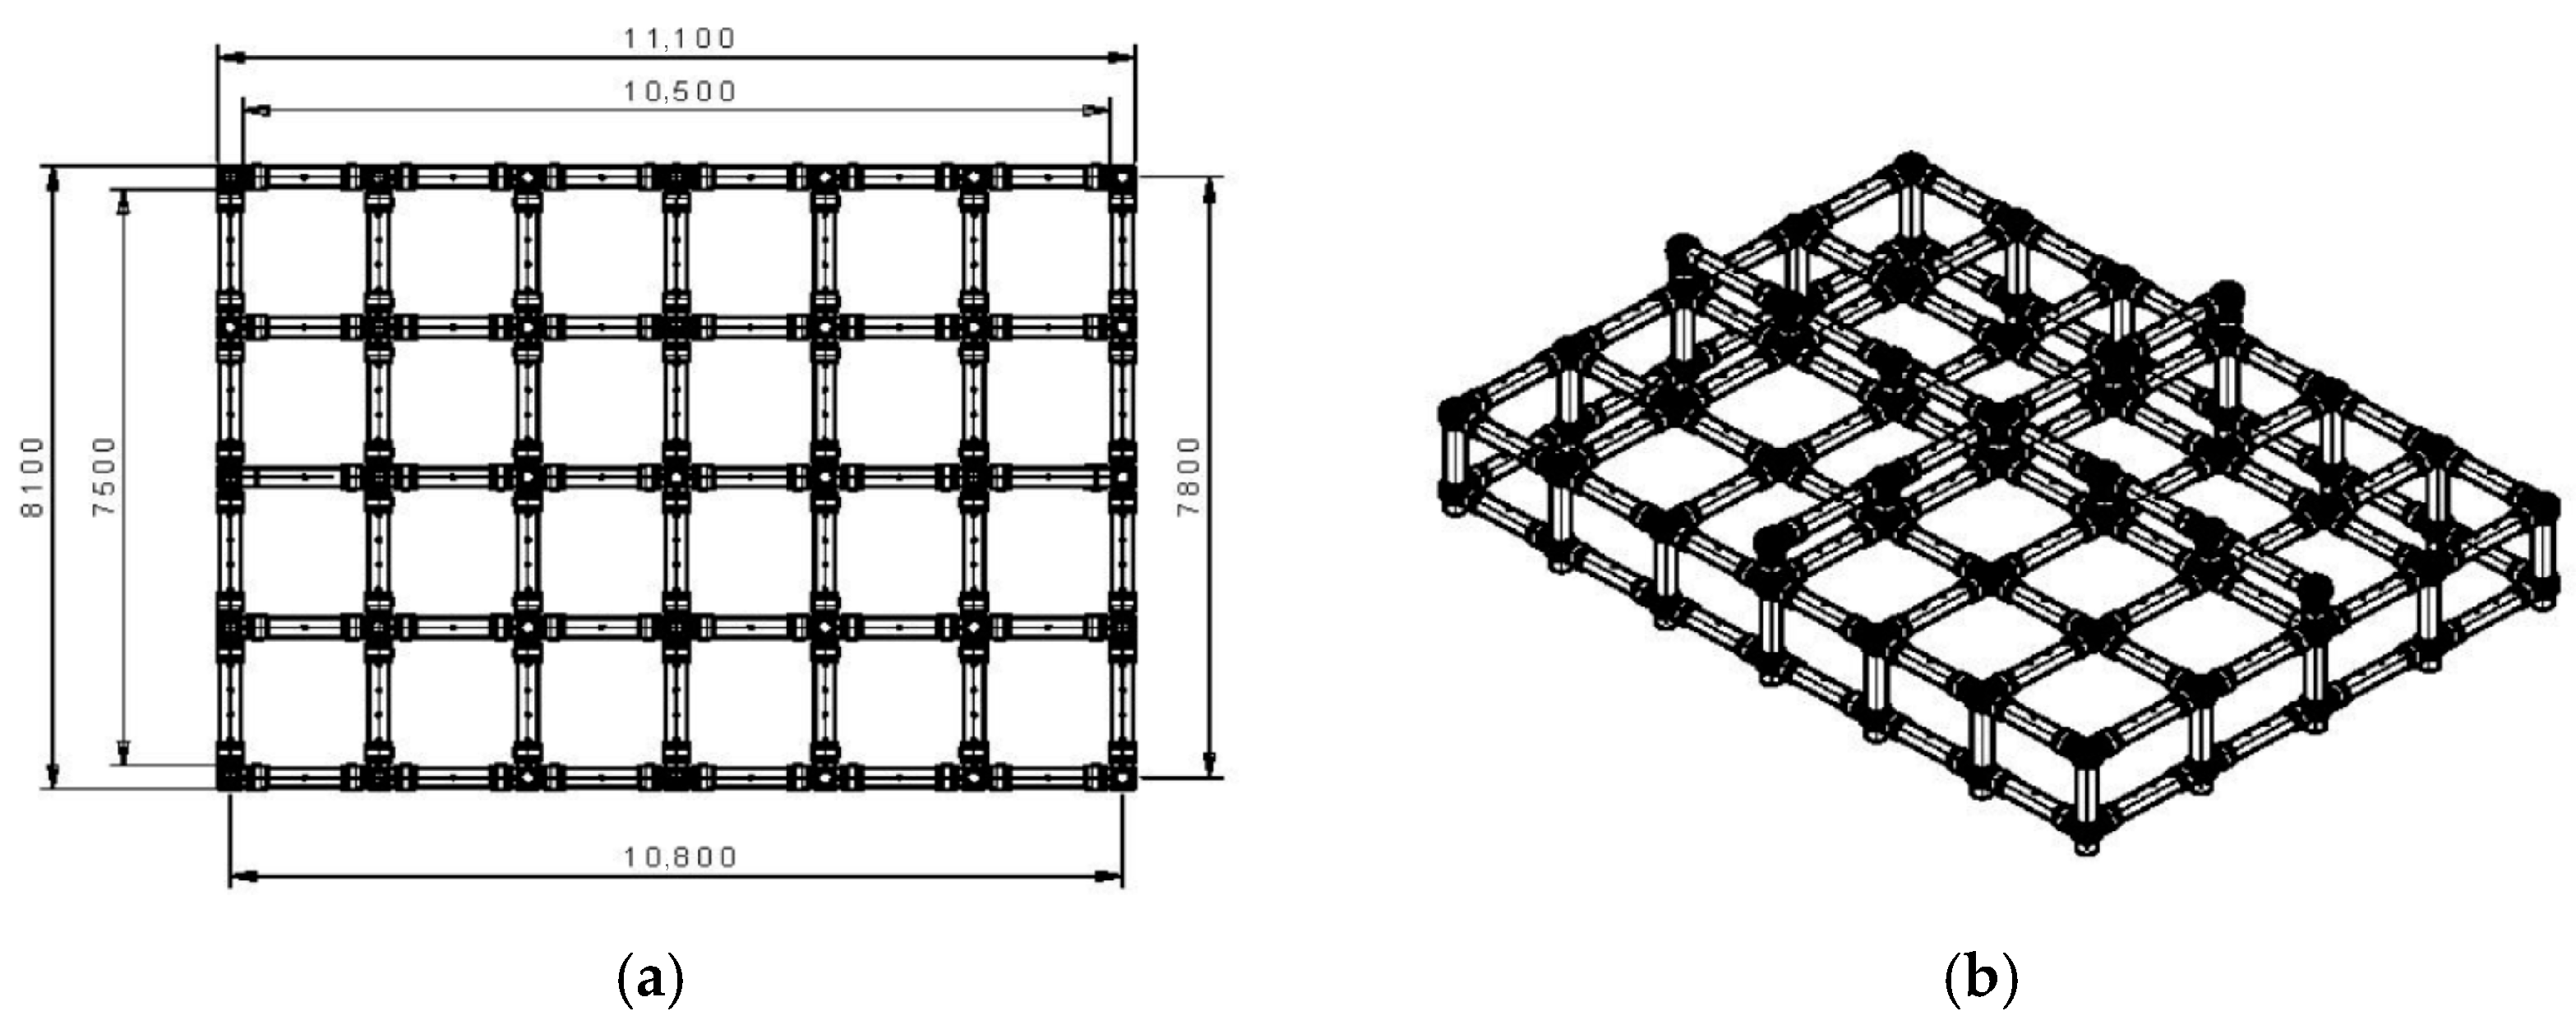
Figure 1. Protective cage of electrode station: (a) top view, (b) 3-D view.
Jmse 13 02057 g001
Figure 2. Typical cross section of studied electricity cable.
Jmse 13 02057 g002
Figure 3. Unofficial route of the Great Sea Interconnector.
Jmse 13 02057 g003
Figure 4. Spatial distribution of dominating hydrodynamic wave action (magenta colour).
Jmse 13 02057 g004
Table 1. Input values of drag coefficient C D .
Site C D 0 ( k / D ) ψ K C , a C D ψ p r o x i C D ψ t r e n c h C D ψ V I V C D C D
#1b0.991.181.401.002.043.34
#2b0.990.991.401.002.203.07
Table 2. Input values of inertia coefficient C M .
Site a C M , 0 ψ k C M ψ p r o x i C M ψ t r e n c h C M C Μ
#1b0.491.071.011.641.001.78
#2b0.011.621.011.641.002.69
Table 3. Total hydrodynamic load on the electricity cable-site #1b.
Particle Design VelocityDrag ForceInertia ForceUplift ForceTotal (Horiz.)
u s
(m/s)
F D
(kN/m)
F M
(kN/m)
F L
(kN/m)
Σ F H
(kN/m)
0.260.020.0080.0020.028
Table 4. Total hydrodynamic load on the electricity cable-site#2b.
Particle Design VelocityDrag ForceInertia ForceUplift ForceTotal (Horiz.)
u s
(m/s)
F D
(kN/m)
F M
(kN/m)
F L
(kN/m)
Σ F H
(kN/m)
1.120.3910.0470.0390.44
Table 5. Distribution of velocities, total loads and sliding resistance of the cable in relation to water depth.
PointDepthWave Induced Design VelocityCurrent Induced Design VelocityTotal Horizontal
Load
Sliding Check V s > 1.5
d
(m)
u w , s
(m/s)
u c , s
(m/s)
Σ F H
(kN/m)
V s
B3460.0070.1200.0035>>1.5
I490.7600.1450.27861.34
L152.5820.2782.60050.11
M3290.0090.0920.0023>>1.5
Disclaimer/Publisher’s Note: The statements, opinions and data contained in all publications are solely those of the individual author(s) and contributor(s) and not of MDPI and/or the editor(s). MDPI and/or the editor(s) disclaim responsibility for any injury to people or property resulting from any ideas, methods, instructions or products referred to in the content.