Methodological Overview of Hydrodynamic Loading on Seabed Structures in the South-East Mediterranean
Abstract
1. Introduction
2. Scope
3. Methodology Applied
3.1. General Considerations
3.2. Oceanic Circulation
3.3. Local Contributions
3.3.1. Wind-Induced Currents
3.3.2. Tsunamis
3.3.3. Surface Waves
3.4. Design Values
3.5. Climate Change
- (a)
- The currently acceptable trend of the increase in seawater temperature would correspondingly boost marine growth. Estimates of that increase are available at present, dependent on future carbon emissions. The issue is quite significant since the eastern Mediterranean is prone to high marine fouling due to the expected intense warming process of its waters in the years to come.
- (b)
- The stochastic met-ocean processes that affect seawater kinematics at our site, and thus should be considered in the context of climate change, include the atmospheric pressure field that mainly drives the general oceanic circulation; the local winds; and the wind-generated surface gravity waves.
- An increase of 14% to be adopted for the general oceanic circulation, given that model results for the maximum storm surges forecast an increase of about 3.5% for the South Aegean for the next 25 years [9].
- A wind-wave height increase of 12%, given that relative studies are expecting a tentative increase in the order of 3% in wave height Hs over the next 25 years [8].
- Based on data given in [6], a reduction by 12% of the return time in wind-induced currents’ extreme events is assumed in the present study.
4. Applications
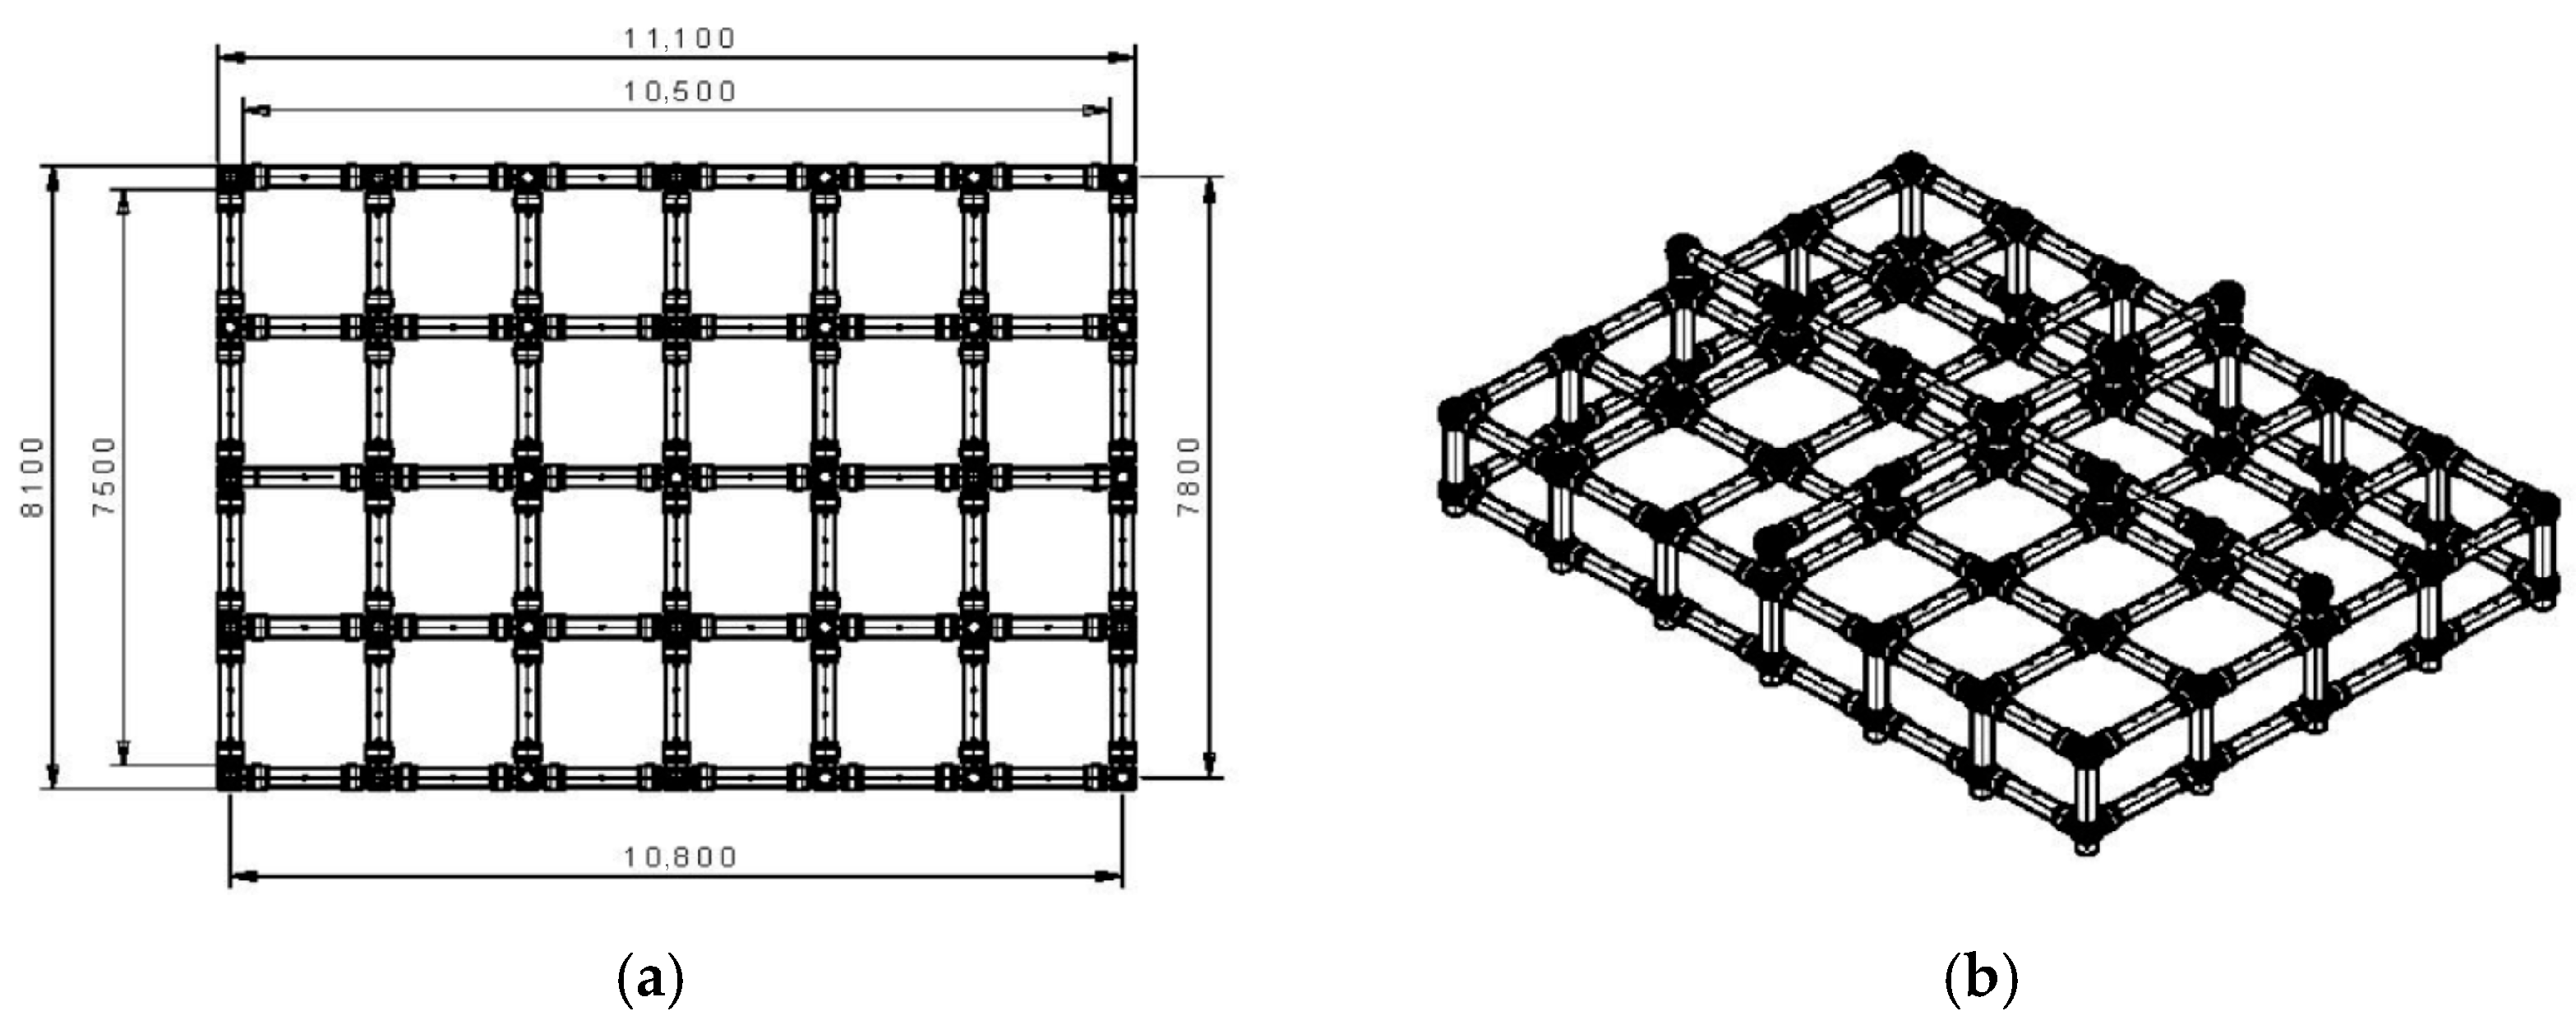
- Protective Cage: This structure has an orthogonal shape measuring 11.1 m × 8.1 m × 1.68 m (height), and is made of light material grid panels, while all faces of the structure are covered by a side protection grid. The outline shape of the protective cage is presented in Figure 1.
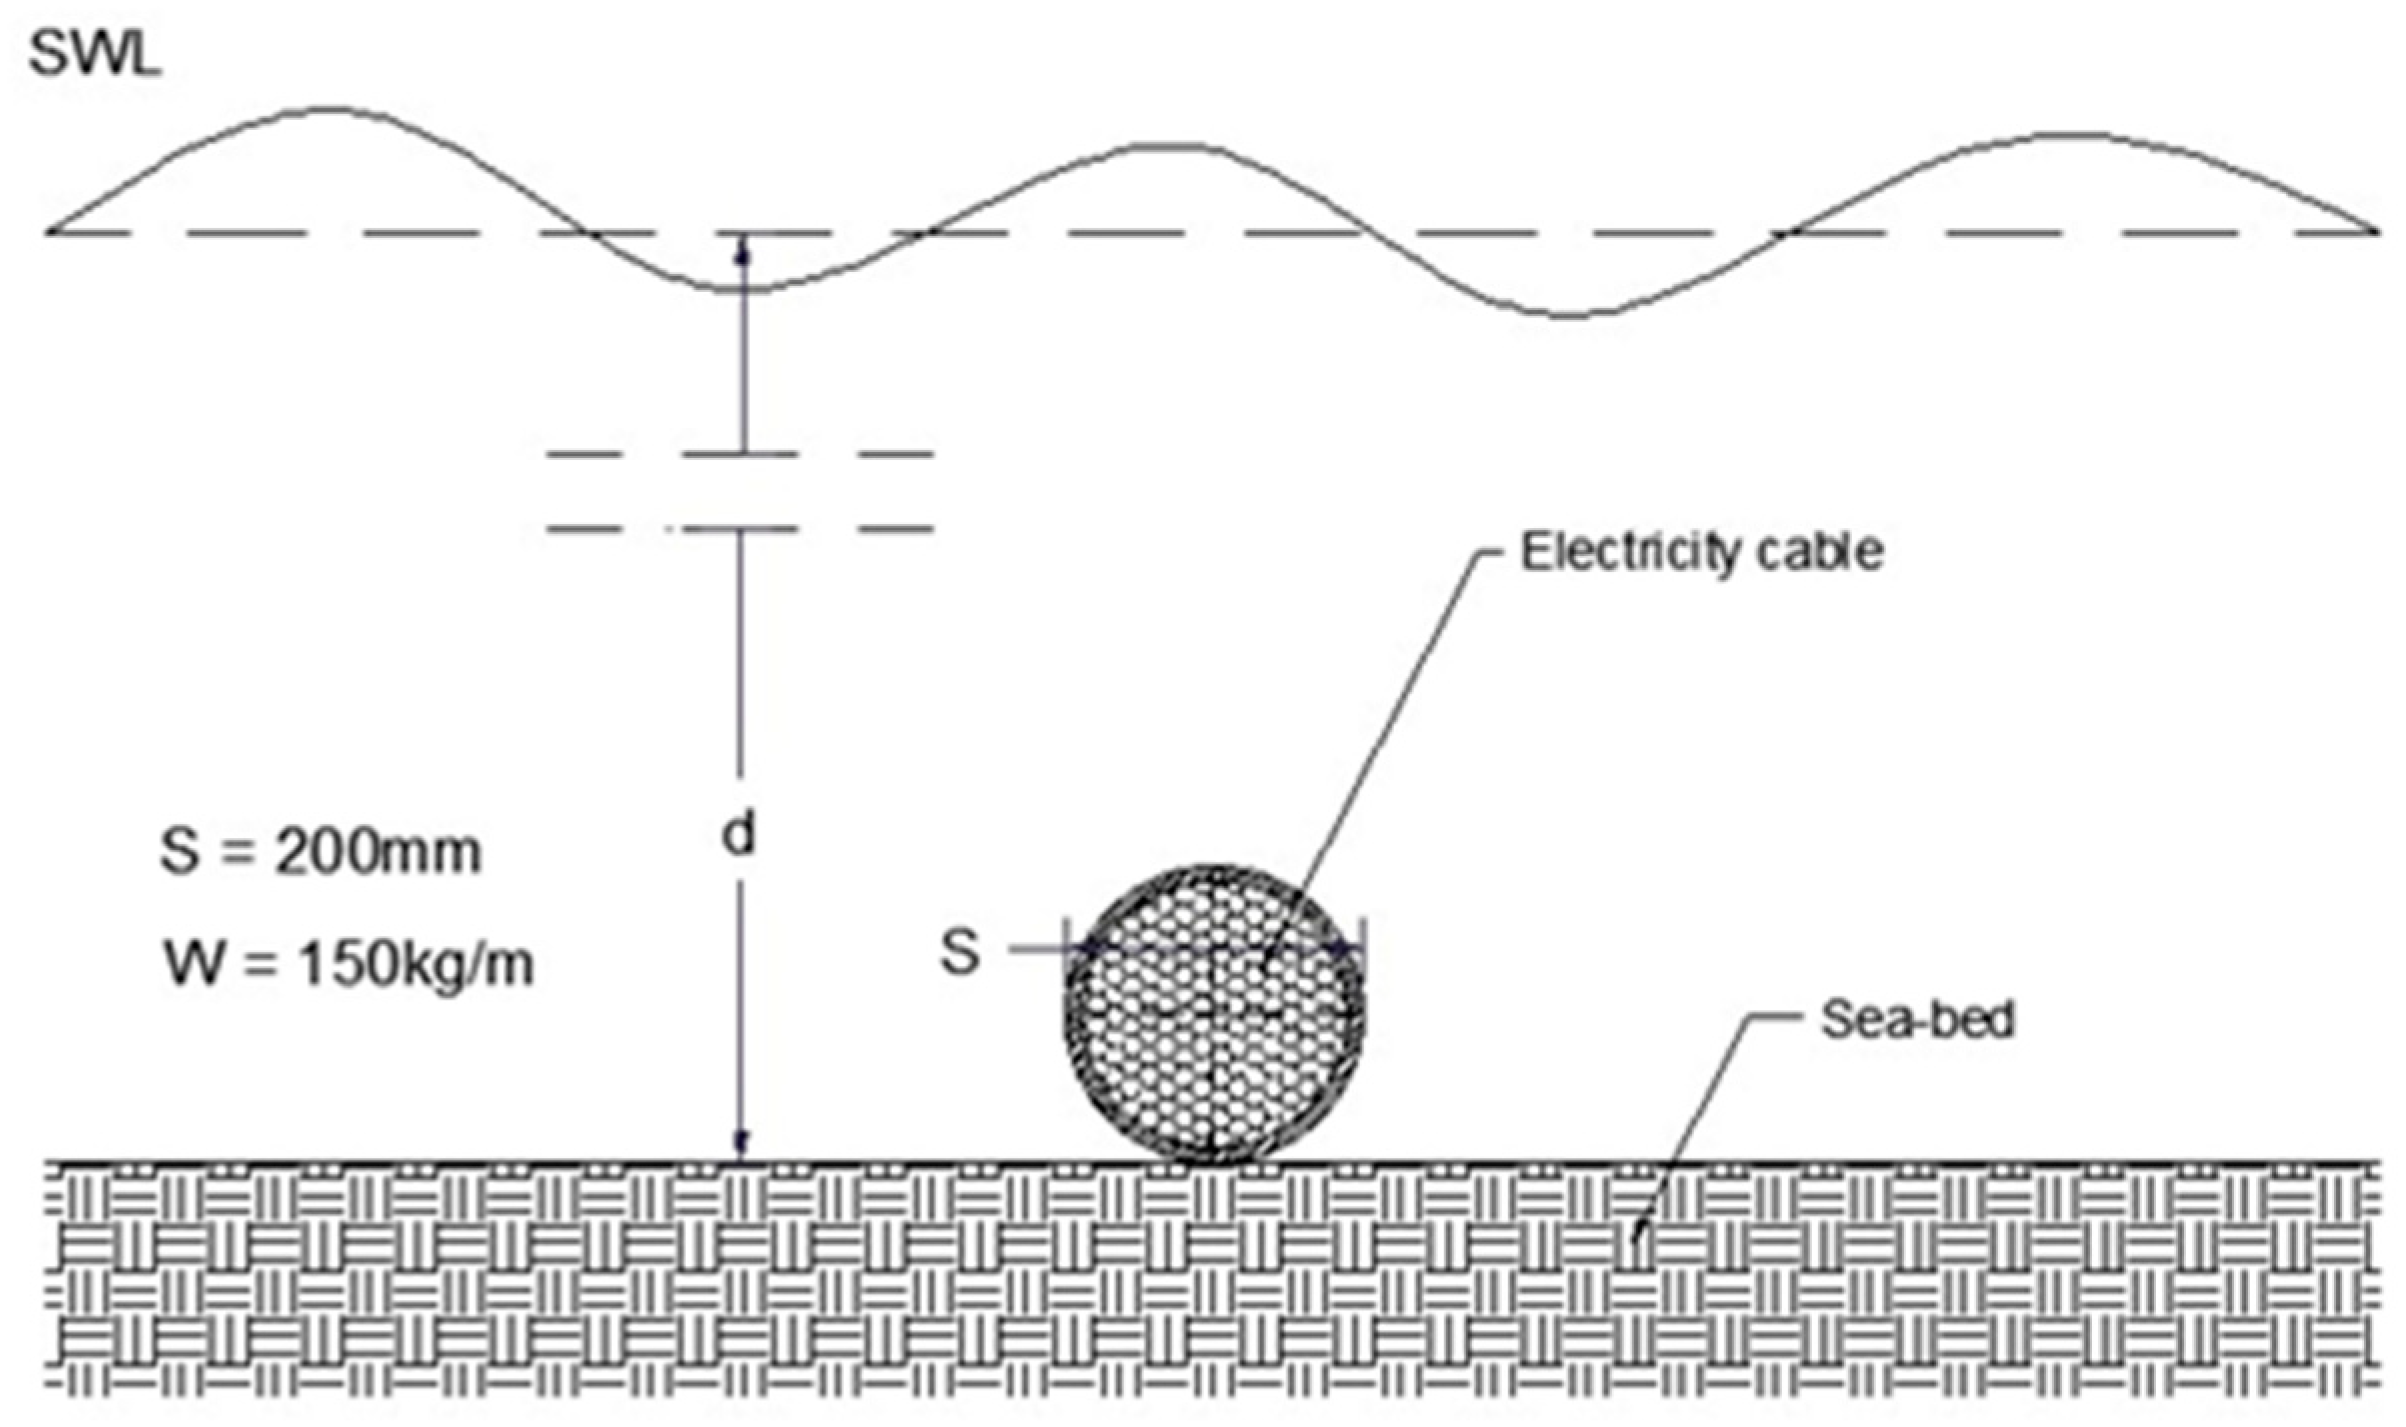
- Electricity cable: Regarding the main characteristics of the electricity cable, it was assumed to have a cylindrical cross section, with a diameter of 200 mm and a linear mass of 150 kg/m, representing the heavier structure of the aforementioned two design cases (see Figure 2).
4.1. Hydrodynamic Parameters
- Oceanic circulation, ui = 0.13 m/s maximum daily mean over 33 years of data.
- Local wind-generated current, uii = 0.03 m/s maximum value over 67 years of data.
- Tsunami effect, uiii = 0.16 m/s for a superelevation in the open sea of 0.40 m.
- Wind–waves motion, uiv = 0.12 m/s for Hm0 = 1.95 m, Tp = 8 s related to a return period of 200 years. The associated particle accelerations along the horizontal and the vertical are, respectively, ah = 0.10 m/s2 and av = 0.01 m/s2.
- Oceanic circulation, ui negligible along wave direction, maximum daily mean over 34.5 years of data.
- Local wind-generated current, uii = 0.10 m/s maximum value over 68 years of data.
- Tsunami effect, uiii = 0.72 m/s for a superelevation in the open sea of 1.5 m.
- Wind–waves motion, uiv = 1.10 m/s for Hm0 = 4.5 m, Tp = 11 s related to a return period of 50 years. The associated particle accelerations along the horizontal and the vertical are, respectively, ah = 0.62 m/s2 and av = 0.06 m/s2.
- Oceanic circulation, ui = 0.11 m/s maximum daily mean over 33 years of data.
- Local wind-generated current, uii = 0.005 m/s maximum value over 67 years of data.
- Tsunami effect, uiii = 0.09 m/s for a superelevation in the open sea of 0.40 m.
- Wind–waves motion, uiv = 0.12 m/s for Hm0 = 1.95 m, Tp = 8 s related to a return period of 200 years. The associated particle accelerations along the horizontal and the vertical are, respectively, ah = 0.09 m/s2 and av = 0.001 m/s2.
- (a)
- Oceanic circulation, ui negligible along wave direction maximum daily mean over 34.5 years of data.
- (b)
- Local wind-generated current, uii = 0.005 m/s maximum value over 68 years of data.
- (c)
- Tsunami effect, uiii = 0.65 m/s for a superelevation in the open sea of 1.5 m.
- (d)
- Wind–waves motion, uiv = 1.00 m/s for Hm0 = 4.5 m, Tp = 11 s related to a return period of 50 years. The associated particle accelerations along the horizontal and the vertical are, respectively, ah = 0.57 m/s2 and av = 0.005 m/s2.
4.2. Hydrodynamic Actions
4.2.1. Protective Cage
- Site #1a: The most critical action comes from the combination of the general oceanic circulation with the wave action and the addition to this result of the local wind-generated current. This yields a water particle design velocity of 0.30 m/s, while the associated accelerations due to waves are ah = 0.09 m/s2 and av = 0.01 m/s2. The leading action was evaluated for a 200y return period (RP), the accompanying action for 15y RP and the additional one for 60y RP. For the above design values the total horizontal load was estimated by Morison’s hypothesis, applicable to the structural components of the cage, to about 5 kN and the uplift to 1.5 kN. The design value of marine growth adopted here was of 4 cm thickness, assuming that the material to be used (polymers) will not be attracting high biofouling, as well as that frequent maintenance cleaning will be implemented.
- Site #2a: The most critical action comes from the combination of the general oceanic circulation with the wave action and the addition to this result of the local wind-generated current. This yields a particle design velocity of 0.30 m/s, while the associated accelerations due to waves are ah = 0.09 m/s2 and av = 0.01 m/s2. The leading action was evaluated for a 200y return period, the accompanying action for 15 y RP and the additional one for 60 y RP. For the above design values the total horizontal load was estimated by Morison’s hypothesis to 60 kN and the uplift to 18 kN. The design value of marine growth adopted here was 5 cm thick, assuming that the material to be used (polymers) will not be attracting high biofouling, as well as that frequent maintenance cleaning will be implemented.
- Sliding: A quick check of resistance against sliding leads to an underwater weight requirement for the cage of the order of 13 kN and 150 kN for sites #1a and #2a, respectively. It became evident that, for the case of site #2a, the structure under consideration should display an underwater weight more than 100 kN to resist sliding on a horizontal seabed of favourable soil composition. However, the protective cage was designed of quite light PVC, meaning that drastic intervention was needed to counteract any risk of sliding. The main option proposed was to place 4 mass structures (dead-men) of a layout embracing the corners of the cage, providing enough weight to safeguard the non-sliding of the protective structure. For a horizontal seabed with a sliding coefficient 0.4, the required weight of each concrete unit would be of the order of 5 tf in air. Four typical precast concrete units placed on the seabed around the modules were proposed, with nylon ropes anchoring the protective cage on those units.
- Vibrations: The possibility of vibrations developing on members of the cage can be ignored. This is because the natural frequency of the upper horizontal beams, most prone to be excited by this process, is an order of magnitude higher than that of the driving action due to waves. Also, the mode of eddy shedding is redundant due again to the higher, by an order of magnitude, critical velocity required for the inception of vibration. The above result holds for both sites #1a, #2a.
4.2.2. Electricity Cable
- Site #1b: The most critical action comes from the combination of the general oceanic circulation with the wave action and the addition to this result of the local wind-generated current. This yields a particle design velocity of 0.26 m/s, while the associated accelerations due to waves are ah = 0.1 m/s2 and av = 0.001 m/s2. The leading action was evaluated for a 200 y return period, the accompanying action for 15 y RP and the additional one for 60 y RP. The total resulting load on the electricity cable at site #1b, estimated by Morison’s hypothesis, is presented in Table 3. It is noted that the values presented in Table 3 and Table 4 refer to the instant when the maximum total action occurs.
- Site #2b: The most critical action comes from the combination of wind waves with the local wind-generated current. This yields a particle design velocity of 1.12 m/s, while the associated accelerations due to waves are ah = 0.65 m/s2 and av = 0.005 m/s2. The leading action was evaluated for a 200 y return period, the accompanying one for 15 y RP. The total resulting load on the electricity cable at site #2b, estimated by Morison’s hypothesis, is presented in Table 4.
- Sliding: A quick check of resistance against sliding with sliding coefficient 0.33, confirms that the considerable weight of the electricity cable is enough to achieve stability at site #1b, without the need of an external stabilization scheme. However, at site #2b the prevalent wave conditions constitute a loading environment that leads to the need of external stabilization. It is noted at this point that the results of the stability checks can vary at waters of intermediate depth, such as in the above sites, due to the strong correlation of the hydrodynamic forces with the characteristics of the design wave and the respective water particle velocities.
4.2.3. Cable Stability on a Greater Scale
5. Discussion
6. Conclusions
- (a)
- In order to address the hydrodynamic loading on seabed structures, a comprehensive methodology should be applied, like the one presented herein, rather than an empirical approach.
- (b)
- The effect of biofouling on the action values should be considered, especially in shallow and warm waters.
- (c)
- The effect of flow-induced vibrations can be negligible in the case of a protective cage but should be considered in the case of a free spanning cable, especially in shallow waters, where the increased water particle velocities are of the same order of magnitude as the critical flow velocity inducing cable vibration.
- (d)
- The approach presented in this article can also be applied to conduits of a tubular shape sitting on the sea floor; in such cases hydrostatic actions should also be taken into account.
- (e)
- In real-life applications, loads due to processes of other origin, e.g., seismic excitations, should be included in the method presented.
Author Contributions
Funding
Data Availability Statement
Acknowledgments
Conflicts of Interest
References
- Koutitas, C. Mathematical Models in Coastal Engineering; Pentech Press: London, UK, 1988. [Google Scholar]
- US Army Corps of Engineers. Coastal Engineering Manual (CEM); U.S. Government Printing Office: Washington, DC, USA, 2003; Volume 6.
- Pond, S.; Pickard, G.L. Introductory Dynamical Oceanography, 2nd ed.; Pergamon Press: Oxford, UK, 1983. [Google Scholar]
- TU Delft. SwanOne User Manual, version 1.3; TU Delft: Delft, The Netherlands, 2018.
- IPCC. Climate Change 2023: Synthesis Report. Contribution of Working Groups I, II and III to the Sixth Assessment Report of the Intergovernmental Panel on Climate Change; Core Writing Team, Lee, H., Romero, J., Eds.; IPCC: Geneva, Switzerland, 2023. [Google Scholar]
- Makris, C.; Tolika, K.; Baltikas, V.; Velikou, K.; Krestenitis, Y. The impact of climate change on the storm surges of the Mediterranean Sea: Coastal sea level responses to deep depression atmospheric systems. Ocean Model. 2022, 178, 102149. [Google Scholar] [CrossRef]
- Makris, C.; Tolika, K.; Baltikas, V.; Velikou, K.; Krestenitis, Y. Climate change impacts on the coastal sea level extremes of the East-Central Mediterranean Sea. In Proceedings of the Protection and Restoration of the Environment XIV, Thessaloniki, Greece, 3–6 July 2018; pp. 695–704. [Google Scholar]
- Makris, C.; Nittis, K.; Lykos, A.; Papadopoulos, A.; Krestenitis, Y. Climate change effects on the marine characteristics of the Aegean and Ionian Seas. Ocean Dyn. 2016, 66, 1603–1635. [Google Scholar] [CrossRef]
- Galiatsatou, P.; Prinos, P. Estimating the effects of climate change on storm surge extremes in the Greek Seas. In Proceedings of the 36th IAHR World Congress, The Hague, The Netherlands, 28 June–3 July 2015; pp. 6825–6836. [Google Scholar]
- British Standards Institution. BS 6349-1-2: Maritime Works—Part 1–2: General—Code of Practice for Assessment of Actions; BSI: London, UK, 2016. [Google Scholar]
- Standards Norway. NORSOK Standard N-003: Actions and Action Effects; Standards Norway: Lysaker, Norway, 2017. [Google Scholar]
- DNVGL. Recommended Practice DNVGL-RP-F105: Free Spanning Pipelines; DNV GL: Høvik, Norway, 2017. [Google Scholar]
- Sarpkaya, T. In-line and transverse forces on cylinders in oscillatory flow at high Reynolds numbers. In Proceedings of the Offshore Technology Conference, Houston, TX, USA, 2–5 May 1976. [Google Scholar] [CrossRef]
- Dean, R.G.; Dalrymple, R.A. Water Wave Mechanics for Engineers and Scientists; World Scientific Publishing: Singapore, 1991. [Google Scholar]
- US Army Corps of Engineers. Shore Protection Manual, 4th ed.; U.S. Government Printing Office: Washington, DC, USA, 1984; Volume 2.


| Site | ||||||
|---|---|---|---|---|---|---|
| #1b | 0.99 | 1.18 | 1.40 | 1.00 | 2.04 | 3.34 |
| #2b | 0.99 | 0.99 | 1.40 | 1.00 | 2.20 | 3.07 |
| Site | ||||||
|---|---|---|---|---|---|---|
| #1b | 0.49 | 1.07 | 1.01 | 1.64 | 1.00 | 1.78 |
| #2b | 0.01 | 1.62 | 1.01 | 1.64 | 1.00 | 2.69 |
| Particle Design Velocity | Drag Force | Inertia Force | Uplift Force | Total (Horiz.) |
|---|---|---|---|---|
(m/s) | (kN/m) | (kN/m) | (kN/m) | (kN/m) |
| 0.26 | 0.02 | 0.008 | 0.002 | 0.028 |
| Particle Design Velocity | Drag Force | Inertia Force | Uplift Force | Total (Horiz.) |
|---|---|---|---|---|
(m/s) | (kN/m) | (kN/m) | (kN/m) | (kN/m) |
| 1.12 | 0.391 | 0.047 | 0.039 | 0.44 |
| Point | Depth | Wave Induced Design Velocity | Current Induced Design Velocity | Total Horizontal Load | Sliding Check |
|---|---|---|---|---|---|
(m) | (m/s) | (m/s) | (kN/m) | ||
| B | 346 | 0.007 | 0.120 | 0.0035 | >>1.5 |
| I | 49 | 0.760 | 0.145 | 0.2786 | 1.34 |
| L | 15 | 2.582 | 0.278 | 2.6005 | 0.11 |
| M | 329 | 0.009 | 0.092 | 0.0023 | >>1.5 |
Disclaimer/Publisher’s Note: The statements, opinions and data contained in all publications are solely those of the individual author(s) and contributor(s) and not of MDPI and/or the editor(s). MDPI and/or the editor(s) disclaim responsibility for any injury to people or property resulting from any ideas, methods, instructions or products referred to in the content. |
© 2025 by the authors. Licensee MDPI, Basel, Switzerland. This article is an open access article distributed under the terms and conditions of the Creative Commons Attribution (CC BY) license (https://creativecommons.org/licenses/by/4.0/).
Share and Cite
Memos, C.D.; Roupas, I.P.; Mylonas, A. Methodological Overview of Hydrodynamic Loading on Seabed Structures in the South-East Mediterranean. J. Mar. Sci. Eng. 2025, 13, 2057. https://doi.org/10.3390/jmse13112057
Memos CD, Roupas IP, Mylonas A. Methodological Overview of Hydrodynamic Loading on Seabed Structures in the South-East Mediterranean. Journal of Marine Science and Engineering. 2025; 13(11):2057. https://doi.org/10.3390/jmse13112057
Chicago/Turabian StyleMemos, Constantine D., Ioannis P. Roupas, and Antonios Mylonas. 2025. "Methodological Overview of Hydrodynamic Loading on Seabed Structures in the South-East Mediterranean" Journal of Marine Science and Engineering 13, no. 11: 2057. https://doi.org/10.3390/jmse13112057
APA StyleMemos, C. D., Roupas, I. P., & Mylonas, A. (2025). Methodological Overview of Hydrodynamic Loading on Seabed Structures in the South-East Mediterranean. Journal of Marine Science and Engineering, 13(11), 2057. https://doi.org/10.3390/jmse13112057


