Article

Numerical Study on the Keying of Suction Embedded Plate Anchors with Chain Effects

by
Xue Li
1,2,
Wei Yan
1,2,
Yanbing Zhao
1,2,*,
Yongye Li
1,2,
Yan Zhang
3 and
Yun Lang
1,2
1
College of Water Resources Science and Engineering, Taiyuan University of Technology, Taiyuan 030024, China
2
Shanxi Key Laboratory of Collaborative Utilization of River Basin Water Resources, Taiyuan University of Technology, Taiyuan 300072, China
3
State Key Laboratory of Water Cycle and Water Security, China Institute of Water Resources and Hydropower Research, Beijing 100038, China
*
Author to whom correspondence should be addressed.
J. Mar. Sci. Eng. 2025, 13(11), 2056; https://doi.org/10.3390/jmse13112056
Submission received: 23 September 2025 / Revised: 17 October 2025 / Accepted: 24 October 2025 / Published: 27 October 2025
(This article belongs to the Section Ocean Engineering)

Abstract

Suction embedded plate anchors are widely used in deepwater mooring systems, which can withstand significant vertical loading. During the installation, the mooring chain is tensioned and causes the anchor to rotate, which is known as keying. With a large deformation finite element approach of the coupled Eulerian–Lagrangian method, the chain effects are incorporated into the keying of suction embedded plate anchors. The effectiveness of the proposed method is verified by numerical results and centrifuge tests. The numerical study reveals that the installation angle of the chain has a significant effect on the loss of embedment, especially combined with the effects of load eccentricity and soil strength. The losses of embedment are 0.024~0.273 and 0.217~1.755 anchor width for the installation angles of 15° and 90°, respectively. The ultimate bearing capacity factor decreases with the increasing of load eccentricity and soil strength, because a cavity is formed at the anchor back. Empirical formulae are finally developed for engineers to rapidly estimate the embedment loss and ultimate pullout capacity of suction embedded plate anchors.

1. Introduction

The exploration of oil and gas resources in deep and ultra-deep waters poses significant challenges for floating platforms [1], where mooring systems play a critical role in ensuring structural positioning and stability. Suction embedded plate anchors (SEPLAs) are regarded as deep and ultra-deep water mooring solutions because of their precise positioning and high bearing capacity [2,3,4]. The SEPLA is embedded to the targeted depth assisted with the suction caisson [5], as shown in Figure 1. The SEPLA is vertically located in the seabed when the suction caisson is retrieved. The mooring chain is then tensioned, causing the SEPLA to rotate to an inclination that is approximately normal to the chain, which is known as the keying of SEPLA. The keying of SEPLA will induce a loss of embedment Δz, resulting in the decrease in anchor-bearing capacity.
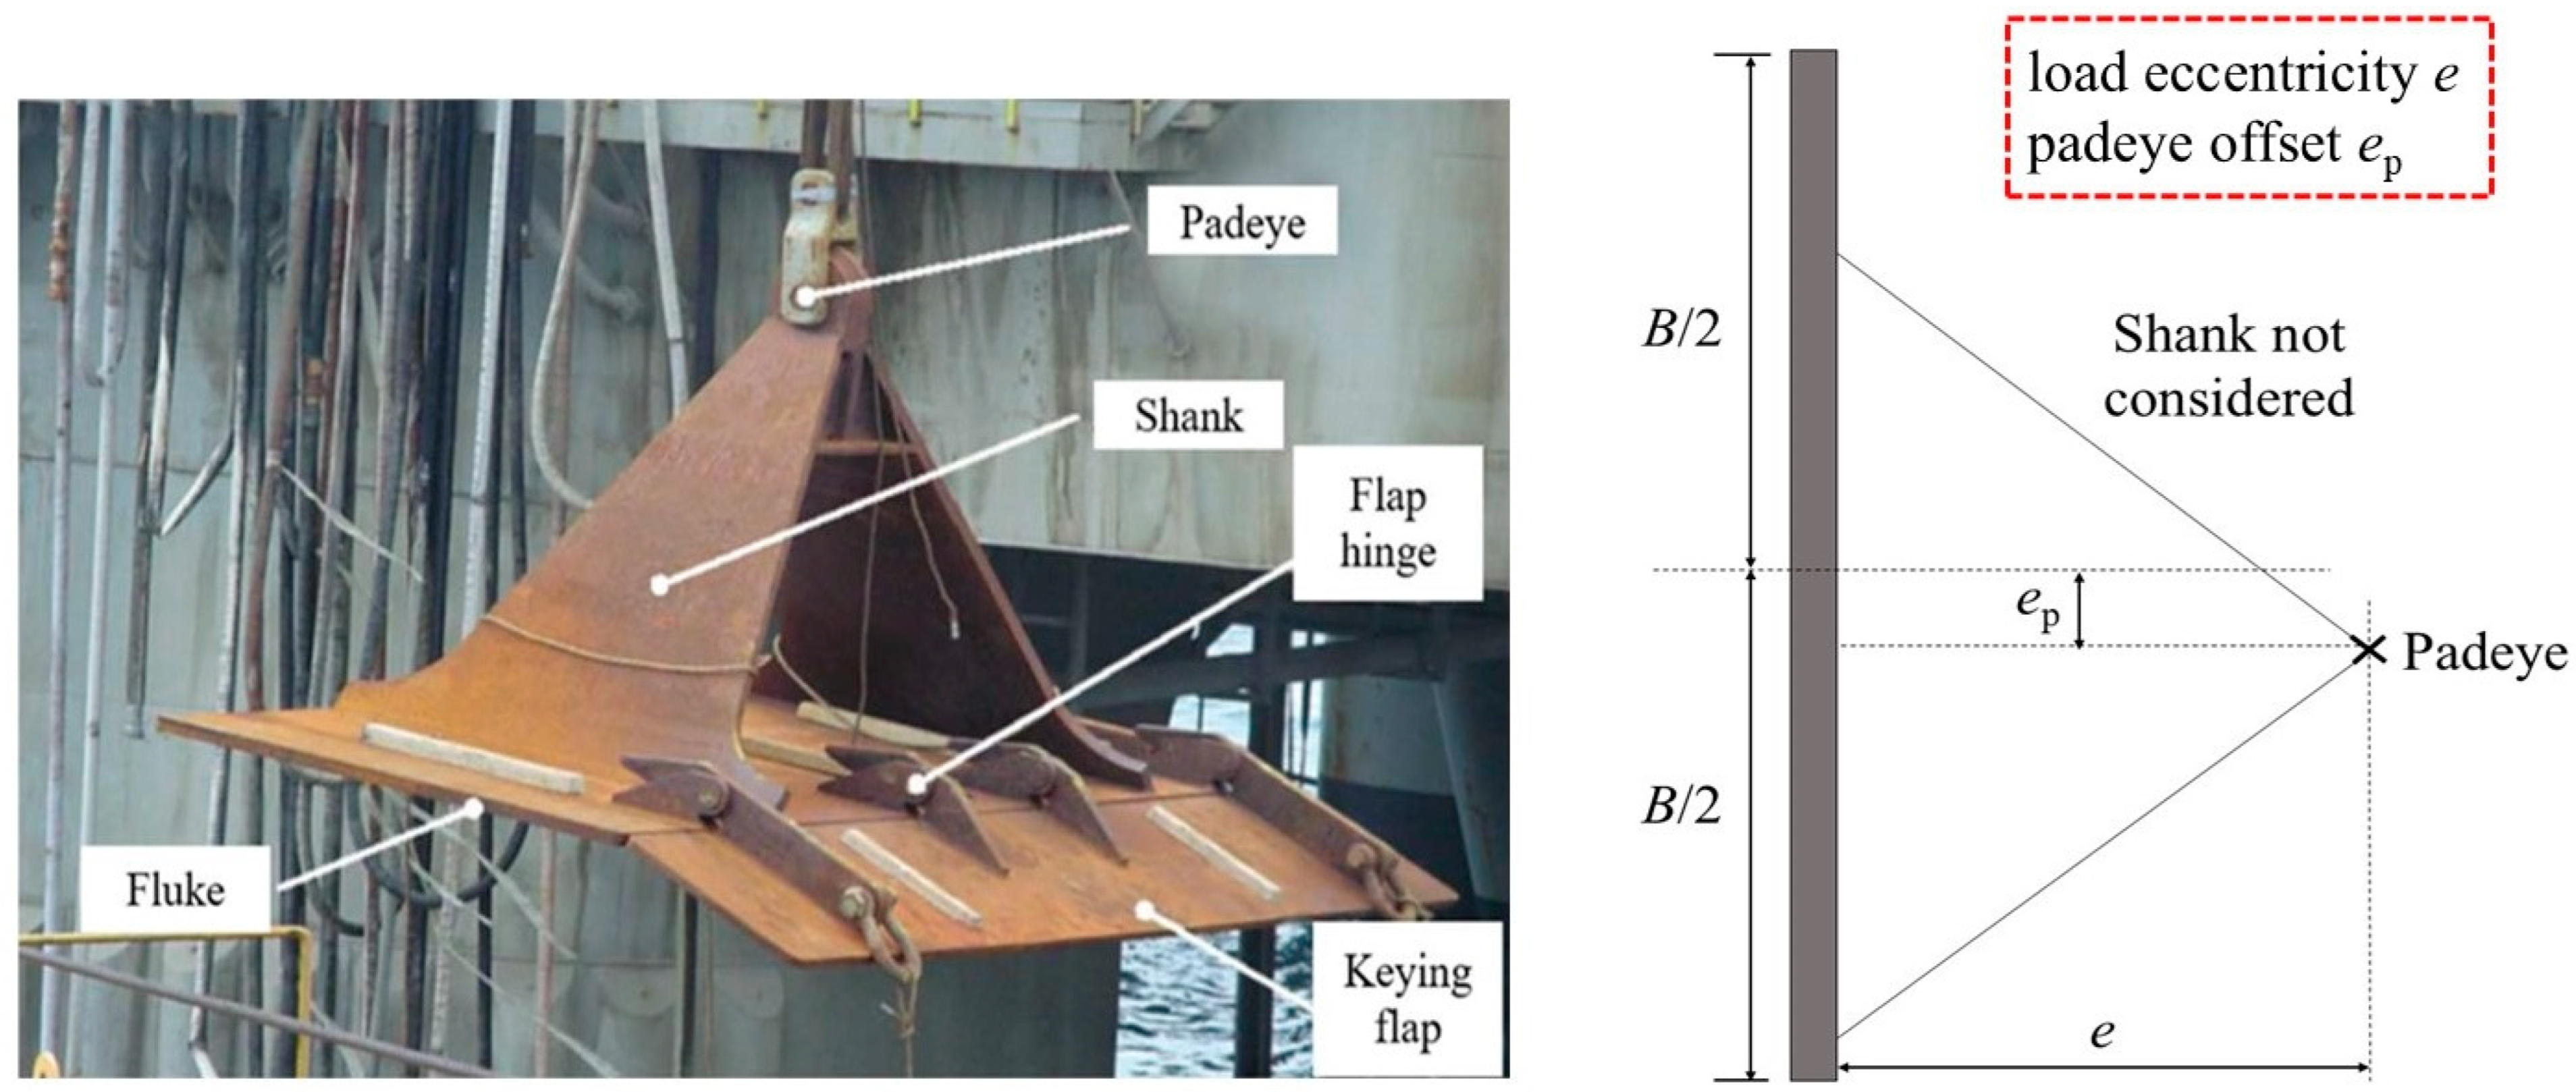
The keying of SEPLAs involves the interactions among mooring chain, anchor and soil. Previous studies paid more attention on the effect of anchor–soil interaction on the loss of embedment, in which a vertical load or velocity was applied at the padeye until the SEPLA rotated horizontally without the chain effect. It was demonstrated that the loss of embedment is highly sensitive to anchor geometry (Figure 2), such as load eccentricity [7,8], padeye offset [9,10,11,12,13,14], flap [12,13,14,15,16] and shank [17]. Centrifuge tests by O’Loughlin [7] found that the loss of embedment increased from 0.1B to 1.5B with load eccentricity decreasing from 1.0 to 0.17, in which B is the anchor width. Large deformation finite element (LDFE) analysis by Yu et al. [8] found that the loss of embedment increased from 0.21B to 1.01B, when the load eccentricity decreased from 1.0 to 0.25 for square anchors. Tian et al. [9,10,11,12,13] paid attention to the effect of padeye offset on the “diving” performance of SEPLAs. Results indicated that the padeye offset enhanced the ability of the anchor to dive and hence the loss of the embedment was reduced. Centrifuge tests reported that the flap did not create any reduction in embedment loss, because the flap hardly rotates during keying [16]. However, new designs of the flap could reduce the loss of embedment, such as the inward flap by Tian et al. [13] and restrained flap by Liu et al. [15]. The embedment loss reduced with taking the shank into account [17]. For the pull of installation angle θe of 40°, the embedment loss was reduced from 0.318B to 0.164B (nearly twice) when the shank was considered. Furthermore, some papers [6,18,19,20,21,22] have investigated the influence of soil properties on the keying of SEPLAs, including the effects of soil remodeling [6,21].
During the keying of SEPLAs, the mooring chain forms a reverse catenary shape in the soil, interacting with the anchor at the padeye, as shown in Figure 1. It is reported by centrifuge tests that the mooring chain also has a significant effect on the loss of embedment. Gaudin et al. [23] found that the losses of embedment were 0.25B and 1.15B in the centrifuge test with the installation angle θe of 45°and 90°, respectively. Centrifuge tests conducted by Song et al. [18] reported that the losses of embedment were 0.33B and 0.65B with the installation angle θe of 60°and 90°, respectively. In the theoretical analysis, the effect of mooring chain was considered by a chain equation, such as the plasticity model [17,24,25] and the mechanical model [26]. The plasticity model described the keying of SEPLAs as a yield envelope that fitted by finite element (FE) analysis. Combined with the chain equation, the loss of embedment was obtained by incremental calculations. The retrospective simulation of anchor keying was performed by the plasticity model, where the simulation results agreed well with the centrifuge test data under the installation angle θe of 40° [17]. The mechanical model was developed on the limit equilibrium method, which proved that the loss of embedment ranged from 0.19B to 1.13B for the installation angle θe between 0°and 90° [26].
For FE analysis, there were two solutions to incorporate the chain effect into the keying of SEPLAs, i.e., combining with the chain equation and constructing the chain by FE method. Song et al. [27] incorporated the chain equation into the LDFE analysis with the remeshing and interpolation technique with small strain (RITSS). It was found by the RITSS analysis that the loss of embedment ranged from 0.24B to 0.51B for the installation angle θe of 30°~90°. Zhao et al. [28] adopted the coupled Eulerian–Lagrangian (CEL) method to simulate the keying of SEPLAs, where the mooring chain was constructed by connecting cylindrical elements with LINK connectors. The effectiveness of the CEL analysis was validated by the centrifuge test data of Song et al. [27] under the installation angle θe of 60°. The diameter of the chain is much smaller, while the length of the chain is much longer than the anchor width. This results in massive soil elements, and hence a time-consuming computation. To improve the computational efficiency, the chain equation was incorporated into the CEL analysis by Zhao et al. [29], using a user subroutine VUAMP written in FORTRAN. It was demonstrated that the computation time by VUAMP was 36.7~41.6% smaller than that by LINK connectors. However, Zhao et al. [29] focused on the investigation of drag anchor installation, while giving little attention to the keying of SEPLAs.
Overall, most of the previous studies focused on the keying of SEPLAs without considering the chain effects. The keying of SEPLAs is a coupled process where the anchor, chain and seabed interact with each other. It was proved by model tests [18,23] that the chain plays a significant role in the keying of SEPLAs. Nevertheless, it is a challenge to effectively incorporate chain effects into the numerical analysis. Although some studies have addressed this issue in the FE analysis [27,28,29], almost no one has systematically investigated the influence of chain effects on the keying of SEPLAs.
In the present study, the CEL model was established to analyze the keying of SEPLAs, incorporating chain effects by a user subroutine VUAMP. A sensitivity analysis was first performed to determine the parameters introduced in the subroutine. The CEL results were then compared with those of RITSS and CASPA and model test to prove its validity. With chain effects, the influences of installation angle, load eccentricity, soil strength and mechanical parameters of the chain on the keying of the SEPLAs were investigated. Finally, empirical formulae were established for the embedment loss and ultimate bearing capacity of SEPLAs.

2. Numerical Modeling

2.1. CEL Method

For large deformation problems like the keying of SEPLAs, the traditional FE method is unsuitable. As the soil deformation grows, soil meshes may severely distort, causing convergence issues. The CEL method, a LDFE approach, was widely used in analyzing geotechnical problems [20,28,29,30,31,32]. The CEL method divides the FE model into two parts, i.e., Eulerian meshes for the soil where material flows in fixed meshes, and Lagrangian meshes for the anchor that moves with the material. During the Lagrangian phase, nodes are assumed to be temporarily fixed within the material, and elements deform with the material. A tolerance is used to determine which elements are significantly deformed at the end of the Lagrangian phase. During the Eulerian phase, the deformation is suspended, and elements with significant deformation are automatically remeshed. The convergence issues can be effectively solved by the Eulerian algorithm [33]. The CEL method uses an explicit time integration scheme [28]. The unknown solution in the next time step can be directly calculated by the solution of the previous time step without any iteration. A critical increment is introduced at each time step to ensure numerical stability. The CEL method tracks soil–structure contact changes via structural boundaries, and calculates the Eulerian volume fraction (EVF) for each element to track soil deformation. EVF = 1 indicates the element is full of soil, while EVF = 0 means no soil is present.

2.2. CEL Model

2.2.1. Model Establishment

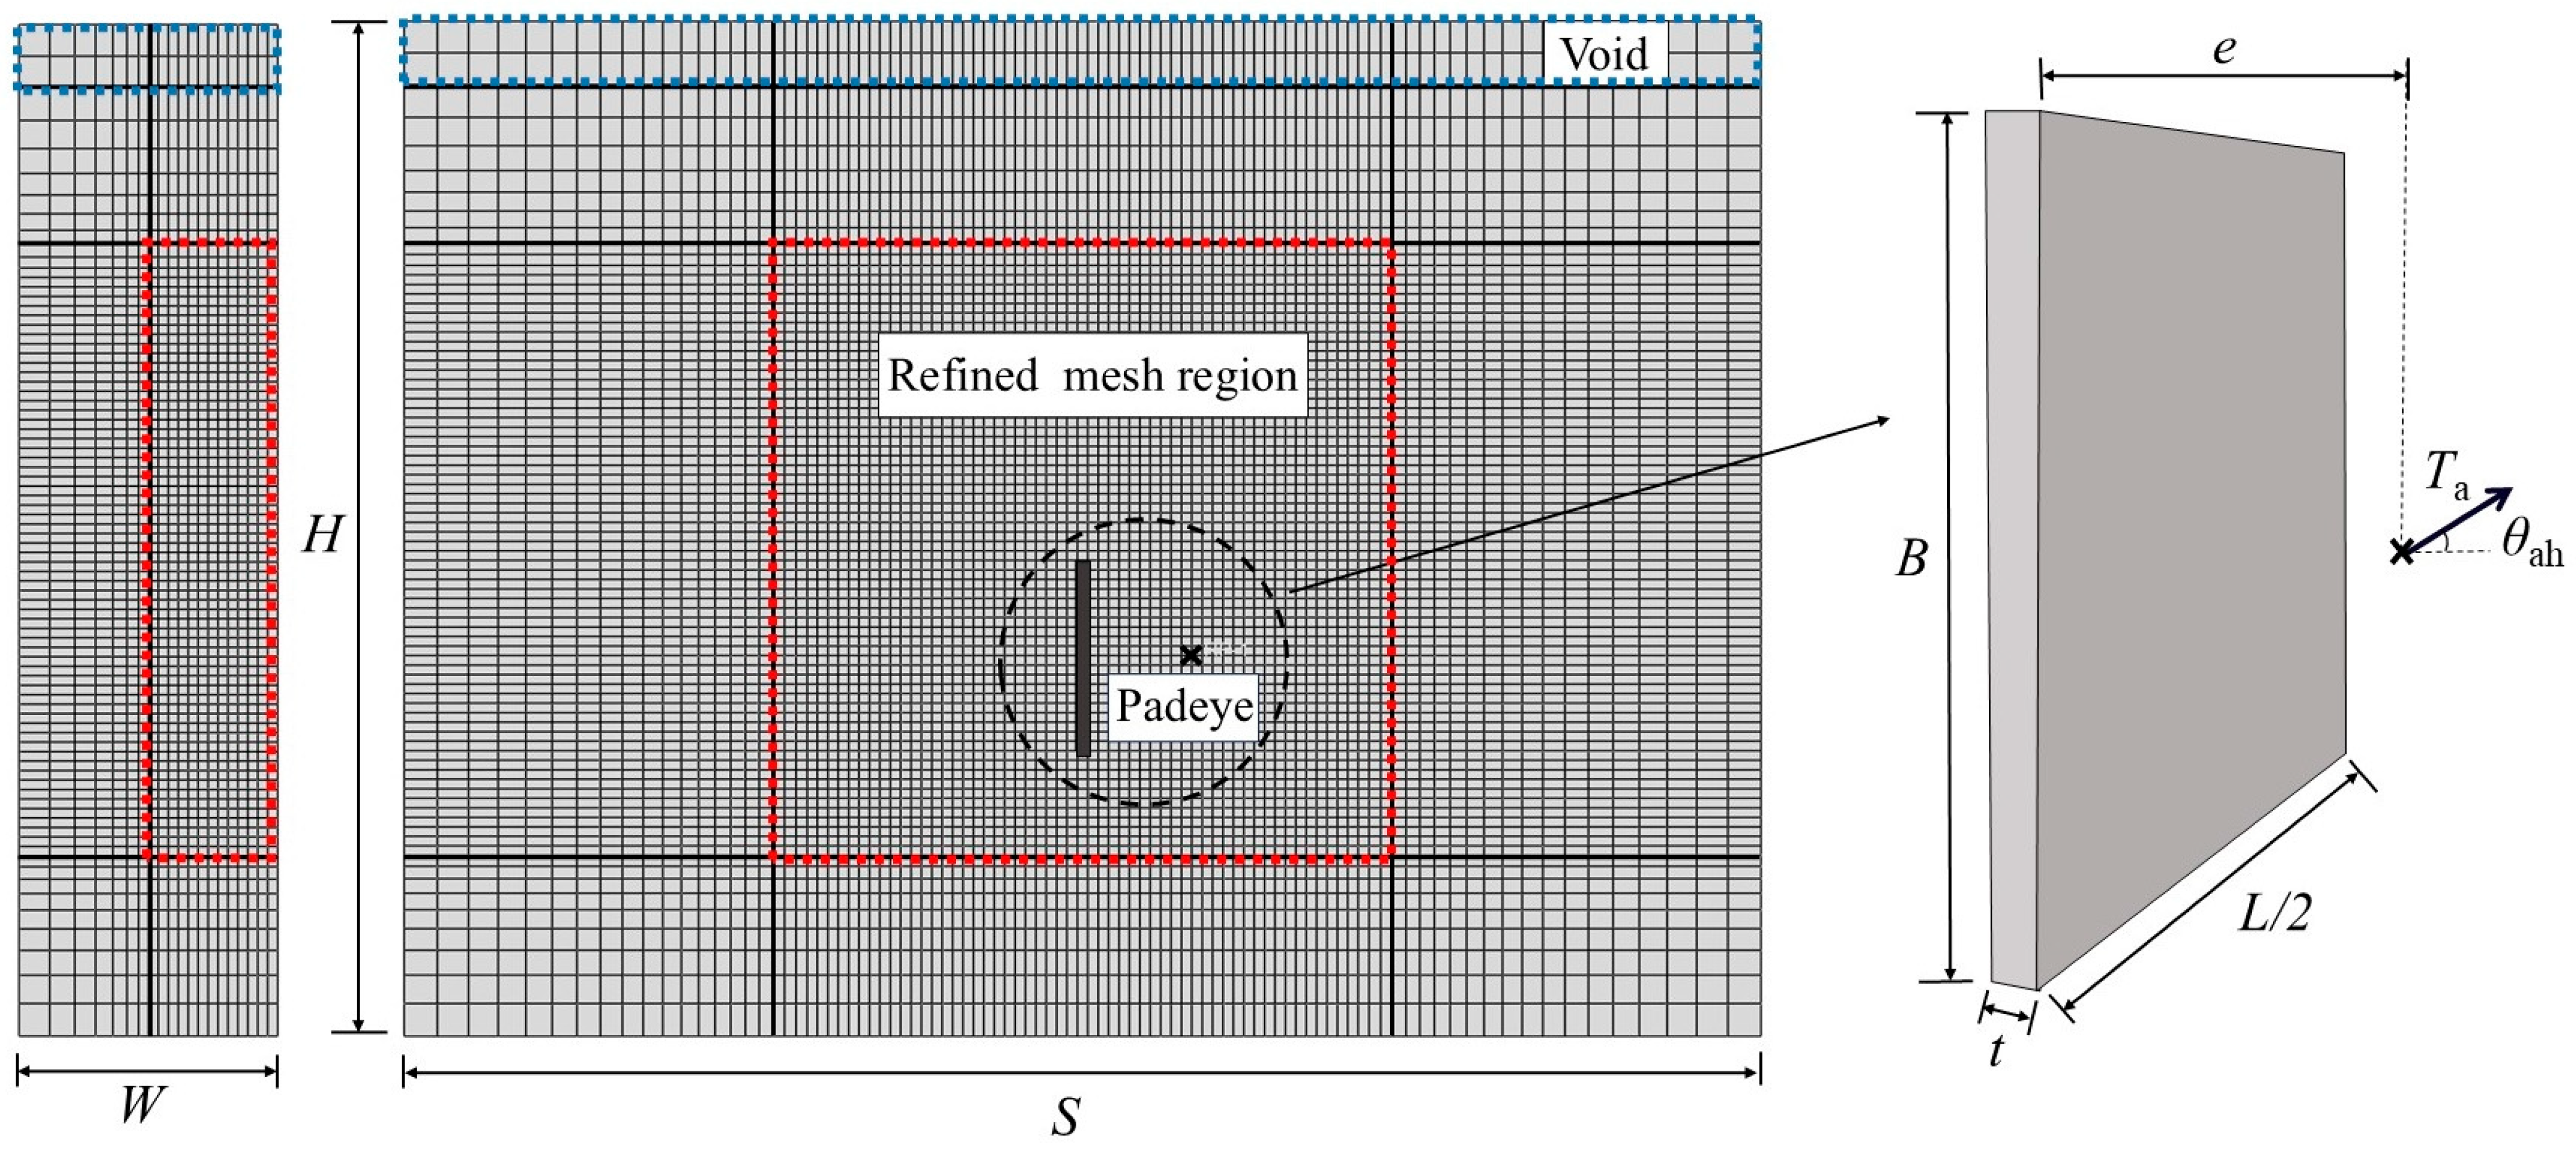
The numerical model was established by the CEL method in the software ABAQUS 6.14, as illustrated in Figure 3. To enhance the calculation efficiency, a symmetric model was constructed due to the symmetry of the problem. S, W and H are the length, width and height of the soil domain; L, B and t are the length, width and thickness of the SEPLA; e is the padeye eccentricity, which is the distance from the padeye to the plane of the anchor. The drag force Ta was applied at a drag angle θah with the chain equation, which will be described in Section 2.2.2.
The soil was modeled as the undrained saturated clay, governed by an ideal elastoplastic constitutive law with the Tresca yield criterion [34,35,36,37]. The SEPLA was modeled as a rigid body. For the soil–anchor interaction, a general contact was defined in the normal direction, while the tangential contact followed the Coulomb friction theory. The frictional coefficient between the anchor and the soil μc = 0.3 was chosen. The soil was meshed by EC3D8R elements, allowing it to flow freely within Eulerian meshes. The EC3D8R element is an eight-node reduced integration Eulerian mesh used for explicit analysis in the software ABAQUS. An air layer was set above the soil to simulate the deformation of seabed surface. The bottom of the soil is fixed, and a symmetric boundary condition is applied on the symmetric plane. Other soil boundaries are constrained in the direction normal to their surfaces.

2.2.2. Incorporating Chain Effects into the CEL Model

In the software ABAQUS, the changes in the drag force Ta and the drag angle θah at the padeye (Figure 1) cannot be directly implemented by the CAE interface or input file. In the present study, the user subroutine VUAMP was used to reflect chain effects, in which the chain equation of Neubecker and Randolph [38] was adopted:
T a 1 + μ 2 e μ θ ah θ cos θ + μ sin θ θ e θ ah = 0 z a N cl E n d s u d z
where μ is the frictional coefficient between soil and chain, θ is the angle formed by the chain to the horizontal at the embedment depth of z, θah is the drag anchor at the padeye, θe is the drag angle at the embedment point which is also called the installation angle (Figure 1), za is the embedment depth of the padeye, Ncl is the pullout capacity factor for the chain, ranging from 7.6 to 14, En is the multiplier to give the effective width in the normal direction, d is the chain diameter, and su is the undrained shear strength of the soil.
The user subroutine VUAMP enables user-defined amplitude curves for load conditions, boundary conditions and predefined fields, describing their variations with time and displacement. The VUAMP subroutine was employed to define the time-dependent amplitude curves of Ta via Equation (1), reflecting the chain effects. In the VUAMP subroutine, three operations are required: firstly, declare history output variables used in Equation (1), including the coordinates of the padeye (xa and za), which are designated as sensors for the subroutine VUAMP. Secondly, create the horizontal and vertical components of the drag force. The drag force Ta was decomposed into horizontal and vertical components, i.e., Tax = Tacosθah and Taz = Tasinθah, and their amplitude curves are calculated dynamically by the VUAMP. Finally, prior to each increment step, retrieve amplitude values from the VUAMP to update Ta and θah.
Figure 4 illustrates the flowchart to incorporate chain effects with the VUAMP. The procedure for analyzing the keying of SEPLAs with chain effects can be summarized as
  • Give the initial values of Ta and θah at the padeye, i.e., Ta = Ta0 and θah = θah0.
  • Calculate Tax = Tacosθah and Taz = Tasinθah acted on the padeye, and conduct an incremental CEL analysis.
  • If the time interval Δt is equal or greater than the control time interval tc, update the padeye location (xa, za) and calculate the average rotational velocity urave = Δurt. ur is the rotation angle of the anchor. If Δt < tc, execute step b.
  • Compare the values of urave and the control rotational angular velocity urc. If urave > urc, apply a new drag force Ta = Ta − ΔT, otherwise Ta= Ta + ΔT, where ΔT is a load increment.
  • Update the value θah via Equation (1), with the updated Ta and za.
  • Repeat steps b–e until the predefined inclination of the SEPLA is achieved.

2.3. Sensitivity of FE Parameters

2.3.1. Sensitivity of Mesh and Domain Sizes

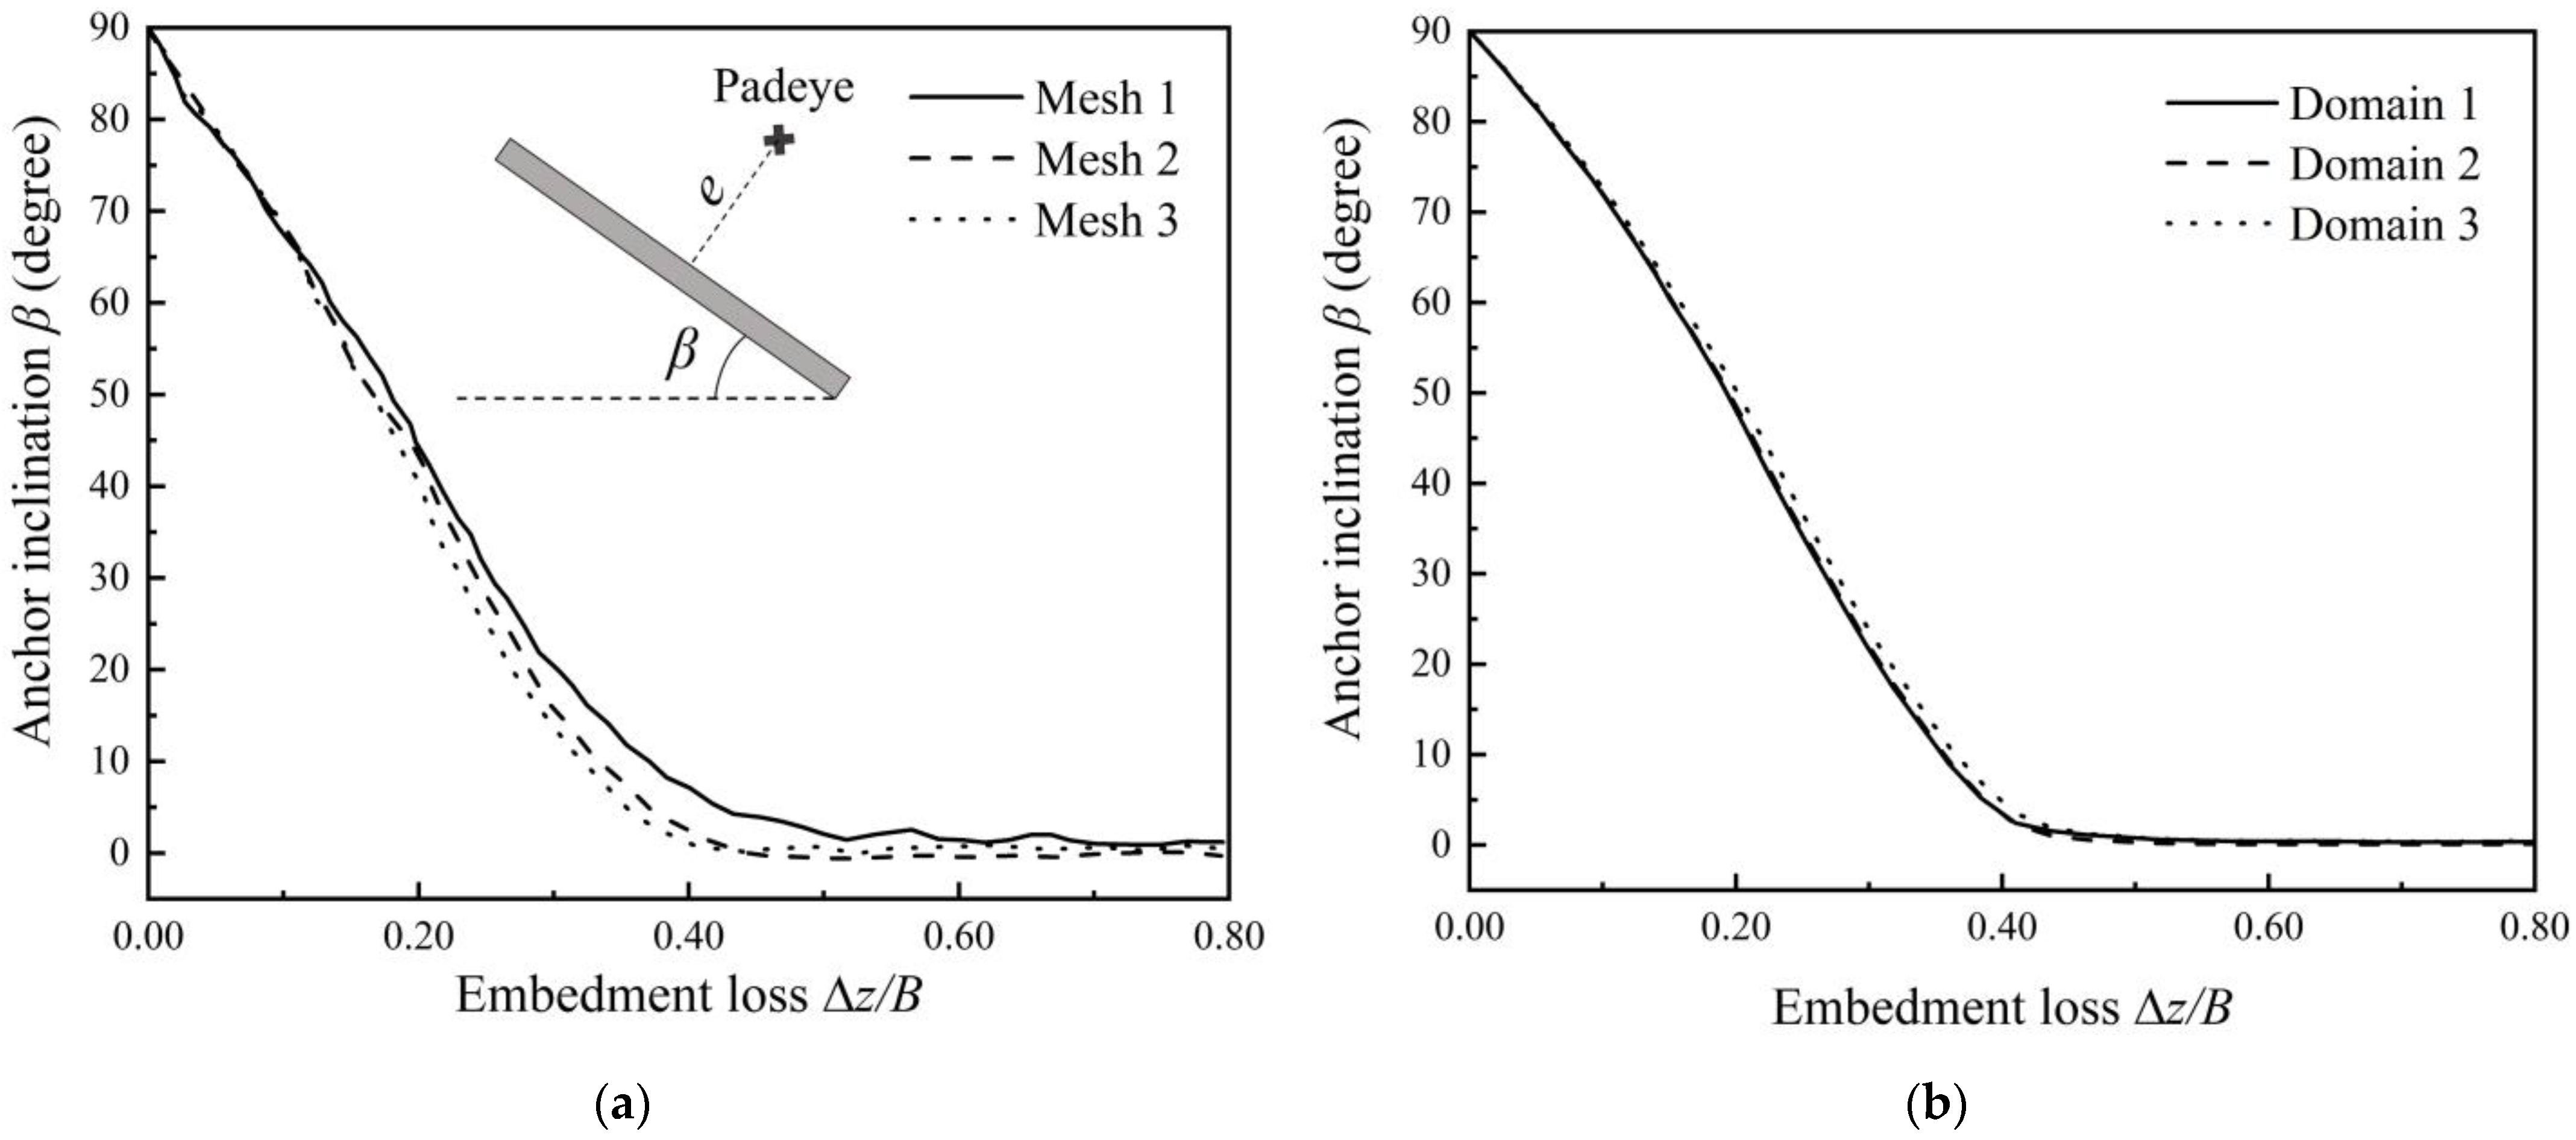
Preliminary calculations were performed to study the sensitivity to the soil mesh size and the far-field boundary effect. The model parameters were adopted the same as RITSS [19], as listed in Table 1, where γsoil and γanchor are the submerged unit weight of the soil and the anchor, respectively; E is the Young’s modulus. Figure 5a,b present the relationship between the embedment loss and the anchor inclination under three soil mesh sizes and soil domains, respectively. The parameters and results for different soil mesh size and soil domain are summarized in Table 2. It was found that Mesh 2 and Domain 2 are considered sufficiently fine in terms of accuracy and adopted for all subsequent analyses.

2.3.2. Sensitivity of Parameters of VUAMP

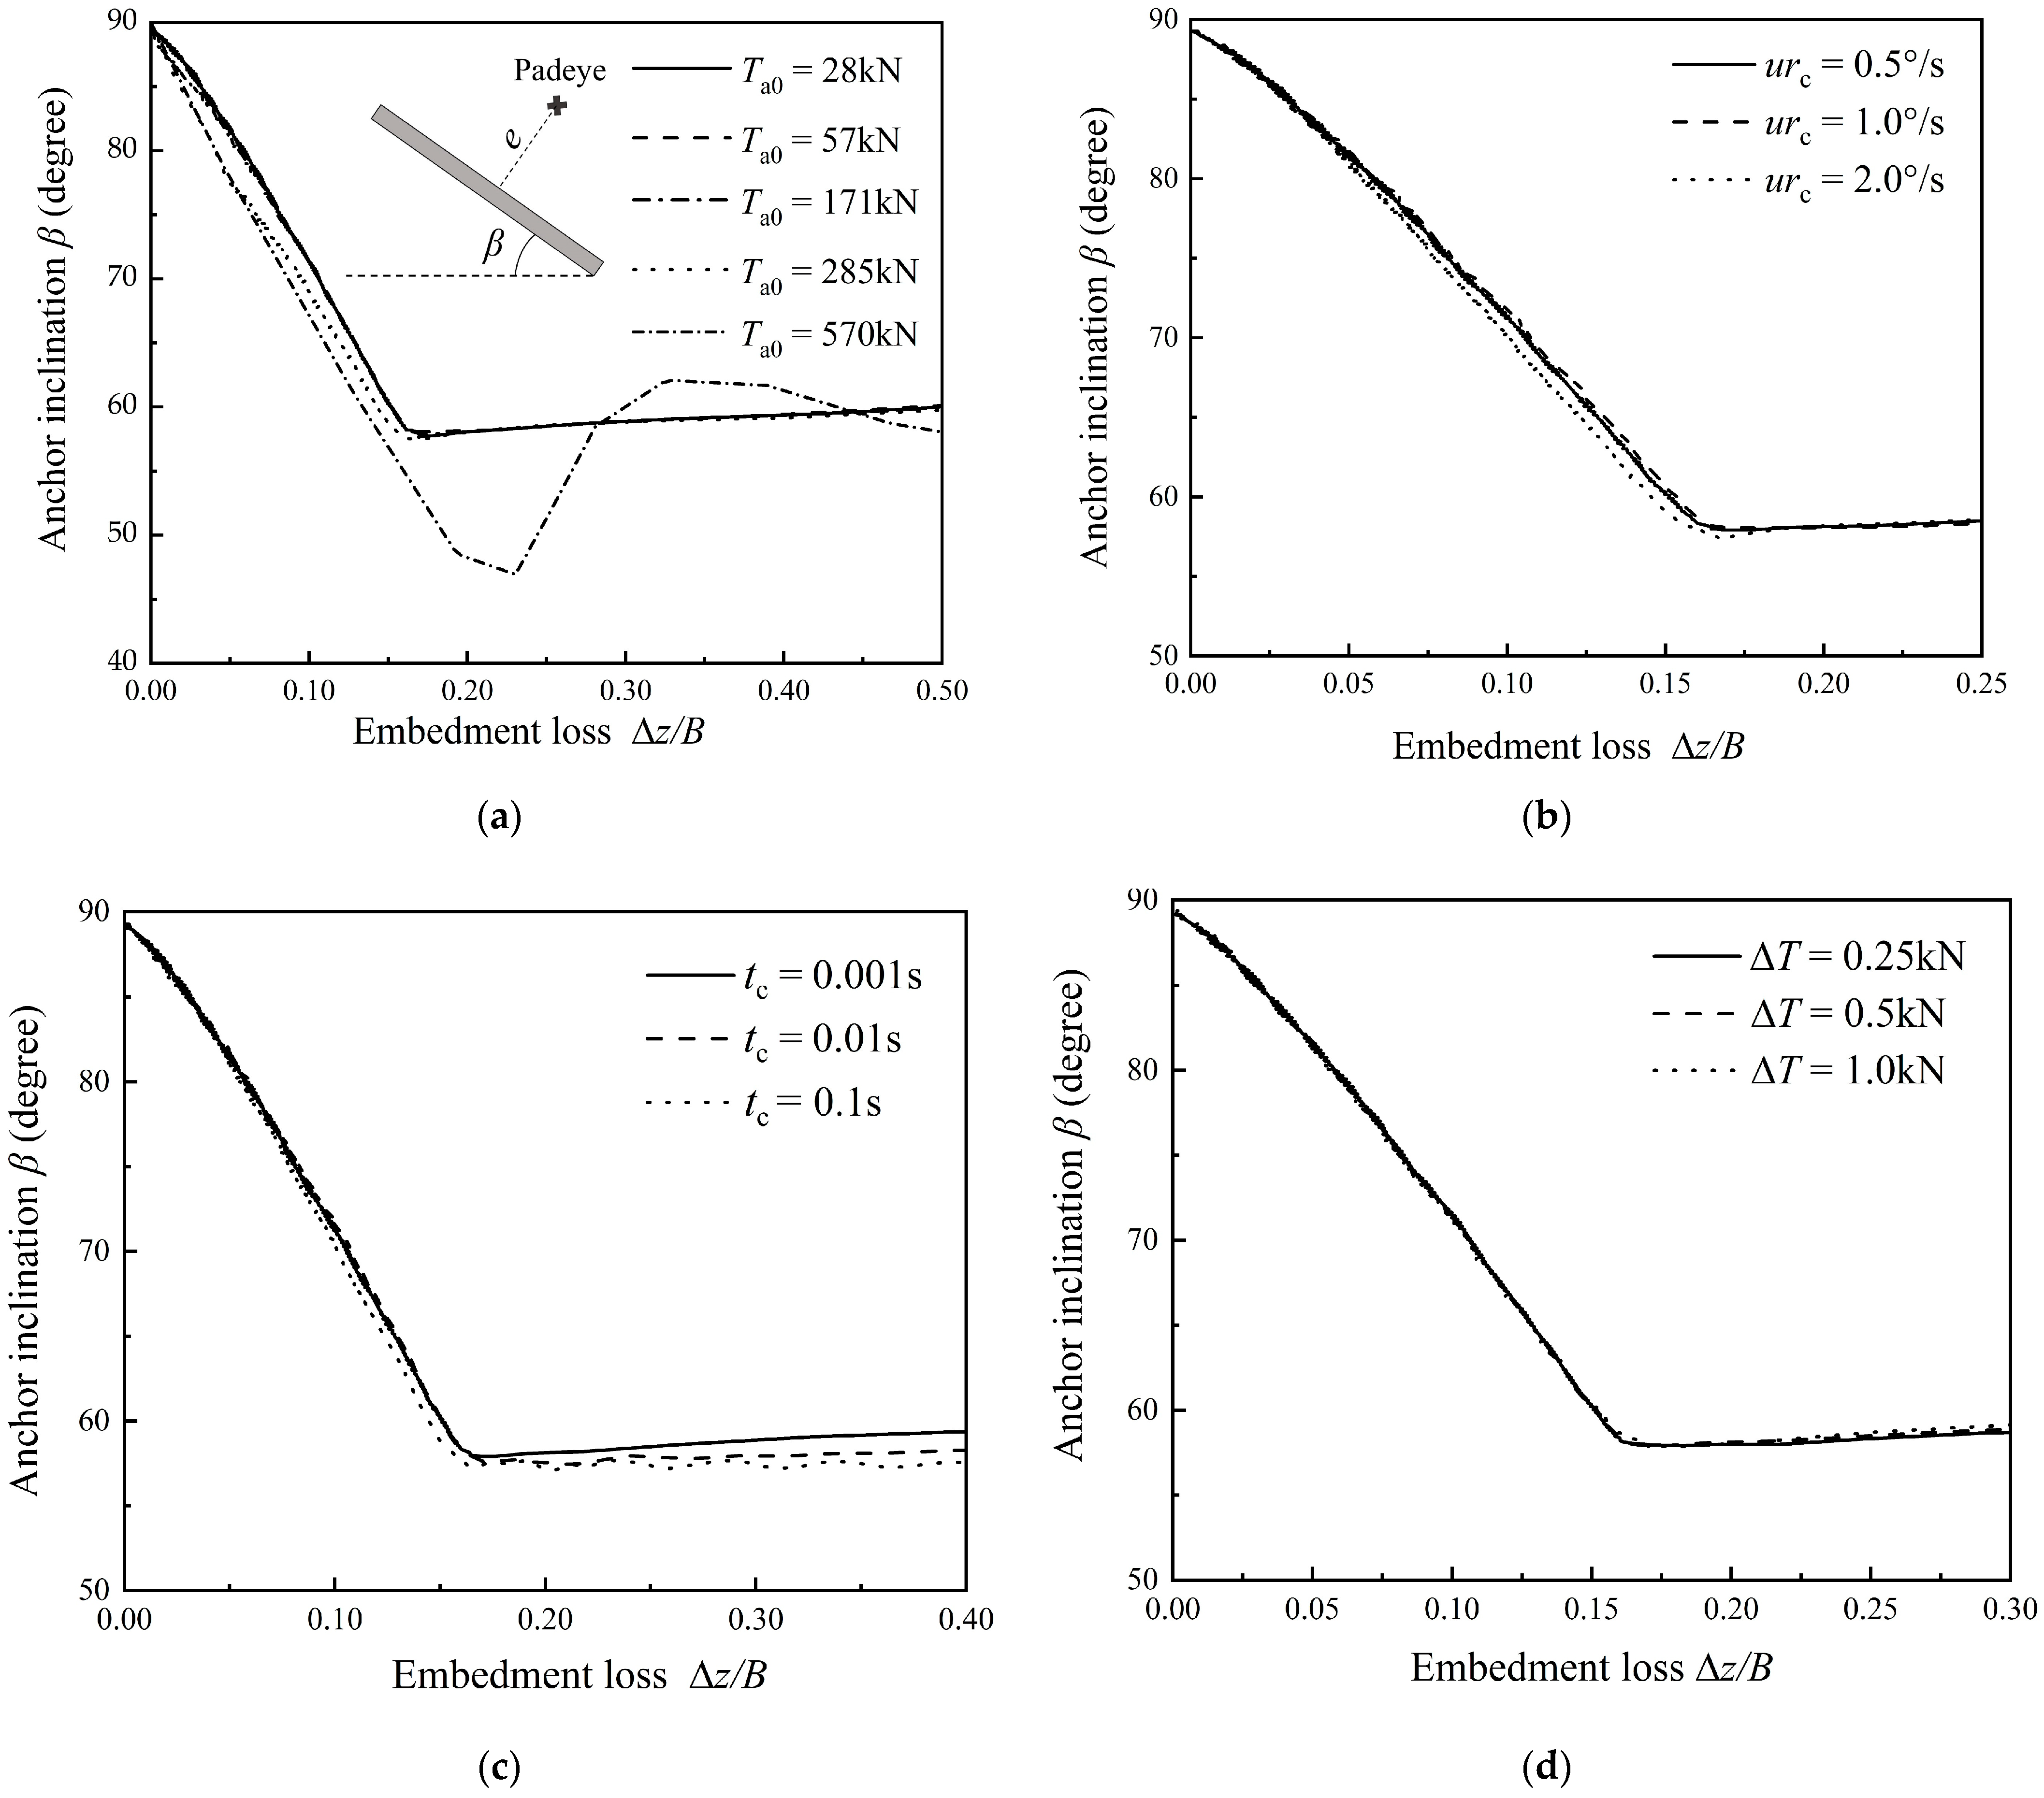
In the VUAMP, five parameters were introduced by the present study, i.e., the initial drag force Ta0 and drag angle θah0, the controlled rotational angular velocity urc, the controlled time interval tc and the load increment ΔT. These parameters may influence the behaviors of SEPLAs during keying. At the initial stage, θah0 was set as 90°. Table 3 lists the cases for assessing the dependency of Ta0, urc, tc and ΔT. The model parameters were adopted the same as RITSS [19], as listed in Table 1. Five values of Ta0 were set as 0.5, 1.0, 3.0, 5.0 and 10.0 times the value of suiA, where sui is the soil strength at the initial embedment depth of the anchor, and A is the fluke area. Figure 6a indicates that the keying of SEPLAs is not affected by Ta0 of 28 kN~171 kN. As the value of Ta0 continually increases, the drag force accelerates the keying of SEPLAs and leads to an excessive embedment loss, especially for Ta0 = 570 kN. In addition, the calculation time decreases with an increasing value of Ta0. Hence, it is suggested that Ta0 = suiA~3suiA is adopted for the keying of SEPLAs. Figure 6b–d shows that urc, tc and ΔT have little effect on the embedded loss. However, the calculation time increases with a decreasing value of urc. The value of tc has a significant effect on the average rotational velocity of the anchor urave. The values of urave are 0.52°/s, 0.91°/s and 1.08°/s at tc of 0.1 s, 0.01 s and 0.001 s, respectively. The average rotational velocity urave approximates the control rotational angular velocity urc at tc = 0.001 s. In the following analysis, Ta0, urc, tc and ΔT are adopted as 2suiA, 1.0°/s, 0.001 s and 0.5 kN, respectively.

2.4. Validation of the CEL Model

The CEL model was compared with the results of the RITSS method by Wang et al. [19], CASPA method by Wei et al. [17] and centrifuge test by Song et al. [27]. The model parameters are listed in Table 1 for validations with RITSS, CASPA and the centrifuge test. Figure 7a gives the relationships between the embedment loss Δz/B and the anchor inclination β for both the CEL and RITSS methods at vertical loading (θe = 90°). For load eccentricities e/B = 0.17, 0.5 and 1.0, the embedment losses calculated by the CEL are 1.75B, 0.51B and 0.21B, respectively, compared to 1.6B, 0.5B and 0.2B by the RITSS [19]. The deviations range from 2% to 9.4%, indicating minor overestimations by the CEL model. To further validate the method to incorporate chain effects (Figure 4), the embedment losses of five installation angles, i.e., θe = 30°, 45°, 60°, 75° and 90°, were compared with the RITSS of Wang et al. [19]. Figure 7b demonstrates that the embedment losses calculated by the CEL agree well with those by the RITSS, with a maximum deviation less than 5%. Figure 7c shows the comparison of embedment loss between the CEL and CASPA methods at θe = 40°. The CASPA method reported an embedment loss of Δz = 0.318B and a final anchor inclination of βf = 34.5°, while the CEL method yielded Δz = 0.287B and βf = 35.6°, representing a 9.7% reduction in the embedment loss. Figure 7d shows the comparison between the CEL and centrifuge test [27] at θe = 60°. The embedment loss of Δz and the final anchor inclination of βf calculated by the CEL are 0.25B and 33.3°, respectively, while the centrifuge test shows Δz = 0.32B and βf = 38°. These comparisons confirm the effectiveness of the CEL model.

3. Parametric Study

Based on the established CEL model, a parametric study was performed to quantify the effects of installation angle, load eccentricity, soil strength and mechanical parameters of the chain on the keying of the SEPLAs. The model parameters were adopted the same as RITSS [19] (Table 1), while the cases of parametric study are listed in Table 4.

3.1. Installation Angle

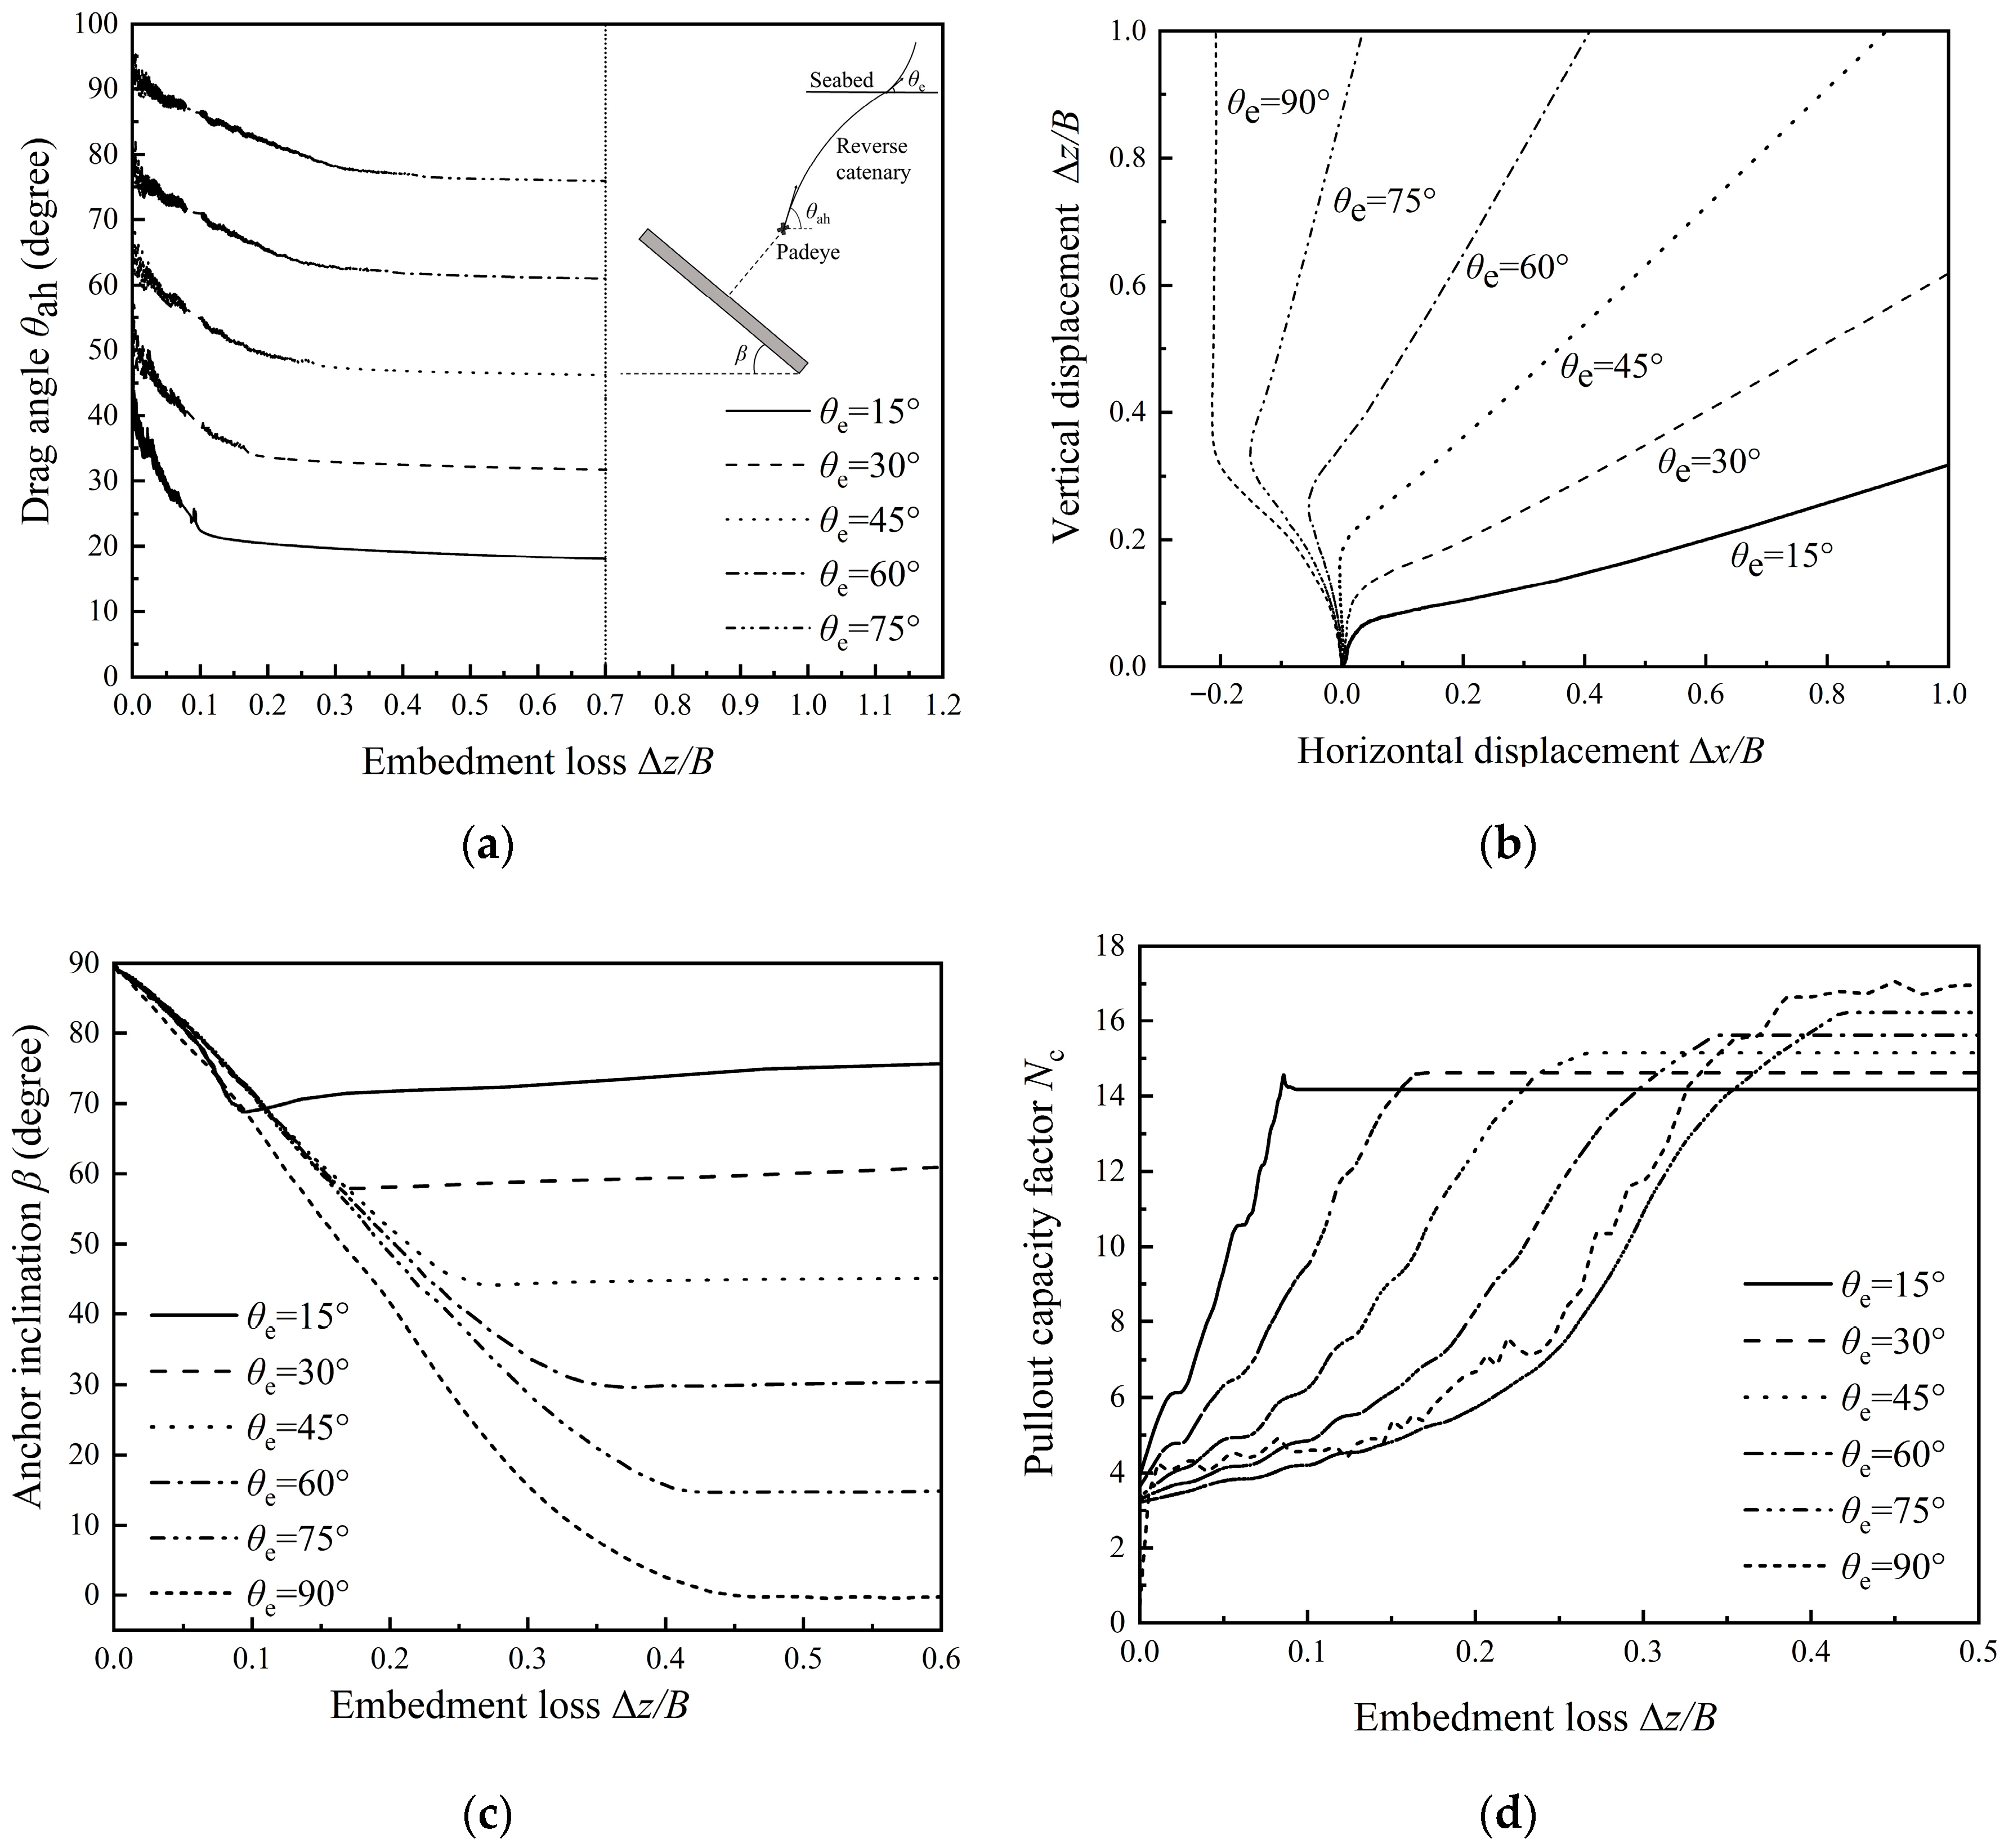
As shown in Equation (1), different installation angles of θe induce different drag angles at the padeye θah, affecting the keying of SEPLAs. Numerical simulations were conducted for θe = 15°, 30°, 45°, 60° and 75°, and compared with the results of vertical uplift of θe = 90° (Case 2 in Table 4). Figure 8a illustrates the relationship between the θah and Δz/B. As the embedment loss Δz/B increases, the drag angle at the padeye θah decreases. The value of θah is always greater than that of θe during the keying, confirming that the chain presents a reverse catenary shape in the soil. The anchor trajectory is shown in Figure 8b, presenting the non-dimensional curves of the horizontal displacement (Δx/B) and vertical displacement (Δz/B) of the anchor. It is evident that a larger installation angle requires the anchor to rotate more to reach the normal bearing state, resulting in greater vertical displacement and embedment loss. Each trajectory has a distinct inflection point at different installation angles, after which the anchor displaces along a fixed direction.
Figure 8c shows that the embedment loss increases by 0.06B~0.1B for every 15° increase in the installation angle. The rotational velocities are nearly the same for each installation angle, arriving at final anchor inclination βf. The values of βf are 75.64°, 60.37°, 45.12°, 30.31°, 14.96° and −0.28° for θe = 15°, 30°, 45°, 60°, 75° and 90°, respectively. It is found that the final anchor inclination is approximately complement of the installation angle, i.e., βf + θe ≈ 90°. Figure 8d presents the relationship between the pullout capacity factor Nc and embedment loss Δz/B, where Nc = Ta/sucA, where suc is the soil strength of the anchor center during the keying. It is shown that the ultimate pullout capacity factors Ncu (Ncu = max(Nc)) are 14.18, 14.62, 15.15, 15.62, 16.22 and 16.97 for θe = 15°, 30°, 45°, 60°, 75° and 90°, respectively.
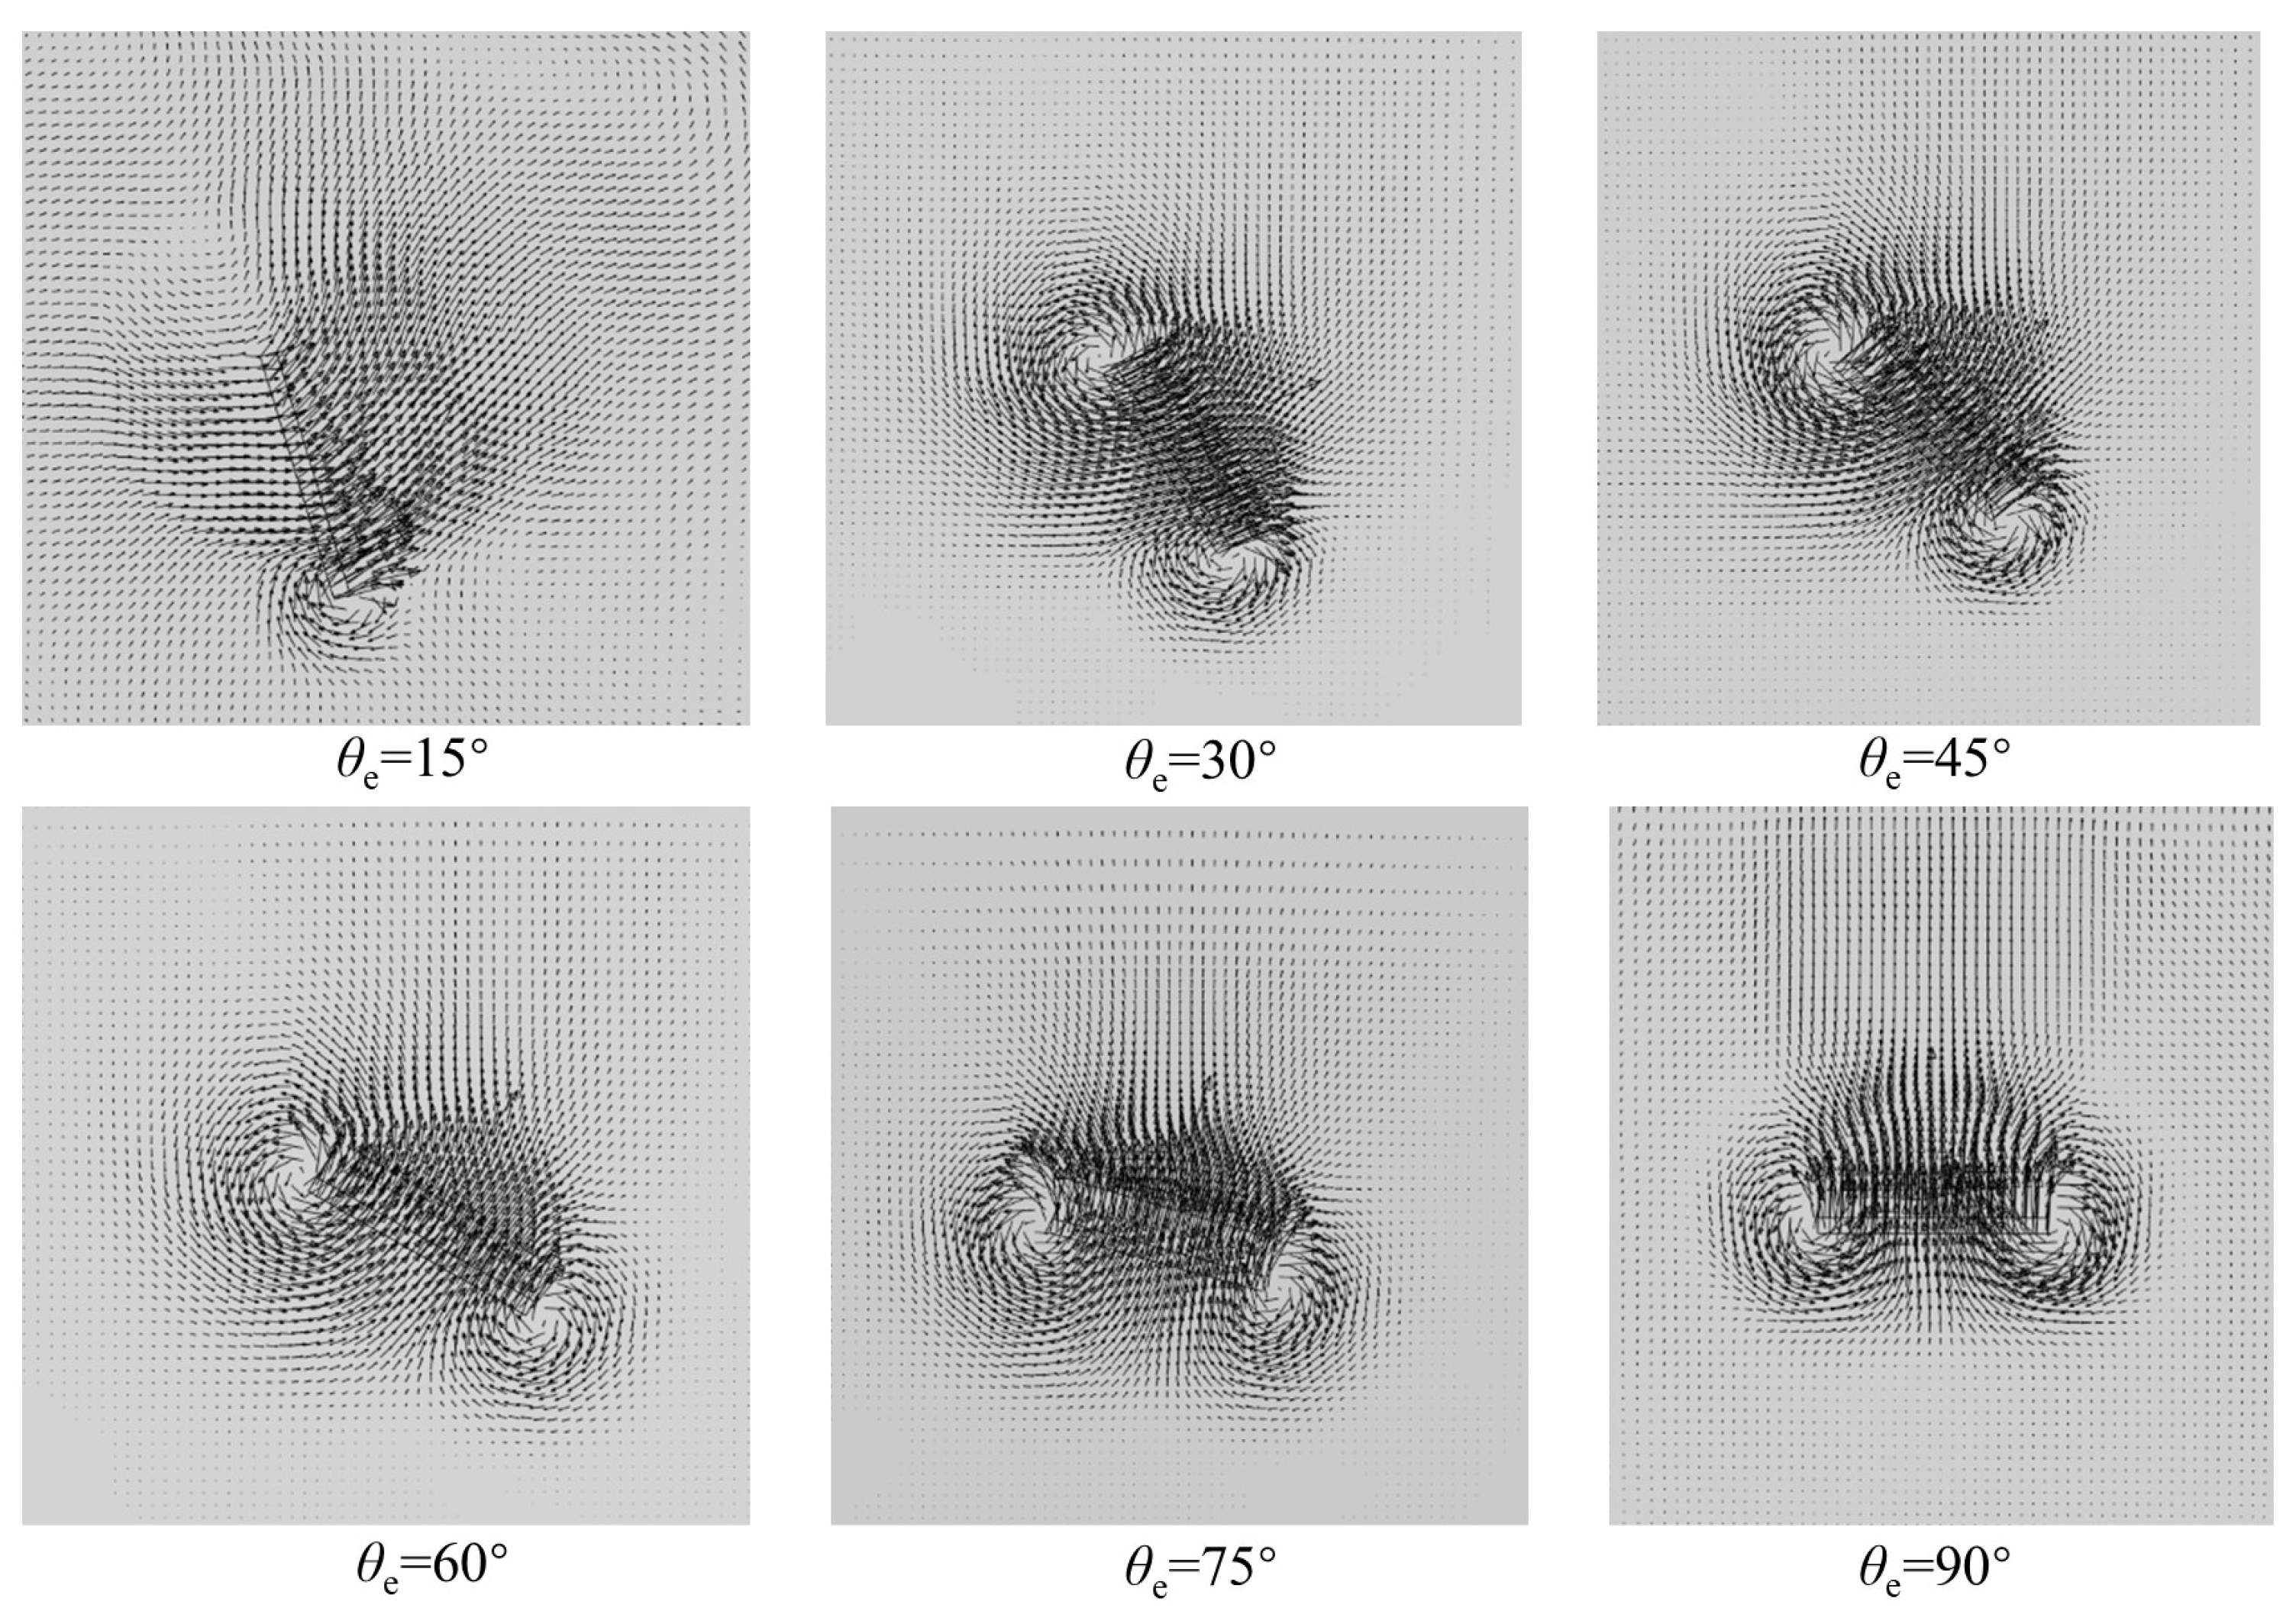
The soil flow mechanism is illustrated in Figure 9, which proves that the soil failure mechanisms for θe = 30°~90° are nearly the same, with a local symmetrical failure. Hence, the value of Ncu decreases only by 3.10% to 4.62% for every 15° decrease in the installation angle θe. The effect of θe on Ncu is only reflected by the final anchor inclination βf.

3.2. Load Eccentricity

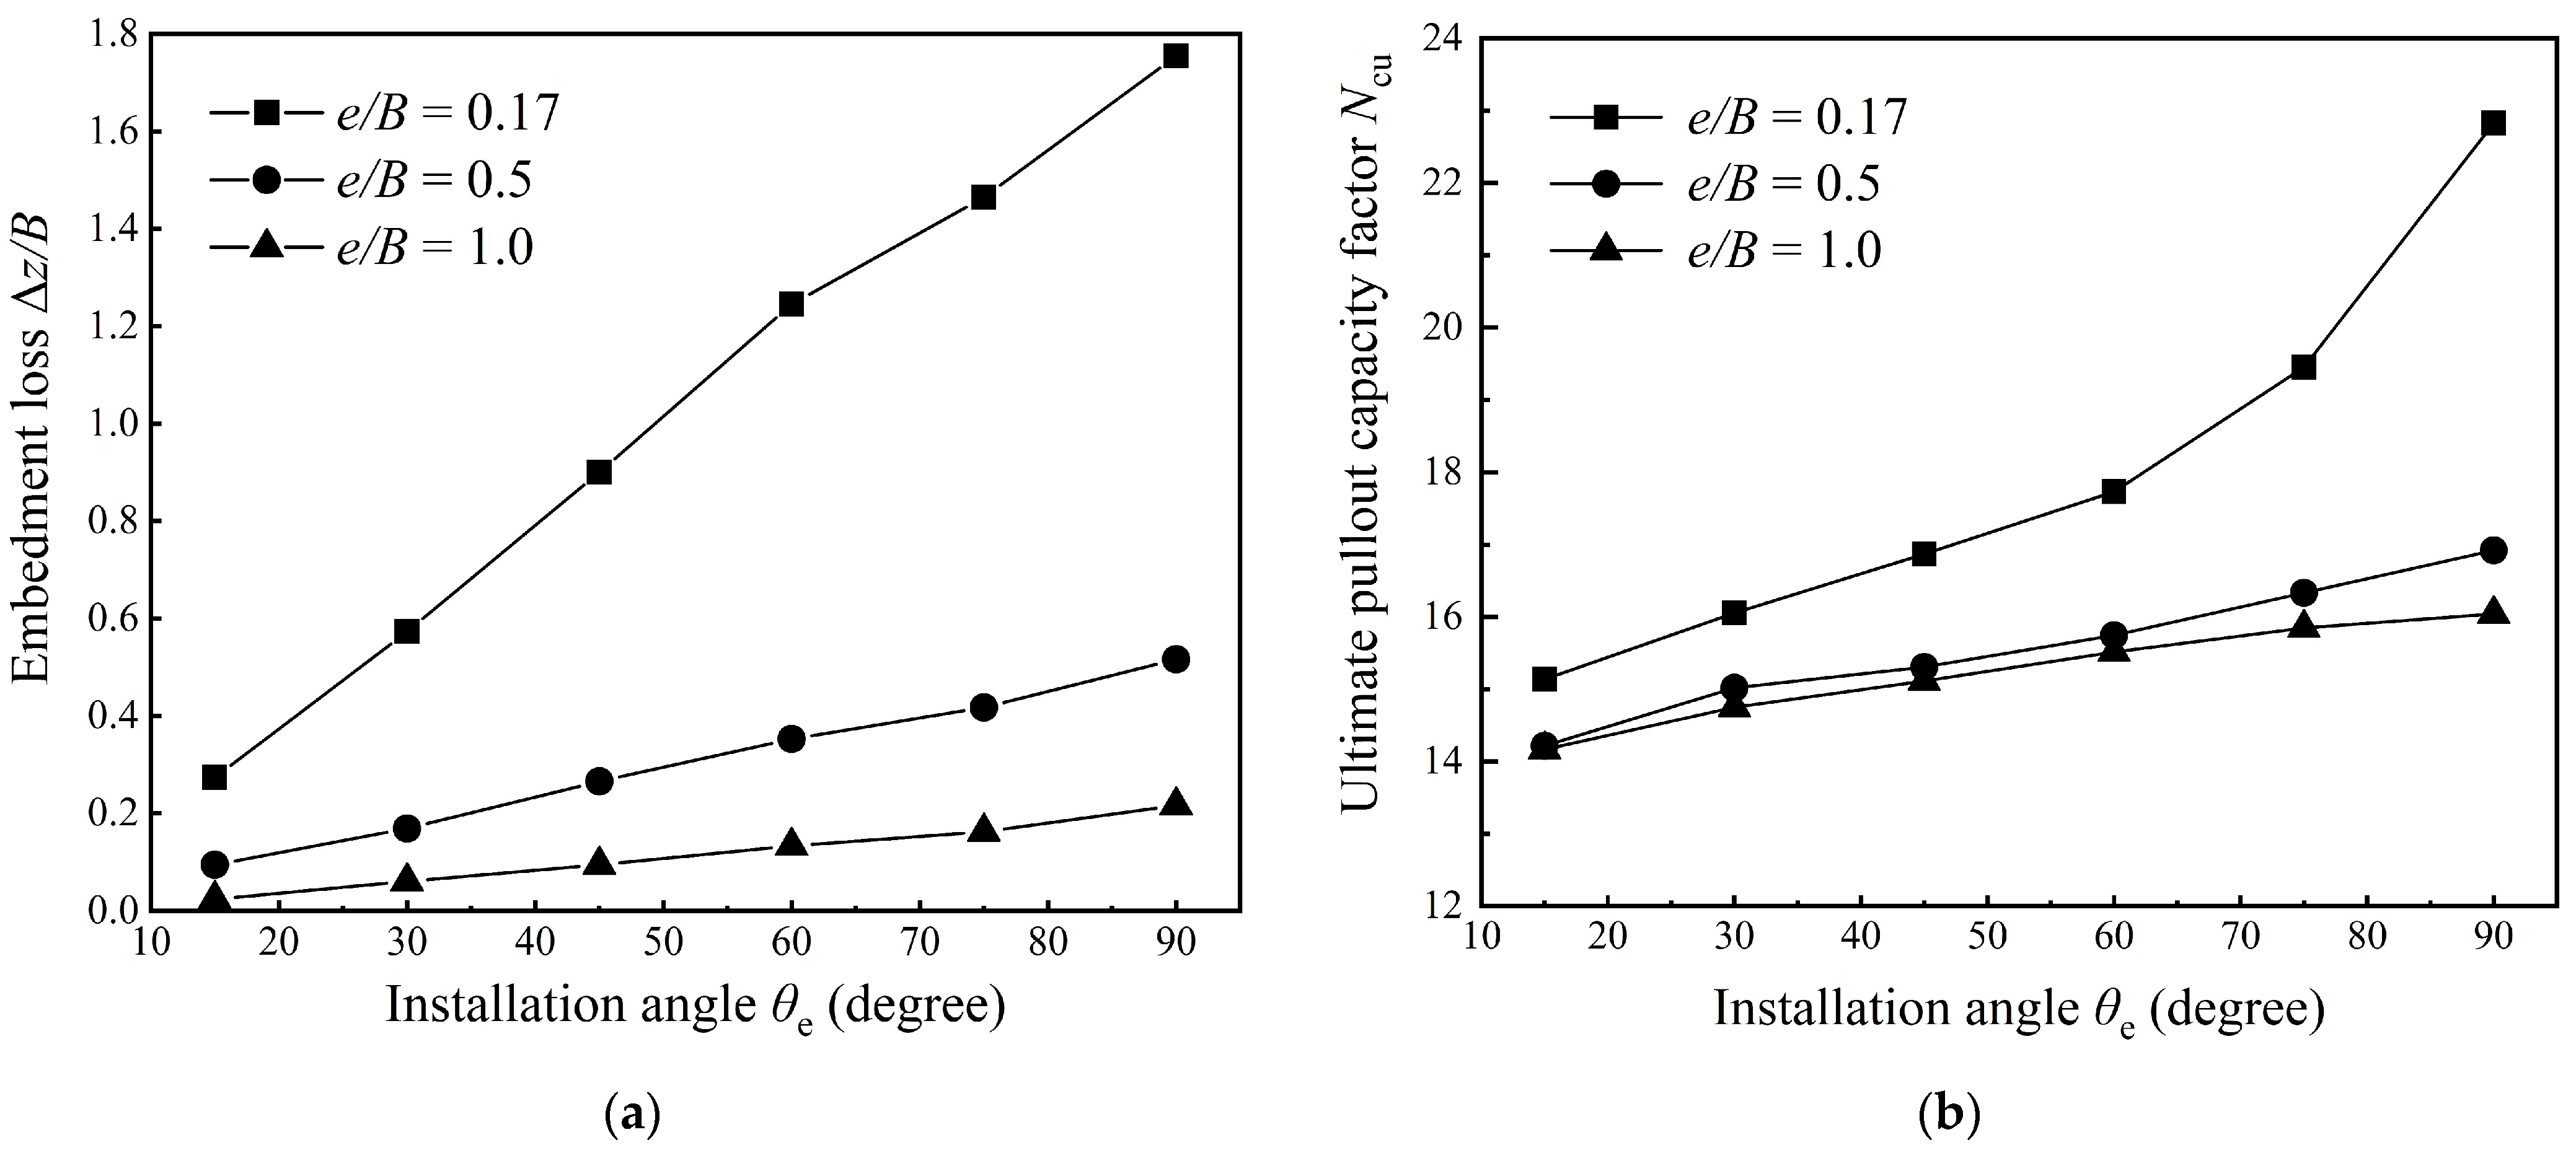
Three cases with load eccentricities e/B = 0.17, 0.5 and 1.0 were designed to investigate the influence of e/B on the keying of SEPLAs (Cases 1, 2 and 5 in Table 4). Figure 10 illustrates the relationship between installation angle θe and embedment loss Δz/B as well as ultimate pullout capacity factor Ncu under different load eccentricities. It is proved that both embedment loss and ultimate pullout capacity of the anchor are negatively correlated with the load eccentricity. For instance, when the installation angle is 15°, the embedment loss decreases by 91.14% and the ultimate pullout capacity factor by 6.41%, as the value of e/B increases from 0.17 to 1.0. Similarly, during vertical uplift of θe = 90°, the embedment loss decreases by 87.67% and the ultimate pullout capacity factor by 29.74% with the increasing of e/B from 0.17 to 1.0. The embedment loss shows an approximate linear relationship with the installation angle. When e/B is small (e.g., e/B = 0.17), the installation angle significantly affects the embedment loss and the ultimate pullout capacity factor. When e/B is between 0.5 and 1.0, the installation angle θe has little effect on the ultimate bearing capacity factor Ncu, with maximum differences of 5.65% for every 15° increase in the installation angle θe.
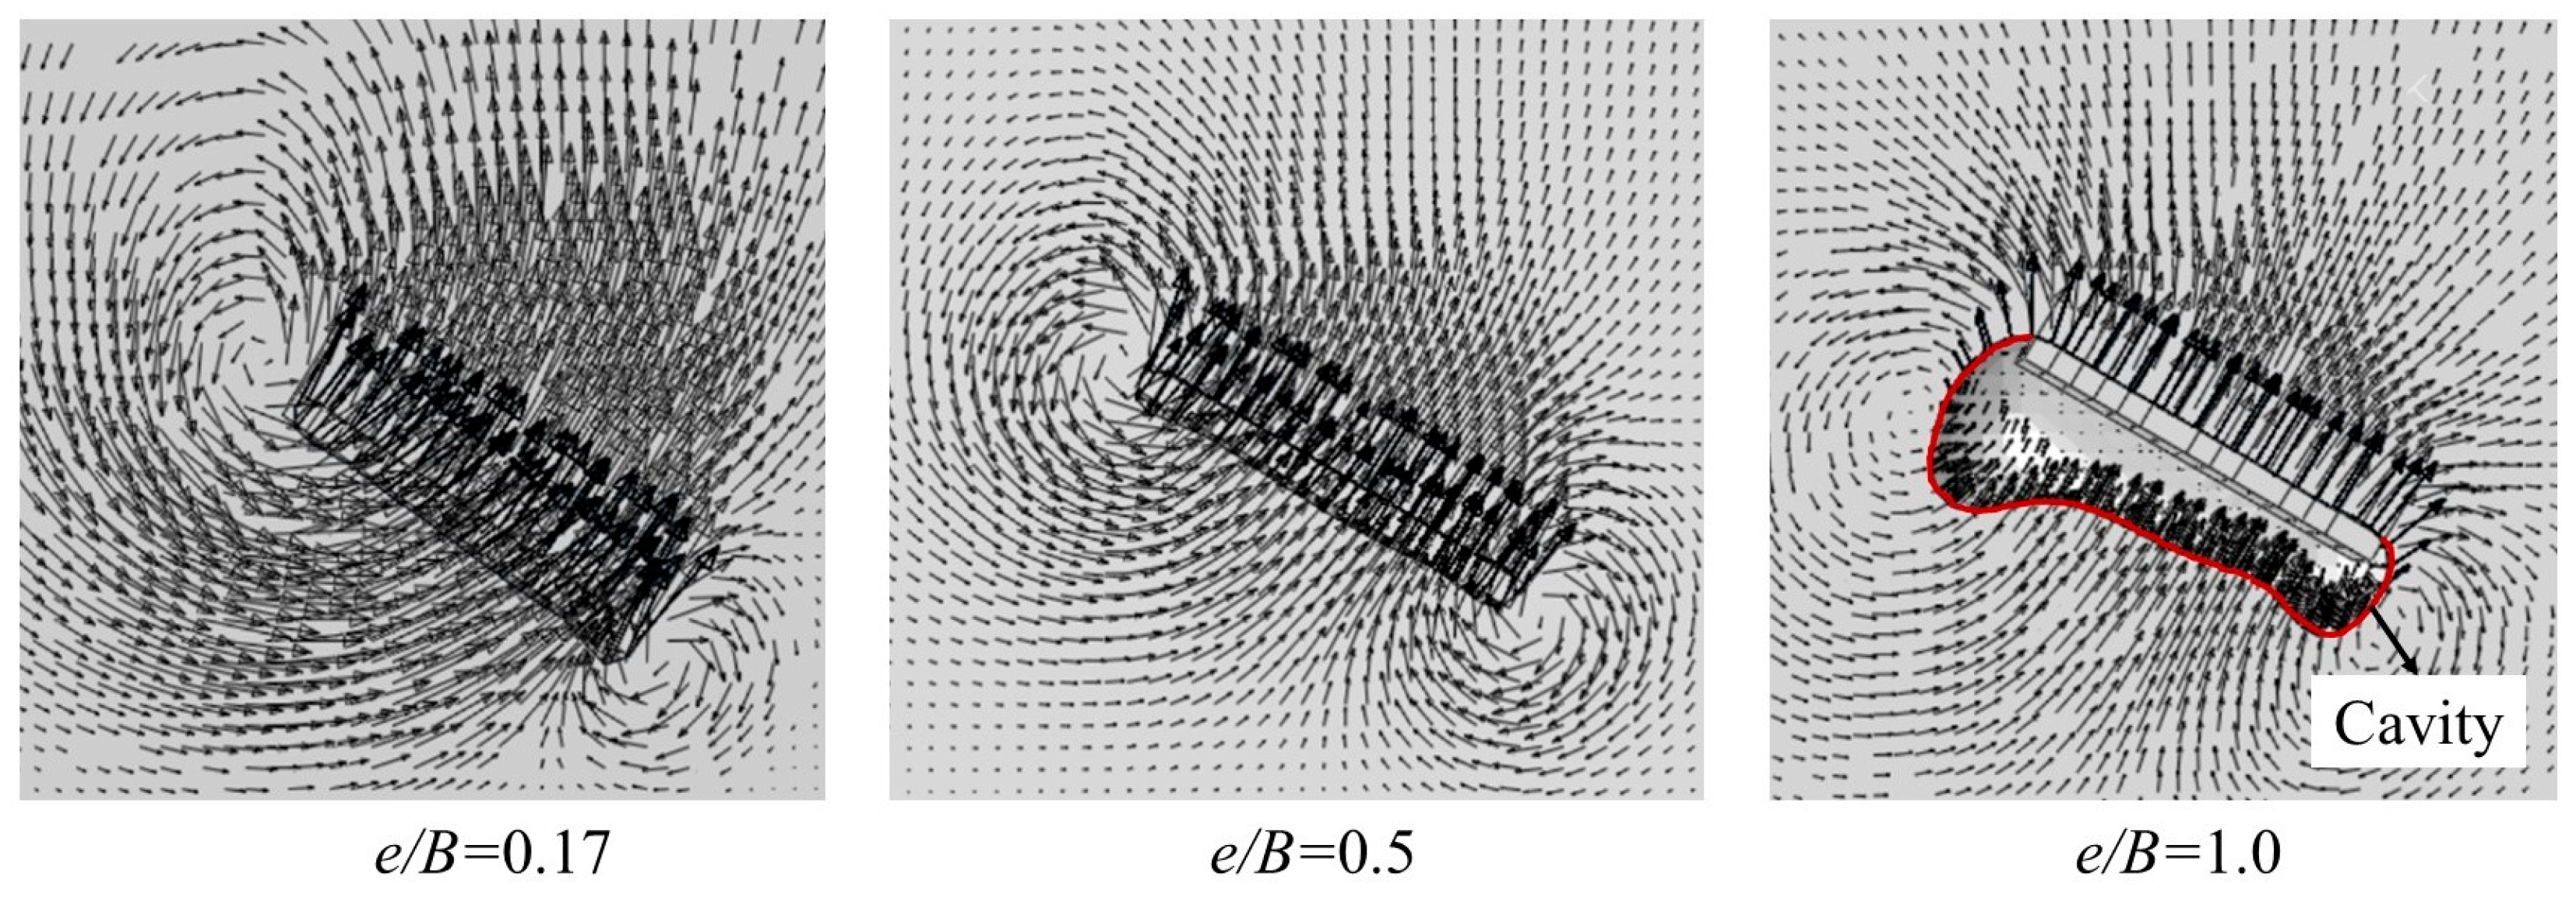
Figure 11 illustrates the soil flow mechanisms at θe = 60° with load eccentricity of e/B = 0.17, 0.5 and 1.0. For e/B = 0.17, the anchor rotates about the anchor top, which induces an intense unsymmetrical soil disturbance with the soil flowing back to the bottom of the anchor. The rotation around the anchor top leads to an amplified embedment loss, while the intense unsymmetrical soil disturbance increases the ultimate bearing capacity factor. The soil flow mechanisms are nearly the same for e/B = 0.5 and 1.0, while there is a cavity on the back of the anchor for e/B = 1.0, as shown in Figure 11. The cavity makes a small reduction in the ultimate bearing capacity factor (Figure 10b).

3.3. Soil Strength

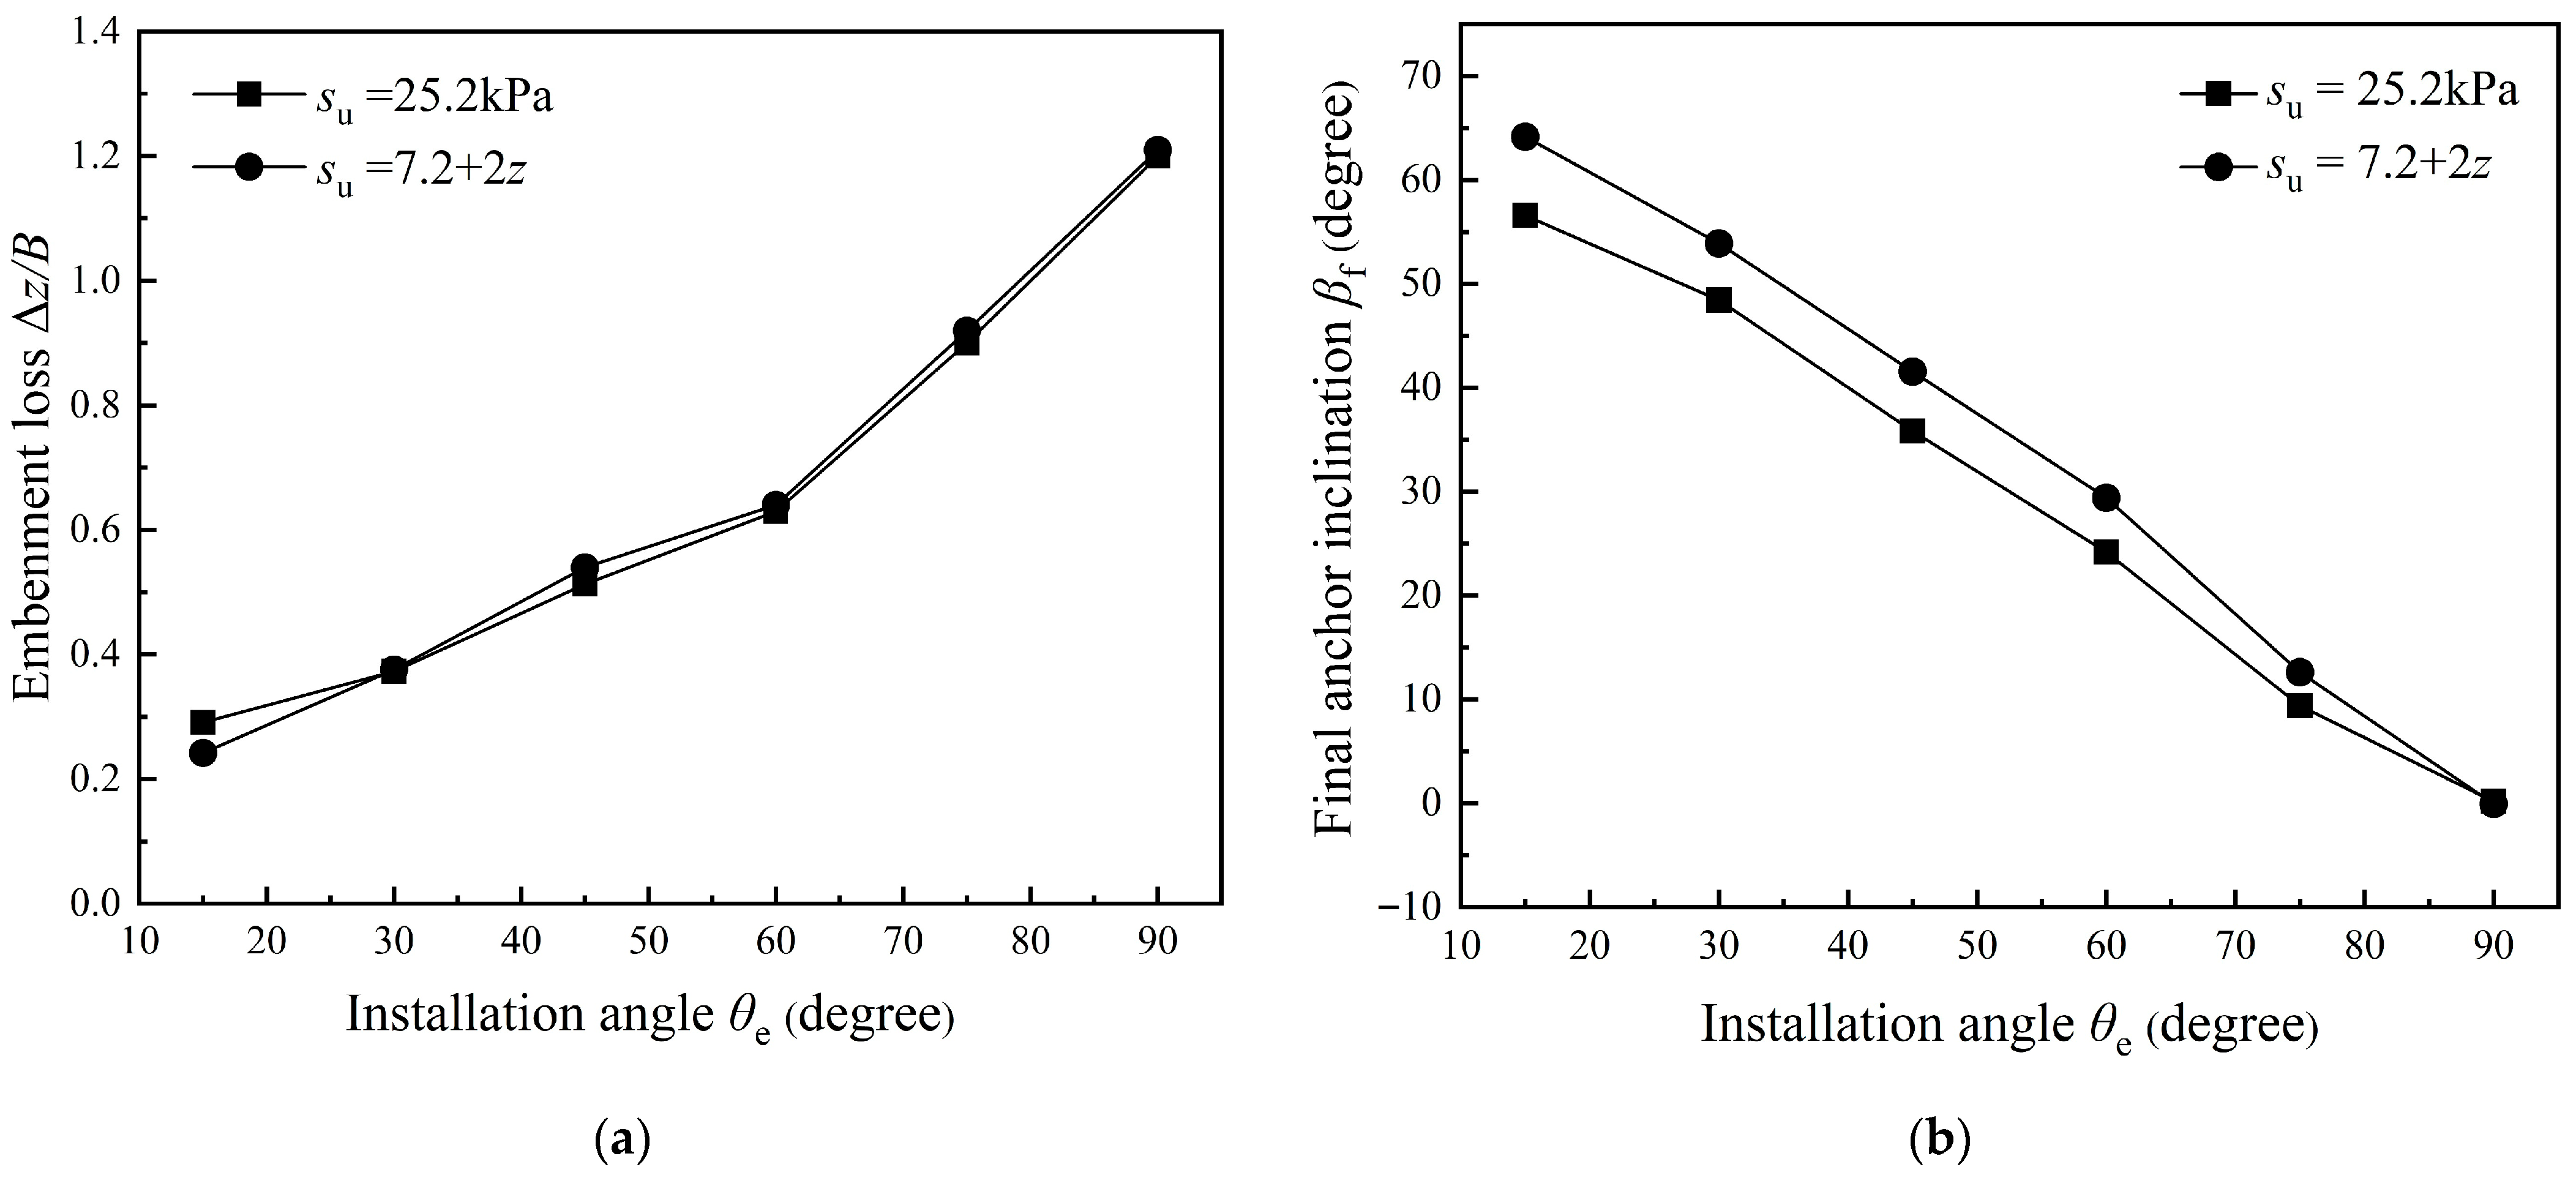
In the numerical study by Wang et al. [19], the SEPLA was vertically pulled (θe = 90°) in the soil with a strength of su = 6.3 kPa and su = 0.7z, where the initial embedment depth of the anchor Hi was 9 m (yielding the soil strength at the initial embedment depth sui = 6.3 kPa). It was demonstrated by Wang et al. [19] that the embedment loss only depends on the value of sui, independent of the soil strength gradient. In the present study, two cases of su = 25.2 kPa and su = 7.2 + 2z kPa were designed with the anchor initial embedment depth of Hi = 9 m, in which the soil strengths at the initial embedment depth were both sui = 25.2 kPa. Figure 12a presents the relationship between Δz/B and θe. The maximum deviation of embedment losses is only 0.05B for su = 25.2 kPa and su = 7.2 + 2z kPa with θe = 15°~90°. That means the embedment loss only depends on the soil strength at the initial embedment depth, even at different values of θe. However, the final anchor inclination βf is affected by the soil strength with a decreasing value of θe. The maximum difference is 10° at θe = 15°, as shown in Figure 12b.
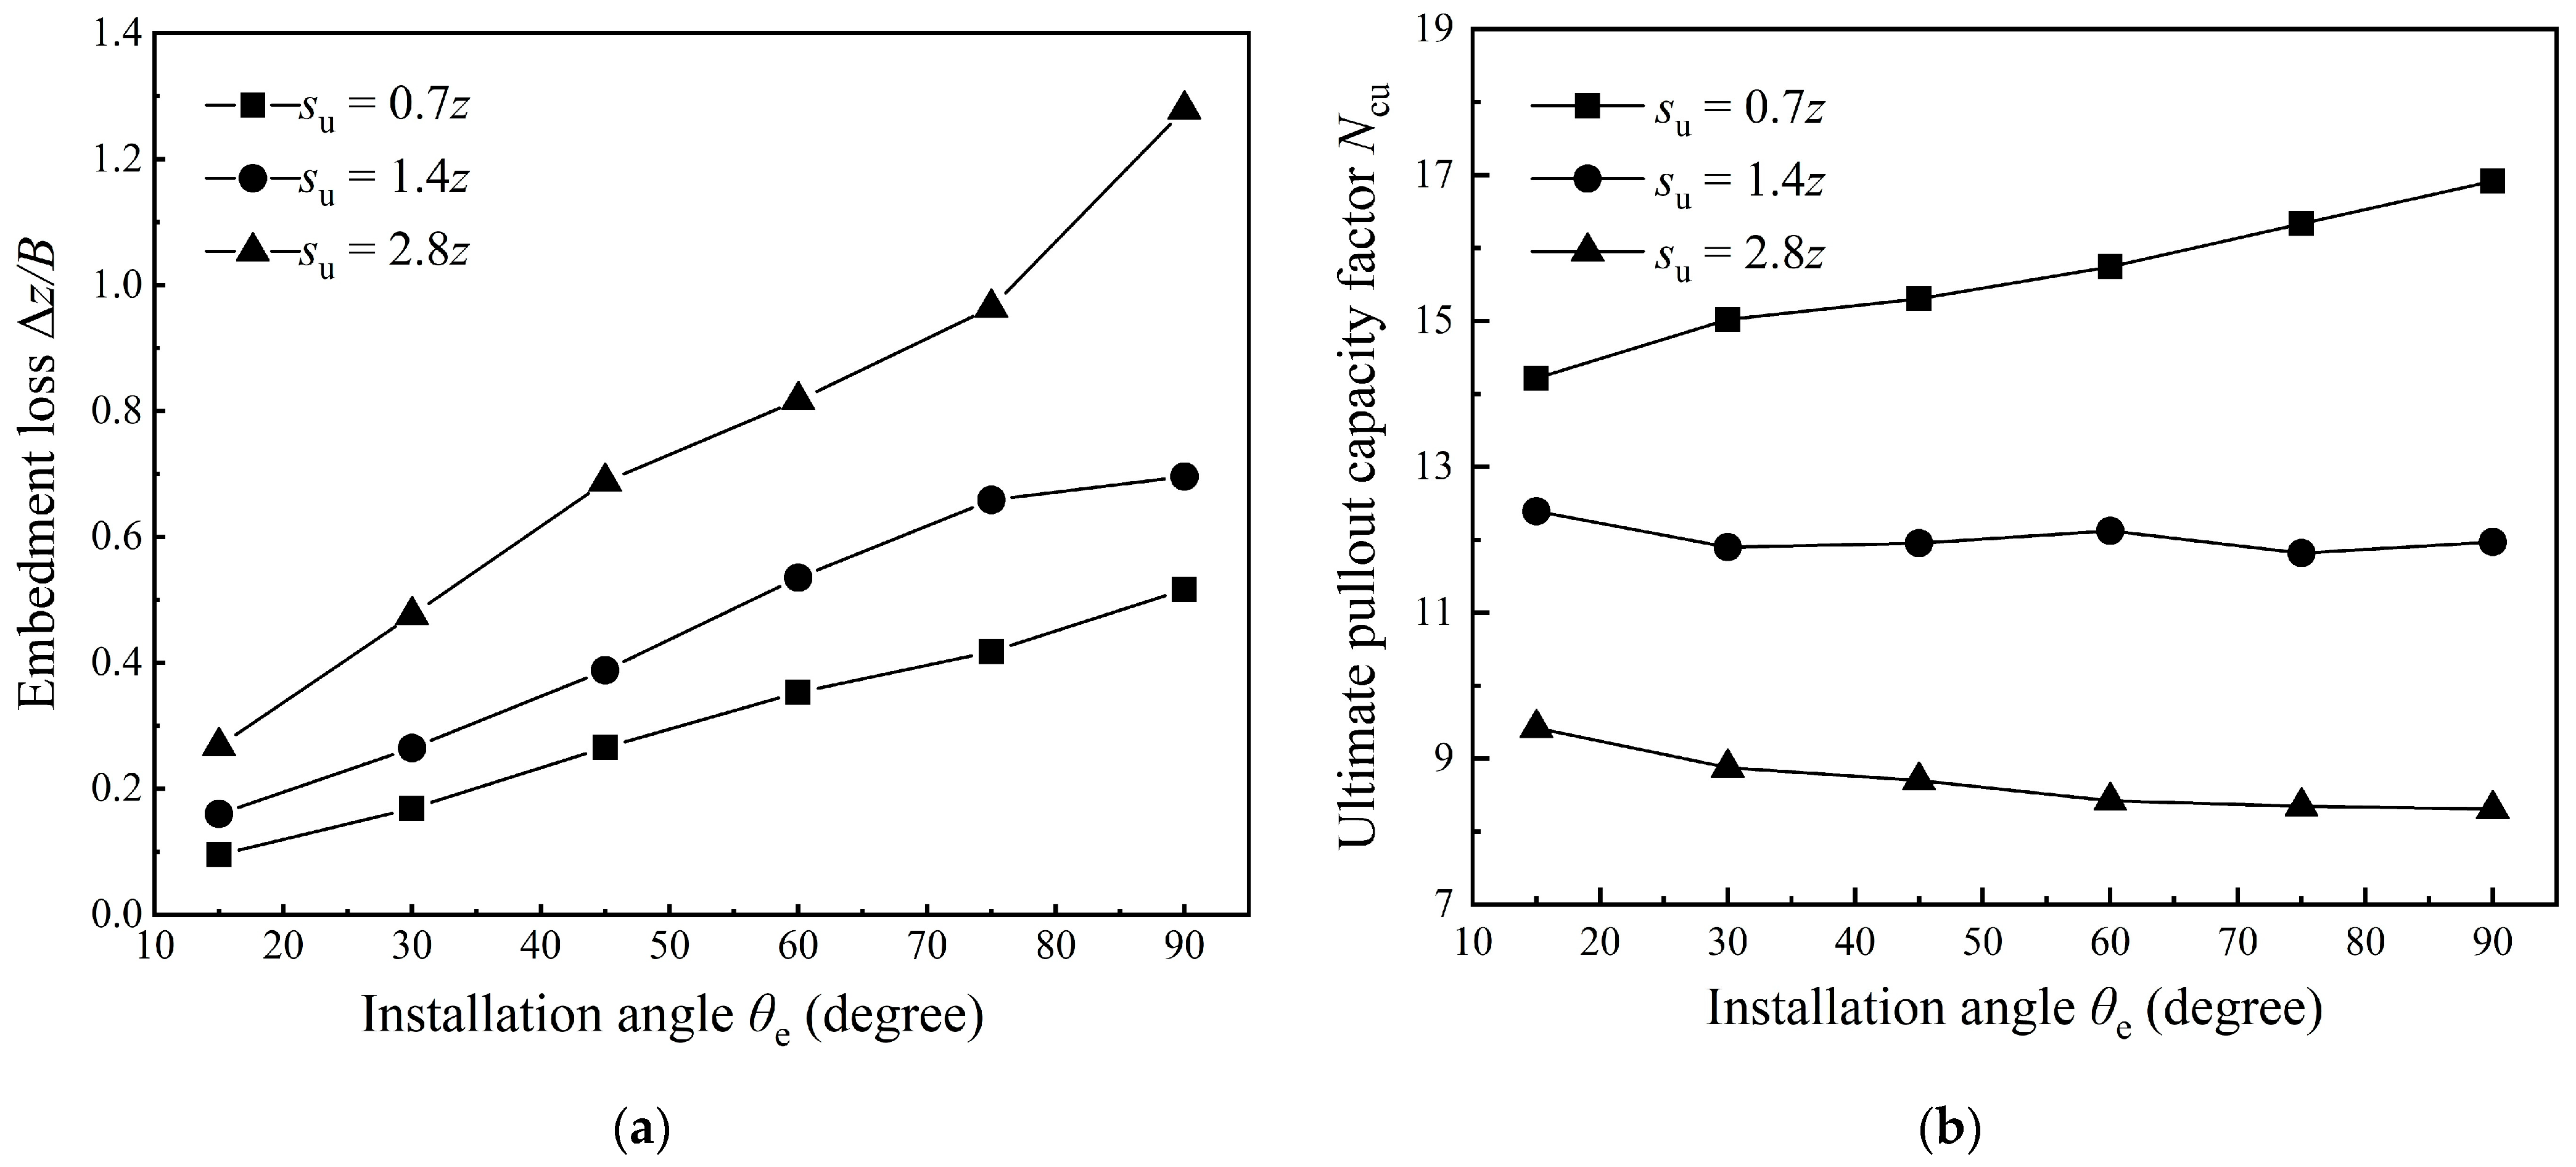
Based on the aforementioned findings, three soil strengths, i.e., su = 0.7z, 1.4z and 2.8z, were designed to evaluate the effects of soil strength on the keying of SEPLAs under different installation angles (Cases 2–4 in Table 4), as shown in Figure 13. Figure 13a demonstrates that the embedment loss increases with increasing soil strength. When the soil strength increases from su = 0.7z to su = 2.8z, the embedment loss increases from 0.09B to 0.27B, 0.17B to 0.48B, 0.27B to 0.69B, 0.35B to 0.82B, 0.42B to 0.96B and 0.52B to 1.28B for θe = 15°, 30°, 45°, 60°, 75° and 90°, respectively. Figure 13b shows that the ultimate bearing capacity factor decreases with increasing soil strength.
Figure 14 illustrates the soil flow mechanisms at θe = 60° with a soil strength of su = 0.7z, 1.4z and 2.8z. For su = 0.7z, the symmetrical circular flow is formed around the anchor sides, and the soil sticks the anchor back, which induces a higher ultimate bearing capacity factor. There is a cavity at the anchor back both for su = 1.4z and 2.8z, decreasing the ultimate bearing capacity factor with increasing soil strength.

3.4. Mechanical Parameters of the Chain

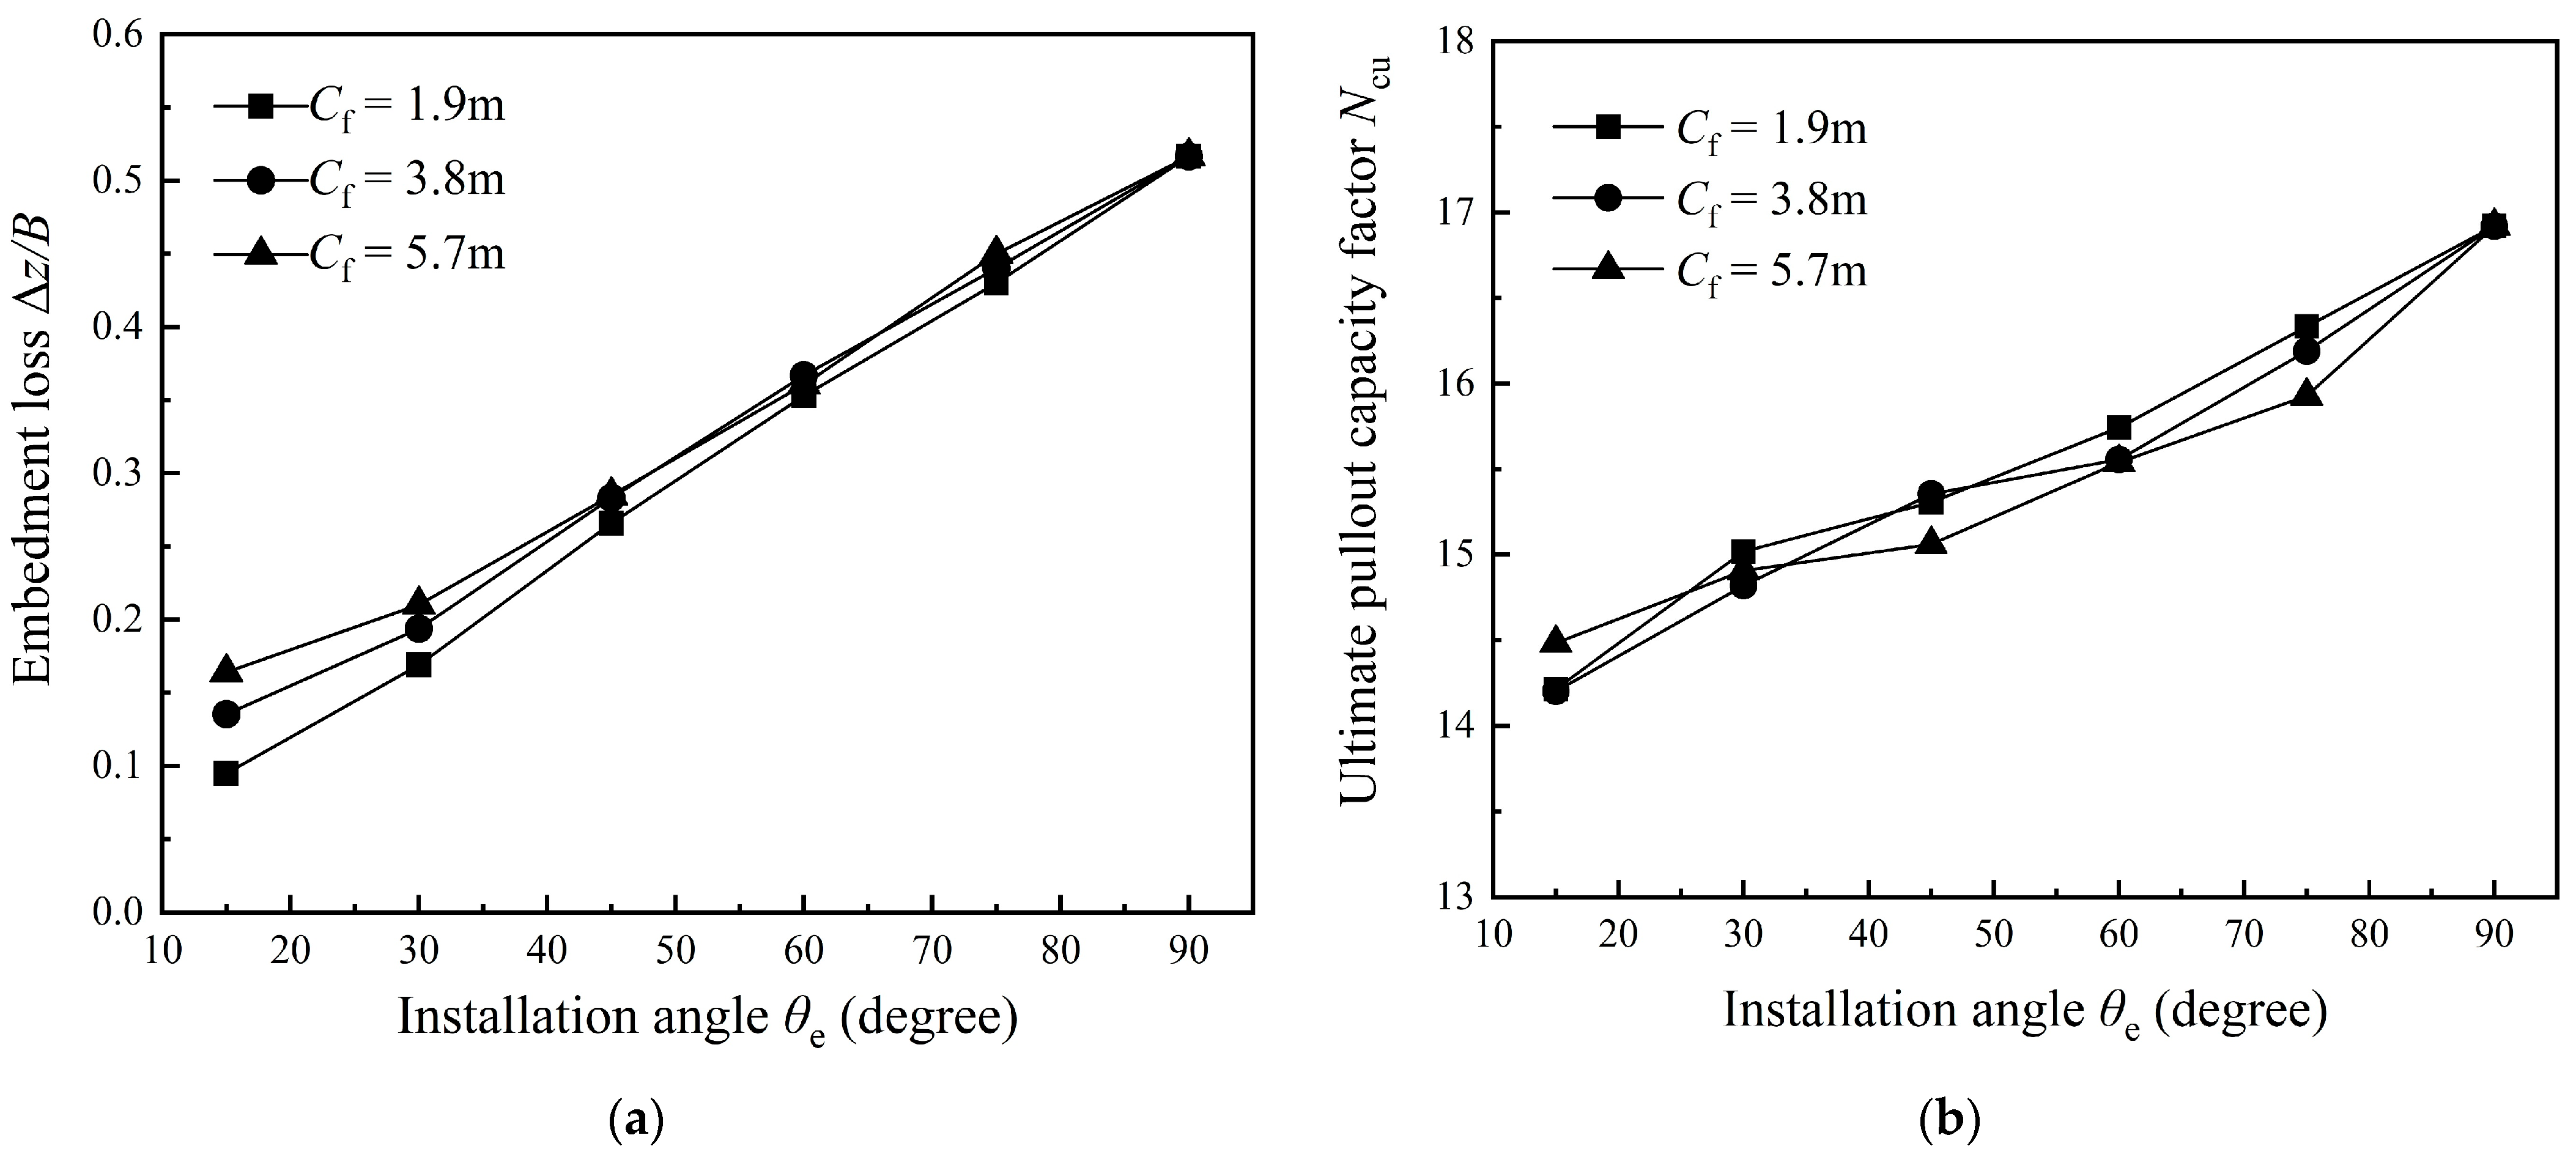
There are three mechanical parameters in Equation (1), including the chain diameter d, the bearing capacity factor of the chain Ncl and the multiplier to give the effective width of the chain En. Cf denotes the product of d, Ncl and En, i.e., Cf = dNclEn (unit: m). Three cases of Cf = 1.9 m, 3.8 m and 5.7 m were designed to evaluate their effects on the keying of SEPLAs (Cases 2, 6 and 7 in Table 4), as shown in Figure 15. The embedment loss increases with the increase of Cf for 15° ≤ θe ≤ 45°, while the value of Cf has no effect on the embedment loss for 45° < θe ≤90°. The smaller θe can form a reverse catenary shape of the chain in the soil, influencing the drag angle at the padeye θah and hence the anchor embedment loss. Figure 15b shows the relationship between the ultimate bearing capacity factor Ncu and the installation angle θe. It is demonstrated that the value of Cf has little effect on Ncu at different installation angles, with the maximum deviation of 1.9%.

4. Empirical Formulae

Considering that the CEL analysis is very time-consuming, empirical formulae will be established for embedment loss and ultimate bearing capacity factor in the present study, which is a benefit to engineering practice and easy to use by engineers. It is noted that the chain effects are incorporated into the empirical formula, which is hardly considered by previous researchers.

4.1. Embedment Loss

Based on the parametric study in Section 3 and dimensional analysis, the empirical formula for anchor embedment loss was developed:
Δ Z B = x 1 sin θ e + x 2 k H i s u 0 x 3 C f B x 4 x 5 e B x 6
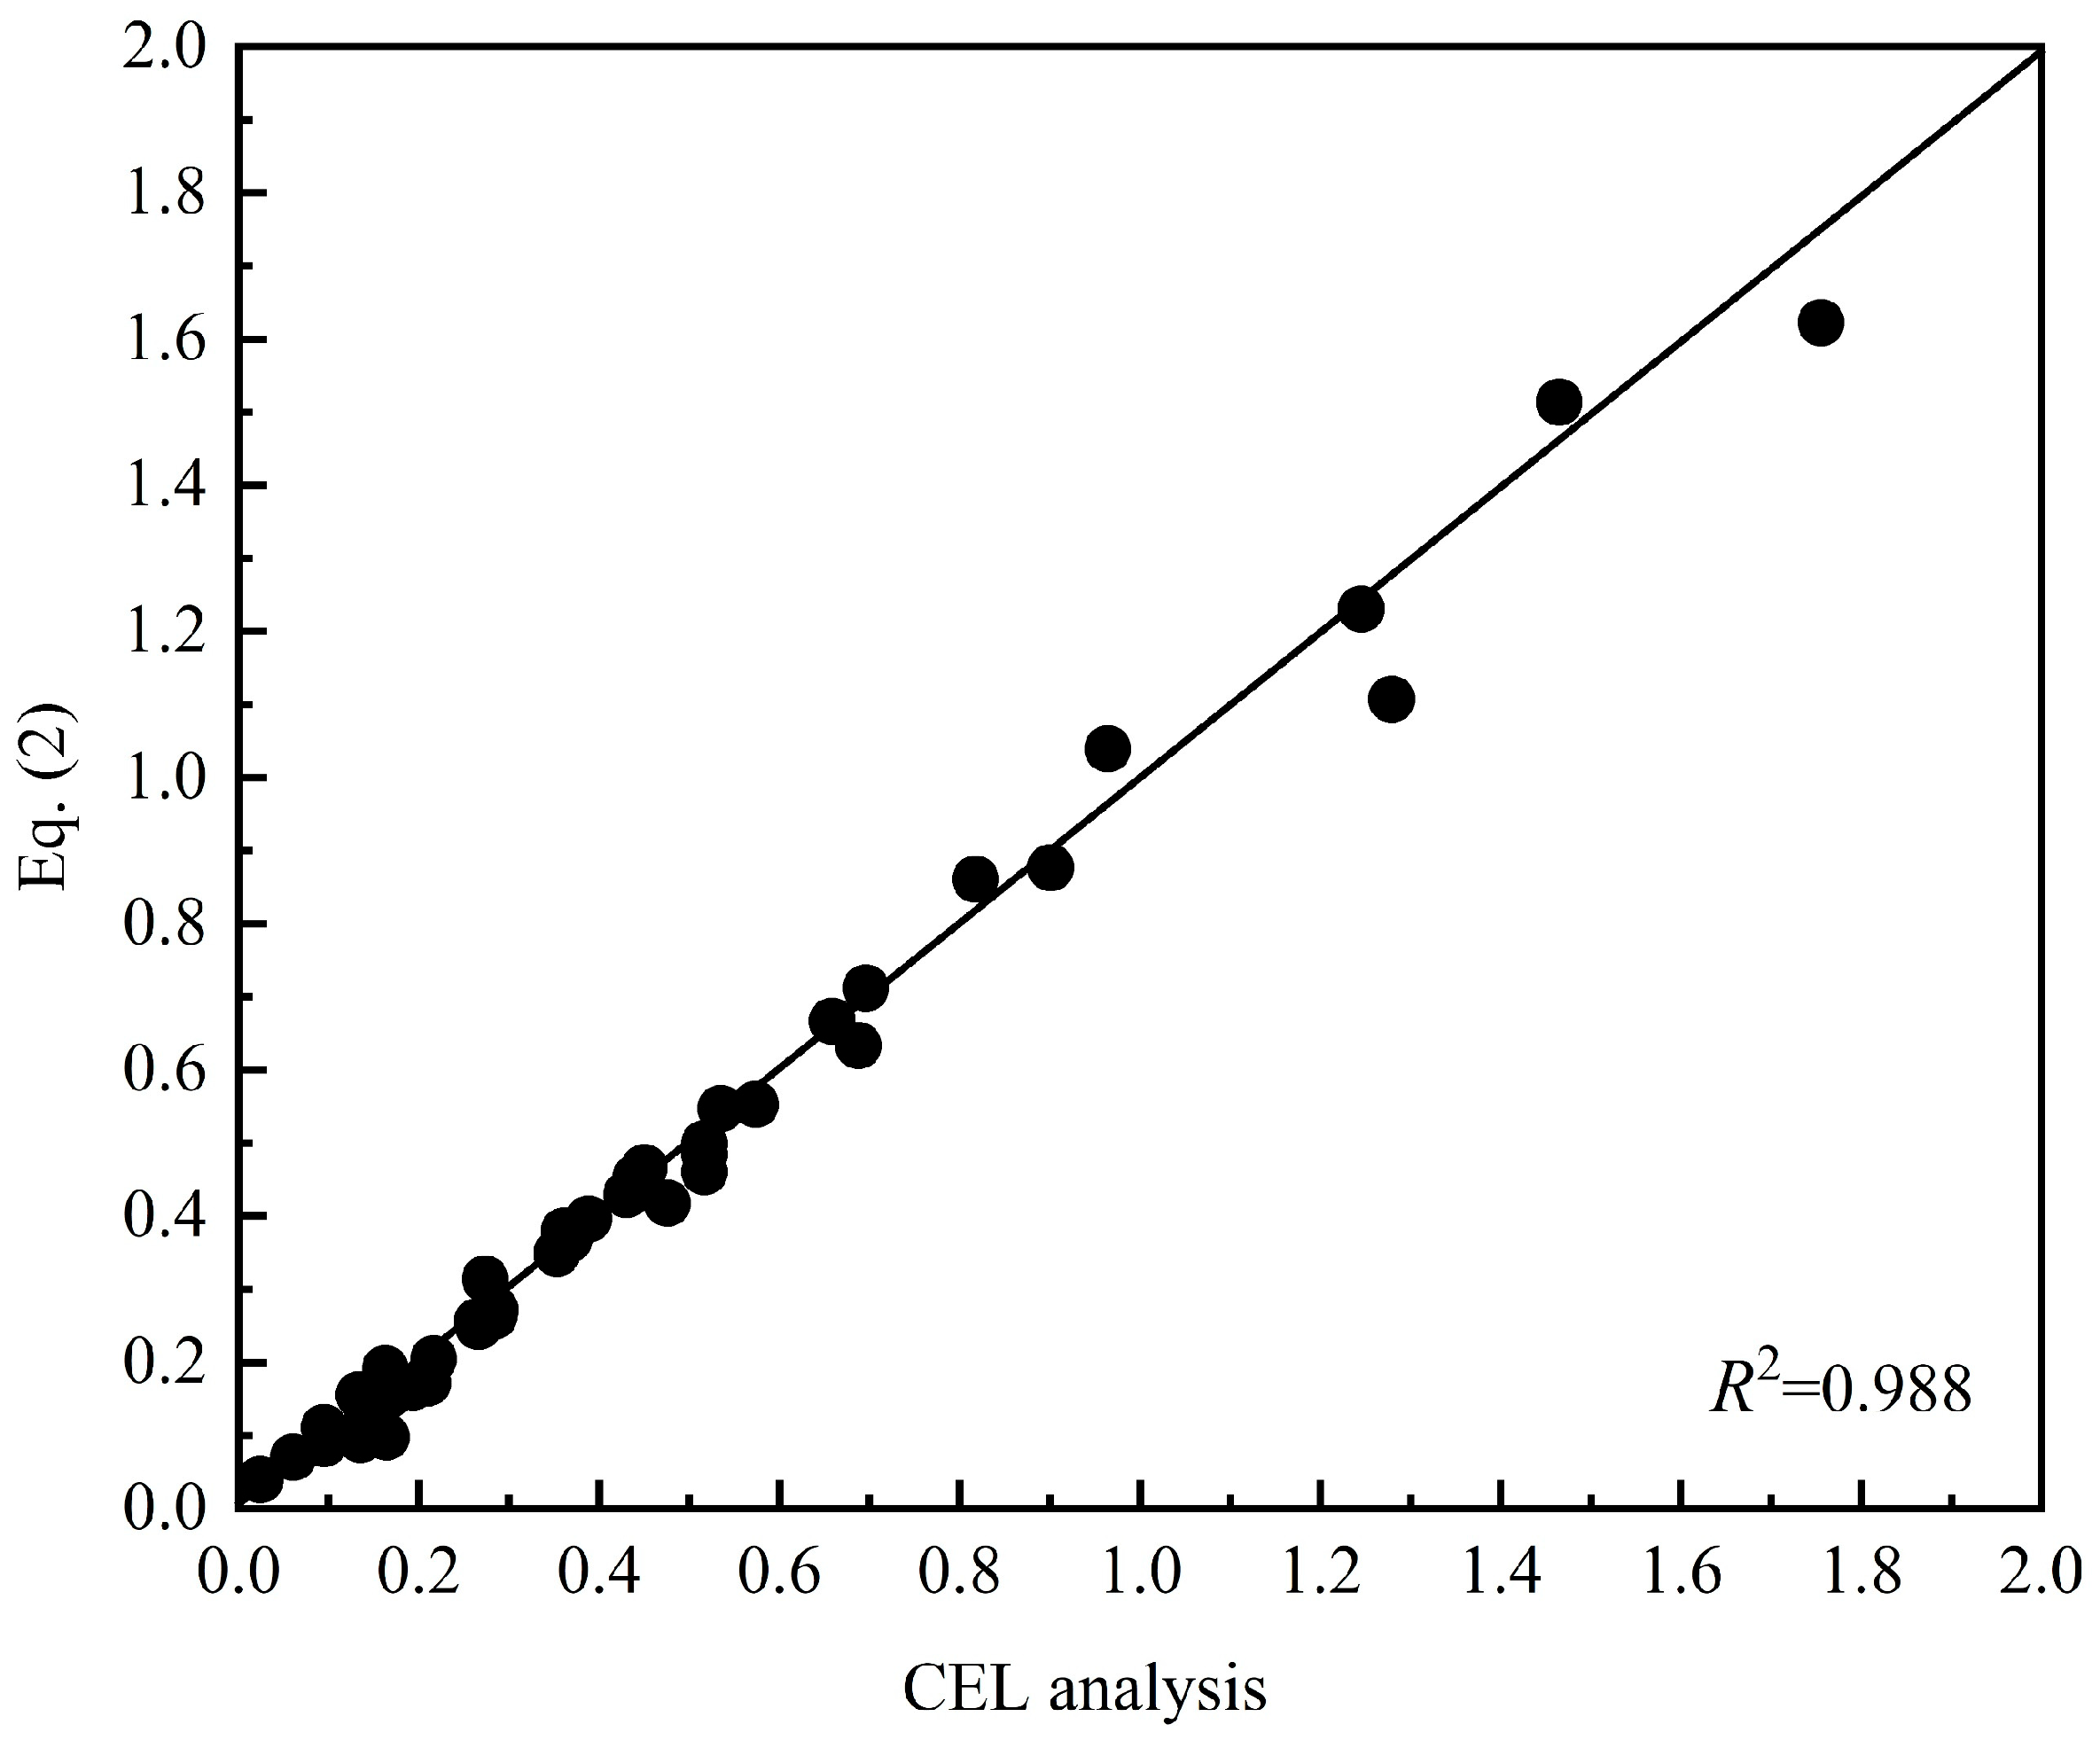
where x1, x2, x3, x4, x5 and x6 are the fitting coefficients for the empirical formula of Equation (2). It is noted that su0 adopts 0.001 kPa when su0 = 0 kPa. With CEL calculations in Table 5, x1, x2, x3, x4, x5 and x6 are fitted as 0.183, 0.316, 0.085, 0.01, 9.383 and 1.167, respectively. Figure 16 illustrates the comparison between the results of Equation (2) and the CEL analysis, with R2 = 0.988.
To verify the empirical formula for embedment loss, four validation cases were designed in Table 5 and calculated by CEL analysis and Equation (2). The deviations between the CEL analysis and Equation (2) are 0.26~9.33%, validating the efficiency of Equation (2).

4.2. Ultimate Pullout Capacity Factor

Based on the parametric study in Section 3 and dimensional analysis, the empirical formula for ultimate pullout capacity factor was also developed:
N cu = x 7 k H i S u 0 x 8 N c , θ e = 90 + x 9 θ e 90 x 10 C f B x 11 e B x 12
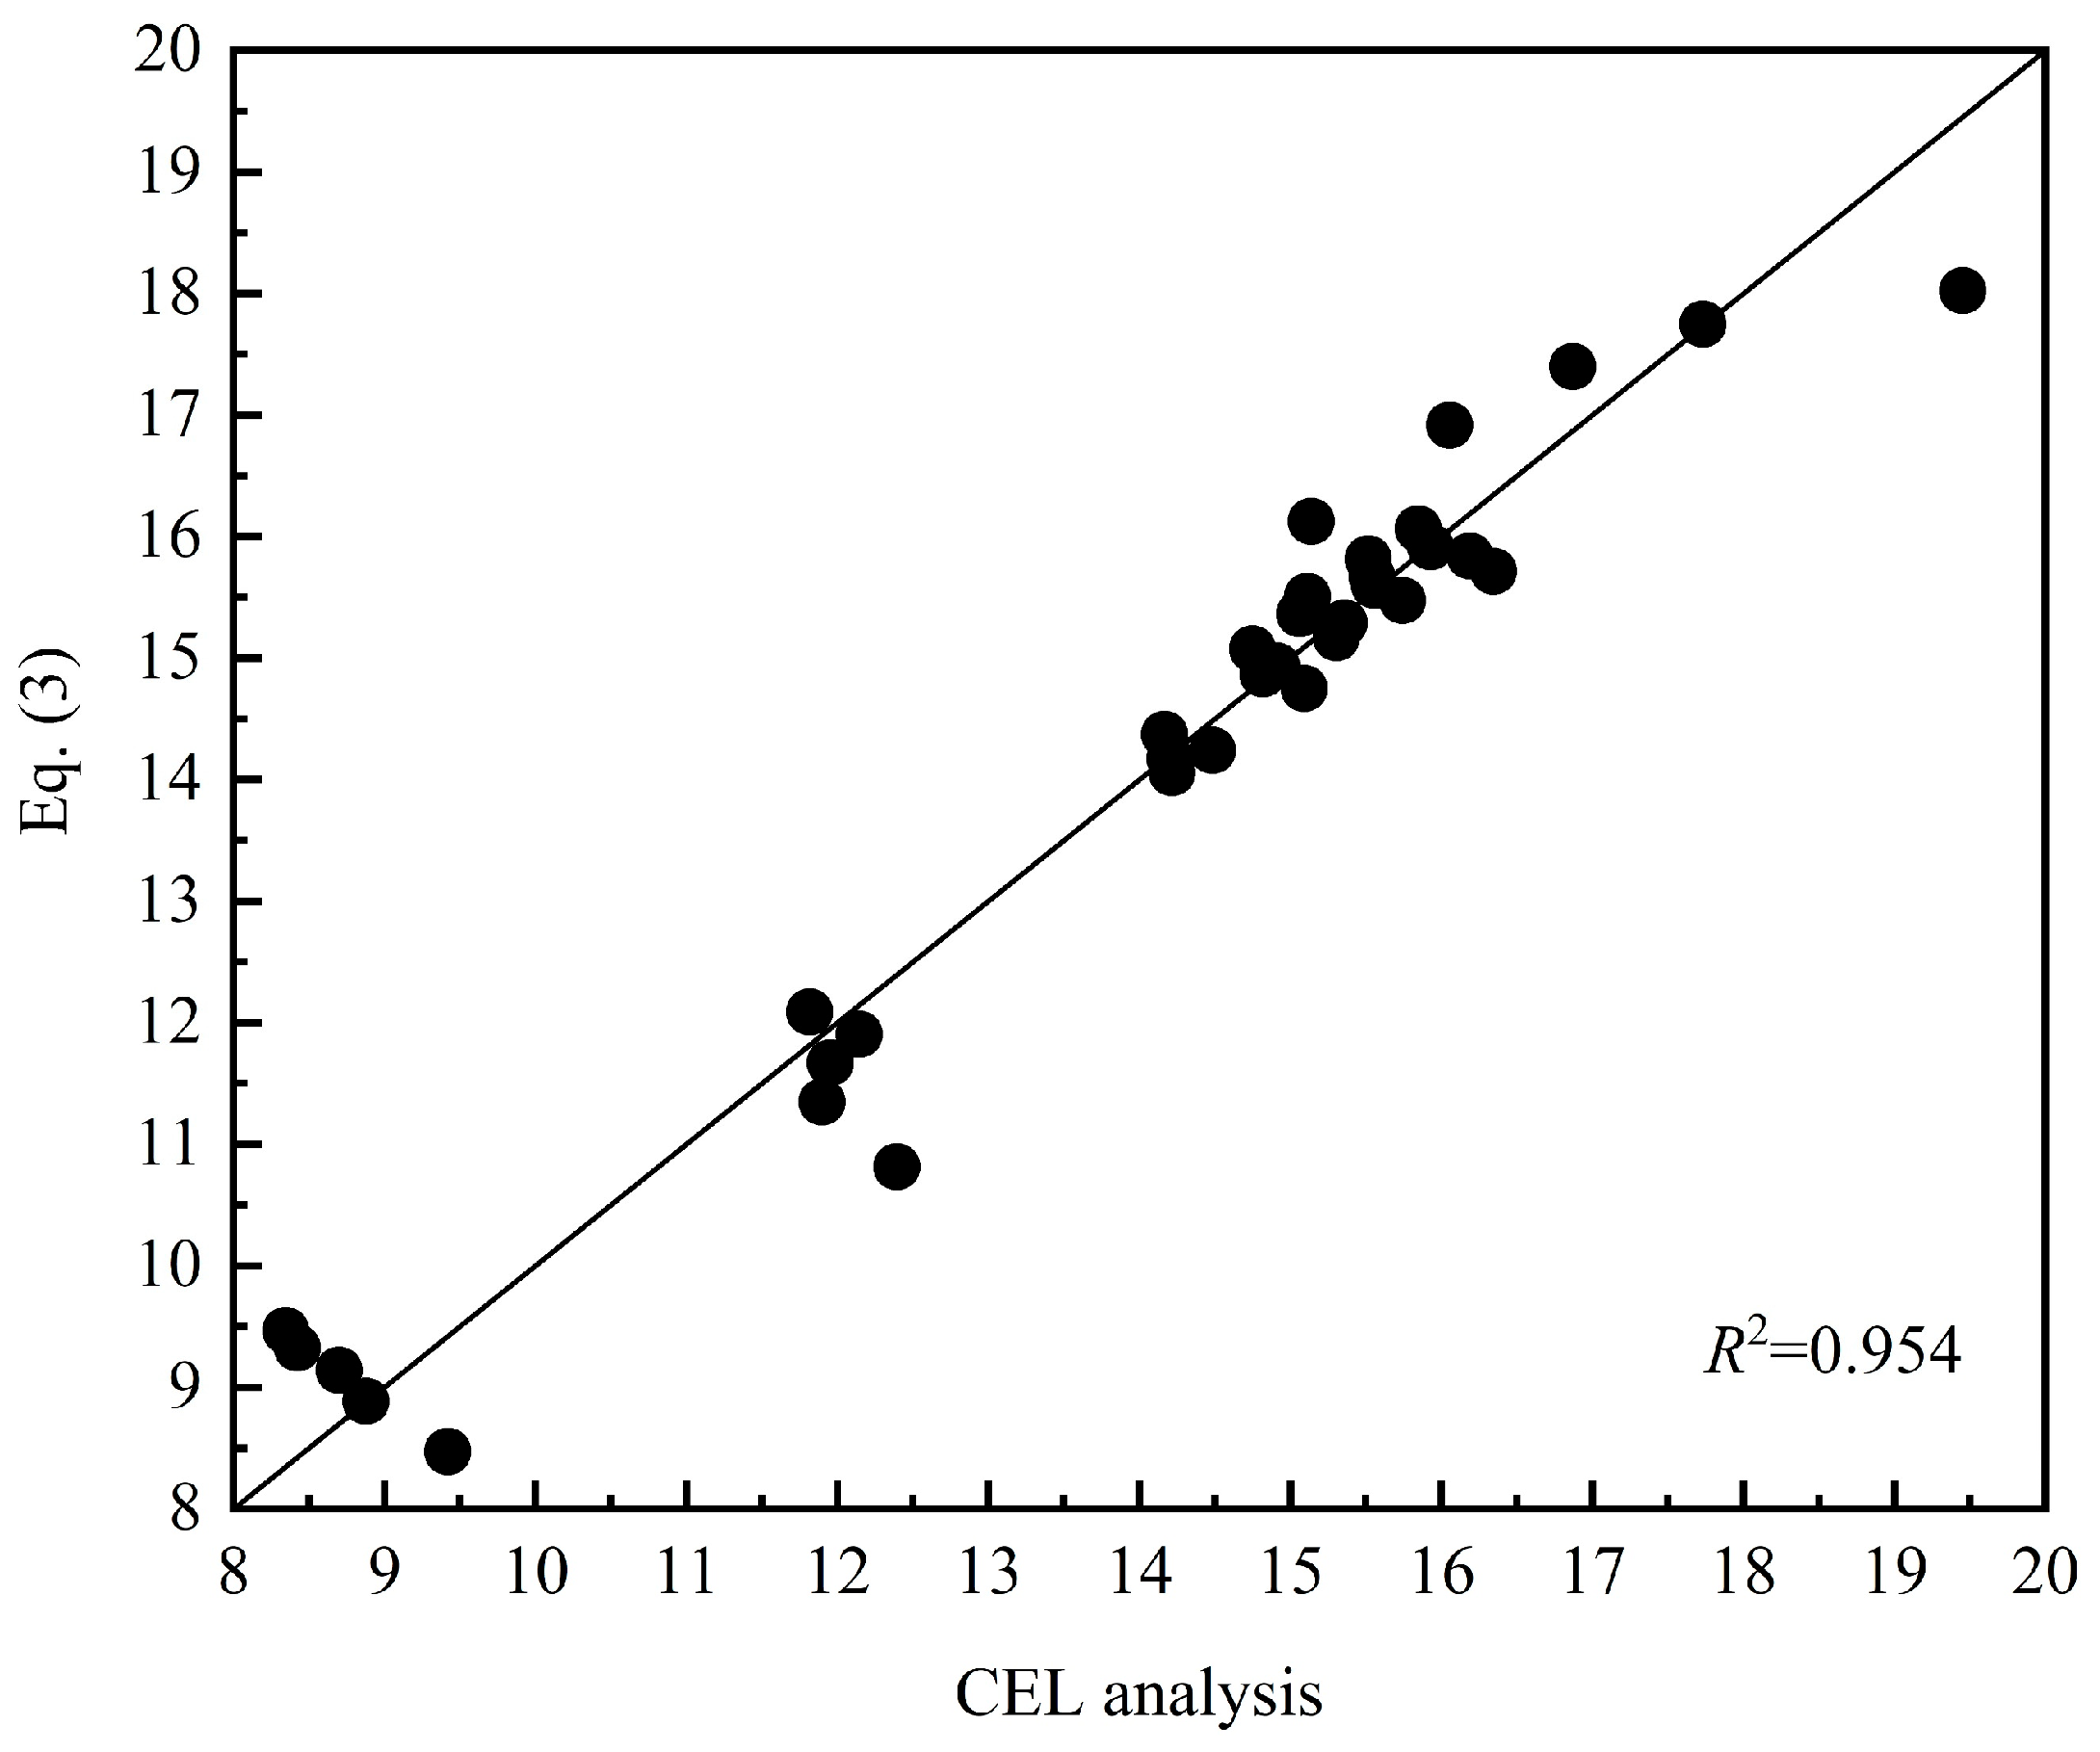
where x7, x8, x9, x10, x11, and x12 are the fitting coefficients for the empirical formula of Equation (3). It is noted that su0 adopts 0.001 kPa when su0 = 0 kPa. With CEL calculations in Table 4, x7, x8, x9, x10, x11, and x12 are fitted as 0.963, −0.027, 4.183, 0.069, −0.090 and 0.012. Figure 17 illustrates the comparison between the results of Equation (3) and the CEL analysis, with R2 = 0.954.
To verify the empirical formula for ultimate pullout capacity factor, two validation cases were designed in Table 6 and calculated by CEL analysis and Equation (3). The deviations between the CEL analysis and Equation (3) are 1.63~3.78%, validating the efficiency of Equation (3).

5. Conclusions

In the present study, the CEL method was employed to establish an FE model for analyzing the keying of SEPLAs, incorporating chain effects via the user subroutine VUAMP. Based on the sensitivity analysis for the introduced parameters in VUAMP, it is suggested that the initial drag force Ta0, the controlled rotational angular velocity urc, the controlled time interval tc and the load increment ΔT are adopted as 1~3suiA, 1.0°/s, 0.001 s and 0.5 kN, respectively. The effectiveness of the CEL model was demonstrated by validations against RITSS, CASPA and the centrifuge test.
With chain effects, the influences of installation angle, load eccentricity, soil strength and mechanical parameters of the chain on the keying of the SEPLAs were investigated. The results show the following:
(1) The final anchor inclination βf is approximately complement of the installation angle θe at the completion of the keying. The loss of embedment Δz and ultimate pullout capacity factor Ncu increase with increasing θe. Each 15° increase in θe elevates Δz by 0.06B~0.1B and Ncu by 3.10~4.62%.
(2) The values of Δz and Ncu decrease with increasing load eccentricity e. Increasing e/B from 0.17 to 1.0 reduces Δz/B by up to 94.14% and Ncu by 29.74%. Lower e/B (e.g., e/B = 0.17) amplifies the effects of θe on Δz and Ncu, because the anchor rotates around the anchor top which induces an intense unsymmetrical soil disturbance with the soil flowing back to the bottom of the anchor.
(3) The loss of embedment only depends on the soil strength at the initial embedment depth of SEPLAs. The value of Δz increases and that of Ncu decreases with increasing value of su. When the soil strength increases, there is a cavity at the anchor back, impairing the bearing capacity factor Ncu.
(4) The value of Δz increases with increasing chain parameter Cf for 15° ≤ θe ≤ 45°, while the value of Cf has no effect on Δz for 45° < θe ≤90°. The smaller θe forms a reverse catenary shape of the chain in the soil, influencing the drag angle at the padeye θah and hence the loss of embedment Δz. The value of Cf has little effect on the ultimate bearing capacity factor Ncu at different installation angles.
Based on the parametric study, empirical formulae were established for the embedment loss and ultimate bearing capacity of SEPLAs, yielding average deviations of 9.69% and 3.24%, respectively. By inputting the parameters of the anchor, chain and soil, the embedment loss and ultimate bearing capacity of SEPLAs can be easily calculated by Equations (2) and (3), respectively. The empirical formulae are easy to use by engineers and can reduce design cycles.
The chain effect was implemented by the chain equation (Equation (1)), which cannot reflect the effects of chain length. In addition, the installation angle was assumed by a constant during the keying of SEPLAs. These limitations also restrict the application of the empirical formulae. In the future, the researchers can pay more attention to the development of the chain equation or find a more accurate and effective FE method to simulate the chain.

Author Contributions

X.L.: FE calculation, data analysis, writing—original draft. W.Y.: model establishment, FE calculation. Y.Z. (Yanbing Zhao): methodology, writing—review and editing. Y.L. (Yongye Li): writing—review and editing. Y.Z. (Yan Zhang): writing—review and editing. Y.L. (Yun Lang): writing—review and editing. All authors have read and agreed to the published version of the manuscript.

Funding

This research was funded by the Fundamental Research Program of Shanxi Province (Grant number 202303021211067, 202303021212080, 202203021222100), National Key Research and Development Program of China (Grant number 2023YFF0906100), Water Resources Youth Talent Development Fund (Grant number JHQB202215), and the Five Talents Program of IWHR (Grant number SD0145B042021).

Data Availability Statement

The original contributions presented in this study are included in the article. Further inquiries can be directed to the corresponding author.

Conflicts of Interest

The authors declare no conflicts of interest.

Abbreviations

The following abbreviations and symbols are used in this manuscript:
CASPAChain and Suction Embedded Plate Anchor Plasticity Analysis
CELCoupled Eulerian–Lagrangian
FEFinite Element
LDFELarge Deformation Finite Element
RITSSRemeshing and Interpolation Technique with Small Strain
SEPLAsSuction Embedded Plate Anchors
VUAMPVectorized User Amplitude
Afluke area
Banchor width
Cfcombination parameter which denotes the product of d, Ncl and En
dchain diameter
EYoung’s modulus
En *multiplier to give the effective width in the normal direction
eload eccentricity
eppadeye offset
Hsoil height
Hiinitial embedment depth of the anchor
ksoil strength gradient
Lanchor length
Nc *pullout capacity factor for the anchor
Ncl *pullout capacity factor for the chain
Ncu *ultimate pullout capacity factor for the anchor
R2 *correlation coefficient for the fitted curve
Ssoil length
suundrained shear strength of the soil
sucsoil strength of the anchor center during the keying
suisoil strength at the initial embedment depth
Tadrag force at the padeye
Ta0initial value of Ta
Tedrag force at the embedment point
tanchor thickness
tccontrol time interval
urrotational angular velocity
urccontrol rotational angular velocity
uraveaverage rotational velocity
Wsoil width
(xa, za)padeye location
βanchor inclination to the horizontal
βffinal anchor inclination to the horizontal
ΔTload increment
Δx/B *normalized horizontal displacement of the anchor
Δz/B *normalized embedment loss
γanchorsubmerged unit weight of the anchor
γsoilsubmerged unit weight of the soil
θahdrag angle at the padeye
θah0initial value of θah
θedrag angle at the embedment point which is also called the installation angle
μfrictional coefficient between soil and chain
μcfrictional coefficient between soil and anchor
* Dimensionless parameters

References

  1. Tomassi, A.; de Franco, R.; Trippetta, F. High-resolution synthetic seismic modelling: Elucidating facies heterogeneity in carbonate ramp systems. Pet. Geosci. 2025, 31, petgeo2024-047. [Google Scholar] [CrossRef]
  2. Yi, J.; Ye, Z.; Cheng, Q.; Tang, H.; Han, X.; Tian, Y.; Li, S. Load-Bearing Performance of SEPLAs in Spatially Variable Clay. ASCE-ASME J. Risk Uncertain. A 2025, 11, 04025029. [Google Scholar] [CrossRef]
  3. Yi, J.; Lin, H.; Cheng, Q.; Liu, W.; Ding, L.; Li, X.; Yang, Q. A large deformation finite element investigation of SEPLA: Failure mechanism and bearing capacities when loaded differently. Appl. Ocean Res. 2024, 143, 103864. [Google Scholar] [CrossRef]
  4. Cerfontaine, B.; White, D.; Kwa, K.; Gourvenec, S.; Knappett, J.; Brown, M. Anchor geotechnics for floating offshore wind: Current technologies and future innovations. Ocean Eng. 2023, 279, 114327. [Google Scholar] [CrossRef]
  5. Wilde, B.; Treu, H.; Fulton, T. Field Testing of Suction Embedded Plate Anchors. In Proceedings of the Eleventh International Offshore and Polar Engineering Conference, Stavanger, Norway, 17–22 June 2001. [Google Scholar]
  6. Cheng, L.; Han, Y.; Wang, Q.; Wu, Y. Effects of soil remoulding on keying behaviours of strip plate anchors with padeye offset. Appl. Ocean Res. 2023, 141, 103790. [Google Scholar] [CrossRef]
  7. O’Loughlin, C.; Lowmass, A.; Gaudin, C.; Randolph, M. Physical modelling to assess keying characteristics of plate anchors. In Proceedings of the 6th International Conference on Physical Modelling in Geotechnics, London, UK, 20 July 2006. [Google Scholar]
  8. Yu, L.; Liu, J.; Kong, X.; Hu, Y. Three-dimensional numerical analysis of the keying of vertically installed plate anchors in clay. Comput. Geotech. 2009, 36, 558–567. [Google Scholar] [CrossRef]
  9. Tian, Y.; Cassidy, M.; Gaudin, C. The influence of padeye offset on plate anchor re-embedding behaviour. Geotech. Lett. 2014, 4, 39–44. [Google Scholar] [CrossRef]
  10. Tian, Y.; Gaudin, C.; Randolph, M.; Cassidy, M. Influence of padeye offset on the bearing capacity of three dimensional plate anchors. Can. Geotech. J. 2015, 52, 682–693. [Google Scholar] [CrossRef]
  11. Tian, Y.; Randolph, M.; Cassidy, M. Analytical solution for ultimate embedment depth and potential holding capacity of plate anchors. Geotechnique 2015, 65, 517–530. [Google Scholar] [CrossRef]
  12. Tian, Y.; Gaudin, C.; Cassidy, M.; Randolph, M. Considerations on the design of keying flap of plate anchors. J. Geotech. Geoenviron. Eng. 2013, 139, 1156–1164. [Google Scholar] [CrossRef]
  13. Tian, Y.; Gaudin, C.; Cassidy, M. Improving plate anchor design with a keying flap. J. Geotech. Geoenviron. Eng. 2014, 140, 04014009. [Google Scholar] [CrossRef]
  14. Wang, D.; Gaudin, C.; Randolph, M. Large deformation finite element analysis investigating the performance of anchor keying flap. Ocean Eng. 2013, 59, 107–116. [Google Scholar] [CrossRef]
  15. Liu, J.; Lu, H.; Yu, L. Keying behavior of suction embedded plate anchors with flap in clay. Ocean Eng. 2017, 131, 231–243. [Google Scholar] [CrossRef]
  16. Gaudin, C.; Simkin, M.; White, D.J.; O’Loughlin, C. Experimental investigation into the influence of a keying flap on the keying behaviour of plate anchors. In Proceedings of the Twentieth International Offshore and Polar Engineering Conference, Beijing, China, 20–25 June 2010. [Google Scholar]
  17. Wei, Q.; Cassidy, M.; Tian, Y.; Gaudin, C. Incorporating shank resistance into prediction of the keying behavior of suction embedded plate anchors. J. Geotech. Geoenviron. Eng. 2015, 141, 04014080. [Google Scholar] [CrossRef]
  18. Song, Z.; Hu, Y.; Wang, D.; O’Loughlin, C. Pullout capacity and rotational behaviour of square anchors. In Pullout Capacity and Rotational Behaviour of Square Anchors; Taylor & Francis: Hong Kong, China, 2006. [Google Scholar]
  19. Wang, D.; Hu, Y.; Randolph, M. Keying of rectangular plate anchors in normally consolidated clays. J. Geotech. Geoenviron. Eng. 2011, 137, 1244–1253. [Google Scholar] [CrossRef]
  20. Tho, K.; Chen, Z.; Leung, C.; Chow, Y. Pullout behaviour of plate anchor in clay with linearly increasing strength. Can. Geotech. J. 2014, 51, 92–102. [Google Scholar] [CrossRef]
  21. Ghorai, B.; Chatterjee, S. Effect of keying-induced soil remolding on the ultimate pull-out capacity and embedment loss of strip anchors in clay. J. Geotech. Geoenviron. Eng. 2021, 147, 04021109. [Google Scholar] [CrossRef]
  22. Peng, M.; Yin, Z. Numerical investigations into the drainage effects on the behaviors of plate anchors under unidirectional and combined loadings. Comput. Geotech. 2025, 188, 107624. [Google Scholar] [CrossRef]
  23. Gaudin, C.; Tham, K.; Ouahsine, S. Keying of plate anchors in NC clay under inclined loading. Int. J. Offshore Polar Eng. 2009, 19, 135–142. [Google Scholar]
  24. Cassidy, M.; Gaudin, C.; Randolph, M.; Wong, P.; Wang, D.; Tian, Y. A plasticity model to assess the keying of plate anchors. Geotechnique 2012, 62, 825–836. [Google Scholar] [CrossRef]
  25. Yang, M.; Aubeny, C.P.; Murff, J.D. Behavior of suction embedded plate anchors during keying process. J. Geotech. Geoenviron. Eng. 2012, 138, 174–183. [Google Scholar] [CrossRef]
  26. Liu, H.; Liang, K.; Peng, J.; Xiao, Z. A unified explicit formula for calculating the maximum embedment loss of deepwater anchors in clay. Ocean Eng. 2021, 236, 109454. [Google Scholar] [CrossRef]
  27. Song, Z.; Hu, Y.; O’Loughlin, C.; Randolph, M. Loss in anchor embedment during plate anchor keying in clay. J. Geotech. Geoenviron. Eng. 2009, 135, 1475–1485. [Google Scholar] [CrossRef]
  28. Zhao, Y.; Liu, H. Numerical implementation of the installation/mooring line and application to analyzing comprehensive anchor behaviors. Appl. Ocean Res. 2016, 54, 101–114. [Google Scholar] [CrossRef]
  29. Zhao, Y.; Liu, H.; Li, P. An efficient approach to incorporate anchor line effects into the coupled Eulerian–Lagrangian analysis of comprehensive anchor behaviors. Appl. Ocean Res. 2016, 59, 201–215. [Google Scholar] [CrossRef]
  30. Chen, Z.; Tho, K.; Leung, C.; Chow, Y. Large deformation numerical analysis of plate anchor keying process. In Frontiers in Offshore Geotechnics III, Proceedings of the 3rd International Symposium on Frontiers in Offshore Geotechnics (ISFOG 2015), London, UK, 10–12 June 2015; CRC Press: Boca Raton, FL, USA, 2015. [Google Scholar]
  31. Feng, T.; Xu, H.; Song, J.; Zhang, J.; Zhou, M.; Zhang, F. Finite—Element Analysis of Keying Process of Plate Anchors in Three—Layer Soft—Stiff—Soft Clay Deposits. Adv. Civ. Eng. 2019, 2019, 7835379. [Google Scholar] [CrossRef]
  32. Feng, T.; Zong, J.; Jiang, W.; Zhang, J.; Song, J. Ultimate pullout capacity of a square plate anchor in clay with an interbedded stiff layer. Adv. Civ. Eng. 2020, 2020, 8867678. [Google Scholar] [CrossRef]
  33. Liu, H.; Xu, K.; Zhao, Y. Numerical investigation on the penetration of gravity installed anchors by a coupled Eulerian–Lagrangian approach. Appl. Ocean Res. 2016, 60, 94–108. [Google Scholar] [CrossRef]
  34. Zhang, Y.; Fan, S.; Li, S.; Yin, J. Analysis of the drag anchor behaviour at shallow depths. Comput. Geotech. 2023, 160, 105518. [Google Scholar] [CrossRef]
  35. Maitra, S.; Tian, Y.; Cassidy, M. Investigation of the installation process of drag-in plate anchors from LDFE modelling. Geotechnique 2022, 74, 1215–1227. [Google Scholar] [CrossRef]
  36. Wu, X.; Chow, Y.; Leung, C. Effect of Fluke Inclination on Behavior of Drag Anchor in Uniform Clay Under Unidirectional and Combined Loading. J. Offshore Mech. Arct. Eng. 2019, 141, 054501. [Google Scholar] [CrossRef]
  37. Ganesh, R. Evaluation of undrained breakout capacity of shallowly buried plate anchors in cohesive soils using a tension-truncated Tresca strength criterion. Ocean Eng. 2025, 338, 122042. [Google Scholar] [CrossRef]
  38. Neubecker, S.; Randolph, M. Profile and frictional capacity of embedded anchors chains. Int. J. Geoenviron. Eng. 1995, 21, 797–803. [Google Scholar] [CrossRef]
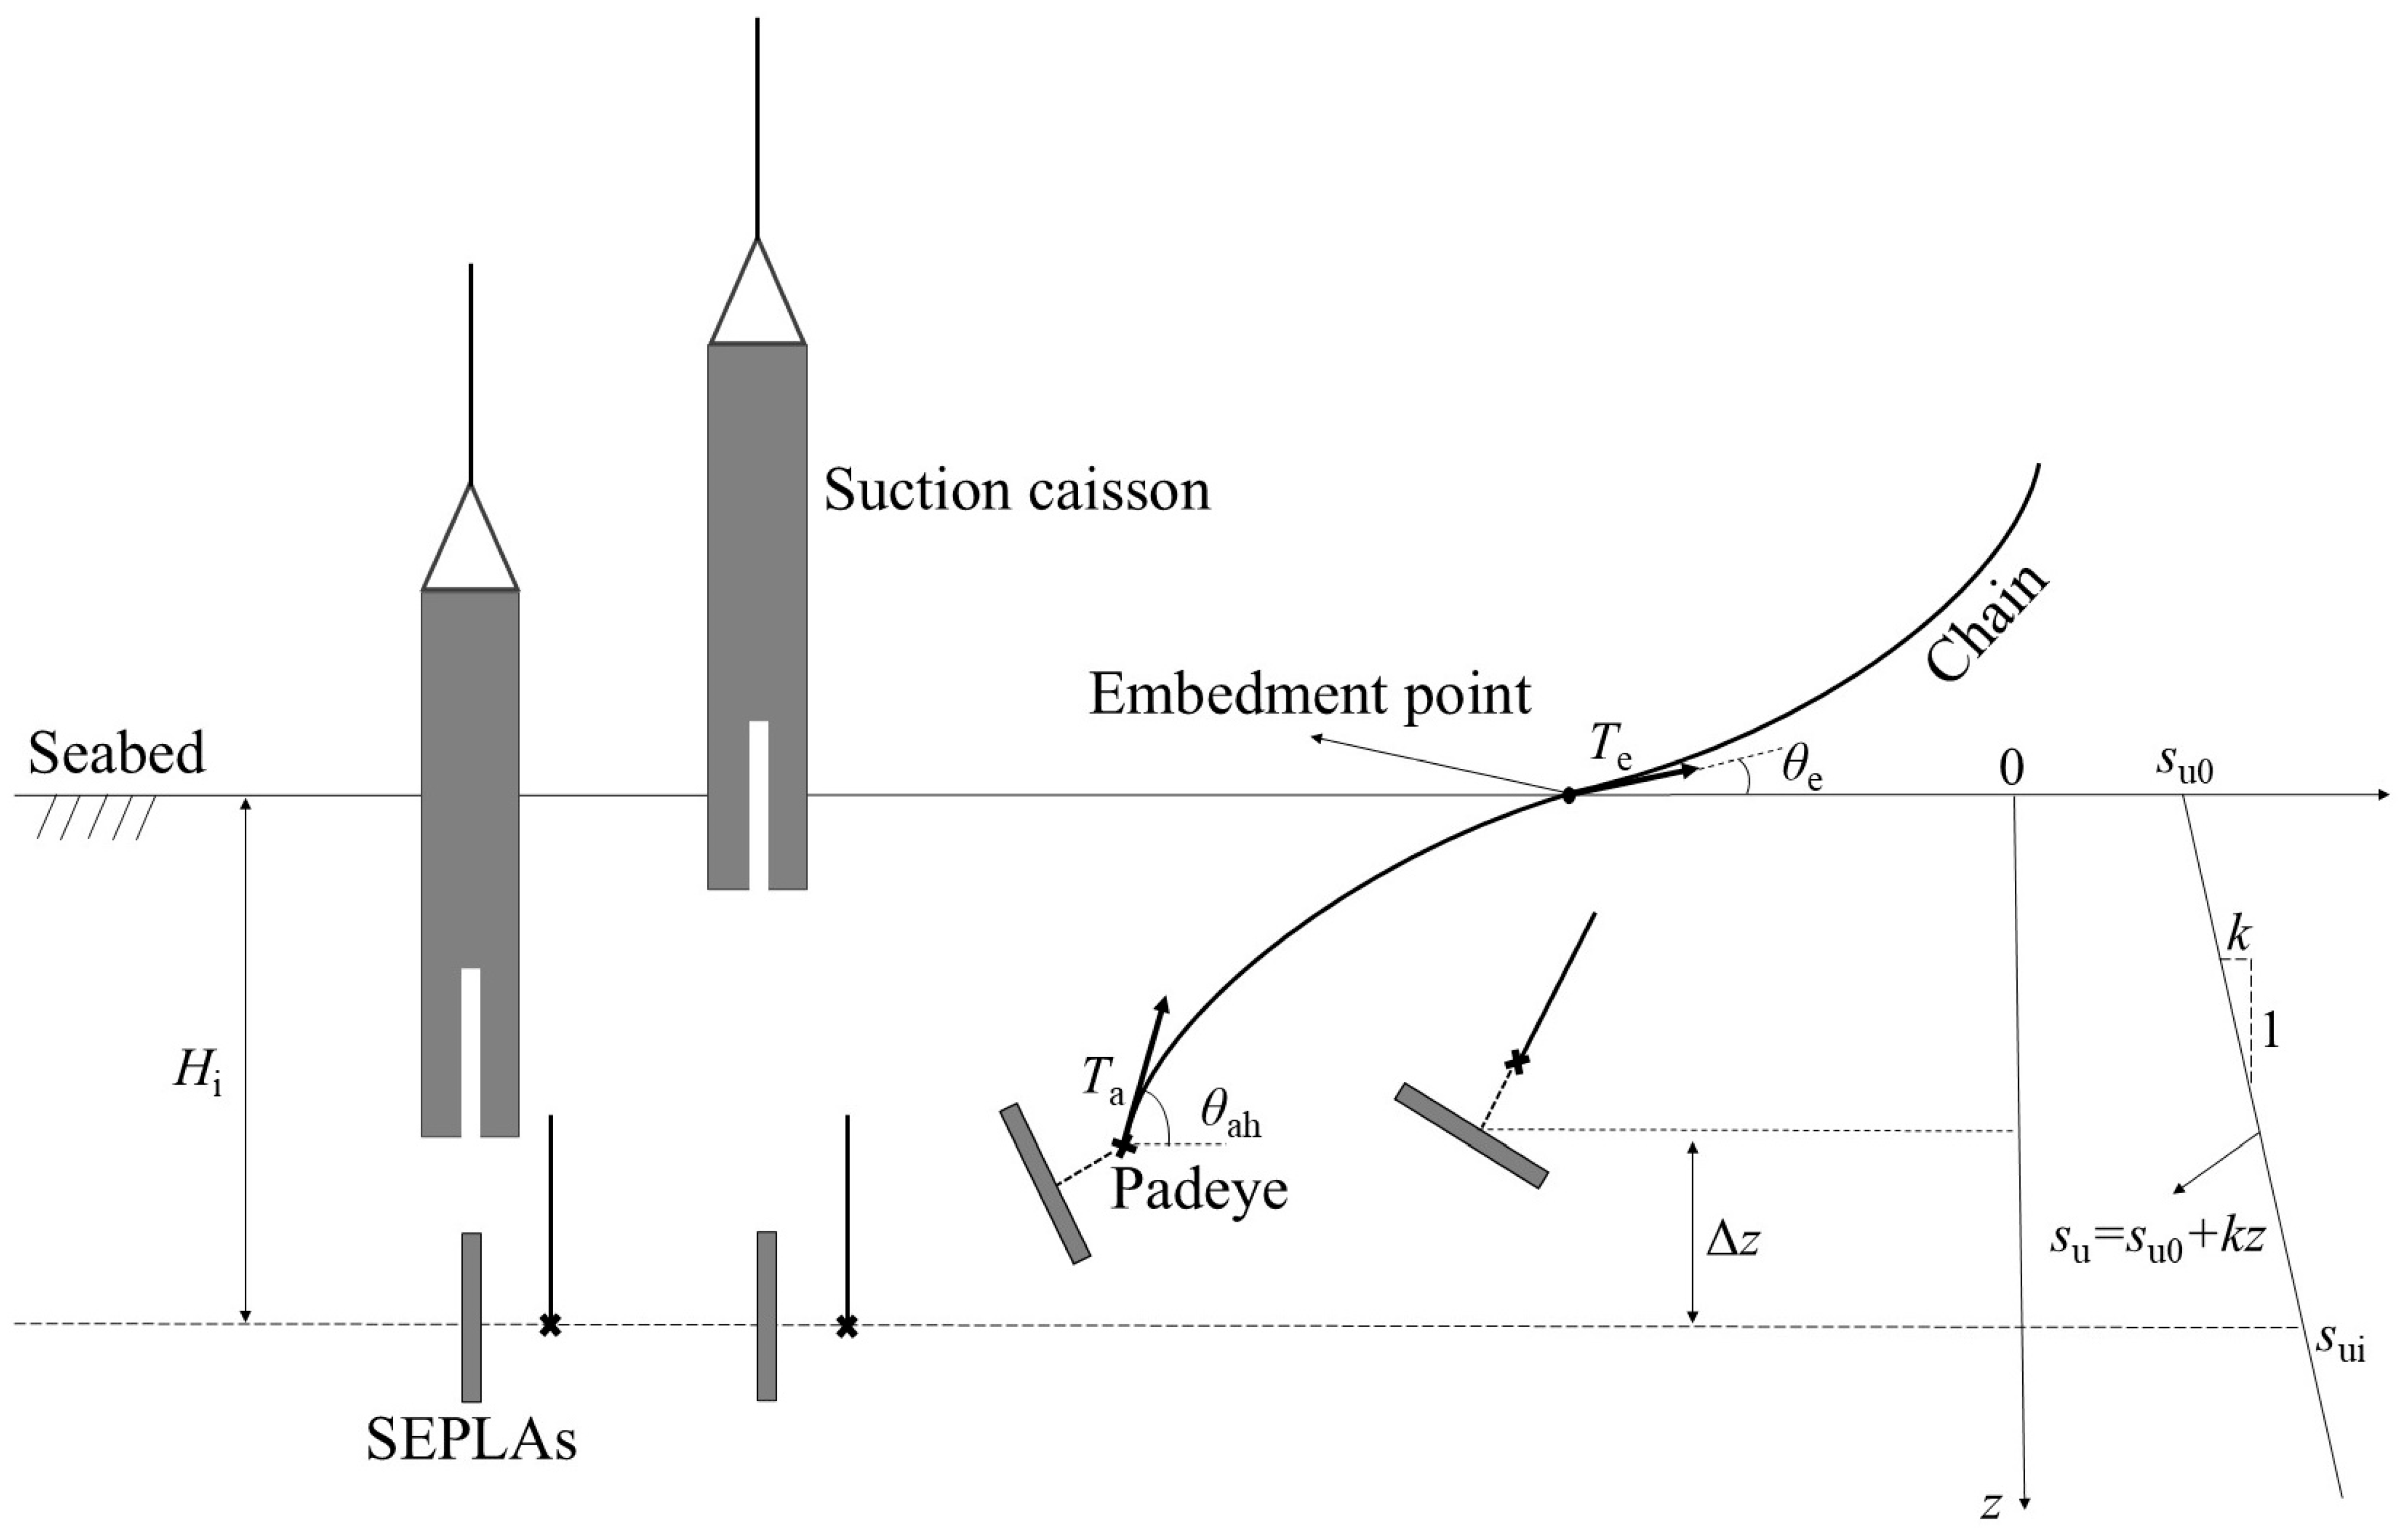
Figure 1. Keying of SEPLAs with chain effects in the normally consolidated clay [6].
Jmse 13 02056 g001
Figure 2. Geometry of SEPLAs [6].
Jmse 13 02056 g002
Figure 3. CEL model.
Jmse 13 02056 g003
Figure 4. Flowchart to incorporate chain effects.
Jmse 13 02056 g004
Figure 5. Relationship between the embedment loss and the anchor inclination. (a) Effect of mesh size. (b) Effect of domain size.
Jmse 13 02056 g005
Figure 6. Effects of parameters in VUAMP on the embedment loss. (a) Effect of Ta0, (b) effect of urc, (c) effect of tc, (d) effect of ΔT.
Jmse 13 02056 g006
Figure 7. Comparison of the calculated results. (a) Anchor inclination with embedment loss (RITSS). (b) Embedment loss with installation angle (RITSS). (c) Anchor inclination with embedment loss (CASPA). (d) Anchor inclination with embedment loss (centrifuge test).
Jmse 13 02056 g007
Figure 8. Effects of installation angle on the keying of SEPLAs. (a) Drag angle, (b) trajectories of SEPLAs, (c) embedment loss, (d) pullout capacity factor.
Jmse 13 02056 g008
Figure 9. Soil flow mechanism with different installation angles (Case 2).
Jmse 13 02056 g009
Figure 10. Effects of load eccentricity on the keying of SEPLAs. (a) Embedment loss, (b) ultimate pullout capacity factor.
Jmse 13 02056 g010
Figure 11. Soil flow mechanism with different load eccentricities (θe = 60°).
Jmse 13 02056 g011
Figure 12. Effects of soil strength at the initial embedment depth on the keying of SEPLAs. (a) Embedment loss, (b) final anchor inclination.
Jmse 13 02056 g012
Figure 13. Effects of soil strength on the keying of SEPLAs. (a) Embedment loss, (b) ultimate pullout capacity factor.
Jmse 13 02056 g013
Figure 14. Soil flow mechanism with different soil strengths (θe = 60°).
Jmse 13 02056 g014
Figure 15. Effects of mechanical parameters of the chain on the keying of SEPLAs. (a) Embedment loss, (b) ultimate pullout capacity.
Jmse 13 02056 g015
Figure 16. Comparison between CEL analysis and Equation (2).
Jmse 13 02056 g016
Figure 17. Comparison between CEL analysis and Equation (3).
Jmse 13 02056 g017
Table 1. Model parameters.
TypeModel ParametersRITSS [19]CASPA [17]Centrifuge Test [27]
SoilS (m)19.727.825.8
W (m)47.94
H (m)1625.916
su (kPa)0.7z1 + 1.25z18
Poisson’s ratio0.490.490.49
γsoil (kN/m3)6.56.59.2
E/su500500500
AnchorL (m)37.924
B (m)34.644
t (m)0.20.160.2
e/B0.17, 0.5 *, **, 1.00.5580.625
Poisson’s ratio0.30.30.3
γanchor (kN/m3)676567.8
Hi/B34.473
ChainNcl, En, μ7.6, 1, 0.17.6, 1, 0.17.6, 1, 0.1
d (m)0.10.410.1
θe (°)30 **, 45, 60, 75, 90 *4060
* Parameters used in Section 2.3.1. ** Parameters used in Section 2.3.2.
Table 2. Parameters and results under different mesh and domain sizes.
CaseMinimum Mesh SizeLength of Soil Domain (m)Number of ElementsEmbedment Loss Δz/B
Mesh 1B/1019.732,2560.58
Mesh 2B/2019.7152,5200.51
Mesh 3B/3019.7406,0000.49
Domain 1B/2010.783,6400.51
Domain 2B/2019.7152,5200.51
Domain 3B/2037.7250,9200.52
Table 3. Cases assessing the dependency of parameters in VUAMP.
CasesTa0 (kN)urc (°/s)tc (s)ΔT (kN)
128
57
171
285
570
1.00.0010.5
21140.5
1.0
2.0
0.0010.5
31141.00.1
0.01
0.001
0.5
41141.00.0010.25
0.5
1.0
Table 4. Cases of parametric study.
CaseCf (m)e/Bsu (kPa)θe (°)
11.90.170.7z15, 30, 45, 60, 75, 90
21.90.50.7z 15, 30, 45, 60, 75, 90
31.90.51.4z15, 30, 45, 60, 75, 90
41.90.52.8z15, 30, 45, 60, 75, 90
51.91.00.7z15, 30, 45, 60, 75, 90
63.80.50.7z15, 30, 45, 60, 75, 90
75.70.50.7z15, 30, 45, 60, 75, 90
Table 5. Verification of Equation (2).
θe (°)e/Bsu (kPa)Cf (m)CEL AnalysisEquation (2)Deviation
20°0.31.0z2.850.3000.2729.33%
40°0.62.0z4.050.3750.3914.27%
90°0.31.0z2.851.0411.1056.15%
90°0.62.0z4.050.7830.7850.26%
Table 6. Verification of Equation (3).
θe (°)e/Bsu (kPa)Cf N c , θ e = 90 CEL AnalysisEquation (3)Deviation
20°0.31.0z2.8514.27913.86513.6401.63%
40°0.62.0z4.059.8910.27810.6663.78%
Disclaimer/Publisher’s Note: The statements, opinions and data contained in all publications are solely those of the individual author(s) and contributor(s) and not of MDPI and/or the editor(s). MDPI and/or the editor(s) disclaim responsibility for any injury to people or property resulting from any ideas, methods, instructions or products referred to in the content.