Abstract
This study presents an experimental investigation of seabed scour in front of a quay wall due to the interaction between propeller jet flow and the wall effect. For this purpose, two propellers (Dp = 6 and 9 cm in diameter) were used, and four different wall clearances (Xw = 2, 4, 6 and 8Dp) were selected. The experiments were carried out for propeller rotational speeds ranging from 300 rpm to 1000 rpm. The effect of clay content was also investigated using three different clay contents of 0, 5 and 10% by weight (i.e., p = 0, 0.05 and 0.1). The results of the study reveal that at low propeller rotational speeds, scour in the cohesive seabed is decreased compared to that in the cohesionless bed. The scour profiles obtained at high propeller rotational speeds for the seabed with a clay content of 5% were found to have the same characteristics as those obtained for the cohesionless seabed. However, as the clay content increases to 10%, significant changes occur in the scour profiles, and the cohesion effect begins to dominate.
1. Introduction
The capacity of maritime transport has been increasing with the increasing demands of world trade. The shipping industry development has been characterized by a surge in capacity, which is inevitably accompanied by an increase in engine power [1]. When ships are operating at full load, the effects of the propeller jet stream on the seabed and/or around berthing structures are observed during maneuvers within navigation channels or harbors. In this case, erosion occurs around berthing structures, and sediment accumulation in some areas of the harbor or navigation channels can cause insufficient draft for ships. The operational requirements and natural conditions of different ports allow the dock types to be divided into three types: gravity, high pile, and sheet pile. Any structural damage to a berthing structure can be defined as a loss of its functions. The damage mechanisms of vertical-faced berthing structures are described in [1]. In gravity-type berthing structures, tilting or sliding-type damages may occur because of the loss of passive ground pressure on the seaward side of the structure due to scouring on the seabed.
Studies on scour caused by propeller jets have been traditionally conducted under two conditions: confined jet and unconfined jet. In recent years, several studies have been published that analyze the physics of propeller jet flows under unconfined conditions. Coscarella et al. (2023) [2] present a theoretical model for estimating the maximum equilibrium scour depth generated by propeller jets in aquatic environments with erodible sediment beds. Their analytical framework builds upon earlier theoretical contributions addressing scour-related problems and incorporates the phenomenological theory of turbulence proposed by [3,4]. In their work, a new model was developed and validated to derive a predictive formula for local scour, and the performance of the proposed equation was evaluated against available laboratory data. Ferraro and Penna (2022) [5] examined the influence of flow intensity on propeller jet-induced scour in ship maneuvering areas and navigation channels. Their experimental results and RANS simulations demonstrated that flow intensity plays a key role in scour development and, for the first time numerically, revealed the effects of a plane boundary on propeller jet characteristics. Curilli et al. (2023) [6] investigated the influence of water depth (h) on propeller-induced scouring and deposition, highlighting that depth variations significantly affect the morphology of both the scour hole and the deposition mound. Their study, based on experimental results and literature data, emphasized the need for detailed 3D analyses of the bed, including longitudinal, transversal, and contour profiles, to accurately assess these effects. They also reported that their findings are consistent with [7], who indicated that the influence of h on both the scour hole and the deposition mound becomes negligible when h/Dp exceeds 2.15. In the confined jet condition, the jet is restricted by a vertical wall or a pile, whereas in the unconfined jet condition, it corresponds to a free jet, which is not restricted by any solid structure. The problem of scour in front of vertical-faced berthing structures has been studied experimentally. Wei and Chiew [8] investigated the effect of confined propeller jet on seabed scour. They conducted their experiments in a 1.8 m wide, 4 m long, and 1 m deep water tank using two propellers with diameters (Dp) of 10 and 15 cm. An inclined surface with a slope of 1/1.5 was created in the downstream region of the propeller. A vertical wall was then placed at the toe of the sloping surface to be buried in the sand base, and the flow was restricted. The experiments were repeated for the toe clearances ranging from 2Dp to 9Dp. The scour profiles obtained using ADV were then compared with those proposed by [7] for unconfined propeller jets to elucidate the scour mechanism. Using a similar system, proposed by [8,9], they obtained velocity and turbulence data with the PIV technique to understand the scour caused by a confined propeller jet. They found that the jet flow in the region close to the propeller causes the formation of very large eddies that fill the bottom scour hole and drive the final scour profile, resulting in a maximum scour depth near the docking structure. When the distance between the berthing structure and the propeller position is about 4–5Dp, primary and toe scour holes are formed, respectively, because of the jet flow and vortices formed on the inclined berthing structure. If the distance between the docking structure and the propeller is significant, the effect of the docking structure slope on scour disappears and the propeller jet dominates the formation of the scour profile. Yüksel et al. [10] investigated the seabed scour in front of a vertical wall under the effect of a propeller jet by considering different wall clearances (horizontal distance between propeller axis and wall, Xw), propeller diameters, and rotational speeds. They proposed a relationship to predict the maximum scour depth under equilibrium conditions. Cui et al. [11] studied the scour problem caused by a twin-propeller jet near a vertical-faced wall and analyzed the effect of different propeller rotation directions (i.e., internal counter-rotation and external counter-rotation). The authors showed that maximum scour occurs at the propeller axis for externally counter-rotating twin propellers and at the center axis for internally counter-rotating twin propellers. Llull et al. [12] investigated the seabed scour caused by twin propeller jets near a vertical-faced docking structure, considering the influence of parameters such as the propeller height, the wall clearance, and the propeller efflux velocity. In these studies, cohesionless material was considered as the bed material for seabed scour. However, as noted by [13], the natural bed is not composed entirely of sand or clay, but usually a combination of the two in various proportions. To help develop predictive models, they studied the scour behavior of clay and sand mixed-bed materials under wave and flume flow conditions. For this purpose, they used a significant amount of data from field and laboratory investigations for both layered and homogeneous deposits. It was observed that the addition of relatively small amounts of kaolinite/montmorillonite clay significantly improved the resistance of sand to scour. As stated by [14], the behavior of the sand, silt, and clay mixture changes when the concentration of clay–silt material with a diameter of less than 62 μm is greater than about 30%. Here, the combination of sand, silt, and clay acts as a cohesive material if the percentage of clay is more than 5–10%, as cohesiveness predominates in the mixture. Cihan et al. [15] studied the seabed scour profiles generated by an unconfined propeller jet in sand/clay mixtures of different clay contents by weight (i.e., p = 0, 0.05, and 0.1) using different propeller efflux velocities, propeller diameters, and propeller heights. They observed that at low clay ratios or high propeller efflux velocities, the clay/sand mixture behaves as a non-cohesive material, whereas as the clay ratio increases, cohesion affects the development of scour.
As stated before, the scour around a vertical wall of a propeller jet was investigated on the cohesionless seabed [10,12,16]. However, the seabed of harbors may not consist solely of sand or clay but may also be a mixture of both materials. Van Rijn (2006) [17] mentioned that coastal sediments are usually mixtures of particles of various sizes, such as clay (<4 μm), silt (4–62.5 μm), and fine sand (62.5–500 μm). The erosion mechanism or the applicability of existing methods in the literature in such mixed-seabed conditions has not been extensively investigated so far.
In this study, experimental investigations were conducted to examine the scour problem generated by a propeller jet in front of a vertical-faced berthing structure on seabeds containing 0, 5%, and 10% clay by weight (p = 0, 0.05, and 0.1). The primary objective was to identify the critical clay content in sand–clay mixtures at which the influence of cohesion becomes dominant, leading to scour profiles that deviate from those observed in non-cohesive beds under varying propeller diameters, clearances, and rotational speeds. In this way, the validity limits of empirical formulas available in the literature for purely non-cohesive materials can be defined for mixtures with low clay content. A secondary aim of the study was to develop predictive models for estimating the maximum scour depth in weakly cohesive seabed conditions using nonlinear regression analysis and the M5P machine learning method. Since no previous research has examined the scour problem in front of a vertical wall for non-cohesive materials belonging to the fine sand class, the applicability of existing equations remains limited. Therefore, this study proposes a valid expression for predicting propeller-induced scour depth in fine sandy seabeds, offering practical guidance for engineers and practitioners.
Scour Mechanism in Front of a Wall
The presence of a quay structure typically causes local changes in the flow pattern, leading to an increase in both the average bed shear stress and turbulence [18]. As a result, a deeper scour is usually observed comparing the unconfined conditions. The extent of this effect depends on the type of ships and their relative positioning to the quay wall and propeller axis. This positioning can be perpendicular to the quay wall, parallel to the quay wall, or a combination of both, as seen with combined quay walls [19].
Wei et al. [20] investigated the scouring mechanism caused by propeller jet placed at four different wall clearances from a quay wall. They obtained streamlines that occurred in front of the wall for different propeller clearances at equilibrium conditions by using PIV. The mechanism of formation of the scour hole in front of the quay wall is related to the junction flow induced by flow separation [19]. This is analogous to pile scour in open-channel flows. However, while the mean flow velocity is constant in channel flows, the velocity of the propeller jet flow decreases over distance due to the fluid surrounding the flow. Wei and Chiew (2019) [21] stated that the varying wall clearances results in different mechanisms in the flow area. They defined that wall obstruction dominates the jet evolution with the small clearances (Xw = 2Dp), when jet diffusion dominates the wall obstruction with the higher clearances (Xw = 3Dp). Since the vertical quay walls cause the junction flow to develop due to the impact of propeller jet, the scour mechanism is driven by the interaction between the jet and junction flows. Wei et al. [20] reported that when the wall clearance is low, the well-established vortex governs the development of the scour hole, while with increasing wall clearance, the wall effect decreases, and the jet flow becomes dominant. According to the PIV results, a complex vortex system is observed at three different locations in front of the quay wall: one at the wall surface, another near the top of the wall, and the third near the bottom of the wall (at the toe of the wall) (see [20]). For times earlier than 0.5 h, under flat-bed conditions, the vortex at the wall surface dominates, while two smaller vortices form around it. At t = 0.5 h, when the scour hole begins to develop in front of the wall, the vortex at the wall toe starts to form and contributes to the expansion of the scour hole. As the scour hole deepens, this toe vortex continues to grow and becomes the dominant mechanism driving the scour process.
2. Experimental Setup
The experimental study was carried out in a 3.2 m × 1.5 m × 1 m experimental tank installed at Kırıkkale University (Figure 1). The seabed was simulated with a 0.3 m high sand/clay mixture placed on the bottom of the flume and water level was kept constant as 0.4 m above the seabed. The water level which is of similar orders of magnitude to those found in the literature [6,7,22,23] is chosen sufficiently deep to allow for proper propagation of the propeller jet. Polycarbonate sheet was coated with sediment particles used in the experiments to simulate the surface roughness of the berthing structure.

Figure 1.
The experimental setup (drawing not to scale).
Two brass propellers with diameters of 0.06 and 0.09 m were used to represent ship propellers. The vertical distance of the propeller axis to the base (y0) is 0.1 m. The propeller properties are given in Table 1.

Table 1.
The propeller properties.
In this study, temporal seabed profiles along the propeller axis were obtained using the Nortek Vectrino II Profiler (ADVP, manufactured by Nortek AS, Rud, Norway) during the experiments, which were terminated after equilibrium conditions were achieved. Here, there is no need to drain the water in the flume during the tests. The ADVP (Acoustic Doppler Velocity Profiler, manufactured by Nortek AS, Rud, Norway) was mounted on a traverse system that allowed it to move in three directions, enabling the collection of bed profiles over time until the bed erosion reached equilibrium. The bed level was measured along the propeller axis at 2 cm intervals, both before the experiments and at specific time intervals during the experiments until it reached equilibrium conditions. Equilibrium was defined by [7] as the point when the dimensions of the scour hole remained constant.
In the present study, it is considered that the equilibrium conditions are reached when the ΔSmax value decreases to ±2 mm in seabed profiles. ΔSmax defines the differences between Smax in successive time intervals (ΔSmax = Smaxti+1 − Smaxti). In the experiments, bed measurements were taken by stopping the propeller at 5, 15, 30, 45, and 60 min within the first hour. Afterwards, bed level measurements were continued at two-hour intervals until the scour profiles reached equilibrium. It was found that the seabed profiles reached equilibrium conditions in different time periods ranging from 9 to 11 h.
An important parameter used in studies on propeller jet flow is the efflux velocity (U0) as defined by [24]. Cihan et al. [15] reported that the efflux velocities of the propellers used in this study are consistent with Equation (1) proposed by [25].
where n, Dp and CT represent the propeller frequency, propeller diameter and propeller thrust coefficient, respectively.
In the experiments, quartz sand with a diameter of 0.24 mm (d50) and a density of 2650 kg/m3 was considered cohesionless sediment. The geometric standard deviation (σg) of the sand used here was determined as 1.50. The sand can be classified as medium-sorted when (σg) is between 1.41–1.61 [26].
The clay fraction was determined to be 39.3%, silt 57.7%, and fine sand 3%. The clay type mixed with sand to prepare the mixture is kaolin clay, with a d50 value of 0.0042 mm, a water content of 30.1, and a density of 2770 kg/m3.
2.1. Preparing Clay/Sand Mixture
Three different clay contents were used in our study: 0, 0.05, and 0.1 by weight. The definition of clay content here is taken as the ratio of clay weight to mixture weight (Wc/Wm). The preparation of the clay/sand mixture used in the experiments included the following steps: (i) first, the required amount of dry materials should be mixed in a container, (ii) some water should be added to the mixture to facilitate the mixing process, (iii) mixing process is continued until a homogeneous mixture is obtained, i.e., care should be taken to ensure that there are no lumps in the mixture. To prepare the seabed, 10 kg of clay/sand mixture was prepared each time. The homogenous mixture was then placed on the bottom of the tank to form the seabed.
Beside this, the moisture content was determined by oven-drying the clay specimens at 105 °C for at least 24 h. In their study, Kırca et al. (2014) [27] used clay with a water content of 38%. Kothyari and Jain (2008) [28] investigated the effect of different proportions of sand, clay, and gravel mixtures on scour formation over the channel bed. In their experiments, various water contents were used, with the clay water content ranging between 8.92% and 25.92%. Zhang et al. (2020) [29] examined wave-induced liquefaction on a seabed composed of varying sand–clay mixtures. The water contents used in their study ranged from 29.5% to 30.1%. The water content used in the present study is consistent with those reported in the literature.
2.2. Experimental Procedures
The procedure that is followed during the experiments is summarized below.
- Preparation of clay/sand mixture.
- Filling the tank with the mixture.
- The prepared clay/sand mixture is carefully poured into the tank.
- Settling the sediment.
Each set of sediment samples is left to settle in the tank for 15 h after preparation.
- 5.
- Filling the tank with water.
The tank is filled with water to the required level. The sand-clay mixture was placed in the box and submerged in water for about 3 h to achieve water saturation, as recommended by Dey et al. (2011) [30].
- 6.
- Measuring Reference Elevations.
Reference elevations of the seabed are measured along the propeller axis and at a line in front of the vertical wall using an ADVP.
- 7.
- Running the Propeller.
The propeller is activated to simulate jet flow conditions.
- 8.
- Measuring Scour Depths.
Seabed elevations are measured at specific time intervals using ADVP. The propeller is stopped at every time interval before the bed profile measurement. When the measurement is finished, the propeller is restarted to continue the experiment.
2.3. Experimental Conditions
The experimental conditions are obtained by considering the boundary conditions of the experimental setup. Various configurations were tested to avoid flow recirculation within the tank due to these boundary effects, and appropriate conditions that do not influence the experimental results were determined. Moreover, similar propeller diameters and RPM values have been employed in previous studies as well. The distances between the propeller and the vertical wall were also chosen in accordance with the literature. The distance between the propeller and the wall increases, the influence of the wall diminishes, and the behavior of an unconfined propeller jet becomes dominant. Therefore, the distance between the propeller and the wall is limited according to [10,16]. The different conditions set for the experimental setup prepared in this study are given in Table 2.
Table 2.
Experimental Conditions.
2.4. M5P Model Tree
Quinlan [31] developed the M5 algorithm, which was later expanded to the M5P algorithm. The M5P tree is a type of machine learning technique that uses regression and data classification to predict numerical results. Choi et al. [32], Behnood et al. [33], Sihag et al. [34] also employed the M5P tree model in their studies. In this study, the Weka software (2005) developed at the University of Waikato in New Zealand, was used to create the M5P tree model. The software includes comprehensive modeling and data preparation techniques [35]. Each leaf contains a linear regression model that predicts the desired result [32]. It was developed primarily as a top-down approach [36]. Before creating the M5 tree, the appropriate classification criteria for dividing the data must be established first. The branching criteria are divided based on different measures of attribute values. The root of the tree is determined by the property that minimizes the expected error. Equation (4) is used to determine the standard deviation reduction (SDR) [35].
in which
T is the set of data records arriving at the node;
Ti is the set of results from splitting the node based on a certain attribute;
is rhe average value of the sets of the T attribute;
sd(T) is the standard deviation of T.
3. Results and Discussion
3.1. Comparison of Scour Profiles for p = 0, 0.05 and 0.1 Clay Contents
The scour profiles obtained for p = 0, 0.05 and 0.1 clay contents are shown in Figure 2, Figure 3 and Figure 4 for comparison. The tests were carried out for y0/Dp = 1.67 at rotation speeds of 500, 750 and 1000 rpm using wall clearances of 2, 4, 6 and 8Dp. The influence of clay content on the scour profile is evident in the 500 rpm case (Figure 2) [37]. The maximum scour depth was observed in the absence of clay, whereas the minimum depth was recorded at a clay content of p = 0.1. At a clay content of p = 0.05, the steepest slopes were obtained at wall clearances of 2Dp and 4Dp, yielding slope angles of 35.94° and 38.66°, respectively [37]. In contrast, for p = 0, the steepest slopes occurred at 6Dp and 8Dp wall clearances, with slope angles of 28.31° and 27.65°, respectively [37].
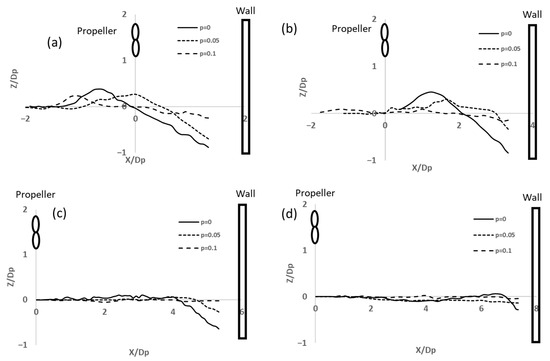
Figure 2.
The scour profiles at 500 rpm rotational speed for (a) Xw = 2Dp [18]. (b) Xw = 4Dp, (c) Xw = 6Dp, (d) Xw = 8Dp (Adapted from [38]).

Figure 3.
The scour profiles at 750 rpm rotational speed for (a) Xw = 2Dp, (b) Xw = 4Dp, (c) Xw = 6Dp, (d) Xw = 8Dp.
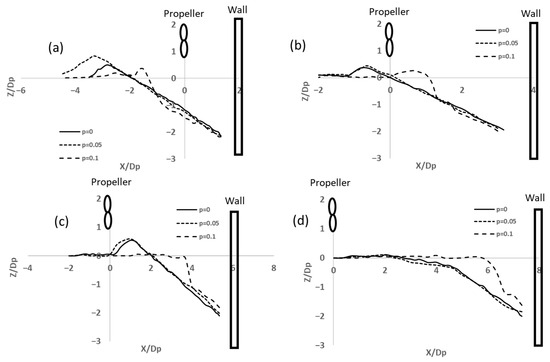
Figure 4.
The scour profiles at 1000 rpm rotational speed for (a) Xw = 2Dp, (b) Xw = 4Dp, (c) Xw = 6Dp, (d) Xw = 8Dp.
As shown in Figure 3, a comparison of the scour profiles obtained for p = 0 and 0.05 shows that the effect of clay on the scour profiles disappears at 750 rpm. In fact, the scour slopes for p = 0 and 0.05 clay contents are very similar. An increase in clay content seems to have a significant impact on the overall shape of the scour profile.
Figure 4 shows different scour behavior for 1000 rpm. Here, it is noticed that the variation in scour profiles for 0% and 0.05 clay contents is almost the same for 750 rpm. In fact, the scour depths are of the same order regardless of the wall clearance. However, no deposition zone is formed on the seabed with different clay content for 8Dp. On the other hand, as the clay content increases to 0.1, significant changes in the scour profiles are observed. Although there is a similarity between the maximum scour values here and those with 0 and 0.05 clay content, the slopes are steeper due to increased cohesion.
Mitchhener and Torfs (1996) [13] note that both adding sand to cohesive material and adding cohesive material to sand increase the critical shear stress of the bed material. For example, when 50% sand (by weight) is added to the cohesive material, the critical shear stress increases up to 2 times, while when 30% cohesive material is added to the sand, the critical shear stress increases up to 10 times.
Figure 5a shows the variation of Smax/Dp with respect to Xw/Dp due to different F0 values and clay contents (p = 0 and 0.05) for y0/Dp = 1.11. Here, the cohesion effect on the maximum scour depth is more pronounced at low F0 (6.79) values, especially for Xw/Dp > 4. At relatively high F0 values (11.32 or higher), the mixture containing clay behaves almost like sand, which was not reported in previous studies.
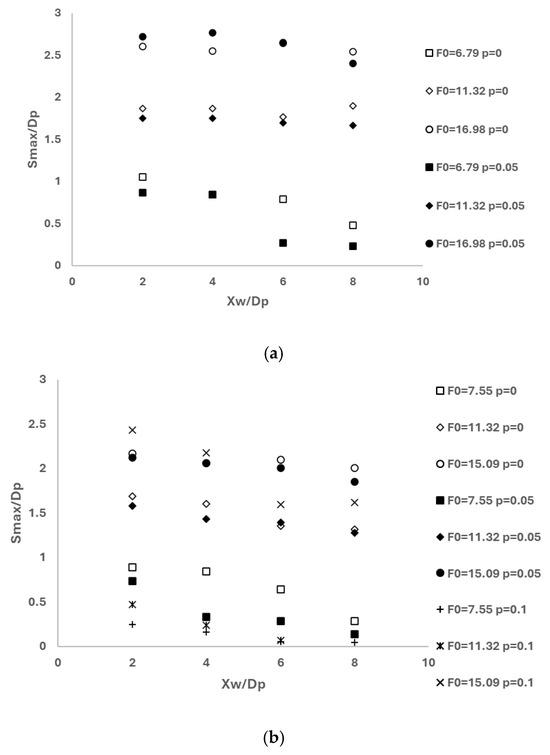
Figure 5.
The variation of Smax/Dp with respect to Xw/Dp due to different F0 values and clay contents, (a) y0/Dp = 1.11, (b) y0/Dp = 1.67.
The variation of Smax/Dp with respect to Xw/Dp due to different F0 values and clay contents (i.e., p = 0, 5 and 0.1) is shown in Figure 5b for y0/Dp = 1.67. In fact, the effect of Xw, clay content and F0 on Smax are considered here together. Figure 5b shows that for a given clay content, Smax decreases with increasing Xw. However, for a given value of Xw/Dp at a constant clay content, Smax increases with increasing F0. It is seen that the values of Smax at 0% and 0.05 clay contents are generally very close to each other for all F0 values. Here, with increasing F0, (11.32 or higher) the mixture containing 0.05 clay behaves almost like sand. Mitchener and Torfs [13] stated that when the clay content is below 3%, scouring occurs in a cohesionless manner, with fine material being washed away. The sediment transport of the bed material primarily happens through bedload movement, leading to the formation of ripples on the bed surface. Cihan et al. [15] studied the impact of an unconfined propeller jet on a weakly cohesive seabed and found that when the clay content is up to 0.05, the seabed behaves as though it is cohesionless. They also noted that the scouring process begins with the washing away of clay particles. On the other hand, it is noticeable that Smax decreases very rapidly with increasing clay content (i.e., p = 0.1) in all F0 cases, especially for Xw/Dp > 4. This decrease is due to: (i) decreasing effect with distance and (ii) the increase in critical shear stress due to increased clay content as noted by [13].
Figure 6 depicts the variation of Smax/Dp for different F0 values for selected y0/Dp and clay contents (i.e., 0, 0.05 and 0.1) when (a) Xw/Dp = 2, (b) Xw/Dp = 4, (c) Xw/Dp = 6, and (d) Xw/Dp = 8. Here, it is seen that as F0 increases, the maximum scour depth tends to increase in all cases. The effect of cohesion on Smax is much more pronounced for low F0 values, especially when Xw/Dp < 8 (panels a, b and c). Also, the effect of the propeller height on Smax should be noted. Here it is easily noticeable for all cases that as the propeller height increases, there is a relative decrease in the maximum scour depth. When F0 is 7.55, the deepest scour occurs at p = 0 (indicating no cohesion), while the shallowest scour occurs at p = 0.1 In contrast, when F0 is 11.32 and y0/Dp is 1.67, the scour profiles and Smax/Dp for p = 0 and p = 0.05 are nearly identical. This suggests that the effect of cohesion is minimal at higher F0 values. At F0 = 6.79 and y0/Dp = 1.11, the greatest scour depth again occurs at p = 0, while the smallest scour depth is observed at p = 0.1.
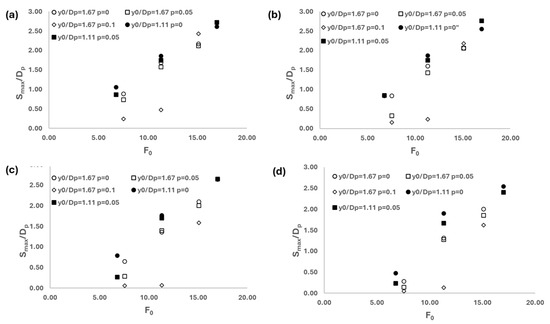
Figure 6.
The variation of Smax/Dp with respect to different F0 values for selected y0/Dp and clay contents when (a) Xw/Dp = 2, (b) Xw/Dp = 4, (c) Xw/Dp = 6 and (d) Xw/Dp = 8.
3.2. Prediction of Scour Depth in Front of a Vertical Wall
Nonlinear regression analysis and M5P tree models were applied in order to estimate an equation for the scour depth in front of a vertical wall. For this purpose, first, the test results obtained for p = 0 and 0.05 clay content were taken into consideration. Subsequently, the test results obtained for p = 0, 5 and 0.1 clay content were used to estimate Smax/Dp values. In this study, Smax/Dp, F0, y0/Dp, p and Xw/Dp were used as dimensionless variables. In fact, they have been identified by some researchers as effective variables on the scour mechanism (e.g., [10,15]). Here, Smax/Dp is taken as the output variable while the rest are treated as input variables. Thus, the dimensionless scour relationship obtained by nonlinear regression analysis for the seabed with p = 0 and 0.05 clay contents are given in Equation (6).
In this study, 10-fold-cross-validation values were used in the M5P tree model. Then, the dimensionless scour relationships given in Equations (7) and (8) were obtained for the seabed with p = 0 and 0.05 clay contents.
The measured and the predicted Smax/Dp values derived from the nonlinear regression and the M5P tree models for p = 0 and 0.05 clay contents were compared in Figure 7. As seen here, M5P tree models produce relatively better estimates than the nonlinear regression model, especially for Smax/Dp values smaller than 2. However, a scatter distribution is observed for Smax/Dp values higher than 2. The statistics used for model performance evaluation were presented in Table 3, where both models seemed to produce relatively close R2 and RMSE statistics.
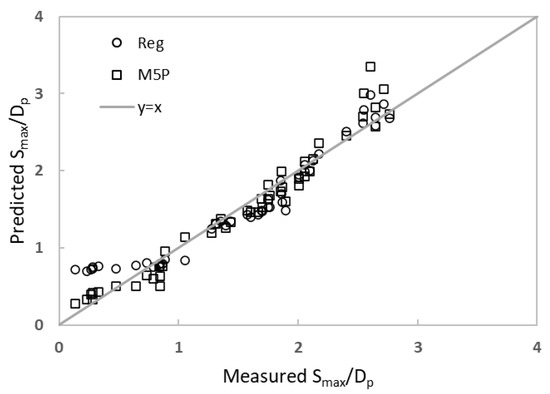
Figure 7.
The predicted and measured values of Smax/Dp obtained from the nonlinear regression and M5P tree models for p = 0 and 0.05 clay contents.
Table 3.
The selected model statistics for the seabed with p = 0 and 0.05 clay contents.
In this section, the scour depth was estimated with both models for p = 0, 0.05 and 0.1 clay contents. The dimensionless scour relationship obtained by nonlinear regression analysis is given in Equation (9).
Equations (10)–(14) show the dimensionless scour relationships created using the M5P tree model for the seabed with p = 0, 5 and 0.1 clay contents.
The measured and the predicted Smax/Dp values were both displayed in Figure 8. It seems that the fit between predictions and measurements is generally not very good for both models. The M5P tree model seems to perform better for Smax/Dp values less than one but produces mostly poor predictions for larger values. The nonlinear regression model has relatively better statistics than the M5P tree model (Table 4).
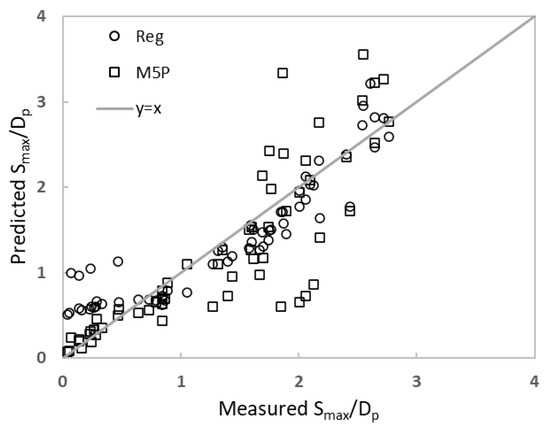
Figure 8.
The predicted and measured values of Smax/Dp obtained from the nonlinear regression and M5P tree models for p = 0, 5 and 0.1 clay contents.
Table 4.
Selected model statistics for the seabed with p = 0, 5 and 0.1 clay contents.
According to Figure 7 and Figure 8, the agreement between the predicted and measured Smax/Dp values decreases with increasing clay content, which is more evident for the M5P model outputs. Also, the number of rules increases in the M5P tree model. This can be explained by the fact that as the clay content increases, the cohesion effect on scour becomes more pronounced, and the bed material begins to behave like a cohesive bed.
The prediction methods presented in this study are valid within the experimental ranges of y0/Dp = 1.11–1.67, F0 = 6.79–16.98, and Xw/Dp = 2–8Dp.
The M5P algorithm combines decision tree structures with linear regression models, enabling both data segmentation and localized linear modeling. This hybrid structure enhances the interpretability of the model outputs, which is particularly advantageous when the underlying physical phenomena exhibit regime-dependent behavior.
By partitioning the dataset and fitting distinct regression equations within each segment, M5P provides a robust framework for modeling nonlinear and complex systems. In addition, the method is computationally efficient, allowing for fast model training and prediction even with large datasets.
However, the model appears to be sensitive to data points near segment boundaries, potentially limiting its generalization performance. Moreover, when applied to highly variable datasets, the resulting tree structure may become excessively complex, thereby increasing the risk of overfitting.
In Figure 9, the results of our study and the above three separate studies (see Table 5) are presented together for comparison. The previous equations are all limited by experimental conditions. Therefore, some differences between the measured and predicted results using the proposed equations should be expected. The RMSE values between measured and predicted results are given as 0.7, 0.73, and 0.61 by [10,16,38], respectively. Therefore, according to the RMSE values, it is seen that the results of the equation proposed by [10] provide the best agreement with the results obtained in our study (for p = 0). It should be noted that the d50 values used in these studies are coarser than the value considered in our study. Hamill et al. (1999) [16] used sand material with a d50 value ranging from 0.76 to 3 mm in their experiments, while [10] preferred sand with a d50 value of 0.52 mm. The results presented in this study contribute to the literature as they include finer sand (d50 = 0.24 mm) results compared to previous studies.
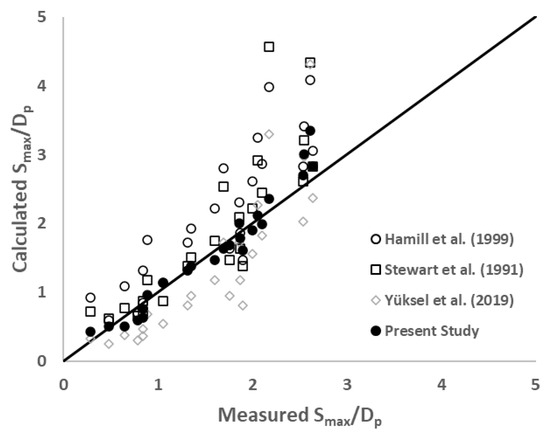
Figure 9.
Comparison of measured scour depths with predicted ones by [10,16,38] and the present study.
Table 5.
Proposed methods in literature to predict maximum scour depths in front of wall.
4. Conclusions
The study has shown that the effect of propeller jet–wall interaction on scour is significant at low jet velocities, whereas it becomes weak at higher velocities. This can be explained by the sensitivity of the jet flow structure to the wall at low velocities, while at high velocities, the momentum of the flow becomes dominant.
The results indicate that, above a critical Froude number (F0 ≈ 11.3), the influence of wall clearance disappears. This threshold reflects that the jet momentum is sufficient to continuously mobilize sediment particles, making the flow regime independent of wall clearance.
The effect of cohesion limits scour at low F0 values; however, as F0 increases, this effect diminishes, and the sediment mixture begins to behave similarly to cohesionless sand. This suggests that cohesion is effective only up to a certain energy level, while at higher jet velocities, the bonds between sand particles are broken.
Seabeds with 5% clay content behave similarly to cohesionless materials, whereas for seabeds with 10% clay content, scour profiles differ, maximum scour depths decrease, and slopes become steeper. This indicates that cohesion alters the scour mechanism once a critical threshold is exceeded. Although Mitchener and Torfs (1996) [13] characterized weakly cohesive mixtures as sediments containing less than 3% clay, there is currently no universally accepted definition for this classification in literature. Similarly, Van Rijn (2007) [14] proposed a threshold of 5% for the combined content of clay and silt. Nevertheless, it should be emphasized that both studies were conducted under general sediment transport conditions and do not specifically account for the unique characteristics of propeller jet flows. Due to the high turbulence intensity and the complex, three-dimensional nature of flow structures generated by propeller jets, the behavior of weakly cohesive mixtures may deviate from that observed under conventional flow conditions.
The results also show that current predictive models provide acceptable estimates for low-cohesion seabeds; however, their accuracy decreases as the clay content increases. This highlights the need to consider the effect of cohesion more carefully in model development.
Overall, the findings reveal a transition from cohesive to cohesionless behavior of the seabed depending on propeller jet velocity. Further experimental studies at higher clay contents and varying conditions are necessary to clarify this transition mechanism and to extend the validity range of the proposed equations.
Author Contributions
Conceptualization, K.C. and A.Y.O.; Validation, K.C.; Investigation, K.C., A.Y.O. and A.D.; Writing—original draft, K.C., A.Y.O. and O.Y.; Writing—review & editing, K.C., A.Y.O. and O.Y.; Visualization, K.C. All authors have read and agreed to the published version of the manuscript.
Funding
This study was supported by Scientific and Technological Research Council of Turkey (TUBITAK) under the Grant Number 218M428. The authors thank TUBITAK for their support.
Data Availability Statement
The original contributions presented in this study are included in the article. Further inquiries can be directed to the corresponding author(s).
Conflicts of Interest
The authors declare no conflict of interest.
References
- The world association for waterborne transport infrastructure. In Guidelines for Protecting Berthing Structures from Scour Caused by Ships; Report No.180; P.I.A.N.C.: Brussels, Belgium, 2015.
- Coscarella, F.; Curulli, G.; Penna, N.; Gaudio, R. Physically based formula for the maximum scour depth induced by a propeller jet. Phys. Fluids 2023, 35, 035113. [Google Scholar] [CrossRef]
- Gioia, G.; Bombardelli, F. Scaling and similarity in rough channel flows. Phys. Rev. Lett. 2001, 88, 014501. [Google Scholar] [CrossRef]
- Gioia, G.; Chakraborty, P. Turbulent friction in rough pipes and the energy spectrum of the phenomenological theory. Phys. Rev. Lett. 2006, 96, 044502. [Google Scholar] [CrossRef] [PubMed]
- Ferraro, D.; Lauria, A.; Penna, N.; Gaudio, R. Unconfined propeller scour in waterways: The role of flow intensity. Phys. Fluids 2022, 34, 095137. [Google Scholar] [CrossRef]
- Curulli, G.; Penna, N.; Gaudio, R. Improved formulation for the geometric characteristics of the scour hole and of the deposition mound caused by a rotating propeller jet on a mobile bed. Ocean Eng. 2023, 267, 113175. [Google Scholar] [CrossRef]
- Hong, J.H.; Chiew, Y.M.; Cheng, N.S. Scour caused by a propeller jet. J. Hydraul. Eng. 2013, 139, 1003–1012. [Google Scholar] [CrossRef]
- Wei, M.; Chiew, Y.M. Influence of toe clearance on propeller scour around an open-type quay. J. Hydraul. Eng. 2017, 143, 04017012. [Google Scholar] [CrossRef]
- Wei, M.; Chiew, Y.M. Characteristics of propeller jet flow within developing scour holes around an open quay. J. Hydraul. Eng. 2018, 144, 04018040. [Google Scholar] [CrossRef]
- Yuksel, Y.; Tan, R.I.; Çelikoglu, Y. Determining propeller scour near a quay wall. Ocean Eng. 2019, 188, 106331. [Google Scholar] [CrossRef]
- Cui, Y.; Lam, W.; Robinson, D.; Hamill, G. Temporal and spatial scour caused by external and internal counter-rotating twin-propellers using Acoustic Doppler Velocimetry. Appl. Ocean Res. 2020, 97, 102093. [Google Scholar] [CrossRef]
- Llull, T.; Mujal-Colilles, A.; Gironella, X. Twin propeller time-dependent scouring processes. Physical experiments. Ocean Eng. 2021, 236, 109461. [Google Scholar] [CrossRef]
- Mitchener, H.; Torfs, H. Erosion of Mud/Sand Mixtures. Coast. Eng. 1996, 29, 1–25. [Google Scholar] [CrossRef]
- van Rijn, L.C. Unified View of Sediment Transport by Currents and Waves. I: Initiation of Motion, Bed Roughness, and Bed-Load Transport. J. Hydraul. Eng. 2007, 133, 649–667. [Google Scholar] [CrossRef]
- Cihan, K.; Doğu, A.; Yılmaz, D.; Yüksel, A.O.; Yıldız, O.; Şahin, C. Unconfined propeller jet scour on clay/sand mixtures. Ocean Eng. 2022, 264, 112448. [Google Scholar] [CrossRef]
- Hamill, G.A.; Johnston, H.T.; Stewart, D.P. Propeller wash scour near quay walls. J. Waterw. Port Coast. Ocean Eng. 1999, 125, 170–175. [Google Scholar] [CrossRef]
- van Rijn, L.C. Principles of Sediment Transport in Rivers, Estuaries and Coastal Seas; Aqua Publications: Amsterdam, The Netherlands, 2006; Volume 1006. [Google Scholar]
- Sumer, B.M.; Fredsøe, J. The Mechanics of Scour in the Marine Environment; World Scientific: River Edge, NJ, USA, 2002. [Google Scholar]
- Wei, M.; Cheng, N.-S.; Chiew, Y.-M.; Cheng, N.-S. Recent advances in understanding propeller jet flow and its impact on scour. Phys. Fluids 2020, 32, 101303. [Google Scholar] [CrossRef]
- Wei, M.; Cheng, N.-S.; Chiew, Y.-M.; Yang, F. Vortex Evolution within Propeller Induced Scour Hole around a Vertical Quay Wall. Water 2019, 11, 1538. [Google Scholar] [CrossRef]
- Wei, M.; Chiew, Y.-M. Impingement of propeller jet on a vertical quay wall. Ocean Eng. 2019, 183, 73. [Google Scholar] [CrossRef]
- Tan, R.I.; Yuksel, Y. Seabed scour induced by a propeller jet. Ocean Eng. 2018, 160, 132–142. [Google Scholar] [CrossRef]
- Penna, N.; D’Alessandro, F.; Gaudio, R.; Tomasicchio, G.R. Three-dimensional analysis of local scouring induced by a rotating ship propeller. Ocean Eng. 2019, 188, 106294. [Google Scholar] [CrossRef]
- Ryan, D. Methods for Determining Propeller Wash Induced Scour in Harbours. Ph. D. Thesis, The Queen’s University of Belfast, Belfast, UK, 2002. [Google Scholar]
- Fuehrer, M.; Römisch, K. Effects of Modern Ship Traffic on Inland and Ocean Waterways. In Proceedings of the 24th International Navigation Congress, Leningrad, Russia; 1977; pp. 236–244. [Google Scholar]
- HEC-RAS 2D Sediment Technical Reference Manual; Hydrologic Engineering Center: Davis, CA, USA, 2023.
- Kirca, V.S.O.; Sumer, B.M.; Fredsoe, J. Influence of clay content on wave-induced liquefaction. J. Waterw. Port Coast. Ocean Eng. 2014, 140, 04014024. [Google Scholar] [CrossRef]
- Kothyari, U.C.; Jain, R.K. Influence of Cohesion on Incipient Motion Condition of Sediment Mixtures. Water Resour. Res. 2008, 44, 1–15. [Google Scholar] [CrossRef]
- Zhang, J.; Jiang, Q.; Jeng, D.; Zhang, C.; Chen, X.; Wang, L. Experimental Study on Mechanism of Wave-Induced Liquefaction of Sand-Clay Seabed. J. Mar. Sci. Eng. 2020, 8, 66. [Google Scholar] [CrossRef]
- Dey, S.; Helkjaer, A.; Sumer, B.M.; Fredsoe, J. Scour at Vertical Piles in Sand-Clay Mixture under Waves. J. Waterw. Port Coast. Ocean Eng. 2011, 137, 6. [Google Scholar] [CrossRef]
- Quinlan, J.R. Learning with continuous classes. In Proceedings of the Australian Joint Conference on Artificial Intelligence, Hobart, Australia, 16–18 November 1992; World Scientific: Singapore, 1992; pp. 343–348. [Google Scholar]
- Choi, Y.; Lee, Y.; Shin, K.; Park, Y.; Lee, S. Analysis of long-term performance of full-scale reverse osmosis desalination plant using artificial neural network and tree model. Environ. Eng. Res. 2020, 25, 763–770. [Google Scholar] [CrossRef]
- Behnood, A.; Behnood, V.; Gharehveran, M.M.; Alyamac, K.E. Prediction of the compressive strength of normal and high-performance concretes using M5P model tree algorithm. Constr. Build. Mater. 2017, 142, 199–207. [Google Scholar] [CrossRef]
- Sihag, P.; Karimi, S.M.; Angelaki, A. Random Forest, M5P and regression analysis to estimate the field unsaturated hydraulic conductivity. Appl. Water Sci. 2019, 9, 129. [Google Scholar] [CrossRef]
- Witten, H.I.; Frank, E.; Hall, M.A. Data Mining, Principal Machine Learning Tools and Techniques; Elsevier: Burlington, MA, USA, 2011. [Google Scholar]
- Wang, Y.; Witten, H.I. Inducing model trees for continuous classes. In Proceedings of the 9th European Conference on Machine Learning, Prague, Czech Republic, 23–25 April 1997. [Google Scholar]
- Cihan, K.; Yüksel, A.O.; Yıldız, O.; Doğu, A. Effect of different clay contents on propeller jet scour occurring near vertical-faced berthing structures. In Proceedings of the 10th Coastal Engineering Symposium, İzmir, Turkey, 16–17 November 2023; pp. 154–161. (In Turkish). [Google Scholar]
- Stewart, D.P.J.; Hamill, G.A.; Johnston, H.T. Velocities in a ship’s propeller wash. In Proceedings of the International Symposium on Environmental Hydraulics, Hong Kong, 16–18 December 1991; A.A. Balkema: Rotterdam, The Netherlands, 1991. [Google Scholar]
Disclaimer/Publisher’s Note: The statements, opinions and data contained in all publications are solely those of the individual author(s) and contributor(s) and not of MDPI and/or the editor(s). MDPI and/or the editor(s) disclaim responsibility for any injury to people or property resulting from any ideas, methods, instructions or products referred to in the content. |
© 2025 by the authors. Licensee MDPI, Basel, Switzerland. This article is an open access article distributed under the terms and conditions of the Creative Commons Attribution (CC BY) license (https://creativecommons.org/licenses/by/4.0/).