Article

The Impact of Canal Construction on the Hydro-Morphodynamic Processes in Coastal Tidal Channels

1
Transport Planning and Research Institute, Ministry of Transport, Beijing 100028, China
2
State Key Laboratory of Maritime Technology and Safety, Wuhan University of Technology, Wuhan 430063, China
3
School of Transportation and Logistics Engineering, Wuhan University of Technology, Wuhan 430063, China
4
Tianjin Research Institute for Water Transport Engineering, Ministry of Transport, Tianjin 300405, China
*
Author to whom correspondence should be addressed.
J. Mar. Sci. Eng. 2025, 13(11), 2048; https://doi.org/10.3390/jmse13112048 (registering DOI)
Submission received: 22 September 2025 / Revised: 17 October 2025 / Accepted: 22 October 2025 / Published: 26 October 2025
(This article belongs to the Section Ocean Engineering)

Abstract

Canals have played a significant role in promoting the prosperity of the shipping industry worldwide. Meanwhile, canal construction can alter the hydro-morphodynamic processes in coastal tidal channels. The Fangchenggang Canal is an extension route of the Pinglu Canal, which connects southwestern regions to the Beibu Gulf in the South China Sea by cutting across approximately 20 km of intertidal and dry land of the Qisha peninsula. A two-dimensional numerical model based on MIKE21 has been established to investigate the variations of tidal current structures and sediment transport characteristics. The maximum flow velocity within the main channel increases up to 1.18 m/s in the marine section. A bidirectional flow pattern has been observed in the land excavation segment. Numerical simulations of the sedimentation processes demonstrated potential erosion in the land excavation section due to the increased bed shear stress. The present study shares useful insights into the response mechanism of hydro-morphodynamic processes under canal construction. The quantitative simulations would support the environmental assessment and route planning of canal projects.

1. Introduction

With the accelerated development of global shipping networks, canals have played an increasingly vital role as hubs linking inland waterways and coastal ports. Representative examples such as the Panama Canal and Suez Canal have not only optimized global supply chains and multimodal transport systems but also significantly promoted the regional economic development [1,2]. However, canal projects often traverse sensitive estuarine and coastal transition zones. Their construction and operational processes could exert a profound impact on tidal dynamics and sedimentary processes. A quantitative evaluation of this impact would facilitate the formulation of waterway maintenance and maritime safety management strategies.
Recently, multidisciplinary approaches integrating hydrodynamic modeling, remote sensing, and long-term observational data have been increasingly applied to investigate these impacts [3,4]. Process-based numerical models (e.g., Delft3D and MIKE) are commonly introduced to simulate tidal propagations, flow divergence, and sediment erosion/deposition under different canal engineering scenarios. For example, Wang et al. [5] developed a three-dimensional hydrodynamic and water quality model using MIKE3 and evaluated the impact of comprehensive engineering projects on the hydrodynamics of the Maowei Sea region in China. Siemes et al. [6] employed Delft3D-FM to establish a morphodynamical model, which captured the microtidal and wave variations in a highly engineered estuary. These methods facilitate quantitative analysis of the spatial extent and temporal evolution of impacts caused by engineering activities. Existing studies demonstrated that coastal activities (e.g., canal projects) may alter the tidal systems through various mechanisms, such as interruption of alongshore currents, disruption of sediment transport chains, break dynamic balance of sediment scouring and sedimentation [7]. The expansion of the Suez Canal has resulted in increased local tidal range and enhanced seasonal sea level fluctuations [8], while the long-term operation of the Panama Canal has significantly modified the tidal dynamics in adjacent marine areas [9]. In estuarine regions, canal construction can directly change flow field and disrupt the spatiotemporal characteristics of tidal propagation, thus triggering responses in sedimentary processes [10]. Moreover, canalization may lead to salinity imbalances, reduced bed stability and even elevated risks of biological invasions [11,12,13].
From the perspective of dynamic mechanisms, variations in channel geometry and boundary conditions can lead to hydrodynamic restructuring, tidal amplification, and redistribution of energy dissipation [14,15]. Martín-Llanes et al. [16] reported that tidal energy amplification caused by channel deepening is closely associated with project length. The pressure gradients and bed shear stress are identified as major drivers of flow restructuring. Huang et al. [17] emphasized that tidal redistribution and the formation of recirculation zones can be key triggers of ecological changes and sediment deposition. Additionally, studies have revealed the existence of complex coupling and time-lag effects between hydrodynamic variations and suspended sediment concentration in estuaries [18,19]. Although many studies have addressed the hydrodynamic disturbances caused by estuarine projects or embankment construction, there is still a research gap regarding quantitative analysis on the hydro-morphodynamic processes caused by canal construction in coastal tidal channels. Moreover, quantitative analyses of the hydro-morphodynamic processes caused by the construction of a canal through a complex land–sea transition zone with diurnal tides and bidirectional flow are still limited. This study addresses this gap by using a high-resolution, validated numerical model to examine the response mechanisms caused by canal construction.
The Pinglu Canal, which connects southwestern regions to the Beibu Gulf in the South China Sea, would play an important role in revolutionizing regional trade and connectivity. The Fangchenggang Canal is an extension route of Pinglu Canal that cuts across approximately 20 km of intertidal and dry land of the Qisha peninsula. It aims to promote the regional logistics and transportation system. Following the comparative study on route selection conducted by Feng et al. [20], an optimal route (i.e., Route 4) is eventually recommended, considering traffic conditions, ecological impacts, hydrodynamic characteristics, etc. In the present study, a two-dimensional hydro-morphodynamic model based on MIKE21 is proposed. The tidal response, hydrodynamic conditions and sediment transport processes resulting from the canal construction are thus systematically investigated. The remainder of the study is structured as follows: a brief introduction to the research material and methods is provided in Section 2. Detailed results of hydro-morphodynamic processes are demonstrated in Section 3, followed by comprehensive discussions in Section 4. The final conclusions are presented in Section 5.

2. Material and Methods

2.1. Description of the Research Domain

The study area is located in the southwestern part of Fangchenggang City, Guangxi Zhuang Autonomous Region, China. It is characterized by a typical diurnal tidal regime, with a large tidal range and strong tidal currents, influenced jointly by astronomical tides, wind waves and river runoff. The construction of the Fangchenggang canal involves excavating a waterway based on the ancient Huangchengao Canal, with a total length of approximately 20 km. It is designed as a 5000-ton navigable channel, with a bottom width ranging from 80 m to 140 m and a bottom elevation of −8.32 m. The canal construction area is divided into a land excavation section and a marine excavation section. The land part mainly passes through hilly terrain, while the marine part crosses the coastal tidal flats (as shown in Figure 1). The canal passes through a typical land–sea transition zone, featuring coastal landforms and active sediment dynamics.
The tidal level data were obtained from Fangchenggang Station (November 2020, 7 days) and Qinzhou Bay Station (August 2021, 15 days), providing the basis for model validation. The tidal current and suspended sediment data were collected simultaneously at Fangchenggang and Qinzhou Bay stations during spring and neap tides for both flood and dry seasons of 2020 and 2021. Sampling was conducted at 30 min intervals using an Acoustic Doppler Current Profiler (ADCP) for vertical measurements with either three layers (three-point method) or six layers (six-point method). According to the tidal data, diurnal tidal characteristics are observed in Qinzhou Bay and Fangchenggang East Bay. A pronounced diurnal inequality is observed with approximately 19–25 days per month experiencing a single flood and ebb cycle per day. The duration of the flood tide generally exceeds that of the ebb tide, whereas the ebb current exhibits higher velocities than the flood current. During the remaining days, a semidiurnal pattern occurs, featuring two flood and two ebb tides per day, with similar durations and comparable flow velocities for both flood and ebb phases. In Fangchenggang East Bay, the tidal current is predominantly diurnal and plays a dominant role in the overall hydrodynamic regime. In the Qinzhou Bay area, tidal currents exhibit a remarkable reciprocating pattern, and the flow directions generally align with the shoreline.

2.2. Methods

The two-dimensional model of MIKE21 has been widely validated in simulating tidal wave propagation and the general patterns of sediment transport in tidal channels. This study focuses on tide regions with well-developed vertical mixing, where vertical stratification effects are insignificant. Therefore, the two-dimensional model is sufficient for the purposes of this study. Considering the hydro-morphodynamic processes involved in the canal construction, a two-dimensional numerical model based on MIKE21 (MIKE ZERO version 2011) has been developed to provide a comprehensive analysis of the evolutionary features, with simulations performed on a Lenovo desktop computer running Windows 10. The model primarily consists of three modules: hydrodynamics, waves and sediment. The hydrodynamic module constructs a two-dimensional tidal current model by solving the depth-integrated shallow water equations, in order to simulate the tidal levels and flow fields in the current study area. The governing equations are provided as follows:
h t + h u ¯ x + h u v ¯ y = h S
where t is time; x and y denote the Cartesian spatial coordinates; h represents the total water depth and equals to the sum of water surface elevation and bathymetric depth; u and v represent the velocity components in x and y directions; S denotes the source term of flow. The wave module is employed to simulate wave propagation, transformation, and the resulting radiation stresses, thereby providing wave field inputs for the sediment module. In a Cartesian coordinate system, the governing equation of the wave module is expressed as below:
N t + · v N = S σ
c x , c y = d x d t = c g + U
c σ = d σ d t = σ d d t + U · x d c g k · U s
c θ = d θ d t = 1 k [ σ d d m + k · U m ]
where N denotes the spectrum density; x is the Cartesian coordinate system; v is the wave group velocity; S refers to the source term in the energy balance equation; ∇ denotes the differential operator; s represents the wave propagation direction, while θ and m are directions perpendicular to s. x is the two-dimensional differential operator in the x -space. Moreover, a sediment transportation module is developed to simulate the movement of suspended sediments, erosion–deposition processes and bed evolution. The module explicitly accounts for the flocculation, deposition and erosion of cohesive sediments. The governing equation of sediment transportation is written as follows:
c ¯ t + u ¯ c ¯ x + v ¯ c ¯ y = 1 h x h D x c ¯ x + 1 h y h D y c ¯ y + i = 1 n S i h
where c denotes the depth averaged suspended sediment concentration; Dx and Dy represent the turbulent diffusion coefficients of suspended sediment in x and y directions; Si denotes the erosion and deposition source term. Certain parameters (e.g., dispersion coefficient, critical shear stress and empirical constants) are defined so as to simulate the dynamic processes of sediment erosion and deposition. The specific steps for calculating sediment are further presented in Figure 2.
The computational domain covers the entire construction area of the Fangchenggang canal, approximately 372 km in the east–west direction and 192 km in the north–south direction. To achieve a balance between computational efficiency and resolution, locally refined unstructured triangular meshes have been generated by following the grid scheme proposed by Feng et al. [20]. The spatial resolution near the open boundary is set as 2000 m, while it is refined to 5–10 m in the vicinity of the construction zone. A total of 318,856 computational nodes and 626,696 triangular cells are generated for the canal construction project. A discharge condition is specified at the upstream boundary.

2.3. Model Validation

The model was calibrated and validated through field observations of tidal levels and current velocity. At the open boundary on the offshore side, the tidal levels are prescribed based on the MIKE Global Model, which incorporates diurnal, semidiurnal, and shallow-water tidal constituents derived from satellite data, with a spatial resolution of 0.125°. The discharge is specified at the upstream boundary. The computational time step ranges from 0.05 to 36 s. The wetting–drying method is adopted to handle land–water interfaces, breakwaters, and cofferdams, with default parameter setting: a dry depth of 0.005 m, a flooding depth of 0.05 m, and a wet depth of 0.1 m. Both Smagorinsky eddy viscosity coefficient CS and the Manning roughness coefficient M are calibrated, with Cs = 0.28 and M = 20–50). The results demonstrate that the error distribution of tidal level numerical simulation is generally acceptable.
Figure 3 and Figure 4 demonstrate the validation results of tidal levels and flow directions at stations T1–T2 during the flood tide and neap tide. The deviation between field observations and model simulations falls within ±10%. During the spring tide of flood season, ebb velocities exceed flood velocities and flow directions are parallel to the shoreline. During the neap tide of dry season, flood and ebb velocities are generally close. The temporal variations in flow velocity are validated at stations V02 to V04 for spring tide (Figure 5) and neap tide (Figure 6). The numerical simulations are generally consistent with the field observations, highlighting the model’s reliability in the deep channel waters.
The temporal variations in sediment concentration are compared for stations V02 and V03 during the spring tide, as shown in Figure 7. The characteristic values and variations of sediment concentration are fairly close to the field observation, indicating that the sediment transport model can characterize the topographic evolution features of the study area under complex hydrodynamic conditions.
The tidal flow fields during flood peak and ebb peak periods are shown in Figure 8 and Figure 9, which verify the hydro-morphodynamic model in simulating the reciprocating tidal currents in Qinzhou Bay and Fangchenggang East Bay. The flow field distribution demonstrates the hydrodynamic environment along the proposed canal alignment (i.e., Route 4 shown in Figure 1). A northward tidal current converging into Longmen Gorge at the bay entrance is observed at flood peak (Figure 8), while it exhibits a southwest deflection at ebb peak (Figure 9).
The model validation results indicate that the numerical model based on MIKE21 is capable of simulating the complex processes accurately in the Qinzhou Bay. In the present study, 0° and 360° represent the same flow direction. The dominant flow directions at different monitoring stations agree with the field observations. The deviations in water level, flow velocity and flow direction satisfy the technical requirements for numerical models (JTS/T231-2021). The numerical model is subsequently adopted to investigate the impact of canal construction on hydro-morphodynamic processes in Section 3.

3. Results

3.1. Tidal Currents in Coastal Channels

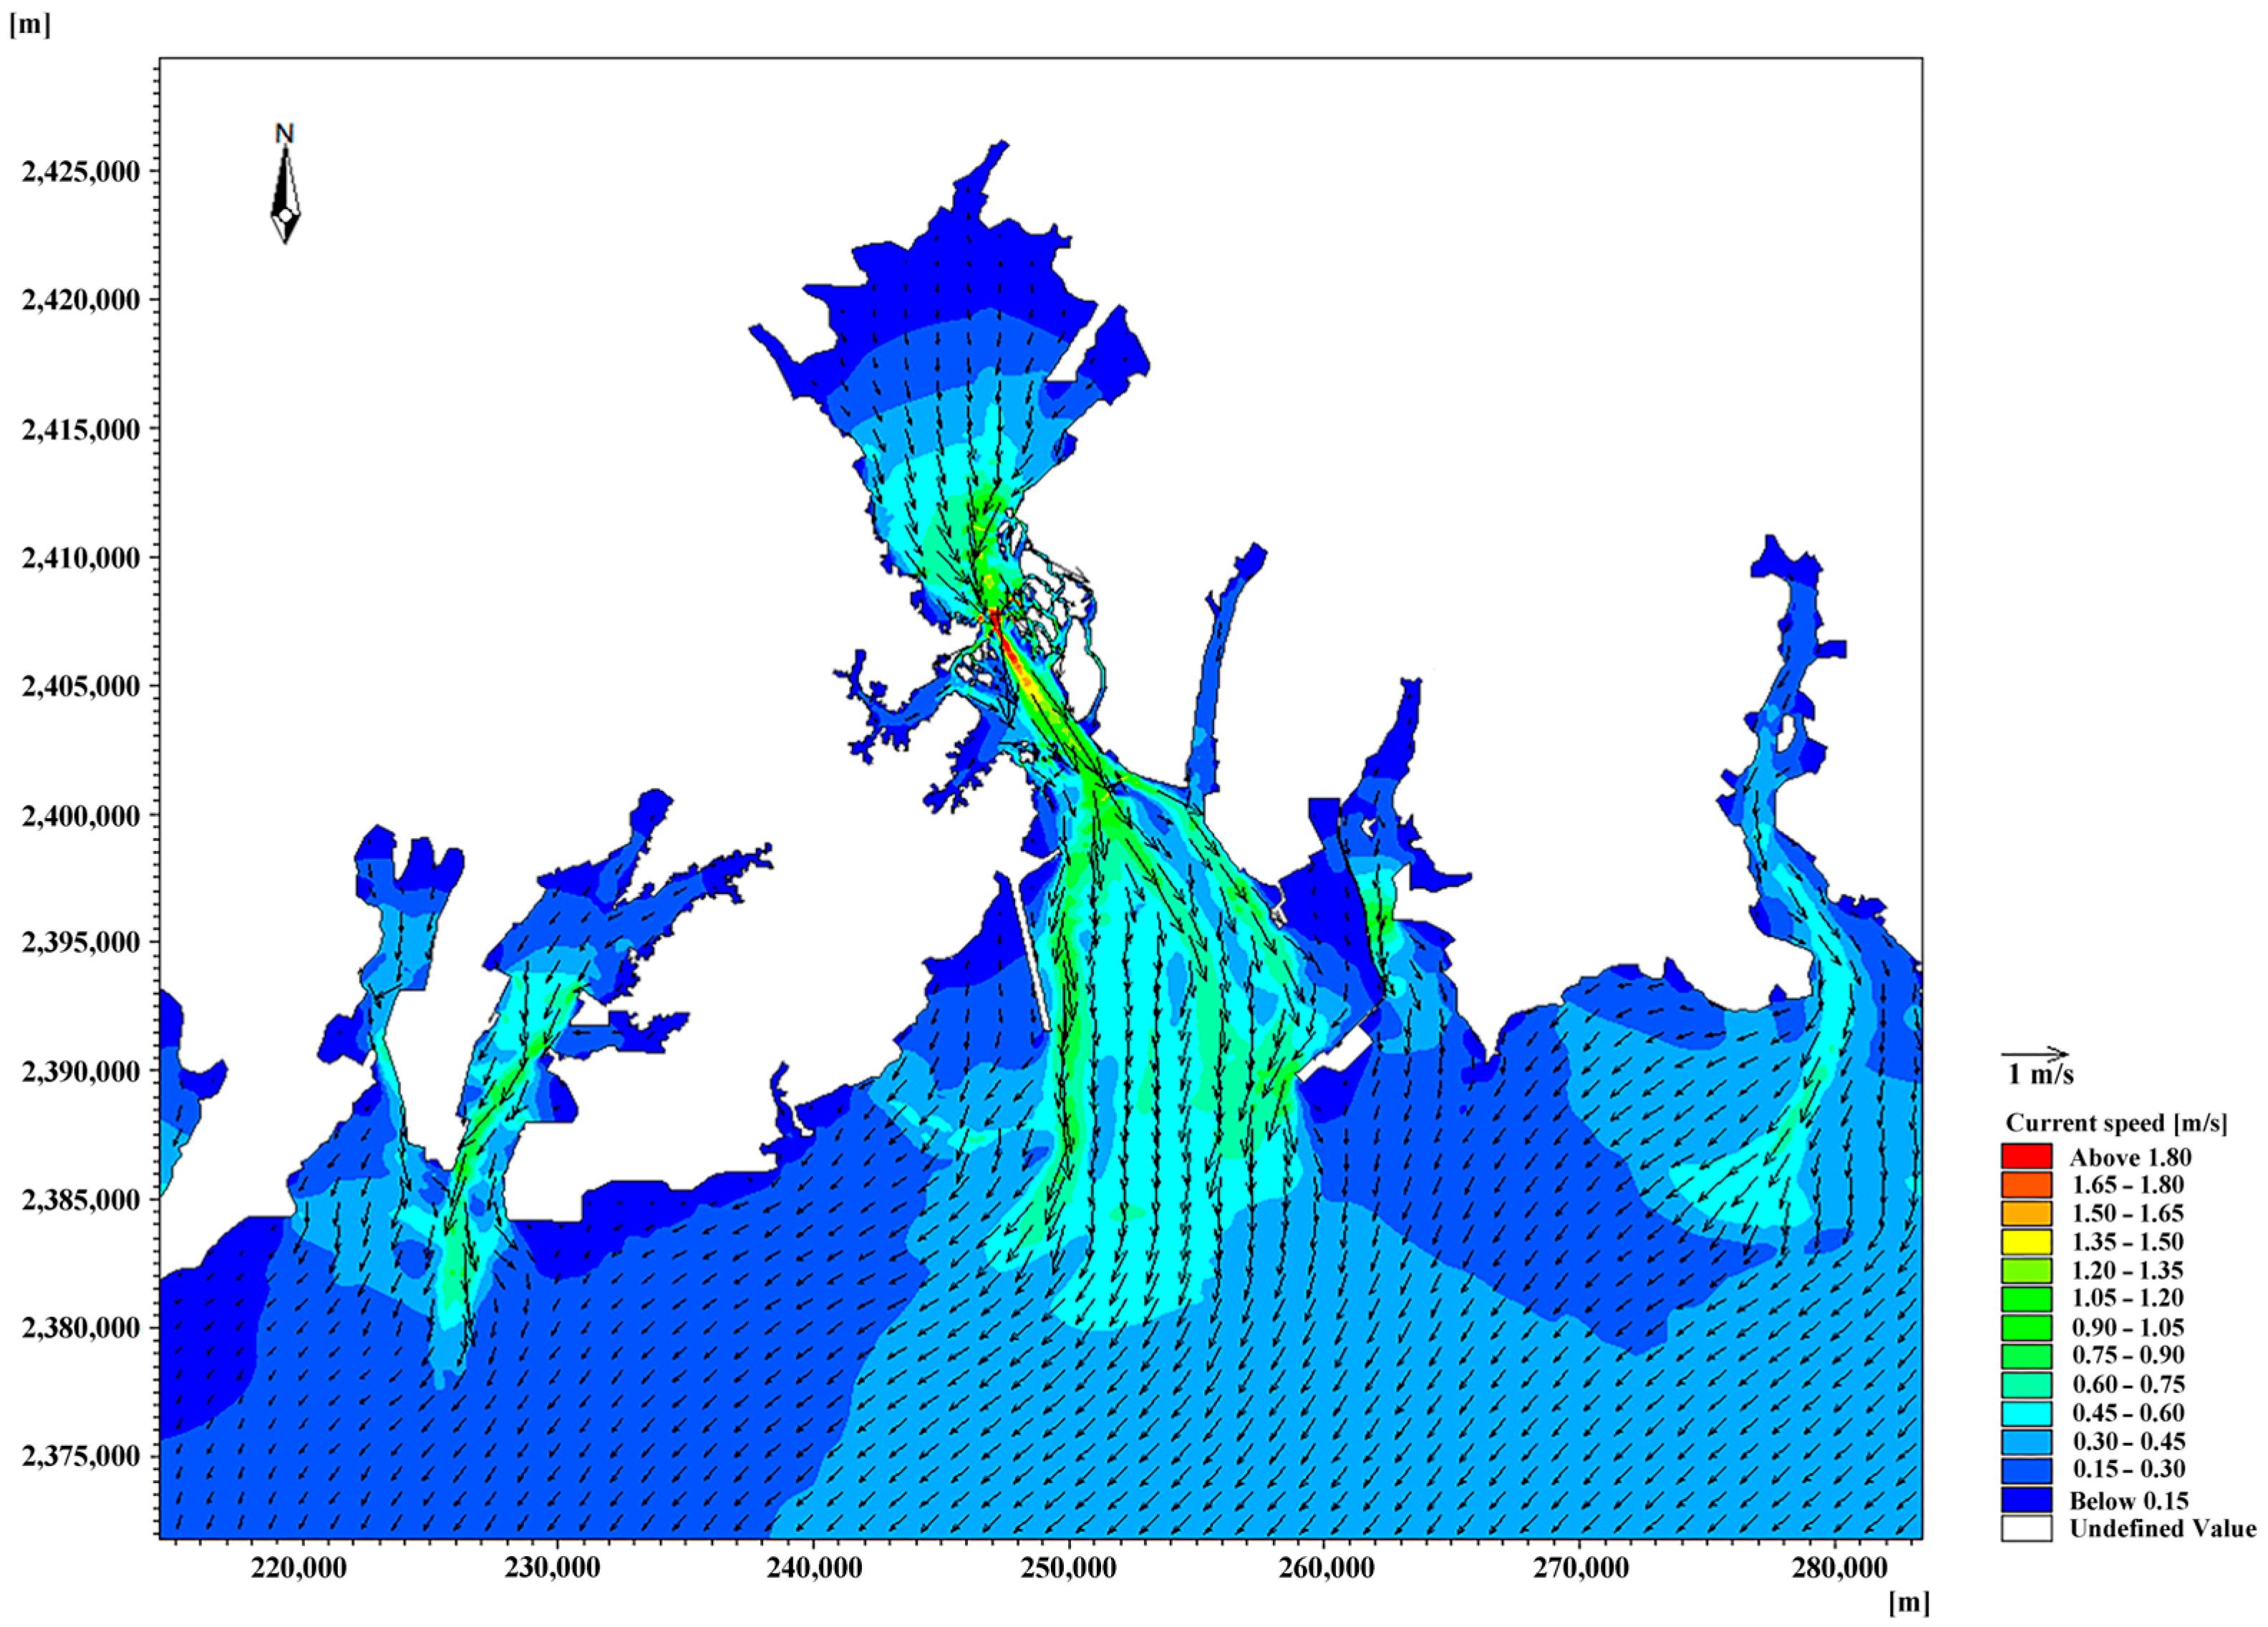
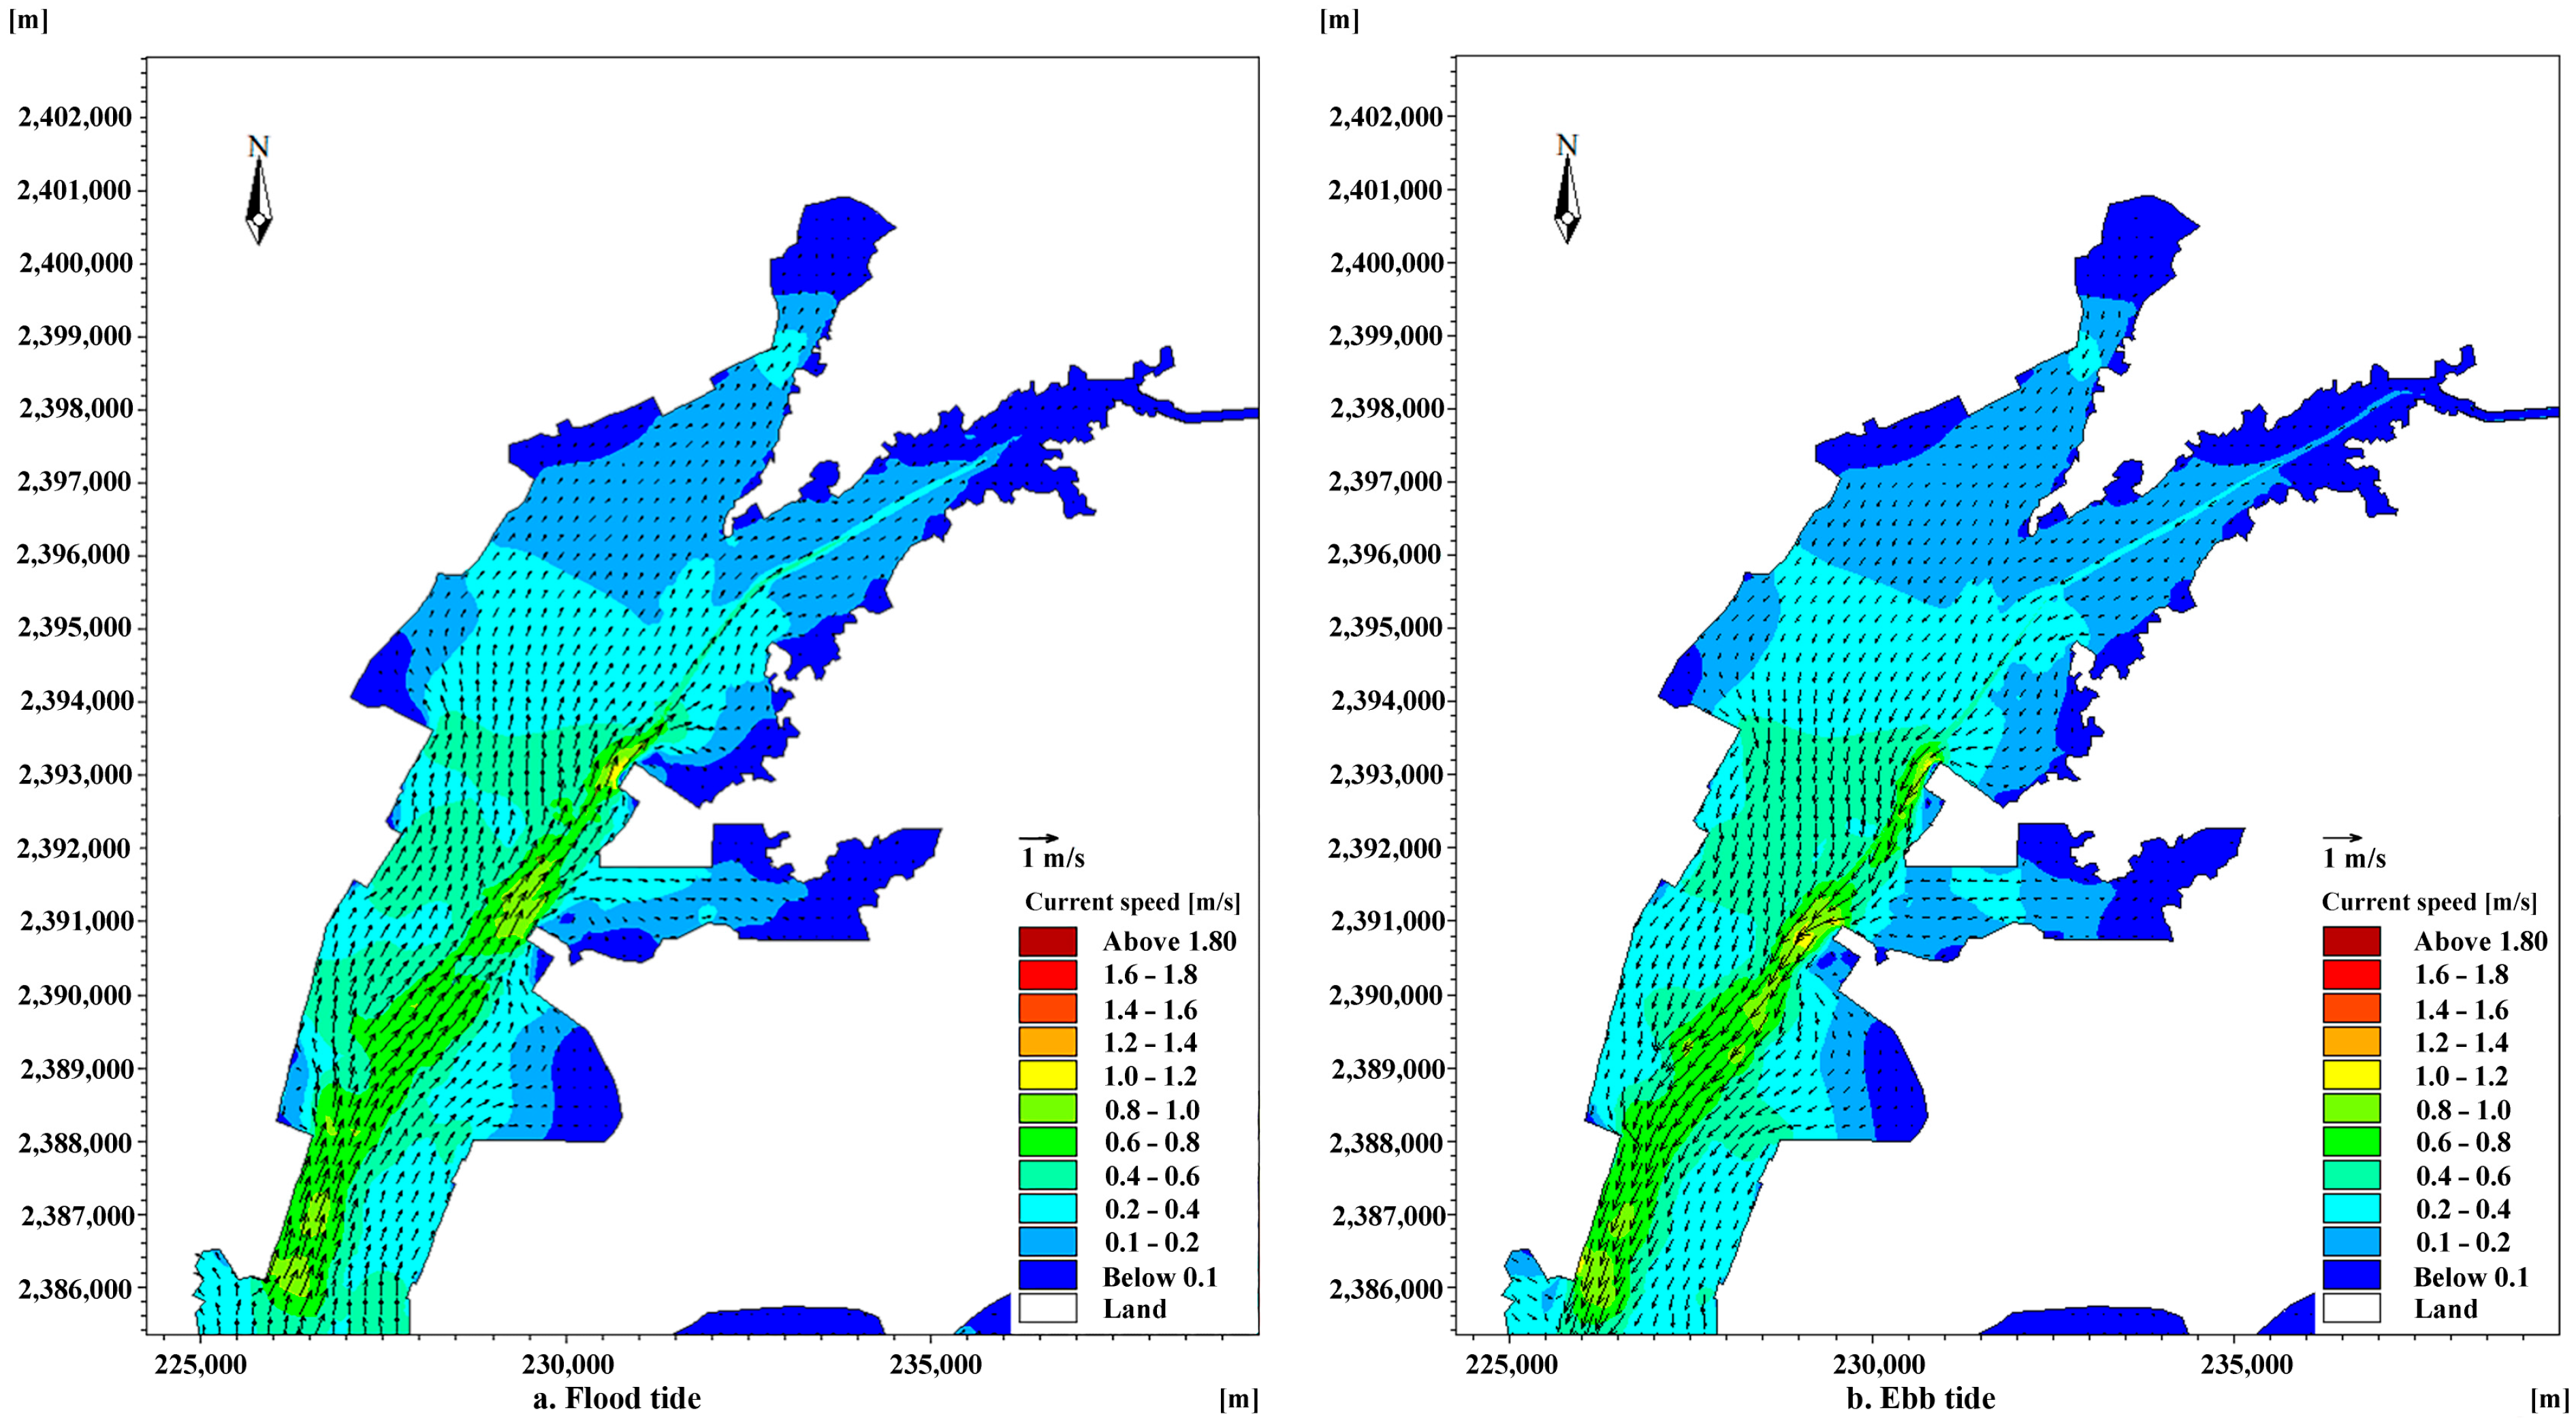
Both flood and ebb tide flow fields during the spring tide in Qinzhou Bay are illustrated in Figure 10. A distinct bidirectional tidal flow pattern is observed, and the spring tide exhibits pronounced hydrodynamic asymmetry and spatial heterogeneity. Owing to the unique coastal topography and shoreline configuration, most flood currents flow northeastward, converging at the bay entrance. High speed currents (>1.0 m/s) advance northwestward along the deep channel, forming a clearly transport corridor. In contrast, the central and western waters show a large velocity gradient. The dense streamlines around island clusters (<0.4 m/s) indicate a strong tidal wave shadow effect on the leeward side.
From the perspective of spatial distribution, the flow velocity falls below 0.8 m/s within approximately 70% of bay waters, suggesting the tidal energy dissipation in shallow waters. The ebb tide flow field presents a divergent dual-channel pattern from northwest to southeast. Specifically, one passes through the deep channel at Maowei Sea with peak velocities exceeding 1.5 m/s, while the other part moves southward along the eastern island chain with a velocity ranging from 0.8–1.0 m/s. A stagnation zone emerges in the eastern intertidal flat and maintains low flow velocities (<0.4 m/s) throughout the tidal cycle.
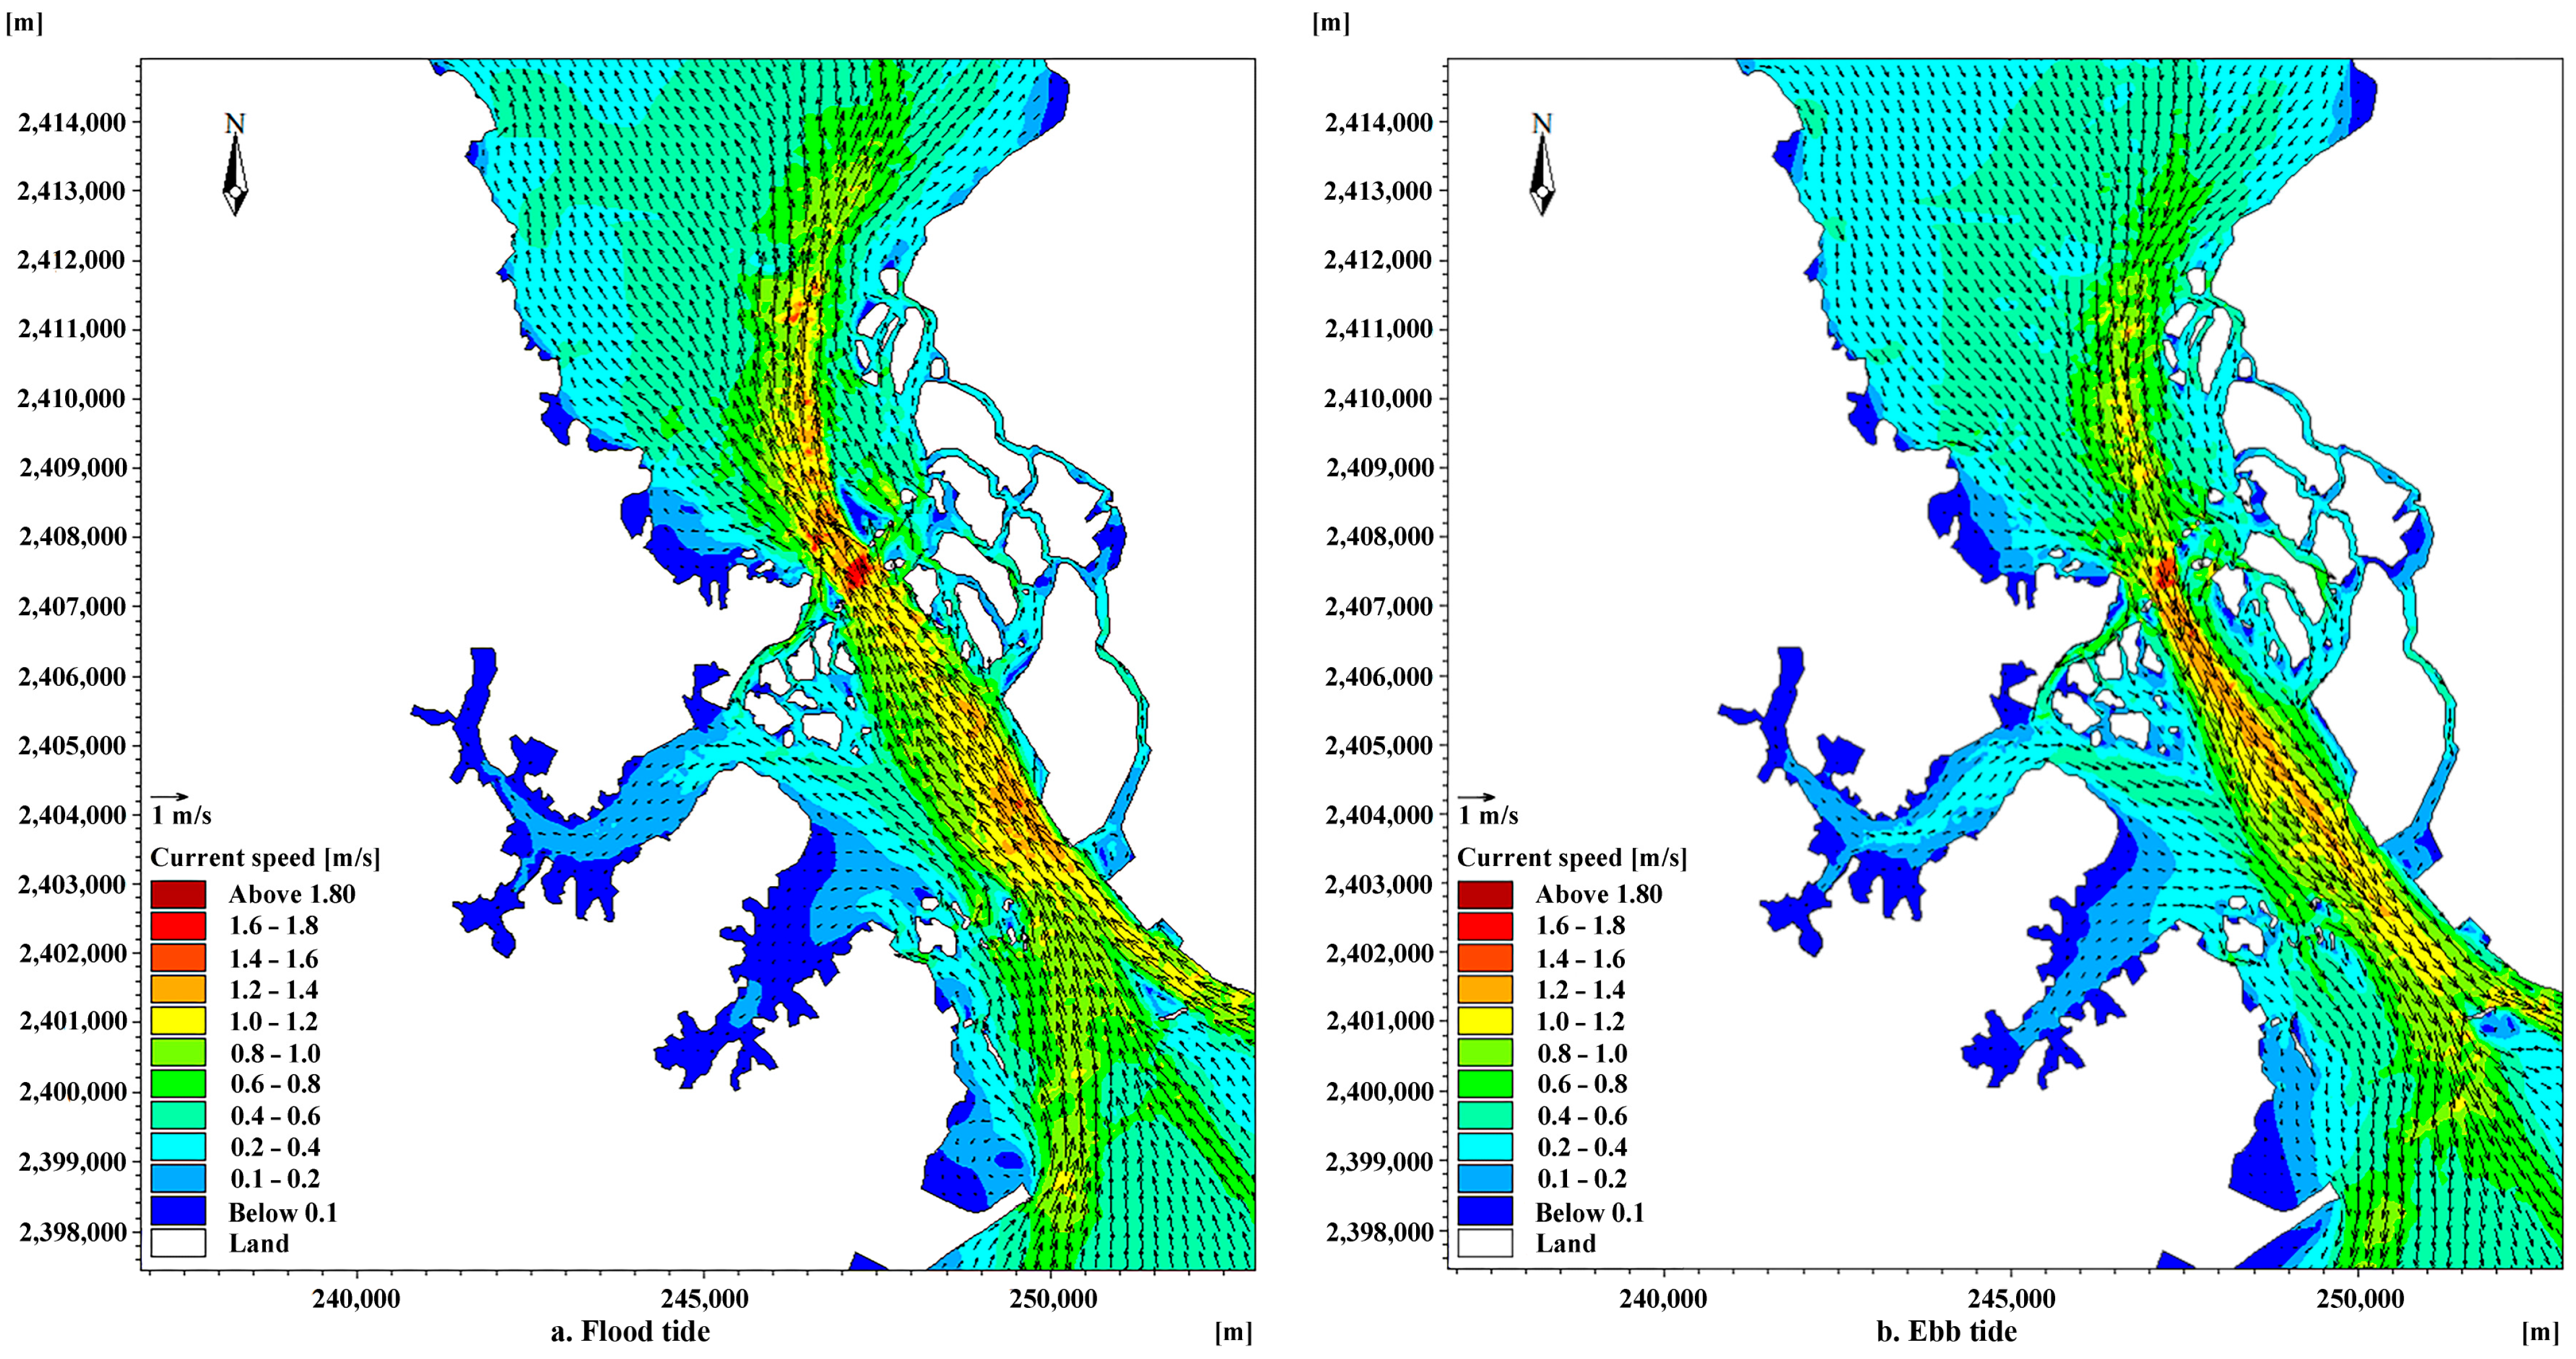
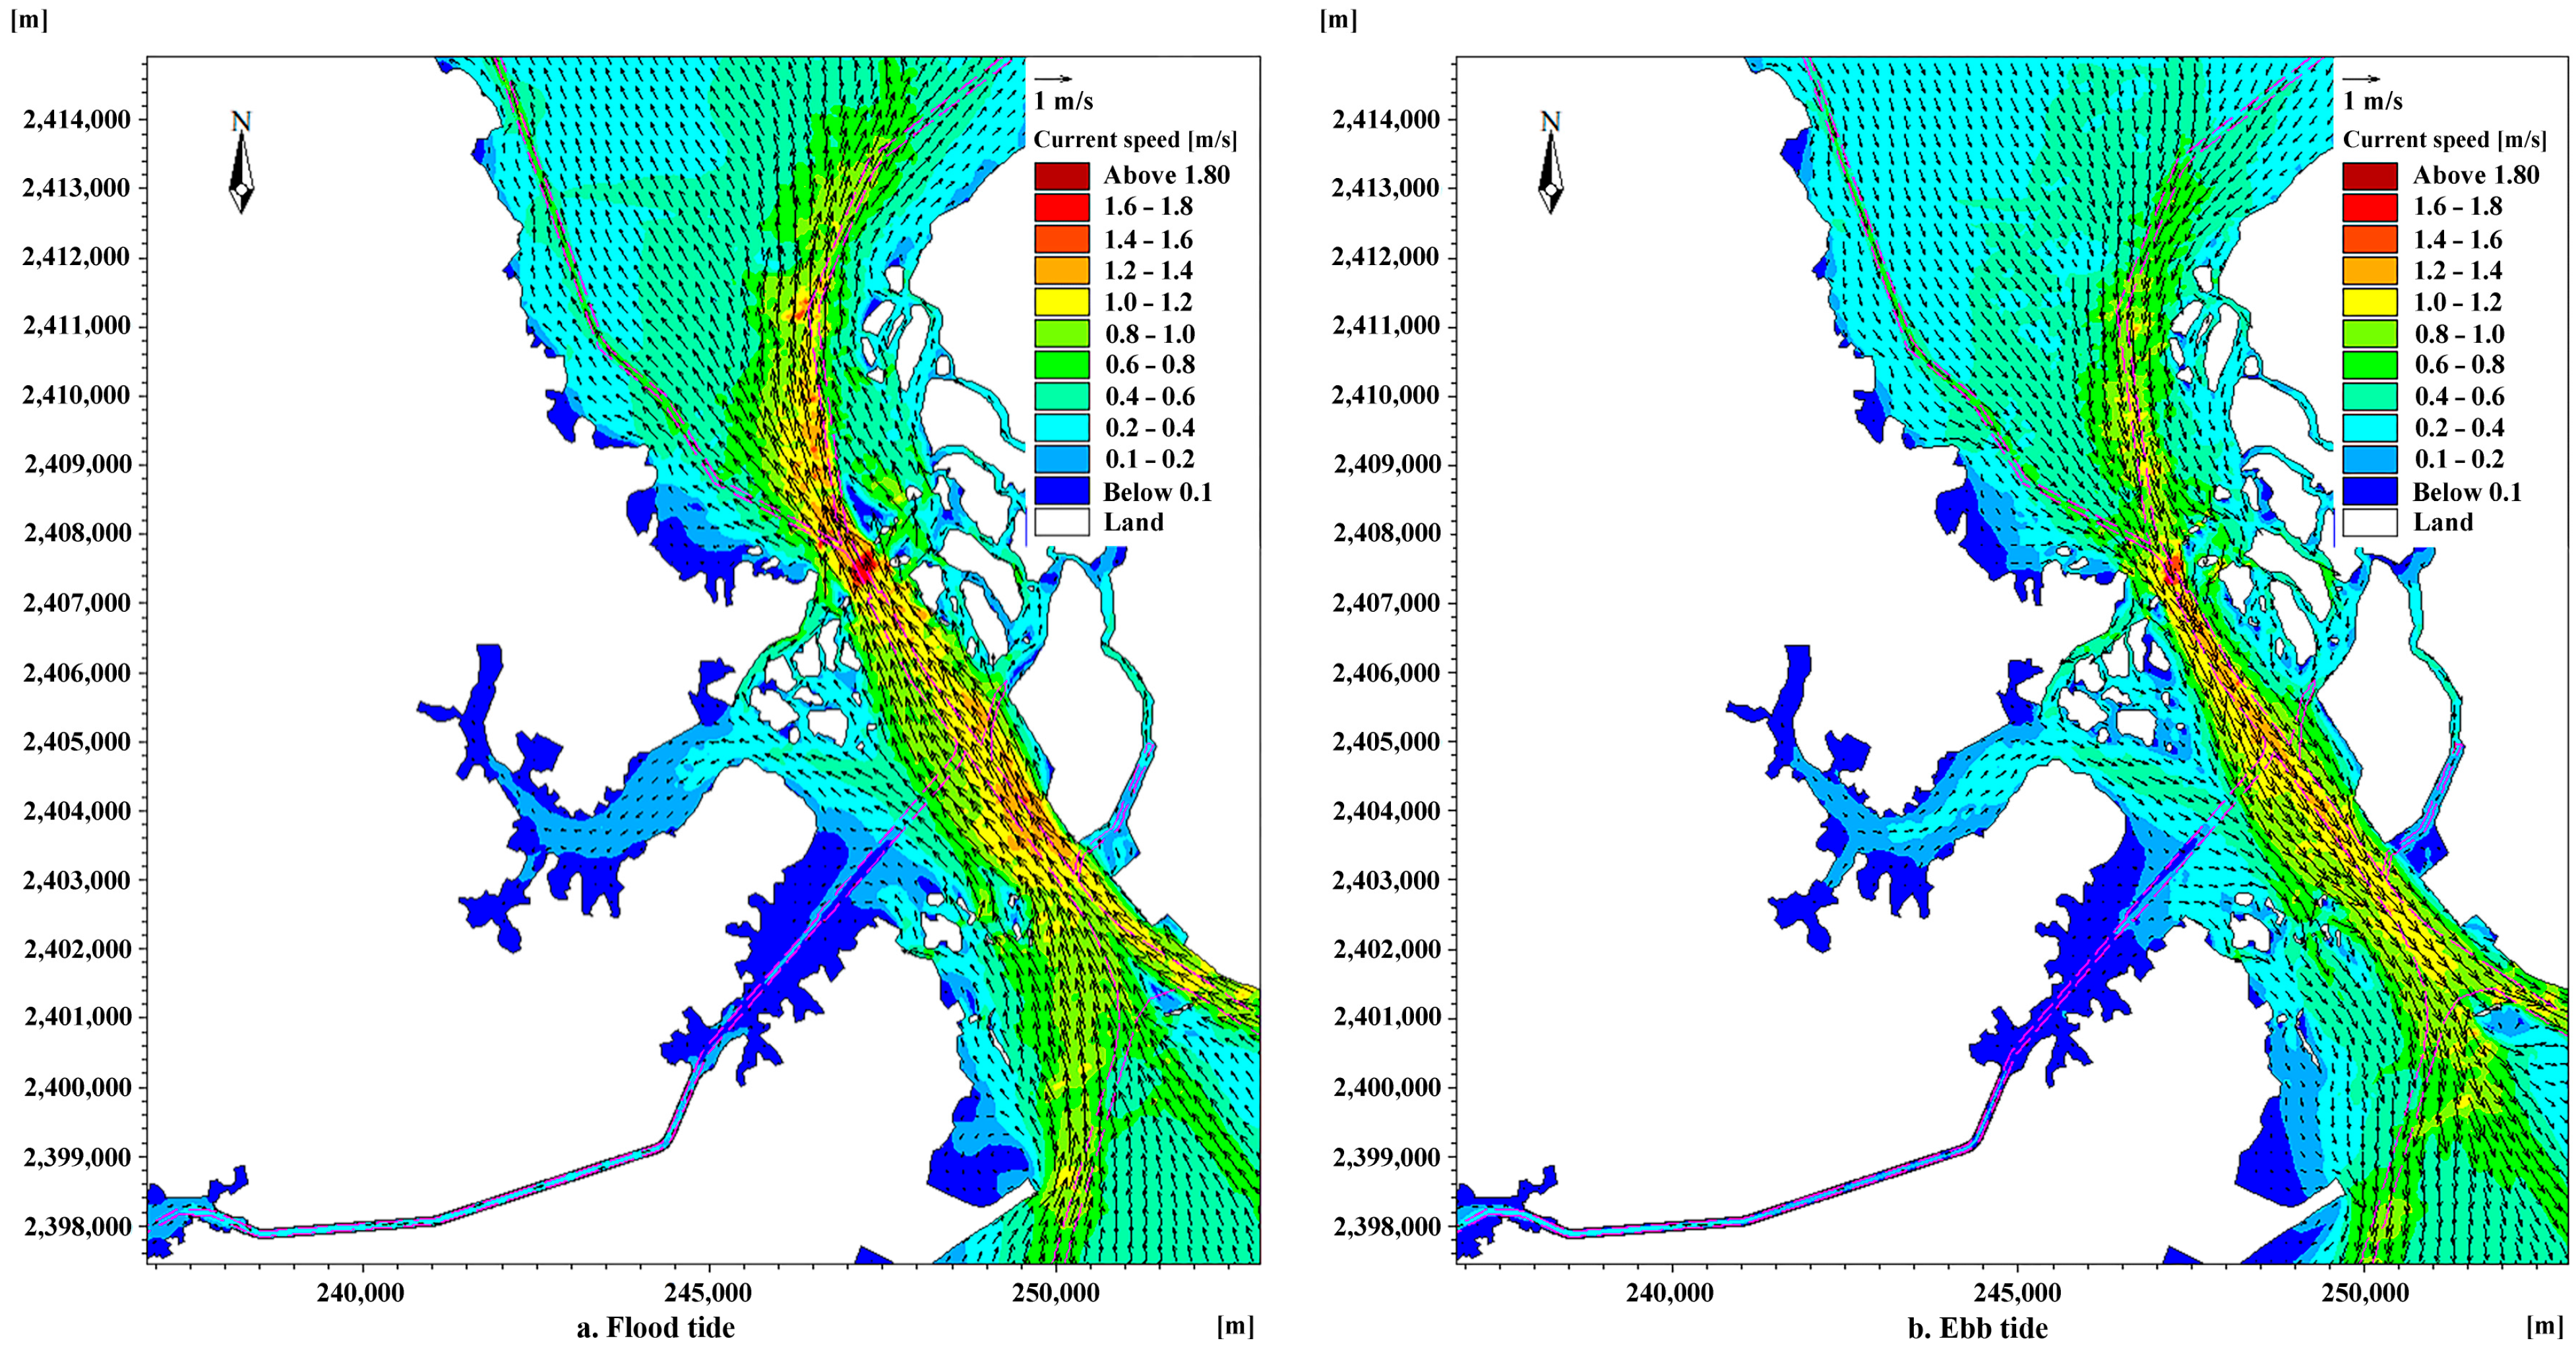
The flow field in Fangchenggang East Bay exhibits a reciprocating tidal pattern, as shown in Figure 11. During peak flood, the flow field shows a converging pattern toward the deep-channel navigation zone (Figure 11a). The high-speed flow region (>1.0 m/s) is concentrated along the main channel and the central bay entrance, forming a dominant flood-current corridor. Energy attenuation is observed in the vicinity of shoal areas. Flow velocity in the northern bayhead and nearshore waters falls below 0.4 m/s. Recirculating eddies emerge in the tidal flats on the northern edge of the bayhead with dense streamlines in the dark blue regions (<0.1 m/s). At ebb peak, the strong currents concentrate in the eastern deep trough, partially overlapping with the flood tide path but in the opposite direction (Figure 11b). On both sides of the main channel, the flow splits in a bifurcated tail-shaped pattern around the shoal topography with visibly reduced streamline density.
The tidal currents in the open waters of Qinzhou Bay are characterized by relatively high and uniform flow velocities, while low flow velocity and variable flow directions appear in the shallow waters. The maximum flow velocity could reach up to 1.50 m/s along the navigation channels. In Fangchenggang East Bay, the flow velocity demonstrates a clear spatial gradient, with strong currents in offshore waters and weak flows nearshore. The peak flood and ebb velocities reach 0.87 m/s and 0.77 m/s, respectively.

3.2. Variations in Hydrodynamic Conditions

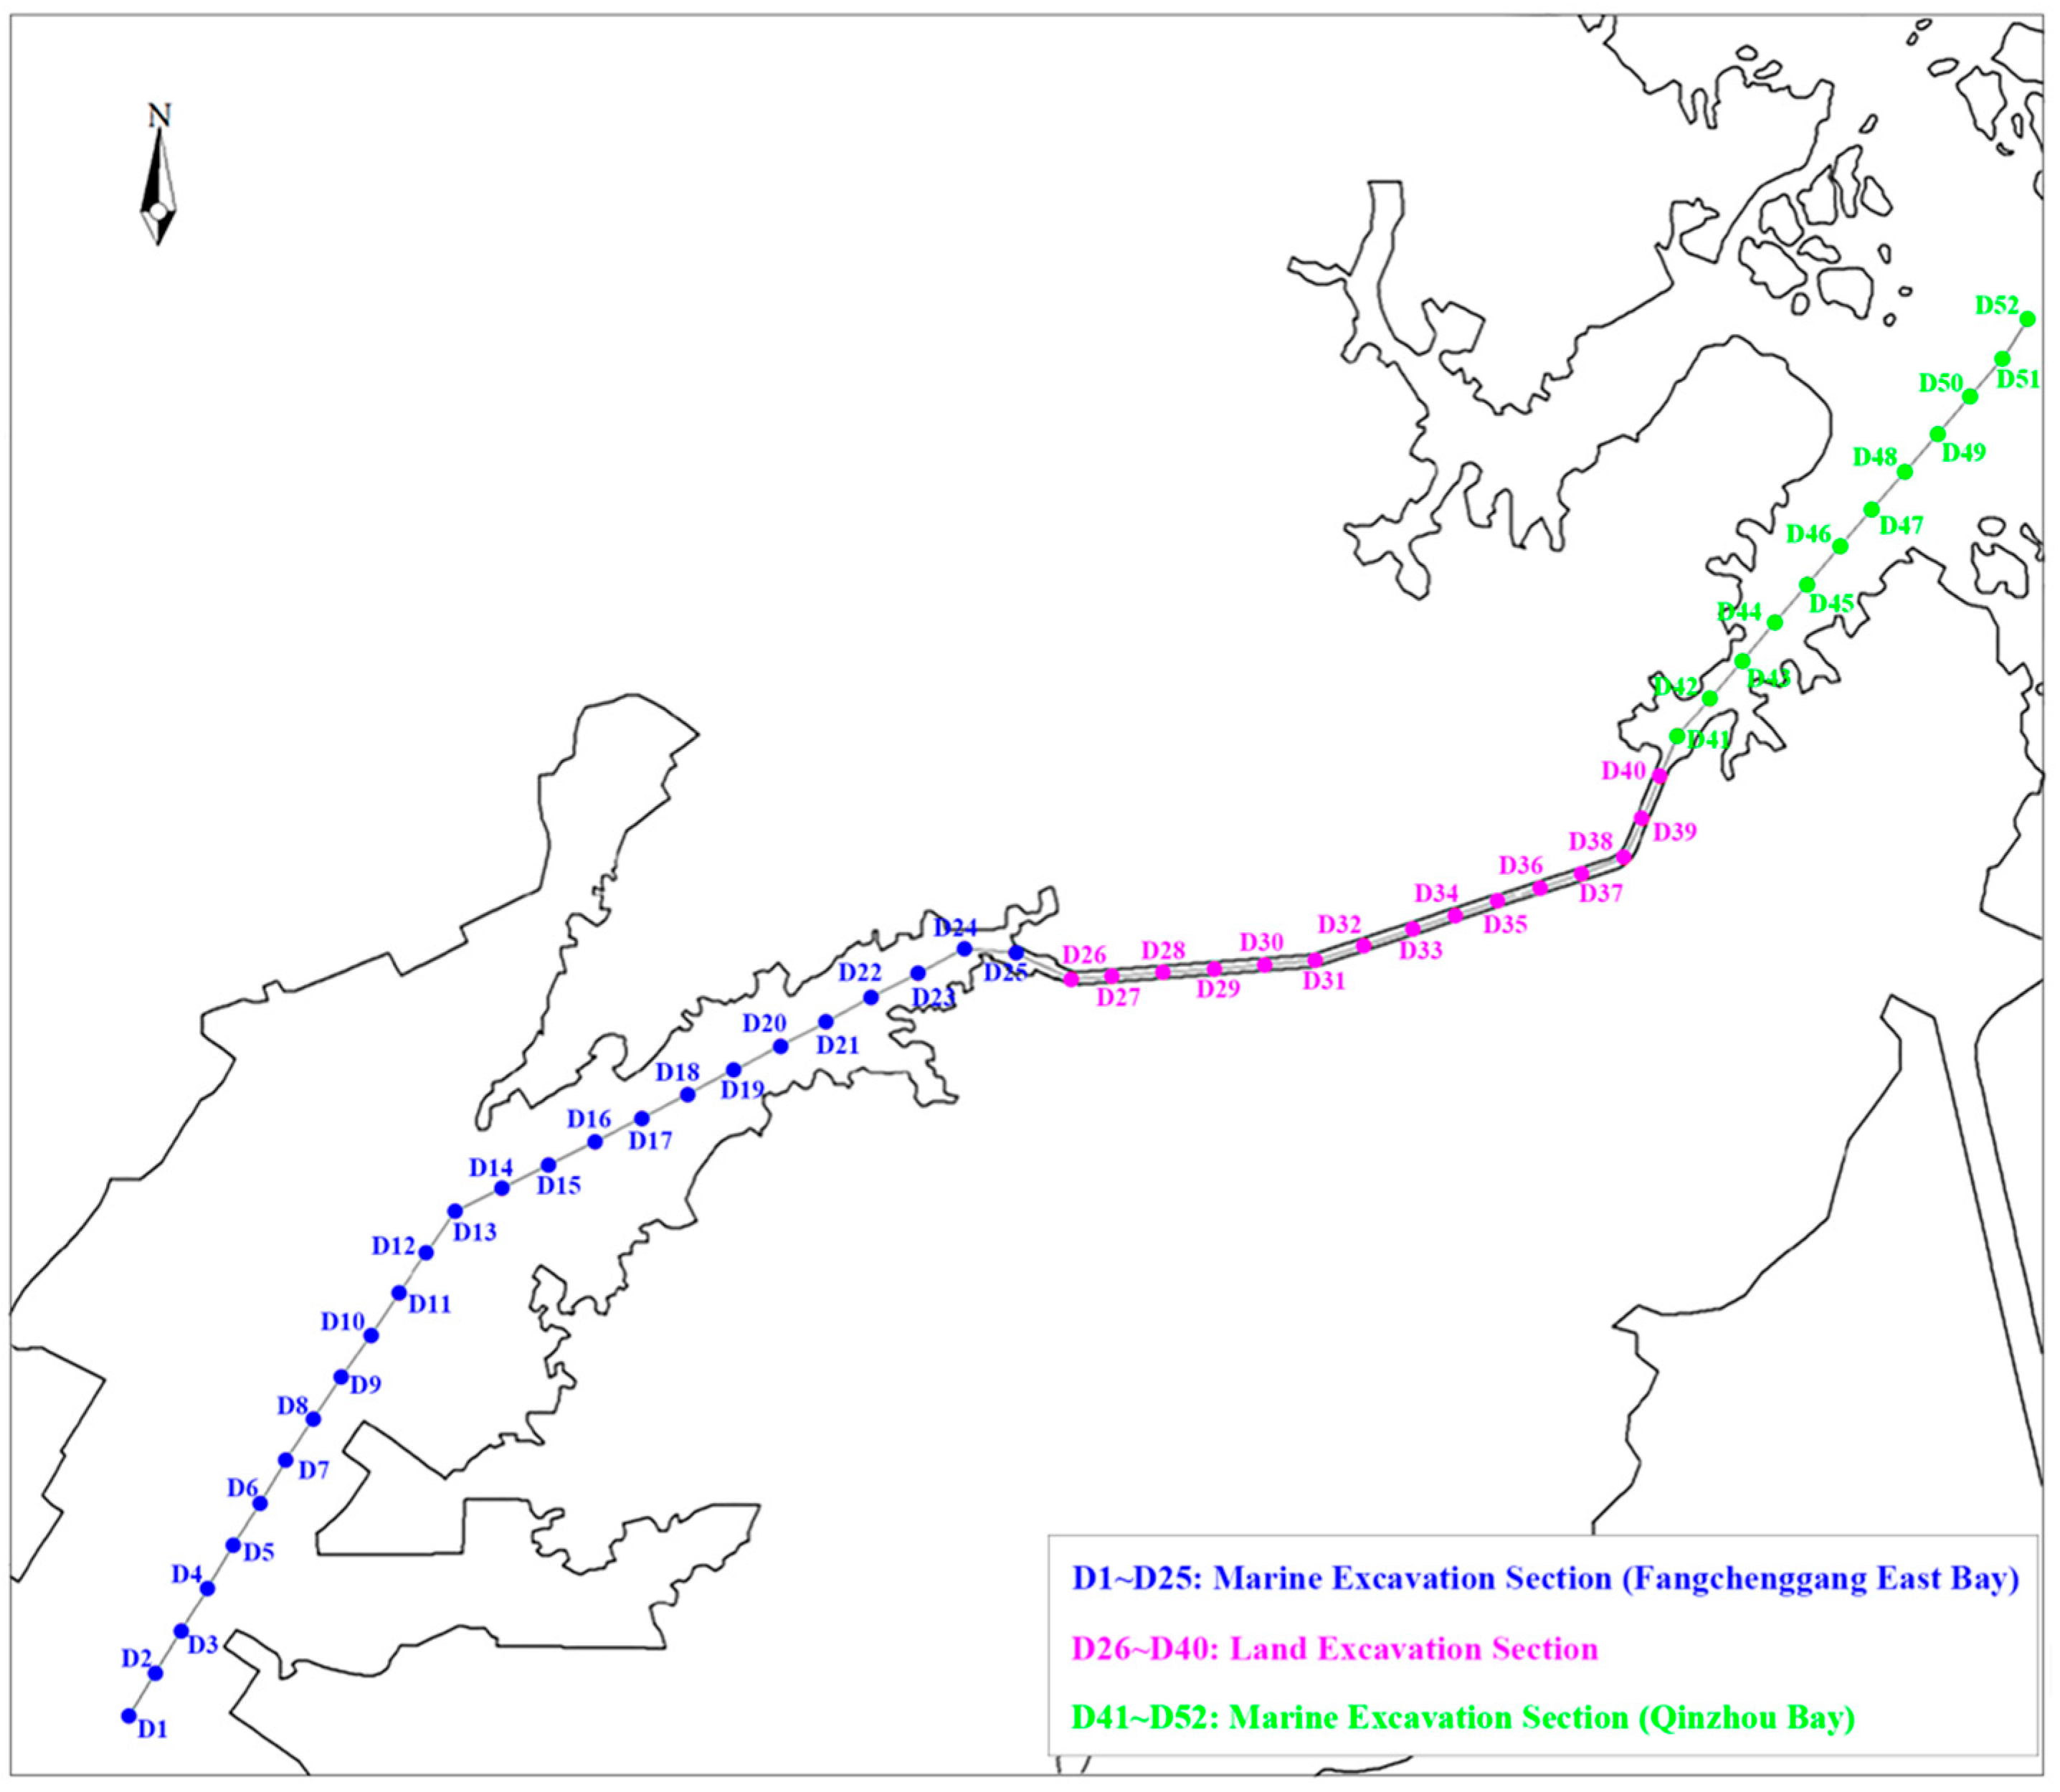
To investigate the variations of hydrodynamic conditions, a total of 52 characteristic points (D1–D52) were assigned along the canal route, as shown in Figure 12. Specifically, points D26–D40 are located in the land excavation section while D1–D25 and D41–D52 are located in the marine excavation section of Fangchenggang East Bay, Qinzhou Bay.
The flood tide velocity and flow direction results in the land excavation section during spring tide are summarized in Table 1. The flow exhibits a typical bidirectional tidal pattern, with stable and opposing flood and ebb currents. The maximum flood velocity ranges from 0.77 to 0.86 m/s at points D26–D37. The difference between flood and ebb tide velocity is generally less than 0.05 m/s. The average flow velocity refers to the mean vertical velocity at each characteristic point over a tidal cycle, with values ranging from 0.36 to 0.37 m/s. The flood flow direction is consistently distributed between 71° and 85°, while the ebb flow direction falls between 251° and 265°. These characteristics suggest the relatively uniform distribution of flow velocity in the canal area.
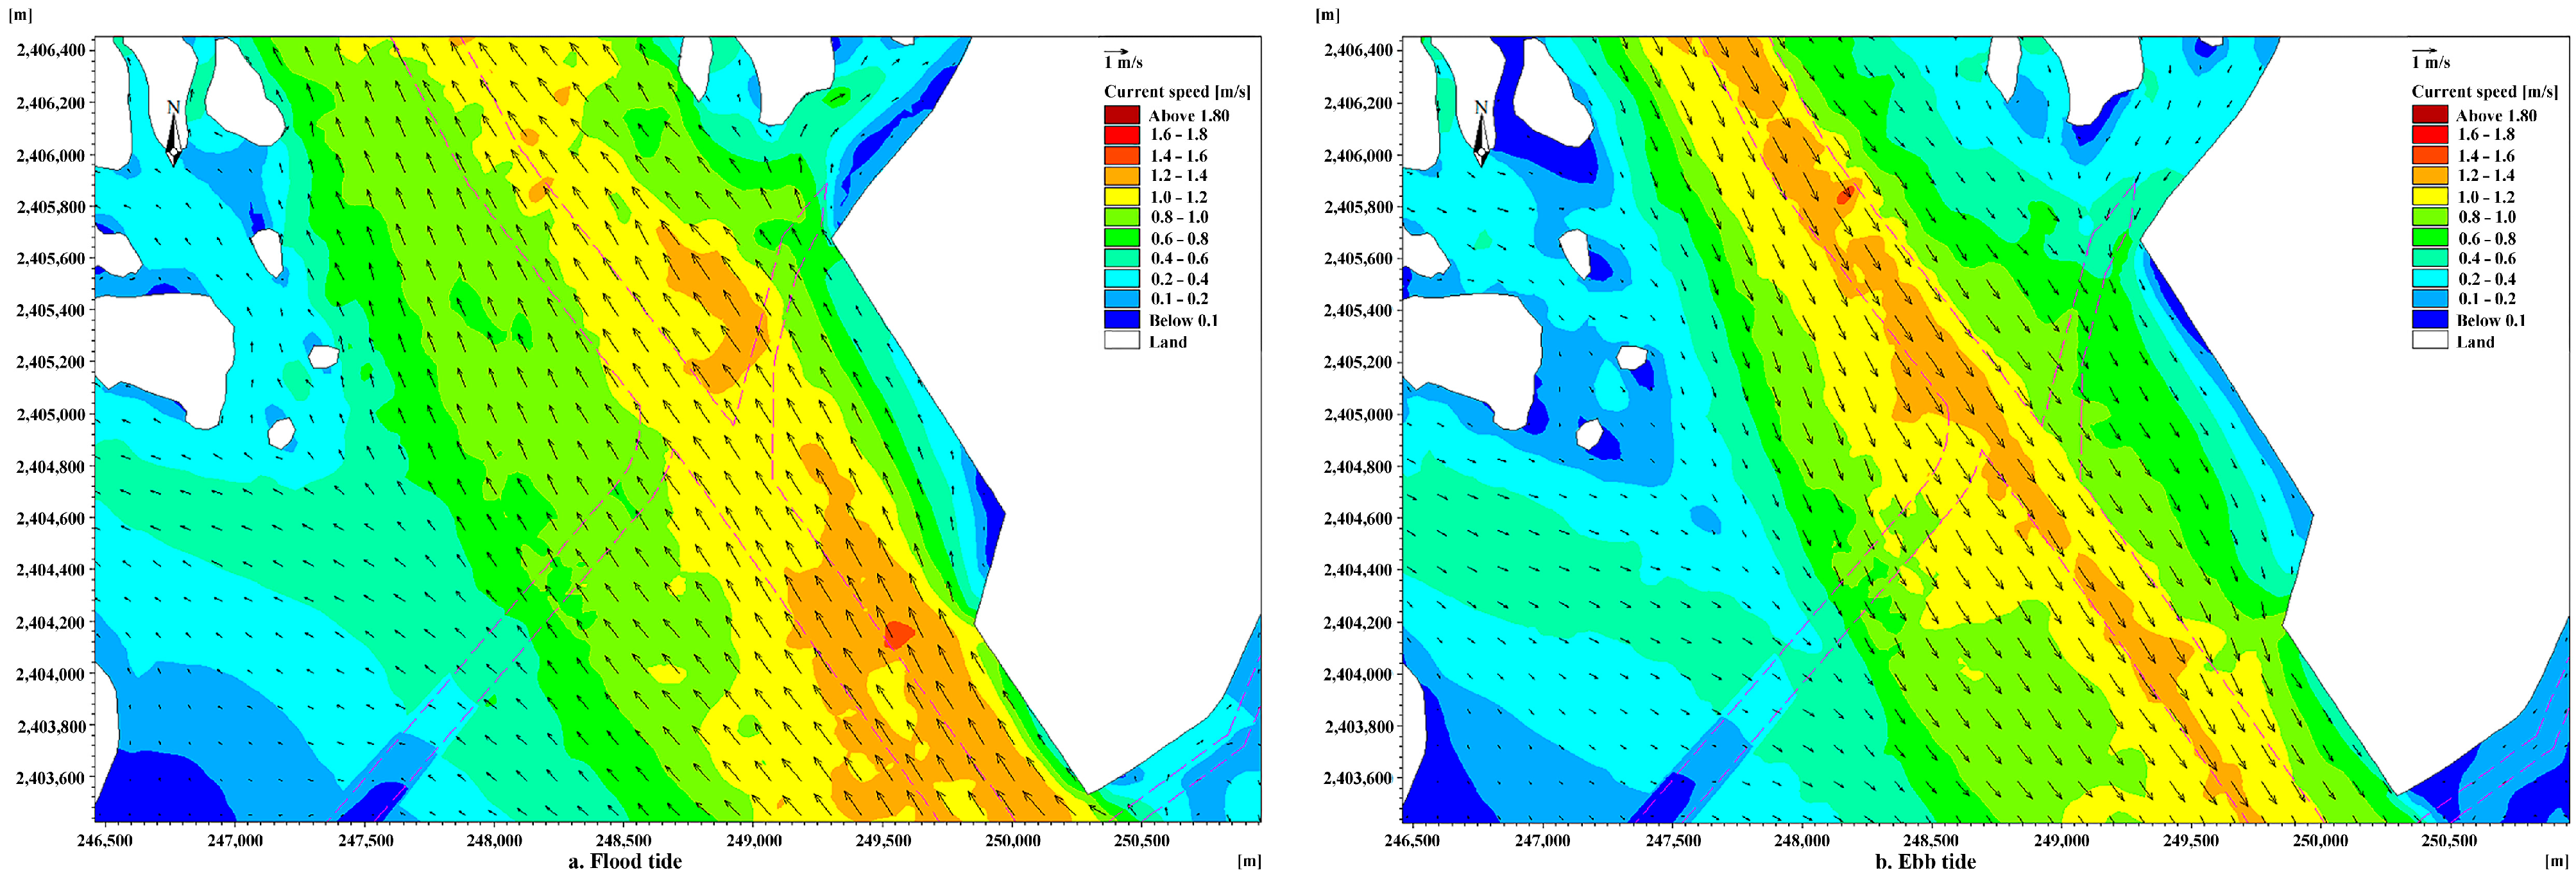
The flood and ebb flow fields at the land–sea junction are shown in Figure 13. The land excavation section exhibits a typical reciprocating flow pattern, attributed to the tidal waves from both Qinzhou Bay and Fangchenggang East Bay. The canal layout design results in alternating flow directions, i.e., westward and eastward flows during both flood and ebb tides. Field observations during the spring tide reveal that the flood tide moves westward at the early stage and decelerates gradually for approximately 7 h. Subsequently, it turns eastward and accelerates to its maximum velocity and then decelerates until slack water for nearly 5 h. During the ebb tide, the flow moves westward for about 5 h before shifting eastward. The peak flood velocity occurs 2 to 4 h before high tide, featured as an eastward flow. The peak ebb velocity appears 3 to 5 h after high tide, then the flow moves westward.
The flow velocity and direction during spring tide in the marine excavation section of Fangchenggang East Bay exhibit a typical tide-dominated and heterogeneous flow structure, as shown in Table 2. The flow velocity varies significantly across different points, with maximum flood and ebb velocity ranging from 0.43 to 1.18 m/s, 0.31 to 1.08 m/s. Strong current zones appear in the vicinity of the bay entrance (e.g., D3 and D8), while the current velocity decelerates gradually toward the bay head (e.g., D15–D21). Flow direction depicts a notable spatial gradient from the bay entrance to the inner bay (D24–D25). Moreover, tidal asymmetry characterized by dominant energy flux transport is observed in the canal waterway. In summary, the flow field in the marine excavation section is strongly influenced by offshore hydro-morphodynamic processes, in contrast to the uniform flow structure in the land excavation section.
The flow field of Fangchenggang East Bay shown in Figure 14 demonstrates a pronounced onshore flow from the bay entrance to the central area during the flood tide. High velocity appears along the main channel and generally exceeds 1.0 m/s, indicating that the hydrodynamic conditions in the main channel are improved by the dredging project. In the marine excavation section, the flow velocity increases by approximately 0.2–0.4 m/s. During the ebb tide, a similar trend of flow velocity is observed in the canal construction area. In particular, the ebb tidal hydrodynamics are enhanced within the deep channel, as evidenced by the expanded coverage of yellow zones with a flow velocity of 1.0–1.2 m/s.
Distinct patterns have been observed in the marine excavation section of Qinzhou Bay (D41–D52), as shown in Table 3. A more complex flow structure with pronounced spatial heterogeneity occurs in Qinzhou Bay. In the bay entrance area (D51–D52), velocity increases remarkably with a maximum flood tide velocity of 0.96–1.12 m/s and an ebb tide velocity of 0.99–1.12 m/s. In contrast, low velocity appears in the inner bay area (D41–D49) with a flood tide velocity of 0.28–0.80 m/s and an ebb tide velocity of 0.40–0.73 m/s. The minimum velocity is observed at D49 (0.28 m/s during flood tide and 0.40 m/s during ebb tide). Moreover, the flow direction presents more pronounced spatial variability. In the bay entrance area (D50–D52), flood and ebb flows exhibit nearly opposite directions, while, in the inner bay area (D47–D48), flow directions change drastically.
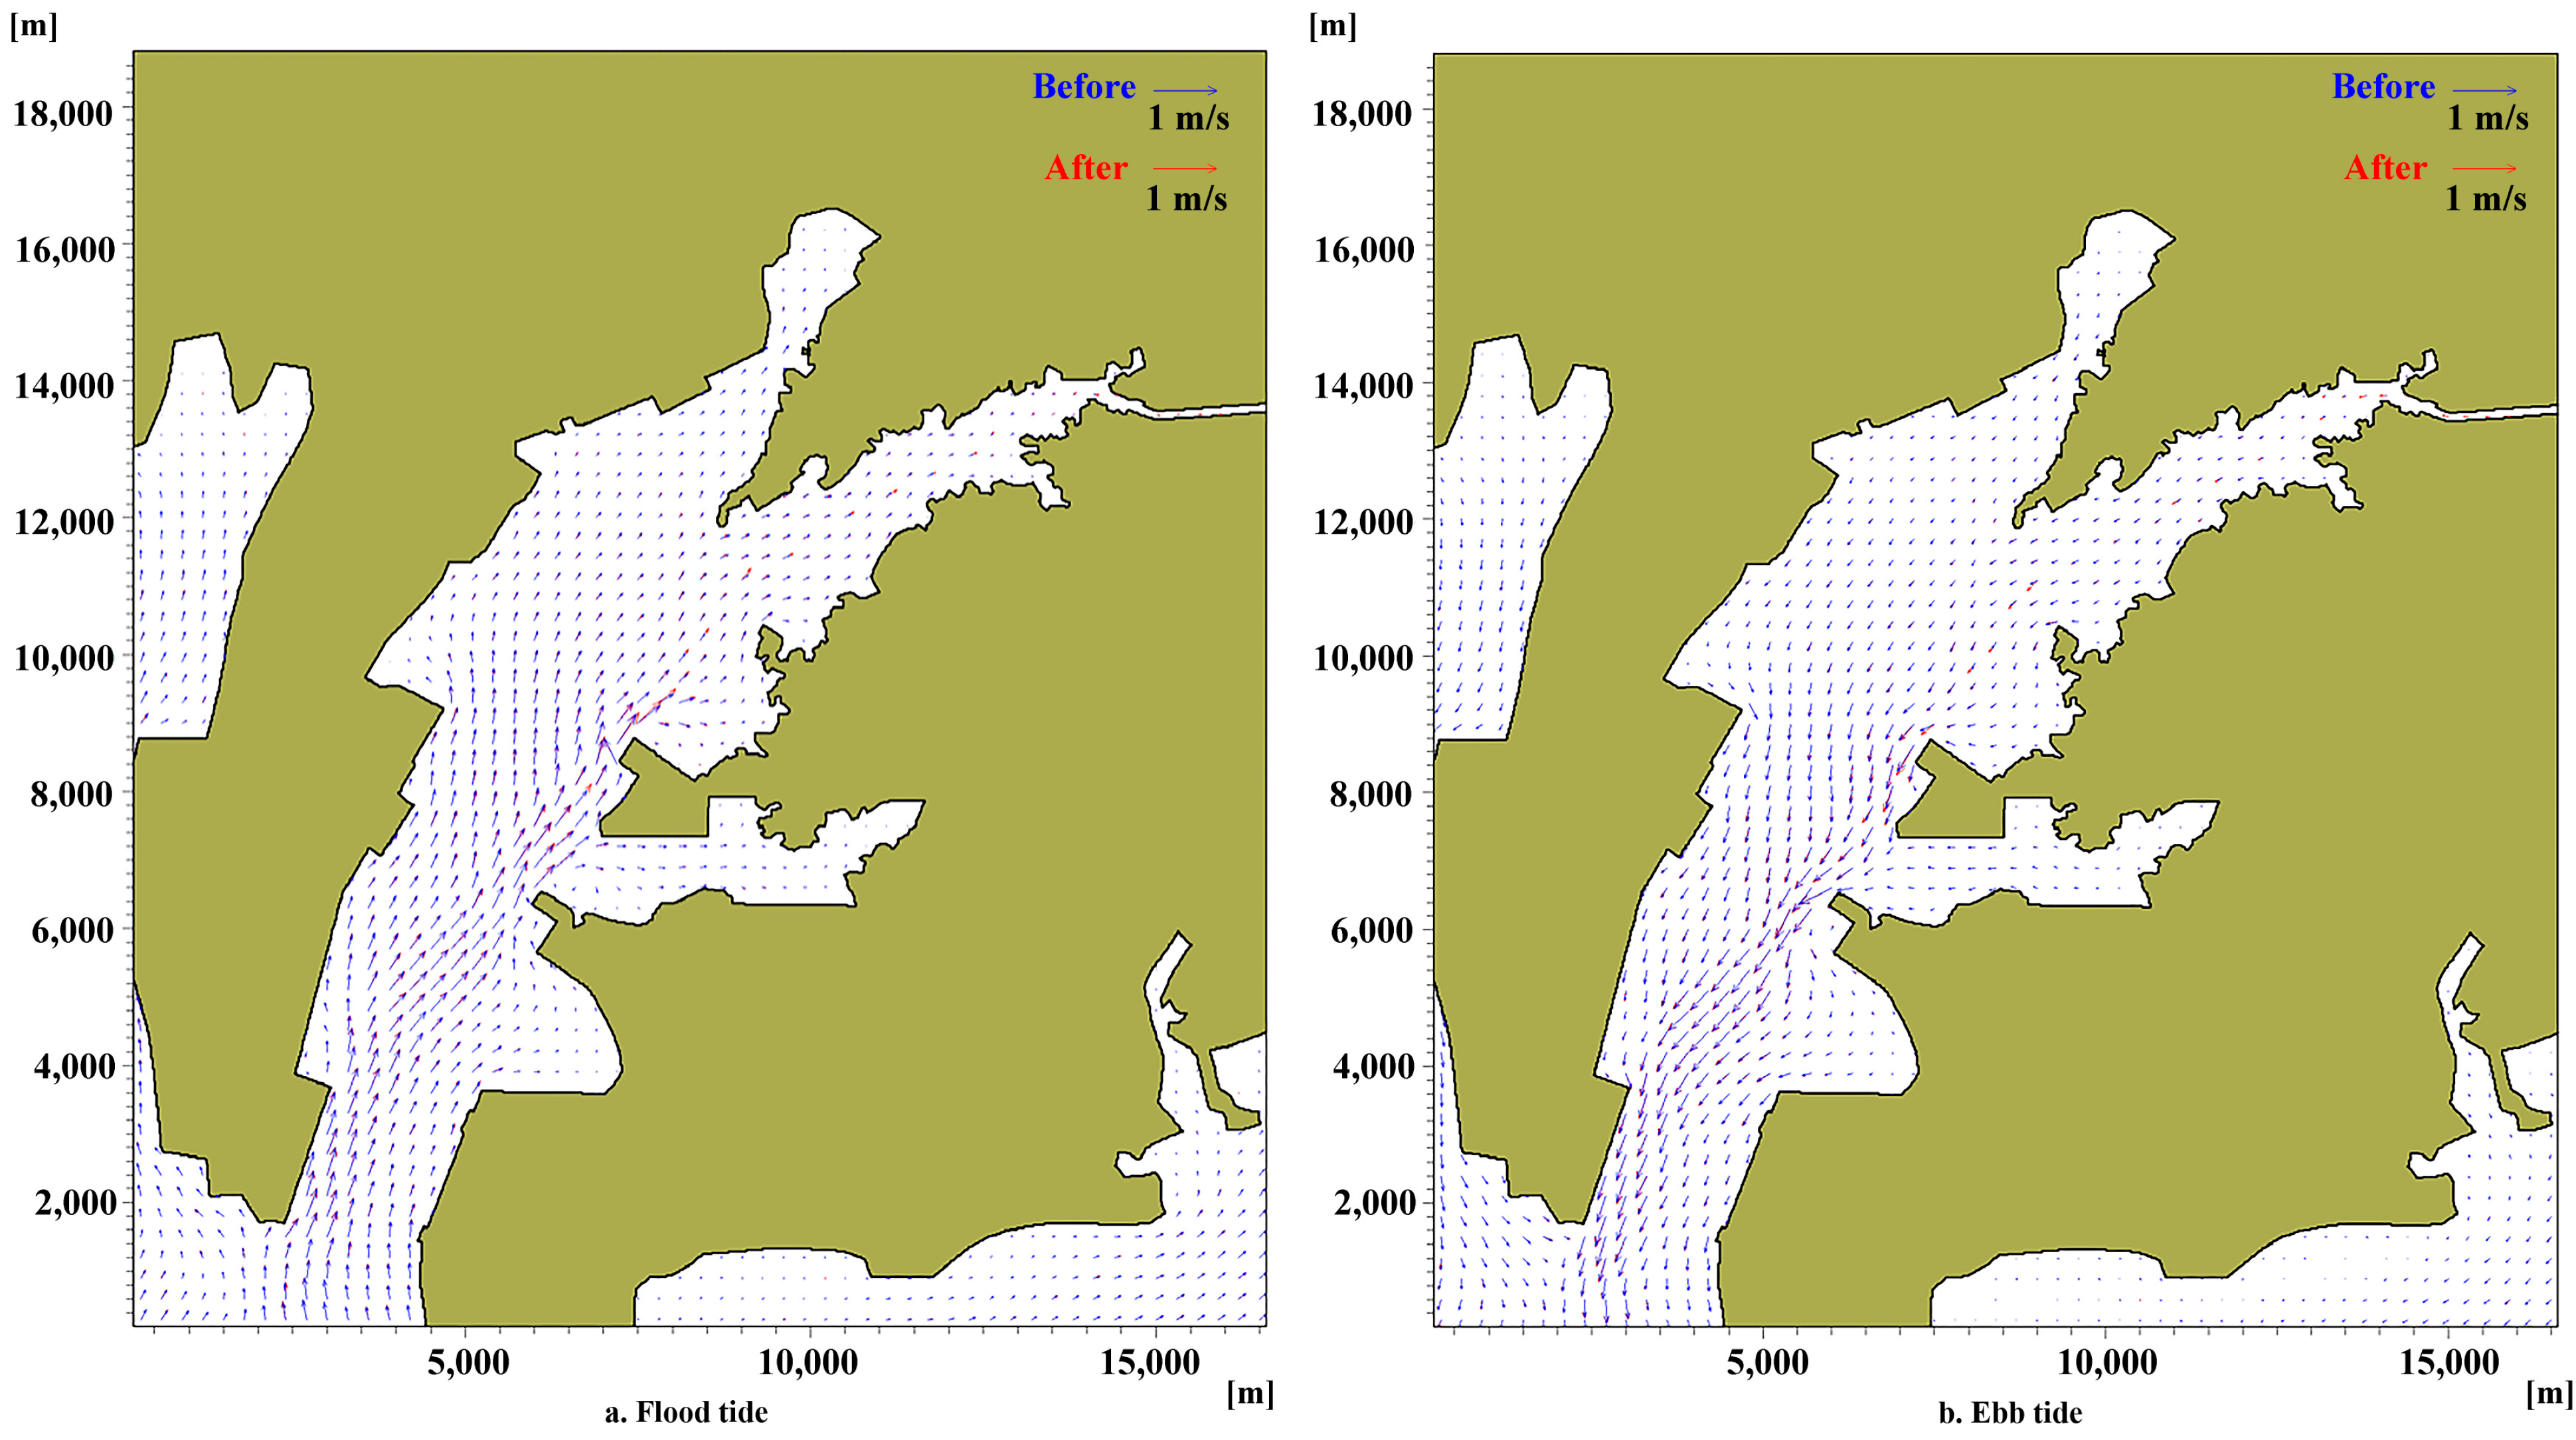
The flood and ebb current fields in the marine excavation section of Qinzhou Bay are shown in Figure 15. During the flood tide, high-velocity flows are densely distributed in the central bay area and the confluence of the canal waterway. The canal construction would enhance the hydrodynamics within the main channel effectively, forming a dominant flood tide pathway. The flows tend to move shoreward, with a sharp increase in the velocity gradient along the channel. The high-velocity zones diffuse along the evacuation channel toward the bay entrance and yield two main paths. One extends along the western waterway with a magnitude of 1.2–1.4 m/s; the other moves slightly eastward with a magnitude of 0.8–1.0 m/s. The results suggest that the canal construction would improve the flow condition at the bifurcation of ebb tide paths. The flow velocity decreases to below 0.1 m/s, where localized weak backflow occurs.
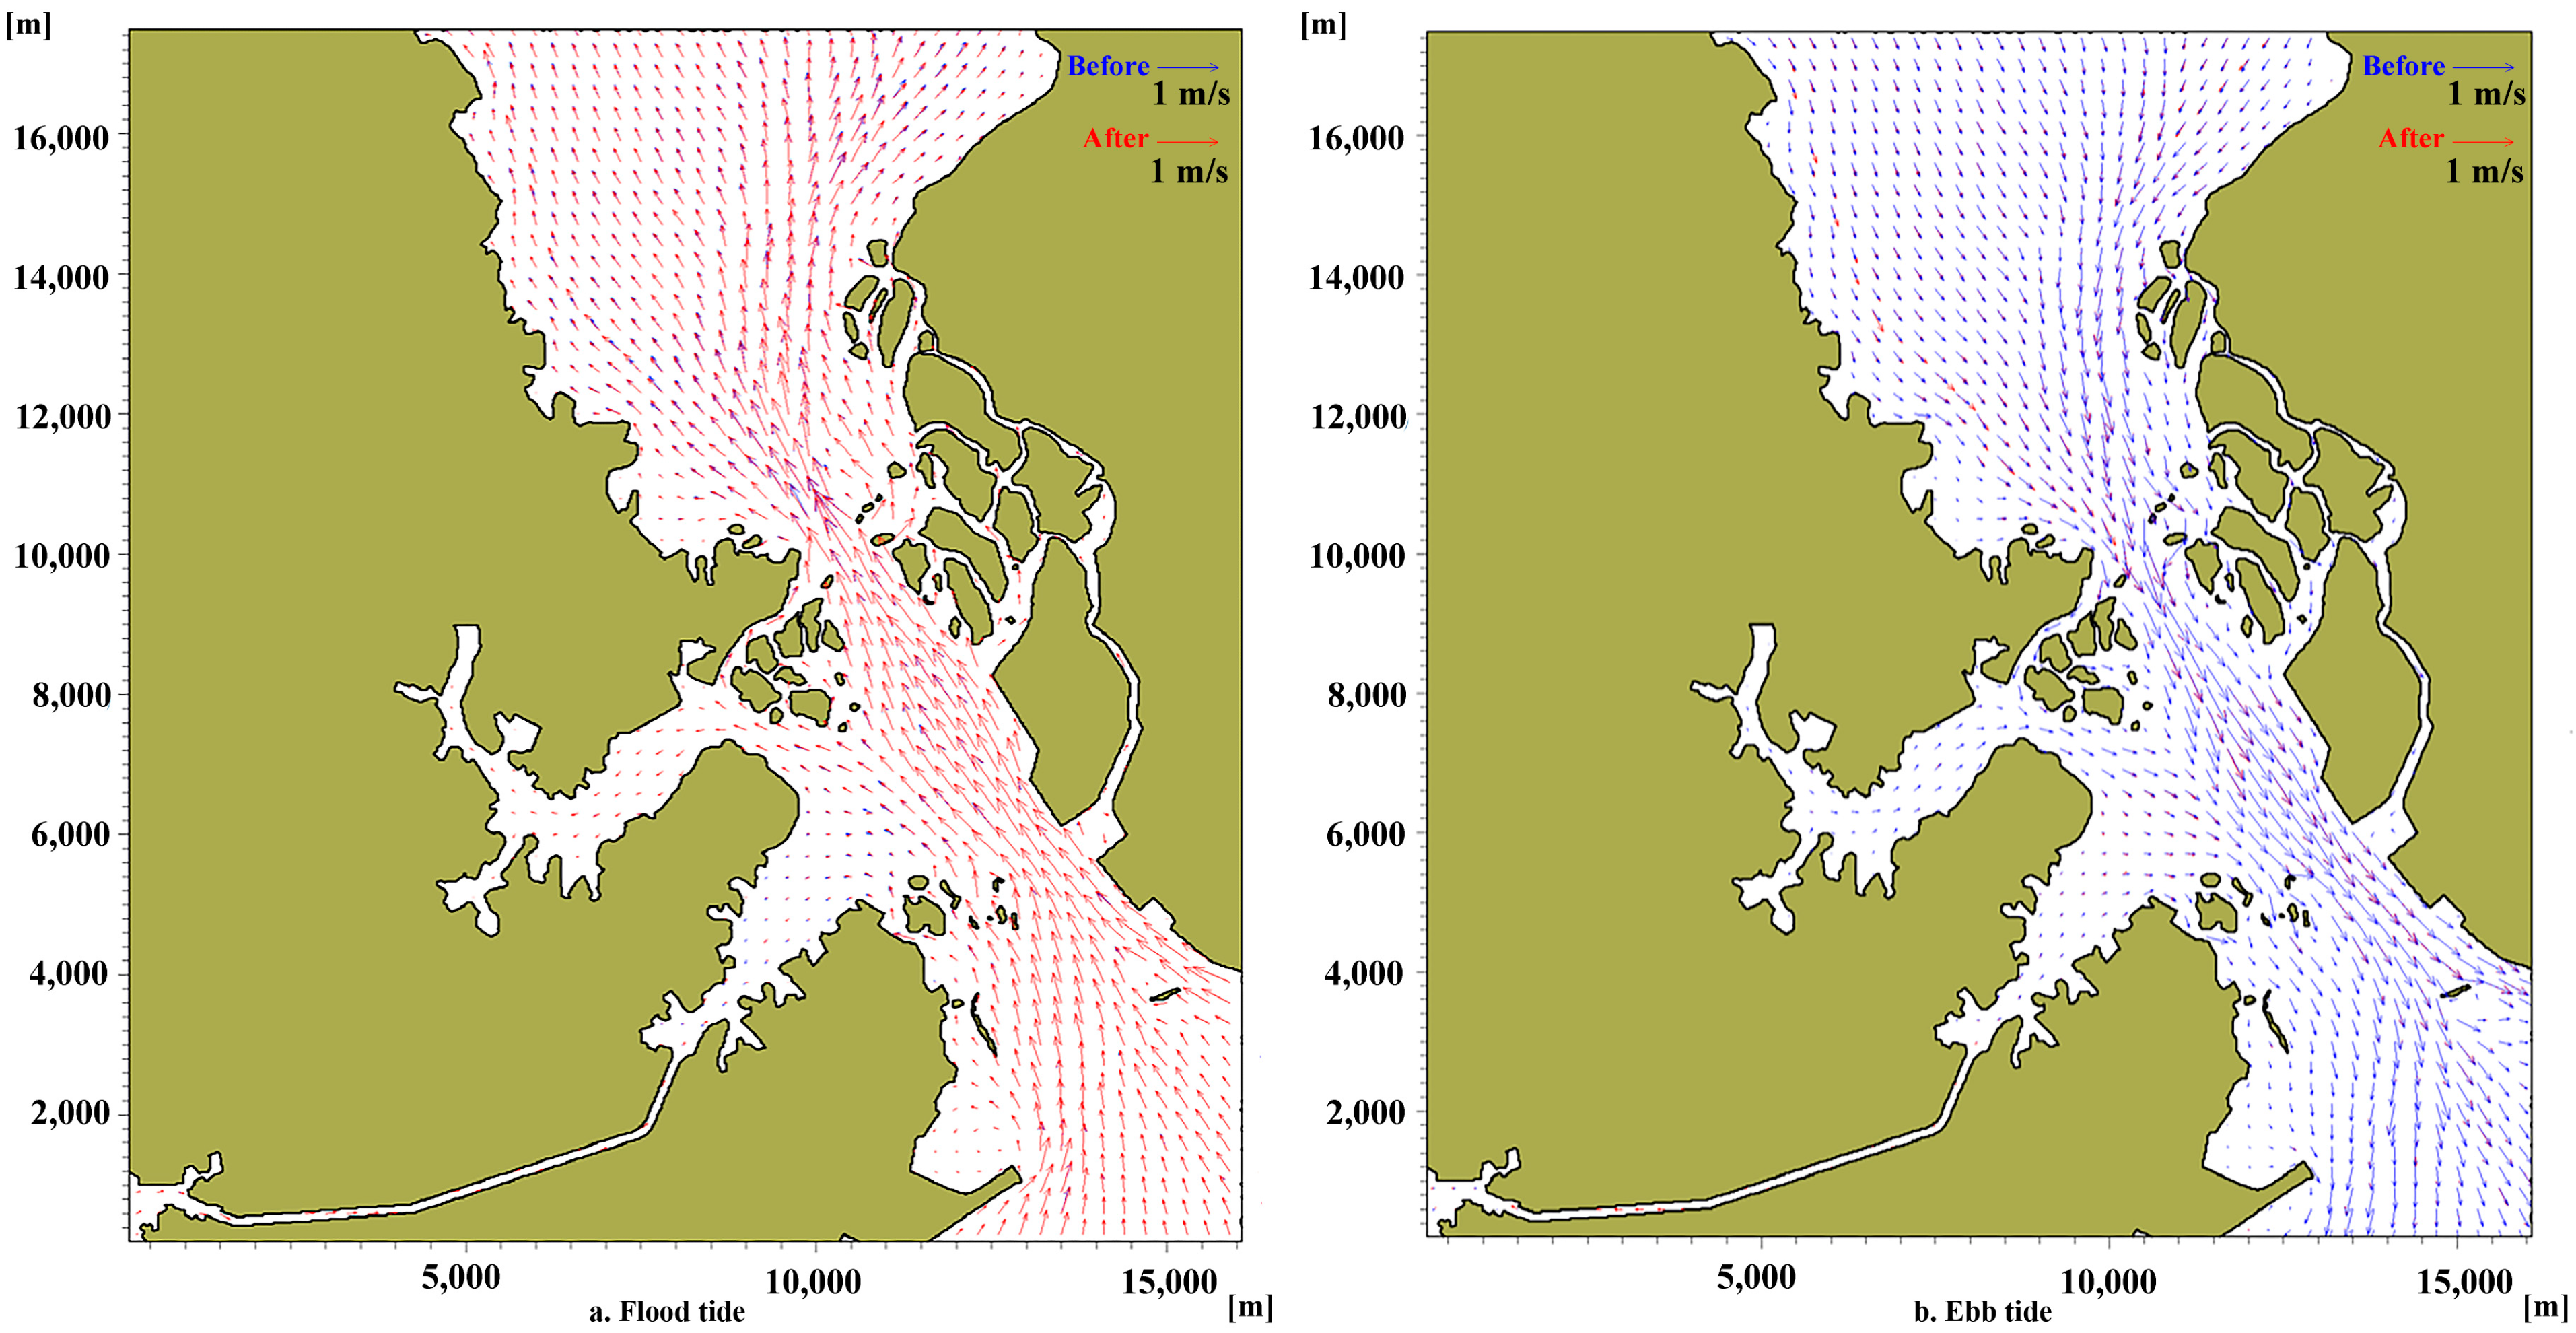
As the canal project is implemented, the variations in flow field during the spring tide are illustrated for Fangchenggang East Bay (Figure 16) and Qinzhou Bay (Figure 17). It is concluded that the canal construction would enhance the flood tide dynamics in the local excavation sections, while the overall flow field pattern in the broader sea area remains unchanged. The flow field in the central bay entrance area (i.e., marine excavation section) is strengthened, with an increased flow velocity of 0.8–1.0 m/s. In Qinzhou Bay, a pronounced flow concentration effect emerged, with currents becoming more focused along the marine excavated section of canal route. The results indicate that the flow velocity would increase in the excavated section during the flood tide while it decreases to a certain extent during the ebb tide (Figure 16).

3.3. Distribution of Maximum Flow Velocity

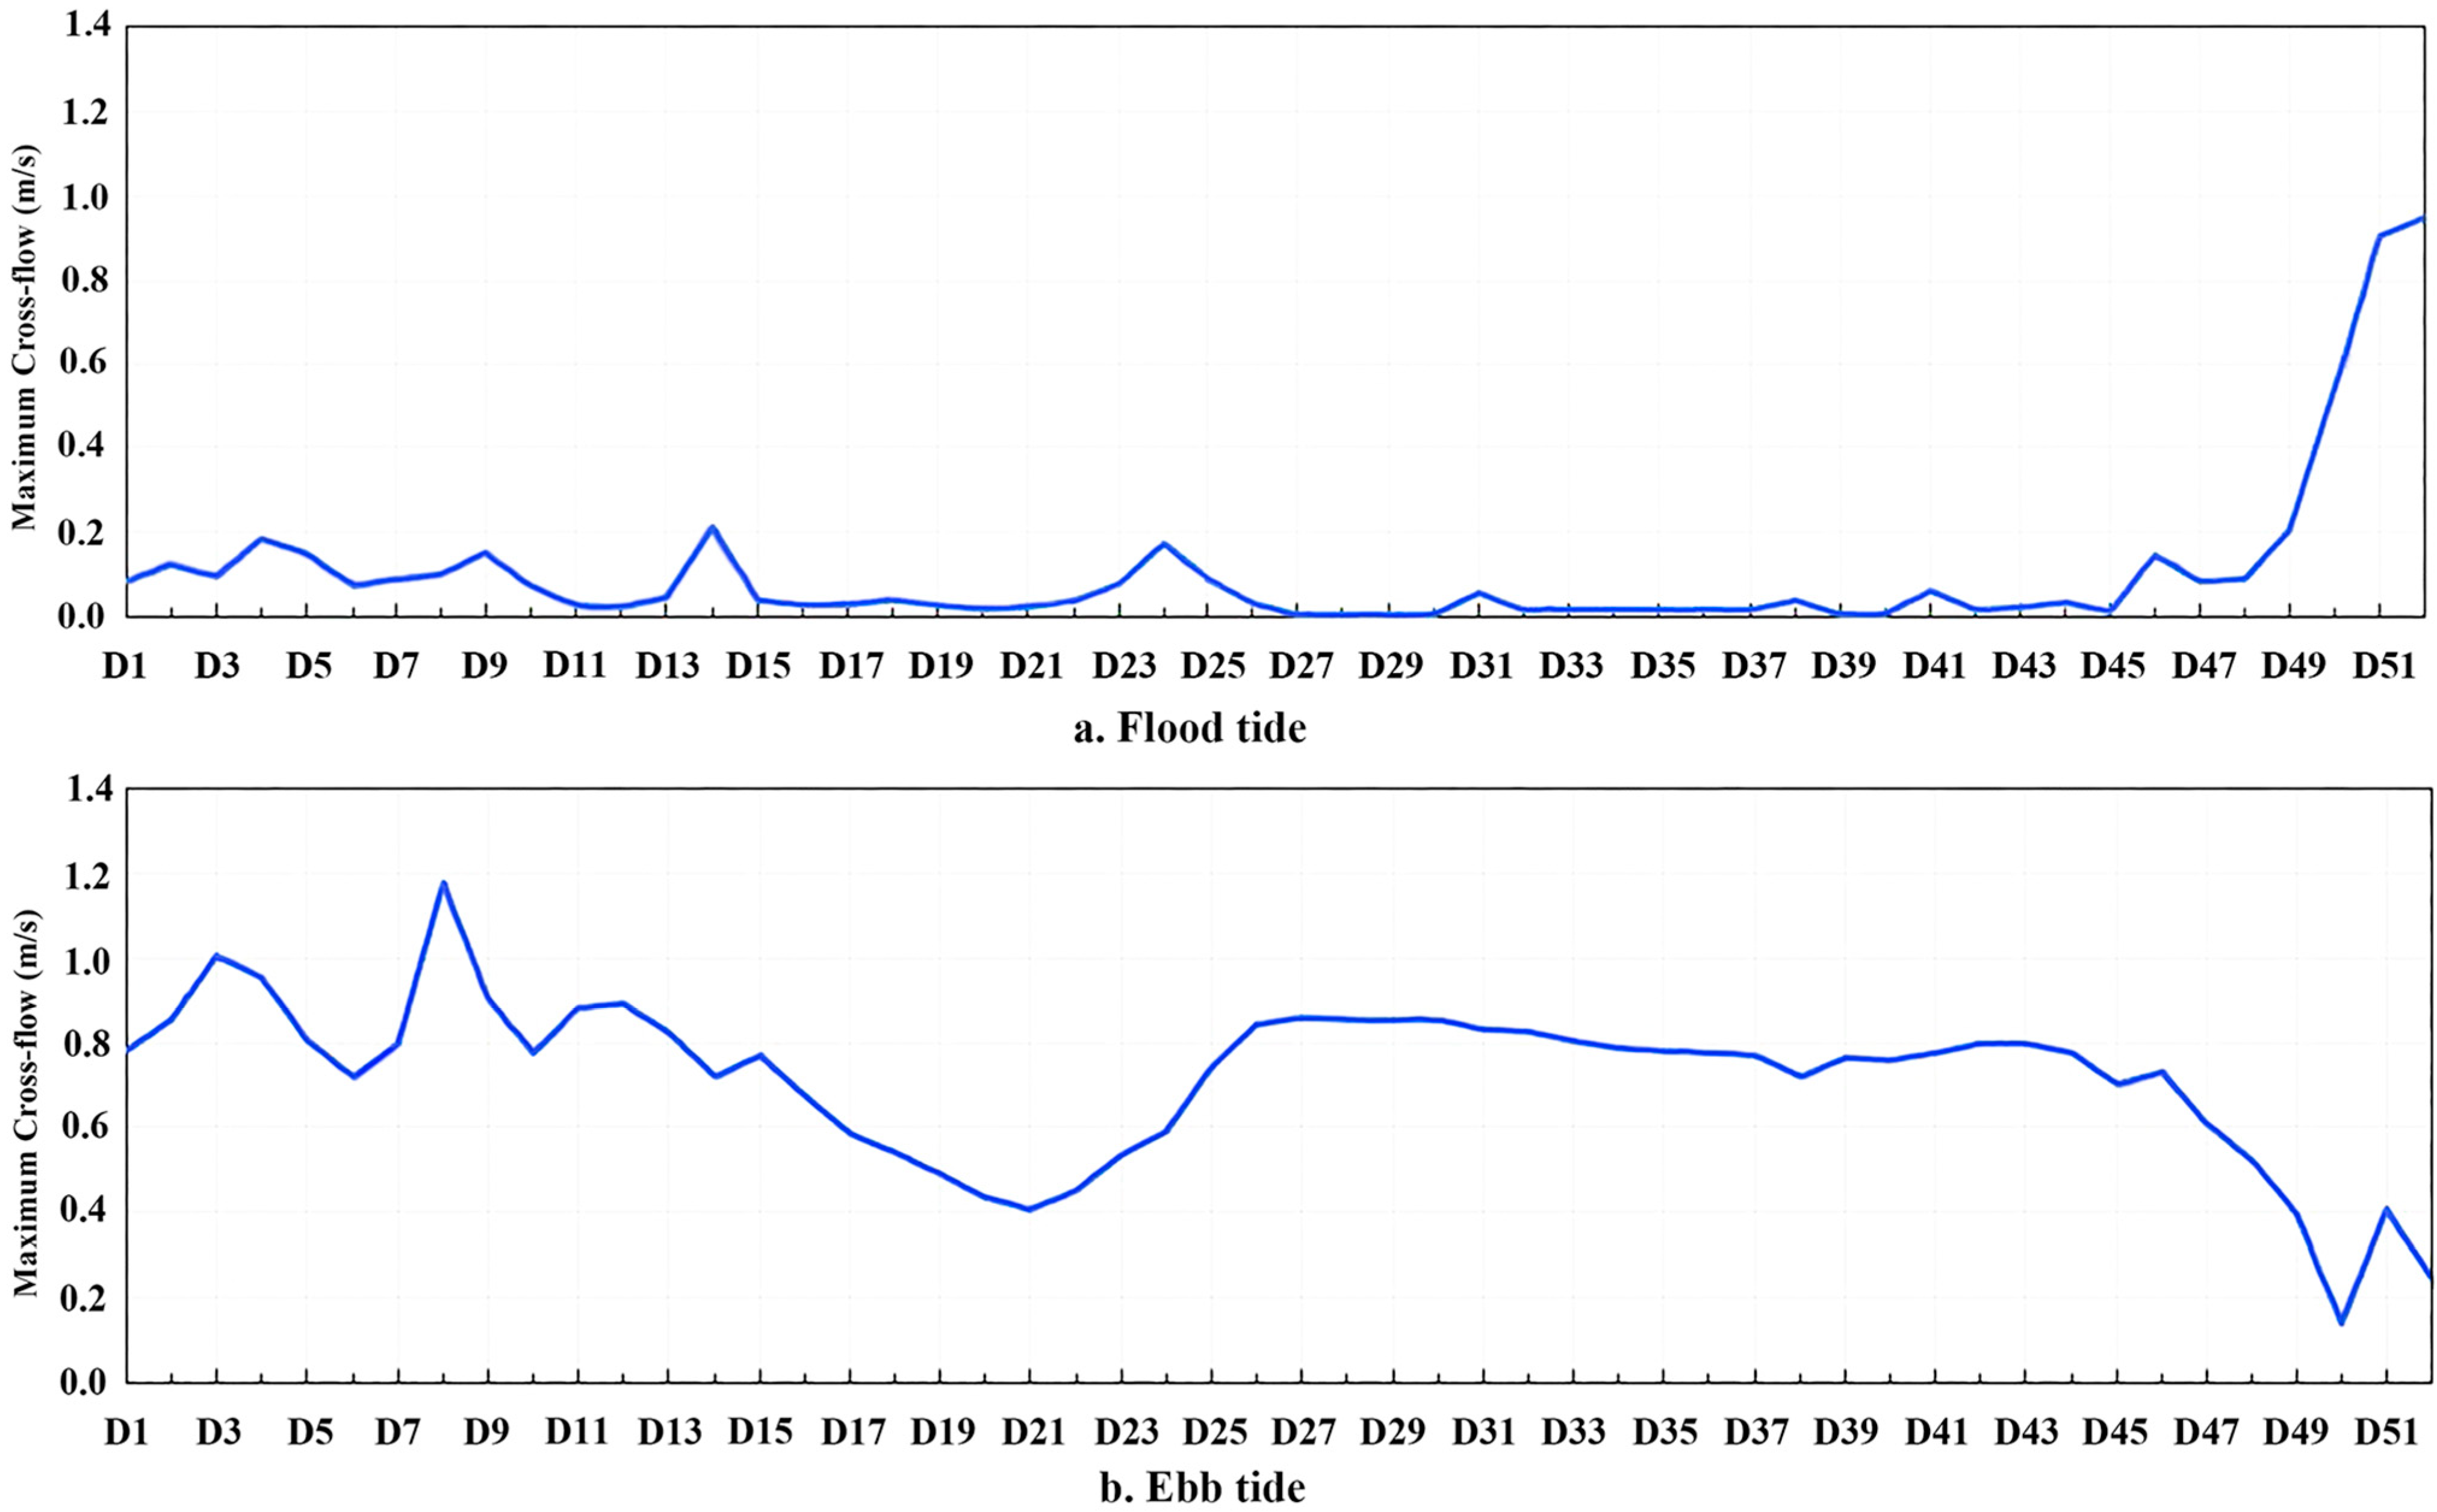
Based on the numerical simulations, the variations in maximum transverse and longitudinal flow velocity during the spring tide are shown in Figure 18. It is noted that the flow generally runs parallel with the shoreline in the marine excavation section of Qinzhou Bay. Along the marine excavation section in Fangchenggang East Bay and the land section, the maximum transverse flow velocity is less than 0.20 m/s.
Due to the dominant flood and ebb tidal currents in Qinzhou Bay, the maximum transverse current velocity occurs near the junction with the main canal channel. During the 30 h spring tide period, the maximum transverse current velocity reaches 0.95 m/s. The maximum longitudinal flow velocity is relatively moderate, ranging from 0.14 m/s to 1.18 m/s. According to the Technical Rules for Statutory Inspection of Inland Vessels (Maritime Safety Administration of the People’s Republic of China), river reaches with a flow velocity exceeding 3.5 m/s are classified as “rapid-flow reaches”. Model simulations indicate that the flow velocity in the main channel falls below 1.5 m/s.
Following the Standards for Inland Waterway Navigation (GB50139-2014) [21], the maximum allowable flow velocity at the entrance to a lock is 1.5 m/s in the longitudinal direction and 0.25 m/s in the transverse direction. Numerical simulations based on MIKE21 show that all excavated sections meet these limits of flow velocity, except for the connection segment where the transverse velocity exceeds the threshold slightly.

3.4. Comparison of Sedimentation Intensity

The SW (Spectral Wave) module of MIKE 21 was adopted in the present study. Wave data were statistically analyzed by combining short-term wave measurements from the Fangchenggang area in 2008 with hourly wave hindcasting data from the European Centre for Medium-Range Weather Forecasts (ECMWF) for 2016–2020. Waves from the SE, SSE, S and SSW directions were selected as representative combinations, which account for approximately 45% of the total wave energy. Wave conditions from the SE–S and S–SSW dominant directions were synthesized for the numerical model. The synthesized significant wave height was 0.51 m for the SE–S direction and 0.67 m for the S–SSW direction.
The sediment siltation in the project area has been numerically investigated as the canal project is implemented. It is necessary to reasonably account for the combined effects of tidal currents and waves. Based on the analysis of wave conditions in the current research domain, two representative wave directions (SE–S and S–SSW) were identified. The upstream boundary condition was defined by multi-year averaged river runoff and sediment concentration. Numerical simulations were conducted based on three sets of hydrodynamic conditions to estimate the annual average erosion–deposition patterns under normal weather conditions.
The annual average siltation intensity after project implementation is summarized in Table 4. It is noted that the siltation intensity along the canal route exhibits significant spatial heterogeneity. In the Fangchenggang East Bay Section (i.e., D1–D25), siltation intensity decreases progressively landward, with declining values from the bay entrance (D1–D4) to the bay head zone (D15–D25). In the land excavation section (D26–D40), siltation becomes generally weaker, with the main segment (D28–D37) maintaining a low intensity of 0.04–0.07 m/a. In contrast, the Qinzhou Bay section (D41–D52) shows a pattern of weak siltation at the bay entrance (D52) and bay head (D41), with significantly stronger accumulation in the mid-bay area. Siltation intensifies in the circulation zone around D48–D49 with a magnitude of 0.18–0.20 m/a, suggesting a potential sediment deposition belt. Overall, the total sediment siltation volume will be highest in the marine excavation section of Fangchenggang East Bay. The land section would experience the weakest siltation due to the uniform flow structure within the canal channel, while Qinzhou Bay features pronounced local siltation hotspots owing to the complex flow patterns.
Based on the sediment sampling and analysis in the project area, the shallow eastern region of Qinzhou Bay is predominantly composed of fine clayey silt which can be mobilized and transported under certain wave and current conditions. Analysis of sediment dynamics on the tidal flats indicates that sediments in shallow water area (<−10 m) can be mobilized and transported during strong wind waves. In summary, a certain risk of rapid sedimentation exists in the project area.

4. Discussion

4.1. Variations in Hydrodynamic Conditions Resulted by Canal Construction

The hydrodynamic impact caused by the marine evacuation section of Fangchenggang East Bay is primarily observed in two areas: namely, tidal propagation and flow field reconfiguration. The canal construction will effectively shorten the tidal path from Qinzhou to Fangchenggang, which allows tidal energy to be more directly concentrated along the main channel. Thus, the flood tide duration is decreased, particularly in the marine excavation section of Fangchenggang East Bay (D1–D25), leading to a compressed tidal cycle in the central channel region and a weakened tidal lag effect between the bay entrance and the inner bay areas. Li et al. [22] conducted a hydrodynamic and sediment transport analysis of dredging-induced channel deepening, revealing a similar trend of flow convergence toward the channel center, accompanied by increased tidal range and intensified tidal asymmetry. Likewise, Van et al. [23] reported comparable results in the Rotterdam Waterway in the Netherlands, where channel deepening led to reduced tidal damping, slightly larger tidal ranges, and increased peak tidal velocities. Hoitink et al. [24] attributed such changes in tidal propagation to reduced energy dissipation caused by bottom friction and topographic drag, which could reshape the spatial distribution of tidal energy.
It is worth noting that the tidal energy intensification is not evenly distributed across the study area. Enhanced tidal asymmetry is also observed, with ebb flow velocities generally exceeding flood flow velocities, which indicates stronger energy export during ebb phases and insufficient recovery during flood phases. This growing asymmetry may induce hydrodynamic instability across the basin [25]. Cheng et al. [26] pointed out that secondary circulation (e.g., turbulence and vertical convection) can be driven by tidal-induced mixing processes. By altering the tidal path and propagation conditions, the canal project not only improves transport efficiency but may also reshape the tidal system’s response mechanism and energy allocation pattern. These regionally interconnected effects must be carefully investigated in the planning and design of canal project.

4.2. Response Mechanism of Sediment Transport

Variations in hydrodynamic structure can directly influence the sediment transport routes, the deposition locations and the morphological patterns. Numerical simulations show that the flow velocity will increase in the land excavation section, surpassing the threshold for initiating movement of fine cohesive sediments and leading to potential local scouring. This effect is particularly notable at channel bends and contraction zones, where large velocity gradients and concentrated shear stress create zones of compressed flow, intensifying disturbance of the bed surface. The presence of tides contributes to the spread of strong currents, enhances jet diffusion, and accelerates the buildup of sediment bars [27]. Additionally, flow energy rapidly decreases in the turning zones and channel outlets. In the present study, the turning section of the land excavation section showed a significant drop in velocity and a corresponding increase in annual average siltation, highlighting the dynamic response of tidal channels to erosion and deposition. Similar findings reported by Fagherazzi et al. [28] confirmed that waves and tides play a key role in the sediment transport in estuaries. The spatiotemporal variability in sedimentation process will be governed by the dominant tidal or riverine forces of the system.
In addition, sediment siltation tends to shift gradually, especially in land–sea transition zones. Allison and Meselhe [29] found that variations in flow patterns caused by engineering interventions can systematically alter sediment pathways, leading to deposition in low-energy return flow zones. Sediment dynamics are also closely influenced by the shoreline morphology. Best [30] demonstrated that even small changes in channel geometry can lead to new zones of sediment convergence, forming stable depositional bodies. In estuarine systems, Guo et al. [31] showed that, after channel widening or bed alteration, depositional centers will shift toward areas with weaker currents and the sediment distribution tends to become more uneven. These results indicate that sediment transport is a nonlinear and highly sensitive feedback system shaped by flow patterns, bed structure and energy distribution. The complex interactions of hydrodynamics, geomorphic change and channel geometry cannot be ignored.

4.3. Sustainability and Risk Management of Canal Construction

The multifunctional role of the canal project poses new challenges to both sustainability of navigational functions and connectivity of ecological systems, as the hydrodynamic and sedimentary processes are reconfigured. First, the spatial redistribution of localized sediment accumulation increases the burden of channel maintenance, particularly at junctions and bayhead bends where dynamic siltation tends to intensify under extreme weather conditions, resulting in recurrent maintenance difficulties. Through a global shipping network topology analysis, Wan et al. [32] demonstrated that blockages at key channel nodes can significantly reduce navigational connectivity and trigger cascading effects across the global maritime system. Shoreline stability is also susceptible to dredging after civil engineering constructions. Temmerman et al. [33] highlighted that, in high-energy deltaic environments, canal deepening or widening without adequate hydrodynamic control can sharply increase alongshore shear stress, potentially causing tidal flat retreat and shoreline instability. Similar patterns were observed in the current study area, where canal construction intensified velocity gradients along the bayhead shoreline, reduced coastal stability and posed potential risks on habitat degradation. Canal constructions may exert further impact on the shipping efficiency. Zhang et al. [34] noted that large-draft vessels navigating in tidal channels often experience delays while waiting for suitable tidal windows due to tidal fluctuations. The extent to which tidal systems constrain navigation depends heavily on canal design, and optimal canal planning should consider the alignment between vessel characteristics and tidal characteristics.
From an ecological standpoint, canal construction may sever existing intertidal–subtidal habitat linkages and disrupt the benthic ecological continuum. Barbier et al. [35] pointed out that port and waterway projects frequently lead to ecological fragmentation, especially in narrow tidal channel zones. Kemper et al. [36] emphasized that ecological connectivity should be a major concern in the engineering design; otherwise, long-term risks such as biodiversity loss and population isolation may arise. The construction area locates at the estuary of Qinzhou Bay, which contains mangrove ecological wetlands and abundant biological resources. Canal construction may damage the nearshore biological habitats and fundamentally alter the regional ecosystem. The project implementation will cause short-term sediment disturbances in the estuary, affecting the predation and reproduction of aquatic organisms. While canal construction enhances shipping capacity, it also introduces regional risks such as shoreline erosion, channel siltation and ecological fragmentation from a long-term perspective. These impacts call for an integrated approach that balances navigational performance, ecological protection and maintenance efficiency [37].
It is noteworthy that this study primarily assesses the short-term impacts of canal construction on hydrodynamics and sediment processes but does not account for the potential long-term effects under a changing climate, such as sea-level rise and increased frequency of extreme weather events. These factors can significantly alter the regional sediment dynamics and channel stability. For example, sea-level rise may elevate the baseline water level, thereby weakening tidal exchange and increasing the risk of upstream sedimentation. More frequent storm events could enhance sediment resuspension and transport, thus accelerating the shoreline erosion and local deposition–erosion patterns. Future studies should incorporate the climate changes (i.e., projected sea-level rise and stochastic storm events) into numerical models to assess the environmental adaptability of canal construction properly.

5. Conclusions

The construction of canals will exert an inevitable impact on the hydro-morphodynamic processes in coastal tidal channels. The Fangchenggang Canal is known as an extension line of Pinglu Canal, which will contribute to the efficient transportation and logistics system in southwest China. A two-dimensional numerical model based on MIKE21 has been established to systematically analyze the hydrodynamic disturbances caused by the canal construction. The results indicate that the canal construction will effectively shorten the tidal propagation pathway, enhancing the hydrodynamic conditions within the main channel. The regional tidal lag effect can be weakened, leading to a systemic adjustment in tidal characteristics. Moreover, the current velocity in the deep channel increases significantly, forming a more concentrated flow corridor. In contrast, certain zones exhibit altered flow directions and vortex formation, suggesting spatial reorganization and restructuring of the flow field. These variations in hydrodynamic structure further trigger responses and evolutions in sediment transport processes. The present study reveals that the canal construction intensifies bed shear stress in the land excavation section, resulting in potential bed scouring. Low-velocity areas such as channel bends and connection zones may emerge as new depositional sites with significant sediment accumulation. Sediment transport pathways shift from the upper bay regions toward connecting sections, forming an alternating pattern of erosion and deposition, which reflects the reconfiguration of transport chains and system sensitivity.
The present study contributes to a deeper understanding of the hydro-morphodynamic processes influenced by canal construction in coastal zones. The different hydrodynamic response features between land-excavated and marine-excavated sections were investigated quantitatively through numerical modelling, which could provide scientific references for other canal projects.

Author Contributions

H.F.: data curation, formal analysis, resources, writing—original draft. X.C.: formal analysis, methodology, validation, writing—original draft. P.Z.: software, visualization, writing—review and editing. Z.J. (Zhonglian Jiang): conceptualization, formal analysis, funding acquisition, writing—review and editing. Z.J. (Zhefei Jin): data curation, validation, writing—review and editing. All authors have read and agreed to the published version of the manuscript.

Funding

This research was supported by the National Natural Science Foundation of China (52071250), National Key R&D Program of China (2018YFB1600404) and the Fangchenggang Supporting Special Project of the “Guangxi Beibu Gulf Port Master Plan” (No. 032207-001).

Data Availability Statement

The data that support the findings of this study are available from the corresponding author upon reasonable request.

Acknowledgments

The authors are grateful for the technical support provided by the Department of Transport of Guangxi Zhuang Autonomous Region.

Conflicts of Interest

The authors declare no conflicts of interest.

References

  1. Mutema, M.; Dhavu, K. Review of factors affecting canal water losses based on a meta-analysis of worldwide data. Irrig. Drain. 2022, 71, 559–573. [Google Scholar] [CrossRef]
  2. Han, Z.; Yin, D.; Zhao, R.; Liu, Z.; Cheng, R.; Lin, G.; Jia, H. The Ecological Effect of Ship Canals on Wetlands. Water 2024, 16, 3324. [Google Scholar] [CrossRef]
  3. Ahmad, I.; Wang, X.; Waseem, M.; Zaman, M.; Aziz, F.; Khan, R.Z.N.; Ashraf, M. Flood management, characterization and vulnerability analysis using an integrated RS-GIS and 2D hydrodynamic modelling approach: The case of Deg Nullah, Pakistan. Remote Sens. 2022, 14, 2138. [Google Scholar] [CrossRef]
  4. Huang, S.; Gan, Y.; Chen, N.; Wang, C.; Zhang, X.; Li, C.; Horton, D.E. Urbanization enhances channel and surface runoff: A quantitative analysis using both physical and empirical models over the Yangtze River basin. J. Hydrol. 2024, 635, 131194. [Google Scholar] [CrossRef]
  5. Wang, C.; Cai, L.; Wu, Y.; Ouyang, Y. Numerical simulation of the impact of an integrated renovation project on the Maowei Sea hydrodynamic environment. Sci. Rep. 2021, 11, 17059. [Google Scholar] [CrossRef] [PubMed]
  6. Siemes, R.W.A.; Duong, T.M.; Willemsen, P.W.J.M.; Borsje, B.W.; Hulscher, S.J.M.H. Morphological response of a highly engineered estuary to altering channel depth and restoring wetlands. J. Mar. Sci. Eng. 2023, 11, 2150. [Google Scholar] [CrossRef]
  7. Franzen, M.O.; Fernandes, E.H.; Siegle, E. Impacts of coastal structures on hydro-morphodynamic patterns and guidelines towards sustainable coastal development: A case studies review. Reg. Stud. Mar. Sci. 2021, 44, 101800. [Google Scholar] [CrossRef]
  8. Ibrahim, O.; El-Geziry, T.M.; Khedr, A.; Alam El-Din, K. Impacts of recent development processes on the temporal and spatial sea-level variations along the Suez Canal. Reg. Stud. Mar. Sci. 2023, 66, 103120. [Google Scholar] [CrossRef]
  9. Pan, H.; Gan, M.; Xu, T.; Wei, Z. A century of tidal evolution around the Panama Canal. Cont. Shelf Res. 2024, 283, 105357. [Google Scholar] [CrossRef]
  10. Anthony, E.J. Wave influence in the construction, shaping and destruction of river deltas: A review. Mar. Geol. 2015, 361, 53–78. [Google Scholar] [CrossRef]
  11. Lin, H.-Y.; Cooke, S.J.; Wolter, C.; Young, N.; Bennett, J.R. On the conservation value of historic canals for aquatic ecosystems. Biol. Conserv. 2020, 251, 108764. [Google Scholar] [CrossRef]
  12. Mel, R.A.; Viero, D.P.; Carniello, L.; D’alpaos, L. Multipurpose use of artificial channel networks for flood risk reduction: The case of the waterway Padova–Venice (Italy). Water 2020, 12, 1609. [Google Scholar] [CrossRef]
  13. González-Ortegón, E.; Moreno-Andrés, J. Anthropogenic modifications to estuaries facilitate the invasion of non-native species. Processes 2021, 9, 740. [Google Scholar] [CrossRef]
  14. Rossi, V.M.; Kim, W.; López, J.L.; Edmonds, D.; Geleynse, N.; Olariu, C.; Steel, R.J.; Hiatt, M.; Passalacqua, P. Impact of tidal currents on delta-channel deepening, stratigraphic architecture, and sediment bypass beyond the shoreline. Geology 2016, 44, 927–930. [Google Scholar] [CrossRef]
  15. Ralston, D.K.; Talke, S.; Geyer, W.R.; Al-Zubaidi, H.A.M.; Sommerfield, C.K. Bigger tides, less flooding: Effects of dredging on barotropic dynamics in a highly modified estuary. J. Geophys. Res. Oceans 2019, 124, 196–211. [Google Scholar] [CrossRef]
  16. Martín-Llanes, G.; López-Ruiz, A. On the assessment of channel deepening impacts in micro-meso tidal estuaries: A systematic analysis. Ocean Model. 2025, 196, 102552. [Google Scholar] [CrossRef]
  17. Huang, L.; Li, Y.; Han, J.; Sun, Z.; Yang, Y. Influence of change in river discharge and tides on stagnation points in the Yangtze River estuary. Adv. Water Sci. 2015, 26, 572–578. [Google Scholar] [CrossRef]
  18. Bain, R.L.; Hale, R.P.; Goodbred, S.L. Flow reorganization in an anthropogenically modified tidal channel network: An example from the southwestern ganges-Brahmaputra-Meghna delta. J. Geophys. Res. Earth Surf. 2019, 124, 2141–2159. [Google Scholar] [CrossRef]
  19. Luo, W.; Shen, F.; He, Q.; Cao, F.; Zhao, H.; Li, M. Changes in suspended sediments in the Yangtze River Estuary from 1984 to 2020: Responses to basin and estuarine engineering constructions. Sci. Total. Environ. 2022, 805, 150381. [Google Scholar] [CrossRef]
  20. Feng, H.; Jin, Z.; Chu, X.; Wang, W.; Yao, H. Route Selection for the Extension Line of Pinglu Canal: A Comparative Study. Land 2025, 14, 1266. [Google Scholar] [CrossRef]
  21. GB50139-2014; Standards for Inland Waterway Navigation. China Communications Press: Beijing, China, 2014. (In Chinese)
  22. Li, W.; Zhang, Y.; Hu, P.; Chen, F.; He, Z. Evolutions of hydrodynamics and sediment transport pattern in the Qiantang Estuary (China) in response to multidecadal embankment constructions. Estuar. Coast. Shelf Sci. 2024, 309, 108965. [Google Scholar] [CrossRef]
  23. van Rijn, L.; Grasmeijer, B.; Perk, L. Effect of channel deepening on tidal flow and sediment transport: Part I—Sandy channels. Ocean Dyn. 2018, 68, 1457–1479. [Google Scholar] [CrossRef]
  24. Hoitink, A.J.F.; Jay, D.A. Tidal river dynamics: Implications for deltas. Rev. Geophys. 2016, 54, 240–272. [Google Scholar] [CrossRef]
  25. Konkol, A.; Schwenk, J.; Katifori, E.; Shaw, J.B. Interplay of river and tidal forcings promotes loops in coastal channel networks. Geophys. Res. Lett. 2022, 49, e2022GL098284. [Google Scholar] [CrossRef]
  26. Cheng, P.; de Swart, H.E.; Valle-Levinson, A. Role of asymmetric tidal mixing in the subtidal dynamics of narrow estuaries. J. Geophys. Res. Oceans 2013, 118, 2623–2639. [Google Scholar] [CrossRef]
  27. Leonardi, N.; Canestrelli, A.; Sun, T.; Fagherazzi, S. Effect of tides on mouth bar morphology and hydrodynamics. J. Geophys. Res. Oceans 2013, 118, 4169–4183. [Google Scholar] [CrossRef]
  28. Fagherazzi, S.; Edmonds, D.A.; Nardin, W.; Leonardi, N.; Canestrelli, A.; Falcini, F.; Jerolmack, D.J.; Mariotti, G.; Rowland, J.C.; Slingerland, R.L. Dynamics of river mouth deposits. Rev. Geophys. 2015, 53, 642–672. [Google Scholar] [CrossRef]
  29. Allison, M.A.; Meselhe, E.A. The use of large water and sediment diversions in the lower Mississippi River (Louisiana) for coastal restoration. J. Hydrol. 2010, 387, 346–360. [Google Scholar] [CrossRef]
  30. Best, J. The fluid dynamics of river dunes: A review and some future research directions. J. Geophys. Res. Earth Surf. 2005, 110, 1–21. [Google Scholar] [CrossRef]
  31. Guo, L.; van der Wegen, M.; Roelvink, J.A.; He, Q. The role of river flow and tidal asymmetry on 1-D estuarine morphodynamics. J. Geophys. Res. Earth Surf. 2014, 119, 2315–2334. [Google Scholar] [CrossRef]
  32. Wan, Z.; Su, Y.; Li, Z.; Zhang, X.; Zhang, Q.; Chen, J. Analysis of the impact of Suez Canal blockage on the global shipping network. Ocean Coast. Manag. 2023, 245, 106868. [Google Scholar] [CrossRef]
  33. Temmerman, S.; Meire, P.; Bouma, T.J.; Herman, P.M.J.; Ysebaert, T.; De Vriend, H.J. Ecosystem-based coastal defence in the face of global change. Nature 2013, 504, 79–83. [Google Scholar] [CrossRef] [PubMed]
  34. Zhang, B.; Zheng, Z.; Wang, D. A model and algorithm for vessel scheduling through a two-way tidal channel. Marit. Policy Manag. 2019, 47, 188–202. [Google Scholar] [CrossRef]
  35. Barbier, E.B.; Hacker, S.D.; Kennedy, C.; Koch, E.W.; Stier, A.C.; Silliman, B.R. The value of estuarine and coastal ecosystem services. Ecol. Monogr. 2011, 81, 169–193. [Google Scholar] [CrossRef]
  36. Kemper, J.T.; Thaxton, R.D.; Rathburn, S.L.; Friedman, J.M.; Mueller, E.R.; Scott, M.L. Sediment-ecological connectivity in a large river network. Earth Surf. Process. Landf. 2021, 47, 639–657. [Google Scholar] [CrossRef]
  37. Carse, A.; Lewis, J.A. Toward a political ecology of infrastructure standards: Or, how to think about ships, waterways, sediment, and communities together. Environ. Plan. A Econ. Space 2016, 49, 9–28. [Google Scholar] [CrossRef]
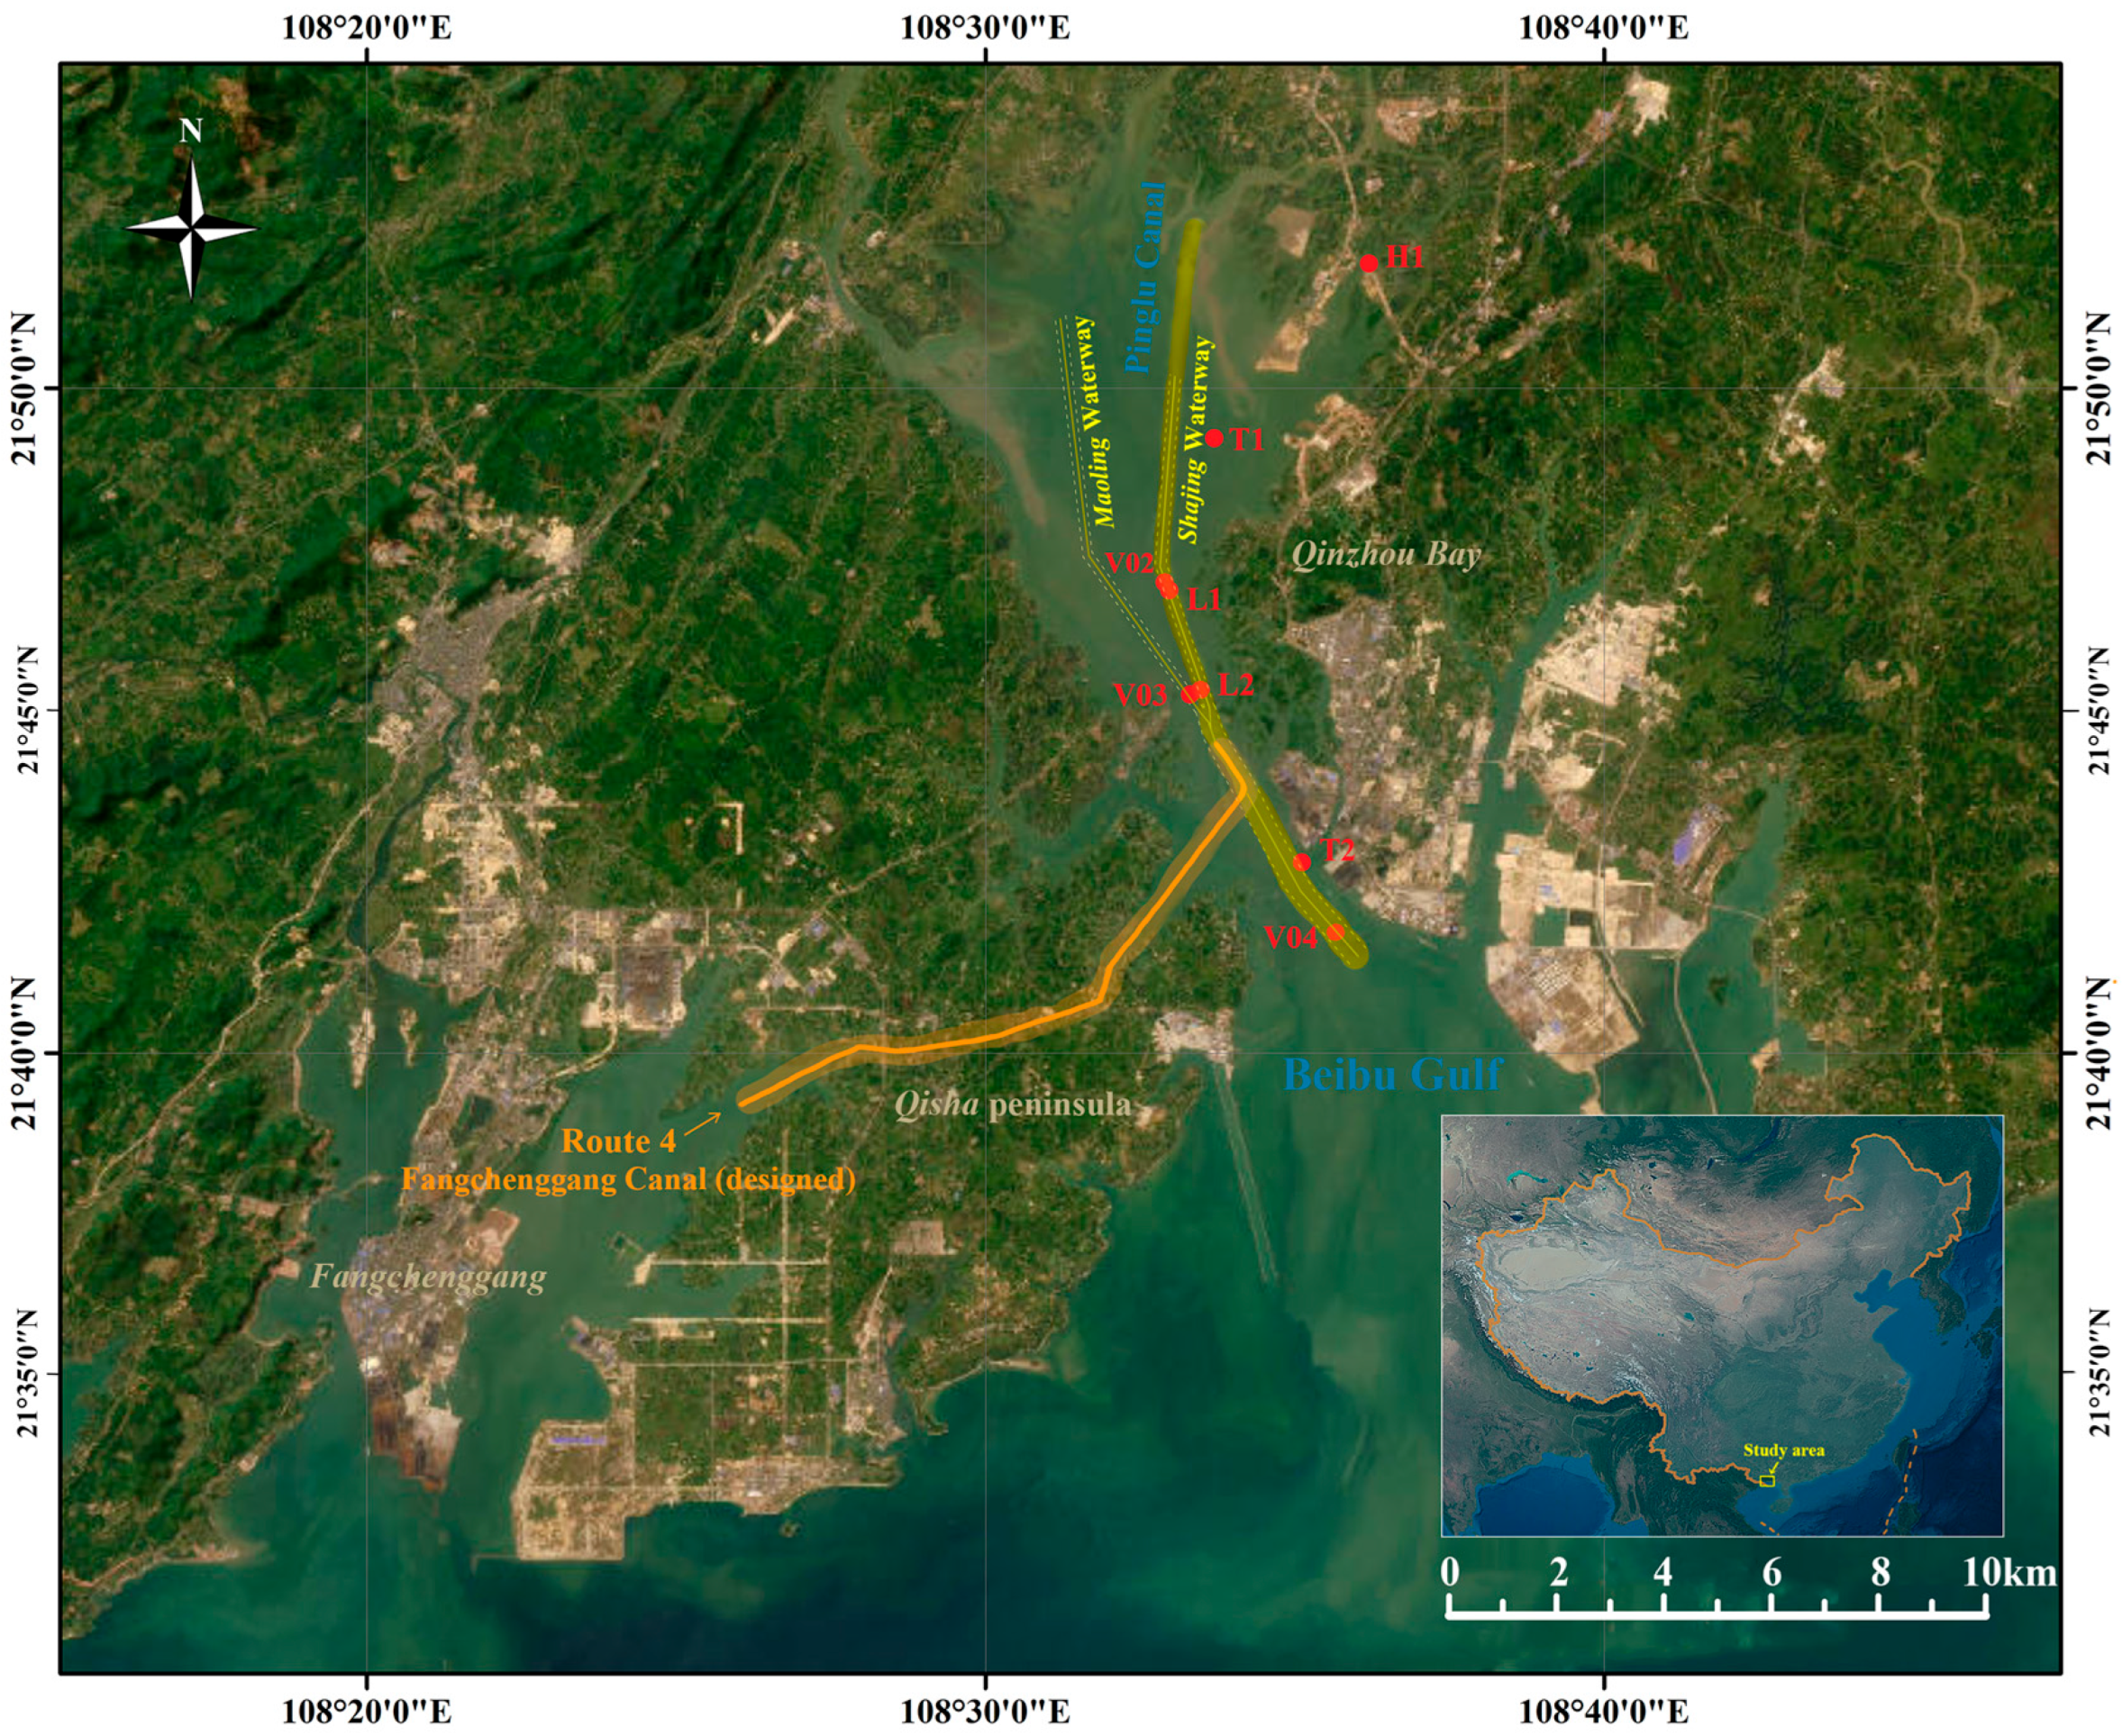
Figure 1. Schematic diagram of the Fangchenggang Canal route and hydrological stations.
Jmse 13 02048 g001
Figure 2. Implementation flowchart of the sediment transportation module.
Jmse 13 02048 g002
Figure 3. Validation of tidal level at stations T1–T2 during the spring tide of flood season.
Jmse 13 02048 g003
Figure 4. Validation of tidal level at stations T1–T2 during the neap tide of flood season.
Jmse 13 02048 g004
Figure 5. Validation of flow velocity at stations V02~V04 during the spring tide of flood season.
Jmse 13 02048 g005
Figure 6. Validation of flow velocity at stations V02~V04 during the neap tide of flood season.
Jmse 13 02048 g006
Figure 7. Temporal variations of sediment concentration for V02 and V03 during the spring tide.
Jmse 13 02048 g007
Figure 8. Tidal flow field at flood peak during the spring tide.
Jmse 13 02048 g008
Figure 9. Tidal flow field at ebb peak during the spring tide.
Jmse 13 02048 g009
Figure 10. Ebb tide flow field during spring tide in Qinzhou Bay.
Jmse 13 02048 g010
Figure 11. Ebb tide flow field during spring tide in Fangchenggang East Bay.
Jmse 13 02048 g011
Figure 12. Layout of the characteristic points along the canal route.
Jmse 13 02048 g012
Figure 13. Flood and ebb flow fields during spring tide at the land–sea junction.
Jmse 13 02048 g013
Figure 14. Flood and ebb tidal fields during spring tide in Fangchenggang East Bay.
Jmse 13 02048 g014
Figure 15. Flood and ebb tidal fields during spring tide in Qinzhou Bay. (The purple dash line represents the navigation channel route.)
Jmse 13 02048 g015
Figure 16. Comparison of flow field during the spring tide in Fangchenggang East Bay.
Jmse 13 02048 g016
Figure 17. Comparison of flow field during the spring tide in Qinzhou Bay.
Jmse 13 02048 g017
Figure 18. Longitudinal distribution of maximum flow velocity during spring tide.
Jmse 13 02048 g018
Table 1. Flow velocity and direction during spring tide in the land excavation section.
PointMaximum Flood TideMaximum Ebb TideAverage Flow Velocity
(m/s)
Flow Velocity (m/s)Flow Direction (Degree)Flow Velocity (m/s)Flow Direction
(Degree)
D260.761010.842810.35
D270.77850.862650.36
D280.77850.862650.36
D290.77850.852650.36
D300.79850.862650.37
D310.80750.842540.37
D320.80710.832510.37
D330.78710.802510.37
D340.77710.792510.37
D350.77710.782510.37
D360.77710.782510.37
D370.77710.772510.37
D380.72460.7322250.35
D390.76220.762020.38
D400.76220.762020.38
Table 2. Flow velocity and direction during spring tide in the Fangchenggang East Bay.
PointMaximum Flood TideMaximum Ebb TideAverage Flow Velocity (m/s)
Flow Velocity (m/s)Flow Direction (Degree)Flow Velocity (m/s)Flow Direction (Degree)
D10.63370.842160.47
D20.57360.912100.46
D30.81271.082150.58
D40.96360.902220.59
D50.82400.592180.47
D60.72350.502110.42
D70.80270.662020.52
D81.18321.012080.78
D90.91420.702220.54
D100.78330.552150.42
D110.92340.482130.40
D120.89350.482140.39
D130.83360.412160.36
D140.75460.412340.31
D150.77600.382410.30
D160.68600.342410.27
D170.59600.312390.25
D180.54600.352370.22
D190.49590.392380.19
D200.43600.392410.18
D210.41600.402400.17
D220.45590.432410.19
D230.54600.482330.21
D240.60720.612580.25
D250.741070.712900.31
Table 3. Flow velocity and direction during spring tide in Qinzhou Bay.
PointMaximum Flood TideMaximum Ebb TideAverage Flow Velocity (m/s)
Flow Velocity (m/s)Flow Direction (Degree)Flow Velocity (m/s)Flow Direction (Degree)
D410.78280.62280.35
D420.80400.64390.36
D430.80400.69400.36
D440.78400.65400.32
D450.70400.65410.30
D460.66320.73410.25
D470.462210.61390.25
D480.472190.52400.23
D490.28350.40490.19
D500.543150.491450.31
D510.833280.991540.50
D520.963241.121420.57
Table 4. Annual average sedimentation intensity.
PointSedimentation Intensity
(m/a)
PointSedimentation Intensity
(m/a)
PointSedimentation Intensity
(m/a)
D10.28D260.07D410.10
D20.27D270.07D420.12
D30.33D280.07D430.13
D40.32D290.06D440.09
D50.28D300.06D450.09
D60.23D310.06D460.13
D70.28D320.05D470.13
D80.29D330.05D480.18
D90.29D340.05D490.20
D100.20D350.04D500.16
D110.15D360.05D510.13
D120.14D370.06D520.05
D130.14D380.07
D140.14D390.08
D150.13D400.09
D160.12
D170.12
D180.12
D190.12
D200.11
Disclaimer/Publisher’s Note: The statements, opinions and data contained in all publications are solely those of the individual author(s) and contributor(s) and not of MDPI and/or the editor(s). MDPI and/or the editor(s) disclaim responsibility for any injury to people or property resulting from any ideas, methods, instructions or products referred to in the content.