1. Introduction
The International Maritime Organization’s (IMO) measures to reduce the environmental impact of ship operations pushed the maritime industry, designers and researchers to investigate different strategies to reduce the emissions—starting from the design measures such as the optimization of hull form, the introduction of energy saving devices (for example gate rudders), air lubrication, wind-assisted propulsion, use of alternative fuels, etc.—to operational measures such as slow steaming, route optimization, voyage planning, weather routing, and optimized ship and cargo handling. Within these environmental and regulatory frames, the ship behaviour in rough sea is seen as crucial at the design level, becoming fundamental for the hull form optimization. Different numerical methods can be used, from linearized potential-flow methods solved in frequency domain, to fully nonlinear RANSE solvers. In recent years, there were many joint efforts from the scientific community regarding the benchmarking of different methods for the prediction of ship motions and/or wave-induced loads—shear force and vertical bending moments—examined by potential flow frequency domain methods, RANSE simulations and experiments [
1,
2,
3,
4,
5]. Several comparative studies have been conducted to verify various experimental and numerical techniques for the added resistance analysis [
6,
7,
8,
9,
10]. Liu and Papanikolaou [
11], based on the previous benchmarks and discrepancies found in their database consisting of experimental results for about 130 ships of different types and sizes and about 3000 data points, discussed the issues connected with the state-of-the-art methods for the prediction of the added resistance. Authors discussed the problems rising from potential flow software, CFD simulations and experimental data, pointing out the complexity and computational time of the CFD simulations which could give the correct results only if expert users are running them. The shortcomings of the experimental approach are the cost, the impossibility to conduct the experiment at the early design stage, and uncertainties in measuring the resistance in short waves. Authors pointed out the need for readily useable engineering methods in the early design stage, publishing in [
11,
12,
13,
14] the developed empirical method for added resistance prediction in regular waves of arbitrary heading.
The present work follows the trend of comparative analysis of different numerical tools for motions and added resistance prediction. A modern RoPax ferry operating in Greek archipelago is selected as the test case. Strip theory-based software ShipX, 3D BEM potential flow method software Hydrostar, and 3D RANS CFD virtual towing tank have been used to calculate the motions and added resistance in head and beam seas.
RANS simulations are performed using the open-source CFD code OpenFOAM [
15] and using the forcing zones for wave generation. The configuration of the simulations (e.g., domain size, mesh) follows the spirit of the LincoSim virtual towing tank [
16], an application developed within the framework of two European projects (LINCOLN and e-SHyIPS) to enable the preparation, execution, and analysis of naval CFD simulations on High-Performance Computing (HPC) resources. The LincoSim approach relies on the standardization of inputs and outputs as well as on the full automation of the workflow, thereby minimizing the level of CFD and HPC expertise required by the end user.
The simulated conditions—vessel speed, wave periods and wave height—have been selected considering the realistic operational profile of the vessel under investigation (a medium-sized Ro-Pax ferry managed by Levante Ferries) working along routes within the Ionian Sea. The CFD seakeeping and ShipX time-domain simulations are performed for six representative wave periods in head and beam seas at the constant wave height of 3 m, corresponding to the extreme wave conditions in the Eastern Mediterranean Sea. ShipX and Hydrostar calculations in the frequency domain are performed for the unit wave amplitude in the wave frequency range from 0.2 to 2.0 rad/s. For the comparison of the methods, all results are given in the form of RAOs.
To visualize the effect of the wavelength on the added resistance mean values, a snapshot of three cycles of time series obtained from LincoSim are given, showing wave elevation, heave, pitch, roll, and added resistance. The comparison of the results shows that potential-flow methods are very efficient and reliable tools, suitable for the massive calculations in the first stages of the project. Results obtained by 3D BEM potential-flow and high-fidelity RANSE modeling, which take into account the interaction of ship and incident wave systems, have significantly different trends compared to 2D methods for added resistance and roll in beam waves.
2. Problem Formulation and Software Description
The considered RoPax vessel, managed by the Greek operator Levante Ferries, operates daily routes from the mainland port of Killini to the islands of Zakynthos, Kefalonia, and Ithaca [
17]. Her longitudinal profile is shown in
Figure 1, and the principal characteristics are listed in
Table 1. The operational profile, provided by Levante Ferries, is summarized in
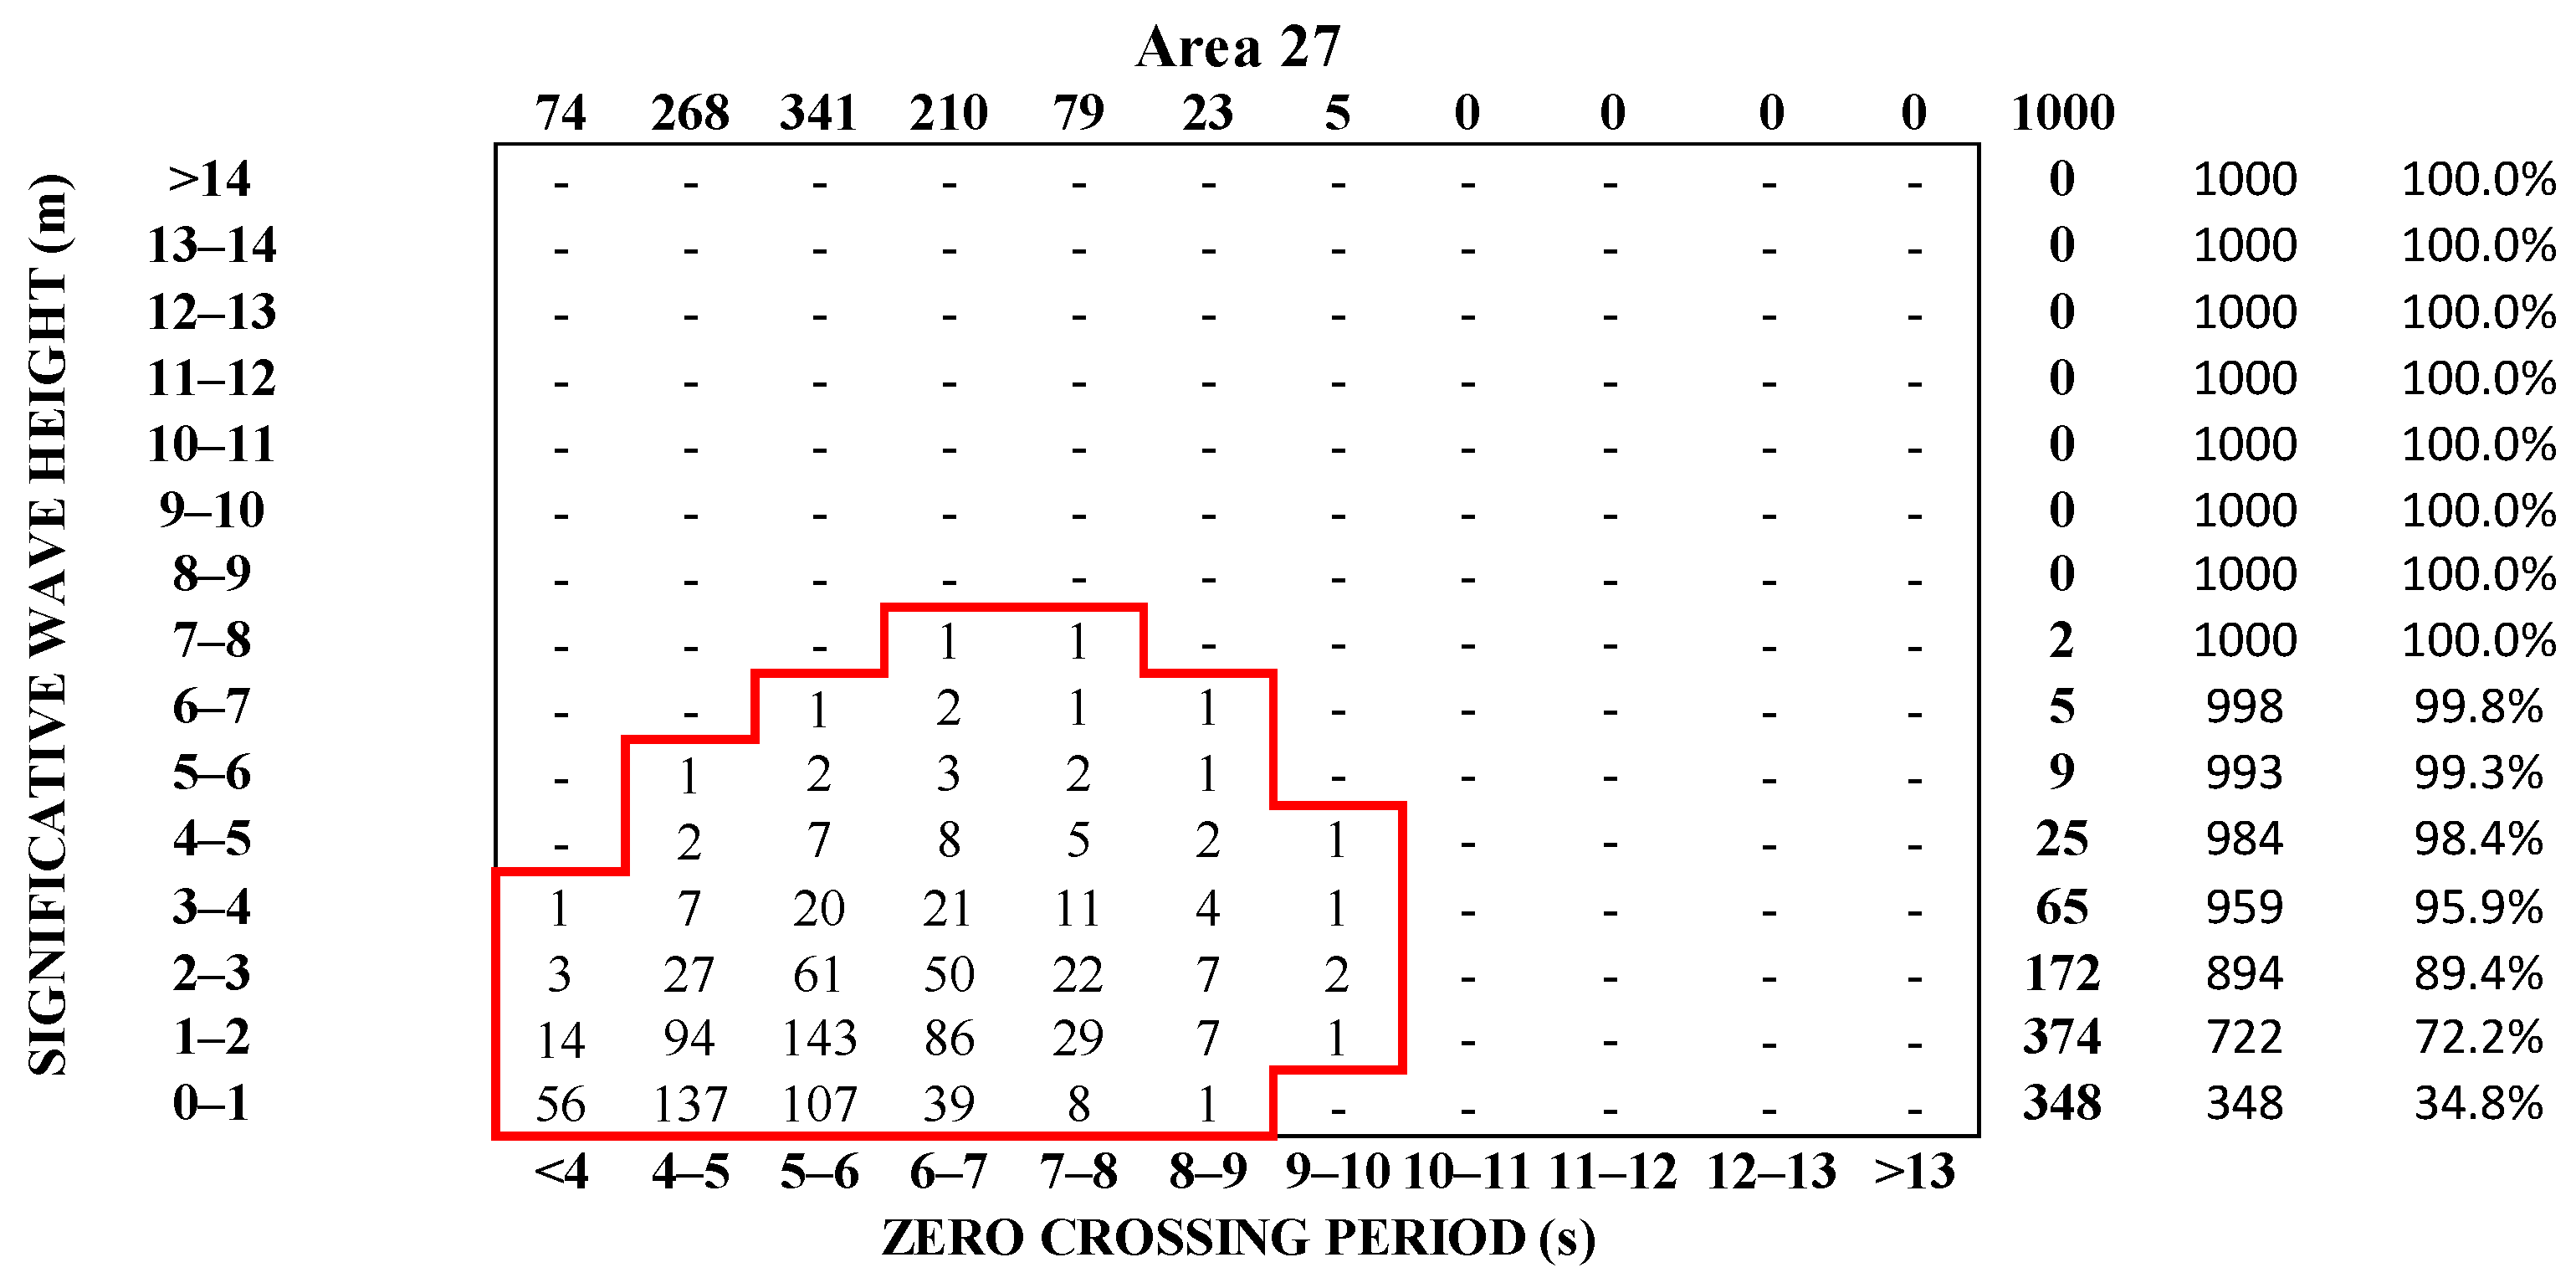
Table 2. According to the Global Wave Statistics [
18], for the annual statistics of Area 27, given in
Figure 2, waves, of any wave period, higher than 3 m have the probability of occurrence of 0.106. Therefore, for the operator, this wave height is considered as an extreme wave, making the vessel operate at a lower speed, as reported in
Table 2. All calculations have been performed for the ship operating at 14 knots under full load conditions.
2.1. LincoSim OpenFOAM (CFD)
LincoSim is used as a conventional web application that automatically manages the entire workflow, ultimately presenting the integrated results within its interface. At present, LincoSim effectively supports calm-water simulations as well as hydrostatic calculations and has been validated against experimental results for these scenarios in [
16,
19,
20,
21,
22]. Hydrostatic calculations are typically performed to generate consistent data for calm-water simulations. Wave-induced simulations are not yet integrated into the application, but the first comparison against the experimental data in head waves has been performed in [
16].
Wave/hull interaction modeling by CFD is still an open issue in research. The availability of limited validation datasets represents a concrete limitation to the development of a robust workflow to face different wave conditions. In this work we describe the basic procedural principles that have been employed to generate the presented results, which may serve as the foundation for their future full integration into LincoSim. To our knowledge, one of the most robust modeling techniques for wave/hull interaction CFD studies is the so-called forcing zone method, as fully described by Peric et al. in [
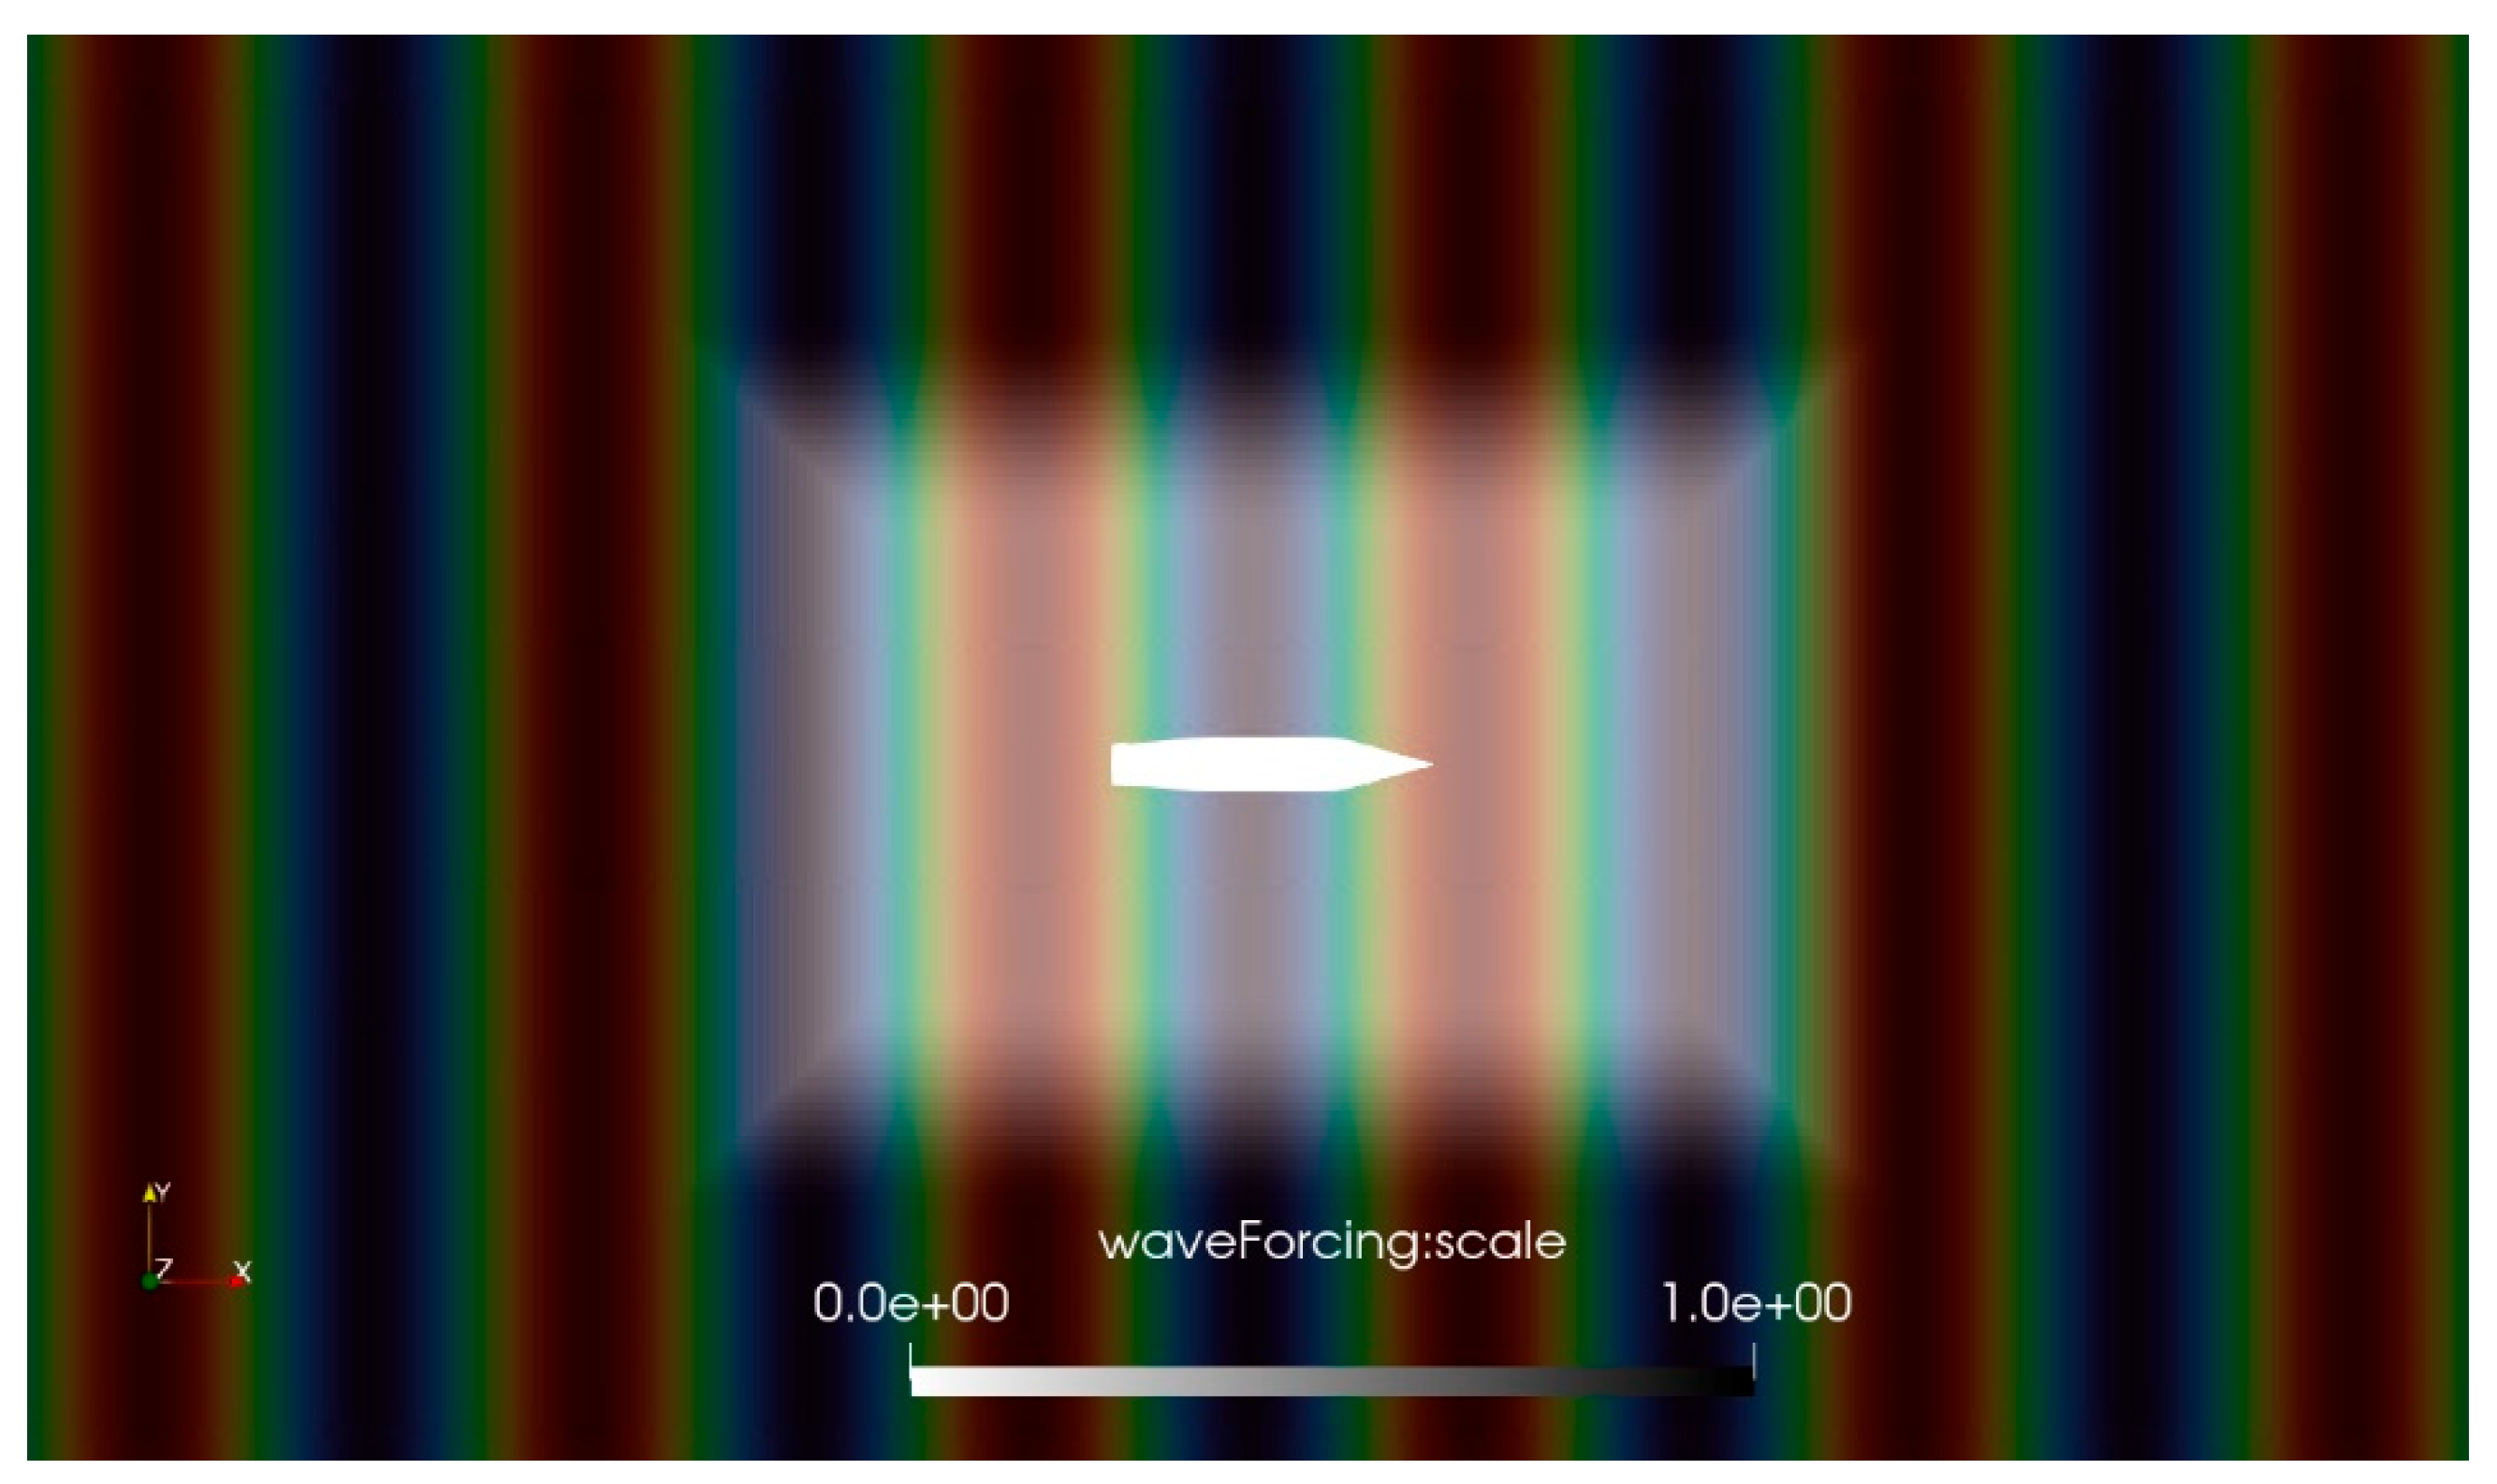
23]. In
Figure 3, an example of the forcing zones is given.
The general idea is to force the wave equations on a frame externally to the hull position and let the solution of the Navier–Stokes equations adapt to the forced condition transporting the wave into the frame surrounding the hull. According to [
23], the frame extent is defined according to the imposed wave so that the internal frame (non-forced) extent is equal to one wavelength and the external frame (forced) is equal to about two wavelengths. To minimize the undesired wave reflections, a suitable forcing parameter has been selected according to [
23], using the code and manual provided by the authors in [
24,
25]. In our models we used half cosine ramp function, with a forcing zone extent equal to 1.5 times the wavelength selecting to force horizontal and vertical velocity components together with volume fraction.
Considering the OpenFOAM wave model type, Stokes 5th order regular wave model has been selected. The forcing zones and forcing parameter value, as well as the domain extent and meshing strategy have been set starting from the recommendations given in [
26], where meshing topology is defined using between 25 and 30 cells per wavelength in the longitudinal direction and between 5 and 8 cells per wave height. Regarding ITTC recommendations, we marginally respect the indication of 40 points per wavelength near the hull and over 20 points elsewhere to adequately capture the waves in the longitudinal direction. The number of cells per wave height depends on the case considered (the wavelength) to achieve an isotropic mesh cell spacing near the hull. Consequently, for shorter waves, the number of cells is in some cases lower than the recommended limit of 20 points.
In more detail, the domain extension is set as follows:
X-direction: five times the maximum between the wavelength and hull length;
Y-direction: same as x-direction;
Z-direction: two times the maximum between the wavelength and hull length.
The mesh spacing specifications for the meshing topology are as follows:
X-direction: between 30 and 40 mesh cells per wavelength;
Y-direction: same as x-direction;
Z-direction: between 10 and 15 mesh cells per wave amplitude.
Additionally, the target mesh cell size on the hull is set to be equal to 1/250 the hull length. In
Figure 4 an example of the mesh spacing is given.
Considering the requirements defined above, for a given hull shape, the mesh is increasing the cell counts moving from long period to short period waves. To reduce the time to result by taking advantage of symmetric domain definition, wave angle at 0 degrees (head waves) has been threaded as half domains symmetric respect to the Y-axis. To complete the model setup, a parametric simulation end-time value equal to 30 wave time periods (TWAVE) has been used. This value is considered sufficient to guarantee the onset of a periodic hull dynamics response to the incoming wave. The starting integration time step is set to 1/150 of the wave period and is automatically adjusted during the simulation to ensure the value of the Courant number lower than or equal to 1, as this setting for time integration is considered the optimal theoretical value. The simulations are performed in the hull reference frame and only heave, roll, and pitch have been considered.
Considering the numerical scheme for all RANS models, we used the PIMPLE algorithm with Euler (first order) as the time integration scheme and second-order schemes for divergence and gradient terms.
2.2. Hydrostar 3 BEM Potential-Flow Method
Hydrostar is a potential method software developed by Bureau Veritas, which models the three-dimensional geometry of the vessel through panels (Chen [
27]). The Green function involved in the wave diffraction and radiation problem is formulated as the fundamental solution expressed by the Fourier–Hankel integral. The formulation and numerical computation of the second-order wave loads, including the high-frequency and low-frequency components, are based on the work by Chen [
28]. In particular, the problems of poor numerical convergence of the near-field formulation, or only the sum of drift loads on all bodies provided by the far field, are solved using the middle-field formulation that has the same virtue as the far-field formulation, ensuring rapid convergence and giving access to the drift load on each individual body.
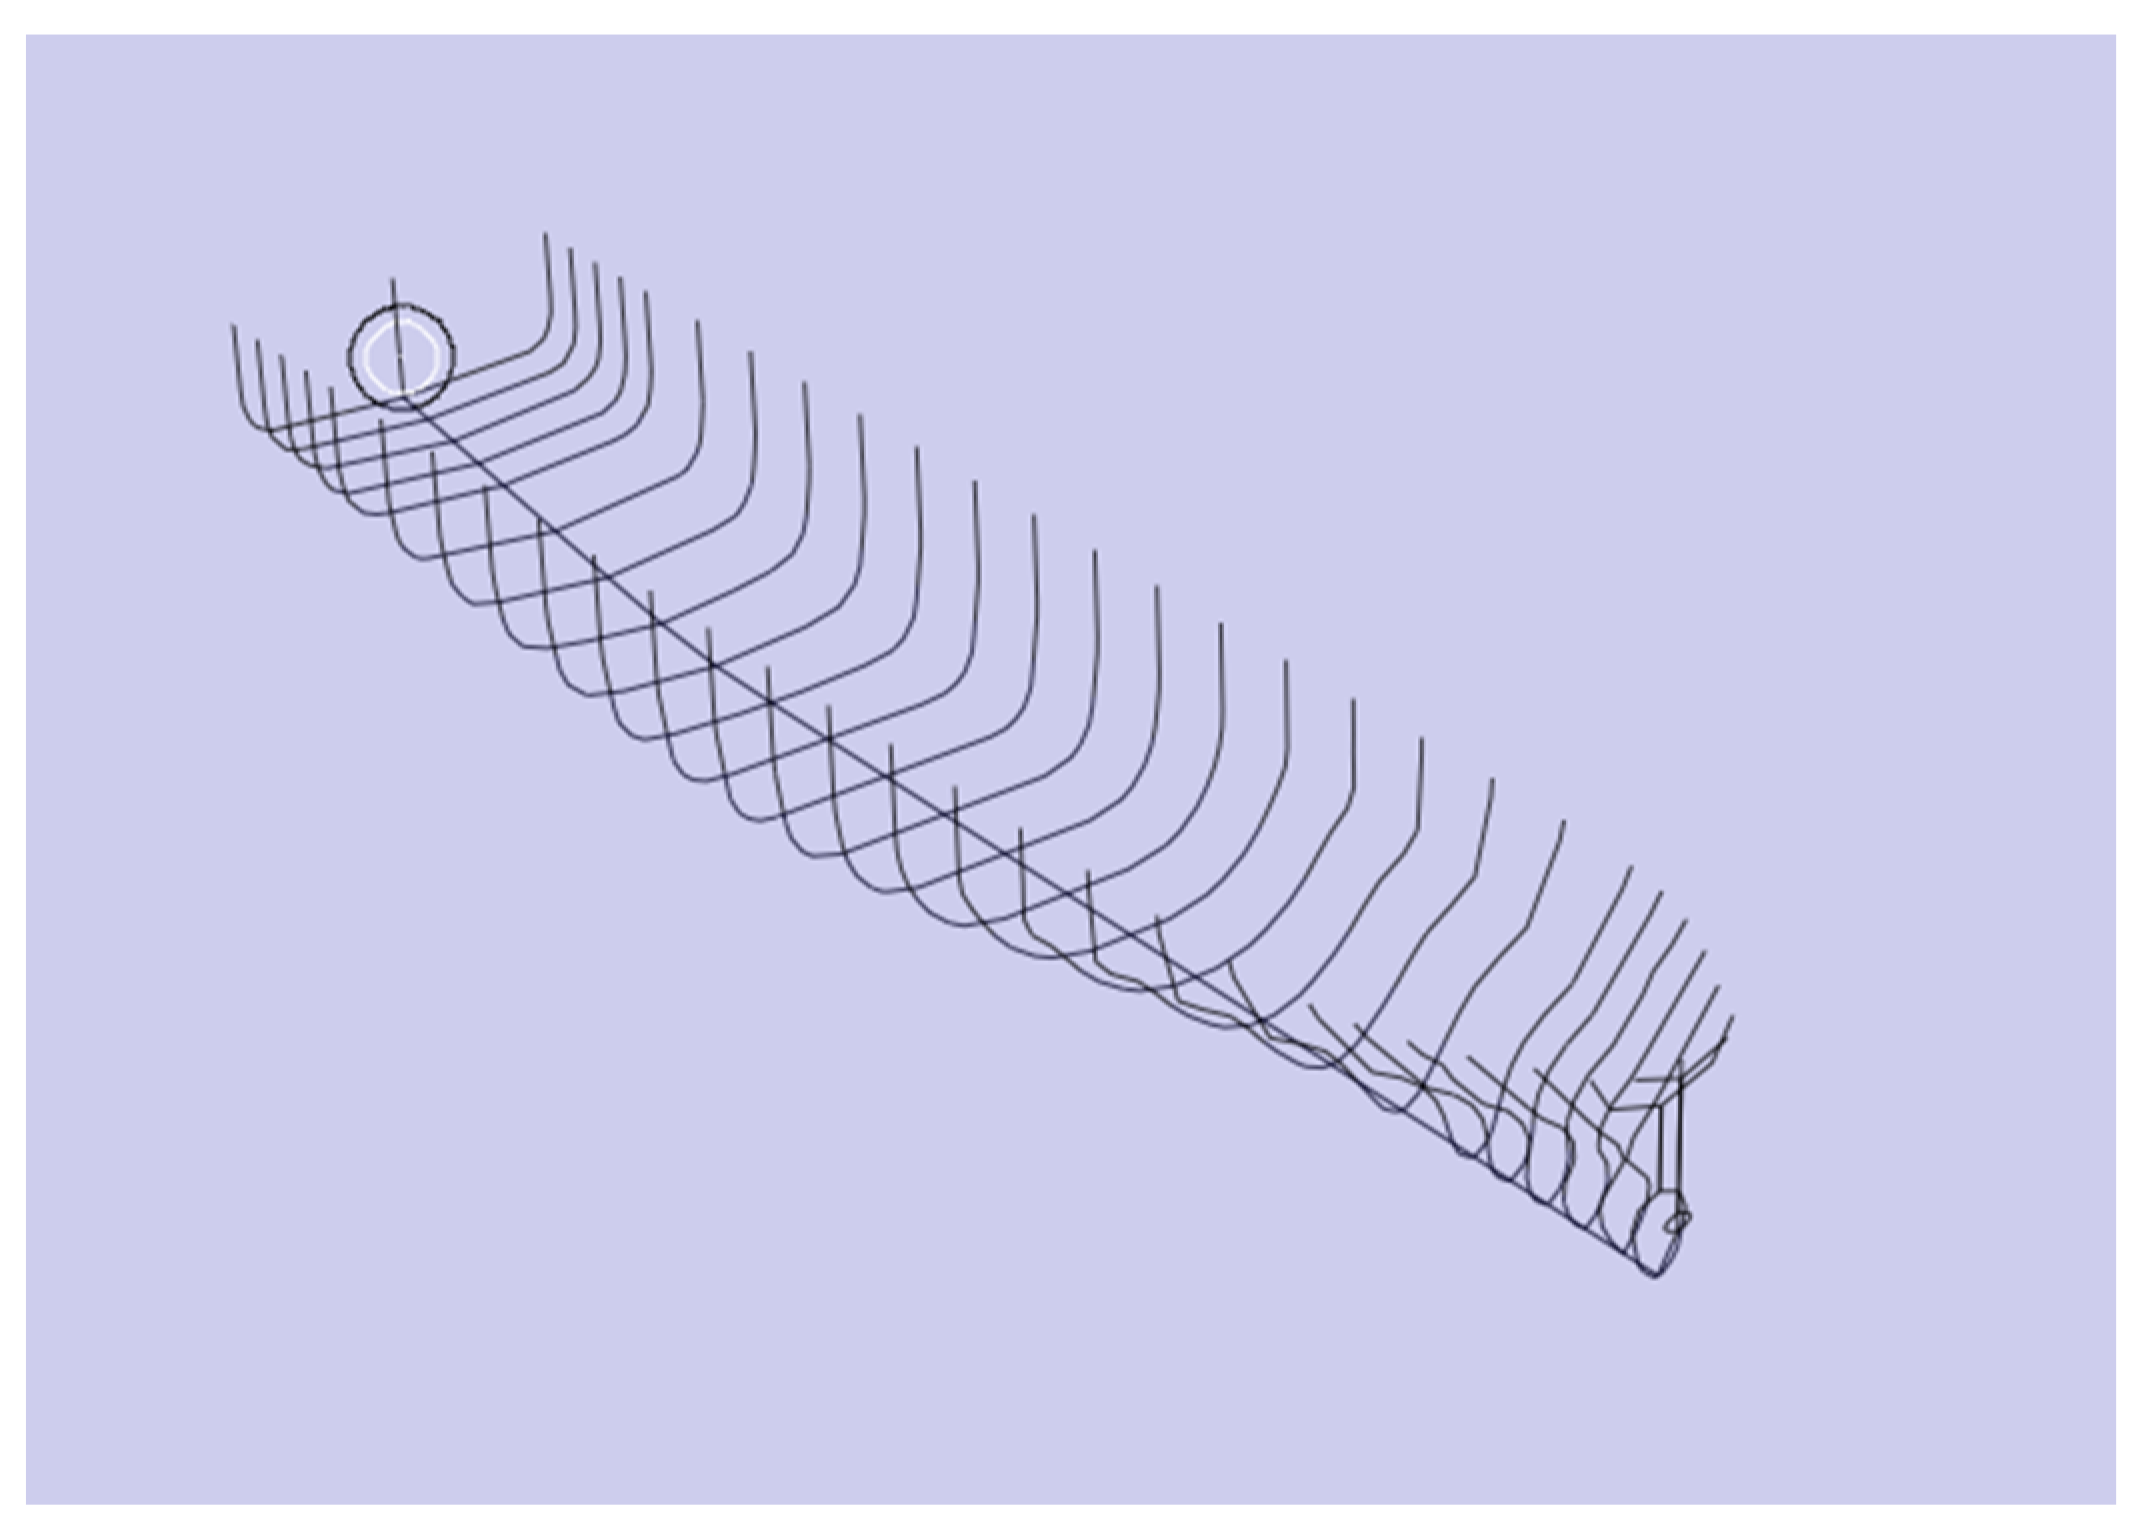
The RoPax has been described by about 4800 panels, as shown in
Figure 5, and the calculations have been performed at speed of 14 kn for the wave frequency range from 0.2 to 2.0 rad/s with a step of 0.02 rad/s. For the roll motion, it is possible to include additional damping, either as the combination of linear and quadratic coefficients, as the Ikeda method, or as the linear damping in percentage of the critical damping. For this ship, considering the software guidelines, the linear damping of 3% of the critical damping has been given as input.
2.3. ShipX V4.2 Strip Theory (ST)
ShipX uses the well-known strip theory developed by Salvesen et al. [
29]. For the calculation of added resistance, the method of Gerritsma and Beukelman [
30], in the generalized approach of Loukakis and Sclavounos [
31], extended to oblique waves, is implemented. Gerritsma and Beukelman “defined” added resistance as the energy radiated by heave and pitch motions and derived the final expression in terms of sectional hydrodynamic coefficients and relative motion, i.e., quantities that are relatively insensitive to how well the local flow around the ship is resolved. For the short waves, the Faltinsen asymptotic solution [
32] is implemented. The RoPax geometrical representation is given by 27 sections and contour line, as shown in
Figure 6. The calculations are performed for wave periods from 4 to 12 s with the step 0.2 s and from 12 to 20 s with step 2 s. The same wave conditions have also been used for the calculations presented in
Section 2.4. For the roll motion, the additional viscous damping is included, considering the contributions from frictional roll damping, eddy making, and lift.
2.4. ShipX V4.2. Direct Pressure Integration (DPI)
The direct pressure integration method available in ShipX is based on the Faltinsen and Zhao’s work [
33], and the main difference is that the quadratic velocity members are retained. When using the pressure integration approach, a high number of sections should be used to describe the bow and stern part of hull. It is thought to give the most accurate results for head to beam sea with Froude numbers above approximately 0.2.
2.5. ShipX V3 Time Domain
In the ShipX version V3, it is possible to obtain the motions using the time-domain calculations. The time-domain simulation is based on the frequency-domain results obtained by the strip theory and correction for the nonlinear Froude–Krylov and hydrostatic forces.
3. Results
3.1. Resistance in Calm Water
To compute added resistance in waves, a preliminary calm-water simulation at the same velocity must be performed. The standard set of main outcomes, together with the results obtained using a slightly modified meshing criteria to match the requirements of the wave modeling set of simulations for the model scale 1:20, obtained using the two meshing criteria, are reported in
Table 3, and some of the typical CFD scenes are given in
Figure 7.
3.2. Results Comparison in Head Waves
The summary of the wave periods in model and ship scale for the CFD and time-domain calculations is reported in
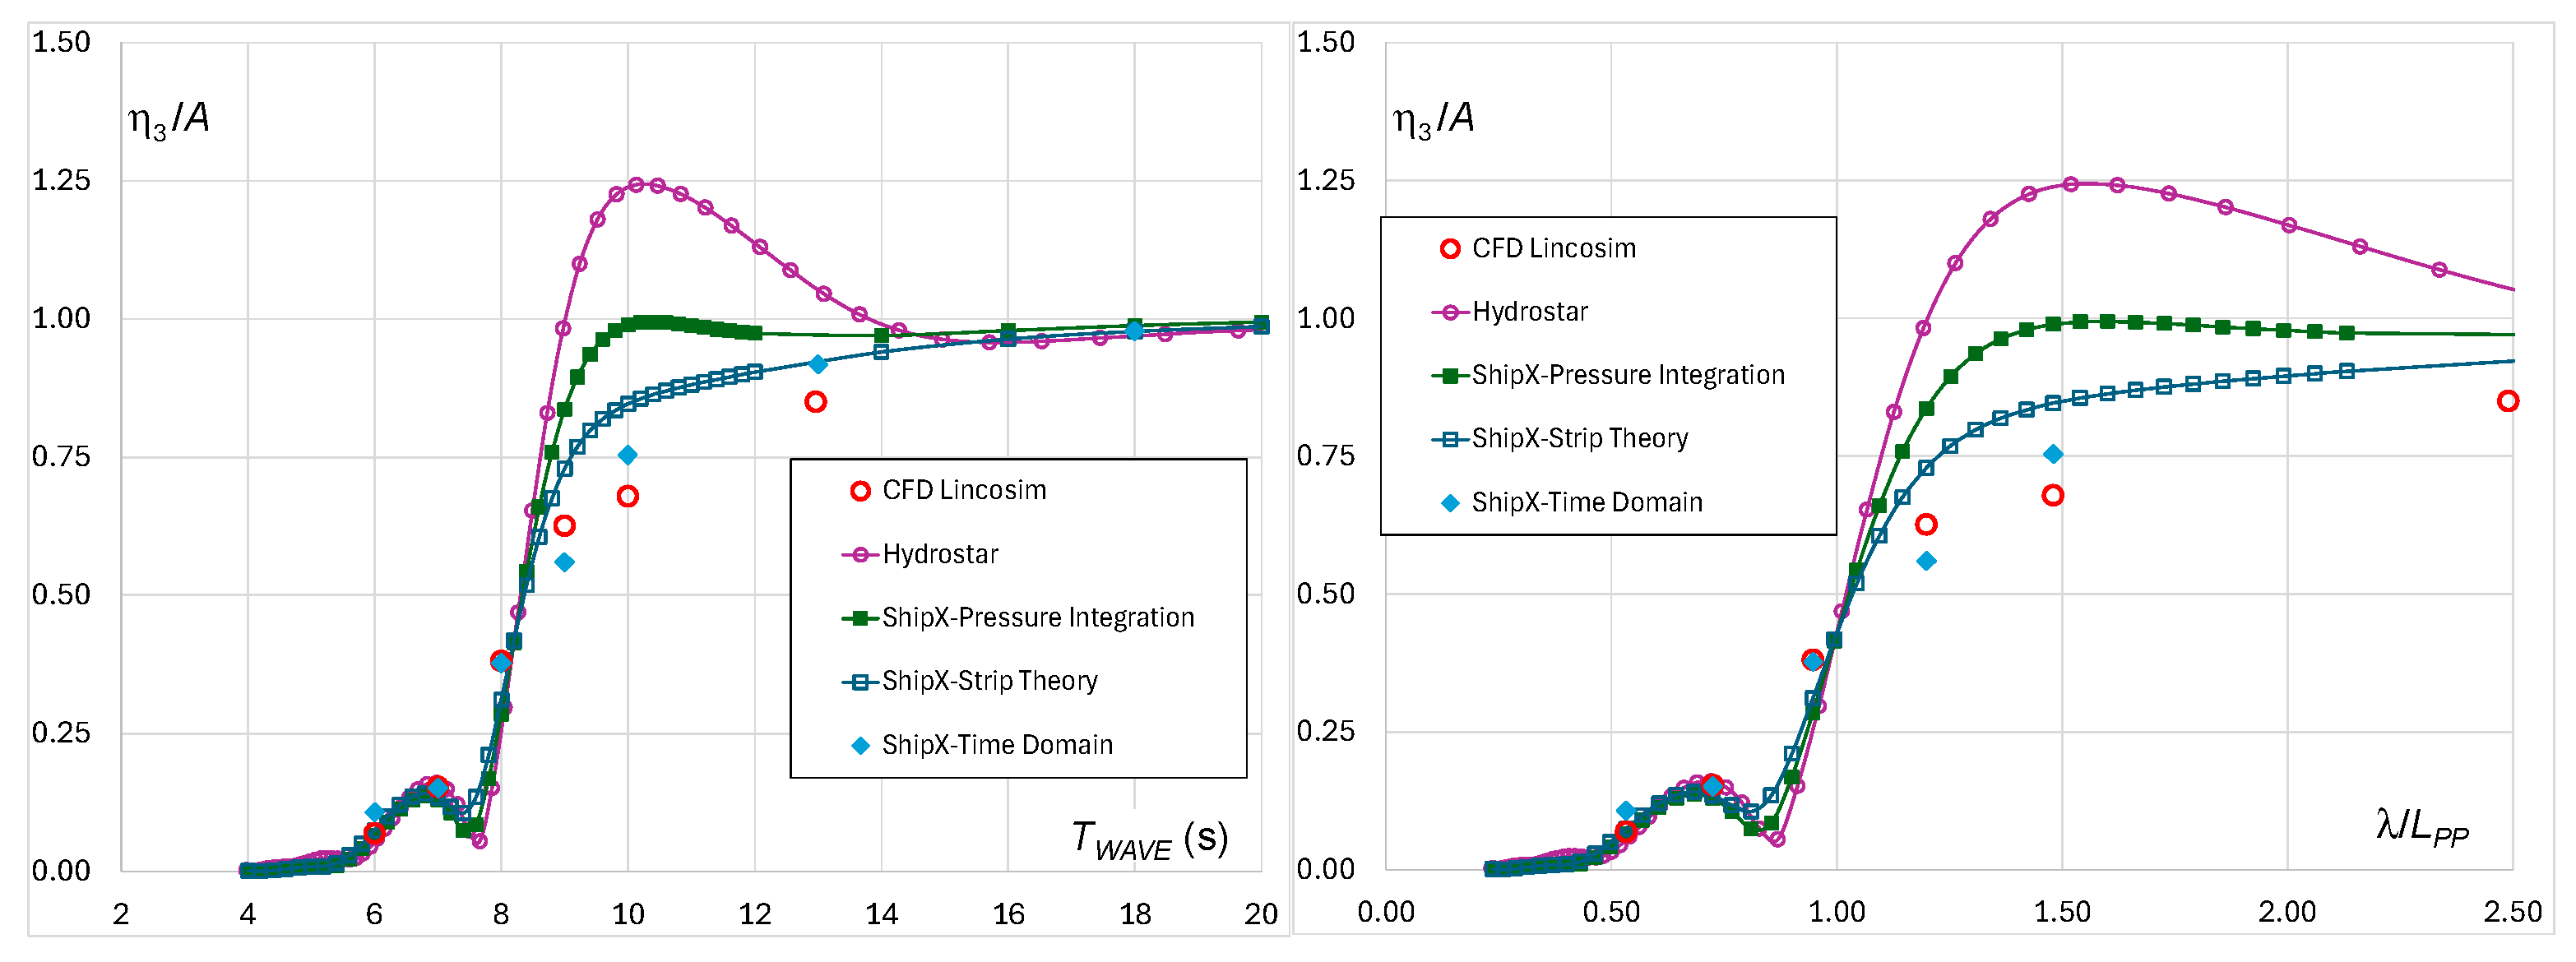
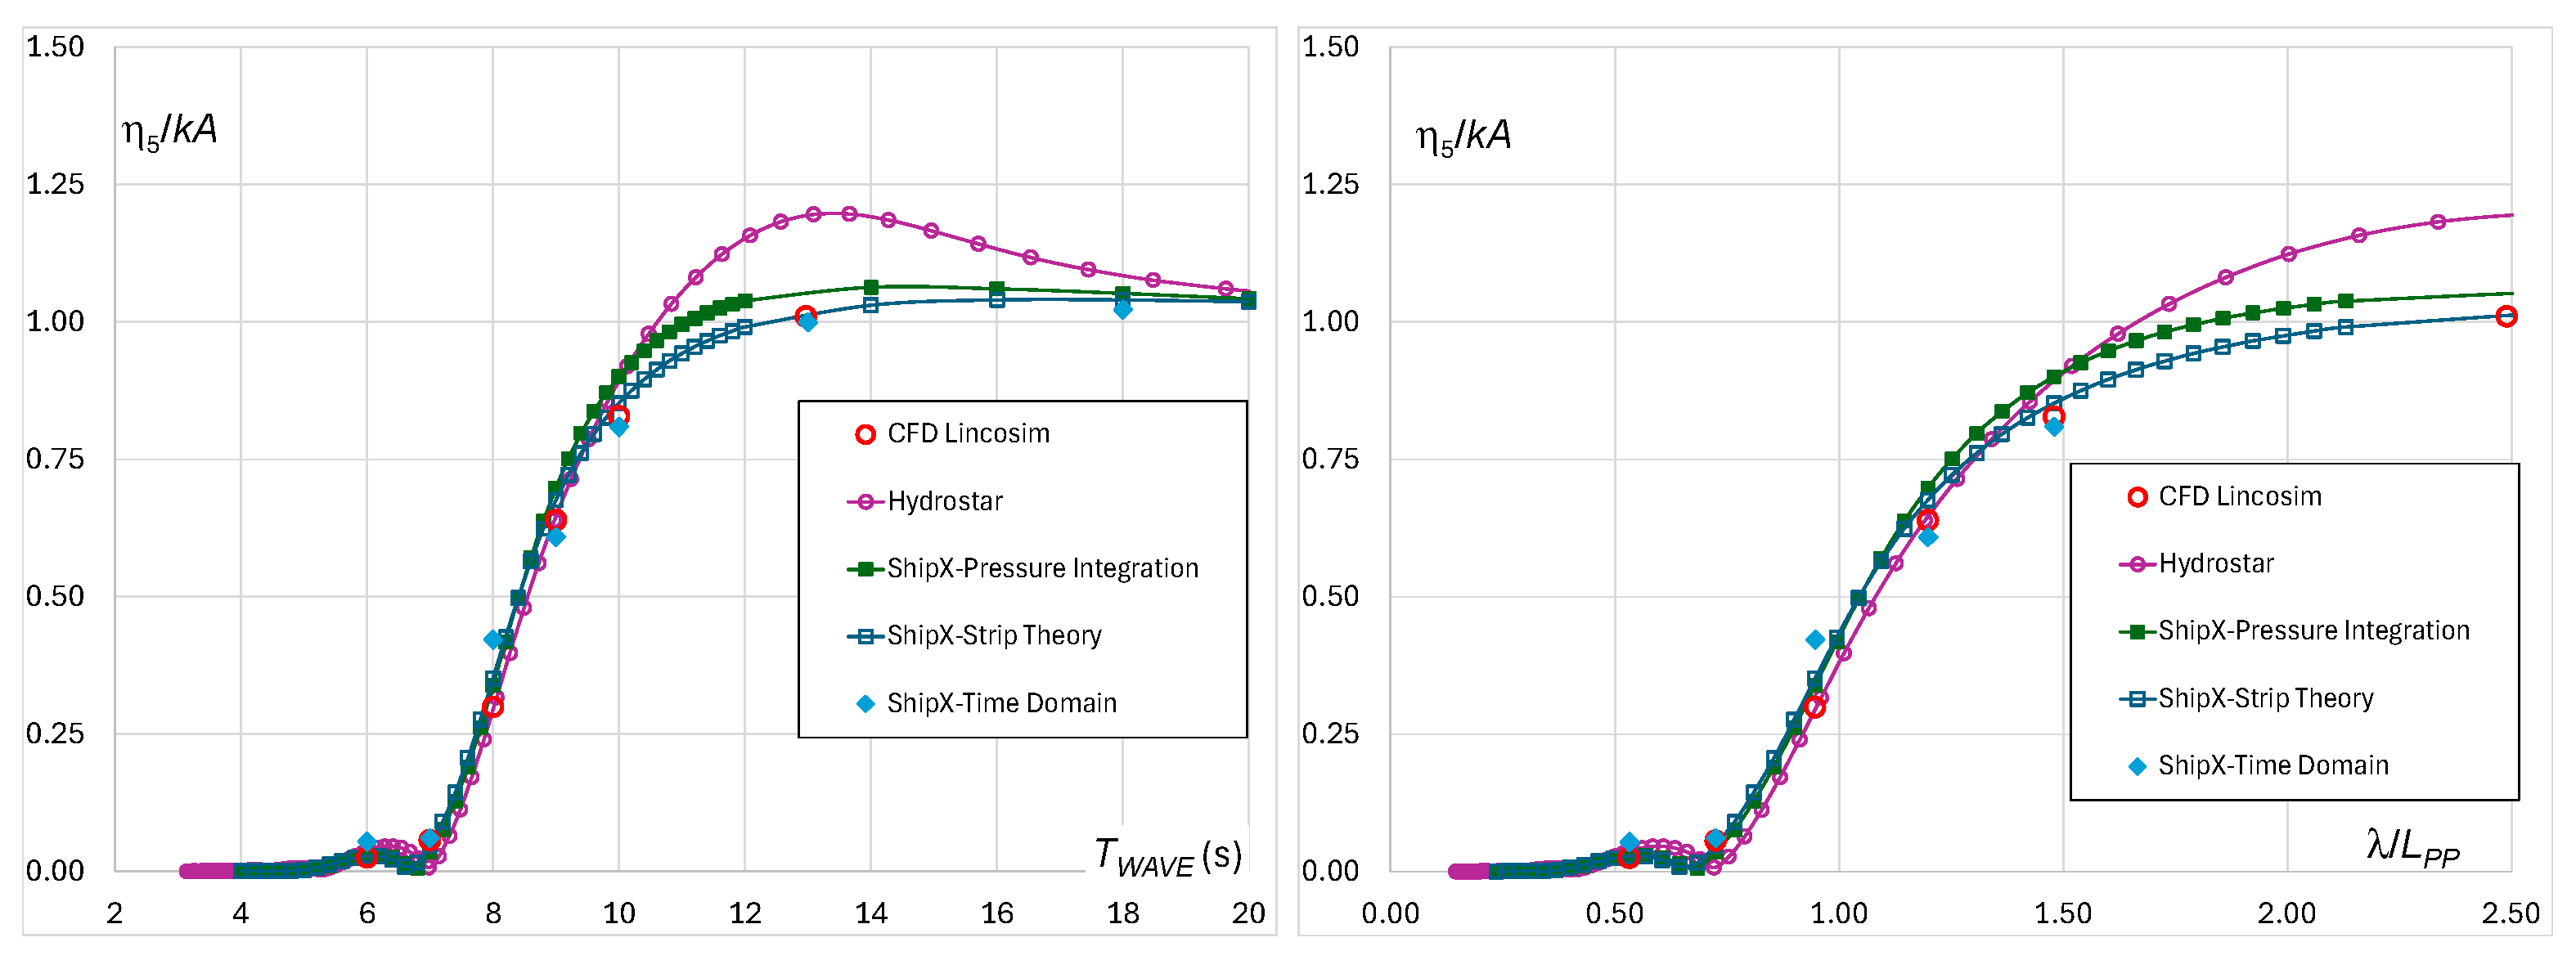
Table 4. Response Amplitude Operators (RAOs) for heave and pitch in head waves are reported in
Figure 8 and
Figure 9. Added resistance RAO is shown in
Figure 10. For easier comparison, these results are shown both as a function of wave period
TWAVE and in nondimensional form as a function of λ/
LPP, where λ is the wavelength in [m]. The RAO definitions are as follows:
is defined as the difference in the mean resistance (FX force) in wave and in the calm water, and is the wave frequency in [rad/s].
It can be noted that heave response obtained by different methods is almost identical up to the λ/
LPP ≈ 1 which for the considered ship corresponds to the
TWAVE ≈ 9 s. According to
Figure 2, it can be noted that for the Eastern Mediterranean, the probability of occurrence of wave periods up to 9 s is higher than 99%. For longer waves, CFD and ShipX time domain, which takes into account an instantaneous wetted surface for the Froude–Krylov and the restoring forces, are providing lower responses. For the pitch RAO, CFD, ShipX time domain and classical strip theory are in excellent agreement; a small difference can be observed when using the ShipX DPI method, while Hydrostar provides slightly higher results in the range of waves longer than 10 s. In contrast, added resistance calculation by panel method is closer to the CFD results than strip theories and, in particular, excellent agreement can be observed for the range where added resistance is dominated by the ship motions. A more detailed analysis of calculated responses is given in
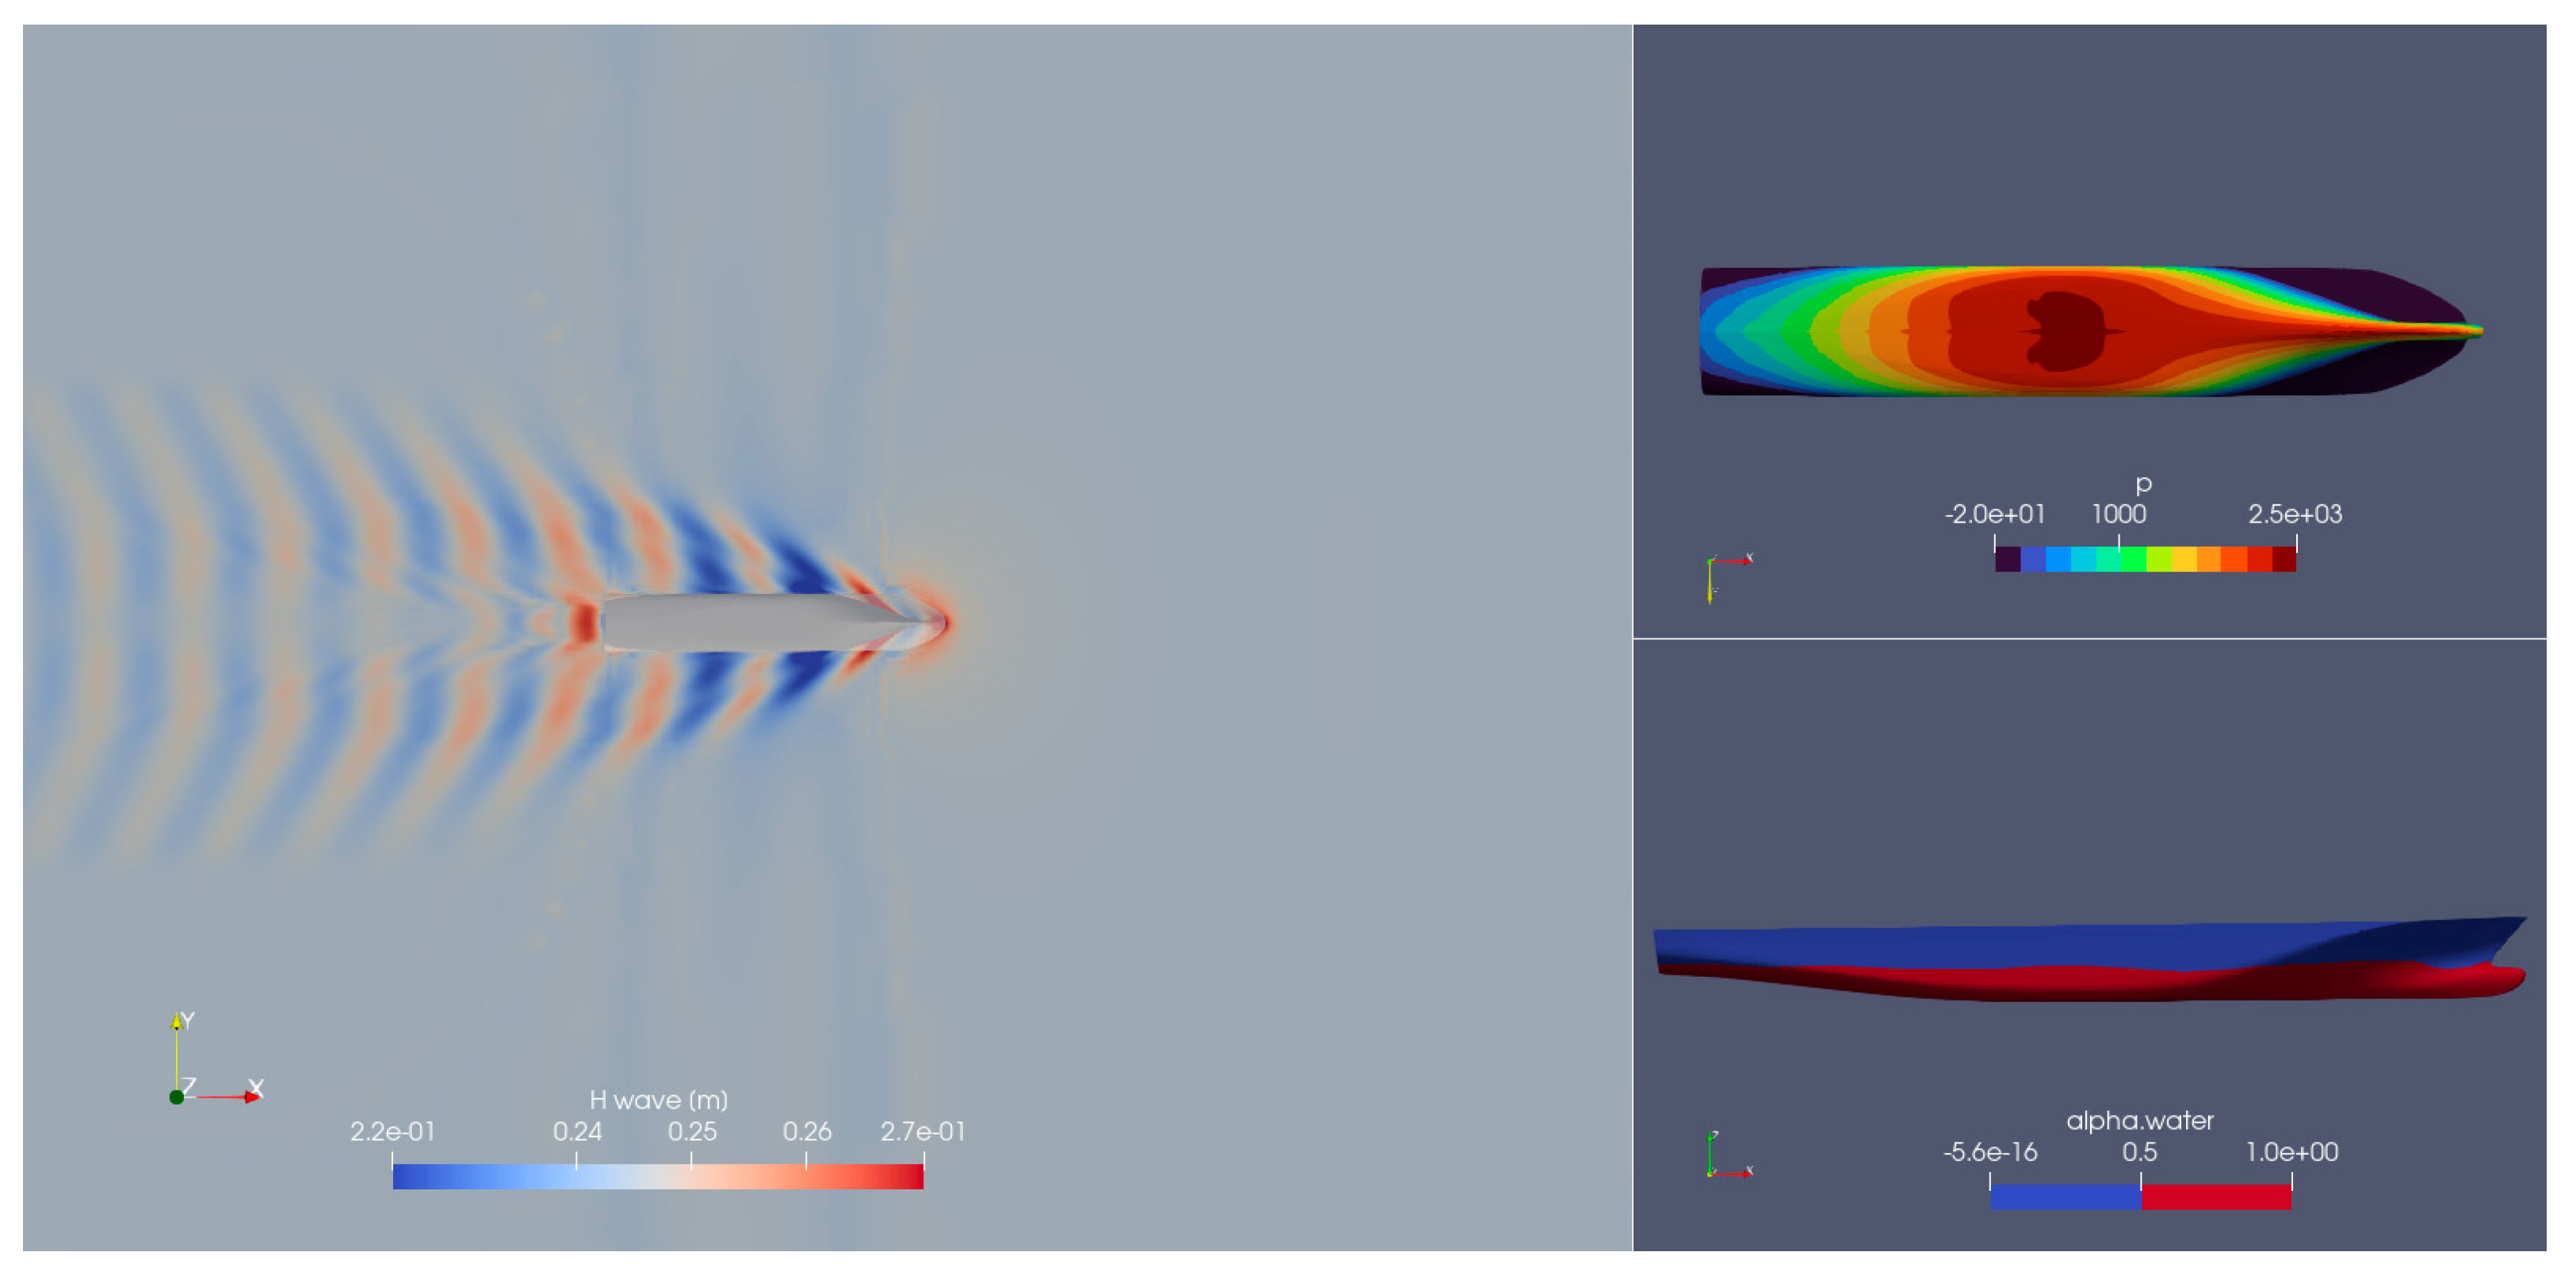
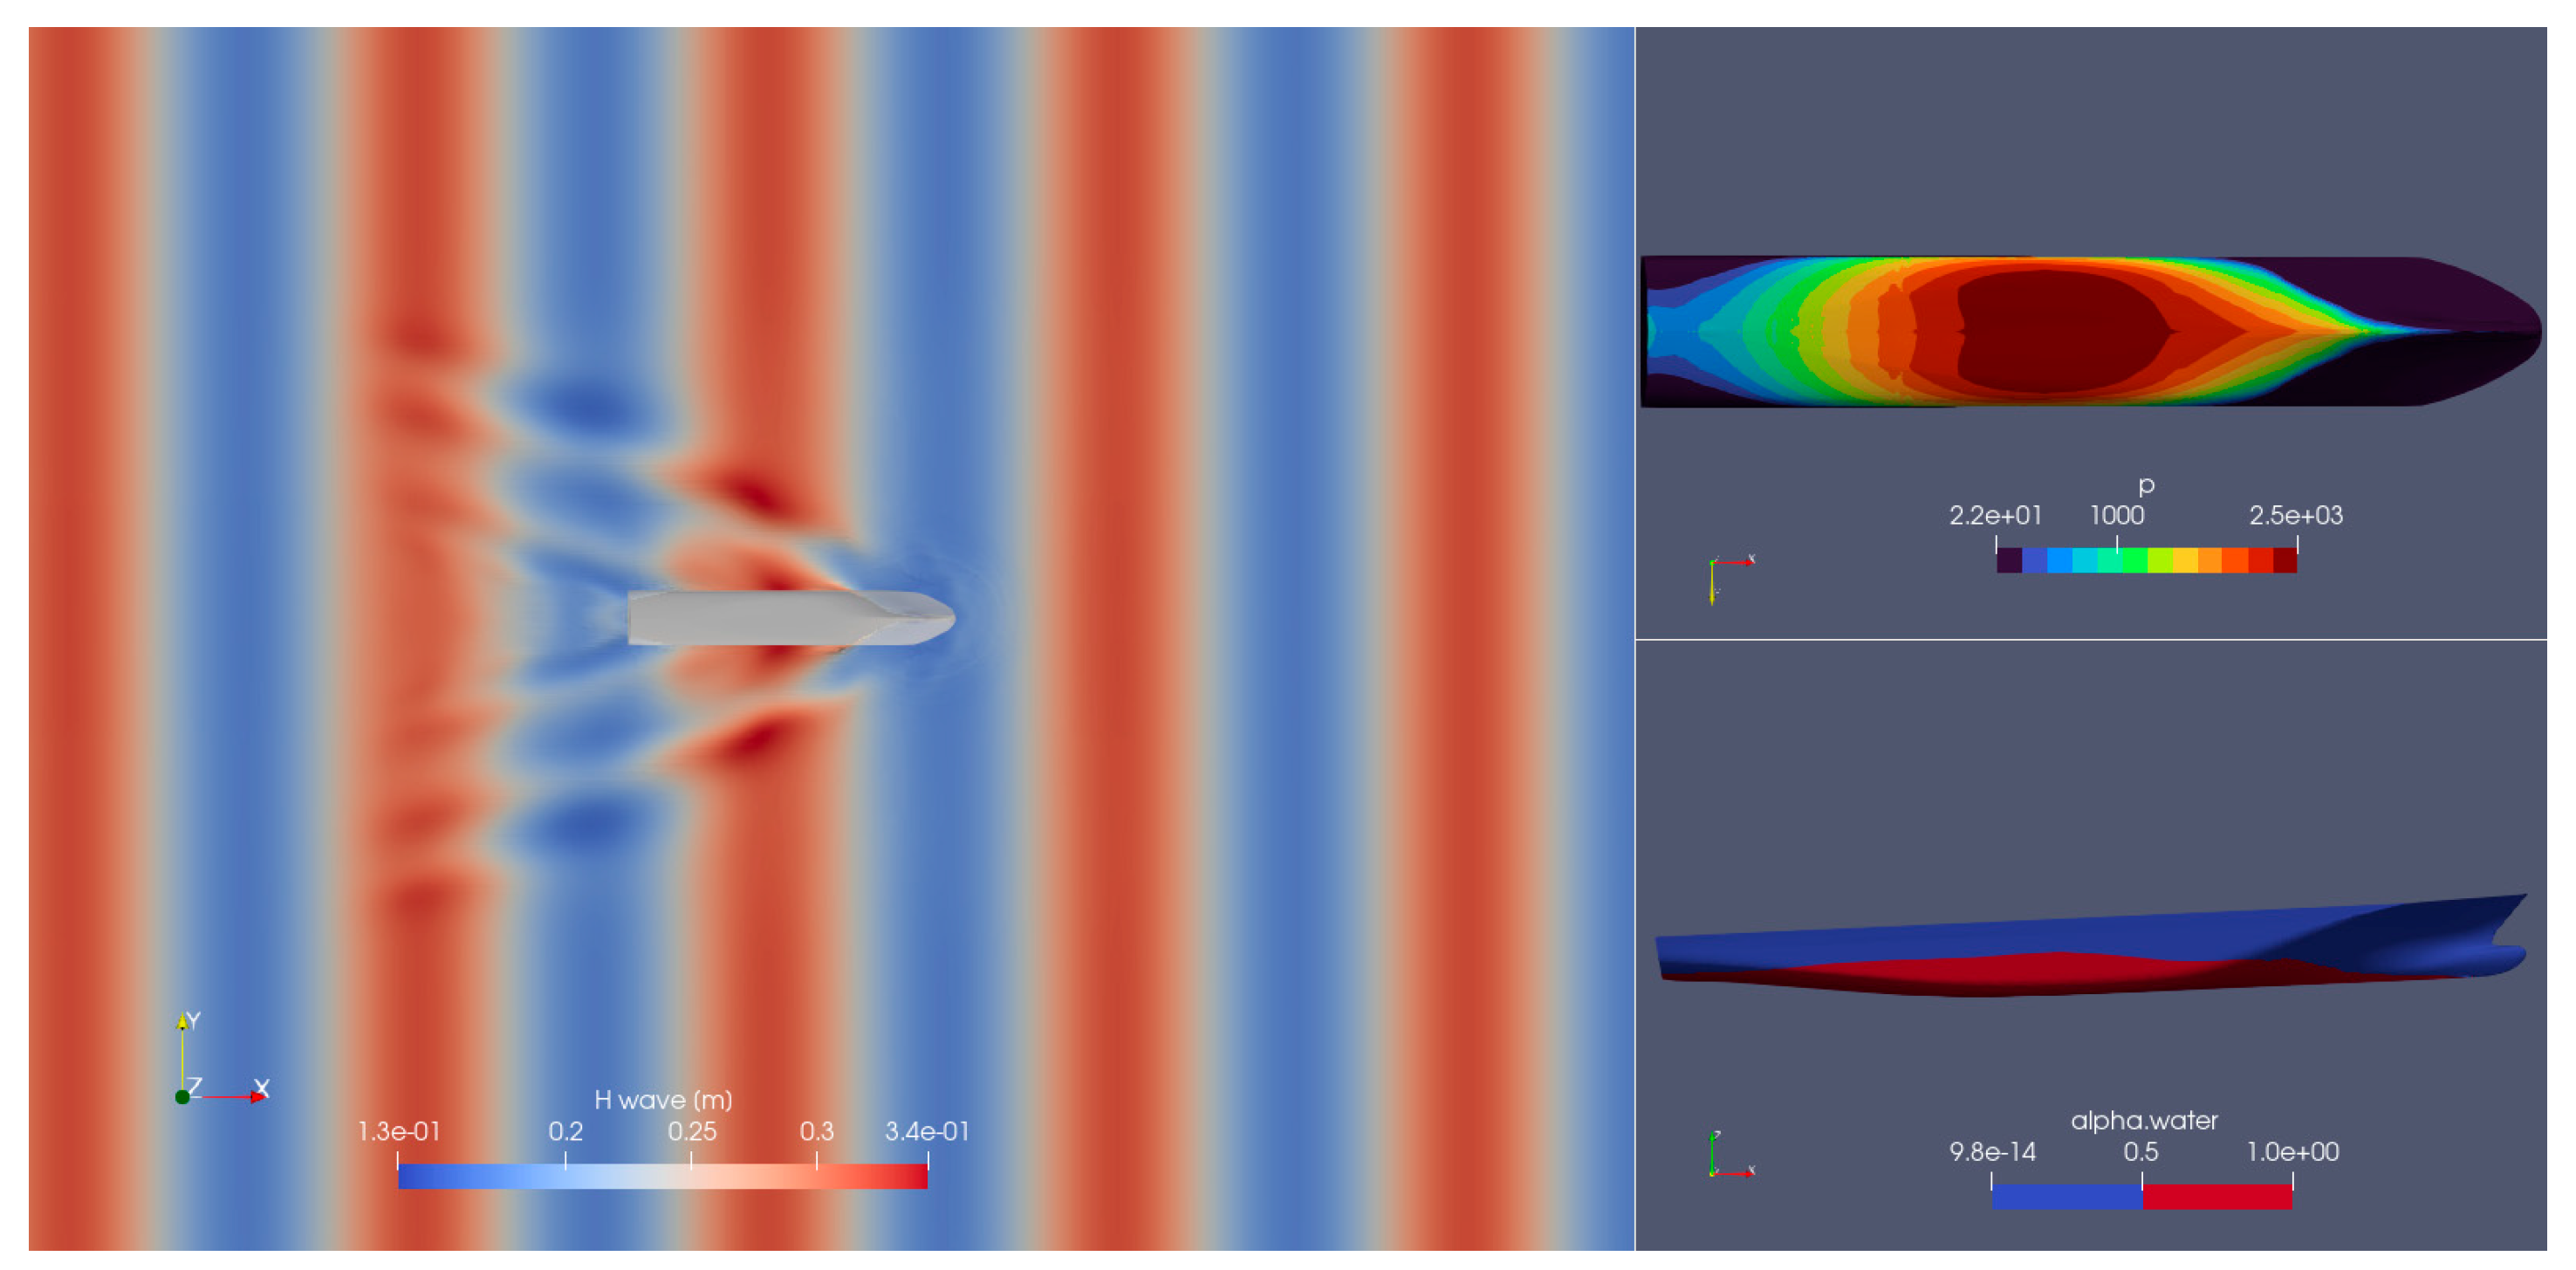
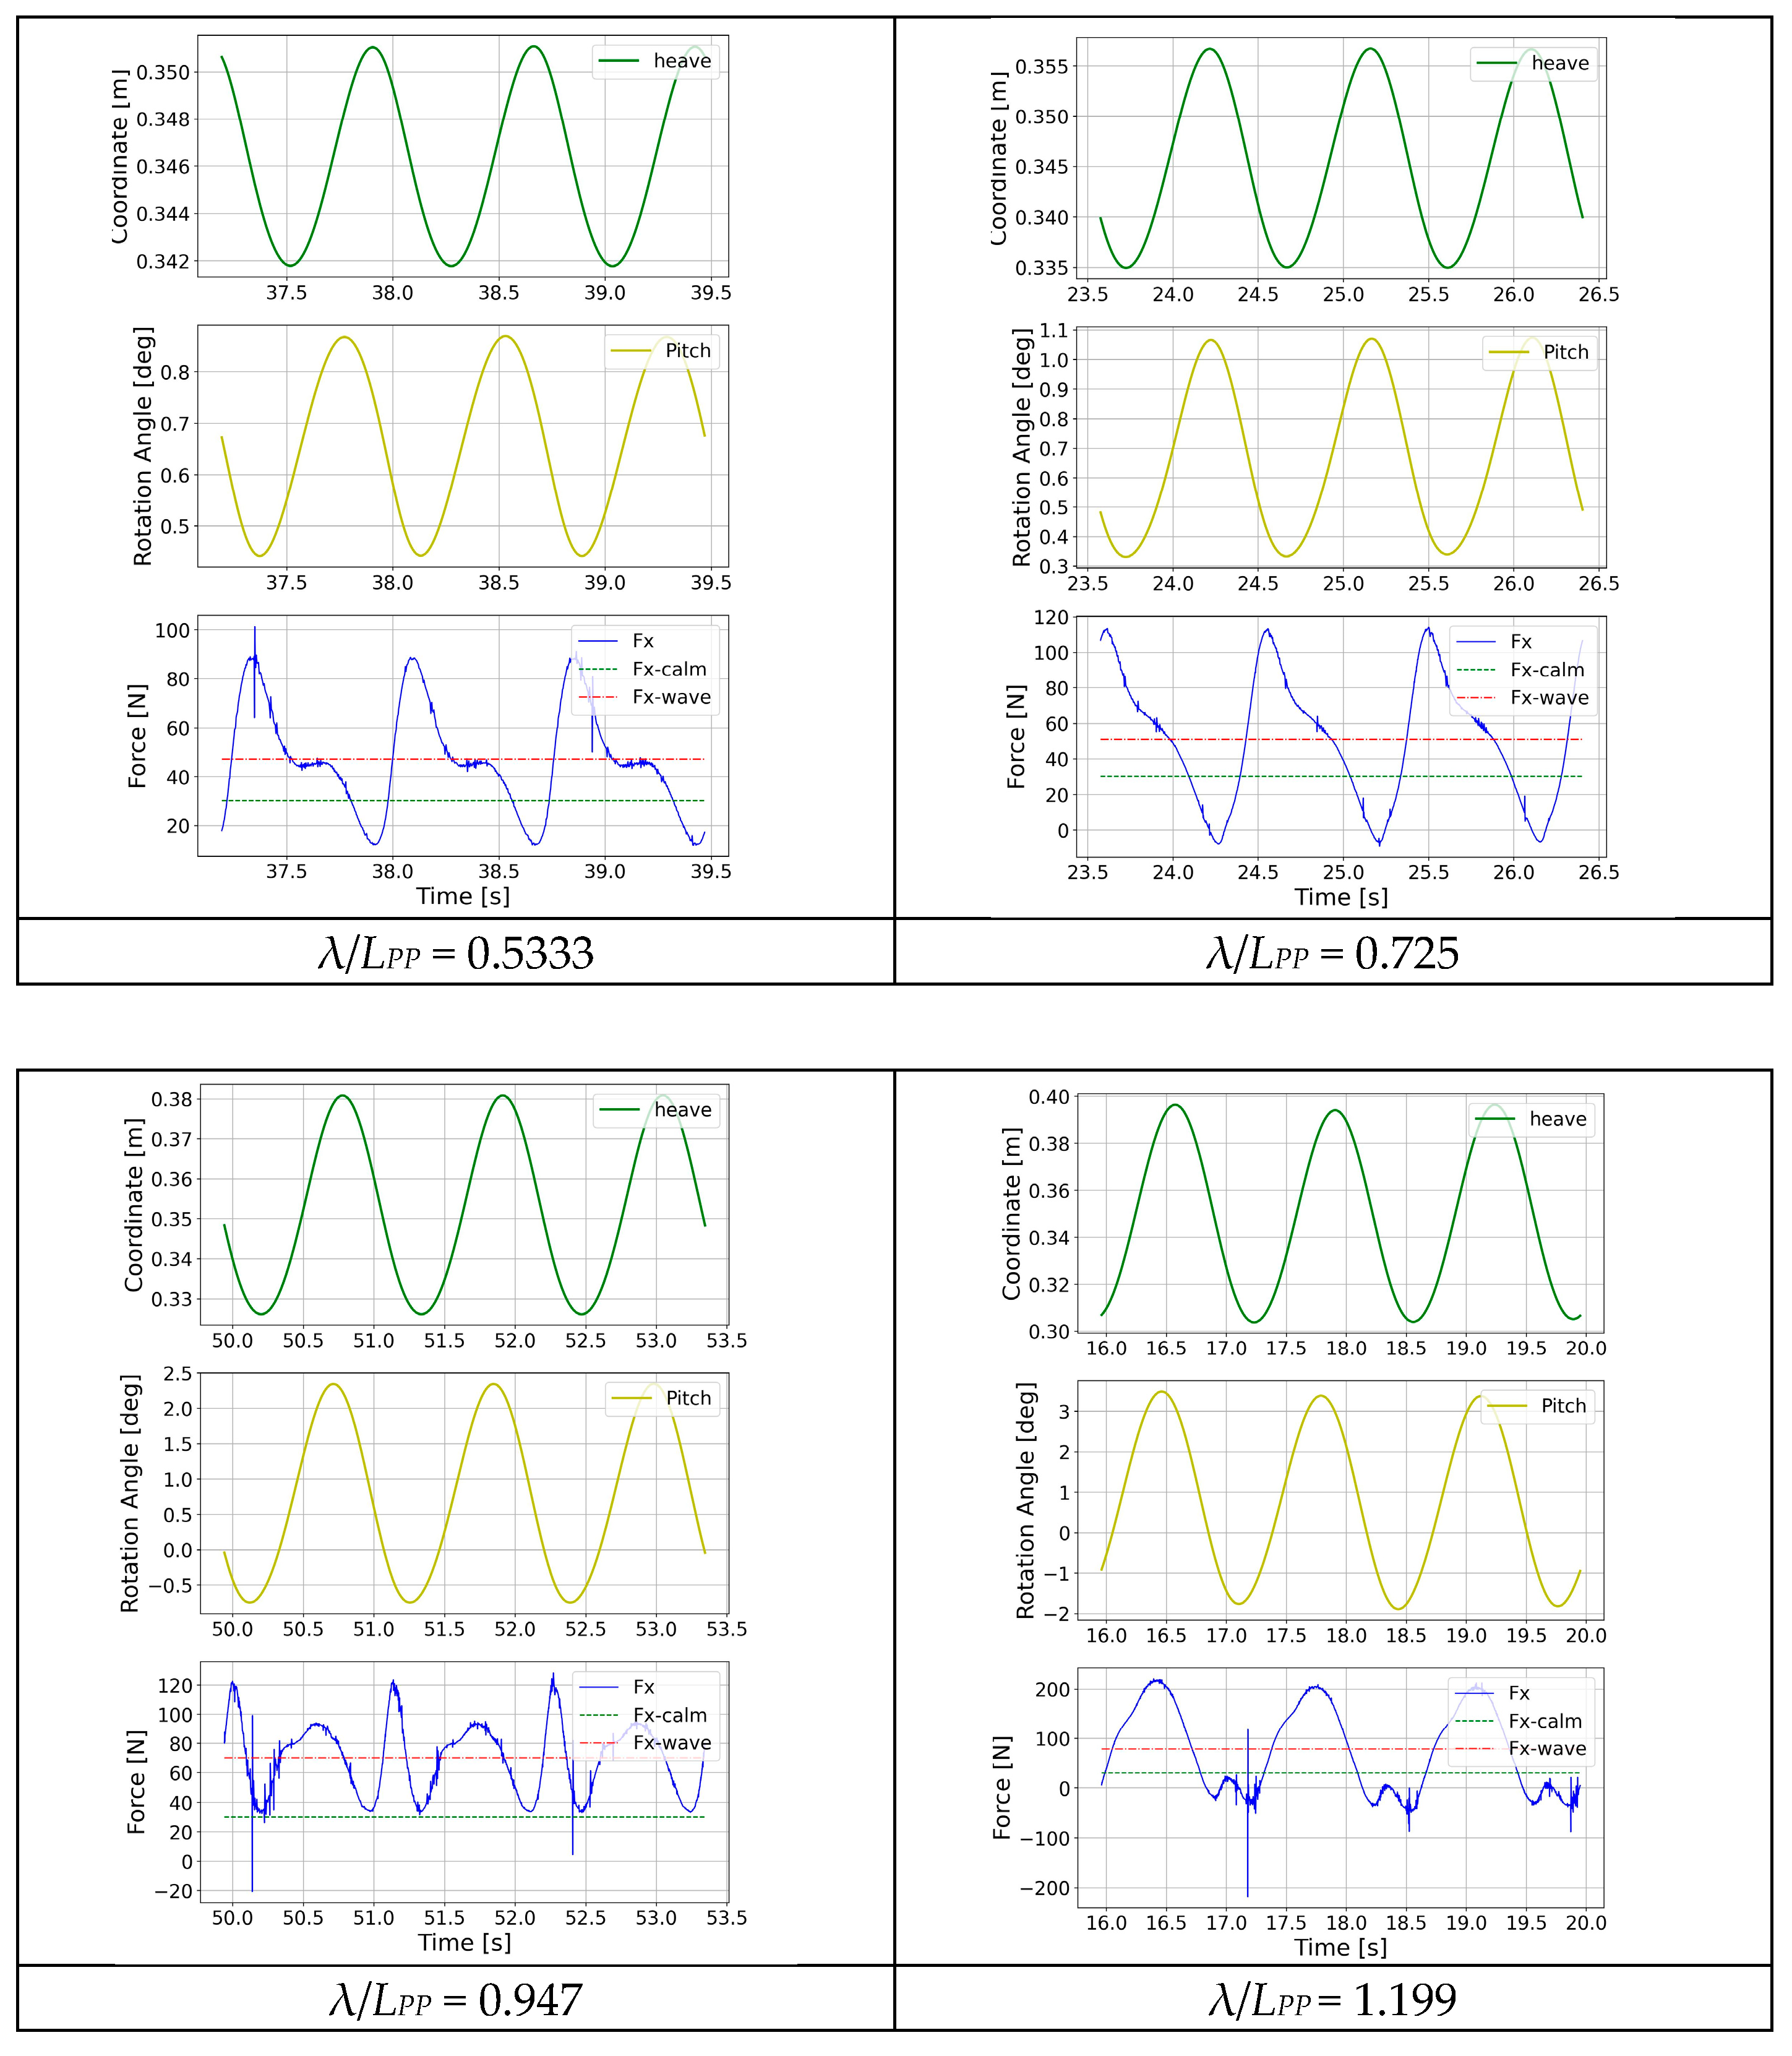
Figure 11 and
Figure 12. In
Figure 11, the numerical domain is given, showing the interference of the incoming wave and waves generated by the advancing ship. On the right side of the Figure, the pressure field on the hull and the instantaneous wetted surface are shown.
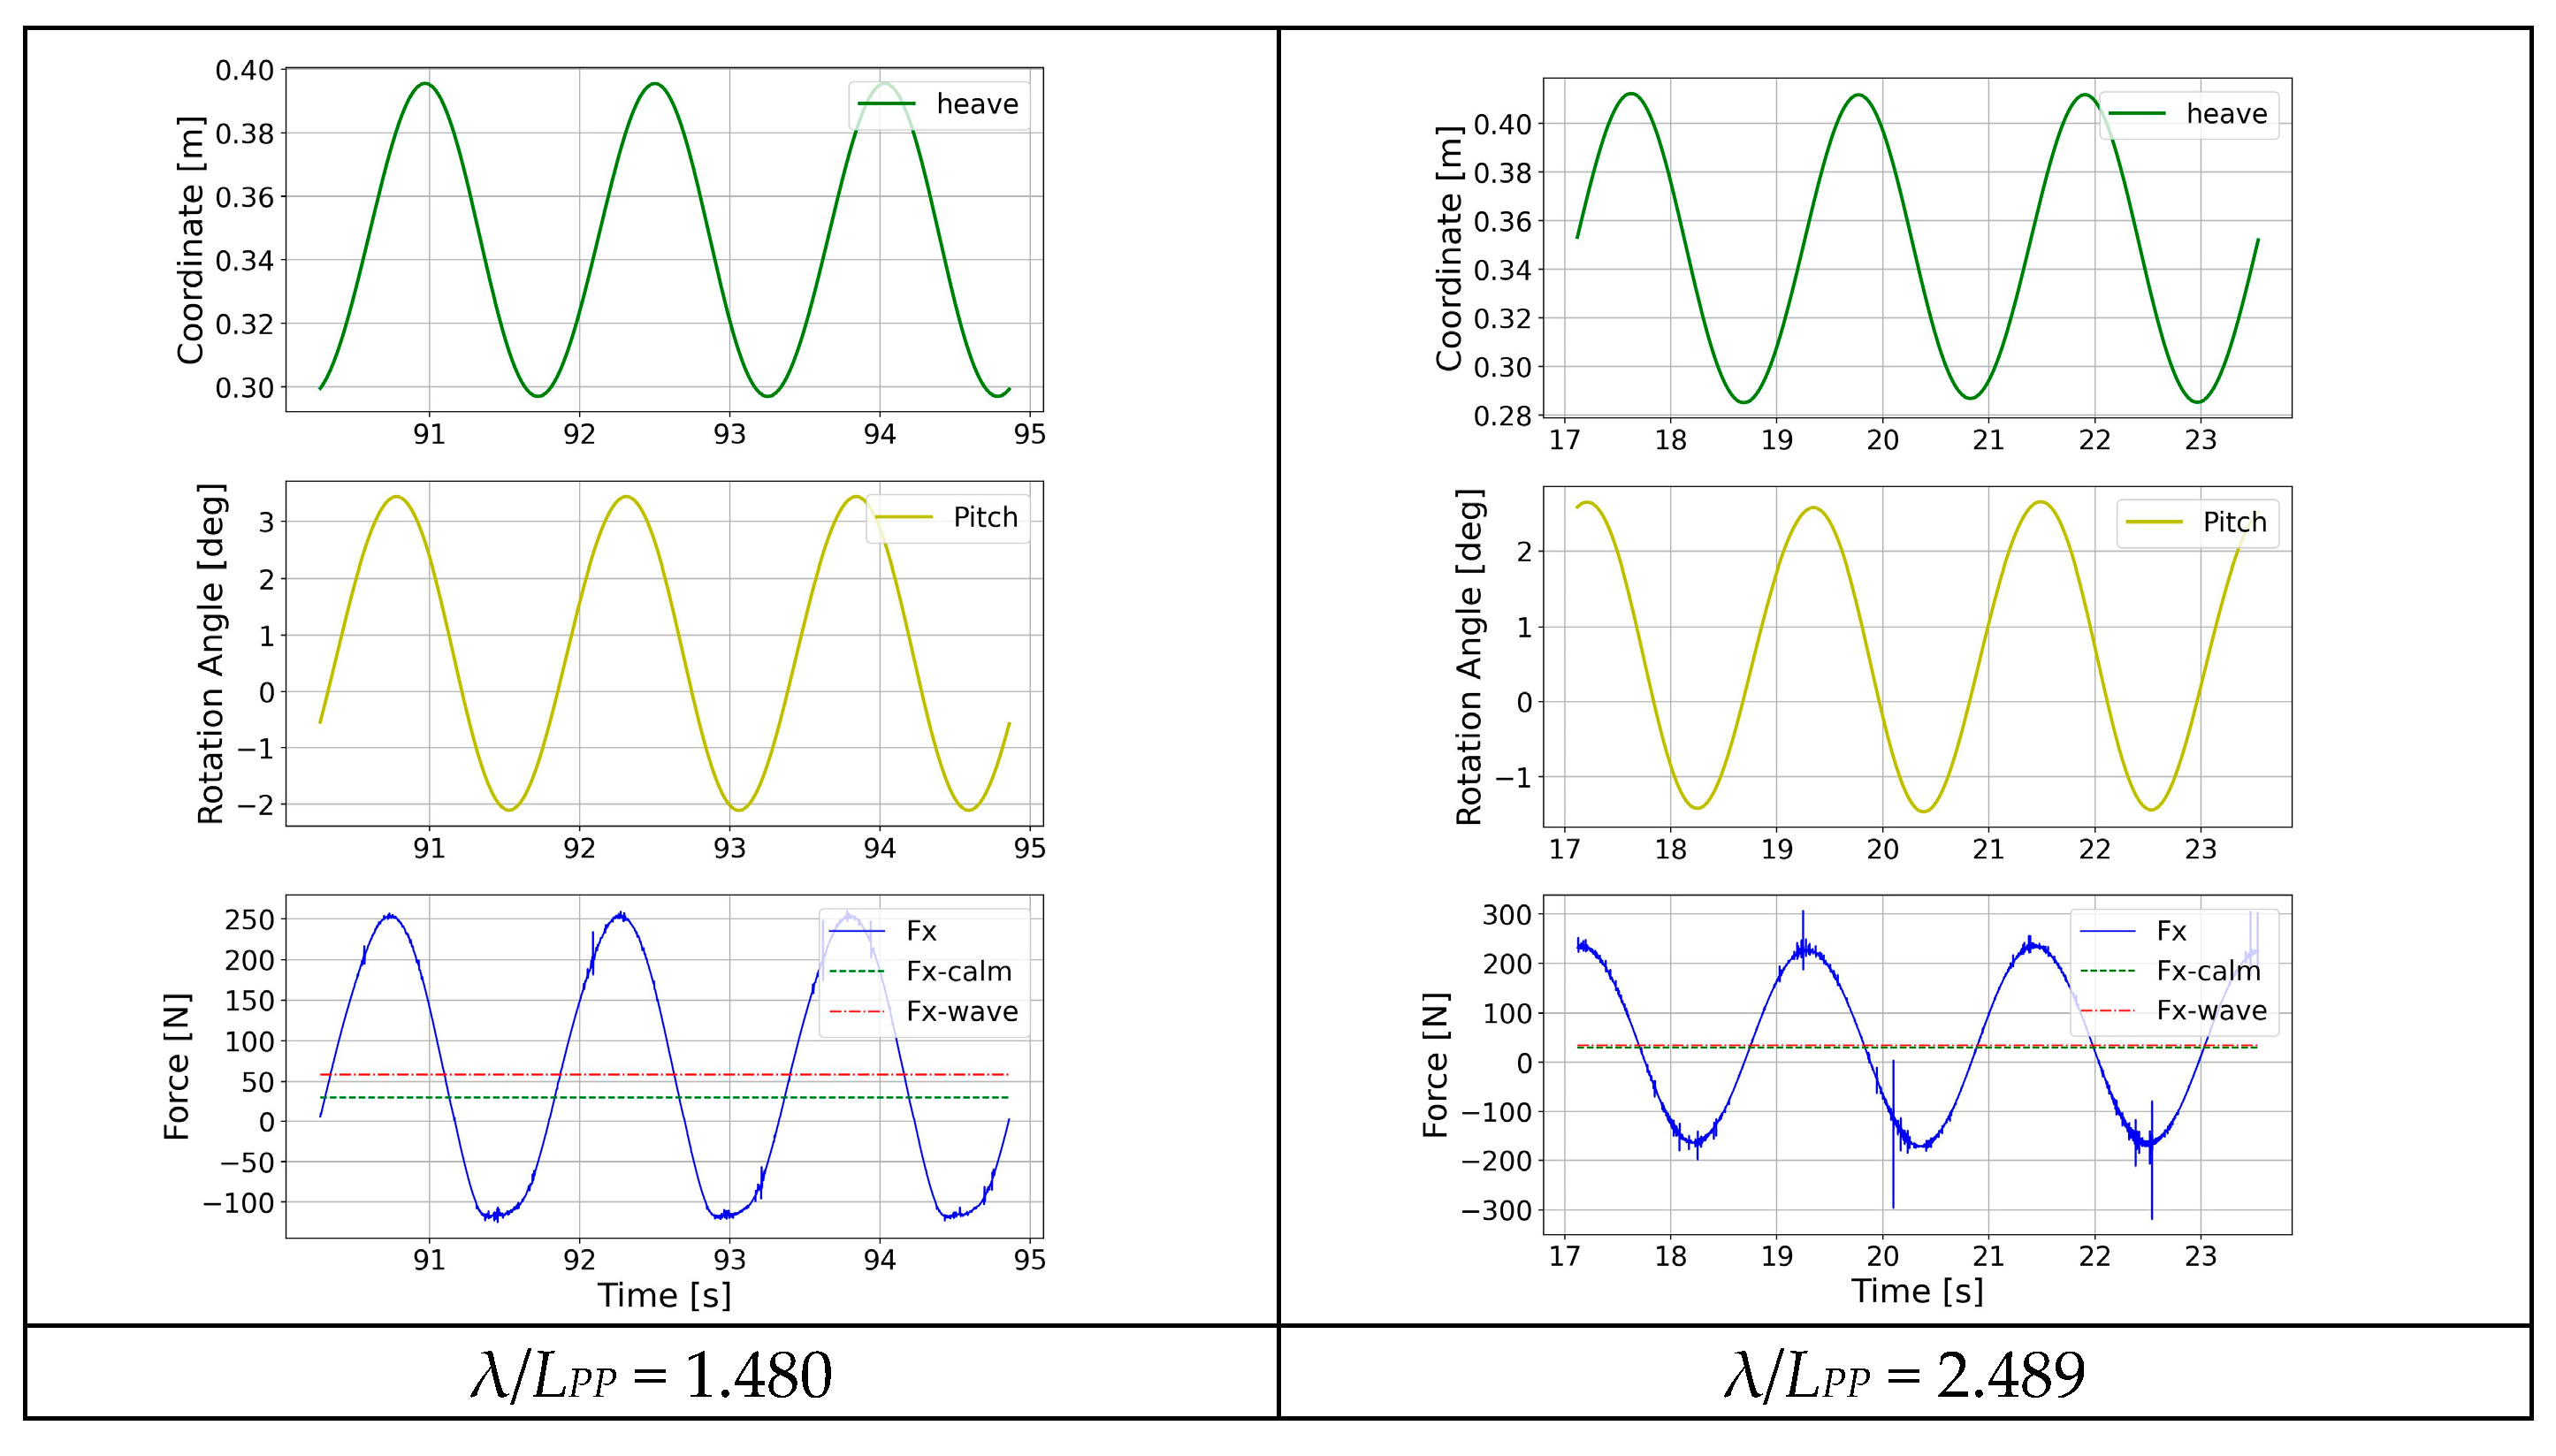
Figure 12 gives the time series of three cycles of heave, pitch, and resistance force for each calculated wave. It can be observed how the shape of the resistance curve changes and presents different harmonics, especially when the waves are close to the resonance of the ship motions, at λ/
LPP = 0.947 and 1.199. On the longer waves λ/
LPP = 1.480 and 2.489, the shape of the resistance force is almost “linear” and in phase with the pitch motion.
3.3. Results Comparison in Beam Waves
A detailed analysis of calculated responses is shown in
Figure 13,
Figure 14,
Figure 15 and
Figure 16. Analogous to the head wave case, in
Figure 15, the numerical domain is given, showing the interference of the incoming wave and waves generated by the advancing ship on the left and the pressure field on the hull and the instantaneous wetted surface on the right side.
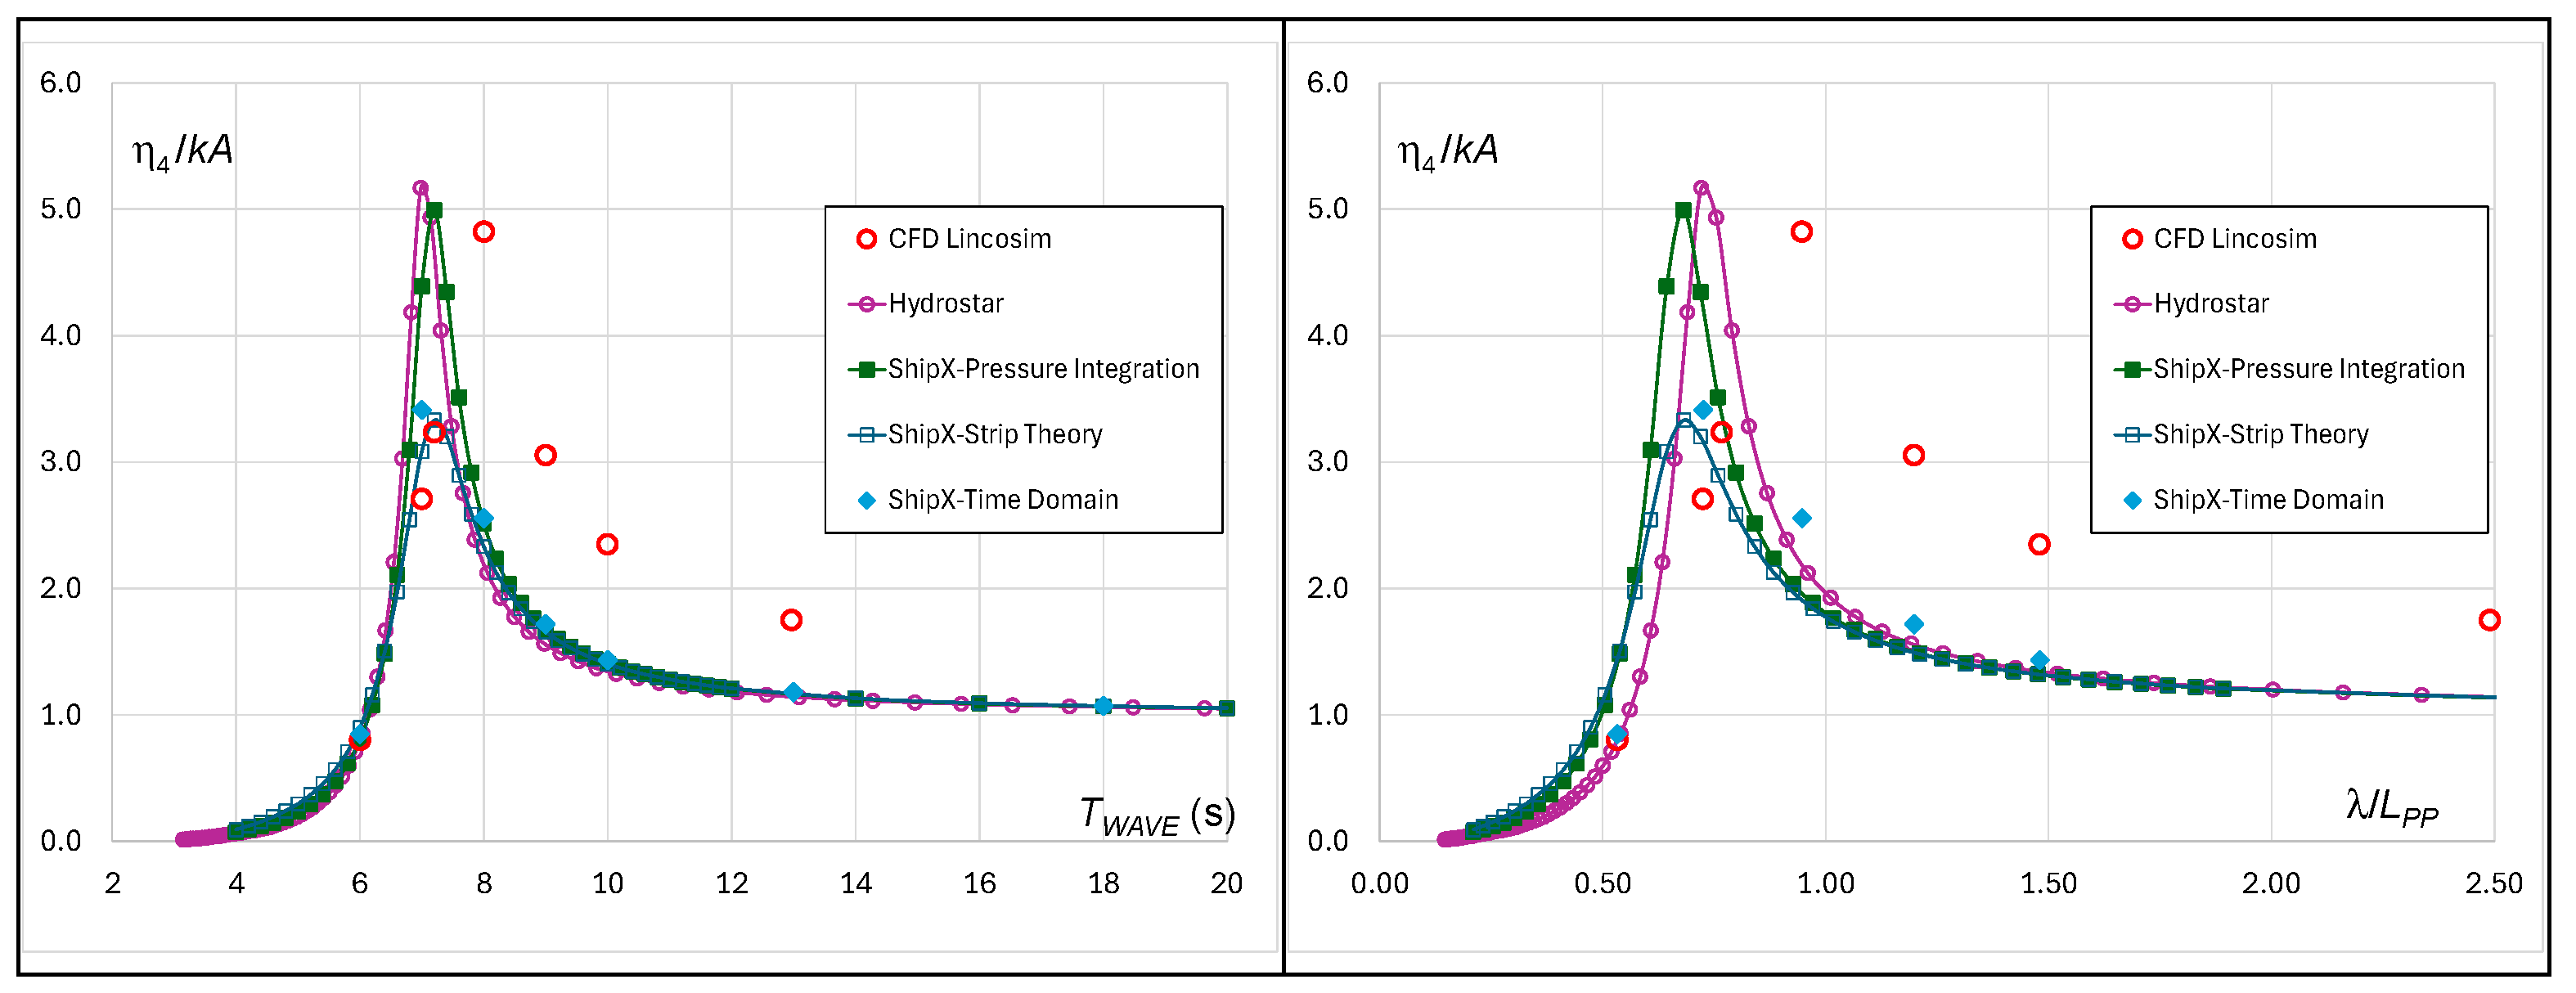
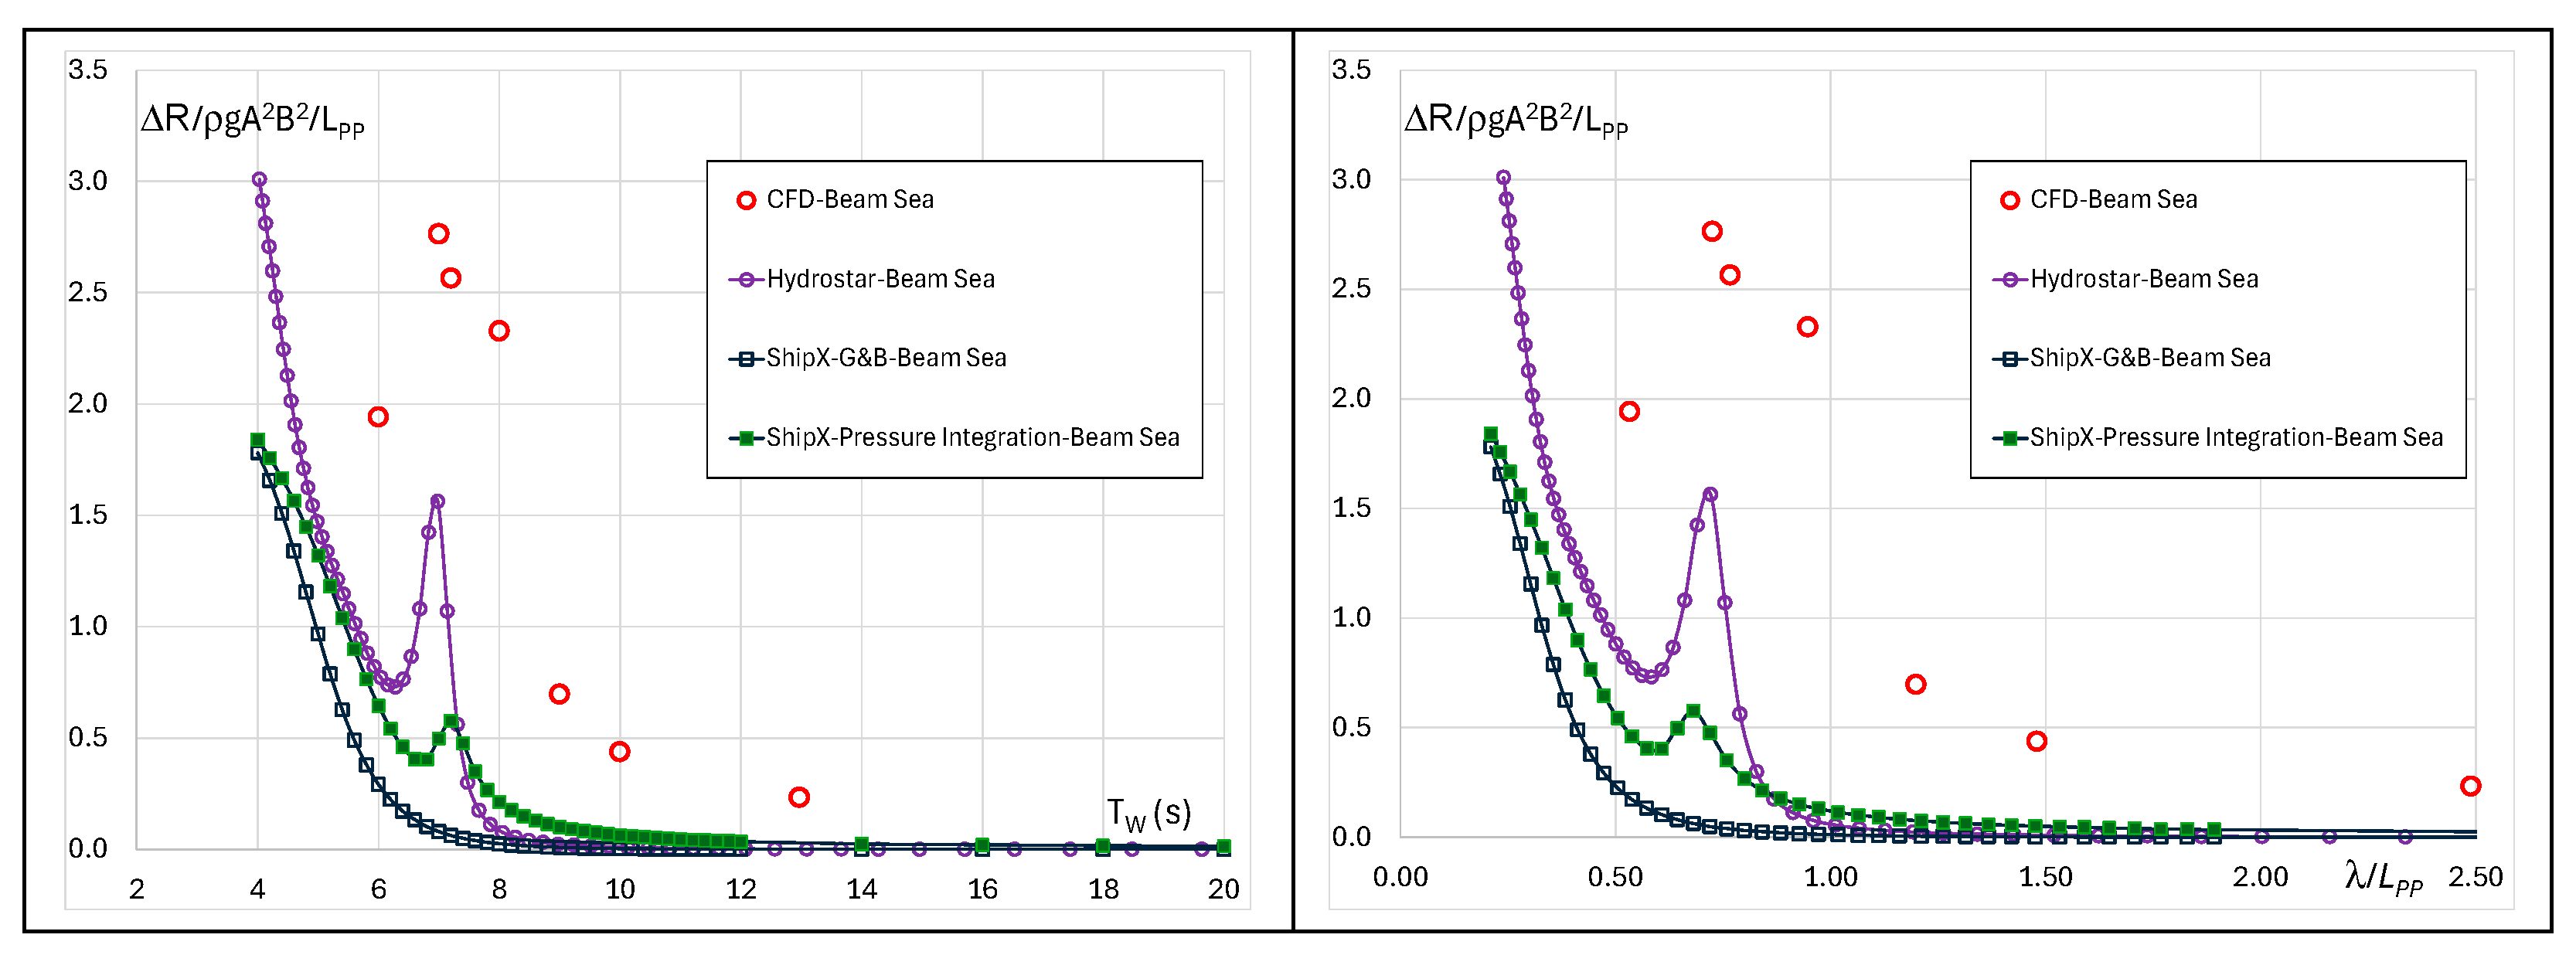
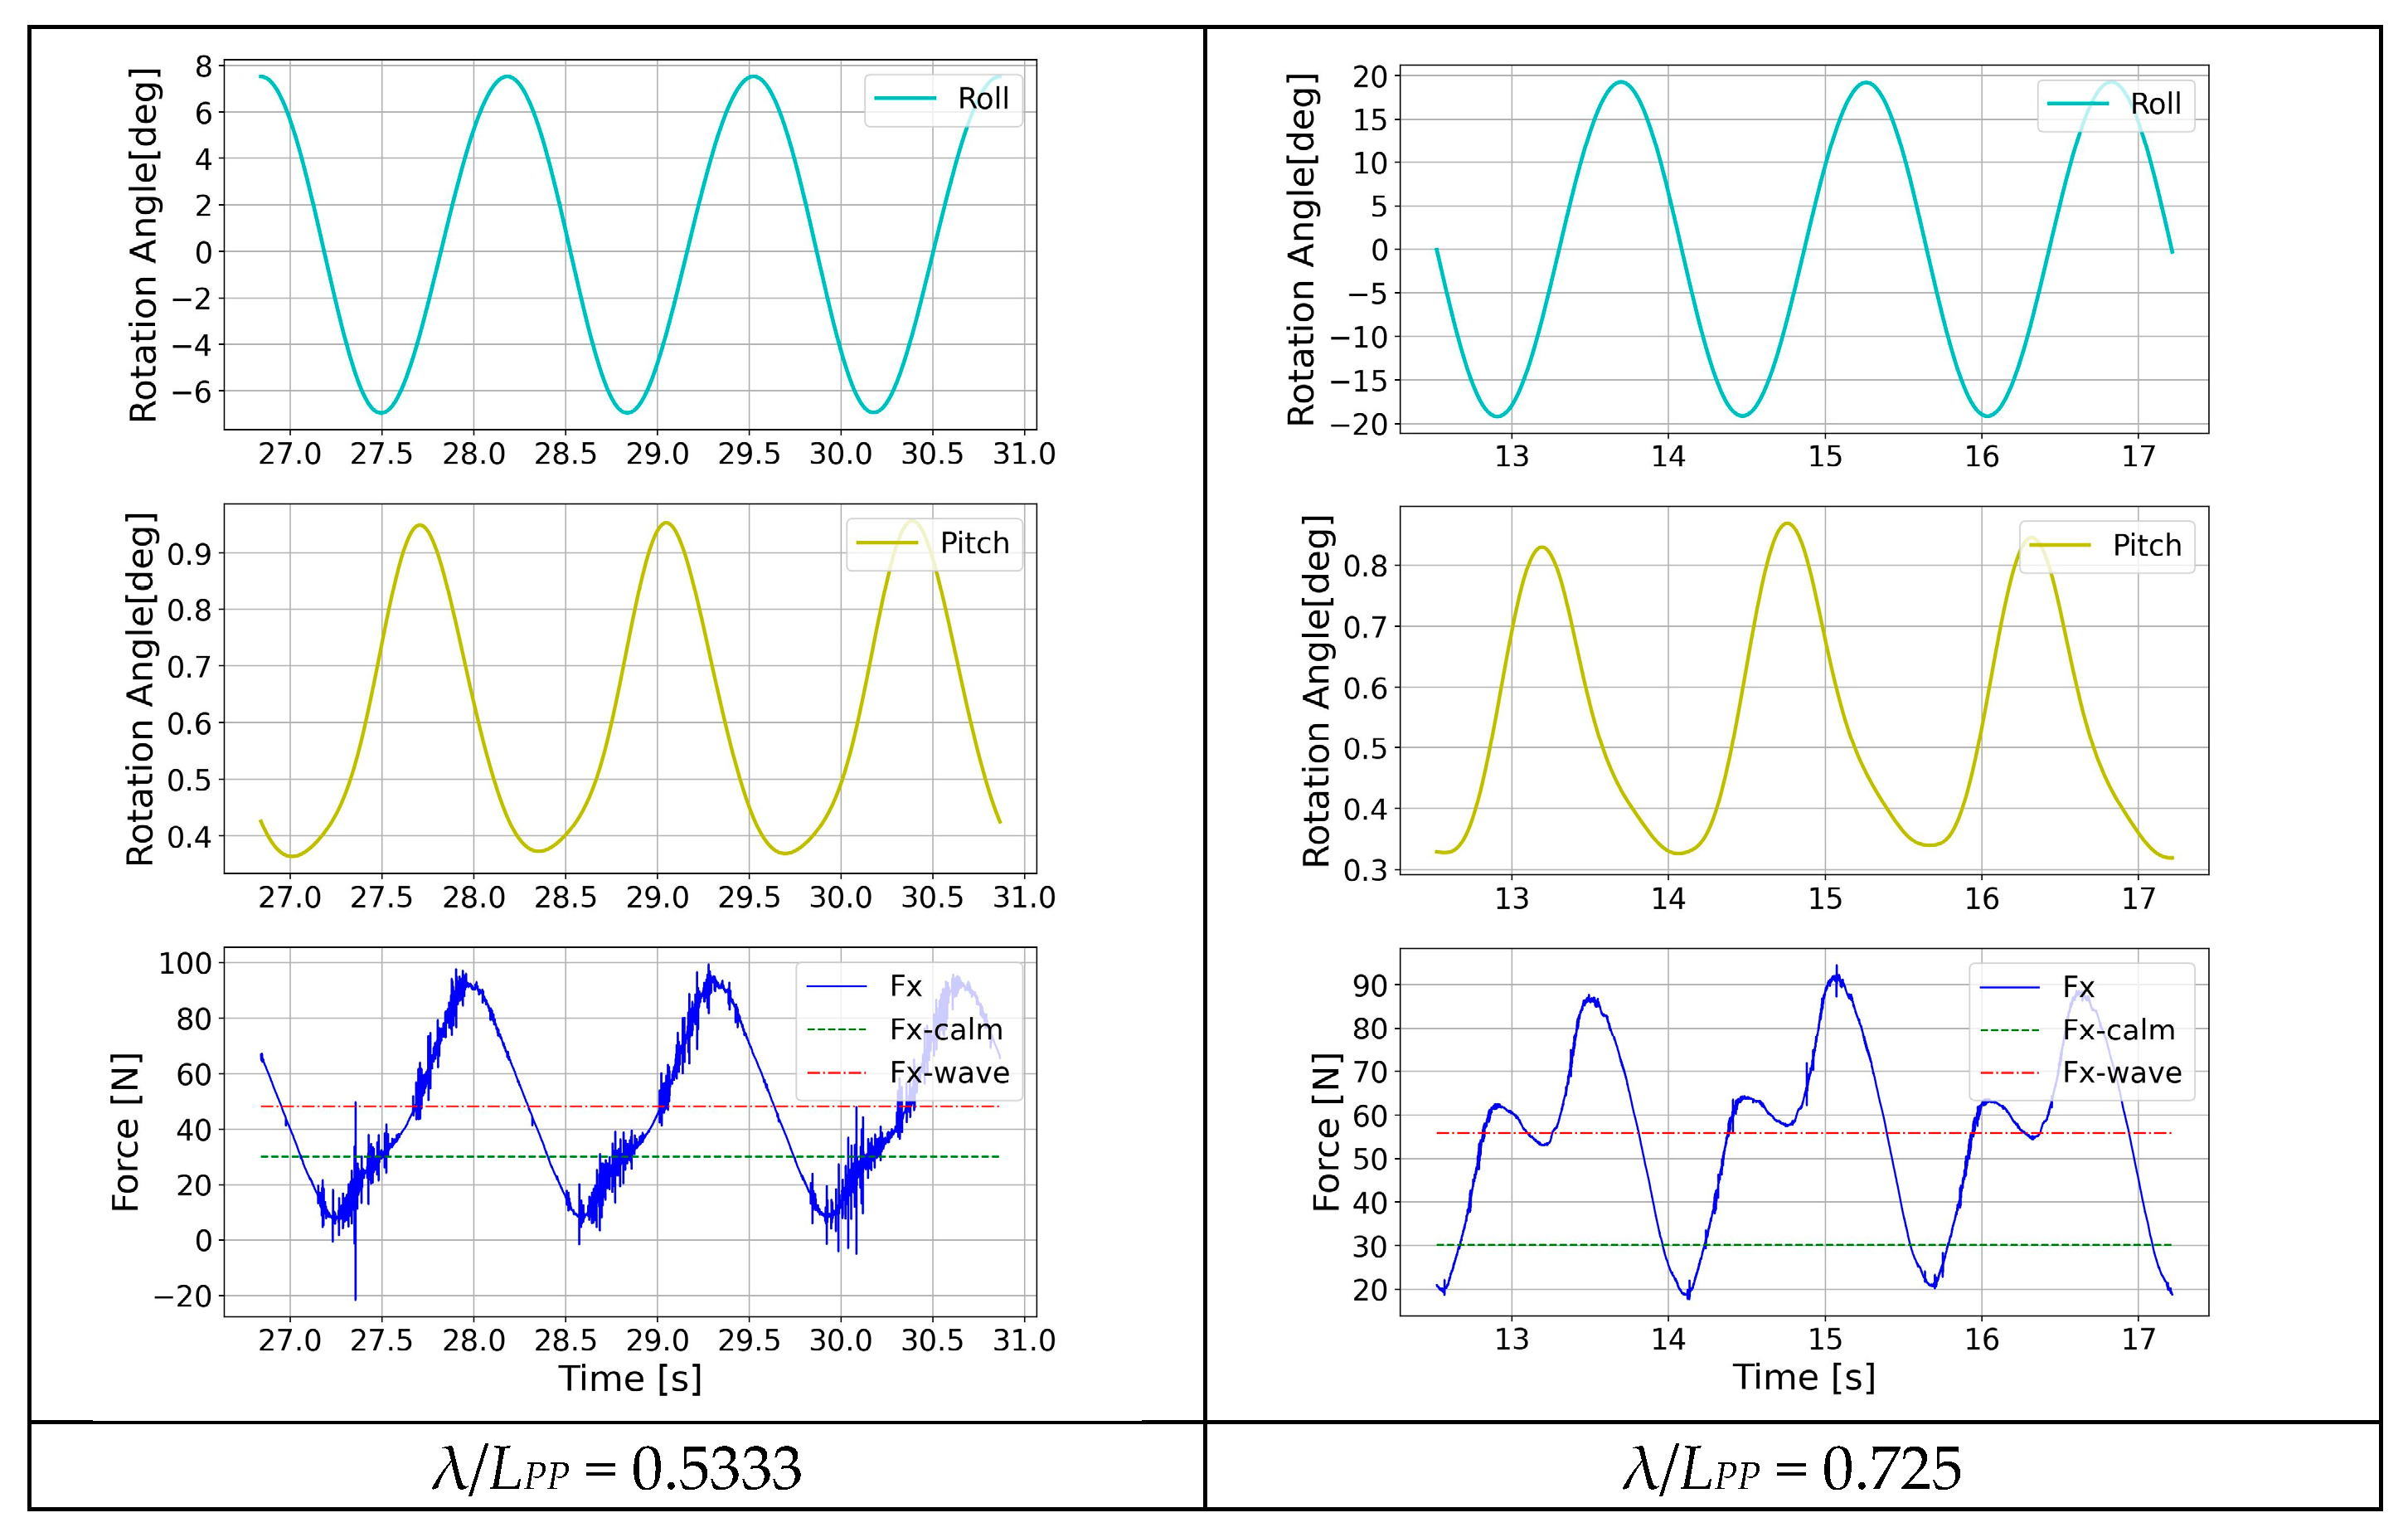
Figure 16 gives wave the time series of three cycles of roll, pitch, and resistance force for each calculated. It is interesting to note in these figures that the shape of the resistance force is very similar to the shape of the pitch motion, even though pitch amplitude is very small with respect to the roll amplitude. Except for the two shorter waves, the resistance force is in phase with the pitch motion. Only for beam sea, the additional CFD simulation is performed at 7.2 s, close to the period where all potential-flow methods are showing the resonance roll, but it can be observed that the resonance in roll for the CFD is occurring around 8 s. The small difference in the roll resonance period also exists among the potential-flow methods. Without the experimental validation, it cannot be said what is the most accurate solution, but the CFD has a mathematical model which better describes the physics of the phenomenon: it considers the wave system interactions, instantaneous wetted surface, and viscosity and turbulence of the fluid, while all these are neglected in the potential-flow methods or taken into account by different empirical expressions.
4. Discussion and Conclusions
From the performed simulations, it can be seen that the use of CFD in the complex hydrodynamic problems of the ship advancing in waves can give results which cannot be obtained by experiments or by low-fidelity methods. This makes CFD a very attractive tool at the design stage where the hull form modifications are still possible and many design alternatives could be “tested” to obtain the optimized ship design. The theories implemented in ShipX have provided very consistent results for head sea as well as for beam sea. In general, for the vertical motions, classic strip theory is closer to the CFD results, while for the roll, direct pressure integration gives the results comparable to the one obtained by CFD. Hydrostar results for heave and pitch in head sea are higher than all others, while for the roll in beam sea, the results from Hydrostar and direct pressure integration of ShipX are almost identical.
Regarding added resistance, it can be observed that in head waves Hydrostar and CFD simulations give almost identical results. It can be observed that the Gerritsma and Beukelman method perfectly follows the CFD results for the waves lower than the resonance whereas for the longer waves the pressure integration method is in better agreement with CFD, but both methods underestimate the CFD and Hydrostar results. This difference can be explained by the interaction of ship and incident wave systems, which is neglected in the 2D methods. It can be observed that both ShipX methods are using Faltinsen asymptotic solution at wave periods lower than 6 s, and that the results are artificially changing trends and decrease monotonically to a very small finite value.
For the beam sea, there is a difference in numerical values between CFD and Hydrostar and in trends and numerical values between CFD and ShipX. The added resistance results of Gerritsma and Beukelman and direct pressure integration methods are very low for all wave periods. Direct pressure integration shows a little resonance around the 7 s wave. CFD results show the resonance peak at the 7 s wave, and the maximum is approximately one half of the value in head sea but five times the values obtained from the DPI. This behaviour can be explained by the interactions of different wave systems—incident wave, diffraction wave, advancing ship waves, and waves radiated from the ship due to her motions—as can be seen in
Figure 11 and
Figure 15. It is also evident that the 3D panel method considers these interactions better than 2D methods. Furthermore, it can be observed from the time series shown in
Figure 12 and
Figure 16 how the form of the curve of resistance in waves is very similar to the time series of pitch and composed by multiple frequencies. This is particularly evident in beam sea, even in long waves (T
WAVE = 10 and 13 s), while in head sea, for the same waves (10 and 13 s), the added resistance curve has a very regular sinusoidal form, indicating linearity of the phenomenon. Where the motions have their resonance, the resistance in a wave curve has more harmonics due to the motions and wave systems interferences. In conclusion, the necessity of the dedicated experimental campaign to assess the validity of each method can be pointed out.
The shortcoming of application of CFD in wider scale is related to the high cost of computational resources and the necessity for expert users, and the final decision will be the compromise between the required accuracy and resources availability. According to calm-water reference data, at the given reference velocity, the mesh size was about 2 million cells, and the computational effort was about 16 h on 100 computational cores. Wave simulations can rapidly become computationally intensive and demanding. For the given cases, the half-domain mesh was about 5 million cells (head waves), while for the same condition, the full-domain mesh was double this value (beam waves). The computational time to result was about 100 h using 100 cores.
Furthermore, the time domain needs to be resolved for long time periods, hundreds of seconds, using a sufficiently small integration time step. The resulting computational effort required to solve this kind of modeling in a reasonable amount of time requires significant computational power. Considering the average number of optimal mesh cell per computational core of about 25.000, we can estimate the need to use a number of cores that ranges from 100 to 300 or more according to mesh sizes. It is evident that HPC is the only way to face these kinds of models thanks to its large core availability and low latency interconnection networks.
Finally, considering that licenced CFD software still have almost prohibitive costs for highly parallel licencing conditions like the one needed for hull/wave interaction models, the necessity of open-source CFD code business model remains the only way to implement an affordable workflow.
Author Contributions
Conceptualization, E.B.; methodology, E.B. and R.P.; software, E.B., R.P., F.S. and G.R.; validation, E.B., R.P., F.S. and G.R.; data curation, E.B.; writing—original draft preparation, E.B.; writing—review and editing, E.B., R.P., F.S., G.R. and A.B.; visualization, project administration, A.B.; funding acquisition, A.B. All authors have read and agreed to the published version of the manuscript.
Funding
This research received no external funding.
Data Availability Statement
The data are contained within the article.
Acknowledgments
Authors greatly acknowledge the data shared by Levante Ferries in the person of Kyriakos Mahos.
Conflicts of Interest
The authors declare no conflicts of interest.
References
- Kim, Y.; Kim, J.-H. Benchmark study on motions and loads of a 6750-TEU containership, Ocean Engineering. Ocean Eng. 2016, 119, 262–273. [Google Scholar] [CrossRef]
- Parunov, J.; Badalotti, T.; Feng, Q.; Gu, X.; Iijima, K.; Ma, N.; Qiu, W.; Wang, S.; Wang, X.; Yang, P.; et al. Benchmark on the prediction of whipping response of a warship model in regular waves. Mar. Struct. 2024, 94, 103549. [Google Scholar] [CrossRef]
- Parunov, J.; Soares, C.G.; Hirdaris, S.; Iijima, K.; Wang, X.; Brizzolara, S.; Qiu, W.; Mikulić, A.; Wang, S.; Abdelwahab, H.S. Benchmark study of global linear wave loads on a container ship with forward speed. Mar. Struct. 2022, 84, 103162. [Google Scholar] [CrossRef]
- Parunov, J.; Ćorak, M.; Soares, C.G.; Jafaryeganeh, H.; Kalske, S.; Lee, Y.; Liu, S.; Papanikolaou, A.; Prentice, D.; Prpić-Oršić, J.; et al. Benchmark study and uncertainty assessment of numerical predictions of global wave loads on damaged ships. Ocean Eng. 2020, 197, 106876. [Google Scholar] [CrossRef]
- Bunnik, T.; van Daalen, E.; Kapsenberg, G.; Shin, Y.; Huijsmans, R.; Deng, G.; Delhommeau, G.; Kashiwagi, M.; Beck, B. A comparative study on state-of-the-art prediction tools for seakeeping. In Proceedings of the 28th Symposium on Naval Hydrodynamics, Pasadena, CA, USA, 12–17 September 2010. [Google Scholar]
- Shigunov, V.; el Moctar, O.; Papanikolaou, A.; Potthoff, R.; Liu, S. International benchmark study on numerical simulation methods for predictions of manoeuvrability of ships in waves. Ocean Eng. 2018, 165, 365–385. [Google Scholar] [CrossRef]
- Sigmund, S.; el Moctar, O. Numerical and experimental investigation of added resistance of different ship types in short and long waves. Ocean Eng. 2018, 147, 51–67. [Google Scholar] [CrossRef]
- Park, D.M.; Lee, J.H.; Lee, J.; Kim, B.S.; Yang, K.K.; Kim, Y.; Lee, Y.G.; Kim, T.; Yang, J.H.; Song, K.H.; et al. Comparative study on added resistance of a container ship in waves. In Proceedings of the 29th International Ocean and Polar Engineering Conference, Honolulu, HI, USA, 16–21 June 2019. [Google Scholar]
- Sulovsky, I.; de Hauteclocque, G.; Greco, M.; Prpić-Oršić, J. Comparative Study of Potential Flow and CFD in the Assessment of Seakeeping and Added Resistance of Ships. J. Mar. Sci. Eng. 2023, 11, 641. [Google Scholar] [CrossRef]
- Chen, C.; Liu, Y.-D.; He, Y.-P.; Chen, Z.; Zheng, G.-Y. Numerical analysis of added resistance in head waves on a Polar Research Vessel and conventional ships. Ocean Eng. 2021, 233, 108888. [Google Scholar] [CrossRef]
- Liu, S.; Papanikolaou, A. Improvement of the prediction of the added resistance in waves of ships with extreme main dimensional ratios through numerical experiments. Ocean Eng. 2023, 273, 113963. [Google Scholar] [CrossRef]
- Liu, S.; Papanikolaou, A. Regression analysis of experimental data for added resistance in waves of arbitrary heading and development of a semi-empirical formula. Ocean Eng. 2020, 206, 107357. [Google Scholar] [CrossRef]
- Liu, S.; Shang, B.; Papanikolaou, A.; Bolbot, V. Improved Formula for Estimating Added Resistance of Ships in Engineering Applications. J. Mar. Sci. Appl. 2016, 15, 442–451. [Google Scholar] [CrossRef]
- Liu, S.; Papanikolaou, A. Fast approach to the estimation of the added resistance of ships in head waves. Ocean Eng. 2016, 112, 211–225. [Google Scholar] [CrossRef]
- Weller, H.G.; Tabor, G.; Jasak, H.; Fureby, C. A tensorial approach to computational continuum mechanics using object-oriented techniques. Comput. Phys. 1998, 12, 620–631. [Google Scholar] [CrossRef]
- Begovic, E.; Bertorello, C.; Ponzini, R.; Salvadore, F. Planing Hull Hydrodynamic Performance Prediction Using LincoSim Virtual Towing Tank. J. Mar. Sci. Eng. 2024, 12, 794. [Google Scholar] [CrossRef]
- Di Ilio, G.; Bionda, A.; Ponzini, R.; Salvadore, F.; Cigolotti, V.; Minutillo, M.; Georgopoulou, C.; Mahos, K. Towards the design of a hydrogen-powered ferry for cleaner passenger transport. Int. J. Hydrogen Energy 2024, 95, 1261–1273. [Google Scholar] [CrossRef]
- Hogben, N.; Dacunha, N.M.C.; Oliver, G.F. Global Wave Statistics; British Maritime Technology Limited: London, UK, 1986. [Google Scholar]
- Salvadore, F.; Ponzini, R. LincoSim: A Web Based HPC-Cloud Platform for Automatic Virtual Towing Tank Analysis. J. Grid Comput. 2019, 17, 771–795. [Google Scholar] [CrossRef]
- Salvadore, F.; Ponzini, R.; Arlandini, C. Improving the productivity of hull designers with HPC in the cloud: The LincoSim experience. In Proceedings of the 2019 IEEE International Conference on Systems, Man and Cybernetics (SMC), Bari, Italy, 6–9 October 2019; IEEE: New York, NY, USA, 2019. [Google Scholar] [CrossRef]
- Ponzini, R.; Salvadore, F.; Begovic, E.; Bertorello, C. Automatic CFD analysis of planing hulls by means of a new web-based application: Usage, experimental data comparison and opportunities. Ocean Eng. 2020, 210, 107387. [Google Scholar] [CrossRef]
- Salvadore, F.; Ponzini, R.; Duque, J.H.; Reinaldos, C.A.; Soler, J.M. Automatic CFD analysis of a multiplatform catamaran by means of a web-based application: Experimental data comparison for a fully automated analysis process. Appl. Ocean Res. 2021, 116, 102886. [Google Scholar] [CrossRef]
- Perić, R.; Vukčević, V.; Abdel-Maksoud, M.; Jasak, H. Optimizing wave generation and wave damping in 3D-flow simulations with implicit relaxation zones. Coast. Eng. 2022, 171, 104035. [Google Scholar] [CrossRef]
- Python Code for Optimal Lambda Computation. Available online: https://github.com/wave-absorbing-layers/relaxation-zones-for-free-surface-waves (accessed on 15 April 2025).
- Manual Usage of the Python Code for Optimal Lambda Computation. Available online: https://usermanual.wiki/Document/Manual.2128294547.pdf (accessed on 15 April 2025).
- Berndt, J.; Peric, R.; Abdel-Maksoud, M. Influence of Wave Steepness on Second-Order Forces and Ship Maneuvering. In Proceedings of the 34th Symposium on Naval Hydrodynamics, Washington, DC, USA, 26 June–1 July 2022. [Google Scholar]
- Chen, X.B. Hydrodynamics in offshore and naval applications part I. In Proceedings of the Keynote Lecture on the 6th International Conference on Hydrodynamics, Perth, Australia, 24–26 November 2004. [Google Scholar]
- Chen, X.B. New Formulations of the Second-Order Wave Loads, Rapp. Technique, NT2840/DR/XC; Bureau Veritas: Paris, France, 2004. [Google Scholar]
- Salvesen, N.; Tuck, E.O.; Faltinsen, O. Ship Motions and Sea Loads. Trans. Soc. Nav. Archit. Mar. Eng. 1970, 78, 250–287. [Google Scholar]
- Gerritsma, J.; Beukelman, W. Analysis of the resistance increase in waves of a fast cargo ship. Int. Shipbuild. Prog. 1972, 19, 285–293. [Google Scholar] [CrossRef]
- Loukakis, T.A.; Sclavounos, P.D. Some extensions of the classical approach to strip theory of ship motions, including the calculation of mean added forces and moments. J. Ship Res. 1978, 22, 1–19. [Google Scholar] [CrossRef]
- Faltinsen, O.; Minsaas, K.J.; Liapis, N.; Skjørdal, S.O. Prediction of resistance and propulsion of a ship in a seaway. In Proceedings of the 13th Symposium on Naval Hydrodynamics, Tokyo, Japan, 6–10 October 1980. [Google Scholar]
- Faltinsen, O.M.; Zhao, R. Numerical predictions of ship motions at high forward speed. Phil. Trans. R. Soc. Lond. A 1991, 334, 241–252. [Google Scholar]
Figure 1.
Hull form of the RoPax ferry.
Figure 1.
Hull form of the RoPax ferry.
Figure 2.
Scatter diagram of Annual Wave Statistics in Area 27, according to [
18].
Figure 2.
Scatter diagram of Annual Wave Statistics in Area 27, according to [
18].
Figure 3.
Example of forcing zone.
Figure 3.
Example of forcing zone.
Figure 4.
The hull and wave surface mesh details and cutting plane of the domain.
Figure 4.
The hull and wave surface mesh details and cutting plane of the domain.
Figure 5.
The hull representation by panels in Hydrostar software.
Figure 5.
The hull representation by panels in Hydrostar software.
Figure 6.
The hull representation in ShipX software.
Figure 6.
The hull representation in ShipX software.
Figure 7.
Resistance simulation in calm water.
Figure 7.
Resistance simulation in calm water.
Figure 8.
Comparison of Heave RAO in head sea at Fr = 0.224.
Figure 8.
Comparison of Heave RAO in head sea at Fr = 0.224.
Figure 9.
Comparison of Pitch RAO in head sea at Fr = 0.224.
Figure 9.
Comparison of Pitch RAO in head sea at Fr = 0.224.
Figure 10.
Comparison of Added Resistance in head sea at Fr = 0.224.
Figure 10.
Comparison of Added Resistance in head sea at Fr = 0.224.
Figure 11.
Head wave visualization for wave TWAVE = 2.012 s (λ/LPP = 1.199).
Figure 11.
Head wave visualization for wave TWAVE = 2.012 s (λ/LPP = 1.199).
Figure 12.
Heave, pitch, and added resistance time series in head sea at Fr = 0.224.
Figure 12.
Heave, pitch, and added resistance time series in head sea at Fr = 0.224.
Figure 13.
Comparison of roll RAO in beam sea at Fr = 0.224.
Figure 13.
Comparison of roll RAO in beam sea at Fr = 0.224.
Figure 14.
Comparison of added resistance in beam sea at Fr = 0.224.
Figure 14.
Comparison of added resistance in beam sea at Fr = 0.224.
Figure 15.
Beam wave visualization for wave TWAVE = 2.012 s (λ/LPP = 1.199).
Figure 15.
Beam wave visualization for wave TWAVE = 2.012 s (λ/LPP = 1.199).
Figure 16.
Roll, Pitch, Added resistance time series in beam sea at Fr = 0.244.
Figure 16.
Roll, Pitch, Added resistance time series in beam sea at Fr = 0.244.
Table 1.
Principal characteristics of the RoPax ferry.
Table 1.
Principal characteristics of the RoPax ferry.
| Name | ITTC Symbol | SI Unit | Value |
|---|
| Length overall | LOA | m | 118.80 |
| Length between perpendiculars | LPP | m | 105.50 |
| Beam max | BOA | m | 20.00 |
| Draft | T | m | 4.75 |
| Displacement | Δ | t | 5841.92 |
| Maximum speed | VMAX | kn | 19 |
| Froude number at 14 kn | Fr | - | 0.224 |
| Number of passengers/crew | - | 1140/24 |
| Number of cars/cars + trucks | - | 310/130 + 32 |
Table 2.
Operational profile of the RoPax ferry, as provided by Levante Ferries.
Table 2.
Operational profile of the RoPax ferry, as provided by Levante Ferries.
| Operational Profile | Sea State WMO | Wave Period
[s] | Wave Height
[m] | Vessel Speed
[kn] |
|---|
| Bunkering | 1 | - | 0.01 | 0 |
| Seakeeping Operability | 3 | 3–6 | 0.5–1.2 | 15–17 |
| Seakeeping Extreme | 5 | 6–8 | 2.5–3.0 | 14 |
Table 3.
LincoSim calm-water results for the Levante Ferries RoPax ferry.
Table 3.
LincoSim calm-water results for the Levante Ferries RoPax ferry.
| Quantity | SI Unit | LincoSim Mesh | Wave Modeling Mesh |
|---|
| Total drag | N | 30.194 | 30.51 |
| Pressure drag | N | 8.978 | 9.57 |
| Viscous drag | N | 21.216 | 20.94 |
| Final displacement | kg | 730.488 | 730.84 |
| Final sink | m | 0.348 | 0.347 |
| Final pitch | deg | 0.625 | 0.615 |
| Wetted surface area | m2 | 5.986 | 5.944 |
| Maximum pressure on hull | Pa | 2367.780 | 2352.660 |
| Minimum pressure on hull | Pa | −20.256 | −21.42 |
Table 4.
Summary of the performed CFD runs in regular waves.
Table 4.
Summary of the performed CFD runs in regular waves.
| TWAVE | TWAVE-M | AWAVE-M | λ-M | λ/LPP | H/λ |
|---|
| [s] | [s] | [m] | [m] | - | - |
| 6.0 | 1.342 | 0.075 | 2.810 | 0.533 | 1/18.9 |
| 7.0 | 1.565 | 0.075 | 3.824 | 0.725 | 1/25.6 |
| 8.0 | 1.789 | 0.075 | 4.996 | 0.947 | 1/33.3 |
| 9.0 | 2.012 | 0.075 | 6.323 | 1.199 | 1/41.7 |
| 10.0 | 2.236 | 0.075 | 7.806 | 1.480 | 1/52.6 |
| 12.97 | 2.900 | 0.075 | 13.131 | 2.489 | 1/90.9 |
| Disclaimer/Publisher’s Note: The statements, opinions and data contained in all publications are solely those of the individual author(s) and contributor(s) and not of MDPI and/or the editor(s). MDPI and/or the editor(s) disclaim responsibility for any injury to people or property resulting from any ideas, methods, instructions or products referred to in the content. |
© 2025 by the authors. Licensee MDPI, Basel, Switzerland. This article is an open access article distributed under the terms and conditions of the Creative Commons Attribution (CC BY) license (https://creativecommons.org/licenses/by/4.0/).

