Article

Multidimensional Maritime Route Modeling Method for Complex Port Waters Considering Ship Handling Behavior Diversity

1
School of Mechanical, Electronic and Control Engineering, Beijing Jiaotong University, Beijing 100044, China
2
The 54th Research Institute of China Electronics Technology Group Corporation, Shijiazhuang 050081, China
*
Author to whom correspondence should be addressed.
J. Mar. Sci. Eng. 2025, 13(10), 1963; https://doi.org/10.3390/jmse13101963
Submission received: 6 August 2025 / Revised: 24 September 2025 / Accepted: 10 October 2025 / Published: 14 October 2025
(This article belongs to the Section Ocean Engineering)

Abstract

The sea area adjacent to ports features a dense network of intricate access routes. Existing route modeling methods exhibit limitations in accurately capturing these complex routes and effectively representing the diverse handling behavior patterns of ships within them. To address this issue, this paper proposes a maritime route modeling method incorporating ship handling behavior (MARSHB) to accurately identify port channels with diverse traffic flows and enabling a multi-dimensional model of heterogeneous vessel behaviors along these channels. Numerical experiments using extensive automatic identification system (AIS) data from the Bohai Sea show that the proposed method reduces the computational time by 49.75% for route extraction compared to the traditional method. For route modeling, MARSHB covers 88.31% of 95% high-density traffic areas, with safety boundaries exhibiting a higher accuracy of conformity with historical trajectory data.

1. Introduction

Each day, over 50,000 vessels navigate the seas, and as primary carriers of maritime transportation, their traffic flow characteristics have garnered significant attention [1]. In particular, in sea areas near ports, shipping routes are densely packed, maritime traffic is heavy, and vessel behavior patterns are complex and varied [2]. Although some recent studies have attempted to model vessel behavior patterns within route-system waters [3], existing work has predominantly focused on collision avoidance mechanisms under rule-based constraints, with limited attention given to the systematic extraction and modeling of diverse traffic flow patterns [4]. However, the inherent distributional complexity of maritime traffic flows represents a critical challenge in intelligent shipping modeling and maritime traffic optimization [5]. Therefore, research on the precise extraction of route patterns and multidimensional structural modeling of varying traffic flow characteristics is of significant importance for supporting digital waterway development, optimizing port scheduling, and enabling high-precision autonomous navigation [6].
Vessel handling behavior is not static but dynamically adjusted in response to navigational environments and destinations. This diversity in handling behavior is especially evident near port entry and exit routes, where ships must adapt to traffic flows, scheduling directives, and berthing demands. Such complexities require frequent changes in speed and turning behaviors [7]. Accurately characterizing vessel handling patterns along port approach routes is crucial for enhancing maritime traffic management and ensuring navigational safety [8].
Maritime route modeling is essential for understanding vessel behavior and traffic patterns [9], typically relying on historical data to extract motion patterns [10] and construct rule-based routes [11]. However, as port infrastructure expands and layouts become more dispersed [12], vessels have greater spatial freedom, increasing modeling complexity. Most studies emphasize spatial features such as geometry and traffic volume but overlook dynamic handling behaviors in complex ports [13], limiting their ability to capture real traffic dynamics. While some methods use AIS big data with spatiotemporal clustering or deep learning to improve accuracy [14], and others incorporate speed changes and traffic density, they still struggle to balance efficiency and precision in high-density settings [15]. Moreover, their focus on spatial characteristics fails to fully represent actual handling behavior patterns during port entry and exit [16].
In conclusion, while route modeling has advanced the understanding of ship behavior, existing methods remain limited. To accurately characterize vessel behavior in near-port areas, two key challenges must be addressed: (1) For extensive AIS datasets, how can we efficiently and accurately extract maritime navigational structures, thereby enhancing the accuracy of network construction? (2) Given the rich spatiotemporal features of trajectory data, how can we overcome the issue of static representations lacking dynamic behavior information and obtain behavior-reflective modeling that comprehensively reflects actual vessel movements?
In light of these challenges, this study proposes an approach for route extraction and modeling in port-adjacent sea areas based on extensive AIS data. Compared to prior studies, this research introduces spatiotemporal topology to model port routes with uneven traffic density and complex navigation patterns to achieve a multi-dimensional geographic representation of real port traffic dynamics. The contributions of this study are as follows:
  • Aiming at port areas with heavy maritime traffic, an efficient and accurate method was designed to extract port routes with diverse traffic flow characteristics in complex environments, effectively addressing the challenge of balancing efficiency and accuracy in high-density data settings.
  • A characterization method for maritime traffic patterns based on the navigational stage division was proposed. By integrating vessel handling behaviors—such as speed adjustments, obstacle avoidance, and berthing—with spatial features, this approach offers a more comprehensive understanding of ship dynamics in port entry and exit channels. It addresses the limitation in existing studies, which often focus heavily on spatial aspects while underrepresenting real-world operational behaviors.
  • A route safety boundary that integrates spatial features and handling behavior standards was designed. After combining with vessel behavior guidelines, the route model achieves an upgrade from “spatial description” to “behavioral description.”
This paper is organized as follows. Section 2 of this paper describes the existing methods of route modeling. Section 3 is about the study area and data set preparation. Section 4 introduces the route extraction and modeling framework proposed in this paper. Section 5 is about the experimental results of case data. Section 6 presents some discussion, including the accuracy analysis of route extraction and modeling. Section 7 provides a summary of this paper.

2. Related Work

The existing literature presents several methods for maritime route modeling from vessel trajectory data, including grid-based, vector-based, and statistical approaches [11].

2.1. Vector-Based Route Modeling Methods

In vector-based methods, maritime routes are abstracted as combinations of points and segments to construct traffic networks, enabling the exploration of traffic patterns at large regional or global scales [17]. A representative method is the Traffic Route Extraction and Anomaly Detection (TREAD) algorithm proposed by [18], where route points represent stationary objects such as ports or platforms, and segments represent connections between points. Ref. [19] introduced a topological–geometric two-layer maritime network (TTMRN) for intelligent navigation, treating the marine road network as a collection of waypoints and routes. Waypoints include stopping or turning points reflecting changes in ship behavior [20], whereas routes are defined as trajectory sets within waypoint regions.
However, vector-based approaches have limitations in complex port waters. Waypoint extraction is sensitive to threshold selection, and traffic patterns vary by port size, requiring different thresholds across ports [21]. Additionally, frequent vessel maneuvers near berths, such as docking, turning, or fishing activities, may lead to the creation of false stationary zones or spurious route points [22], reducing the reliability of route models. These issues show that vector-based methods may not consistently capture real navigational behavior in dynamic port environments.

2.2. Grid-Based Route Modeling Methods

Grid-based methods reorganize raw traffic data using a grid indexing system and count the data within each grid to represent the maritime traffic characteristics. Ref. [23] applied this method to construct a traffic density map of representative routes for the maritime traffic conditions in Korean waters. However, this method only focuses on cargo ships and oil tankers. Ref. [24] proposed a grid-based speed pattern recognition method to extract speed patterns from AIS data near the Suez Canal in 2022 and reveal possible speed limit rules, converting complex AIS trajectories into interpretable navigation speed patterns. Ref. [25] divided study regions and trajectories into grids, generated trajectory density maps, and applied kernel density estimation (KDE) to estimate grid indices for collision candidate detection and route boundary extraction. However, this method does not take into account the handling behavior pattern of the vessel.
Although grid-based methods perform well in large-scale or sparsely trafficked areas [26], they face limitations in complex port waters, where dense and intersecting routes can cause cell-level statistics to overlook local details or produce suboptimal paths [27]. Moreover, grid size selection is highly sensitive in narrow channels: overly fine grids incur high computational costs, while overly coarse ones fail to capture detailed route characteristics [8]. As a result, traditional grid methods may not reliably represent actual navigation patterns in port environments.

2.3. Statistical Route Modeling Methods

Statistical methods focus on modeling vessel traffic flow characteristics, such as traffic volume, capacity, speed distribution, and lateral distribution [28]. Among these methods, cluster analysis is a commonly used approach. It groups trajectories by similarity to extract major routes and characterize their features [29]. This method has been widely applied to characterize vessel behavior and detect abnormal navigation [30,31]. Ref. [32] extracted main channels using OD–Hausdorff trajectory clustering, selected 100 observation points along the main channel, and computed the MAE of lateral offsets to model ship deviation. However, the method relies on empirically set parameters. Ref. [33] used 75% KDE to define route widths and applied the observation line method to analyze ship speed distributions. This route boundary definition approach, based on observed lines, has proven to be a potential solution for marine traffic research.
However, traditional statistical methods face limitations in capturing complex ship dynamics in intricate port waterways. Recent studies have applied spatio-temporal density analysis, such as Space-Time Kernel Density Estimation (STKDE) [34], to identify high-activity zones and characterize navigation patterns. For example, ref. [35] applied trajectory compression and adaptive clustering to extract seven main routes from Houston Port AIS data and analyze navigation behaviors but did not account for the influence of geographical features. Ref. [36] applied OPTICS clustering with spatiotemporal features to classify routes hierarchically for port traffic modeling but did not differentiate various port scenarios, such as vessel arrival and departure processes. Ref. [37] developed an enhanced MD-DBSCAN with dynamic parameters to extract major routes and construct traffic maps capturing topology and temporal flow.
Clustering-based methods are reliable and easy to implement for identifying representative paths in real time [38], making them increasingly popular for maritime traffic pattern recognition [39]. However, these methods typically rely on local similarity between trajectory points or segments [40]. In port waters, this local focus may fail to capture the overall motion characteristics of vessels, leading to fragmented or incomplete routes. Additionally, the high and uneven vessel density limits the adaptability of fixed clustering methods or parameters to local conditions [41], often resulting in distorted or missed route detection.

2.4. General Remarks

Although existing route modeling approaches have made progress in identifying representative vessel navigation patterns, their application within port waters still faces challenges [42]. Port channels often have dense and uneven vessel traffic. In such conditions, grid-based methods may miss local details or produce suboptimal routes. Similarly, fixed clustering parameters can lead to incomplete route extraction in mixed-density areas. The dynamic nature of vessel behavior in port areas further highlights the limitations of purely geometric channel models, which fail to capture nuanced handling patterns during entry and departure [7] or to link such behaviors explicitly to ship positions [43].
To address these limitations, this study proposes a novel maritime route modeling framework. For route extraction, the method adopts a port-centered perspective, isolating entry and departure trajectories to reduce interference from transit traffic. For channel modeling, it incorporates spatio-temporal topology for multi-dimensional representation of port traffic dynamics, enabling detailed descriptions of ship handling behaviors along typical port entry and exit paths.

3. Study Area and Data

This study constructs the dataset from AIS records, consisting of anchorage and trajectory data. First, the study area and data scope are introduced; then, anchorage data extraction and spatial distribution are detailed; finally, navigational trajectory construction and classification are presented.

3.1. Study Area

The study area is located in the southwestern part of Bohai Bay, China, encompassing Tianjin Port, Huanghua Port, and Caofeidian Port. These ports are key maritime hubs in northern China, handling major bulk commodities such as coal, iron ore, crude oil, and natural gas [44]. Due to the cargo structure, the region exhibits a pronounced ballast imbalance. Inbound voyages are typically heavily laden, whereas outbound voyages are often lightly laden or in ballast [45]. This imbalance not only increases scheduling and operational costs for shipping enterprises but also directly affects vessel speed, draft, and handling behaviors, making the area a suitable setting for investigating typical inbound and outbound navigation patterns.
AIS data from 1 February to 31 July 2019 were used for analysis. This period covers the transition from late winter to summer, capturing seasonal variations in navigation patterns, and the six-month duration provides sufficient samples for representativeness while avoiding computational redundancy from excessive data volume. The study area spans 117.70° E to 118.50° E and 38.63° N to 39.05° N. A vessel density heat map from one week of AIS data is shown in Figure 1a, illustrating the high concentration and strong representativeness of traffic in the region.
Within the dataset, cargo ships account for over 70% of all trajectories, followed by container ships and tank ships (Figure 1b). Over 40% of tank ship trajectories have a draught under 5 m. In contrast, 99% of container ship trajectories exceed 5 m, with nearly half exceeding 10 m. The draught of cargo ships mostly ranges from 5 to 10 m (Figure 1c).
It should be noted that the AIS data capture seasonal variations between late winter and summer but do not reflect full year-round differences. Furthermore, port operations and shipping arrangements may fluctuate across years, implying that the findings of this study are more indicative of the typical characteristics of the selected period rather than long-term patterns. In addition, as AIS data inevitably contain omissions and anomalies, data cleaning and preprocessing methods in this research [46] were applied to mitigate their effects, though some degree of bias may remain.

3.2. Anchorage Point Data

AIS data mining plays a critical role in the planning of port infrastructure [21]. In port-adjacent waters, anchorage boundaries are often indistinct and cannot be precisely defined by administrative demarcations [47]. Vessel positions during berthing or anchoring effectively reflect actual port utilization. Thus, identifying anchorage points from AIS data is a key method for defining port boundaries [48].
According to the Agreement on Port State Measures (PSMA [49]), the average speed of a mooring ship is close to zero. This study regarded berthing and anchoring events as mooring events. Trajectory points with a speed of less than 0.5 knots and a vessel status labeled as “anchoring” or “mooring” were selected. This resulted in approximately 621,645 anchoring points identified within the study area as a candidate dataset for port areas. In this study, the longitude and latitude information of all data were transformed into two-dimensional coordinates, and the conversion formula is as follows:
x p = l o n p × π 180 × R earth
y p = ln tan l a t p × π 360 + π 4 × R earth
where  R earth is the radius of Earth and  l o n p l a t p are the longitude and latitude of the trajectory point, respectively.
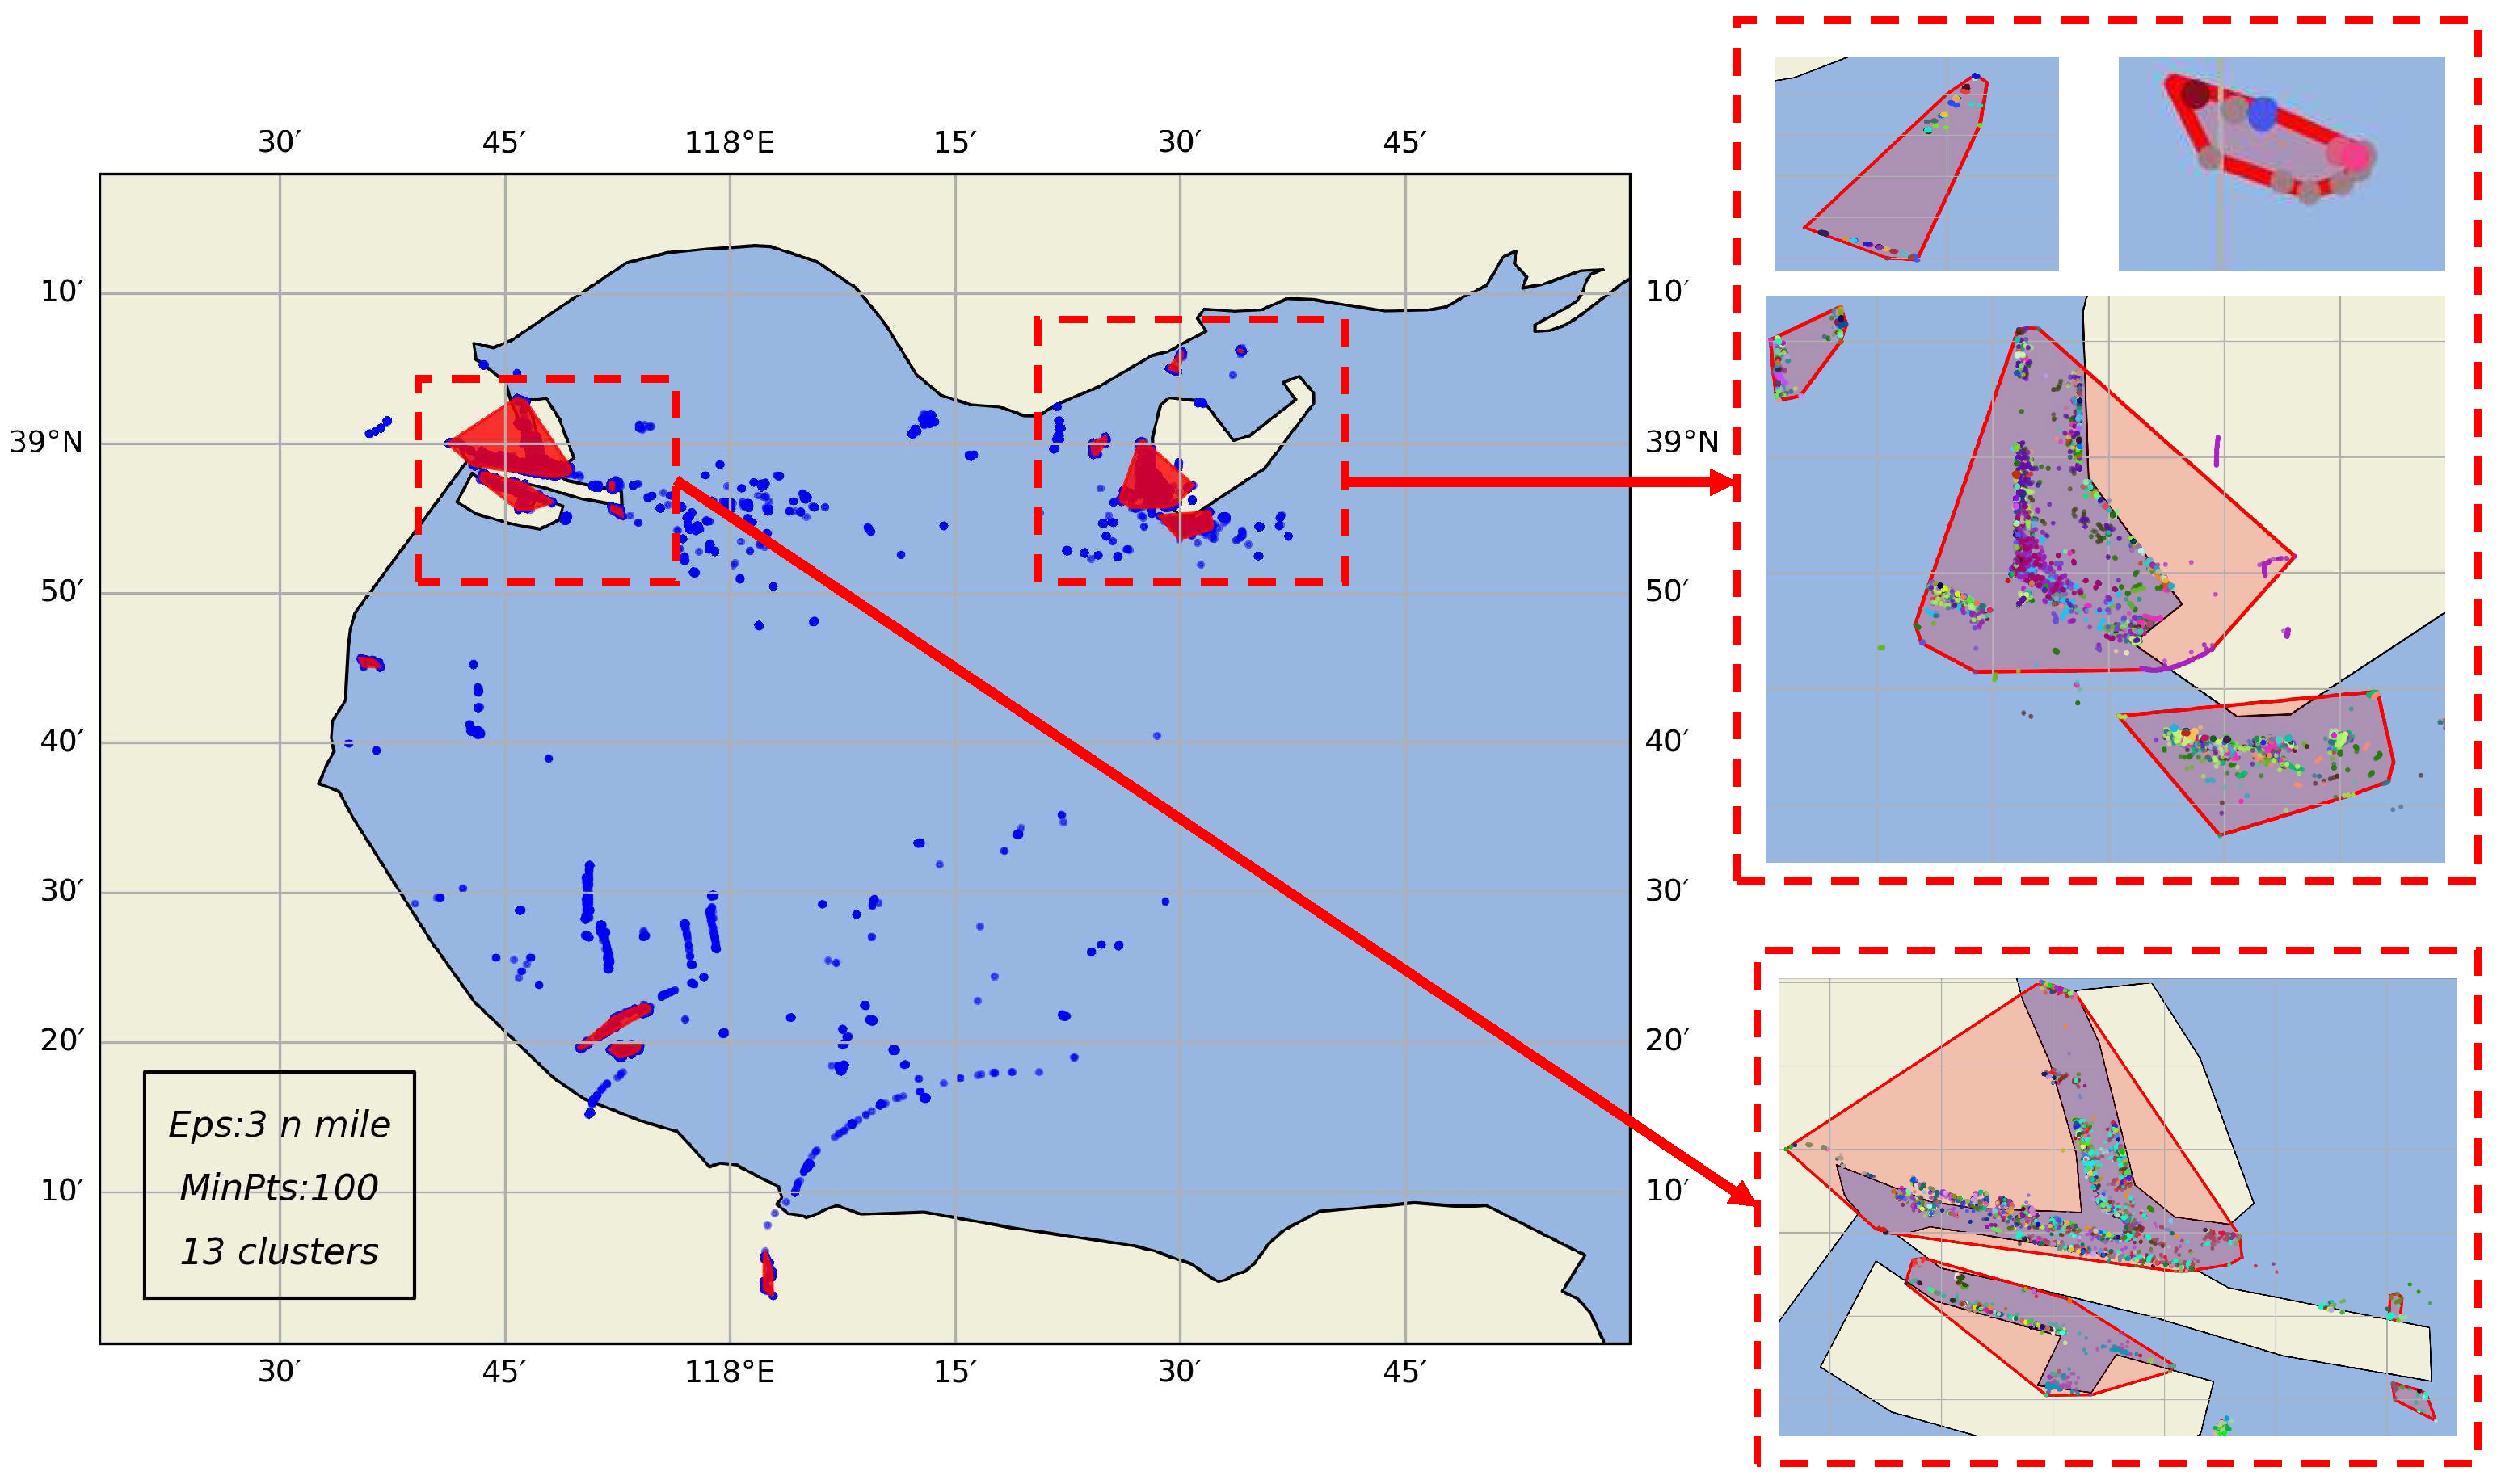
Figure 2 shows the spatial distribution of the anchoring points. Most anchorage points are concentrated and overlapping near port berths and designated anchorage areas. However, some are dispersed farther offshore, indicating anchoring activities in open waters. Additionally, distance calculations for points with the same MMSI (Figure 3a) show that over 90% of point-to-point distances are under 3 km, confirming strong spatial clustering of anchorage locations.

3.3. Ship Trajectory Data

Following the identification of port boundaries, trajectory datasets were constructed by selecting AIS records with the navigational status designated as “underway.” For trajectory points belonging to the same ship, the points were sorted according to their time stamps. If the time interval between two consecutive points exceeded 1 h, the trajectory was divided into two segments. Data from 3010 vessels with different MMSI numbers were finally included, comprising a total of 14,663,557 trajectory points and 15,137 trajectory segments.
The trajectory dataset was classified into three vessel types—cargo ships, container ships, and tankers—comprising 11,490, 1935, and 1711 trajectory segments, respectively. In addition, trajectories were further categorized by draught into three loading conditions: light load (<5 m), medium load (5–10 m), and heavy load (≥10 m). The distribution is summarized in Table 1.
To characterize variations in vessel behavior, statistical analyses were conducted on trajectory distances within the same port, as shown in Figure 3b. Two peaks can be observed. The first peak, high and narrow, indicates that most trajectories are very close to each other, suggesting they are clustered together or have high similarity. The second peak, broad and subdued, is partly due to the spatial separation between inbound and outbound trajectories, reflecting significant differences in navigational behavior.

4. Method

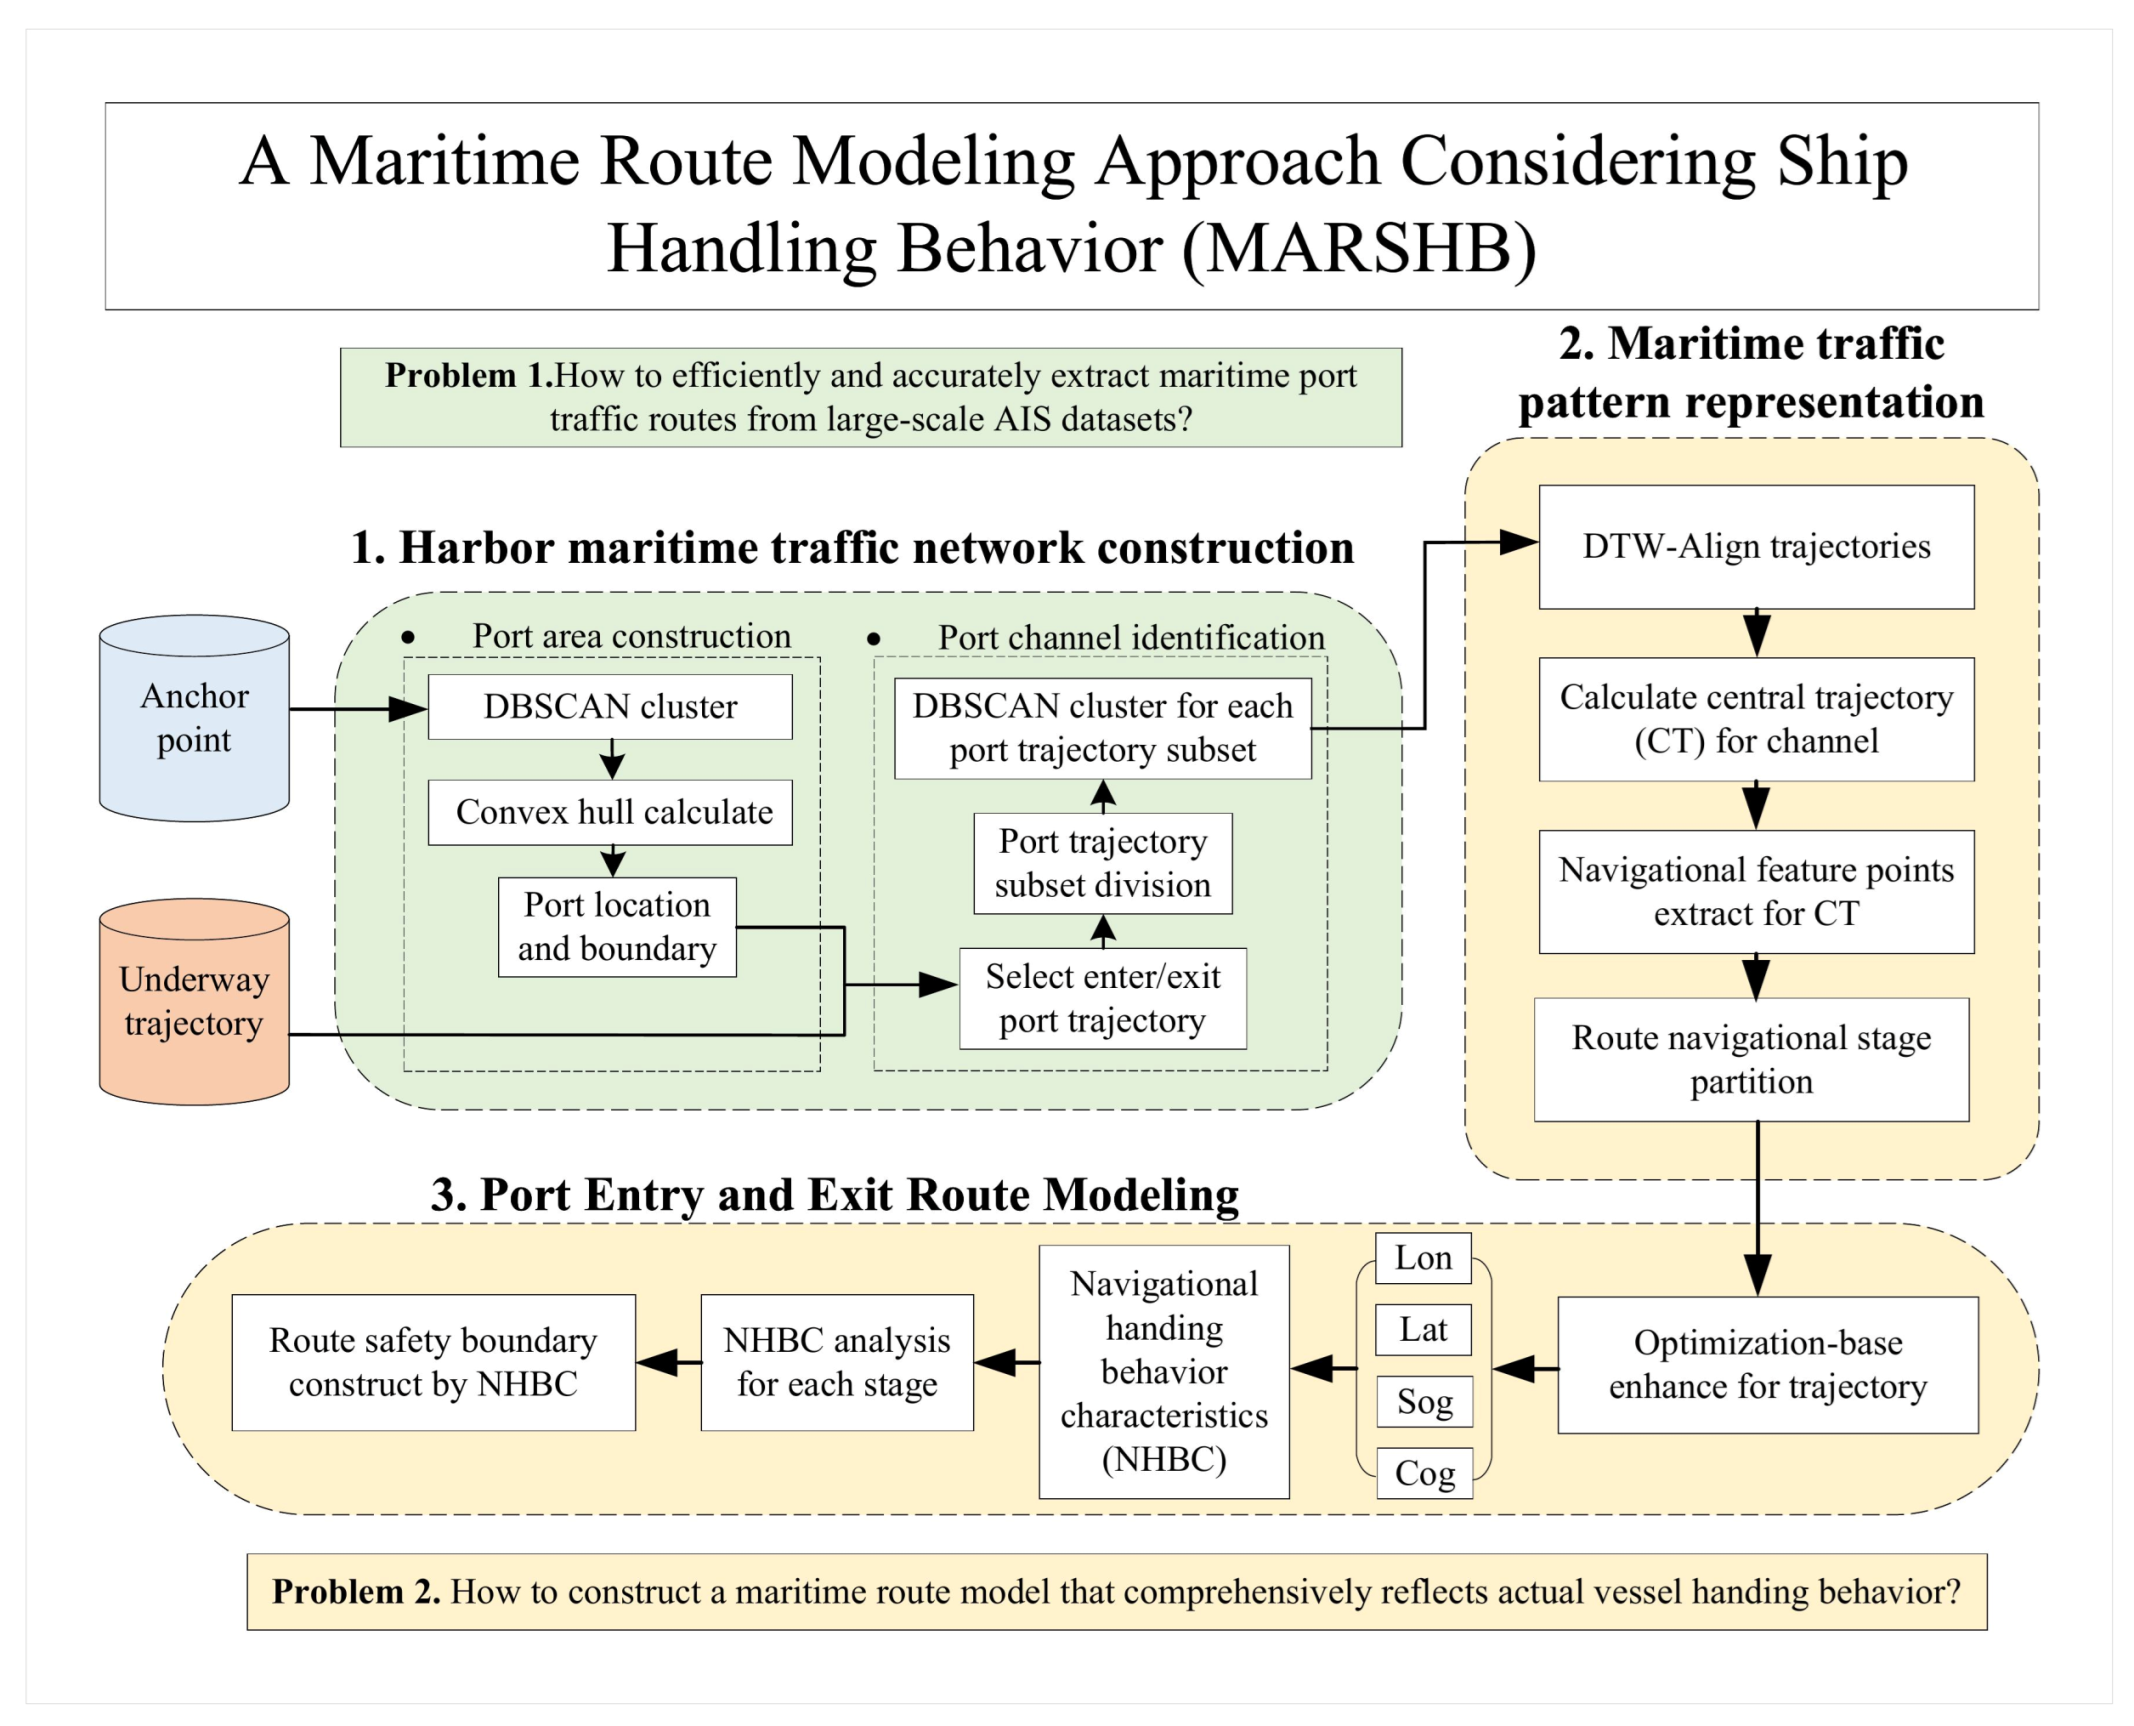
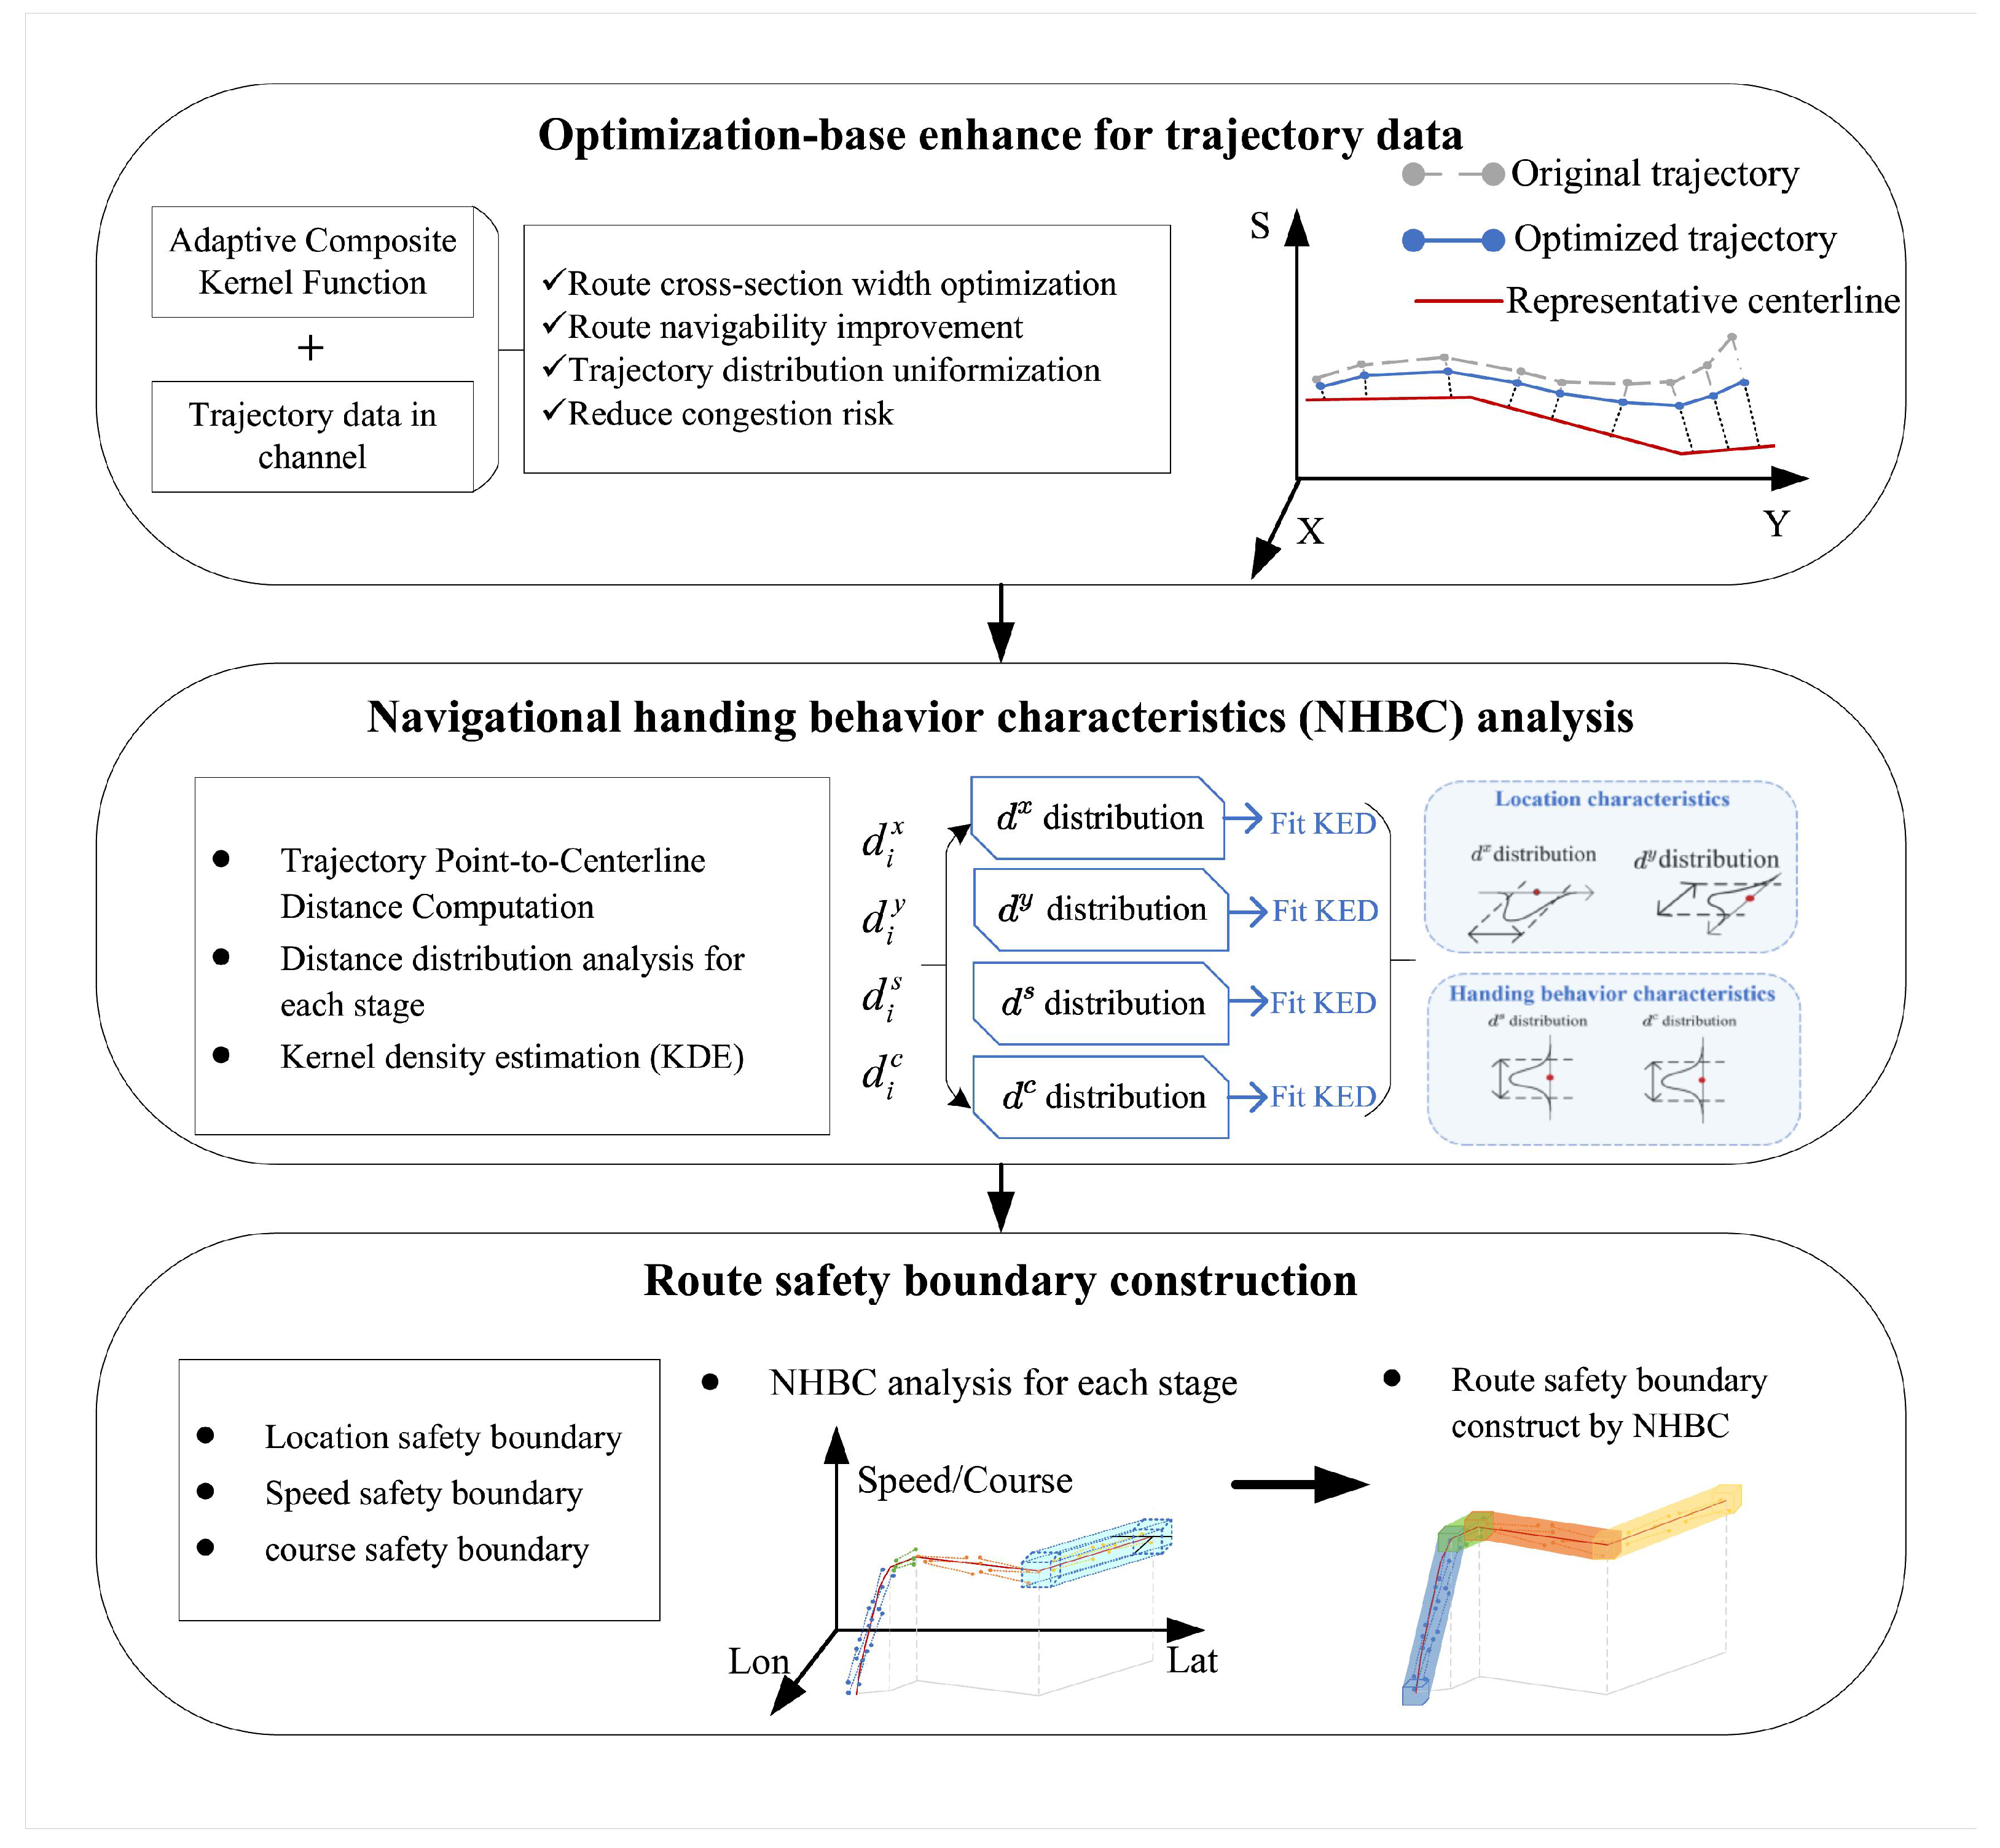
To address the limitations of existing route modeling methods in accurately describing and quantifying vessel navigational behavior in near-port areas, this study proposes a maritime route modeling method incorporating ship handling behavior (MARSHB). The process is divided into three parts.
In the first step of MARSHB, a density clustering-based port route hierarchical extraction method is proposed. Building on the extracted results, a maritime traffic pattern representation method that integrates vessel behavior patterns is designed. This approach extracts vessel location and handling feature points to partition the route into navigation stages. Finally, based on the previously defined stages, a safety behavior boundary that integrates both spatial and handling behaviors is constructed.
Based on these steps, MARSHB models maritime routes in near-port areas using large-scale AIS data. The MARSHB framework is shown in Figure 4.

4.1. Harbor Maritime Route Network Construction

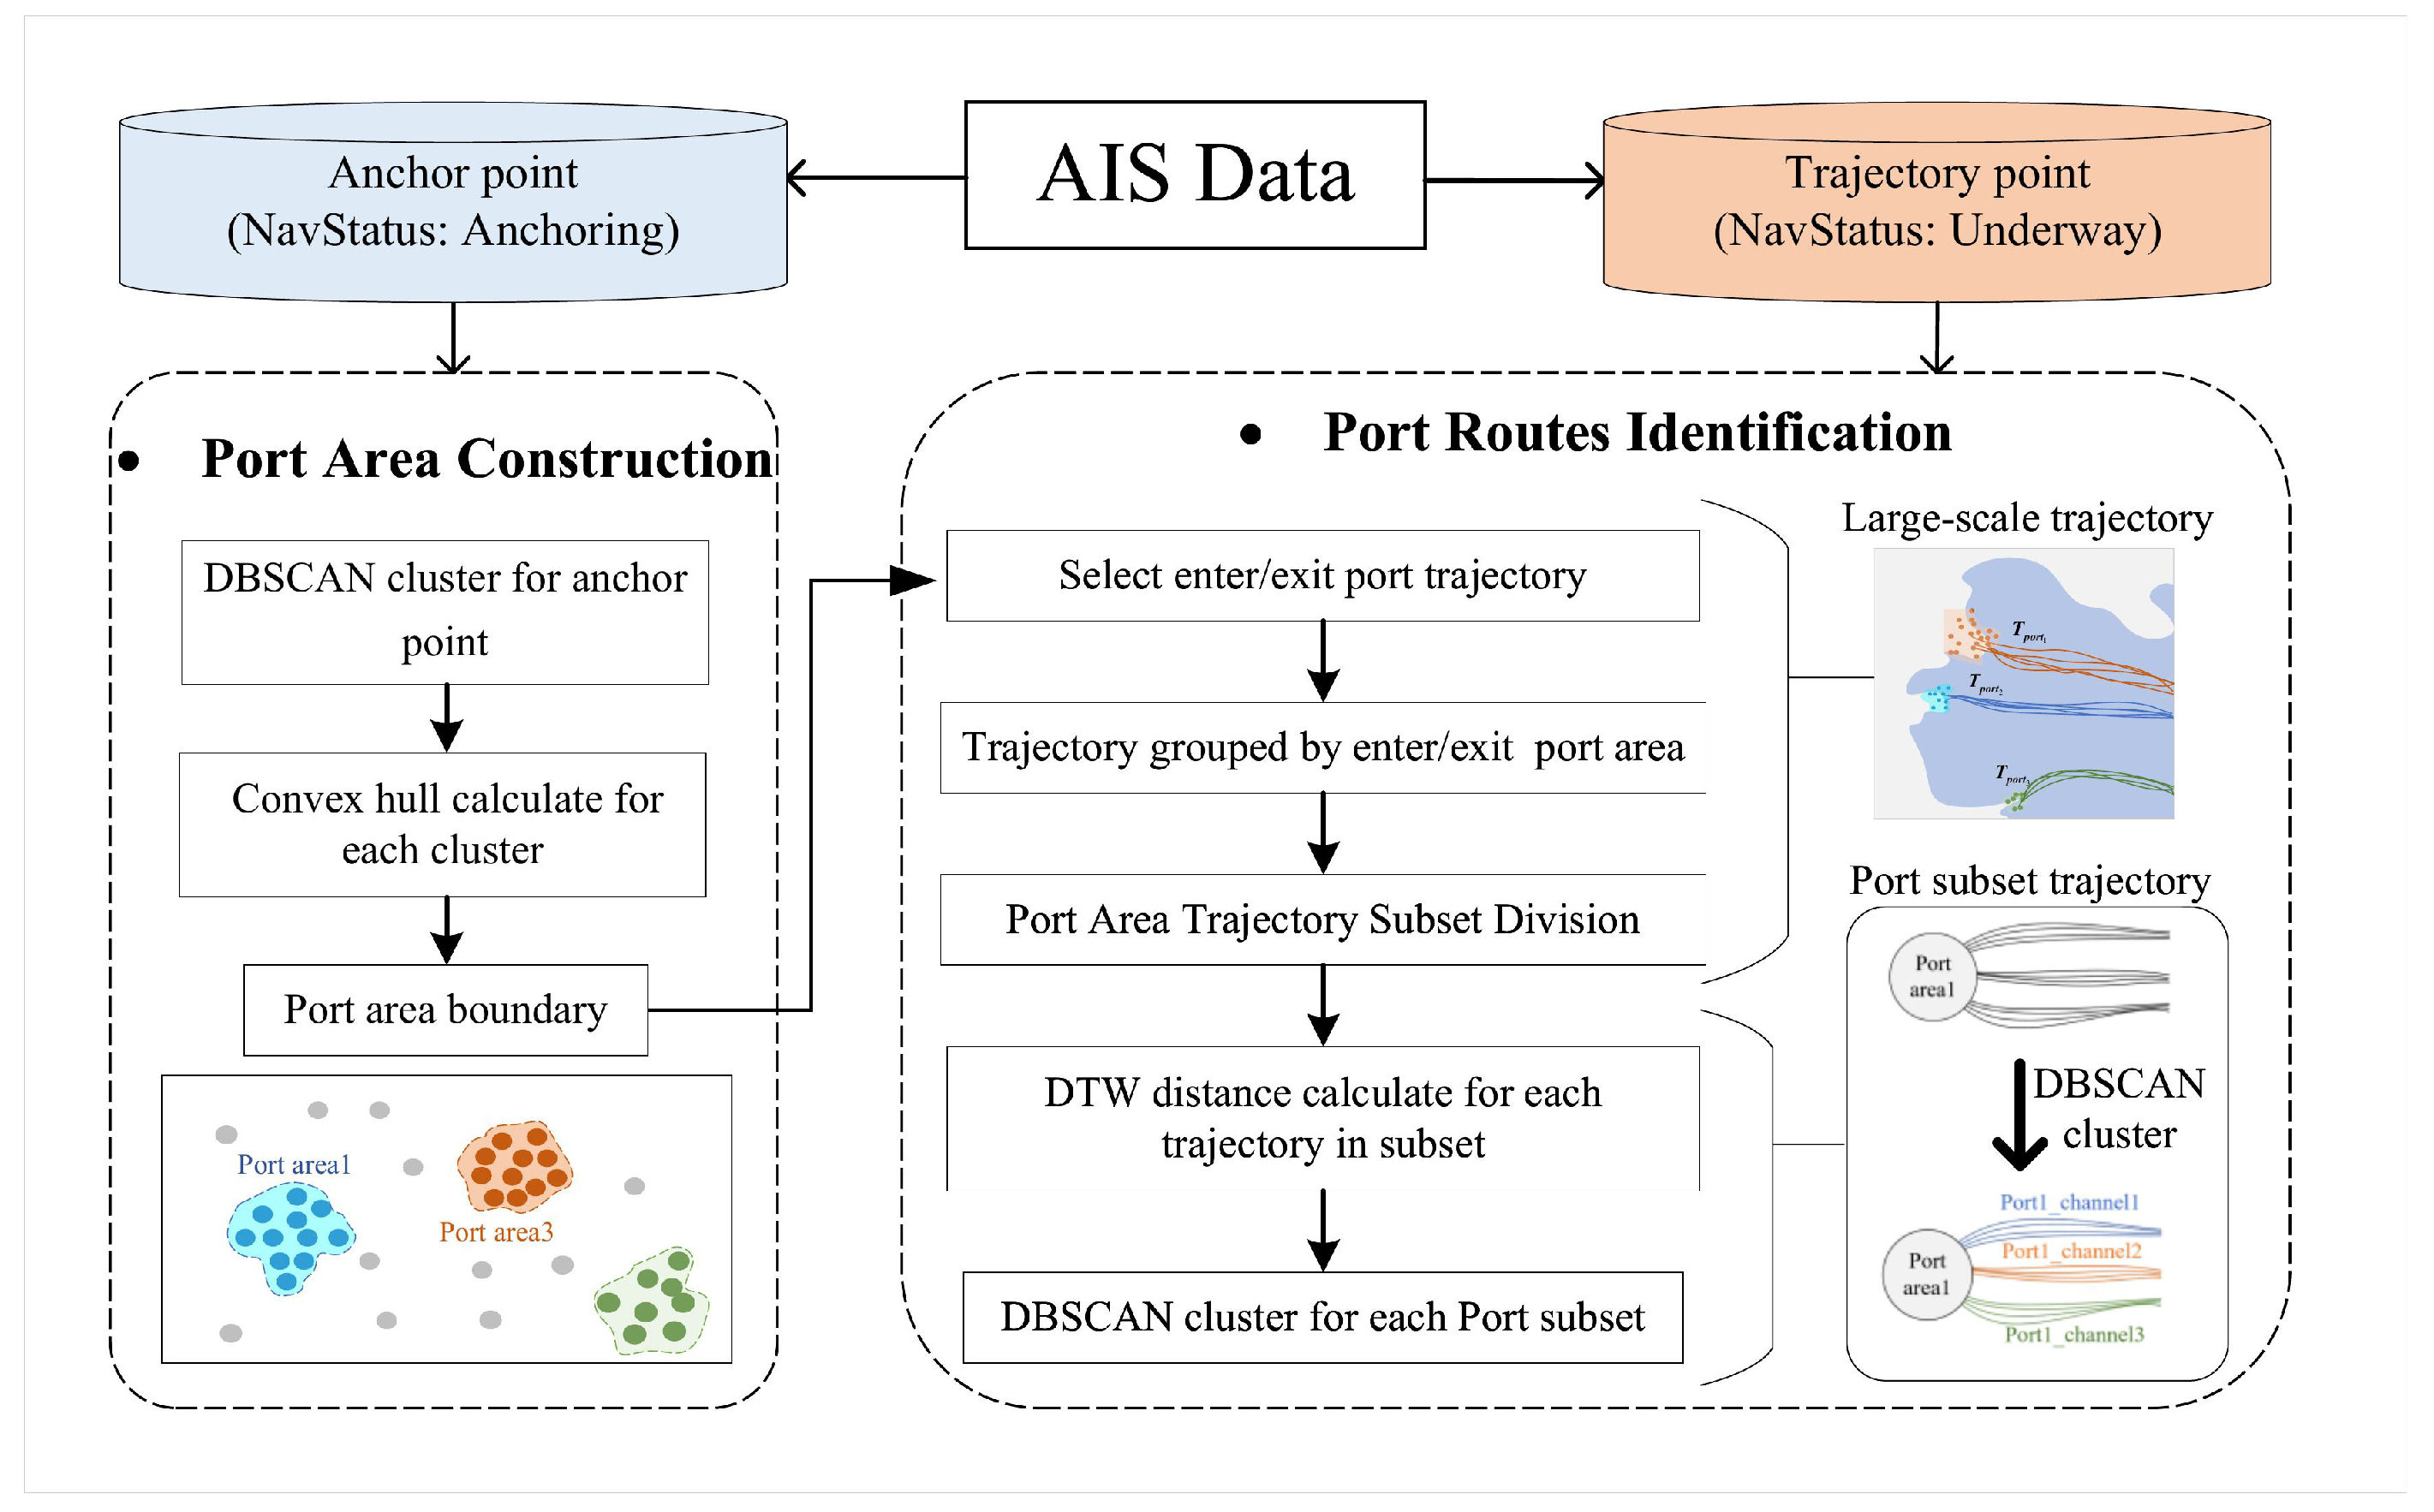
Existing methods for extracting maritime routes from large-scale AIS data are inefficient [50]. This study proposes a hierarchical density clustering-based method for port route extraction. The approach is illustrated in Figure 5.

4.1.1. Port Area Construction

To capture the evolving spatial patterns of actual port usage, including both formal anchorages and transient berthing areas, we employed a data-driven approach that identifies port boundaries directly from real anchoring point data. The port areas are constructed by clustering anchoring points using DBSCAN, which identifies clusters without predefined centers and detects outliers [51]. Each cluster’s convex hull, defined as the smallest enclosing convex polygon [52], was computed using SciPy’s ConvexHull function. This determines the port boundaries, with the maritime region defined as  port   =   { port 1 , port 2 , , port n } , where the i-th port area  port i is the convex hull boundary set.

4.1.2. Harbor Routes Extraction

This study divides the port route extraction into three parts:
(a) 
Trajectory definition: The trajectory data set can be defined as  T = T r a j 1 , , T r a j n , where  Traj n represents the n-th trajectory. Trajectory points, including longitude, latitude, speed, course and time information, and the j-th trajectory point, can be expressed as  p j = x , y , s , c , t . To reduce data redundancy and improve the efficiency of subsequent analysis, the DP algorithm was used to compress the trajectory segments [53]. The threshold for compression was set to 0.8 times the ship’s length, as recommended by [54].
(b) 
Subset division of port area trajectories: Trajectory segments whose starting point or ending point lies within a port area are selected. These trajectories are then divided into subsets according to their associated port. Formally, for the i-th port area, the subset can be written as
T port i = { Traj j T | p 1 j port i or p m j port i }
where  T port i denotes the set of trajectories related to the i-th port,  Traj j is a trajectory, and  p 1 j and  p m j are the starting and ending points of  Traj j .
(c) 
Adaptive threshold clustering: Within each port subset, trajectories are compared using the Dynamic Time Warping (DTW) distance, and DBSCAN [55] is used to cluster similar trajectories into navigation routes. A minimum of five trajectories per cluster is required to ensure representativeness, following [56]. The key challenge is that trajectory density varies across ports: dense areas may easily form clusters, while sparse areas risk being ignored if the threshold is fixed [57]. To address this, we introduce an adaptive parameter setting. For each trajectory, we compute its average distance to the five nearest neighbors:
ρ ( Traj i ) = 1 k j = 1 k d ( Traj i , Traj j i j )
where  d ( · ) denotes the DTW distance. The clustering threshold eps is then chosen as the maximum of these local density estimates:
e p s = max ρ ( Traj 1 ) , ρ ( Traj 2 ) , , ρ ( Traj j n )
Finally, the output clusters represent the major navigational routes of the port:
R = { channel 1 , channel 2 , , channel n }
Through this process, port routes that are both representative and adaptive to local traffic density are extracted. The resulting clusters serve as the foundation for constructing route boundaries in subsequent sections.

4.2. Maritime Traffic Pattern Representation

In most maritime traffic characterization schemes, navigation points are categorized into types such as entrances, exits, turning points, and ports. However, their traffic attributes are typically not further detailed or modeled. For example, turning points should incorporate critical features such as course change and speed distribution [16]. To analyze the typical behavior patterns of vessels within a navigation, this study proposes a method for representing maritime traffic patterns based on dynamic stage division. This staged method aims to reveal dynamic vessel behaviors in complex port traffic environments.

4.2.1. Representative Path Calculation

After clustering the navigation trajectories, extracting a representative path is essential to capture the typical traffic pattern of the route. The mean trajectory can serve as a representative path. However, several challenges arise in mean trajectory computation: (1) the presence of noise in the sample can significantly distort the averaging process, and (2) the variability in trajectory lengths prohibits a direct averaging approach.
This study employed a multi-round iterative method to compute the average trajectory. The optimal cluster center initializes the iterations, with an incremental mean algorithm (Equation (7)) assigning smaller weights to new trajectories for progressive convergence, where n represents the iteration count. In this study, the number of iterations is set to three.
c e n t e r n + 1 = c e n t e r n + T r a j n + 1 c e n t e r n n + 1
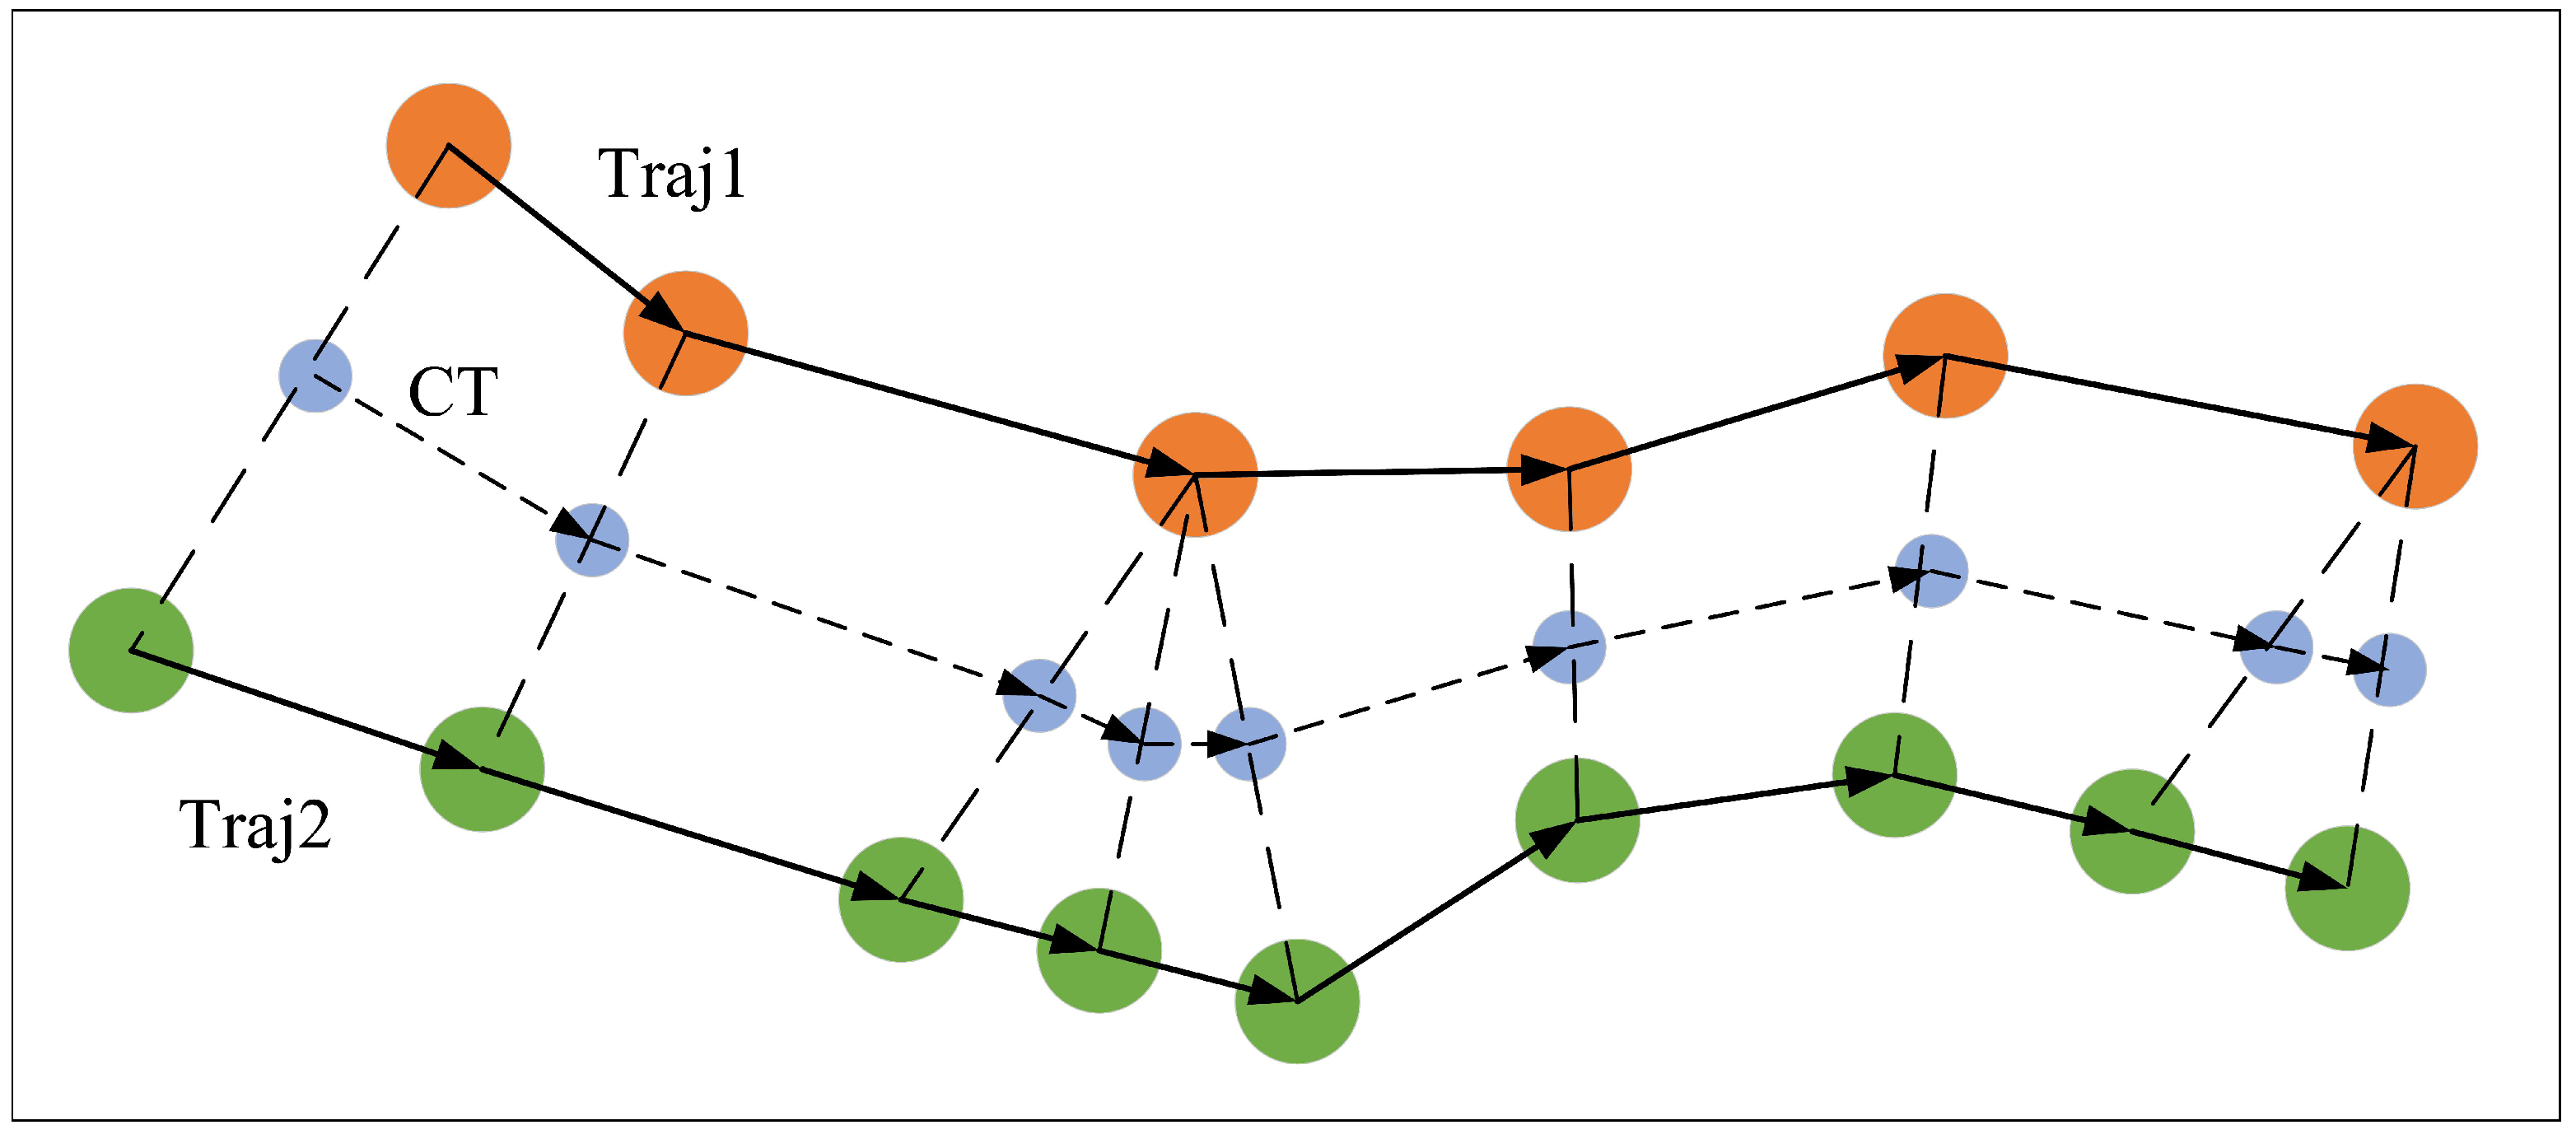
DTW aligns the AIS position records to address length discrepancies and resolve spatiotemporal variations. Figure 6 shows the centerline computation via trajectory alignment. DTW optimally aligns Traj1 and Traj2, and Equation (7) computes the weighted average centerline. For multiple trajectories within the route, the process iteratively aligns each trajectory with the current CT, recalculates the mean, and incorporates all the segments to produce the final representative trajectory.

4.2.2. Route’s Navigation States Segmentation

The central guiding line of the route comprises trajectory points with temporal, location, speed, and course information. To characterize complex traffic patterns in port areas, feature point extraction includes two types: (1) spatial feature points capturing navigation position changes, and (2) speed/course feature points reflecting vessel dynamic handling behavior. These points capture navigation characteristics in complex waters, such as sharp turns and interactions with obstacles [58]. Importantly, each pair of feature points represents a distinct navigational state.
The specific method for feature point extraction is detailed in this research [46]. The pseudocode for the feature point extraction is presented in Algorithm 1. For the representative path of the route, if N feature points are extracted, then N + 1 navigation phases  S = stage 1 , stage 2 , , stage N + 1 can be defined for the CT. For any trajectory point  p i in the route, if its projection point  p i p r o j lies within  stage i , then  p i is assigned to  stage i .
Algorithm 1 Feature Point Extraction.
Input: Representative centerline trajectory CT, speed feature point threshold sth, course feature point threshold cth, trajectory compression threshold dpth
Output: Feature Point FP
# Find Handling Feature Point
   1.
hfp_idx=[] # Initializes the index collection
   2.
for  i = 0  to len(CT)-1 do
   3.
         d c = c [ i + 1 ] c [ i ]
   4.
         d s = s [ i + 1 ] s [ i ]
   5.
end for
   6.
  μ c , σ c = Parameter _ Estimation ( d c )
   7.
  μ s , σ s = Parameter _ Estimation ( d s )
   8.
for  i = 0  to N do
   9.
         if  d c [ i ] < μ c c t h · σ c  or  d c [ i ] > μ c + c t h · σ c  or  d s [ i ] < μ s s t h · σ s  or  d s [ i ] > μ s + s t h · σ s
   10.
       hfp_idx.append(i)
   11.
       end if
   12.
end for
   13.
HFP = CT(hfp_idx)
# Find Position Feature Point
   14.
pfp_idx=[] # Initializes the index collection
   15.
for  i = 0  to M = len(hfp_idx)-1 do
   16.
       Temp = CT hfp _ idx [ i ] : hfp _ idx [ i + 1 ]
   17.
       dp_res= DP ( Temp [ l o n , l a t ] , d p t h )
   18.
       pfp_idx.append(dp_res.index)
   19.
end for
   20.
PFP = CT(pfp_idx)
   21.
FP = concat(HFP, PFP) # Concat feature points

4.3. Port Access Route Modeling

Existing methods for modeling navigation routes often use simplistic geometric boundaries and neglect dynamic variations in the vessel speed during navigation. To address this issue, this study integrates ship behavior norms, constructs a model that accounts for vessel handling behaviors, and provides a safety boundary tailored to the port area. The route modeling method proposed in this paper is illustrated in Figure 7.

4.3.1. Route Trajectory Data Optimization

When constructing navigation routes using historical vessel trajectories, cross-section width inconsistencies can affect the navigability. In open waters, vessels show dispersed trajectories and speed fluctuations, while near ports, they converge into fixed routes with denser trajectories and reduced speeds. Approaching berths, vessels disperse slightly to the dock at different locations [59].
This study proposes a method to optimize the trajectory points before route construction using an adaptive composite kernel function. This repositions points closer to the centerline and reduces the width variability. By considering the vessel density distribution in terms of longitude, latitude, course, and speed, the repositioned points better reflect actual flow characteristics. The step is as follows:
Step 1 
Projection: Each trajectory point is first projected onto the route centerline to obtain a reference point.
Step 2 
Similarity evaluation: The consistency between the original point and its projection is evaluated in four dimensions: longitude (x), latitude (y), speed (s), and course (c).
Step 3 
Adjustment: If the point is similar to its projection across these dimensions, it is pulled closer to the centerline. This reduces excessive width in open waters and ensures a more compact distribution near ports.
This process can be expressed mathematically as
p ^ i = p i p r o j + K ( p i , p i p r o j ) · p i p r o j p i ,
where  p i is the original point,  p i p r o j is its projection on the centerline, and  p ^ i is the optimized position. The weight  K ( p i , p i p r o j ) is a composite kernel consisting of four components:
K ( p i , p i p r o j ) = K x · K y · K s · K c
Each component reflects the similarity in one dimension. For example,
K x ( p i , p i p r o j ) = 1 1 + d x ( p i , p i p r o j ) α · std ( d x ) 2
and similarly for  K y K s , and  K c . Here,  d x d y d s , and  d c denote the differences between the point and its projection in longitude, latitude, speed, and course, respectively. The parameter  α controls the kernel width.
To illustrate the effect of kernel width, we take speed information in the trajectory as an example. When  α is set to 0.1, 1, and 10, the interpolation results in distinct behaviors, as shown in Figure 8. With a very small  α (e.g., 0.1), the distance between each point and the center trajectory becomes smaller, but the distribution is overly distorted compared with the original. With a very large  α (e.g., 10), the adjustment is minimal, and the before–after distributions remain almost unchanged. A moderate value balances accuracy and stability; based on both experiments and experience, the  α values are set to 4 in this study.
By applying this optimization to all trajectory points, the resulting dataset becomes smoother and more consistent. The optimized points better reflect actual vessel flow characteristics across different regions, providing a stable foundation for subsequent route boundary construction.

4.3.2. Route Safety Boundary Establishing

Maritime safety assessments require the integration of static spatial analysis with dynamic data feedback. Relying solely on spatial boundaries may overlook abnormal behaviors, such as sharp turns or speeding, especially in high-risk areas like narrow waterways and port entrances [60].
In Section 4.2.2, we segmented the route into navigation stages to analyze behavior patterns independently. This facilitates accurate behavior statistics and the construction of safety boundaries. By analyzing stage-specific speed and course patterns, behavioral variations along the route can be captured. The construction process is as follows:
Step 1 
Compute the Distance from Projected Points to the Centerline: For each optimized trajectory point  p ^ i = ( x ^ i , y ^ i , s ^ i , c ^ i ) , we calculate its deviation from the projected point on the centerline  p i p r o j . The overall deviation is
d i = p ^ i p i p r o j
which can also be decomposed into x, y, s, and c components.
Step 2 
Fit KDE Probability Distribution for Each Stage: For each stage, we collect the deviation components of all trajectory points and estimate their probability distributions using kernel density estimation (KDE). For example, in the x-dimension,
f ^ x ( x ) = 1 N h i = 1 N K x x ^ i h
where  K ( · ) is the kernel function and h is the bandwidth.
Step 3 
Safety Boundary Description by Probability Density Curves: From the cumulative distribution function (CDF) of each dimension, we determine threshold values corresponding to a high confidence level (99.7%). These thresholds define the maximum acceptable deviation in position, speed, and course within that stage.
Step4 
Construct the Safety Boundary Box for Each Stages: Each stage is assigned a safety boundary box centered at its starting point, extending by the threshold values in all four dimensions. The overall safety boundary of the route is the union of these stage-wise boxes.
Through this process, the safety boundary not only accounts for the spatial corridor of the route but also incorporates dynamic constraints. This ensures that abnormal behaviors such as sudden speed changes or course deviations can be effectively detected within specific navigation.

5. Case Study and Results

5.1. Evaluation Metrics

In order to evaluate the accuracy of the route model in reflecting the actual navigation handling behavior of vessels, this paper designed four evaluation metrics focusing on speed and course:
(1)
Speed Range Coverage (SRC) and Course Range Coverage (CRC): The SRC and CRC metrics are used to evaluate how well the model-generated safe speed and course ranges encompass historical data:
S R C = N w i t h i n _ s N t o t a l × 100
C R C = N w i t h i n _ c N t o t a l × 100
where  N w i t h i n _ s and  N w i t h i n _ c are the numbers of points within the safe speed and course ranges, and  N t o t a l denotes the total number of points. A higher coverage rate suggests that the model-generated safe speed and course range better encompassed historical data.
(2)
Speed Boundary Consistency Error (SBCE) and Course Boundary Consistency Error (CBCE): SBCE and CBCE are used to evaluate the consistency between the model-generated safety handling behavior boundaries and the speed/course distribution in historical data:
Projection Calculation: For each point, compute its projection onto the centerline.
Speed Boundary Retrieval: Based on the projected point’s position, retrieve the speed and course limits ( s min , s max , c min , c max ) from the safety handling behavior boundaries generated by the model.
Minimum Distance Calculation: For each data point’s speed  s i and course  c i , the minimum distances  d s i and  d c i to the safety boundaries are calculated.
d s i = min ( s i s min , s i s max )
d c i = min ( c i c min , c i c max )
Average Minimum Distance Calculation: Compute the average of the minimum distances across all data points, which yields SBCE and CBCE:
S B C E = 1 N N i = 1 d s i
C B C E = 1 N N i = 1 d c i
where N is the total number of data points. A smaller SBCE and CBCE value indicates a higher consistency between the safety handling behavior boundaries generated by the model and historical data.

5.2. Maritime Route Network Construction Results

To extract the actual anchor port area boundaries, the distances between the anchoring points were calculated and applied to the DBSCAN clustering algorithm. According to the statistical results in Figure 3a, more than 90% of the anchoring points were within 3. Thus, eps was set to 3 for DBSCAN and minpts to 100, requiring points from at least five different vessels. Finally, 13 clustering groups were identified. The construction result of the port area boundary is shown in the red closed polygon area in Figure 2. The location information for the port area is shown in Table 2.
Once the port areas were identified, the underway trajectories were grouped into port area trajectory subsets. For DBSCAN, the maximum average nearest-neighbor distance of each subset is set as eps. The upper limit for eps was set to 900, which is the value positioned between the two peaks of trajectories distance, as shown in Figure 3b. This choice effectively distinguished the inbound and outbound trajectories while ensuring that the high-density regions were correctly clustered. Based on the maritime navigation trajectory dataset covering nine port areas, we performed clustering analysis on trajectories in each port region. For tank ships, container ships, and cargo ships, we identified 14, 5, and 27 distinct routes, respectively. Their spatial distributions are shown in Figure 9.
The clustering results reveal notable disparities in route distribution across vessel types. For instance, container ships predominantly navigate to P1 (Tianjin Port) and P2 (Huanghua Port), with no routes observed toward P13 or P4. Tank ships primarily head to Tianjin Port, with some also traveling to Huanghua Port (P12) and Caofeidian Port (P9). In contrast, cargo ship trajectories exhibit a broader distribution. They notably include unique routes to Binzhou Port (P13) and frequent passages to Tianjin Port Nanjiang (P4), as well as Caofeidian North Area (P3 and P11).
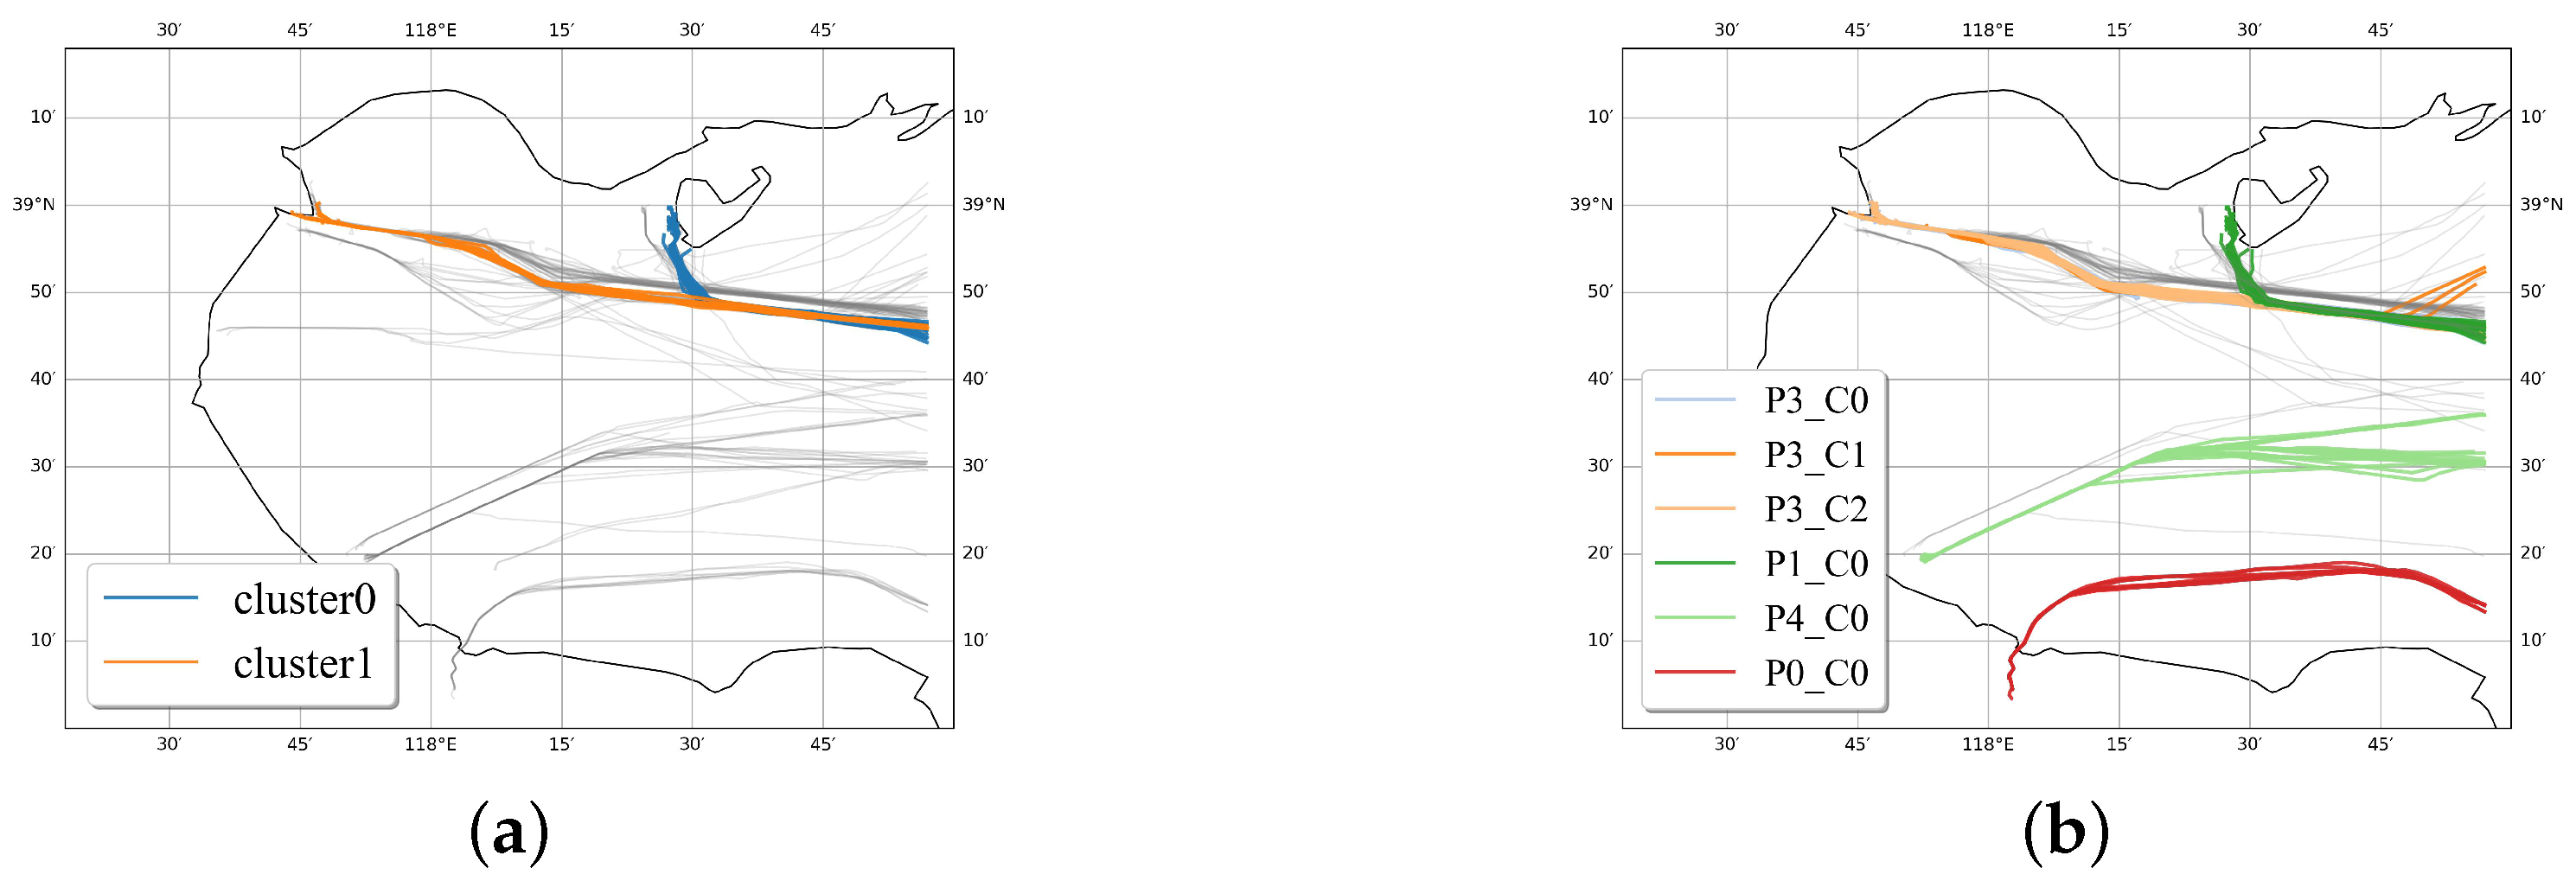
To validate the superiority of the proposed hierarchical clustering method in terms of route extraction accuracy and efficiency, 183 trajectory points were tested from the dataset’s first week in May. The experiment applied DBSCAN clustering directly to the trajectory set with eps set to 900 and compared it with the proposed hierarchical method. The experimental results shown in Figure 10 indicate that direct clustering extracts only two high-density clusters, missing lower-density regions such as Port 0 and Port 4. In contrast, the hierarchical method enables accurate extraction of data across varying traffic volumes. Regarding computational efficiency, direct clustering averages 0.99 s per trajectory, whereas the hierarchical method averages 0.49 s, demonstrating a significant improvement in efficiency.
Based on the above experiments and analyses, the hierarchical-strategy-based method proposed in this study can accurately and efficiently extract port routes with varying spatial characteristics. Accurate route extraction is essential for subsequent modeling.

5.3. Maritime Traffic Pattern Characterization Results

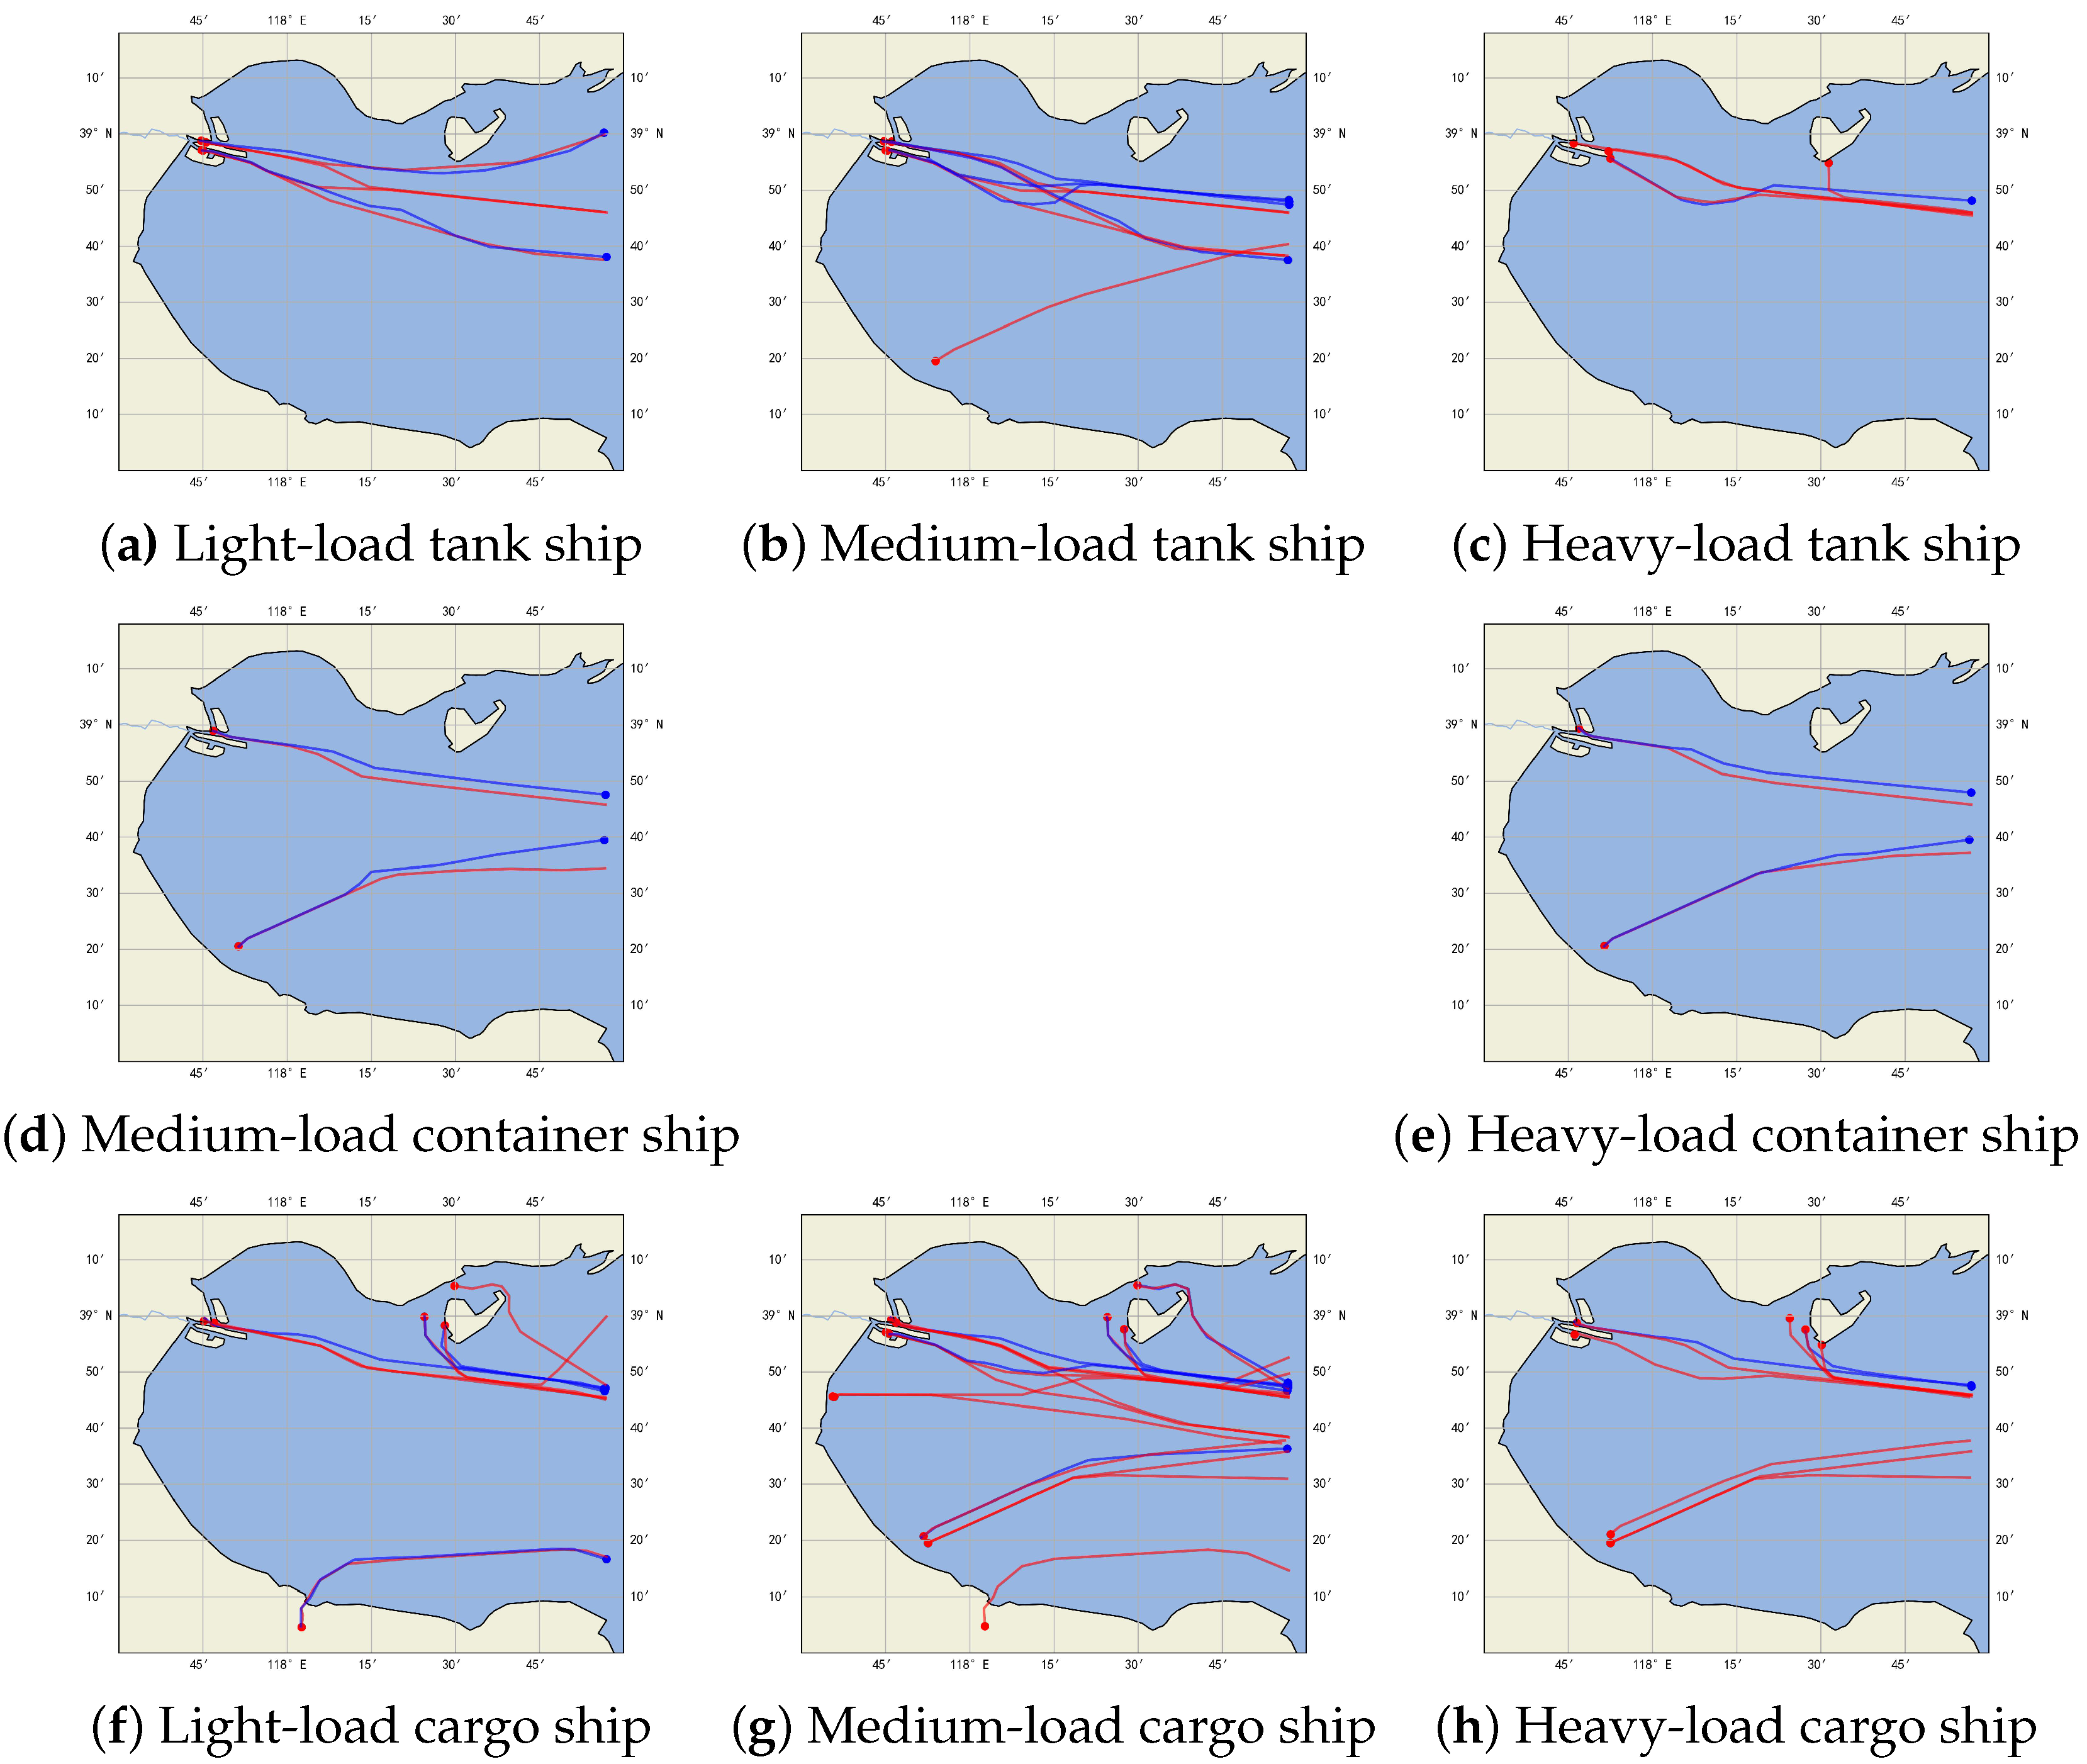
We computed the representative path for the identified route, and the results are shown in Figure 11. In the figure, the path out of the port is represented by a red line, and the path into the port is represented by a blue line. To analyze vessel navigational behaviors by type and load, we categorized trajectories into light-load, medium-load, and heavy-load segments. Details are in Table 1. Over 90% of container ship trajectories are medium-load or heavy-load; thus, only these are included. The distribution of representative paths for different vessel types and loading conditions reveals that vessels of the same type exhibit distinct patterns depending on their loading status. For example, heavily loaded cargo ships avoid Binzhou Port (P13) and Caofeidian North Area (P3 and P11). Additionally, heavily loaded cargo ships and tank ships have more outbound routes.
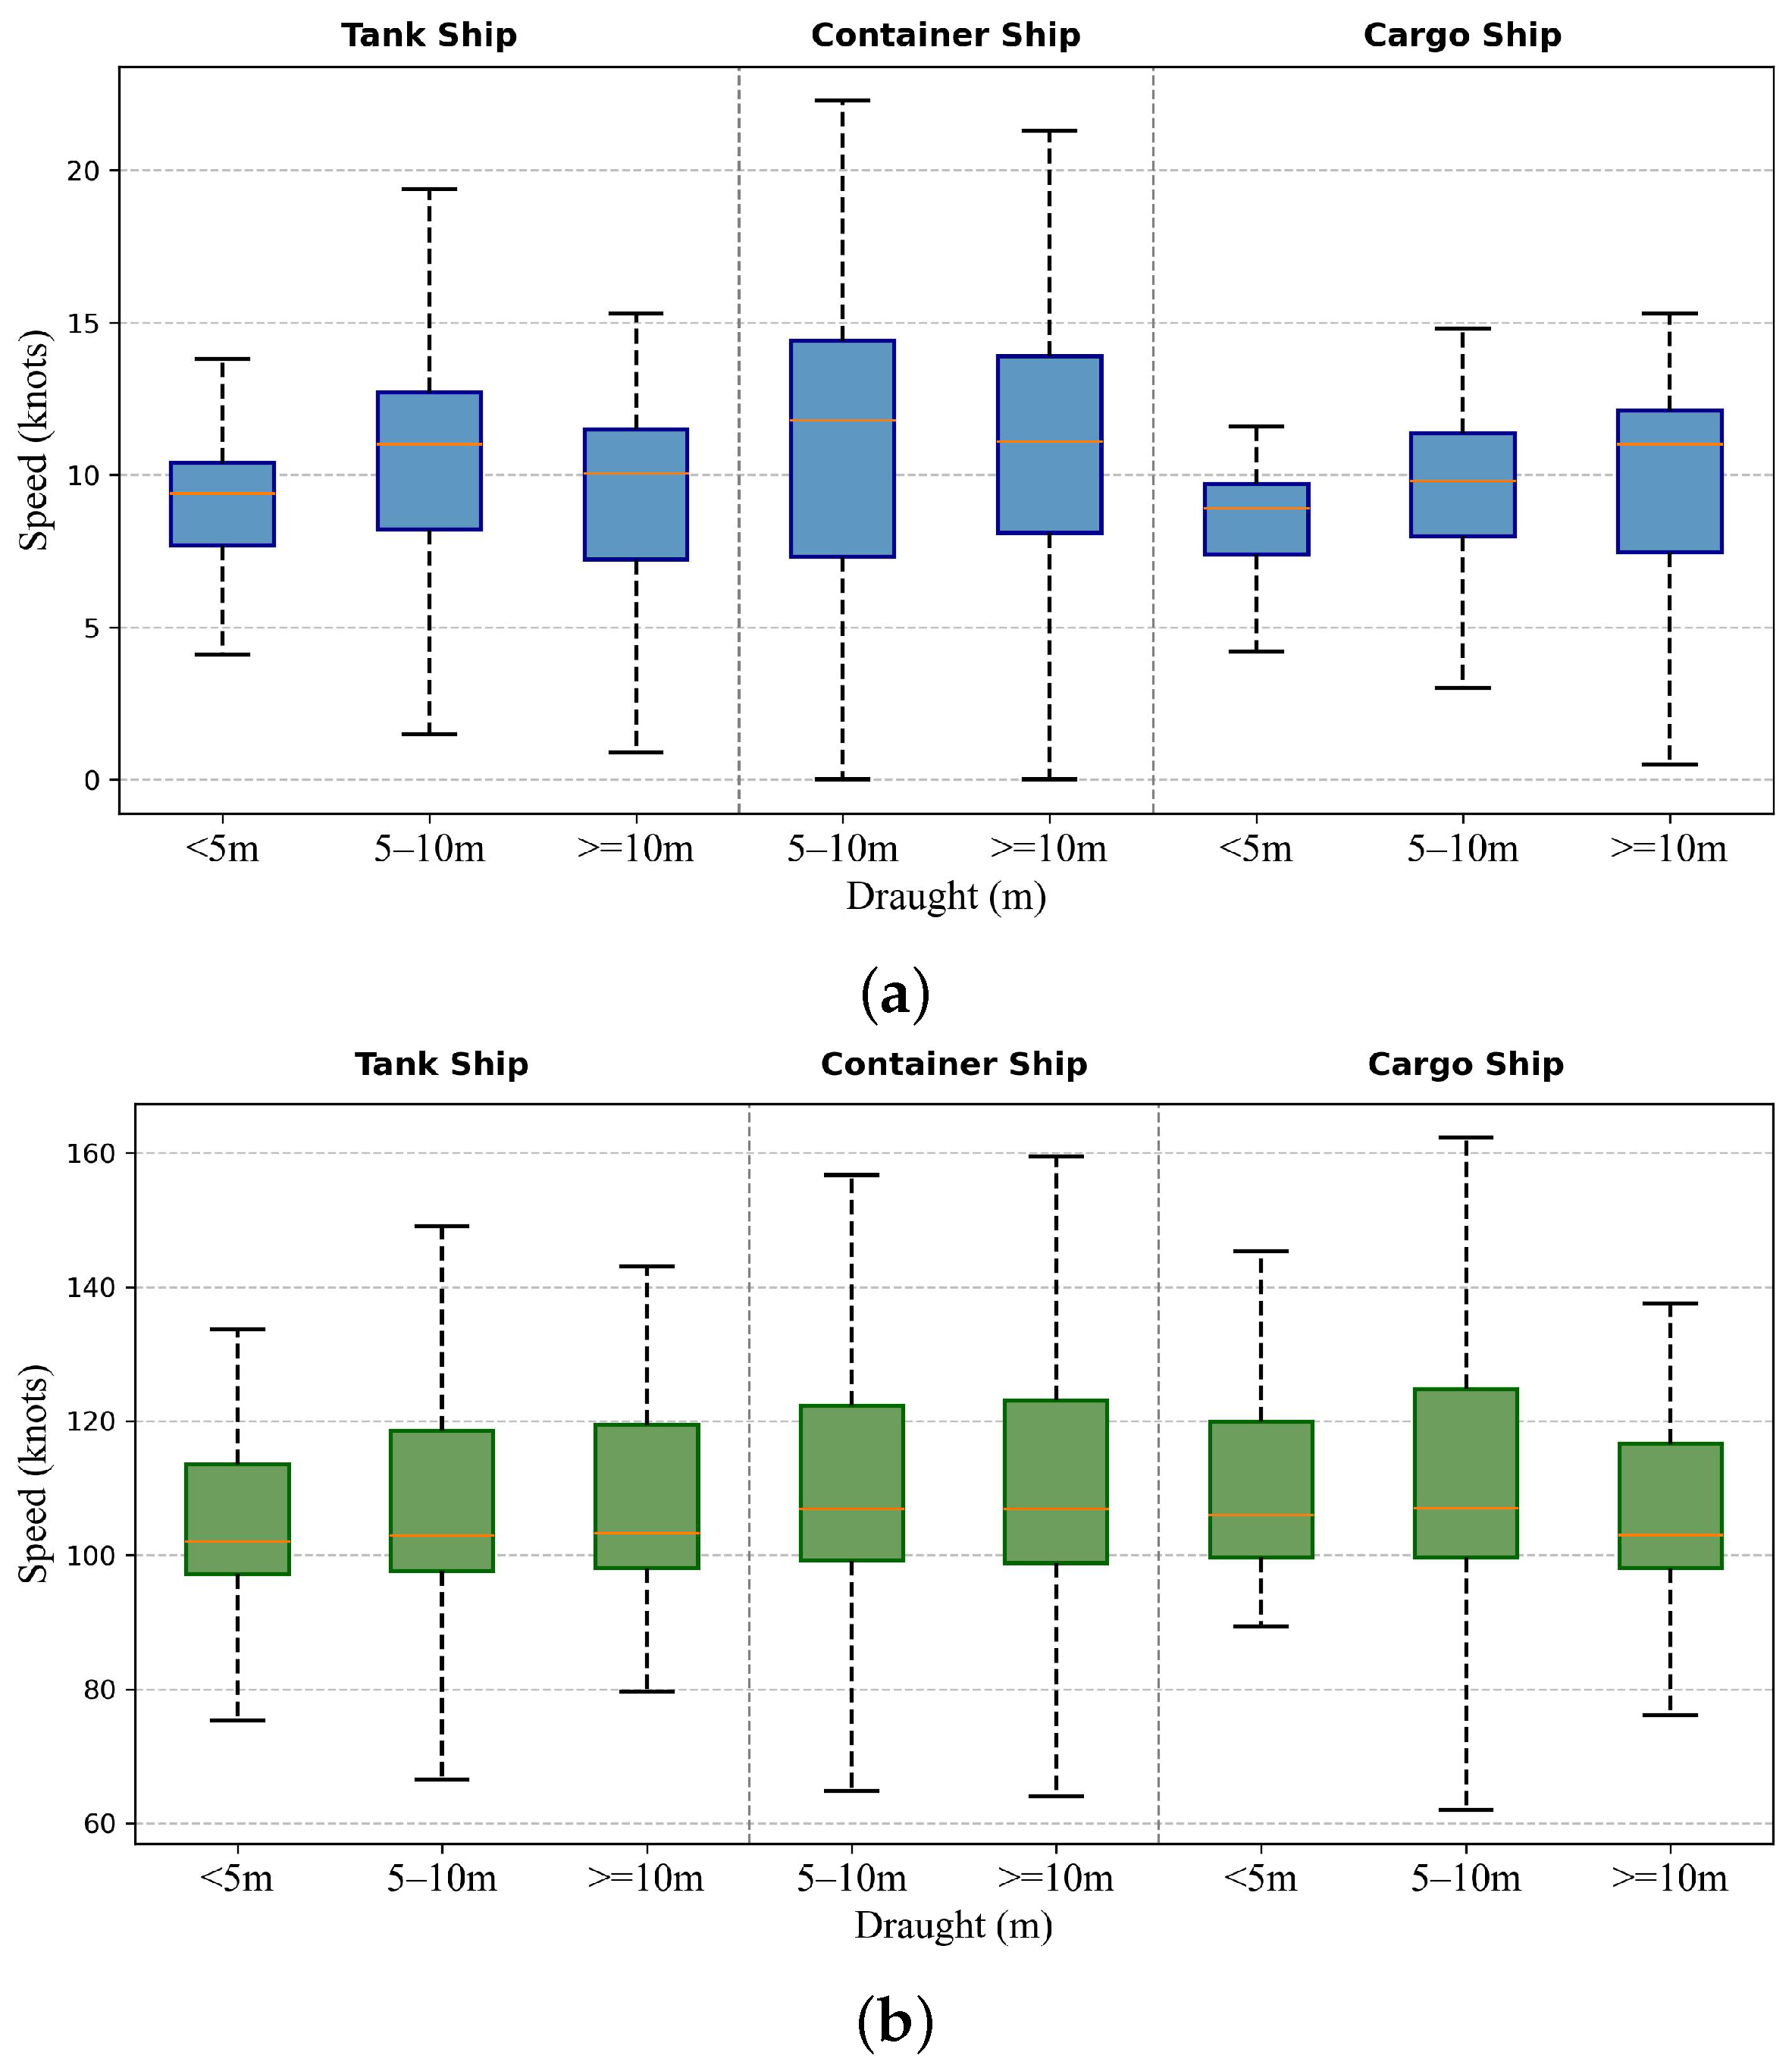
A representative path for departures from Port 1 was selected to analyze the motion characteristics of ships of different types and load conditions. Boxplots of the speed and course distribution of each group of ships on the route are shown in Figure 12. The figure indicates that container ships have the highest average speed. The speed distribution of lightly loaded ships is more concentrated, with an average slightly lower than that of heavily loaded ships. As for the course, the load condition seems to have little impact on its distribution. Statistical analysis of outbound patterns and their distributions enables a more effective examination of the spatiotemporal characteristics of vessel traffic across multi-port areas.
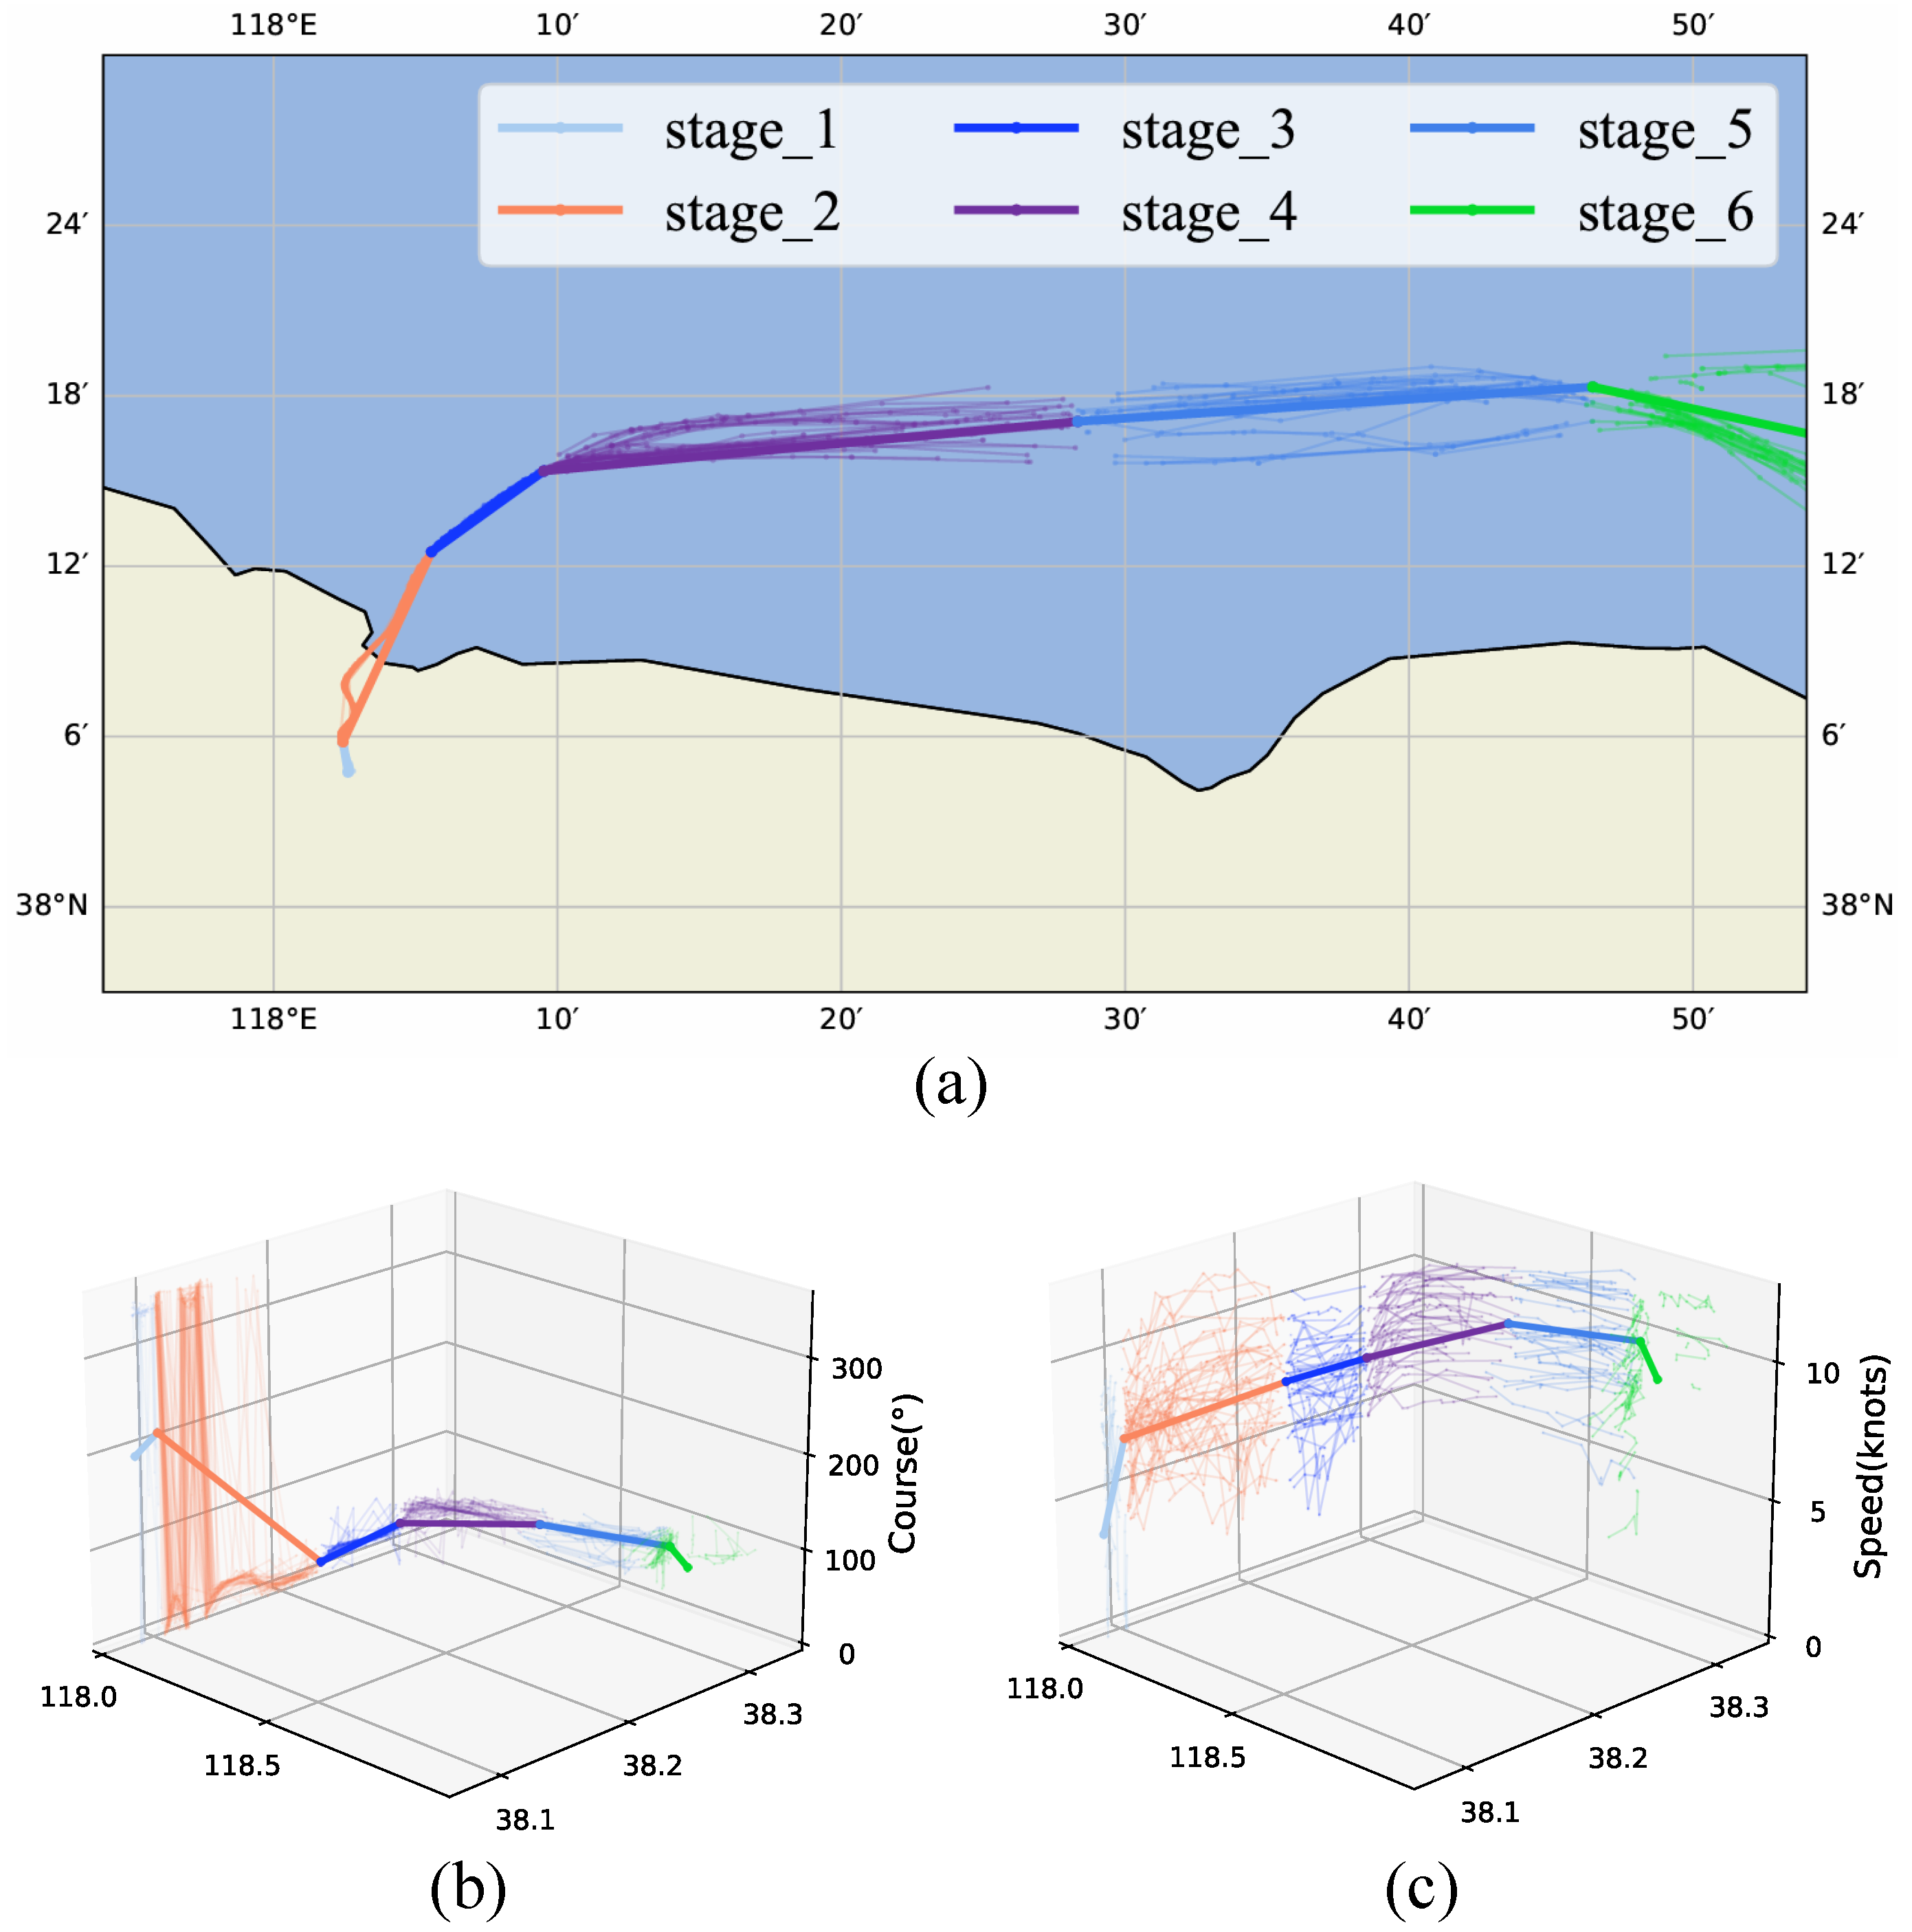
Following the derivation of route centerlines, the dynamic behavioral features and positional points of vessels were extracted. Each route segment between two positional points was defined as a distinct navigation stage, enabling a dynamic stage division. The route navigational stage segmentation is exemplified by the R1 route of cargo ships departing from P13.
R1 of P13 represents the route for departures from the port. Based on the characteristics of central line shape changes, dynamic heading, and dynamic speed, the maritime traffic pattern recognition algorithm divided it into six stages, as shown in Figure 13. After completing the dynamic phase division, each trajectory data point is classified into the corresponding phase. Our method effectively extracts and characterizes typical behaviors.

5.4. Route Safety Boundary Construction Results

A method of defining route boundaries using observation lines has been shown to be effective in maritime traffic studies [61]. Waypoints were set at fixed intervals along the central line, and the boundary was calculated based on statistical data from the observed points along the reference line. The routes were divided into stages based on vessel trajectory data. For each stage, AIS data were statistically analyzed to determine the boundaries of location, speed, and course. The Gaussian process-based modeling method [10] uses temporal information as the independent variable. Each trajectory in a cluster is modeled using normalized temporal information as input, with longitude, latitude, speed, and course as outputs. The resulting model provides the central trajectory as well as the confidence boundaries of each dimension.
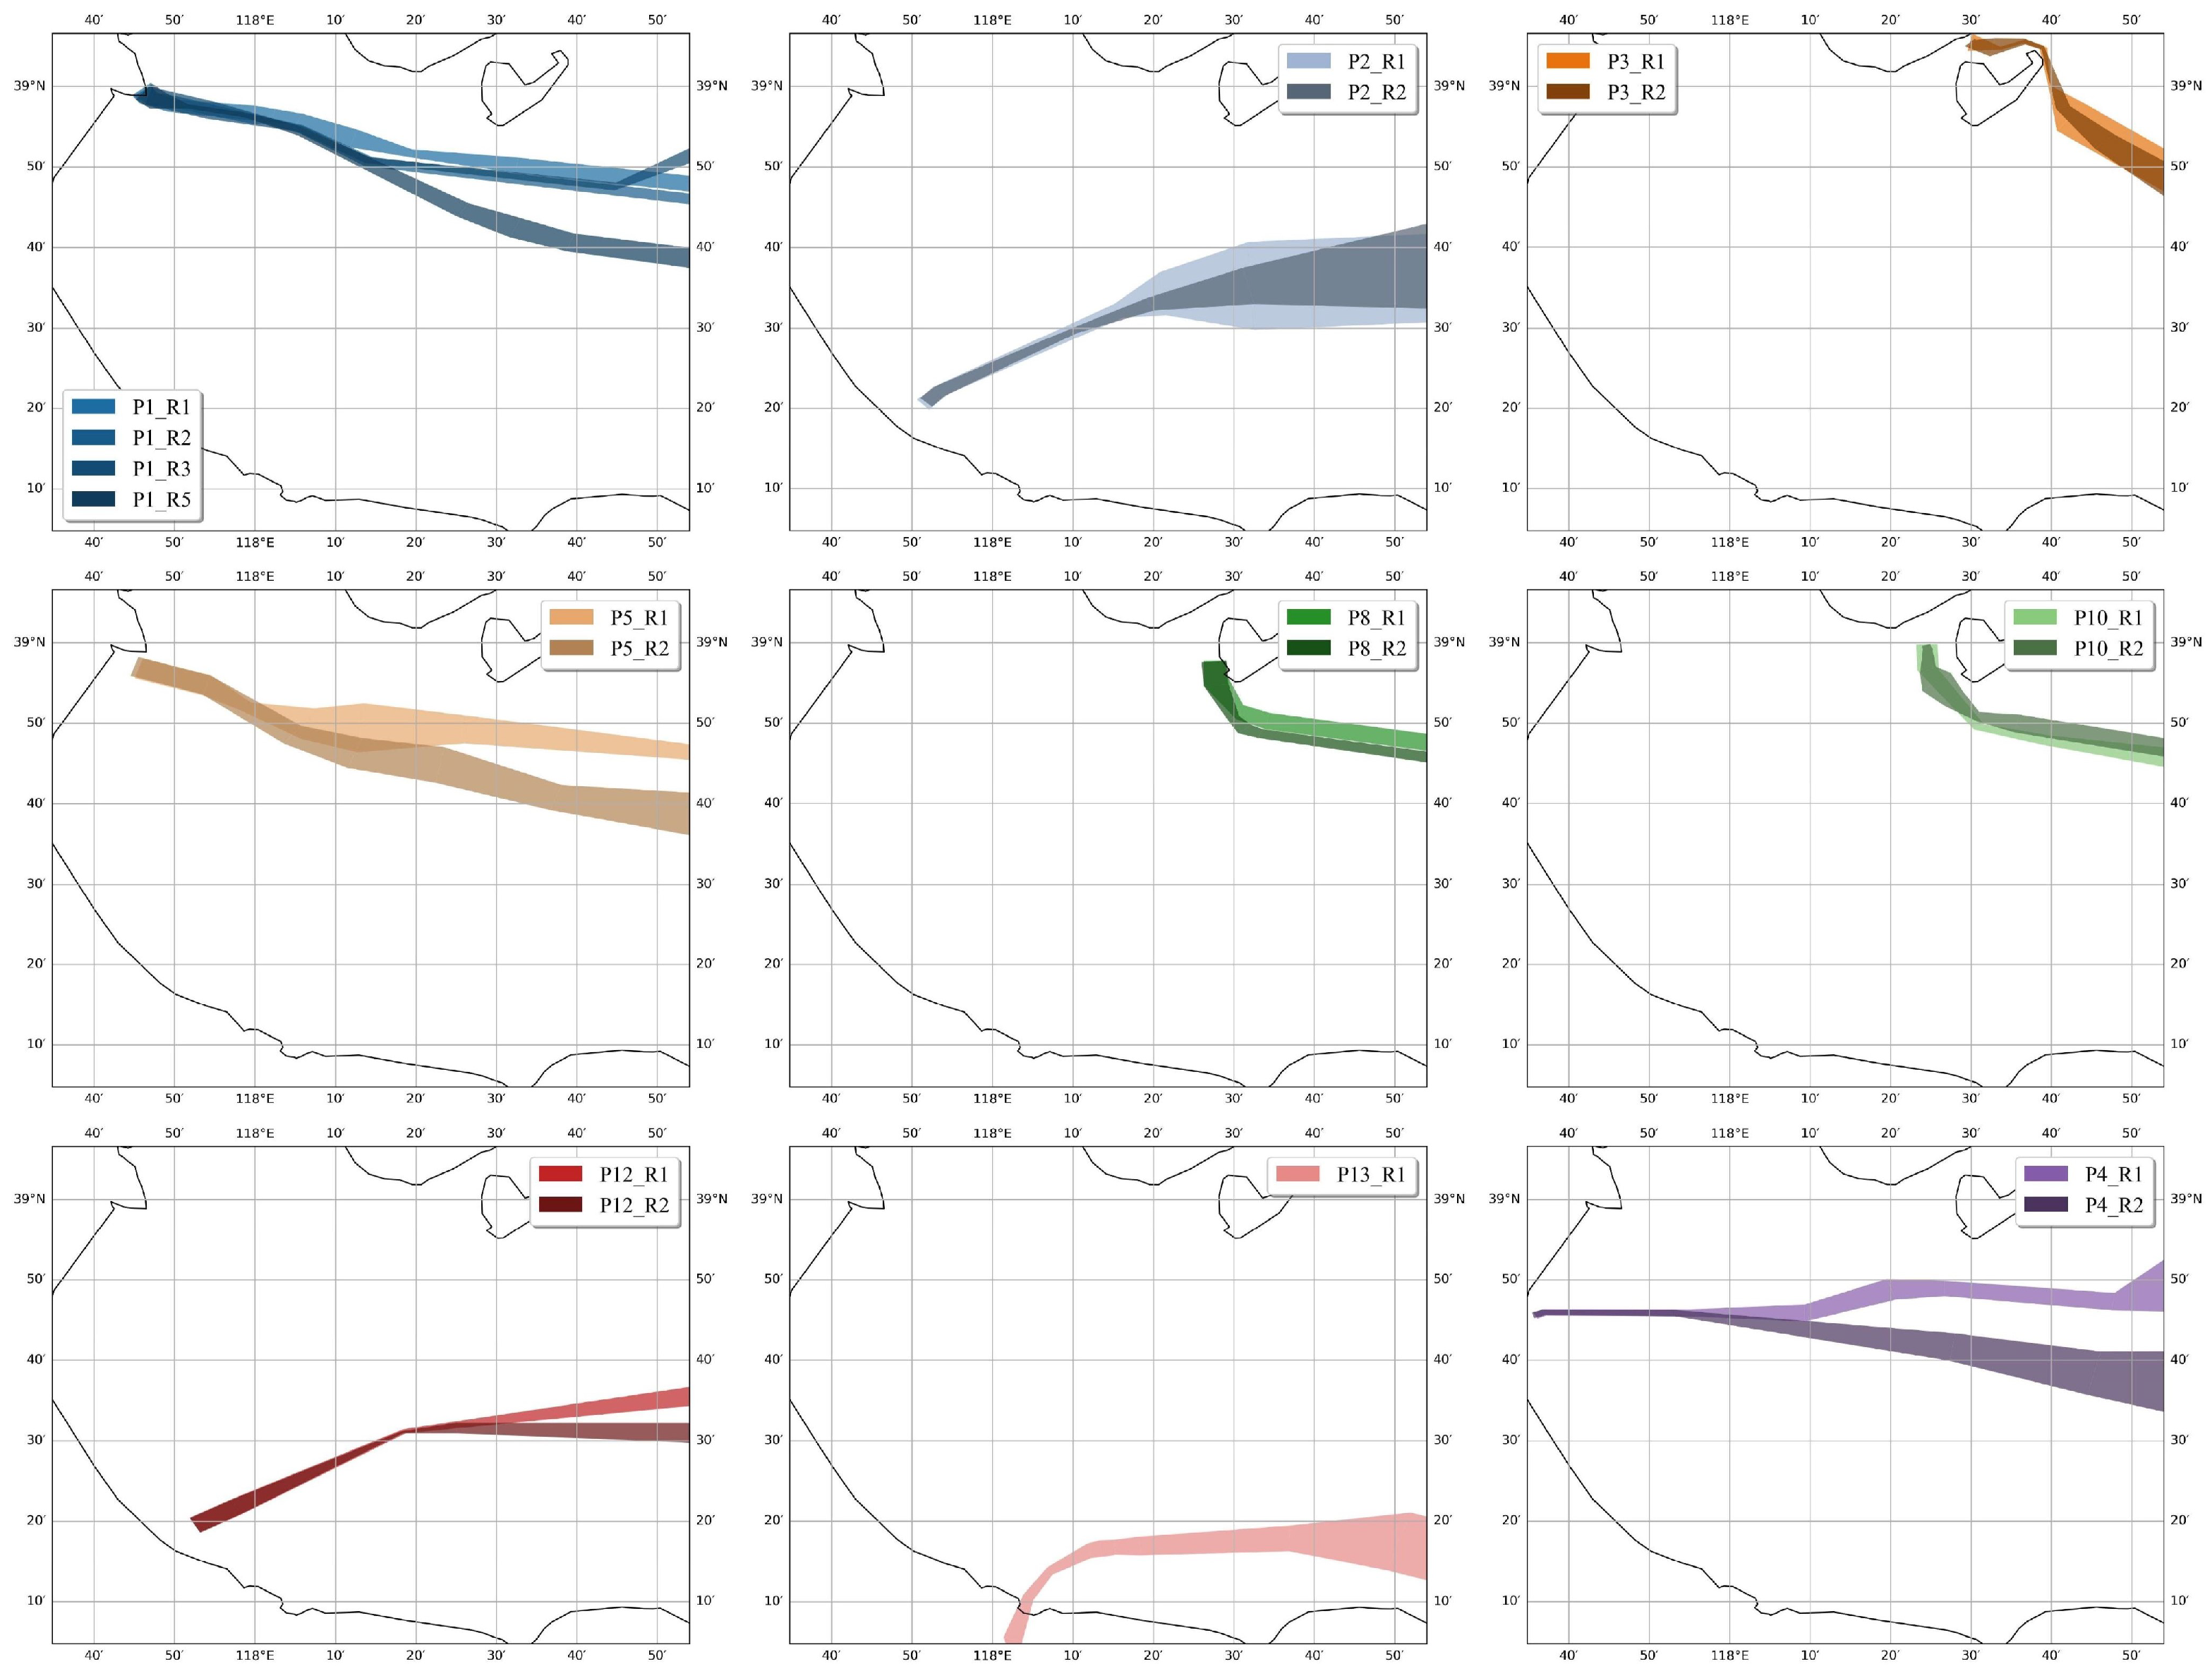
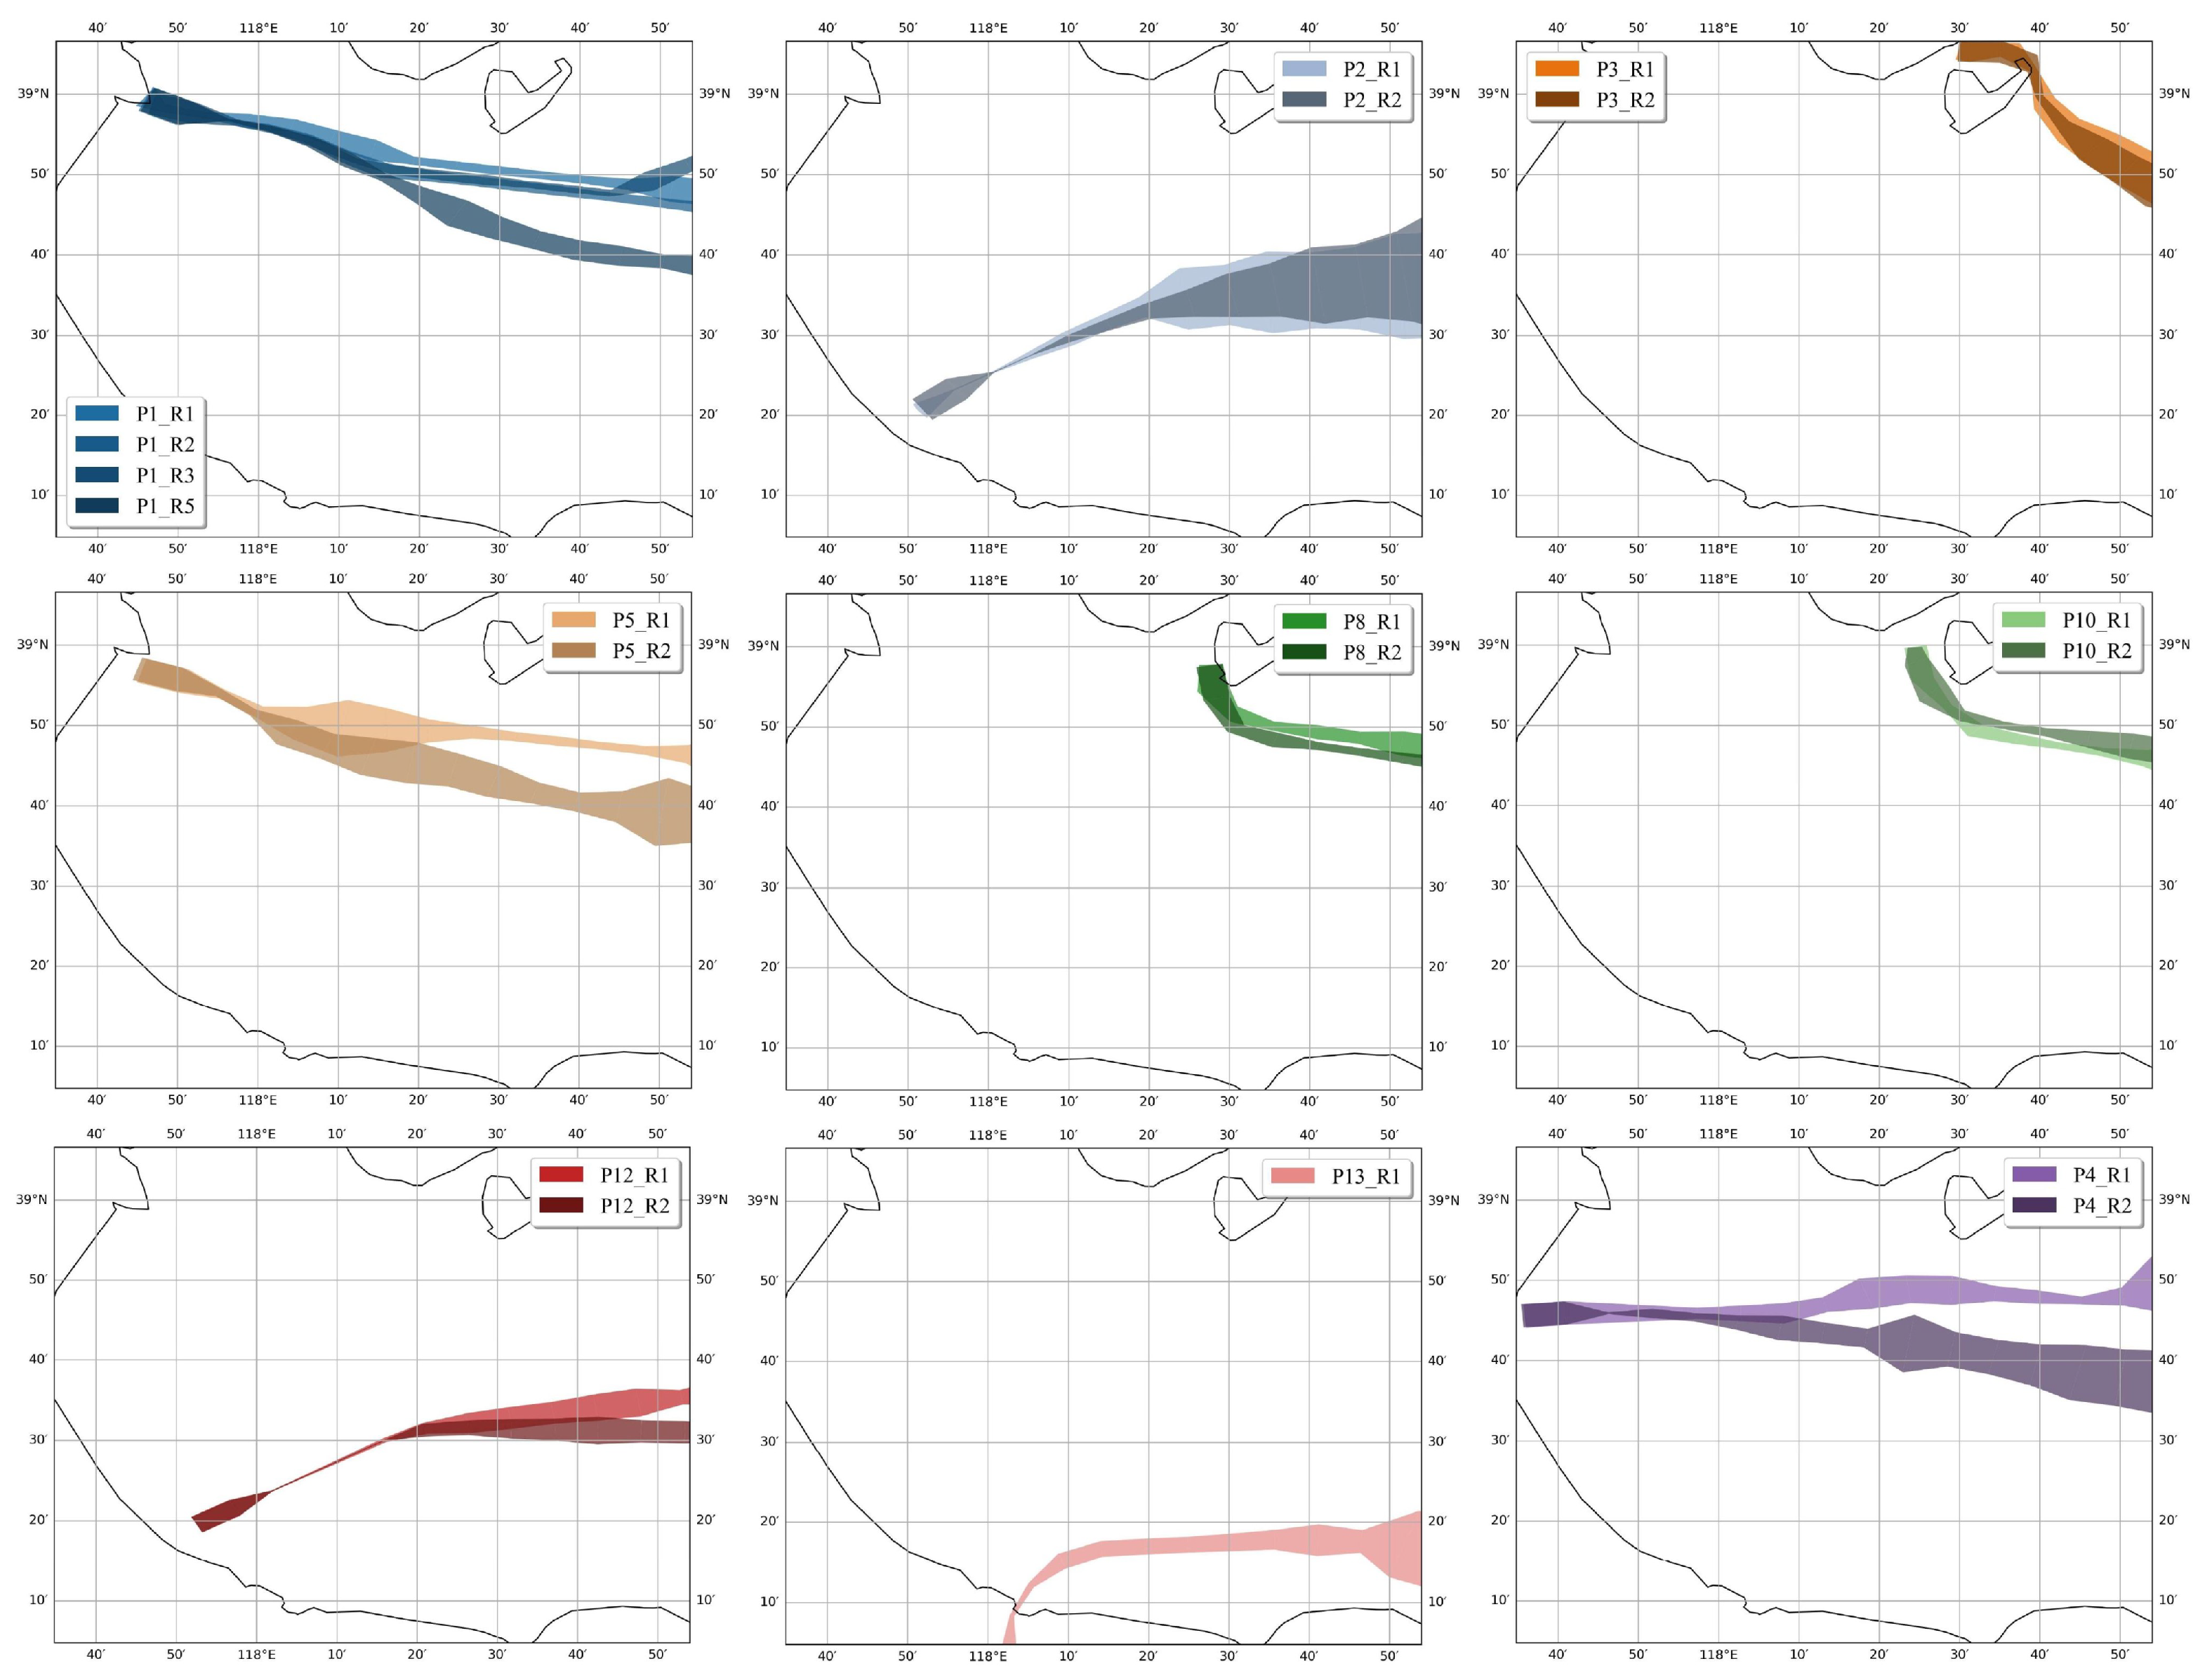
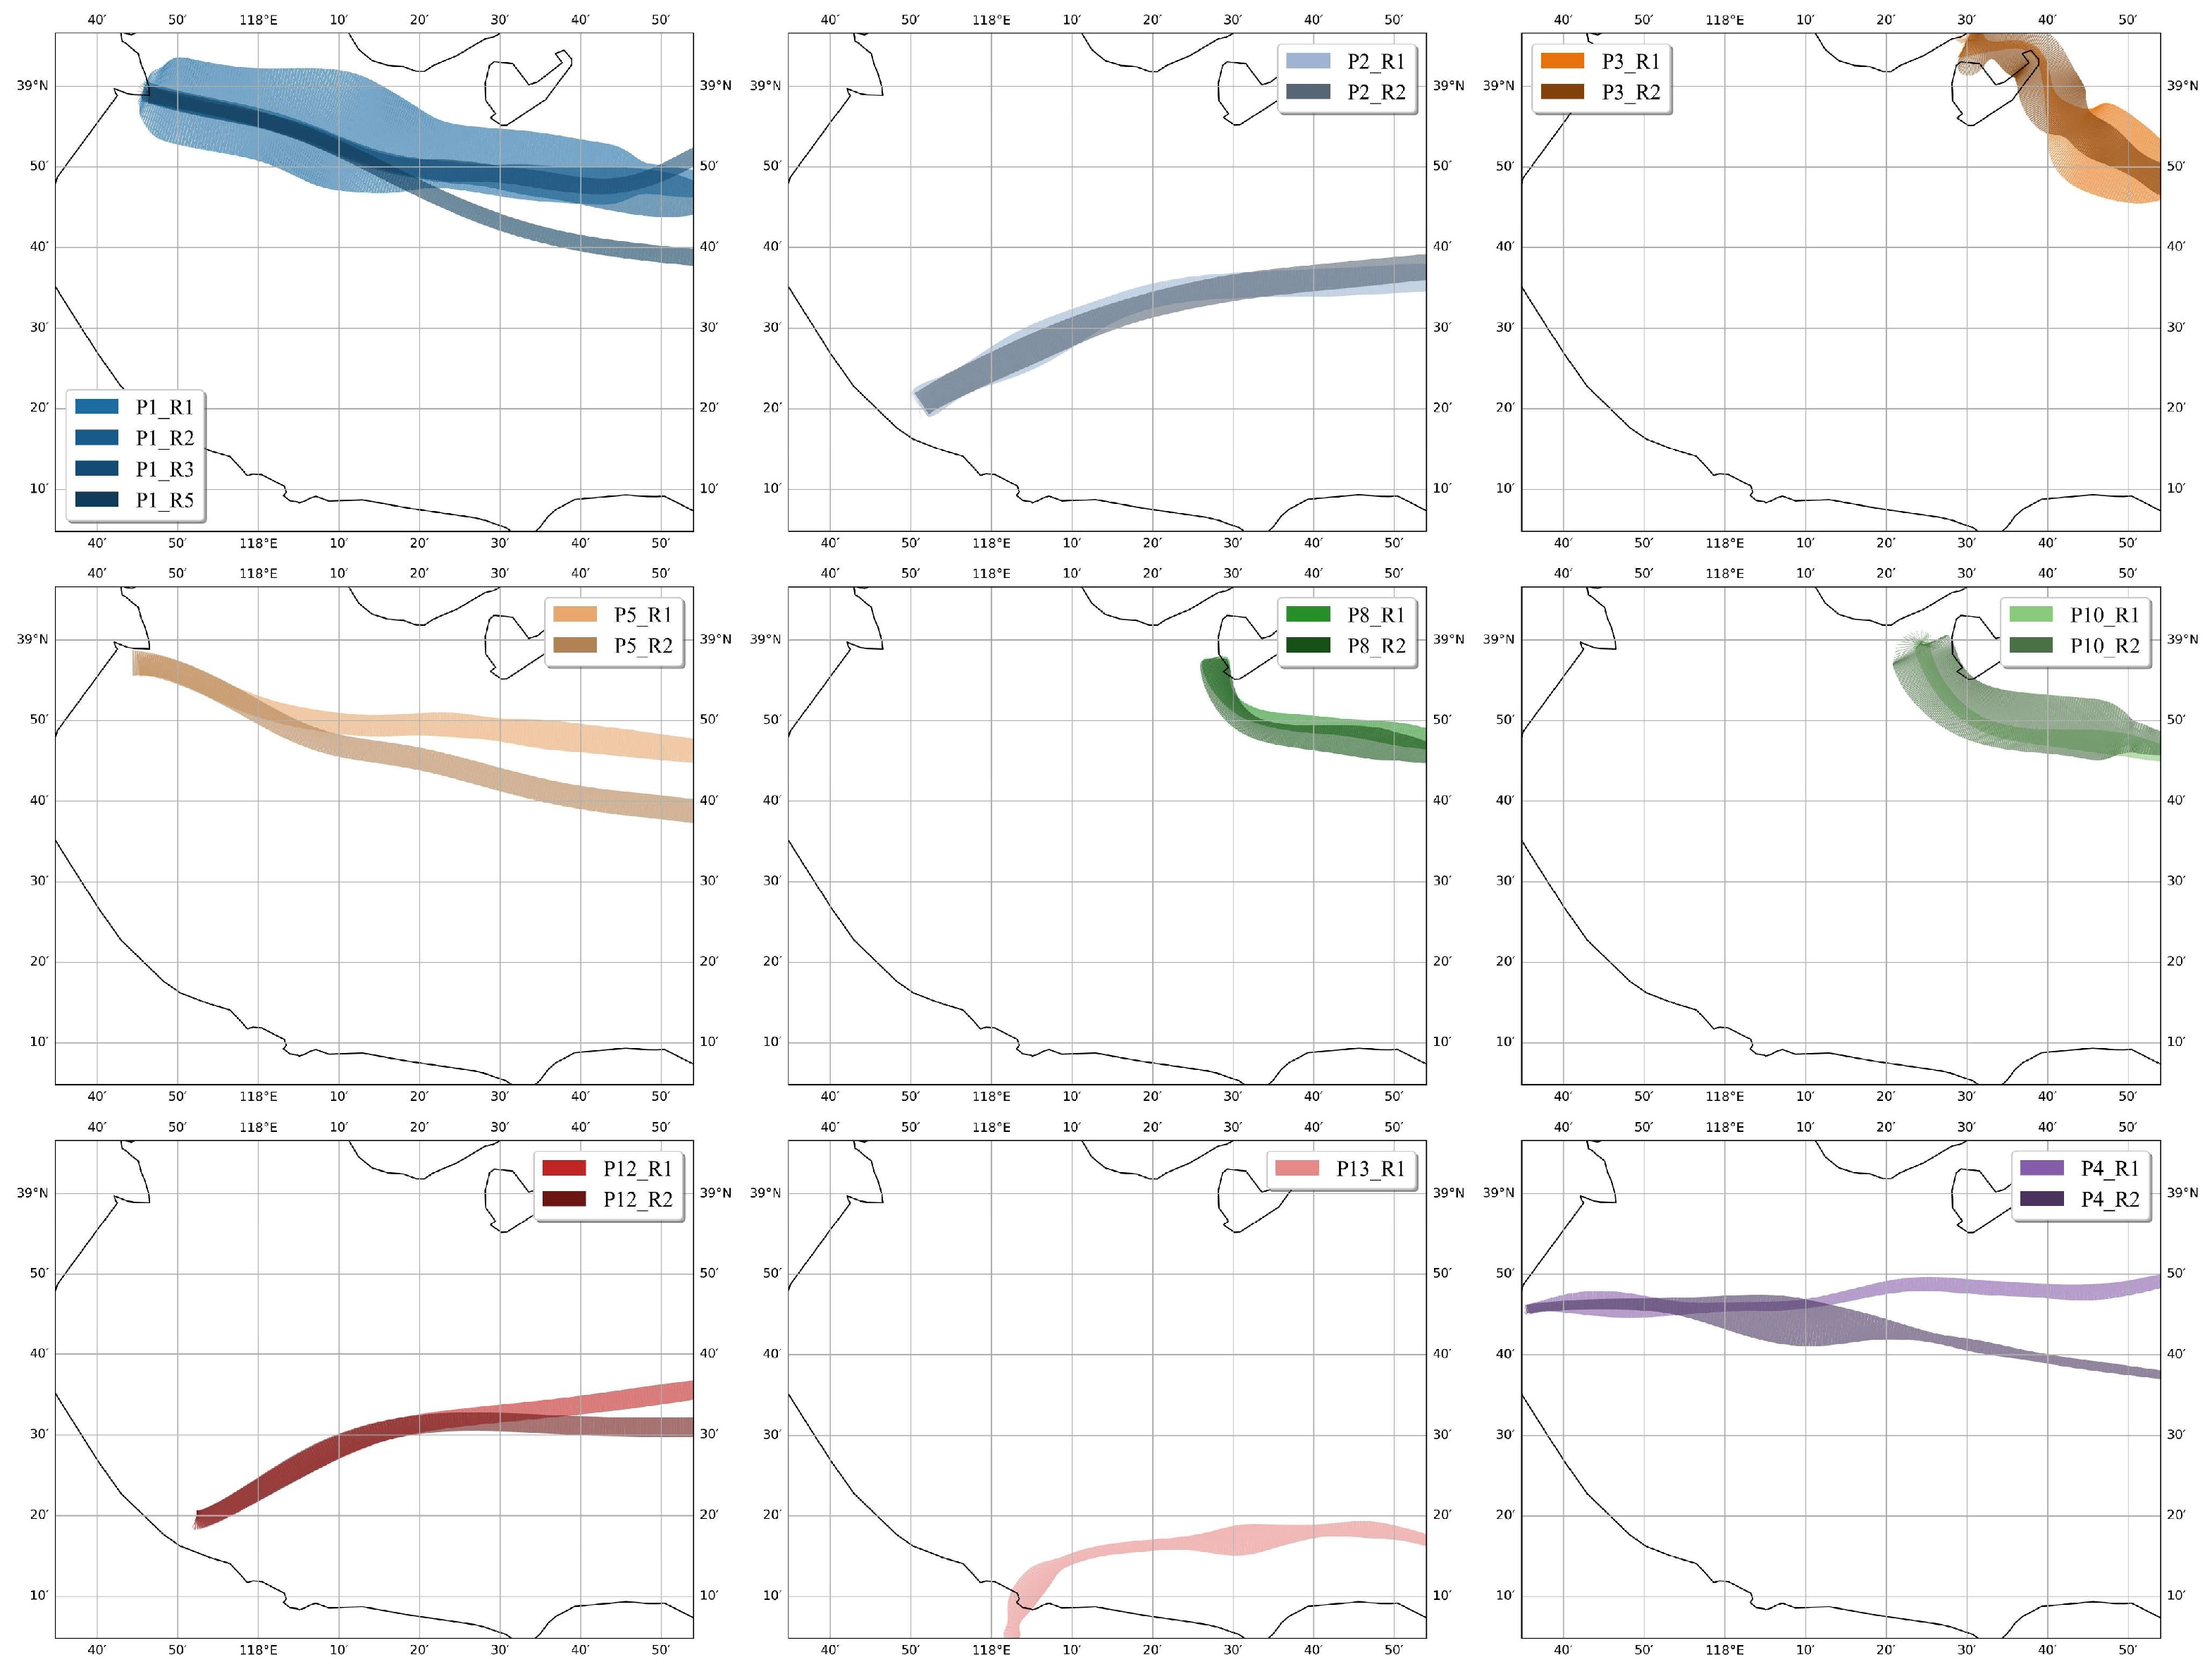
Using R1 of P13 as an example, the safety boundaries for positions and speeds of these routes are shown in Figure 14. The observation-line-based method fails to distinguish individual vessel behaviors and inadequately captures temporal and spatial changes in navigation. The Gaussian process-based method produces initially wide confidence intervals that gradually narrow during the voyage. However, this differs from actual ship trajectories, which tend to be concentrated near the port and more dispersed in open waters. In contrast, our method adapts better to actual vessel characteristics. Finally, using medium-loaded cargo ships as an example, we constructed the safety behavior boundaries for all routes within the target sea area, with the results shown in Figure 15, Figure 16 and Figure 17.
Notably, the observation-line method produces widened safety boundaries when vessels exhibit specific behaviors. In contrast, our method is less affected by such behaviors during the construction of safety boundaries, as shown in R1 and R2 of P2 and R1 and R2 of P5. The Gaussian process method requires a high degree of uniformity in ship navigation times. If a trajectory includes mid-journey berthing or low-speed patterns, its overall navigation time is extended, which interferes with the modeling results, as illustrated in R1 of P1 and R1 and R2 of P3.
From the above experiments, it can be seen that, compared to the observation-line method and the Gaussian process method, this stage-based route modeling approach more accurately reflects actual vessel behavior, especially in irregular waters or non-standard routes.

6. Discussion

6.1. Accuracy of the Model in Capturing Spatial Distribution of Port Route

The waters surrounding Tianjin Port are characterized by dense traffic flows and complex navigational behaviors, making them a representative testbed for evaluating route modeling approaches. To assess the performance of the MARSHB method in capturing the spatial distribution of port routes, comparisons were conducted with two mainstream approaches: the vector-based TTMRN method [19] and the grid-based KDE density modeling method [25].
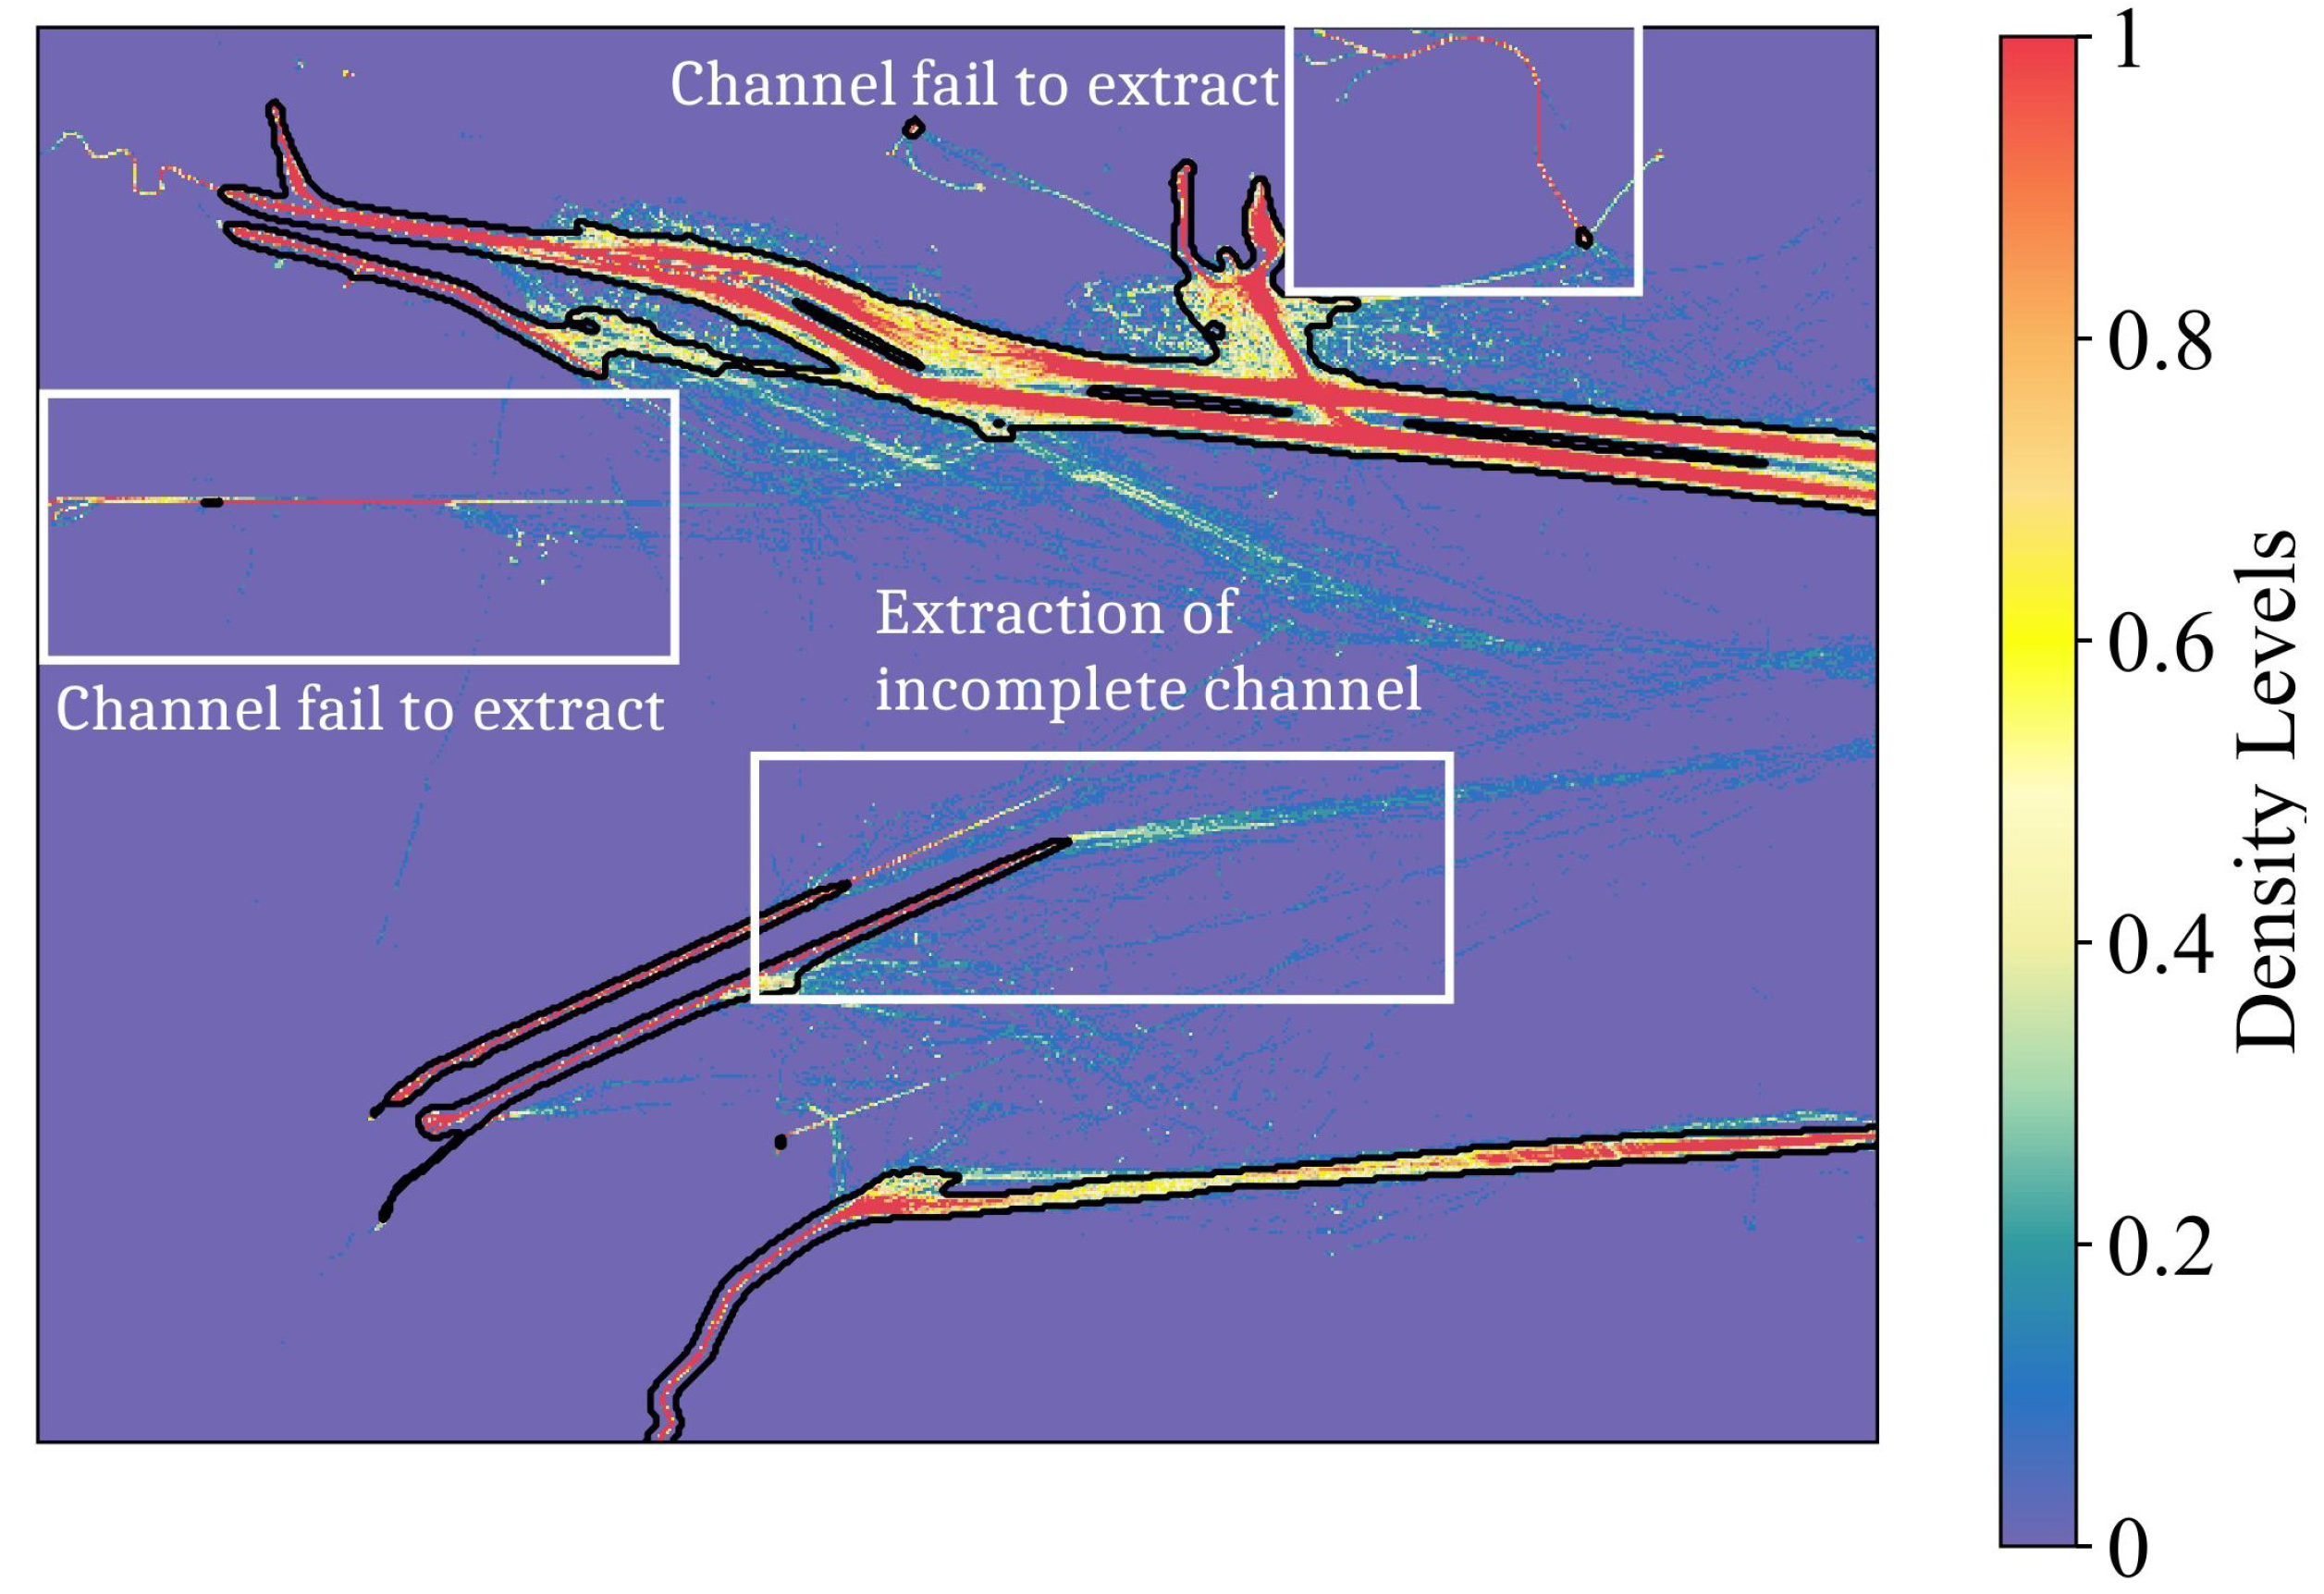
The TTMRN method extracted 11 waypoints and 20 routes in Tianjin Port, as shown in Figure 18b, effectively capturing turning and berthing behaviors during approach. However, it failed to represent branching paths in wider water areas. In contrast, MARSHB identified nine principal routes across five port regions, as shown in Figure 18a. Its coverage rates under varying density thresholds (88.31%, 74.43%, 69.69%) consistently exceeded those of TTMRN (85.06%, 67.01%, 51.20%), demonstrating greater robustness, broader coverage, and a stronger ability to capture branching routes and trajectories in low-density areas. This advantage supports more comprehensive risk identification and improved channel safety management. The KDE method successfully delineated the high-density main channel, as shown in Figure 19, but performed poorly in low-density yet well-defined channels (white rectangle in Figure 19) and was significantly affected by uneven traffic distribution.
For clarity of comparison, the performance of each method in spatial accuracy, behavioral pattern representation, and computational efficiency is summarized in Table 3.
The comparison shows that TTMRN, which focuses on local key points, is better suited to long-distance routes with clear, single pathways. However, in port environments with high traffic and multimodal flow behaviors, its spatial representation is overly simplified. The KDE method relies heavily on density thresholds and often provides incomplete coverage. In contrast, MARSHB maintains high accuracy across varying densities and flow directions, accurately reproducing the hierarchical structure of port routes. Notably, its ability to capture branching channels better reflects actual traffic patterns in multimodal areas.
These findings have direct implications for port management and channel design. First, identifying the branching behaviors of multi-destination vessels allows authorities to anticipate traffic convergence points during scheduling, reducing congestion and conflict risks. Second, by covering low-density but persistently active secondary channels, the method provides essential data for channel design and capacity expansion. This approach avoids biases that may result from overreliance on high-density paths. Finally, a clearer route hierarchy improves traffic regulation and early risk warning, supporting a shift from experience-driven to data-driven port management.

6.2. Accuracy of the Model in Representing Dynamic Characteristics

To evaluate the accuracy of the MARSHB method in capturing vessel dynamic characteristics, namely speed and course, this study compares it with the observation line method and the Gaussian process method. These characteristics are critical for port navigation safety, as they reflect speed variations and heading adjustments, helping to predict potential conflicts and optimize channel management.
The evaluation employs four metrics: coverage of course range (CRC), speed range (SRC), boundary model course error (CBCE), and speed error (SBCE), as detailed in Section 5.1. Using heavily loaded cargo ship trajectories as an example, route models were generated with all three methods, and the mean metric values are shown in Table 4.
Figure 20 and Figure 21 visually compare the three methods in terms of speed and course coverage and boundary errors. MARSHB outperforms the other methods in both CRC and SRC, indicating greater coverage of speed and course ranges. Its balanced performance in SBCE and CBCE reflects strong agreement between model boundaries and historical trajectories.
Overall, MARSHB more accurately reflects vessel operational behaviors in complex port environments. It is particularly effective in capturing dynamics across multi-destination branching, secondary channels, and areas of varying traffic density, which provides a solid foundation for channel safety management.

7. Conclusions

Based on extensive AIS data, this paper proposes a route modeling method for port-adjacent sea areas, which realizes a multi-dimensional model to depict routes characterized by complex and diverse traffic patterns within port sea areas.
The experimental results indicate that, in response to the dense distribution of traffic in port-adjacent waters, MARSHB can more accurately identify routes across varying traffic densities while reducing computation time by 49.75%. In dynamic behavior analysis, the safety behavior boundary developed in this study demonstrates superior precision, with SBCE of 2.69 and CBCE of 28.24, markedly outperforming the traditional Observed Line method (3.37 and 44.81, respectively). These findings show that the proposed approach not only effectively captures high-density traffic flows but also establishes safety boundaries representing vessel operational behaviors with exceptional accuracy.
This study has several limitations. First, the metrics for evaluating dynamic characteristics (CRC, SRC, SBCE, CBCE) measure speed and heading boundaries but lack defined acceptability thresholds, limiting their practical utility in port management. Second, the model depends on historical AIS data, which may contain incomplete reports, positional errors, or gaps, affecting accuracy and robustness. Third, the study focuses on Tianjin Port and adjacent waters; generalizability to other ports is untested, and regional specificity may limit broader applicability. Furthermore, unexpected events such as congestion, accidents, or extreme weather can lead to deviations from typical vessel behavior, thereby increasing the uncertainty of the results. Finally, this study focuses exclusively on self-propelled vessels; therefore, the applicability of the proposed model to tug-assisted vessels remain to be investigated.
Future work will address these limitations. Seasonal and holiday variations in vessel navigation patterns will be analyzed, and a temporally stratified MARSHB model will be developed to compare network connectivity and traffic distribution. The model will also be extended to different spatial scales and voyage lengths, including port-internal, nearshore, and offshore trajectories, exploring multi-resolution clustering approaches for accurate route identification. Finally, the MARSHB model’s potential for real-time vessel monitoring will be explored, integrating dynamic boundary metrics and trajectory deviations for anomaly detection, supporting port safety and shipping operations. These future directions aim to address gaps in seasonal variability, spatial coverage, and real-time anomaly detection, which were identified based on the limitations and findings of the current study.

Author Contributions

J.O.: Writing—original draft, Conceptualization, Methodology, Formal analysis, Investigation, Visualization, Funding acquisition. S.W.: Supervision, Project administration. J.L.: Writing—Review and Editing, Validation, Conceptualization, Resources, Funding acquisition. H.L.: Conceptualization, Investigation. W.Z.: Formal analysis, Data curation. C.J.: Visualization, Software. All authors have read and agreed to the published version of the manuscript.

Funding

This research is supported by the Fundamental Research Funds for the Central Universities (No. 2025YJS144) and the Key R&D Plan Projects in Hebei Province [grant number 22340301D].

Data Availability Statement

The data presented in this study are available on request from the corresponding author. The dataset is commercial and cannot be made publicly available, but it may be provided upon reasonable request.

Conflicts of Interest

Author Jingyi Liu was employed by the company The 54th Research Institute of China Electronics Technology Group Corporation. The remaining authors declare that the research was conducted in the absence of any commercial or financial relationships that could be construed as a potential conflict of interest.

References

  1. Rong, H.; Teixeira, A.; Guedes Soares, C. A framework for ship abnormal behaviour detection and classification using AIS data. Reliab. Eng. Syst. Saf. 2024, 247, 110105. [Google Scholar] [CrossRef]
  2. Peng, P.; Claramunt, C.; Cheng, S.; Yang, Y.; Lu, F. A multi-layer modelling approach for mining versatile ports of a global maritime transportation network. Int. J. Digit. Earth 2023, 16, 2129–2151. [Google Scholar] [CrossRef]
  3. Liu, X.; He, Y.; Zhang, K.; Mou, J.; Zhang, K.; Zhao, X. Research on the decision-making method for autonomous navigation for the ocean-going ship in the ships’ routeing waters. Ocean Eng. 2025, 323, 120641. [Google Scholar] [CrossRef]
  4. Chen, D.; Zhu, M.; Yang, H.; Wang, X.; Wang, Y. Data-driven traffic simulation: A comprehensive review. IEEE Trans. Intell. Veh. 2024, 9, 4730–4748. [Google Scholar] [CrossRef]
  5. Zhang, M.; Zhang, D.; Fu, S.; Kujala, P.; Hirdaris, S. A predictive analytics method for maritime traffic flow complexity estimation in inland waterways. Reliab. Eng. Syst. Saf. 2022, 220, 108317. [Google Scholar] [CrossRef]
  6. Liu, L.; Shibasaki, R.; Zhang, Y.; Kosuge, N.; Zhang, M.; Hu, Y. Data-driven framework for extracting global maritime shipping networks by machine learning. Ocean Eng. 2023, 269, 113494. [Google Scholar] [CrossRef]
  7. Ribeiro, C.V.; Paes, A.; de Oliveira, D. AIS-based maritime anomaly traffic detection: A review. Expert Syst. Appl. 2023, 231, 120561. [Google Scholar] [CrossRef]
  8. Liu, D.; Rong, H.; Soares, C.G. Shipping route modelling of AIS maritime traffic data at the approach to ports. Ocean Eng. 2023, 289, 115868. [Google Scholar] [CrossRef]
  9. Rong, H.; Teixeira, A.; Guedes Soares, C. Ship trajectory uncertainty prediction based on a Gaussian Process model. Ocean Eng. 2019, 182, 499–511. [Google Scholar] [CrossRef]
  10. Rong, H.; Teixeira, A.; Guedes Soares, C. Maritime traffic probabilistic prediction based on ship motion pattern extraction. Reliab. Eng. Syst. Saf. 2022, 217, 108061. [Google Scholar] [CrossRef]
  11. Yan, Z.; Xiao, Y.; Cheng, L.; He, R.; Ruan, X.; Zhou, X.; Li, M.; Bin, R. Exploring AIS data for intelligent maritime routes extraction. Appl. Ocean Res. 2020, 101, 102271. [Google Scholar] [CrossRef]
  12. Cao, Y.; Liang, S.; Sun, L.; Liu, J.; Cheng, X.; Wang, D.; Chen, Y.; Yu, M.; Feng, K. Trans-Arctic shipping routes expanding faster than the model projections. Glob. Environ. Change 2022, 73, 102488. [Google Scholar] [CrossRef]
  13. Han, D.; Cheng, X.; Chen, H.; Xiao, C.; Wen, Y.; Sui, Z. Simulation Modeling for Ships Entering and Leaving Port in Qiongzhou Strait Waters: A Multi-Agent Information Interaction Method. J. Mar. Sci. Eng. 2024, 12, 1560. [Google Scholar] [CrossRef]
  14. Yan, Z.; Yang, G.; He, R.; Shi, K.; Yang, H. Reconstructing trajectories and extracting shipping routes between ports based on AIS data. Appl. Ocean Res. 2025, 161, 104709. [Google Scholar] [CrossRef]
  15. Chen, X.; Wu, P.; Zhang, Y.; Wang, X.; Xian, J.; Zhang, H. Smart Maritime Transportation-Oriented Ship-Speed Prediction Modeling Using Generative Adversarial Networks and Long Short-Term Memory. J. Mar. Sci. Eng. 2025, 13, 1045. [Google Scholar] [CrossRef]
  16. Xiao, Z.; Fu, X.; Zhang, L.; Goh, R.S.M. Traffic pattern mining and forecasting technologies in maritime traffic service networks: A comprehensive survey. IEEE Trans. Intell. Transp. Syst. 2019, 21, 1796–1825. [Google Scholar] [CrossRef]
  17. Xiao, Z.; Zhang, X.; Fu, X.; Zhang, L.; Xu, H.; Liu, R.W.; Chong, C.S.; Qin, Z. Innovating Waterway Route Planning as a Service for Marine Traffic Applications. IEEE Trans. Intell. Veh. 2024. [Google Scholar] [CrossRef]
  18. Pallotta, G.; Vespe, M.; Bryan, K. Traffic route extraction and anomaly detection from AIS data. In Proceedings of the International COST MOVE Workshop on Moving Objects at Sea, Brest, France, 27–28 June 2013; pp. 1–4. [Google Scholar]
  19. Zhou, C.; Xiang, J.; Huang, H.; Yan, Y.; Huang, L.; Wen, Y.; Xiao, C. TTMRN: A topological-geometric two-layer maritime route network modeling for ship intelligent navigation. Ocean Eng. 2023, 287, 115884. [Google Scholar] [CrossRef]
  20. Potočnik, P. Model Predictive Control for Autonomous Ship Navigation with COLREG Compliance and Chart-Based Path Planning. J. Mar. Sci. Eng. 2025, 13, 1246. [Google Scholar] [CrossRef]
  21. Liu, R.W.; Zhou, S.; Liang, M.; Gao, R.; Wang, H. From ports to routes: Extracting multi-scale shipping networks using massive AIS data. Ocean Eng. 2024, 311, 118969. [Google Scholar] [CrossRef]
  22. Xing, B.; Zhang, L.; Liu, Z.; Sheng, H.; Bi, F.; Xu, J. The study of fishing vessel behavior identification based on ais data: A case study of the east china sea. J. Mar. Sci. Eng. 2023, 11, 1093. [Google Scholar] [CrossRef]
  23. Kim, H.C.; Son, W.J.; Lee, J.S.; Cho, I.S. Identification of maritime areas with high vessel traffic based on polygon shape similarity. IEEE Access 2024, 12, 92253–92267. [Google Scholar] [CrossRef]
  24. Li, P.; Hu, Q. A grid-based method for unsupervised speed pattern recognition using AIS data. Ocean Eng. 2025, 328, 121050. [Google Scholar] [CrossRef]
  25. Zhang, L.; Chen, P.; Li, M.; Chen, L.; Mou, J. A data-driven approach for ship-bridge collision candidate detection in bridge waterway. Ocean Eng. 2022, 266, 113137. [Google Scholar] [CrossRef]
  26. Liang, M.; Liu, K.; Gao, R.; Li, Y. Integrating GPU-accelerated for fast large-scale vessel trajectories visualization in maritime IoT systems. IEEE Trans. Intell. Transp. Syst. 2025, 26, 4048–4065. [Google Scholar] [CrossRef]
  27. Kyaw, P.T.; Paing, A.; Thu, T.T.; Mohan, R.E.; Le, A.V.; Veerajagadheswar, P. Coverage path planning for decomposition reconfigurable grid-maps using deep reinforcement learning based travelling salesman problem. IEEE Access 2020, 8, 225945–225956. [Google Scholar] [CrossRef]
  28. Liu, Z.; Gao, H.; Zhang, M.; Yan, R.; Liu, J. A data mining method to extract traffic network for maritime transport management. Ocean Coast. Manag. 2023, 239, 106622. [Google Scholar] [CrossRef]
  29. Tang, C.; Chen, M.; Zhao, J.; Liu, T.; Liu, K.; Yan, H.; Xiao, Y. A novel ship trajectory clustering method for Finding Overall and Local Features of Ship Trajectories. Ocean Eng. 2021, 241, 110108. [Google Scholar] [CrossRef]
  30. Farahnakian, F.; Nicolas, F.; Farahnakian, F.; Nevalainen, P.; Sheikh, J.; Heikkonen, J.; Raduly-Baka, C. A comprehensive study of clustering-based techniques for detecting abnormal vessel behavior. Remote Sens. 2023, 15, 1477. [Google Scholar] [CrossRef]
  31. Zhang, R.; Wu, H.; Yin, Z.; Xiao, Z.; Cheng, Q.; Liu, K. Predictive clustering of vessel behavior based on hierarchical trajectory representation. IEEE Trans. Intell. Transp. Syst. 2024, 25, 19496–19506. [Google Scholar] [CrossRef]
  32. Liu, Z.; Yang, H.; Xiong, C.; Xu, F.; Gan, L.; Yan, T.; Shu, Y. Research on the optimization of ship trajectory clustering based on the OD–Hausdorff distance. J. Mar. Sci. Eng. 2024, 12, 1398. [Google Scholar] [CrossRef]
  33. Lee, B.; Silveira, P.; Loureiro, H.; Teixeira, A. A framework for characterizing the marine traffic of the continental coast of Portugal using historical AIS data. In Trends in Maritime Technology and Engineering; CRC Press: Boca Raton, FL, USA, 2022; pp. 113–120. [Google Scholar]
  34. Yin, Z.C.; Wei, J.J.; Ying, S.; Jia, P.N. Time-awareness in kernel density estimation for movement data. Int. J. Geogr. Inf. Sci. 2025, 1–18. [Google Scholar] [CrossRef]
  35. Zhang, X.; Zhou, S.; Jiang, Z.; Chu, X.; Yu, C. A novel ship trajectory clustering model integrated with spatiotemporal attributes. Ocean Eng. 2025, 336, 121774. [Google Scholar] [CrossRef]
  36. Yang, J.; Zhao, S.; Wang, M.; Sun, Y.; Wu, C. A noval method for constructing a hierarchical maritime topological route network based on the spatiotemporal features of vessel trajectories. Ocean Eng. 2025, 340, 122383. [Google Scholar] [CrossRef]
  37. Zhang, F.; Wen, Y.; Banda, O.V.; Chen, M.; Du, L. Maritime traffic network extraction and vessel flow prediction in complex inland port clusters. Ocean Eng. 2025, 341, 122791. [Google Scholar] [CrossRef]
  38. Gao, Y.; Fang, Z.; Xu, J.; Gong, S.; Shen, C.; Chen, L. An efficient and distributed framework for real-time trajectory stream clustering. IEEE Trans. Knowl. Data Eng. 2023, 36, 1857–1873. [Google Scholar] [CrossRef]
  39. Eljabu, L.; Etemad, M.; Matwin, S. Spatial clustering method of historical ais data for maritime traffic routes extraction. In Proceedings of the 2022 IEEE International Conference on Big Data (Big Data), Osaka, Japan, 17–22 December 2022; pp. 893–902. [Google Scholar]
  40. Huang, I.L.; Lee, M.C.; Chang, L.; Huang, J.C. Development and Application of an Advanced Automatic Identification System (AIS)-Based Ship Trajectory Extraction Framework for Maritime Traffic Analysis. J. Mar. Sci. Eng. 2024, 12, 1672. [Google Scholar] [CrossRef]
  41. Wani, A.A. Comprehensive analysis of clustering algorithms: Exploring limitations and innovative solutions. PeerJ Comput. Sci. 2024, 10, e2286. [Google Scholar] [CrossRef]
  42. Li, H.; Yang, Z. Incorporation of AIS data-based machine learning into unsupervised route planning for maritime autonomous surface ships. Transp. Res. Part E Logist. Transp. Rev. 2023, 176, 103171. [Google Scholar] [CrossRef]
  43. Cheng, X.; Wen, Y.; Sui, Z.; Huang, L.; Lin, H. Multi-granularity spatiotemporal object modelling of waterborne traffic elements. Comput. Ind. 2025, 164, 104185. [Google Scholar] [CrossRef]
  44. Dong, X.C.; Wang, G.X. Coal logistics competency strategies for ports in the Tianjin and Hebei regions around the Bohai Bay in China. Energy Procedia 2012, 17, 436–443. [Google Scholar] [CrossRef]
  45. Wang, G.W.; Zeng, Q.; Li, K.; Yang, J. Port connectivity in a logistic network: The case of Bohai Bay, China. Transp. Res. Part E Logist. Transp. Rev. 2016, 95, 341–354. [Google Scholar] [CrossRef]
  46. Ou, J.; Wang, S.; Liu, J.; Zhu, Y.; Li, H.; Zhao, W.; Deng, C. Multi-stage trajectory compression via speed information for preserving maritime traffic information integrity. Ocean Eng. 2025, 330, 121073. [Google Scholar] [CrossRef]
  47. Xia, Z.; Wang, W.; Guo, Z.; Peng, Y.; Xu, X. Navigation mode extraction and trajectory repair of complex waters in multi-harbor port: An optimal semi-supervised clustering method. Ocean Eng. 2024, 313, 119439. [Google Scholar] [CrossRef]
  48. Yan, Z.; Cheng, L.; He, R.; Yang, H. Extracting ship stopping information from AIS data. Ocean Eng. 2022, 250, 111004. [Google Scholar] [CrossRef]
  49. Alderton, P.M.; Saieva, G. Port Management and Operations; Taylor & Francis: Abingdon, UK, 2013. [Google Scholar]
  50. Xia, Z.; Tian, Q.; Feng, T.; Guo, Z.; Peng, Y.; Jiang, Y.; Wang, W. Integration management of vessel transportation in complex waterway network of port clusters: A column generation-based solution approach. Expert Syst. Appl. 2025, 268, 126242. [Google Scholar] [CrossRef]
  51. Bai, X.; Xie, Z.; Xu, X.; Xiao, Y. An adaptive threshold fast DBSCAN algorithm with preserved trajectory feature points for vessel trajectory clustering. Ocean Eng. 2023, 280, 114930. [Google Scholar] [CrossRef]
  52. Barber, C.B.; Dobkin, D.P.; Huhdanpaa, H. The quickhull algorithm for convex hulls. ACM Trans. Math. Softw. (TOMS) 1996, 22, 469–483. [Google Scholar] [CrossRef]
  53. Douglas, D.H.; Peucker, T.K. Algorithms for the reduction of the number of points required to represent a digitized line or its caricature. Cartogr. Int. J. Geogr. Inf. Geovisualization 1973, 10, 112–122. [Google Scholar] [CrossRef]
  54. Zhang, S.k.; Liu, Z.j.; Cai, Y.; Wu, Z.l.; Shi, G.y. AIS trajectories simplification and threshold determination. J. Navig. 2016, 69, 729–744. [Google Scholar] [CrossRef]
  55. Ester, M.; Kriegel, H.; Sander, J.; Xu, X. A density-based algorithm for discovering clusters in large spatial databases with noise. In Proceedings of the Second International Conference on Knowledge Discovery and Data Mining, Portland, OR, USA, 2–4 August 1996; Volume 96, pp. 226–231. [Google Scholar]
  56. Yang, J.; Liu, Y.; Ma, L.; Ji, C. Maritime traffic flow clustering analysis by density based trajectory clustering with noise. Ocean Eng. 2022, 249, 111001. [Google Scholar] [CrossRef]
  57. Zissis, D.; Chatzikokolakis, K.; Spiliopoulos, G.; Vodas, M. A distributed spatial method for modeling maritime routes. IEEE Access 2020, 8, 47556–47568. [Google Scholar] [CrossRef]
  58. Sheng, K.; Liu, Z.; Zhou, D.; He, A.; Feng, C. Research on ship classification based on trajectory features. J. Navig. 2018, 71, 100–116. [Google Scholar] [CrossRef]
  59. Zhang, X.; Guo, W.; Yang, Z.; Wang, J.; Wang, C. Optimization of integrated accurate ride-tide planning and vessel scheduling in multi-functional ports with long channels. Expert Syst. Appl. 2025, 273, 126894. [Google Scholar] [CrossRef]
  60. Liu, L.; Zhang, Y.; Hu, Y.; Wang, Y.; Sun, J.; Dong, X. A hybrid-clustering model of ship trajectories for maritime traffic patterns analysis in port area. J. Mar. Sci. Eng. 2022, 10, 342. [Google Scholar] [CrossRef]
  61. Rong, H.; Teixeira, A.; Soares, C.G. Evaluation of near-collisions in the Tagus River Estuary using a marine traffic simulation model. Zesz. Nauk. Akad. Morskiej Szczecinie 2015, 43, 68–78. [Google Scholar]
Figure 1. Introduction to the research area and dataset. (a) The vessel traffic density map in the target sea area. (b) The distribution of ship types in the dataset. (c) The distribution of the trajectory draught of different types of ships in the dataset.
Jmse 13 01963 g001
Figure 2. The distribution of anchoring points. Different colors represent anchoring points of different vessels. The irregular enclosed area in red is the result of the structure of the port area. The enlarged submap shows the distribution of anchoring points in the port area. Basically, anchoring points are densely distributed along the berths.
Jmse 13 01963 g002
Figure 3. (a) The distance distribution of anchoring points from same ship. (b) The DTW distance distribution of trajectories within the port subset.
Jmse 13 01963 g003
Figure 4. The framework of maritime route network extraction and modeling method (MARSHB).
Jmse 13 01963 g004
Figure 5. The schematic diagram of hierarchical density clustering-based method for port route extraction.
Jmse 13 01963 g005
Figure 6. The process of computing the centerline through DTW algorithm alignment. In the figure, Traj1 and Traj2 are two trajectories that need to be aligned, and CT is the result of calculating the centerline of the aligned trajectories.
Jmse 13 01963 g006
Figure 7. The schematic diagram of the route modeling method proposed in this paper considering ship handling characteristics.
Jmse 13 01963 g007
Figure 8. Effect of kernel width on speed–distance adjustment along the center trajectory. The figure compares distributions before and after optimization using different kernel width parameter  α .
Jmse 13 01963 g008
Figure 9. Extraction results of navigation routes in the target sea area based on the maritime trajectory dataset covering nine port areas. Trajectories were clustered for each port region using high-density region analysis to distinguish inbound and outbound routes. Different colors represent different clusters (C), and different ports are marked by P. Extraction results show the spatial distribution of extracted routes and highlight the main navigation corridors within each port region.
Jmse 13 01963 g009
Figure 10. Comparison of route extraction results using two clustering methods on one-week trajectory data. (a) Direct DBSCAN clustering, which identifies only high-density clusters (colored) and misses low-density regions such as port0 and port4; gray points indicate noise or unclustered trajectories. (b) Proposed hierarchical clustering method, which accurately extracts trajectories across both high and low density areas. Different colors represent distinct clusters, and labels P0 to P4 indicate key port areas.
Jmse 13 01963 g010
Figure 11. For vessel trajectories under different ship types and loading conditions, representative paths of the identified typical routes are computed and analyzed individually. In the figure, the path out of the port is represented by a red line, and the path into the port is represented by a blue line.
Jmse 13 01963 g011
Figure 12. Boxplots showing the distribution of speed and course for different ship types and load conditions on the departure path from Port 1. (a) Speed distribution: container ships exhibit the highest average speed, while lightly loaded ships show a more concentrated speed distribution, slightly lower than heavily loaded ships. (b) Course distribution: the course patterns appear largely unaffected by load conditions across all ship types.
Jmse 13 01963 g012
Figure 13. The results of dynamic stage division and classification of trajectory data. (a) visualizes the segmentation in channel space, dividing the entire voyage from departure to entry into the open sea into six consecutive stages: (i) low-speed and course adjustment upon departure; (ii) acceleration and course adjustment after departure; (iii) northeast-bound acceleration navigation; (iv) northeast-bound constant-speed navigation; (v) mid-open-sea constant-speed navigation; and (vi) speed and course adjustment for open-sea entry. (b,c) display the trajectories in the space-course and space-speed dimensions, respectively, clearly revealing the dynamic variations in course and speed across segments. Overall, the use of distinct colors effectively highlights the phased characteristics of navigation behavior as they evolve with spatial position.
Jmse 13 01963 g013
Figure 14. Safety boundary construction results for Port13, Route1 in spatial-speed space.
Jmse 13 01963 g014
Figure 15. The construction results of safety behavior boundary for all the routes extracted from the target sea area based on the MARSHB method.
Jmse 13 01963 g015
Figure 16. The construction results of the safety behavior boundary for all the routes extracted from the target sea area based on the Obs-line method.
Jmse 13 01963 g016
Figure 17. The construction results of the safety behavior boundary for all the routes extracted from the target sea area based on the GP method.
Jmse 13 01963 g017
Figure 18. The traffic route model construct result of Tianjin Port.
Jmse 13 01963 g018
Figure 19. Route boundary extraction in Bohai Sea area using the Kernel Density Estimation (KDE) method.
Jmse 13 01963 g019
Figure 20. Boundary coverage metrics of route modeling results for heavy-load cargo vessels using the three methods. (a) The Course Range Coverage (CRC) of the route model. (b) The Speed Range Coverage (SRC) of the route model. Higher CRC and SRC values indicate greater inclusiveness of the modeled behavioral safety boundaries.
Jmse 13 01963 g020
Figure 21. Boundary consistency error metrics of route modeling results for heavy-load cargo vessels using the three methods. (a) The Course Boundary Consistency Error (CBCE) between real trajectory points and the route model. (b) The Speed Boundary Consistency Error (SBCE) between true trajectory points and the route model. Lower SBCE and CBCE values suggest a smaller deviation between the speed and course of trajectory points and the safety boundaries generated by the model.
Jmse 13 01963 g021
Table 1. Detailed categorization of the ship trajectory dataset. Light load corresponds to draughts less than 5 m, medium load to draughts between 5 m and 10 m, and heavy load to draughts equal to or greater than 10 m.
Ship TypeLight LoadMedium LoadHeavy LoadTotal
Tank7517572031711
Container89789491935
Cargo32086209207311,490
Table 2. Location information for the 13 identified port areas is provided, with longitude and latitude indicating the center of each port area cluster. “Anchor Points” denotes the number of AIS anchoring points within the cluster, while “Max Radius” refers to the maximum radial distance from the center to the outermost anchoring point (in km).
PortLongitudeLatitudeAnchor PointsMax Radius
Port1117.7638.99223,8007.26
Port2117.8638.3531,6645.13
Port3118.5039.0960261.41
Port4117.6038.7669341.31
Port5117.7638.9550,2064.30
Port6117.8738.9345491.44
Port7117.8738.9516980.86
Port8118.4738.96163,1025.36
Port9118.5038.9118,7842.99
Port10118.4139.0016,1851.59
Port11118.5739.105020.23
Port12117.8838.3255,0792.06
Port13118.0438.0889453.02
Table 3. Comparison of different methods in terms of spatial distribution accuracy, behavior pattern representation, and applicable scenarios.
MethodSpatial Capture CapabilityPattern Capture CapabilityApplicable Scenarios
TTMRNMedium
(accurate near-port turning and berthing)
Medium
(Clear local behavior, weak cross-waterway diversion)
Long-distance clearly pattern
KDEHigh
(accurate in dense main channels)
Low
(secondary channels hard to identify)
High-density areas
MARSHBHigh
(covers main and branch channels)
High
(captures diversion and multi-mode behavior)
Complex port multiple path
Table 4. Comparison of route modeling methods for heavily loaded cargo ships. CRC and SRC show the proportion of historical course and speed ranges captured, while CBCE and SBCE indicate deviations in course (°) and speed (knot), with lower values being better.
MethodCRC (%)SRC (%)SBCE (knot)CBCE (°)
MARSHB65.077.81.343.4
GP Method54.074.02.074.8
Obs Method41.470.81.762.5
Disclaimer/Publisher’s Note: The statements, opinions and data contained in all publications are solely those of the individual author(s) and contributor(s) and not of MDPI and/or the editor(s). MDPI and/or the editor(s) disclaim responsibility for any injury to people or property resulting from any ideas, methods, instructions or products referred to in the content.