Abstract
Pure Loss of Stability is one of the five typical stability failure modes identified in the Second-Generation Intact Stability Criteria by the IMO. This study investigates the influence of hull line variations on the vulnerability of a saury fishing vessel to pure loss of stability. Hull forms were parametrically modified using the Free-Form Deformation method, and an in-house code was developed to evaluate stability performance. The numerical framework was validated against the commercial ICS-HydroSTAB software (Version 1.0), demonstrating high computational accuracy and engineering applicability. Parametric sensitivity analysis was then conducted to examine the effects of geometric characteristics under both calm-water and wave-induced conditions. The results indicate that vulnerability in calm water is primarily governed by the maximum sectional area curve and the bow portion of the DWL half-breadth curve, while in waves it is influenced by both the maximum sectional area curve and the fore and aft portions of the DWL half-breadth curve. The half angle of entrance (E = 0.08) exhibits a comparatively minor effect, but its increase reduces the initial metacentric height and significantly elevates the risk of capsizing in waves. These findings provide useful references for hull form optimization and stability design.
1. Introduction
Ship stability, a fundamental concern in maritime safety, plays a decisive role in ensuring vessel integrity under complex sea conditions. With the continuous evolution of hull design and operating environments, traditional stability criteria have become insufficient to meet the safety requirements of modern ships. To address this challenge, in 2020, the Maritime Safety Committee of the International Maritime Organization (IMO) adopted the Explanatory Notes to the Interim Guidelines for the Second-Generation Intact Stability Criteria [1]. Within this framework, pure loss of stability has been identified as one of the five representative failure modes.
Pure loss of stability manifests as a significant reduction in the righting lever (GZ) when the ship’s midship section is on a wave crest; thus, evaluating GZ under this condition is essential for its prediction [2]. Early studies [3,4] primarily focused on modeling environmental loads, including regular and irregular wave conditions across different sea states. To extend this, mechanical models incorporating the ship’s six degrees of freedom (6-DOF: roll, pitch, yaw, sway, surge, and heave) and wave–position relationships were developed [5]. These enabled time-domain analysis of restoring force variations under wave excitation, thereby clarifying stability mechanisms in complex seas. With the advancement of nonlinear dynamics, stability models were refined for specific wave conditions. For example, by integrating maneuvering-induced centrifugal forces, a two-degree-of-freedom (2-DOF) surge–roll model was proposed for quartering seas [6], which improved prediction beyond traditional GZ-based methods but remained insufficient for fully revealing instability mechanisms [7]. Consequently, during the development of the IMO Second-Generation Intact Stability Criteria, a coupled four-degree-of-freedom (4-DOF: surge–sway–roll–yaw) model was introduced [8], specifically addressing ship responses in critical sea states such as beam [9], quartering [10], and following seas [11]. More recently, model testing [12] and computational fluid dynamics (CFD) simulations [13] have been employed, while experimental fluid dynamics (EFD) methods based on potential flow theory still rely on empirical data from towing tank experiments [14], limiting their applicability. Advances in computing now allow numerical reproduction of extreme wave-induced instabilities [15]. Nevertheless, despite these advances, most previous studies have primarily emphasized environmental loads and dynamic modeling, whereas the fundamental influence of hull form geometry on stability has received comparatively limited attention, even though it constitutes a critical bridge between ship geometry and stability assessment.
For hull forms that fail to satisfy vulnerability criteria, modifying geometry to meet stability requirements is a primary design strategy. To this end, semi-parametric approaches have been developed for efficient and precise hull form modeling. Current methods include the classical Lackenby transformation method [16], the Morphing method [17,18], the Bézier patch method [19], the Free-Form Deformation (FFD) method [20], and CAD-based techniques [21], each offering different levels of flexibility and computational efficiency. Applications of these methods have demonstrated their effectiveness. For instance, Petacco et al. [22] optimized geometric parameters (e.g., , ) of ballast-free containerships using the Lackenby method, achieving significant improvements in wave stability. Similarly, Ma et al. [23] systematically investigated the impact of hull parameters on pure loss of stability vulnerability. Beyond geometry modification, Nicola et al. [24] advanced Direct Stability Assessment (DSA), enabling probabilistic evaluation of stability failure through direct counting methods. In parallel, appendages designed with rational hydrodynamic considerations have proven effective in reducing heave and roll responses, thereby enhancing stability [25]. Despite these advances, critical gaps remain. While intact stability has been preliminarily addressed through parametric design and DSA, the establishment of optimal hull forms under dynamic motions is still unresolved. In particular, although hull parameters are known to influence pure loss of stability [26], systematic studies on the effects of hull shape variation are still lacking, hindering reliable prediction of this failure mode.
Small fishing vessels, particularly classified as small high-speed craft, contribute significantly to coastal stability accidents [27]. Focusing on such vessels (e.g., saury fishing boats), this study establishes the Figure 1 technical route to reveal the influence mechanism of hull lines on pure loss of stability vulnerability. First, hull lines are parametrically modified via the FFD method to systematically generate geometrically variant hull forms. Second, the in-house code for pure loss of stability calculation creates a framework for comparative stability analysis between original and new hulls. Model reliability is verified by benchmarking against ICS-HydroSTAB commercial software; comparison between numerical results and commercial software outputs confirms the algorithm’s computational accuracy and engineering applicability. Finally, parametric sensitivity analysis systematically explores the influence patterns of hull line geometric characteristics on pure loss of stability vulnerability in calm water and wave-disturbed environments.
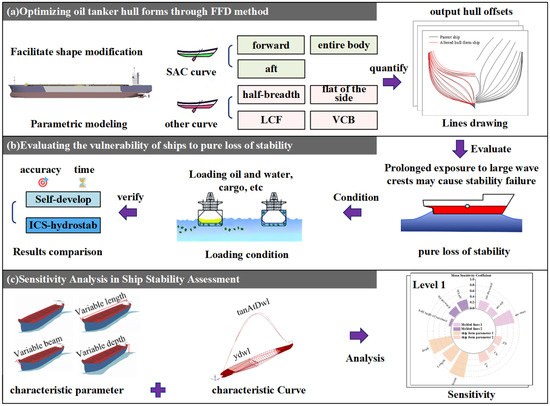
Figure 1.
Technical roadmap.
The remaining sections are structured as follows: Section 2 presents the FFD-based parametric hull modeling method and the numerical theoretical framework for pure loss of stability criteria. Section 3 investigates the influence mechanisms of hull line geometric features on pure loss of stability vulnerability through multi-scenario (calm water/wave) comparative analysis and parameter sensitivity quantification. Section 4 synthesizes key findings and proposes engineering recommendations.
2. Method
2.1. Free-Form Deformation
The FFD method is a classic geometric deformation technique initially proposed by Sederberg et al. in 1986 [28], which continues to receive widespread attention today. The method primarily consists of four steps:
Construct a local coordinate system () on the control lattice enclosing the object, as shown in Figure 2.
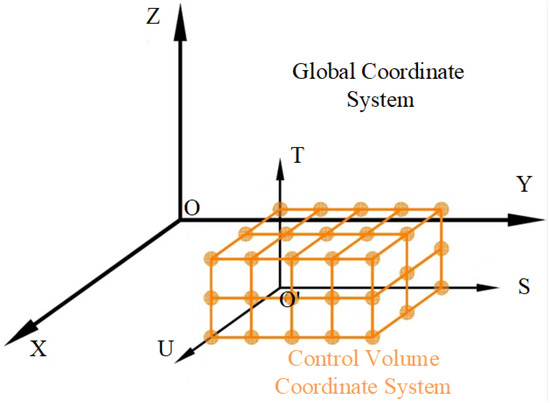
Figure 2.
Coordinate system .
As shown in Figure 2, the local coordinate system attached to the control volume is defined with origin and orthogonal basis vectors S, T, U. The global Cartesian coordinate system provides the reference frame. For any material point X on the body, its local coordinates relate to the global coordinates through the transformation:
where denotes the origin of the local coordinate system; s, t, and u represent, respectively, the following:
Based on the expressions for s, t, and u, . The control vertex set is defined by partitioning , , and into l, m, and n equal intervals along the S, T, and U-directions, respectively, via cross-sections parallel to the coordinate planes , , and . This is, mathematically, as follows:
where ; ; . Given the condition , the origin of the local coordinate system is located at .
Thus, the Cartesian coordinates of any point X within the control domain can be mapped to its local coordinates as follows:
where , , and are Bernstein basis functions of degrees l, m, and n, respectively, expressed as follows:
By moving the control points, the point is displaced to , and its displacement is denoted as . Since the positional relationship between the points on the deformable object within the control volume and the control vertices remains invariant, the displacement of the object’s points after moving the control vertices can be expressed as follows:
By superimposing the generated displacement onto the corresponding coordinates of the object, the deformed Cartesian coordinates can be derived as follows:
2.2. FFD-Based Hull Form Deformation
Using a 300-ton Dalian fishing vessel as parent ship, the control body coordinate system origin is at (−0.7 m, −0.7 m, −1 m), with R-axis (positive portward along width), S-axis (positive deckward along depth), and T-axis (positive bowward along length). The control body dimensions are as follows: R-axis 22 m with 6 control points, S-axis 31 m with 6 points, T-axis 150 m with 13 points. The selective adjustments to Sectional Area Curve (SAC), Design Water Line (DWL), Half-Breadth Curve, and Half-Angle of Entrance at control points employed variation ratios k = 0.90, 0.95, 1.00, 1.05, and 1.10. The deformation range of k = 0.90–1.10 was selected to explore a feasible design space around the optimized parent hull, a practice consistent with established ship design studies [6,23]. Figure 3 compares lines at 20 stations for selected deformation ratios: red solid lines (k = 1.05) and black solid lines (original parent hull, k = 1.00).
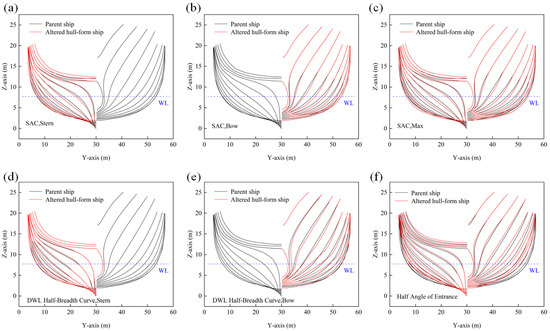
Figure 3.
Hull line comparison with FFD-driven shape modification. (a) SAC, Stern. (b) SAC, Bow. (c) SAC, Max. (d) DWL Half-Breadth Curve, Stern. (e) DWL Half-Breadth Curve, Bow. (f) Half Angle of Entrance.
Maintaining principal dimensions (length, breadth, draft), key points on the SAC are adjusted to reconstruct the SAC by altering sectional areas, redistributing transverse section areas for hull line optimization to meet design/performance targets. For the 300-ton Dalian fishery vessel at a ratio of 1.05: Figure 3a locally modifies the aft SAC (transom to maximum SAC section) to control stern fullness; Figure 3b adjusts the bow SAC (maximum SAC section to bulbous bow apex) for bow fullness; Figure 3c alters the entire SAC (transom to the after end of the designed waterline) for global fullness.
Design Water Line (DWL) Half-Breadth values—transverse width at specified drafts—directly impact stability. Precise DWL Half-Breadth control meets operational requirements: Figure 3d adjusts aft DWL Half-Breadth (transom to deck-side intersection) preventing convex bulging that adversely affects righting lever curves at large angles; Figure 3e modifies bow DWL Half-Breadth (deck-side/stem intersection to stem).
The Half-Angle of Entrance—the angle between DWL tangent at bow and centerplane—influences waterplane area distribution and stability curve form; Figure 3f demonstrates its alteration modifies DWL Half-Breadth and SAC, indirectly affecting stability.
2.3. Pure Loss of Stability Vulnerability Criteria
2.3.1. Level 1 Vulnerability Assessment
The non-vulnerable condition of the ship in the first level of the pure loss of stability is as follows:
where is 0.05 m. D is the molded depth (m), d is the draught (m), is the volume of displacement at waterline equal to D (m3), V is the volume of displacement corresponding to the loading condition under consideration (m3).
2.3.2. Level 2 Vulnerability Assessment
According to the IMO proposal [1], a ship is considered to be less vulnerable to pure loss of stability if Equation (10) is satisfied.
where the coefficients and are the weighted averages of certain stability parameters under certain wave conditions, calculated according to Equations (11) and (12), and is 0.06 m.
where is the weighting coefficient, which is determined according to the wave conditions; the coefficients and are the coefficients corresponding to the different waves and are determined by Equations (13) and (14).
where is the free surface corrected vanishing stability angle, is the free surface corrected stable heel angle, is the second layer of the scale values for the vanishing stability angle, and is the second layer of the scale values for the stable heel angle (15 degrees for passenger ships; 25 degrees for other ship types).
This study employs in-house software to calculate pure loss of stability vulnerability, with the computational workflow shown in Figure 4. Zhang [29] further conducted validation experiments for four loading conditions using this program; analysis demonstrated high consistency when compared with results from CSSRC’s ICS-HydroSTAB 1.0 software, demonstrating its high accuracy in pure loss vulnerability assessment. ICS-HydroSTAB is a well-established tool in the field, and its predictive accuracy has been widely corroborated through experimental validations reported across numerous studies [30].
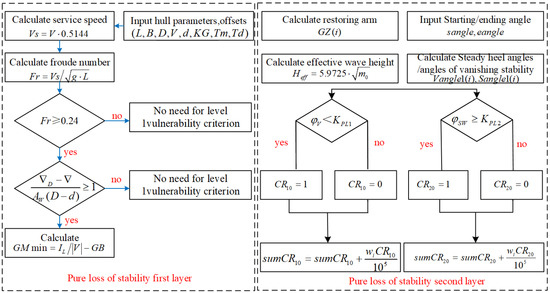
Figure 4.
The calculation of pure loss of stability vulnerability across different software.
In Figure 5, for the first level of pure loss of stability, the error rates for Conditions 1 to 4 are 0.96%, 2.65%, 2.76%, and 1.17%, all of which are below 3%; for the second level of pure loss of stability, the error rates for Conditions 1 to 4 are 2.48%, 5.44%, 4.13%, and 6.27%, the average error rate across all conditions is 4.58%, indicating that the average error rate for the second-layer vulnerability is higher compared to the first layer, likely due to its higher complexity in vulnerability calculation. Overall, the error rates for both the first and second levels of pure loss of stability vulnerability are relatively low, demonstrating the high precision of in-house programs in the assessment of pure loss of stability vulnerability.
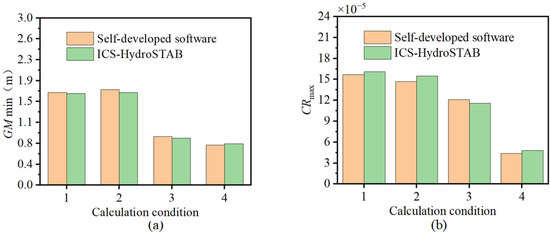
Figure 5.
Procedure for calculating the pure loss of stability. (a) Level 1; (b) Level 2.
3. Results and Discussion
3.1. Computational Vessel Models
In maritime accidents occurring in coastal waters [27], small fishing vessels account for a significant proportion of incidents. Given this context and the fact that, according to fleet composition data from the China Fishery Statistical Yearbook 2024 [31], fishing vessels of 250–400 tons represent a substantial and operationally vital segment, this paper focuses on the Dalian 300-ton, 250-ton, and 400-ton fishing vessels. Parametric modeling was first conducted using the CAESES commercial software (version 1.0), with the main dimensions as shown in Table 1.

Table 1.
Main parameters of ships.
Provided that the duration of contact with the large wave’s crest is sufficiently extended and the wave’s length matches that of the ship, stability failure may occur [6]. Therefore, for numerical calculations in this paper, the relative wavelength () condition of 1 is chosen as the worst-case scenario. We note, however, that real seas consist of broad spectra of waves, and this assumption may introduce limitations; future work will consider spectral conditions for more comprehensive assessments. Moreover, = 0° is considered for following waves, and the wave phase speed (c) is taken equal to the ship speed.
3.2. Effect of Sectional Areas Curve on Pure Loss of Stability Vulnerability
3.2.1. Level 1 Vulnerability
As shown in Figure 6, the influence of key SAC deformation coefficients (bow section , stern section , and maximum section ) at different tonnages on the minimum metacentric height () was calculated. It can be observed that for vessels of any tonnage, increasing the SAC at any position results in a corresponding decrease in the vessel’s ; furthermore, the larger the vessel tonnage, the lower its sensitivity to SAC variations. In Figure 6a, for 250–400 tons fishing vessels decreased by 11.6%, 10.6%, and 5.4% respectively, as SAC increased. In Figure 6b, the reductions for fishing vessels of different tonnages were 10.3%, 9.6%, and 4.3%, respectively; In Figure 6c, the reductions for fishing vessels of different tonnages were 12.5%, 11.6%, and 8.5%, respectively. Across the three sections, altering SAC-Max had the greatest impact on vessel stability, while SAC-Stern had the least impact.

Figure 6.
for different sectional areas curve. (a) Bow section of SAC. (b) Stern section of SAC. (c) Location of maximum SAC.
Figure 7 calculates the variation of righting lever () with respect to SAC. Specifically, Figure 7a–c display the statical stability curve for fishing vessels of different tonnages (250 tons, 300 tons, and 400 tons) under varying ; Figure 7d–f represent the statical stability curve under different ; Figure 7g–i display statical stability curve for different . In Figure 7a–c, the peak righting lever () of 250–400 tons fishing vessels decreased by 16.3%, 13.3%, and 6.8%, respectively, as the static acceleration coefficient SAC increased. Figure 7d–i further validate this pattern by demonstrating that a decrease in the local fullness coefficient k from 1.10 to 0.90 leads to a reduction in for vessels of all tonnages. Moreover, fishing vessels of the same tonnage exhibit clear similarity in response to changes in heel angle, with their occurring at relatively close angles. This aligns with the conclusion in Figure 6, which shows that ship stability is most sensitive to changes in SAC-Max and least sensitive to SAC-Stern. Variations in the SAC modify the lateral distribution of the underwater volume, thereby altering the transverse displacement of the center of buoyancy and the corresponding righting lever. A slimmer midship section enhances outward migration of the buoyancy center, delaying deck immersion and broadening the stability range, whereas the bow and stern sections exert only a minor influence due to their narrowness and distance from midship.
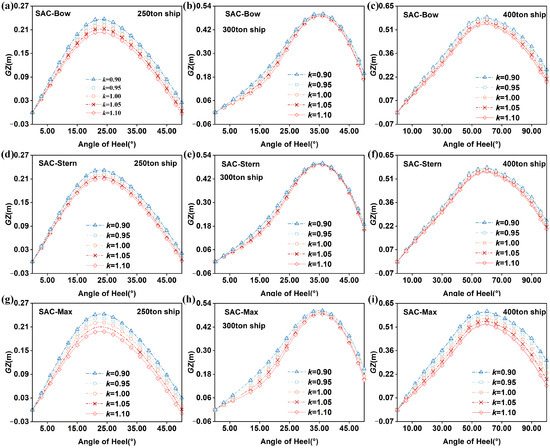
Figure 7.
for different sectional areas curve. (a–c) Bow section of SAC for 250–400 tons Ships. (d–f) Stern section of SAC for 250–400 tons Ships. (g–i) Location of maximum SAC for 250–400 tons Ships.
3.2.2. Level 2 Vulnerability
Figure 8 illustrates the influence of the SAC on the second layer of vulnerability in pure loss of stability. Specifically, Figure 8a–c depict the variation patterns of the maximum failure probability () when altering the SAC’s bow, stern, and maximum values, respectively, and reveal a positive correlation between the key deformation coefficients of SAC and . This indicates that the probability of pure loss of stability failure in waves increases accordingly, consistent with findings from calm water studies. Specifically, the 250-ton vessel exhibits the highest risk of pure loss of stability in waves. When the SAC deformation coefficient is 1.10, varies with the deformation location. In Figure 8a under bow deformation, , whereas in Figure 8b under stern deformation, it is . Figure 8c for the maximum sectional deformation shows values of , , and for the 250-, 300-, and 400-ton vessels, respectively. All maximum failure probabilities remain below the 0.06 threshold for the second-order vulnerability criterion of pure loss of stability, confirming compliance across all vessel types. The standard thus ensures an adequate safety margin, most evident in the 400-ton class. Smaller vessels, however, are more susceptible due to scale effects, with maximum sectional deformation as the primary risk factor affecting the righting lever.

Figure 8.
for different sectional areas curve. (a) Bow section of SAC. (b) Stern section of SAC. (c) Location of maximum SAC.
To investigate the underlying causes of this trend, a 300-ton fishing vessel is selected as the reference case. Figure 9 illustrates the variation of the righting lever () with changes in the transverse sectional area curve under wave conditions. Comparative pairs Figure 9a–d, Figure 9b–e, and Figure 9c–f present the influence of bow, stern, and maximum sectional deformation when the SAC coefficients (, , and ) are set to 0.9 and 1.1. Here, corresponds to the midship at the wave crest, while denotes the wave trough. Results show that when the local fullness coefficient k increases from 0.95 to 1.10, of the 300-ton vessel decreases to varying degrees, consistent with calm-water findings. The bow coefficient causes a 10.1% reduction in as shown in Figure 9a,d, the stern coefficient reduces by 11.0% as shown in Figure 9b,e, while the maximum section produces the most significant effect, with Figure 9c,f indicating a 17.0% decrease. Wave phase also modulates stability: when the midship lies at the trough, increases by up to 13.6% in Figure 9c, whereas at the crest it decreases by 11.2% in Figure 9b. This occurs because at the trough the enlarged waterline area moment of inertia enhances , while at the crest the reduced waterline area and wave dynamic pressure weaken it [32]. When the midship is inclined relative to the wave surface, changes in the fore and aft waterline surfaces offset each other, rendering stability variations negligible. Furthermore, local increases in SAC fullness enlarge the underwater volume and shift the buoyancy center (), thereby modifying in this phase.
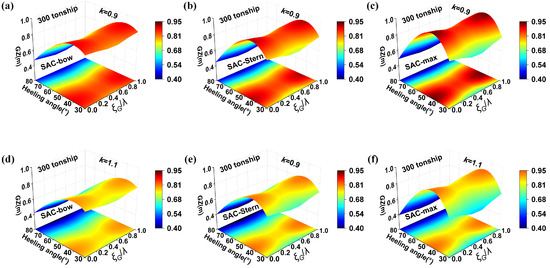
Figure 9.
in waves with different sectional areas curve. (a) = 0.9. (b) = 0.9. (c) = 0.9. (d) = 1.1. (e) = 1.1. (f) = 1.1.
3.3. Effect of DWL Half-Breadth Curve on Pure Loss of Stability Vulnerability
3.3.1. Level 1 Vulnerability
As shown in Figure 10, the influence of key deformation coefficients (, , and ) of the DWL half-breadth curve on was calculated for vessels of different tonnages. It can be observed that for ships of any tonnage, increasing the DWL half-breadth curve at any position results in an increase in the vessel’s . Moreover, the larger the vessel tonnage, the lower its sensitivity to changes in the DWL half-breadth curve. In Figure 10a, the 250–400 tons fishing vessels showed increases of 12.4%, 10.1%, and 3.8% respectively, as the DWL half-breadth curve increased; Figure 10b shows increases of 13.5%, 10.5%, and 8.3% for fishing vessels of different tonnages; Figure 10c indicates increases of 14.2%, 12.6%, and 9.2%. Across all three sections, modifying the overall DWL half-breadth curve had the most significant impact on ship stability, while the bow section of the curve had the least effect. Furthermore, all calculated fell below the critical value of 0.05 for the first layer of vulnerability in pure loss of stability criteria, indicating that all experimental hull types met the criteria requirements.

Figure 10.
for different DWL Half-Breadth Curves. (a) Bow section of DWL Half-Breadth Curve. (b) Stern section of DWL Half-Breadth Curve. (c) Location of maximum DWL Half-Breadth Curve.
Figure 11 presents the variation of with respect to the DWL half-breadth curve. Specifically, Figure 11a–c show the static stability curves of fishing vessels with different tonnages under varying , Figure 11d–f illustrate the corresponding results for , and Figure 11g–i for . Overall, when the coefficient k increases from 0.90 to 1.10, exhibits an enhancement across all vessel sizes, with the bow section inducing comparatively moderate changes. For 250–400 tons fishing vessels, Figure 11a–c indicate increases in of 8.3%, 6.9%, and 3.6% as the DWL half-breadth curve enlarges. A stronger effect is observed in the stern, where Figure 11d–f show increases of 8.6%, 6.9%, and 3.9%. The maximum cross-section exerts the greatest influence, as evidenced in Figure 11g–i, with corresponding increases of 16.1%, 10.5%, and 6.2%. The essence of modifying the DWL half-breadth curve is altering the ratio between the ship’s transverse waterline surface moment of inertia () and displacement volume (). For stability at large angles of heel, a more slender midship section facilitates the formation of a larger waterline moment of inertia during initial heel, thereby providing adequate initial stability. In contrast, the bow and stern sections, being farther from midship and typically narrower, contribute relatively less to the overall waterline moment of inertia due to changes in their waterline shape.
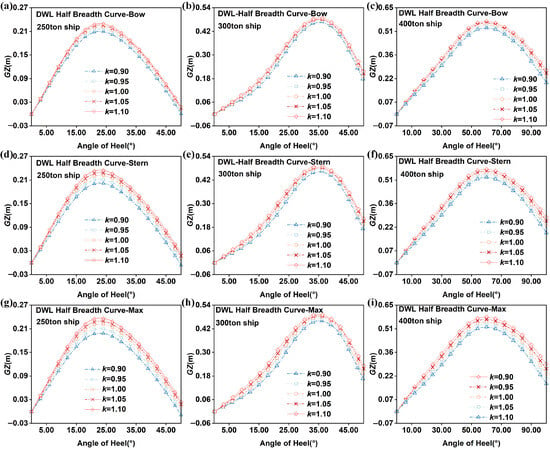
Figure 11.
in waves with different sectional area curves. (a–c) Bow section of DWL Half-Breadth Curves for 250–400 tons Ships. (d–f) Stern section of DWL Half-Breadth Curves for 250–400 tons Ships. (g–i) Location of maximum DWL Half-Breadth Curves for 250–400 tons Ships.
3.3.2. Level 2 Vulnerability
Figure 12 shows the effect of the DWL half-breadth curve on the second-level vulnerability of pure loss of stability. Alterations in the SAC’s bow, stern, and maximum values confirm that increases in , , and are negatively correlated with . This indicates that fuller sections reduce the probability of stability failure in waves, consistent with calm-water predictions. Among all vessel sizes, the 250-ton case exhibits the highest vulnerability. Figure 12a shows that under bow deformation with a coefficient of 0.90, the maximum failure probability is , reflecting only a minor effect. A comparable result of is obtained for stern deformation in Figure 12b, suggesting similarly limited influence. By contrast, Figure 12c demonstrates that maximum sectional deformation has a more significant impact, yielding values of , , and for the 250-, 300-, and 400-ton vessels, respectively. Despite these differences, all values remain well below the 0.06 threshold of the second-order fragility criterion, confirming that each vessel type meets the stability requirement.

Figure 12.
probability for different DWL Half-Breadth Curves. (a) Bow section of DWL Half-Breadth Curve. (b) Stern section of DWL Half-Breadth Curve. (c) Location of Maximum DWL Half-Breadth Curve.
To investigate the causes of this trend, this study analyzed the influence of the waterline half-breadth curve on the under wave action, using a 300-ton fishing vessel as the subject. Figure 13 presents three sets of sub-figures comparing the variation patterns of the with respect to when the , , and are set to 0.9 and 1.1, respectively. The changes in the bow section correspond to Figure 13a,d, those in the stern section to Figure 13b,e, and the variations in the maximum deformation coefficient to Figure 13c,f. Results indicate that when the local fullness coefficient k of the waterline half-breadth curve increases from 0.95 to 1.10, the of the 300-ton fishing vessel exhibits varying degrees of elevation. This aligns with findings from calm water studies, but wave action significantly alters the magnitude and distribution characteristics of these changes. Specifically, the bow coefficient exhibits a relatively gradual influence on the in waves, as shown in Figure 13a–d, where the peak increase in the 300-ton vessel reaches 6.1%. The stern coefficient had a moderate effect, with the increasing by 8.6% in Figure 13b–e. The midship section coefficient had a relatively significant impact, with the decreasing by 18.3% in Figure 13c–f. In waves, the effectiveness of transverse waterplane inertia () is governed mainly by the midship region, which remains continuously submerged and provides a stable restoring contribution. In contrast, the fore and aft sections, due to their limited breadth and intermittent immersion, contribute only marginal and fluctuating effects. Hence, variations in bow and stern coefficients exert relatively little influence on the righting lever compared with the dominant role of the midship section.
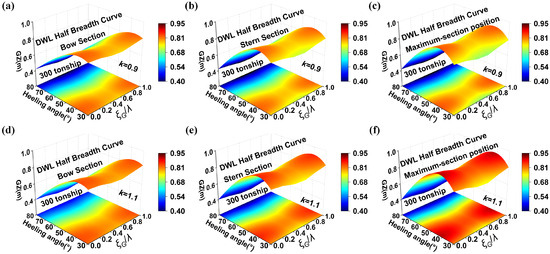
Figure 13.
Righting level in waves with different DWL Half-Breadth Curves. (a) = 0.9. (b) = 0.9. (c) = 0.9. (d) = 1.1. (e) = 1.1. (f) = 1.1.
3.4. Effect of Half Angle of Entrance on Pure Loss of Stability Vulnerability
As shown in Figure 14, this study examines the influence of the half angle of the entrance on the first-layer criterion for pure loss of stability in vessels of different tonnages. Figure 14a illustrates the effect of varying the half angle of entrance on , while Figure 14b–d present its influence on the righting lever . Results indicate that increasing the half angle of entrance consistently reduces both and across all vessel sizes. In Figure 14a, the of 250 tons, 300 tons, and 400 tons fishing vessels decreases by 8.0%, 6.8%, and 3.0%, respectively. In Figure 14b–d, the of the same vessels decreases by 8.3%, 4.8%, and 4.6%, respectively.This phenomenon can be attributed to changes in waterline geometry. Increasing the half angle of entrance reduces the forward breadth of the design waterline, thereby lowering the waterplane area moment of inertia. As shown in Figure 14a–d, the sensitivity of the first-layer criterion to this parameter decreases with vessel tonnage, due to the fairer and fuller hull forms of larger ships. Consequently, careful adjustment of the half angle of entrance offers a practical means of balancing speed and stability. This effect is particularly pronounced in small and medium-sized vessels, where higher sensitivity allows significant performance gains to be achieved through relatively minor hull form refinements.
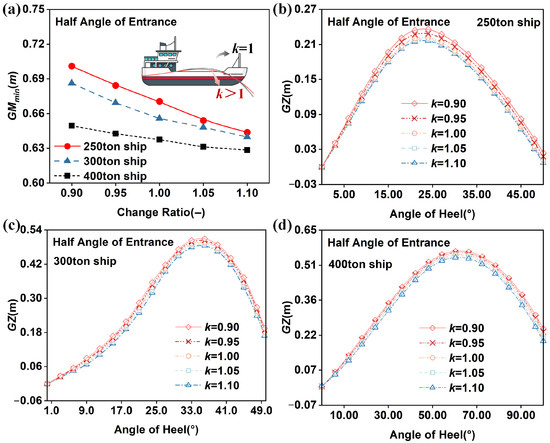
Figure 14.
The influence of the half-angle of entrance on the first level of pure loss of stability. (a) for different DWL Half-Breadth Curves. (b) Different DWL Half-Breadth Curves for 250-ton ship. (c) Different DWL Half-Breadth Curves for 300-ton ship. (d) Different DWL Half-Breadth Curves for 400-ton ship.
As shown in Figure 15, the influence of different half angles of entrance on the second-layer criterion for pure loss of stability was examined across vessels of varying tonnages. Figure 15a presents the effect of this parameter on the maximum failure probability, while Figure 15b,c compare its influence on the restoring lever arm in waves. The results indicate that increasing the half angle of entrance leads to a higher maximum failure probability, implying that the likelihood of pure loss of stability in waves increases accordingly. This trend is consistent with observations obtained under static water conditions. Specifically, the peak increase in the restoring lever arm in waves, as shown in Figure 15b,c, is 6.3%. The 250-ton vessel exhibits the highest risk of pure loss of stability in waves. In Figure 15a, at a deformation coefficient of 1.10 under the maximum sectional deformation condition, the maximum failure probabilities for the 250-ton, 300-ton, and 400-ton ship models are , , and , respectively. Increasing the half angle of entrance reduces both the metacentric height and the restoring lever in calm water by narrowing the forward waterline, decreasing the waterplane area moment of inertia, and altering the displacement volume distribution. At the same time, this geometric deformation modifies the interaction between the hull and incident waves, thereby increasing susceptibility to pronounced pitch and roll motions. Consequently, during the design and evaluation phases—particularly for small and medium-tonnage vessels—the half angle of entrance should be regarded as a critical sensitivity parameter for stability in waves, requiring careful trade-offs between hydrodynamic performance and stability margins.

Figure 15.
The influence of the half-angle of entrance on the second level of pure loss of stability. (a) for different DWL Half-Breadth Curves. (b) k = 0.9. (c) k = 1.1.
4. Sensitivity Analysis
To assess the sensitivity of hull form parameters to curve deformations under pure loss of stability, an economic-style sensitivity analysis was applied. The uncertain factors are the parameter curves and their deformation modes, with the variation factor denoted as F. Two sensitivity coefficients, and , are defined to represent the ratios of and maximum failure probability to the deformation ratio difference, respectively. They are calculated as follows:
The sensitivity of parameter curves was found to differ among ship types. To derive a comprehensive sensitivity ranking, the coefficients obtained for each ship type were averaged, yielding the mean sensitivity coefficients of pure loss of stability with respect to the characteristic parameter curves and their associated deformation modes.
where N denotes the number of parent ships. Except for the sensitivity coefficient mean calculated for the distribution of parallel midships along the ship’s length, which is taken as 2, all others are taken as 5; represents the maximum sensitivity coefficient among all deformation modes for the i-th ship type.
As illustrated in Figure 16, the sensitivity of pure loss of stability to hull form variations is examined. Figure 16a shows the influence on the first- and second-layer criteria, while Figure 16b compares vessels of different tonnages. The sensitivity ranking of parameter curves and their deformation patterns is as follows: location of the maximum sectional area curve > bow section of the sectional area curve > stern section of the DWL half-breadth curve > stern section of the sectional area curve > bow section of the DWL half-breadth curve > half angle of entrance. Furthermore, sensitivity to hull form variations decreases with increasing vessel tonnage. Specifically, as illustrated in Figure 16a, the sectional area curve plays a dominant role in sensitivity analysis, showing the highest sensitivity to both vulnerability layers at its maximum value. In the first layer, its sensitivity coefficient reaches 0.61, which is significantly higher than the values of 0.26 for the bow section and 0.25 for the stern section. In the second layer, this parameter’s sensitivity further increases to 0.75, while the bow section rises to 0.35 and the stern section decreases to 0.22. The waterline half-breadth curve also exerts a notable influence: in the stern section the sensitivity remains high, with values of 0.33 in the first layer and 0.34 in the second layer, whereas in the fore section it declines from 0.32 in the first layer to 0.21 in the second. By contrast, the half angle of entrance shows relatively low sensitivity, decreasing from 0.13 in the first layer to an even lower level in the second. These results are consistent with previous findings, confirming that the influence of different hull parameters varies substantially between vulnerability layers [32]. Furthermore, as shown in Figure 16b, sensitivity to hull form variations decreases significantly with increasing vessel tonnage. This trend reflects scale effects: as vessel size increases, the growth of principal dimensions such as beam and molded depth, together with the waterplane moment of inertia, far exceeds that of other parameters, making these factors dominant in stability and thereby reducing the relative impact of finer hull form variations. In addition, this difference in sensitivity between bow and stern across tonnages is primarily attributed to the hull’s overall geometric architecture, which fundamentally alters its response to localized modifications [33].
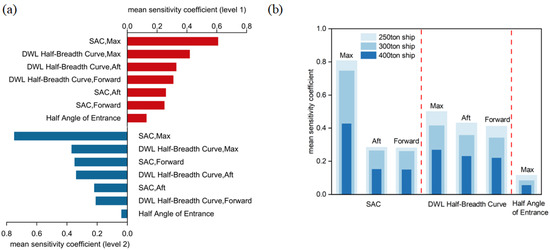
Figure 16.
Sensitivity analysis of pure loss of stability Vulnerability to hull form variations. (a) Sensitivity of the first- and second-layer criteria of pure loss of stability under different hull form lines. (b) Sensitivity analysis of pure loss of stability for vessels of different tonnages.
Despite the insights gained from the sensitivity analysis, several limitations should be noted. First, the present study considered only the individual influence of hull line parameters, without addressing potential interactions (e.g., between the sectional area curve and the DWL half-breadth curve). Second, the analysis was restricted to a single failure mode (pure loss of stability), whereas practical ship design requires multi-objective optimization that also accounts for seakeeping, resistance, and other criteria. Finally, while the Free-Form Deformation method offers flexibility in hull form modification, its performance depends on the initial control lattice configuration and may be less effective in generating extreme local variations.
5. Conclusions
This study systematically analyzed the influence of hull form lines on the pure loss of stability of fishing vessels through parametric modeling and vulnerability calculations. By introducing the Free Form Design (FFD) method, it established a novel correlation analysis between local hull form characteristics—such as sectional area curves, waterline half-breadth curves, and the half angle of entrance—and stability vulnerability. These findings provide theoretical support for accurately identifying regions most susceptible to stability loss and for guiding targeted hull form optimization, thereby clarifying the variation patterns of key hull form parameters and the mechanisms underlying stability failure. The specific conclusions are as follows:
- An increase in the sectional area curve is generally detrimental to the pure loss of stability of fishing vessels, as it reduces the minimum metacentric height and righting lever, thereby increasing the probability of failure under wave conditions. The most significant influence arises at the maximum section, with the bow and stern sections exerting relatively weaker effects. This pattern originates from the fundamental alteration of the transverse distribution of underwater volume, which modifies the lateral displacement of the centre of buoyancy during heeling. Owing to their narrowness and distance from midship, the bow and stern sections have only a limited impact on the trajectory of the centre of buoyancy.
- Increasing the waterline half-breadth curve mitigates the vulnerability of fishing vessels to pure loss of stability. The maximum section has the greatest influence, while the bow and stern sections contribute less due to their smaller widths and greater distance from midship. This effect arises from changes in the ratio between the transverse waterplane moment of inertia and the displacement volume, which directly governs initial stability.
- A larger half angle of entrance slightly reduces initial stability by lowering the trans- verse waterplane moment of inertia. Consequently, the half angle of entrance should be carefully balanced: while hydrodynamically favourable for resistance, excessive values may compromise stability safety in waves.
- As vessel tonnage increases, the vulnerability of pure loss of stability becomes less sensitive to hull form variations. This trend arises from scale effects: with larger dimensions, parameters such as breadth, moulded depth, and the transverse moment of inertia of the waterplane exert an increasingly dominant influence on stability. As a result, the relative impact of minor modifications to local hull geometry is substantially reduced.
- In the early stages of the design process, the above findings provide some beneficial introductions for engineers. (a). The maximum-section neighborhood is fixed as displacement constraint. The SACmax should avoid being thickened. if it is necessary, small amounts can be shifted toward the bow and stern instead. (b). The half-width of the waterline at the middle of the ship should be the same as SACmax and should be subject to certain restrictions. Within a certain number of stations, the adjustment of the midship waterline width should not significantly affect the area moment. (c). In design and evaluation, the half angle of entrance should therefore be treated as a sensitive parameter for stability safety under wave conditions, requiring careful balance between hydrodynamic optimization and stability margins. (d). Before conducting detailed calculations, the designer should take into account the linear results caused by the changes in the ship’s profile under different tonnage conditions as calculated in this article. Based on this, more efficient detailed calculations are carried out to describe the target design.
Future research may explore the combined effects of multiple hull line parameters and extend the analysis to multi-objective optimization frameworks that consider seakeeping and resistance. Further refinement of the Free-Form Deformation method also represents a promising direction.
Author Contributions
Conceptualization, H.Z., K.L. and G.M.; methodology, H.Z. and K.L.; software, H.Z.; validation, K.L., G.M., J.D. and Q.W.; formal analysis, H.Z. and K.L.; investigation, H.Z., J.D. and Q.W.; resources, K.L. and G.M.; data curation, H.Z., J.D. and Q.W.; writing—original draft preparation, H.Z.; writing—review and editing, K.L., G.M., J.D. and Q.W.; visualization, H.Z.; supervision, K.L. and G.M.; project administration, K.L. and G.M.; funding acquisition, K.L. and G.M. All authors have read and agreed to the published version of the manuscript.
Funding
The development and application project of ship CAE software.
Data Availability Statement
Data are contained within the article.
Conflicts of Interest
The authors declare that the research was conducted in the absence of any commercial or financial relationships that could be construed as potential conflicts of interest.
References
- IMO. Interim Guidelines on the Second Generation Intact Stability Criteria; International Maritime Organization: London, UK, 2020. [Google Scholar][Green Version]
- Hamamoto, M. Transverse Stability of Ship in a Following Sea. In Proceedings of the 2nd International Conference on Stability of Ships and Ocean Vehicles, Tokyo, Japan, 24–29 October 1982; pp. 215–224. [Google Scholar][Green Version]
- Spyrou, K. Dynamic instability in quartering seas—Part III: Nonlinear effects on periodic motions. J. Ship Res. 1997, 41, 210–223. [Google Scholar] [CrossRef]
- Neves, M.A. Dynamic stability of ships in regular and irregular seas-an overview. Ocean Eng. 2016, 120, 362–370. [Google Scholar] [CrossRef]
- Hashimoto, H. Pure loss of stability of a tumblehome hull in following seas. In Proceedings of the ISOPE International Ocean and Polar Engineering Conference, Osaka, Japan, 21–26 June 2009; ISOPE: Mountain View, CA, USA, 2009; p. ISOPE–I. [Google Scholar]
- Lu, J.; Gu, M.; Shi, C.; Wang, T.; Chu, J.; Lan, B. Study on Direct Assessment Method for Pure Loss of Stability in Following Seas. J. Ship Mech. 2018, 22, 1198–1204. [Google Scholar]
- Kubo, H. Pure loss of stability in astern seas-is it really pure. In Proceedings of the 6tfi Asia-Pacific Workshop on Marine Hydrodynamics, Johor, Malaysia, 3–5 September 2012; pp. 329–334. [Google Scholar]
- International Maritime Organization. Report of the Maritime Safety Committee on Its Fifty-Fifth Session. In Proceedings of the Session Report SLF 55/18, Sub-Committee on Stability, Load Lines and Fishing Vessels (SLF), London, UK, 18–22 February 2013. [Google Scholar]
- Mantari, J.; e Silva, S.R.; Soares, C.G. Intact stability of fishing vessels under combined action of fishing gear, beam waves and wind. Ocean Eng. 2011, 38, 1989–1999. [Google Scholar] [CrossRef]
- Umeda, N.; Yamakoshi, Y. Probability of Ship Capsizing due to Pure Loss of Stability in Quartering Seas. Nav. Archit. Ocean Eng. 1993, 30, 73–85. [Google Scholar] [CrossRef]
- Lu, J.; Gu, M.; Boulougouris, E. Model experiments and direct stability assessments on pure loss of stability of the ONR tumblehome in following seas. Ocean Eng. 2019, 194, 106640. [Google Scholar] [CrossRef]
- Lu, J.; Gu, M.; Boulougouris, E. Model experiments and direct stability assessments on pure loss of stability in stern quartering waves. Ocean Eng. 2020, 216, 108035. [Google Scholar] [CrossRef]
- Carrica, P.M.; Paik, K.J.; Hosseini, H.S.; Stern, F. URANS analysis of a broaching event in irregular quartering seas. J. Mar. Sci. Technol. 2008, 13, 395–407. [Google Scholar] [CrossRef]
- Sadat-Hosseini, H.; Carrica, P.; Stern, F.; Umeda, N.; Hashimoto, H.; Yamamura, S.; Mastuda, A. CFD, system-based and EFD study of ship dynamic instability events: Surf-riding, periodic motion, and broaching. Ocean Eng. 2011, 38, 88–110. [Google Scholar] [CrossRef]
- Carrica, P.M.; Sadat-Hosseini, H.; Stern, F. CFD analysis of broaching for a model surface combatant with explicit simulation of moving rudders and rotating propellers. Comput. Fluids 2012, 53, 117–132. [Google Scholar] [CrossRef]
- Lackenby, H. On the systematic variation of ship forms. Trans. Rin A 1950, 92, 289–316. [Google Scholar]
- Kang, J.Y.; Lee, B. Mesh-based morphing method for rapid hull form generation. Comput.-Aided Des. 2010, 42, 970–976. [Google Scholar] [CrossRef]
- Peri, D.; Rossetti, M.; Campana, E.F. Design optimization of ship hulls via CFD techniques. J. Ship Res. 2001, 45, 140–149. [Google Scholar] [CrossRef]
- Peri, D.; Campana, E.F. Multidisciplinary design optimization of a naval surface combatant. J. Ship Res. 2003, 47, 1–12. [Google Scholar] [CrossRef]
- Sederberg, T. Free-form deformation of solid geometric models. Comput. Graph. 1992, 26, 151. [Google Scholar]
- Farin, G.E. Curves and Surfaces for CAGD: A Practical Guide; Morgan Kaufmann: Burlington, MA, USA, 2002. [Google Scholar]
- Petacco, N.; Pitardi, D.; Podenzana Bonvino, C.; Gualeni, P. Application of the IMO second generation intact stability criteria to a ballast-free containership. J. Mar. Sci. Eng. 2021, 9, 1416. [Google Scholar] [CrossRef]
- Shuxia, B.; Min, G.; Zhailiu, H.; Jiang, L. Sensitivity Analysis of Ship Parameters on Parametric Roll Vulnerability Criteria. In Proceedings of the 29th National Conference on Hydrodynamics, Zhenjiang, China, 24–26 August 2018; Volume 2. [Google Scholar]
- Petacco, N.; Petkovic, G.; Gualeni, P. An insight on the post-processing procedure of the Direct Stability Assessment within SGISC. Ocean Eng. 2024, 305, 117982. [Google Scholar] [CrossRef]
- Pawling, R.; Percival, V.; Andrews, D. A study into the validity of the ship design spiral in early stage ship design. J. Ship Prod. Des. 2017, 33, 81–100. [Google Scholar] [CrossRef]
- Kun, M.; Bo, Y.; Gaoyuan, H. Influence of Ship Parameters on Pure Loss of Stability Vulnerability. Shipbuild. China 2018, 59, 81–88. [Google Scholar]
- Kim, D.J.; Yeo, D.J. Estimation of drafts and metacentric heights of small fishing vessels according to loading conditions. Int. J. Nav. Archit. Ocean Eng. 2020, 12, 199–212. [Google Scholar] [CrossRef]
- Sederberg, T.W.; Parry, S.R. Free-form deformation of solid geometric models. In Proceedings of the 13th Annual Conference on Computer Graphics and Interactive Techniques, Dallas, TX, USA, 18–22 August 1986; pp. 151–160. [Google Scholar]
- Zhang, H.; Li, K. Assessment of Fishing Vessel Vulnerability to Pure Loss of Stability Using a Self-Developed Program. J. Mar. Sci. Eng. 2024, 12, 527. [Google Scholar] [CrossRef]
- Qi, J.; Lu, J. On Direct Assessment of Pure Loss of Stability for Ships in Quartering Seas. Ship Boat 2022, 33, 63. [Google Scholar]
- Ministry of Agriculture and Rural Affairs, People’s Republic of China. China Fishery Statistical Yearbook; Statistical Yearbook; China Statistic Press: Beijing, China, 2024. (In Chinese) [Google Scholar]
- Huang, W.; Ma, K.; Lu, J. Theoretical study on variation of ship roll stability in regular waves. Ship Eng. 2011, 33, 21–25. [Google Scholar]
- Belenky, V.L.; Sevastianov, N.B. Stability and Safety of Ships: Risk of Capsizing; SNAME: Alexandria VA, USA, 2007. [Google Scholar]
Disclaimer/Publisher’s Note: The statements, opinions and data contained in all publications are solely those of the individual author(s) and contributor(s) and not of MDPI and/or the editor(s). MDPI and/or the editor(s) disclaim responsibility for any injury to people or property resulting from any ideas, methods, instructions or products referred to in the content. |
© 2025 by the authors. Licensee MDPI, Basel, Switzerland. This article is an open access article distributed under the terms and conditions of the Creative Commons Attribution (CC BY) license (https://creativecommons.org/licenses/by/4.0/).