Article

Experimental Study on Creep Characteristics and Mechanisms of Wenzhou Soft Soil

1
Wenzhou Electrical Power Design Co., Ltd., Wenzhou 325000, China
2
College of Civil Engineering and Architecture, Wenzhou University, Wenzhou 325035, China
3
Key Laboratory of Engineering and Technology for Tideland Reclamation and Life-Cycle Intelligent Monitoring of Zhejiang Province, Wenzhou 325035, China
*
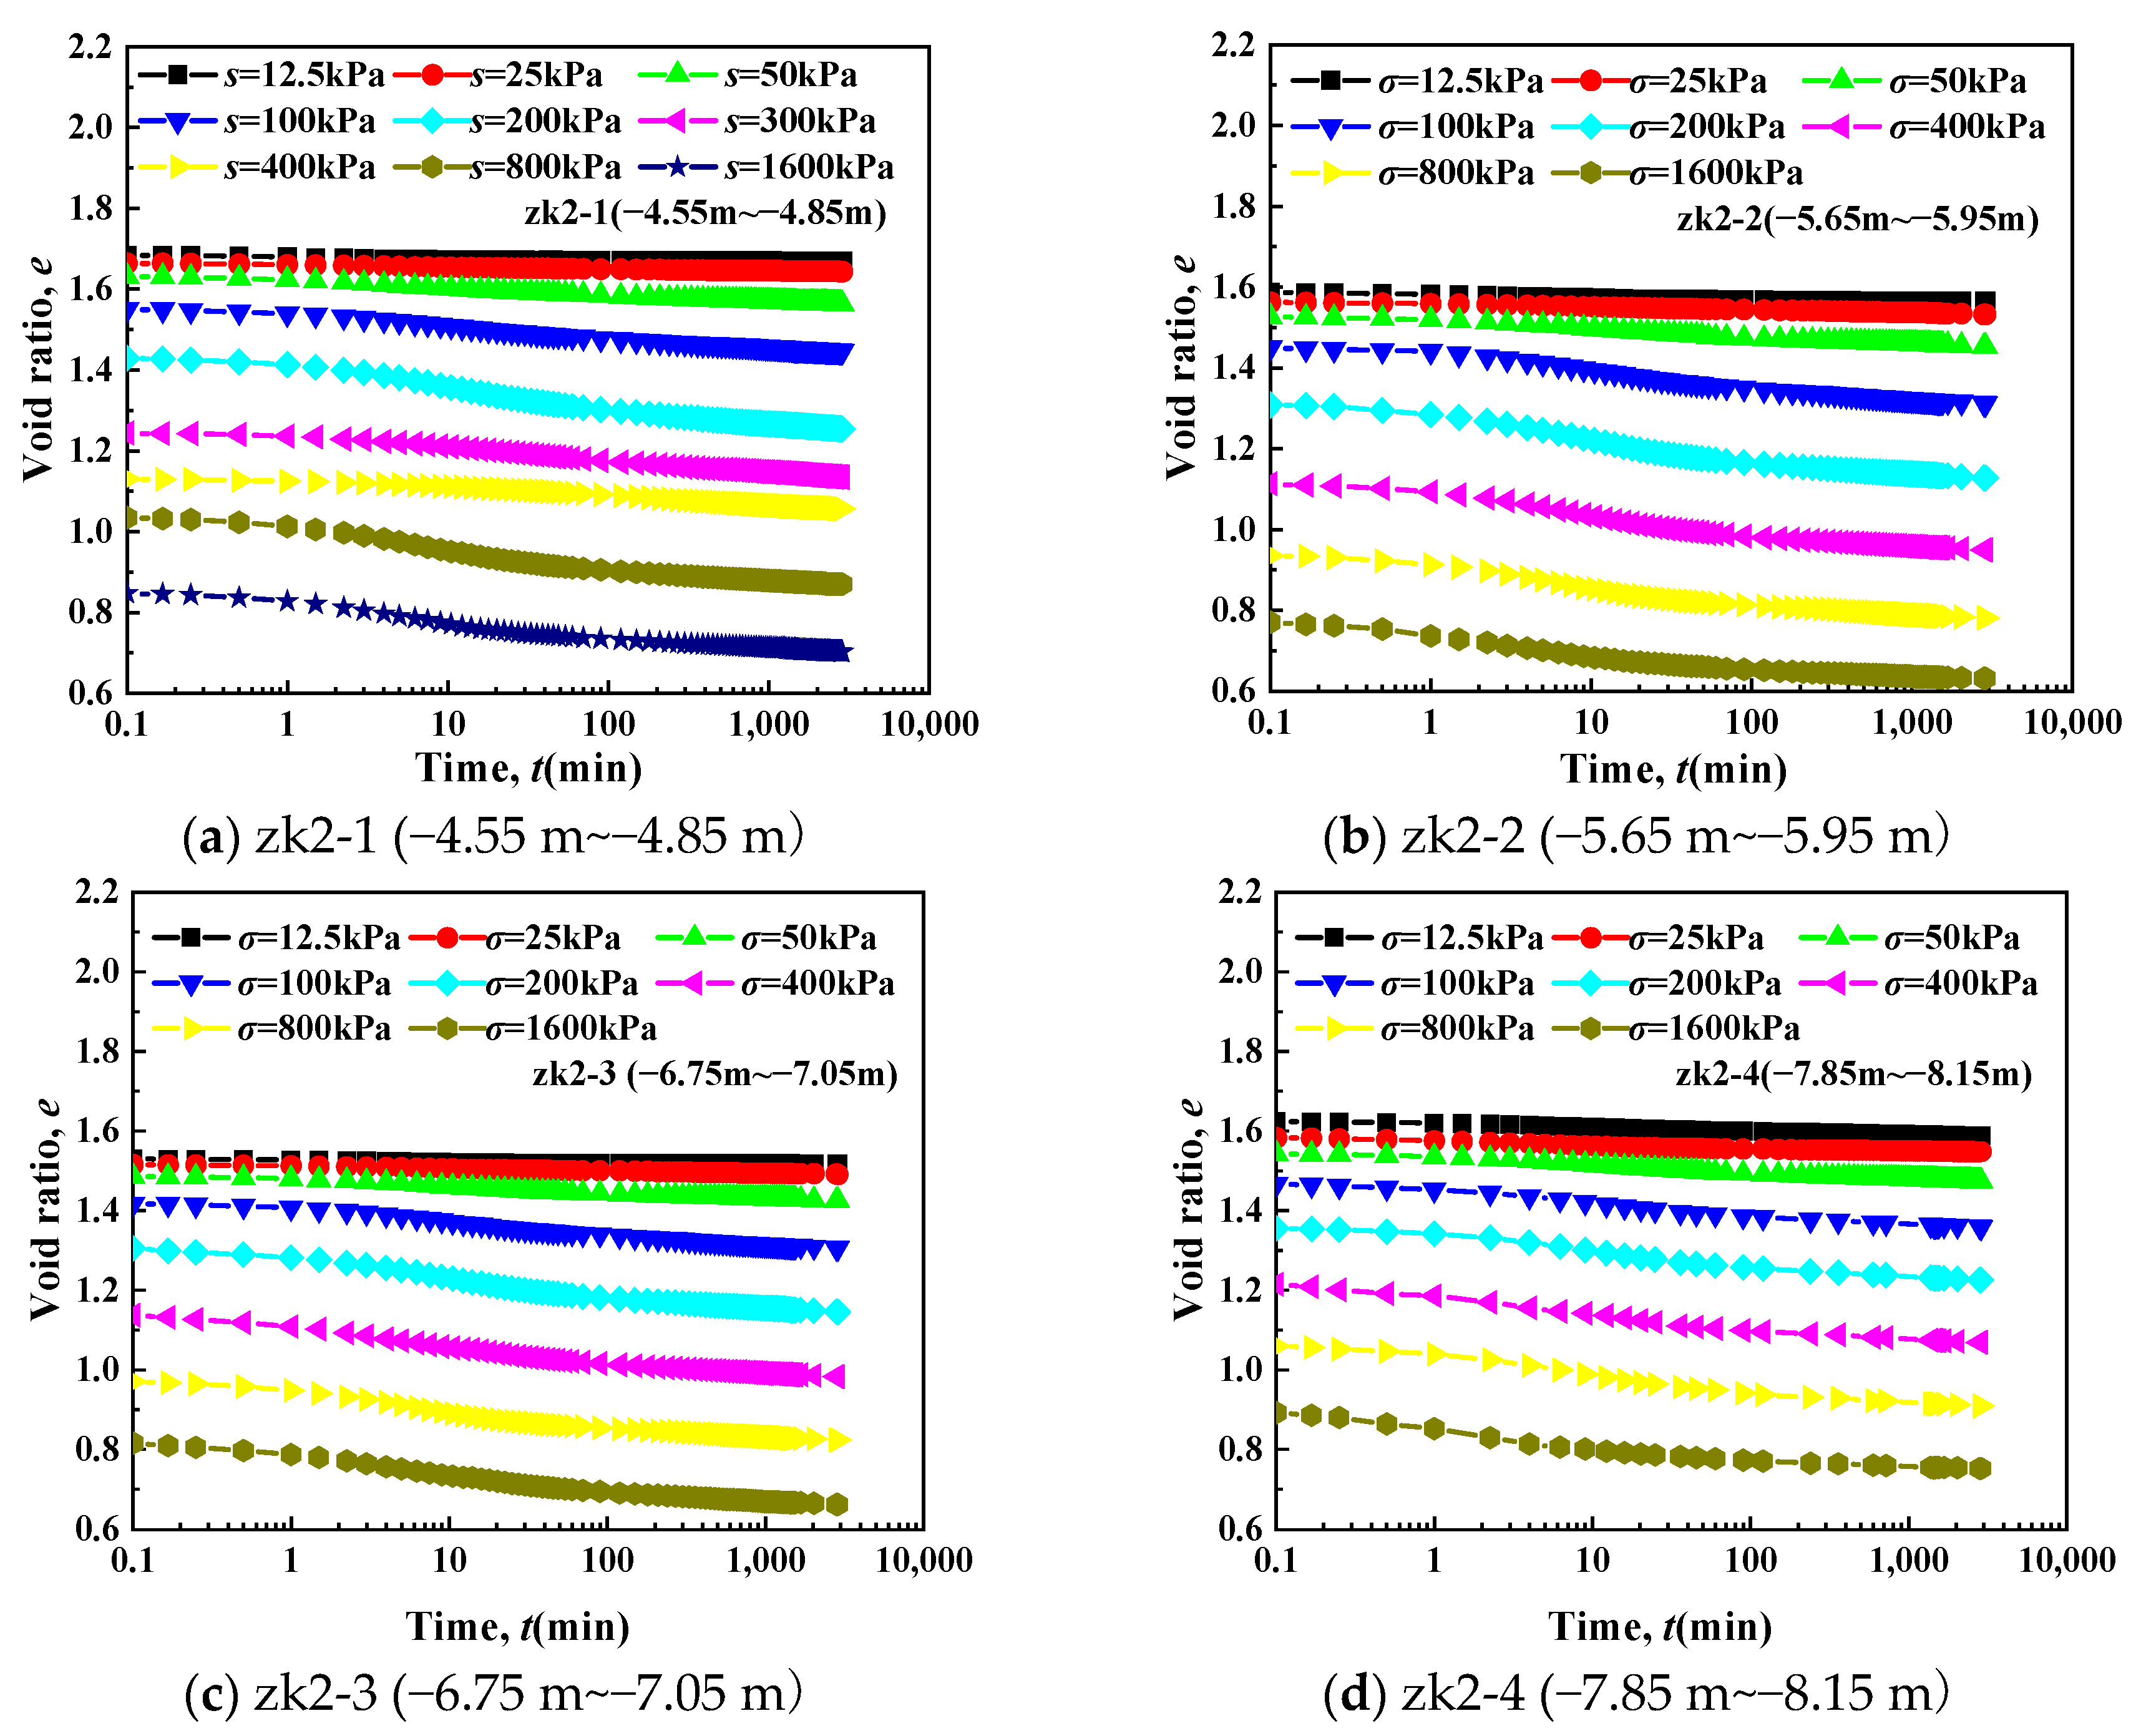
Authors to whom correspondence should be addressed.
J. Mar. Sci. Eng. 2025, 13(10), 1943; https://doi.org/10.3390/jmse13101943 (registering DOI)
Submission received: 27 August 2025 / Revised: 29 September 2025 / Accepted: 1 October 2025 / Published: 10 October 2025
(This article belongs to the Section Coastal Engineering)

Abstract

This study investigates the creep behavior of Wenzhou marine soft soil through 1D and triaxial creep tests, revealing that the secondary consolidation coefficient initially increases then stabilizes with stress level, decreases with OCR, increases with time, and reduces with depth. The e-lgt curves show four-phase deformation (instantaneous, primary consolidation, secondary compression, and accelerated creep), while triaxial tests identify three creep stages (decelerated, steady, and accelerated), with higher confining pressure increasing the deviatoric stress threshold for accelerated creep. Nonlinear stress–strain isochrones shift toward the strain axis with increasing confining pressure. The proposed structural parameter inversely correlates with the secondary consolidation coefficient, demonstrating that enhanced interparticle cementation and soil structure improve long-term creep resistance in coastal soft soil foundations.

1. Introduction

Extensive deposits of soft soils with unique engineering properties are widely distributed in China’s eastern coastal regions, particularly in the Yangtze River Delta and Pearl River Delta areas. Taking Wenzhou as an example, its soft soils exhibit notable unfavorable engineering characteristics: high water content, large void ratio, high compressibility, low permeability, and poor bearing capacity [1,2]. These properties pose serious challenges to construction projects, particularly the long-term settlement of foundations under sustained loading due to the soil’s high compressibility [3,4]. Therefore, an in-depth investigation into the long-term deformation behavior of soft soils is of both theoretical and practical significance for accurately predicting and controlling foundation settlement, ensuring the long-term safety and stability of infrastructure in soft soil regions.
The creep behavior of soft soils is influenced by initial consolidation degree, drainage conditions, and loading ratio [5]. The creep process consists of deceleration and steady-state stages [6], while the relationship between the secondary consolidation coefficient and consolidation pressure depends on preconsolidation pressure and loading ratio [7,8]. Theoretically, some researchers have developed a new one-dimensional consolidation differential equation by integrating the modified Singh–Mitchell model with Terzaghi’s consolidation theory, explicitly accounting for creep deformation after primary consolidation [9]. Triaxial tests demonstrate that drainage conditions significantly affect creep characteristics: consolidation reduces soil creep, with drained shear exhibiting linear deviatoric stress–axial strain under constant loading, whereas undrained shear shows nonlinearity with yielding. Sustained loading under undrained conditions enhances undrained strength [10]. Time-dependent deformation arises from consolidation–creep coupling, where stress level and drainage conditions determine their relative contributions [11]. This is evident in triaxial creep tests: drained conditions produce larger instantaneous deformation but smaller creep, while undrained conditions exhibit more pronounced creep, with distinct strain–time and stress–strain relationships [12]. Increasing stress levels enhance nonlinearity in creep time–strain curves and shift stress–strain isochrones toward the strain axis. Under creep, the compression modulus decreases over time, and long-term strength declines before stabilizing [13].
Soil properties are strongly influenced by microstructure, which is a key factor determining macroscopic behaviors such as shear strength, compressibility, and creep characteristics [14,15,16]. This provides additional evidence that silty and clayey soils can also undergo significant time-dependent deformation. At the microscale, the arrangement of soil particles and pore structure characteristics not only reflect the formation history, composition, and physico-mechanical properties of soft soil but also govern its current mechanical behavior and subsequent deformation evolution [17]. Mercury intrusion porosimetry (MIP) tests reveal that the pore size between residual soil particles decreases during desiccation [18]. Real-time computed tomography (CT) observations identify four stages in the microstructural evolution of silty clay: micro-defect closure, initial damage, damage development, and post-damage progression [19]. Additionally, the reduction in interparticle cementation leads to microstructural degradation in soft soil, manifested by both pore enlargement and particle breakdown [20]. This study investigates the mesostructural evolution of soft soil before and after creep, providing critical scientific insights into the long-term deformation mechanisms of soft soils.
In addition, this study considers the fact that coastal soft soil not only has high compressibility and creep characteristics but also often exhibits liquefaction sensitivity [21]. In order to reduce the risk of liquefaction and long-term settlement, a variety of foundation reinforcement measures are usually adopted in engineering practice, such as vibro-replacement, gravel piles, sand piles, and so on. These can effectively improve the stability of foundations and reduce long-term settlement by improving drainage conditions and improving soil compactness [22]. Studies have shown that these measures not only improve the macroscopic bearing capacity of the soil, but also change the microstructure evolution law to a certain extent, thus affecting the creep characteristics [23]. Therefore, the relationship between the microstructure and creep characteristics of soft soil revealed in this study is an important reference value for optimizing foundation treatment schemes and improving the long-term safety of coastal projects.
Based on the research background, this study systematically investigates the creep characteristics of undisturbed soft soil from Wenzhou through comprehensive laboratory tests, including one-dimensional and triaxial creep tests, coupled with microstructural analysis. The experimental program was designed to evaluate the combined effects of multiple factors, including stress levels, overconsolidation ratios, sampling depths, time-dependent behavior, and confining pressures. The research findings provide reliable experimental data for long-term settlement prediction of soft soil foundations, while establishing a theoretical basis for optimizing settlement control techniques. The study holds significant practical value for geotechnical engineering applications in soft soil regions.

2. Experimental Methodology

2.1. Basic Physical Properties of Test Materials

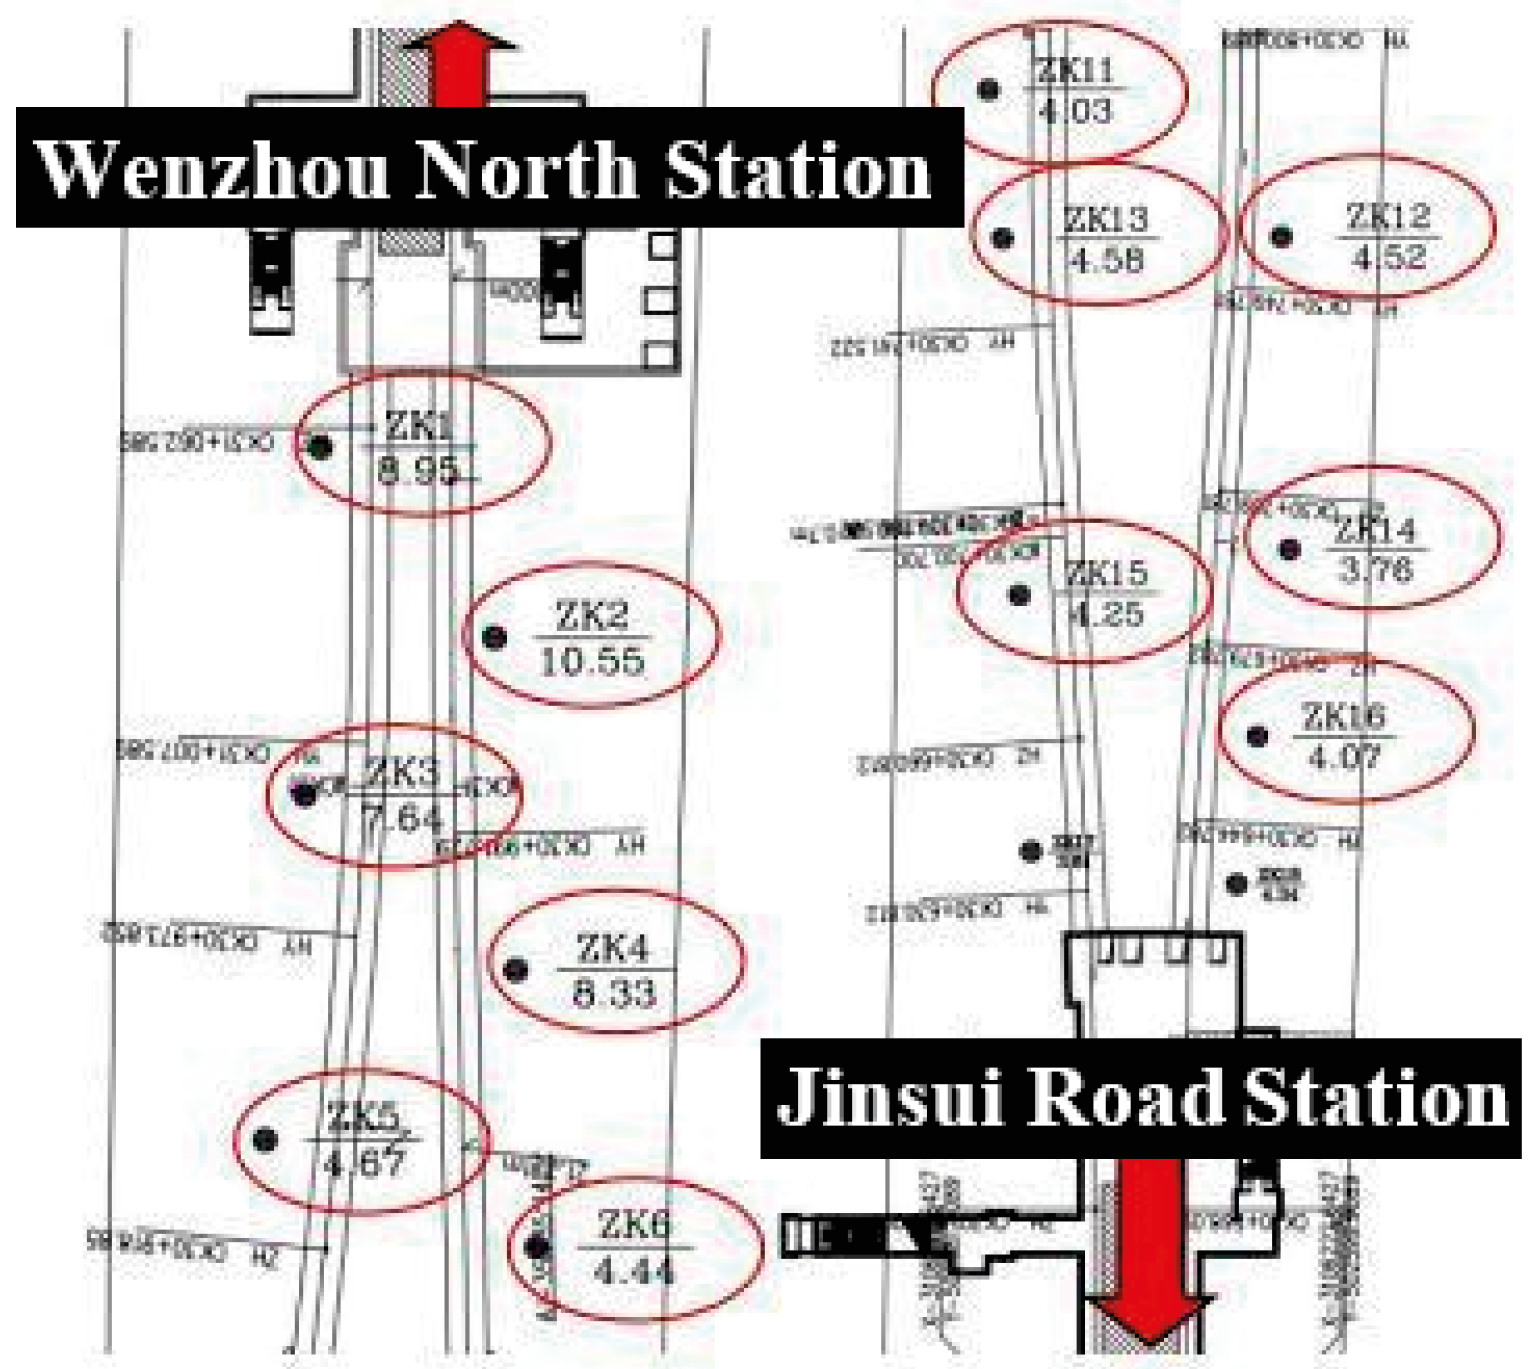
Undisturbed soft soil samples were retrieved from Wenzhou Metro Line M1 (32.5 km total length, Figure 1) using thin-walled Shelby tubes (110 mm diameter) via continuous push sampling at the locations shown in Figure 2. The specimens were immediately sealed in wax-lined storage tubes and preserved in dark, constant-temperature/humidity conditions to maintain their natural structure.
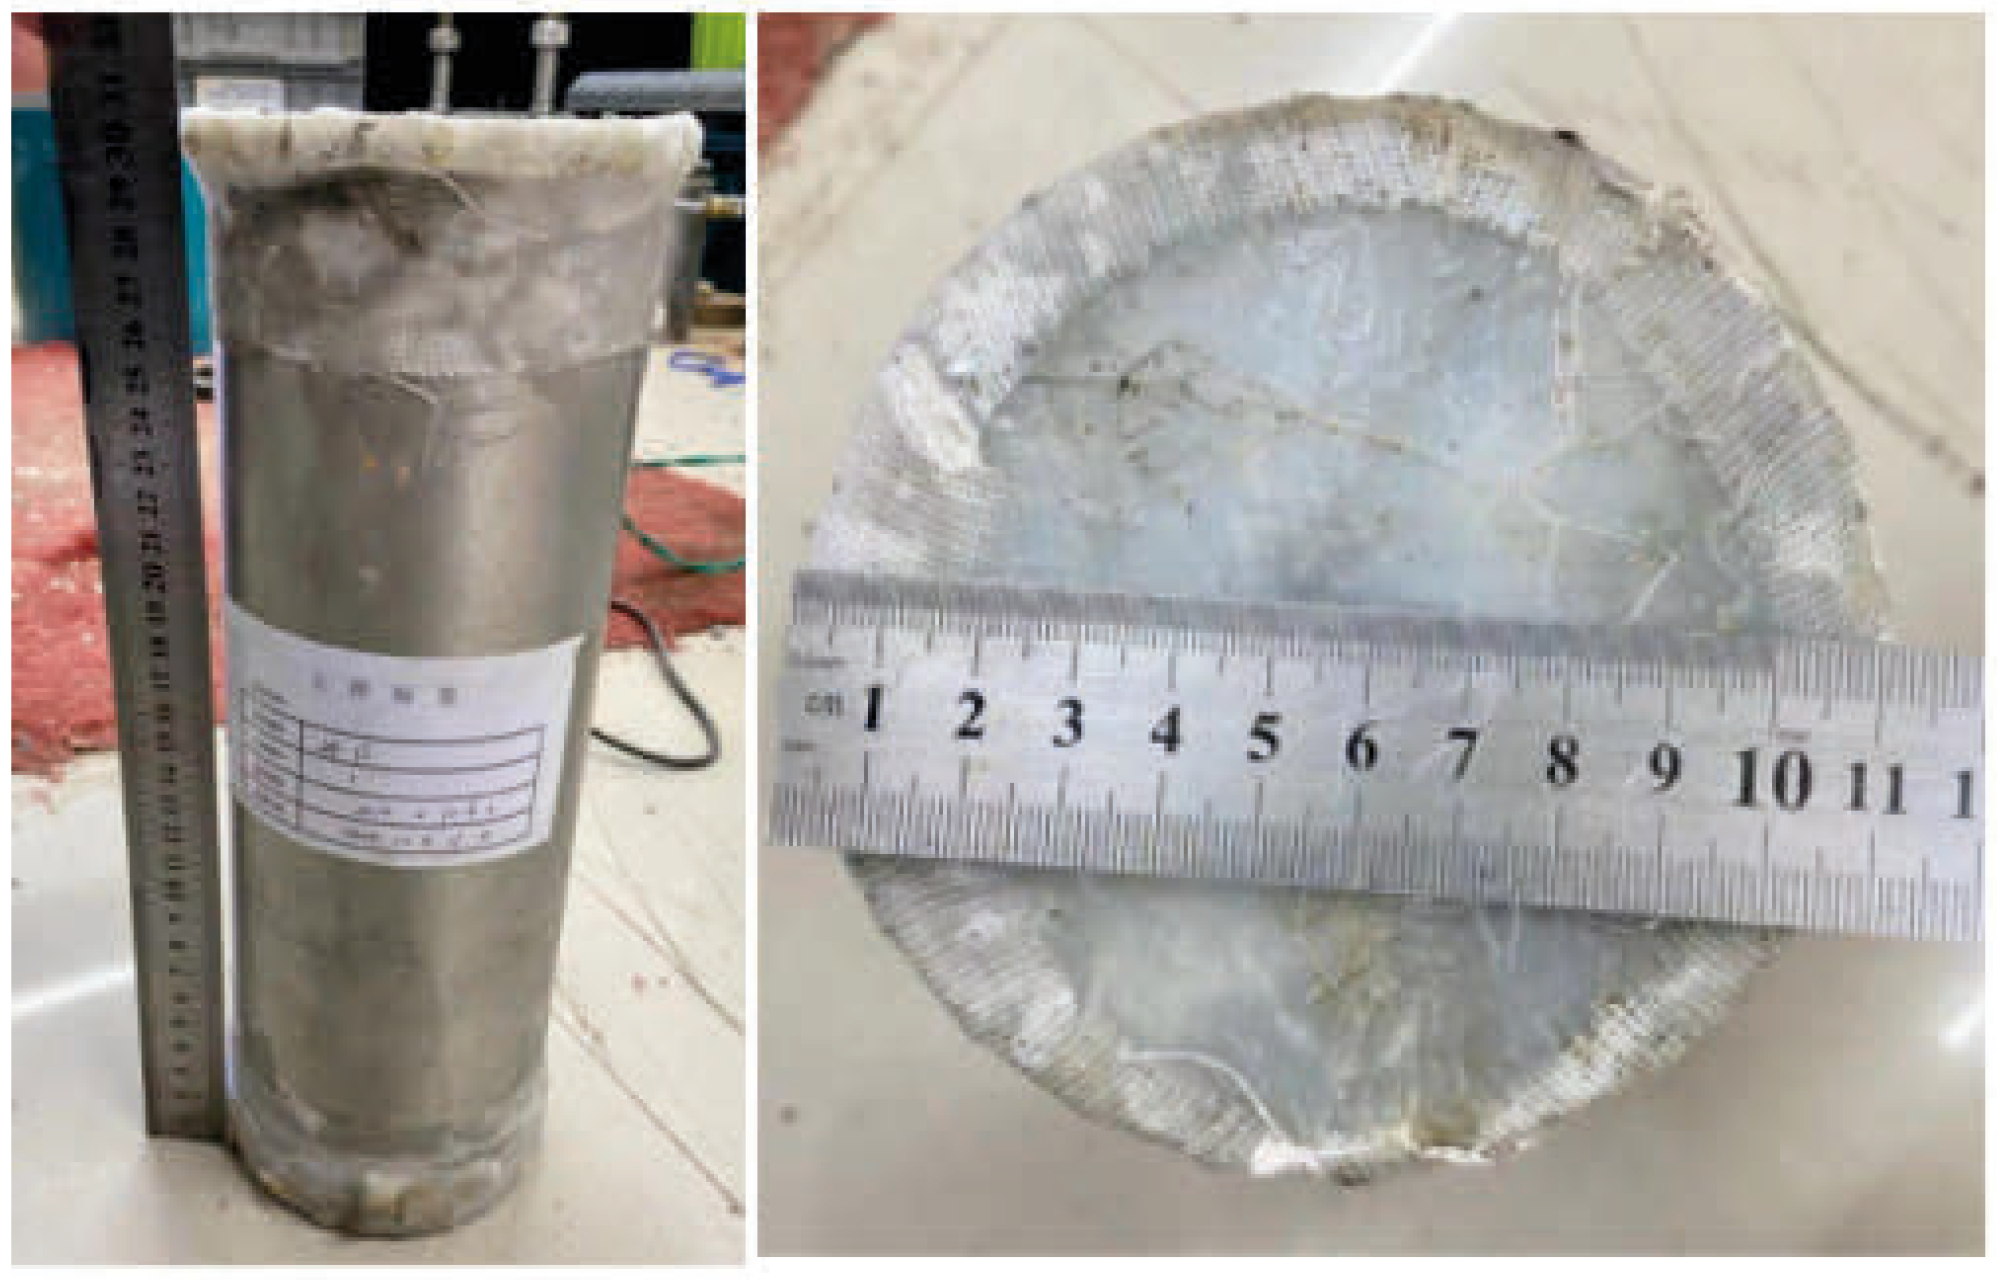
Undisturbed soft soil specimens were obtained from four boreholes at ten different depths using thin-walled Shelby tubes (10 cm diameter × 30 cm height, Figure 3). The samples exhibited gray to bluish-gray marine mucky soil characteristics with occasional silt inclusions, displaying the glossy surfaces, high toughness, homogeneous structure, low shear strength, and near-fluid consistency typical of Wenzhou’s soft soil deposits. Key physical properties are presented in Table 1.
XRD analysis revealed that the undisturbed soft soil primarily consists of quartz, dolomite, and mica (Table 2). The soil exhibits high clay content and moderate organic matter, while the mineral composition indicates strong hydrophilicity, resulting in characteristically high natural water content.
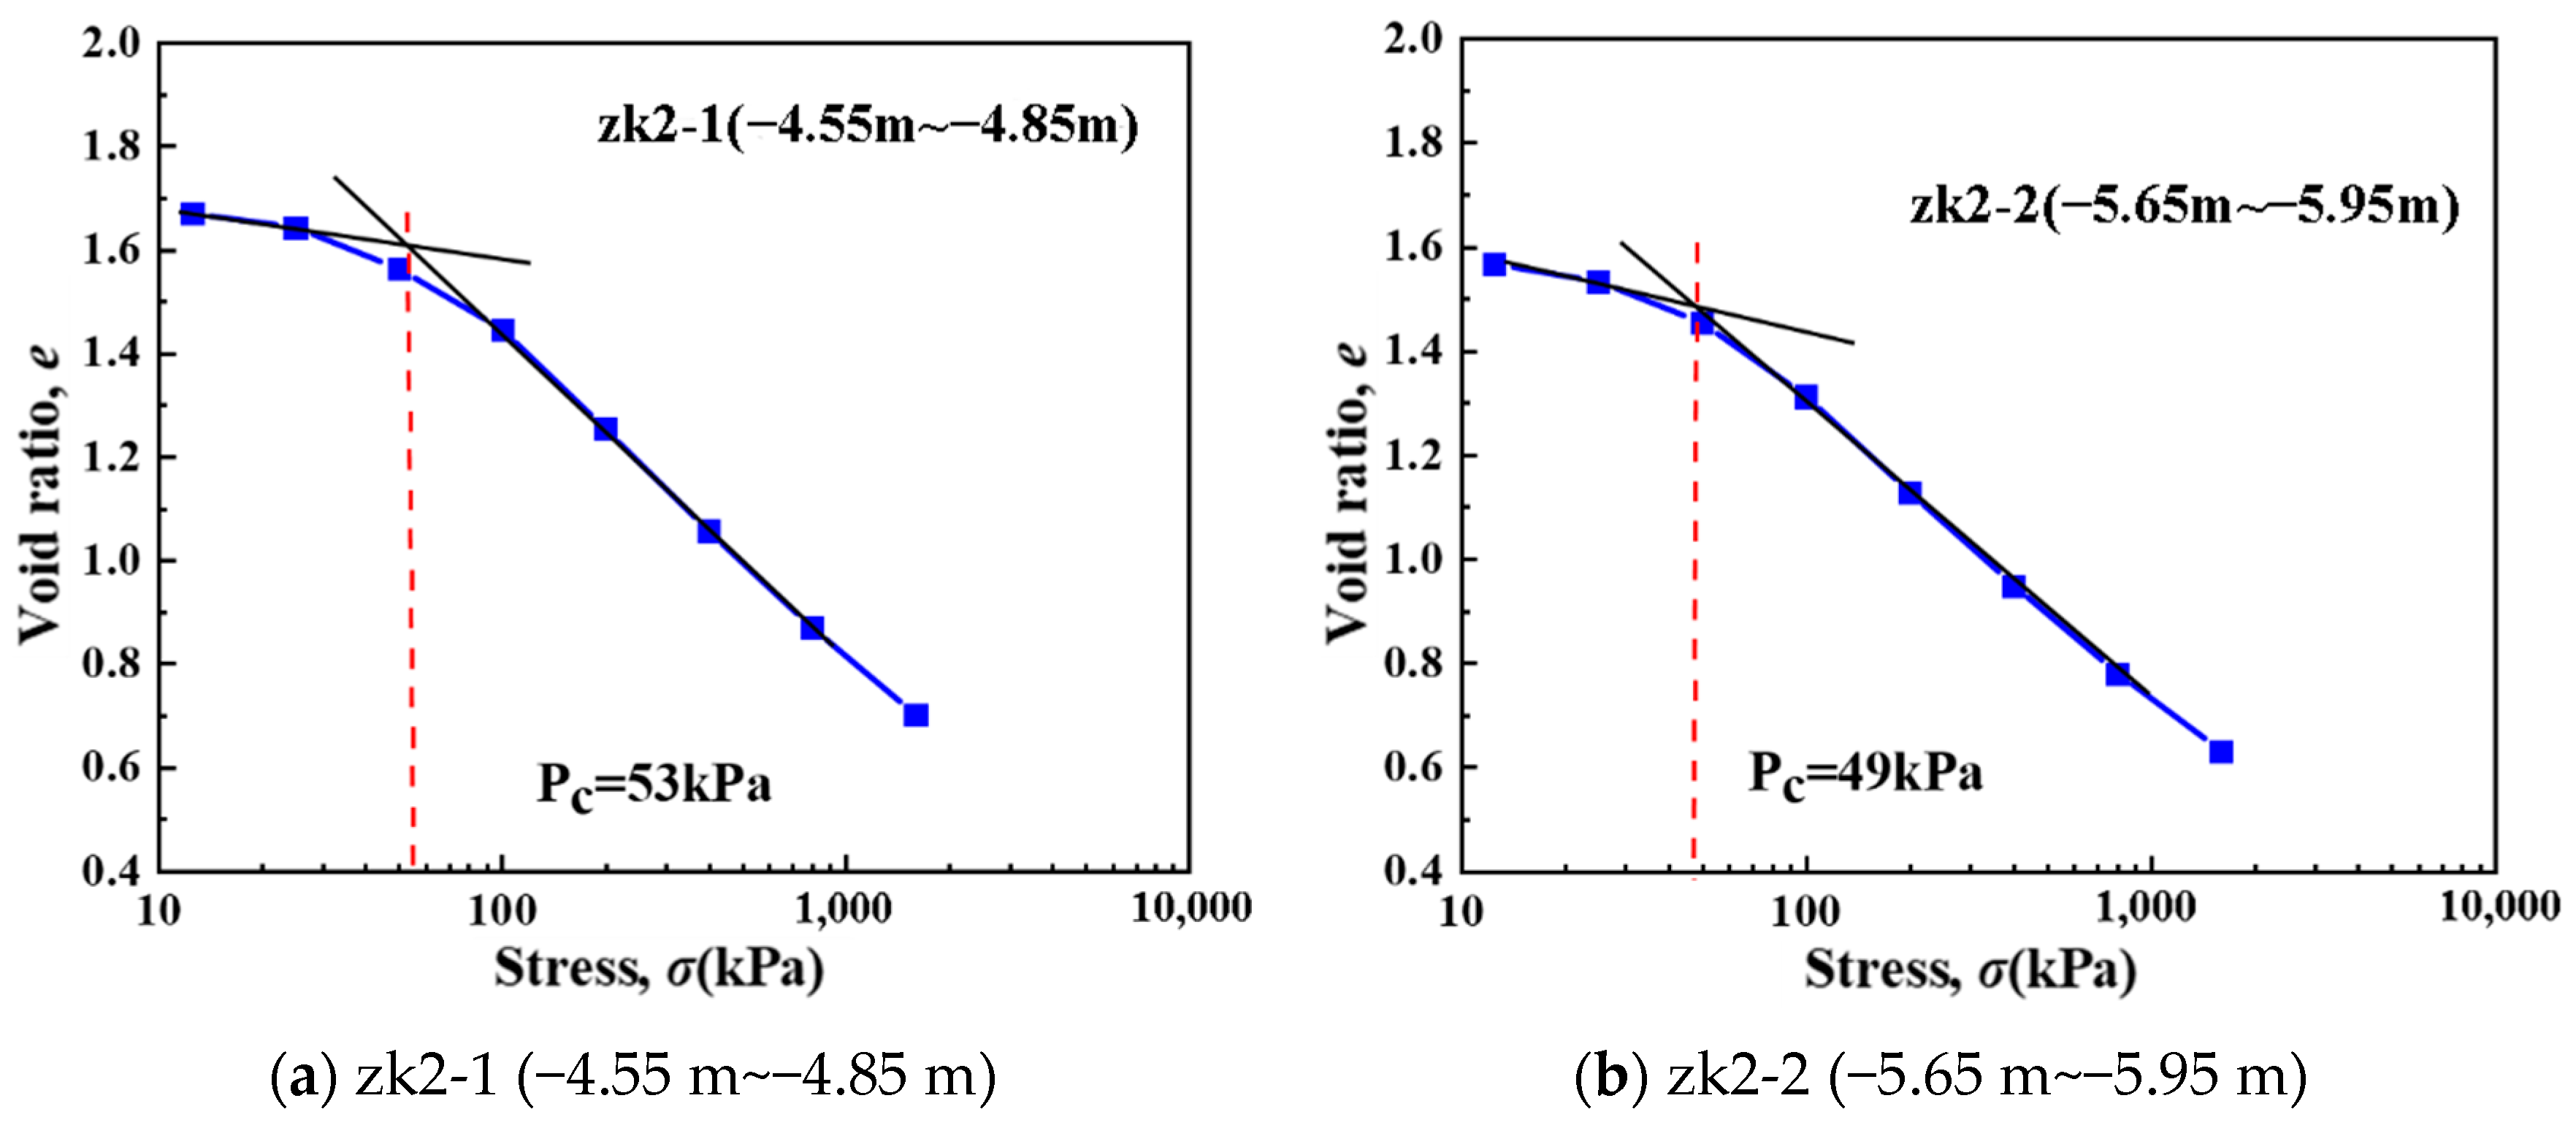
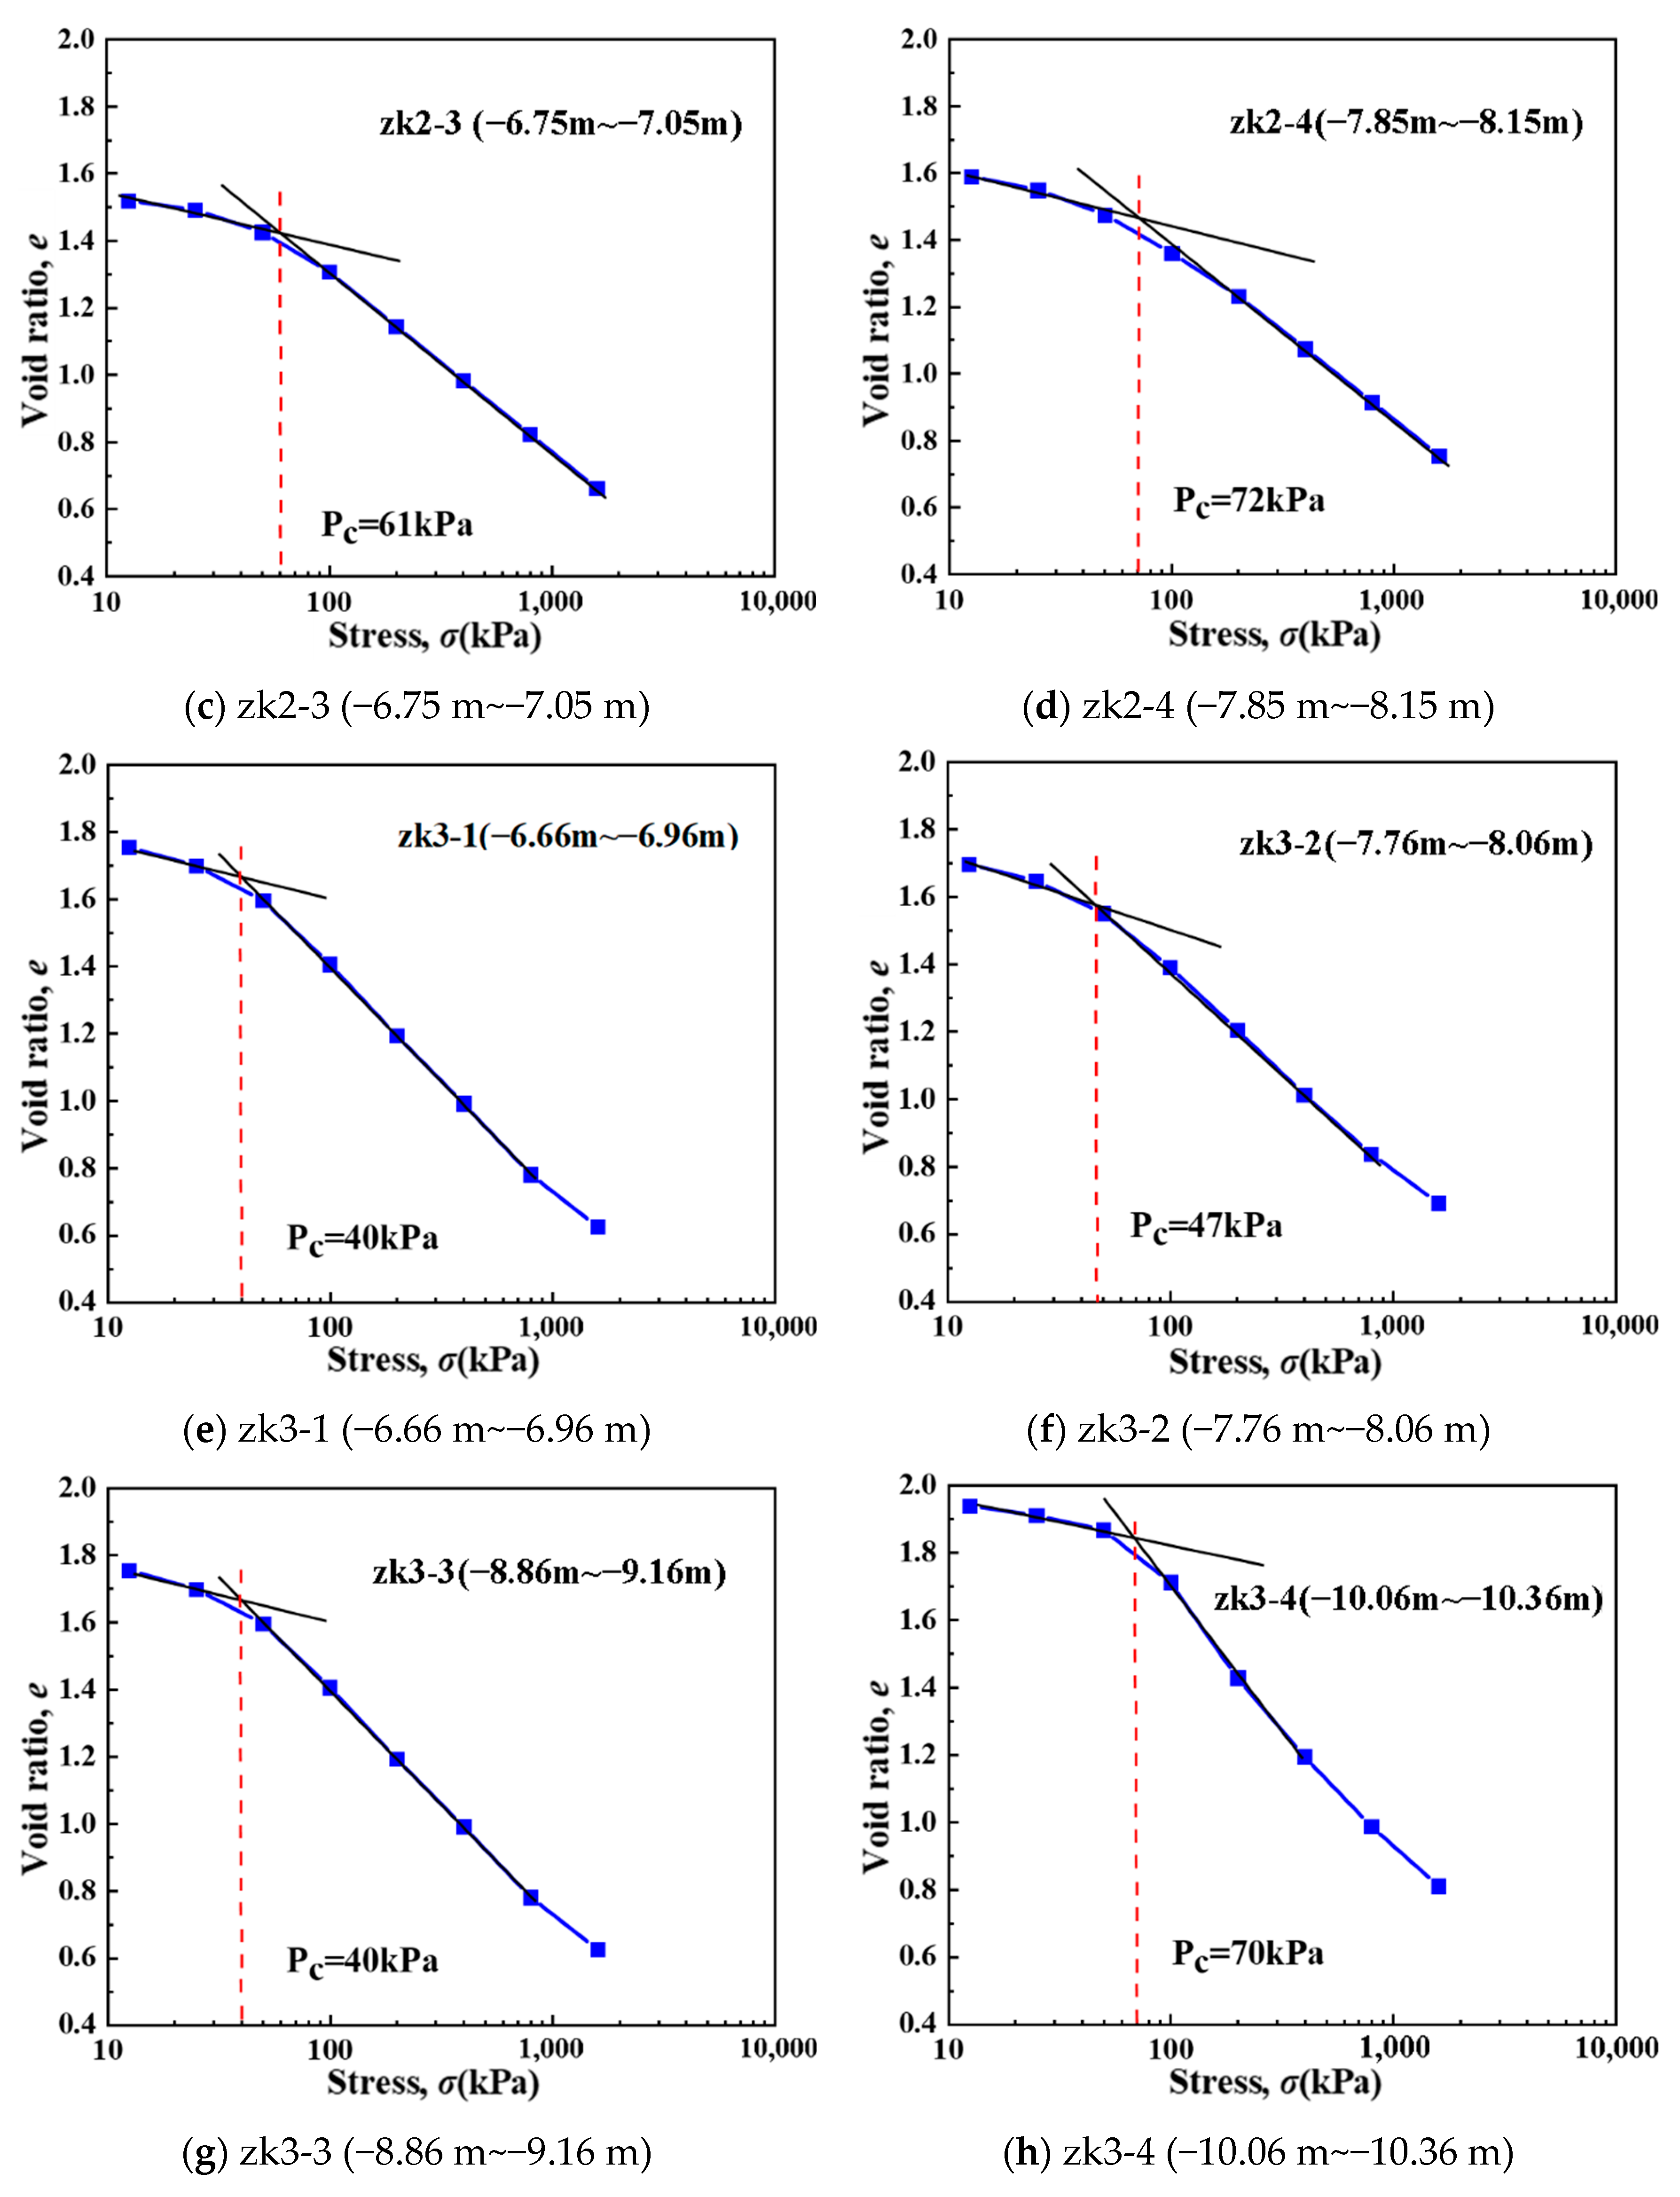
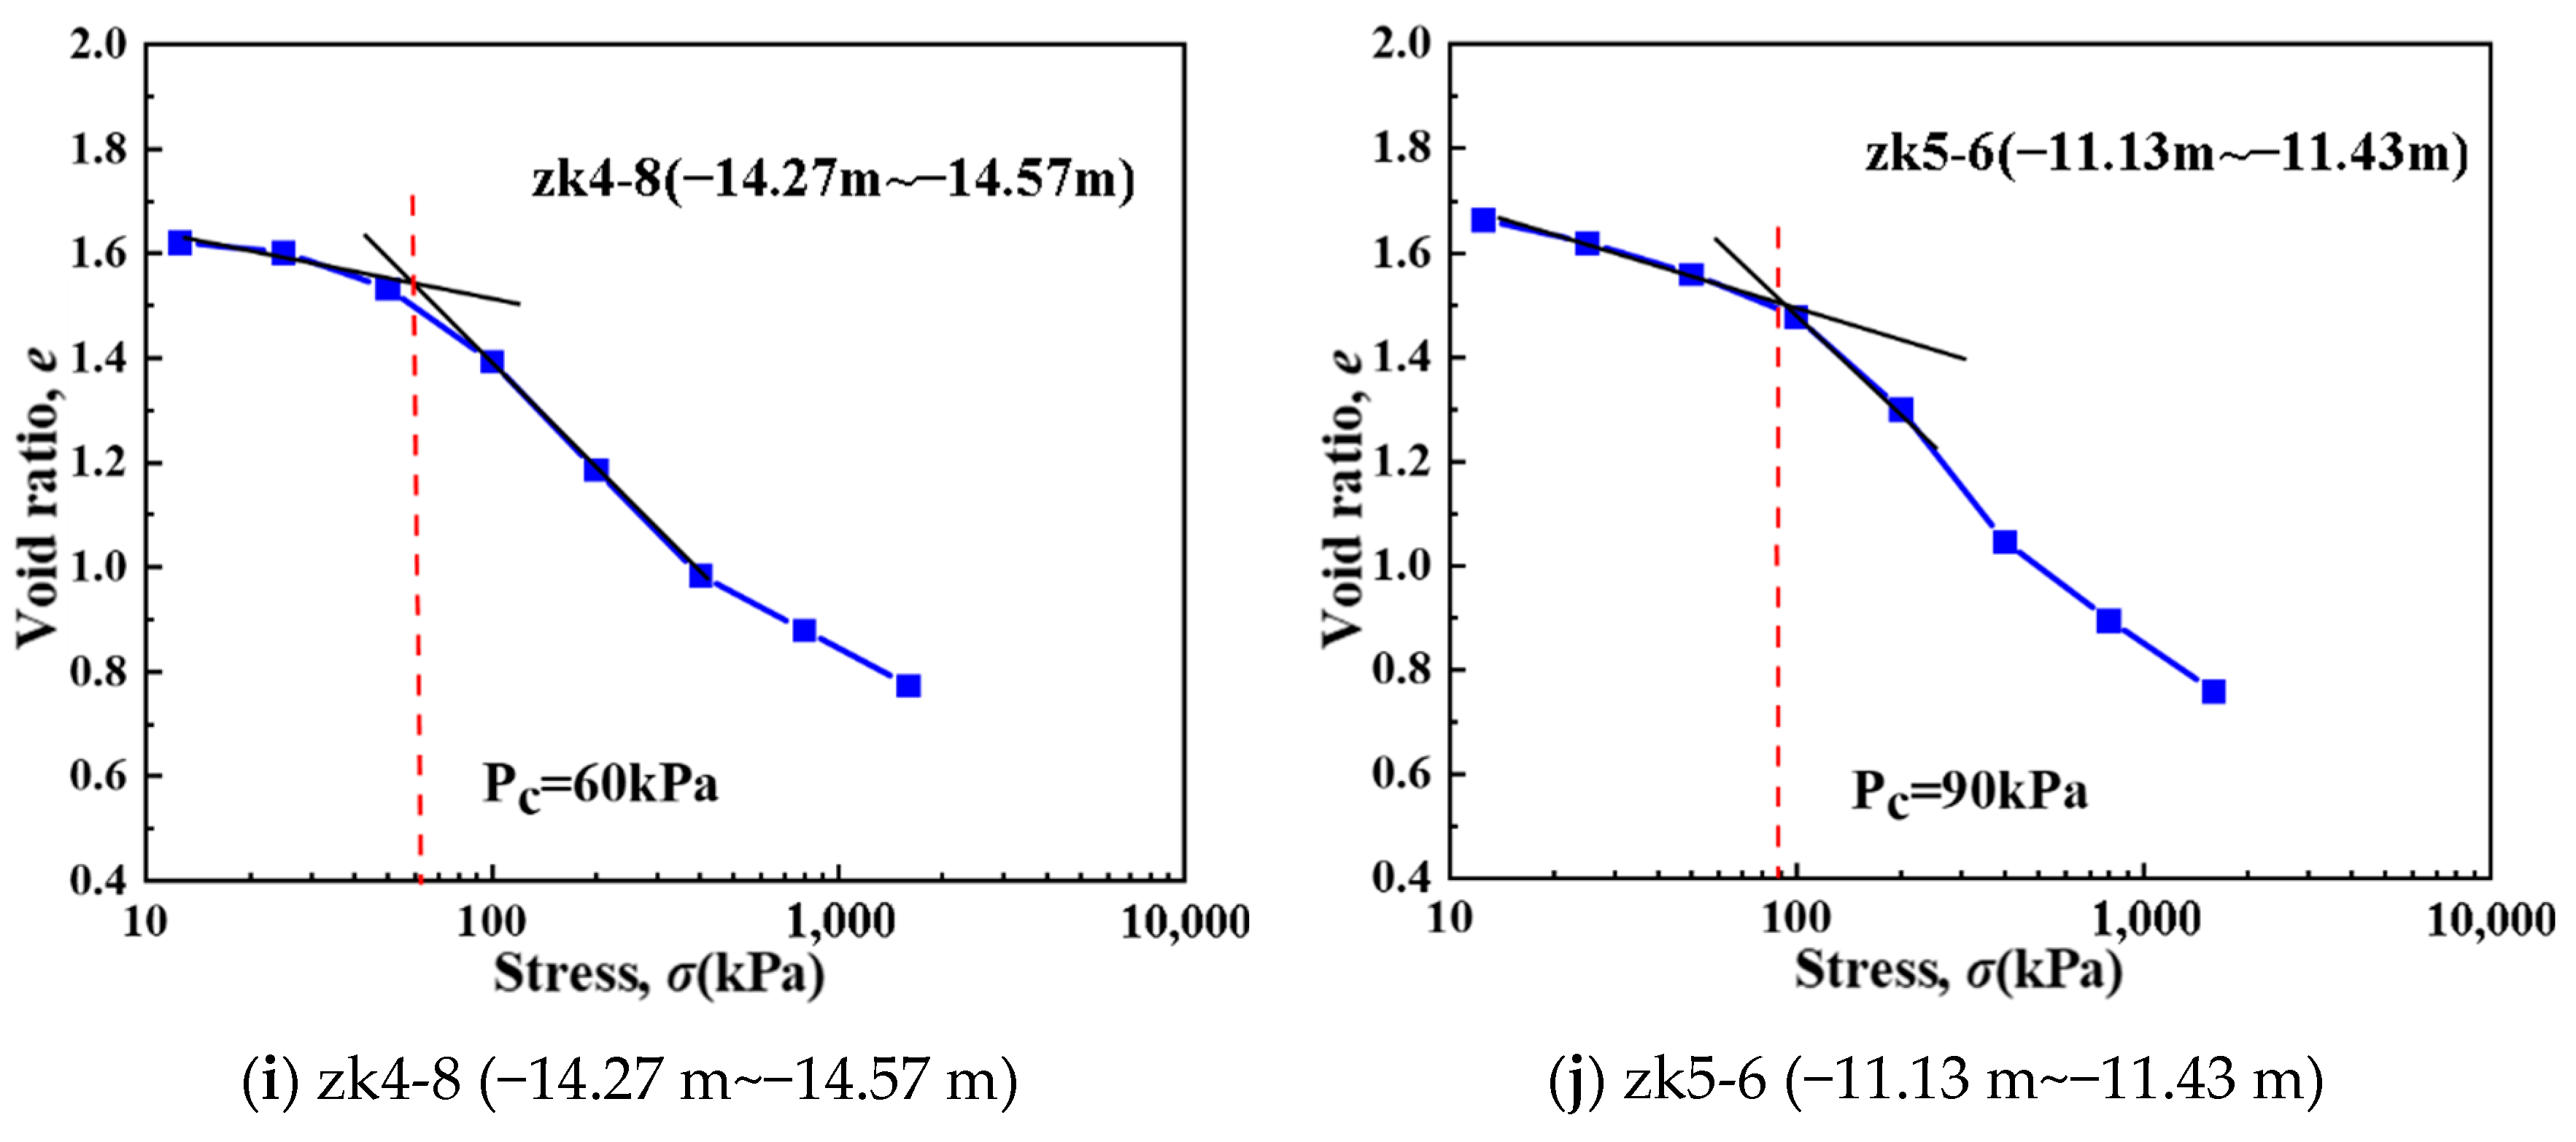
One-dimensional consolidation tests on ten undisturbed soft soil specimens (sampling depth: 11–18 m) yielded e-lgσ curves (Figure 4) showing preconsolidation pressures ranging between 50 and 100 kPa across different depths.
The consolidation test results in Table 3 demonstrate that the compression coefficient, compression modulus, compression index, and preconsolidation pressure of the undisturbed soft soil exhibit random fluctuations within specific ranges without showing consistent depth-dependent trends. Based on the measured values of the compression coefficient and compression index, the soil specimens were classified as highly compressible.

2.2. Sample Disturbance Verification

The in situ void ratio (ein situ) of sampling points was measured via borehole water pressure tests, and compared with the initial void ratio (elab) of samples measured in the laboratory. Taking the representative borehole ZK2-4 (sampling depth: 7.85–8.15 m) as an example, the in situ void ratio was 1.61, and the laboratory-tested void ratio was 1.588 (see Table 1 in the original paper for detailed data), with a deviation of only 1.36%. The elab/ein situ ratios of all 10 samples ranged from 0.97 to 1.02, far lower than the industry threshold of “typically >5% deviation for disturbed samples”, confirming that the pore structure of the samples was not significantly damaged during sampling.
Using the “Stress History and Normalized Soil Engineering Properties” (SHANSEP) method, the preconsolidation pressure (Pc) of the samples was measured via one-dimensional consolidation tests, and the ratio of Pc to the in situ effective overburden pressure (σv0) was calculated (OCR = Pc/σv0). The results showed that the OCR values of all the samples ranged from 1.1 to 1.3 (e.g., for sample ZK3-1, Pc= 40 kPa, σv0 = 36 kPa, OCR = 1.11), which was consistent with the characteristic of “OCR ≈ 1–1.5 for normally consolidated soft soil”. Additionally, the coefficient of variation in OCR for samples at the same depth was <5%, indicating that the stress history of the samples was not lost due to disturbance and that their mechanical properties were consistent with the in situ state.
Via triaxial undrained shear tests, the undrained shear strength (cu) of undisturbed samples (undisturbed) and remolded samples (completely disturbed, kneaded repeatedly to a plastic state) was measured, and the sensitivity was calculated as follows: St = Cu(undisturbed)/Cu(remolded). The St values of the samples in this study ranged from 2.1 to 2.5 (e.g., for sample ZK4-8, Cu(undisturbed) = 18 kPa, Cu(remolded) = 7.5 kPa, St = 2.4), which falls into the category of “medium-sensitivity soft soil” (industry classification: 1.5 < St ≤ 4 for medium sensitivity). These values are fully consistent with the range of “in-situ soft soil sensitivity: 2.0–2.6” reported in published literature on the Wenzhou area, confirming that the structural integrity of the samples was not damaged during sampling and testing.

2.3. Sample Preparation

  • Preparation of specimens in their original state
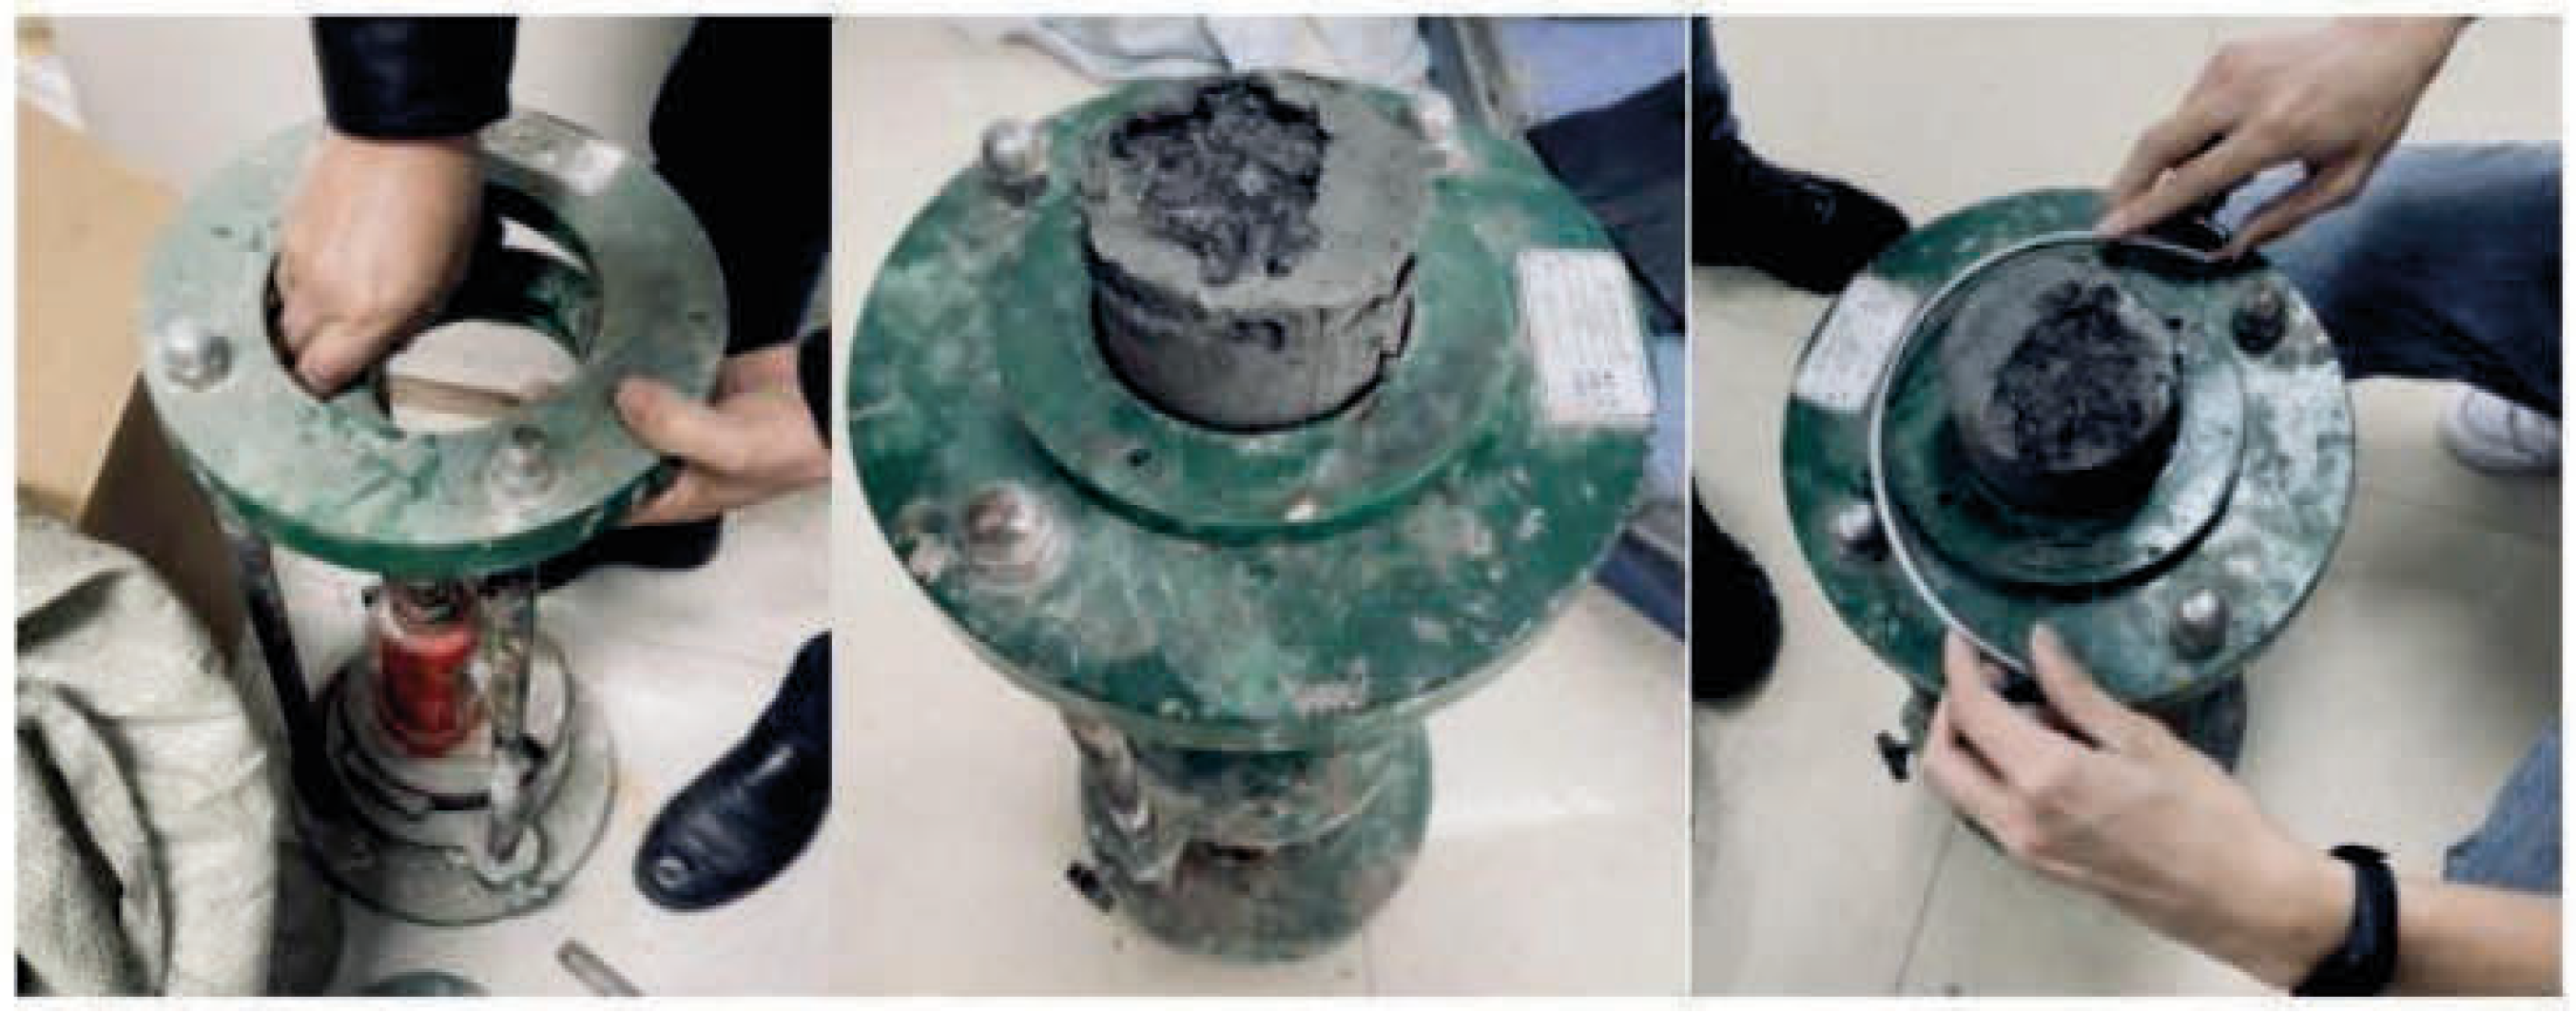
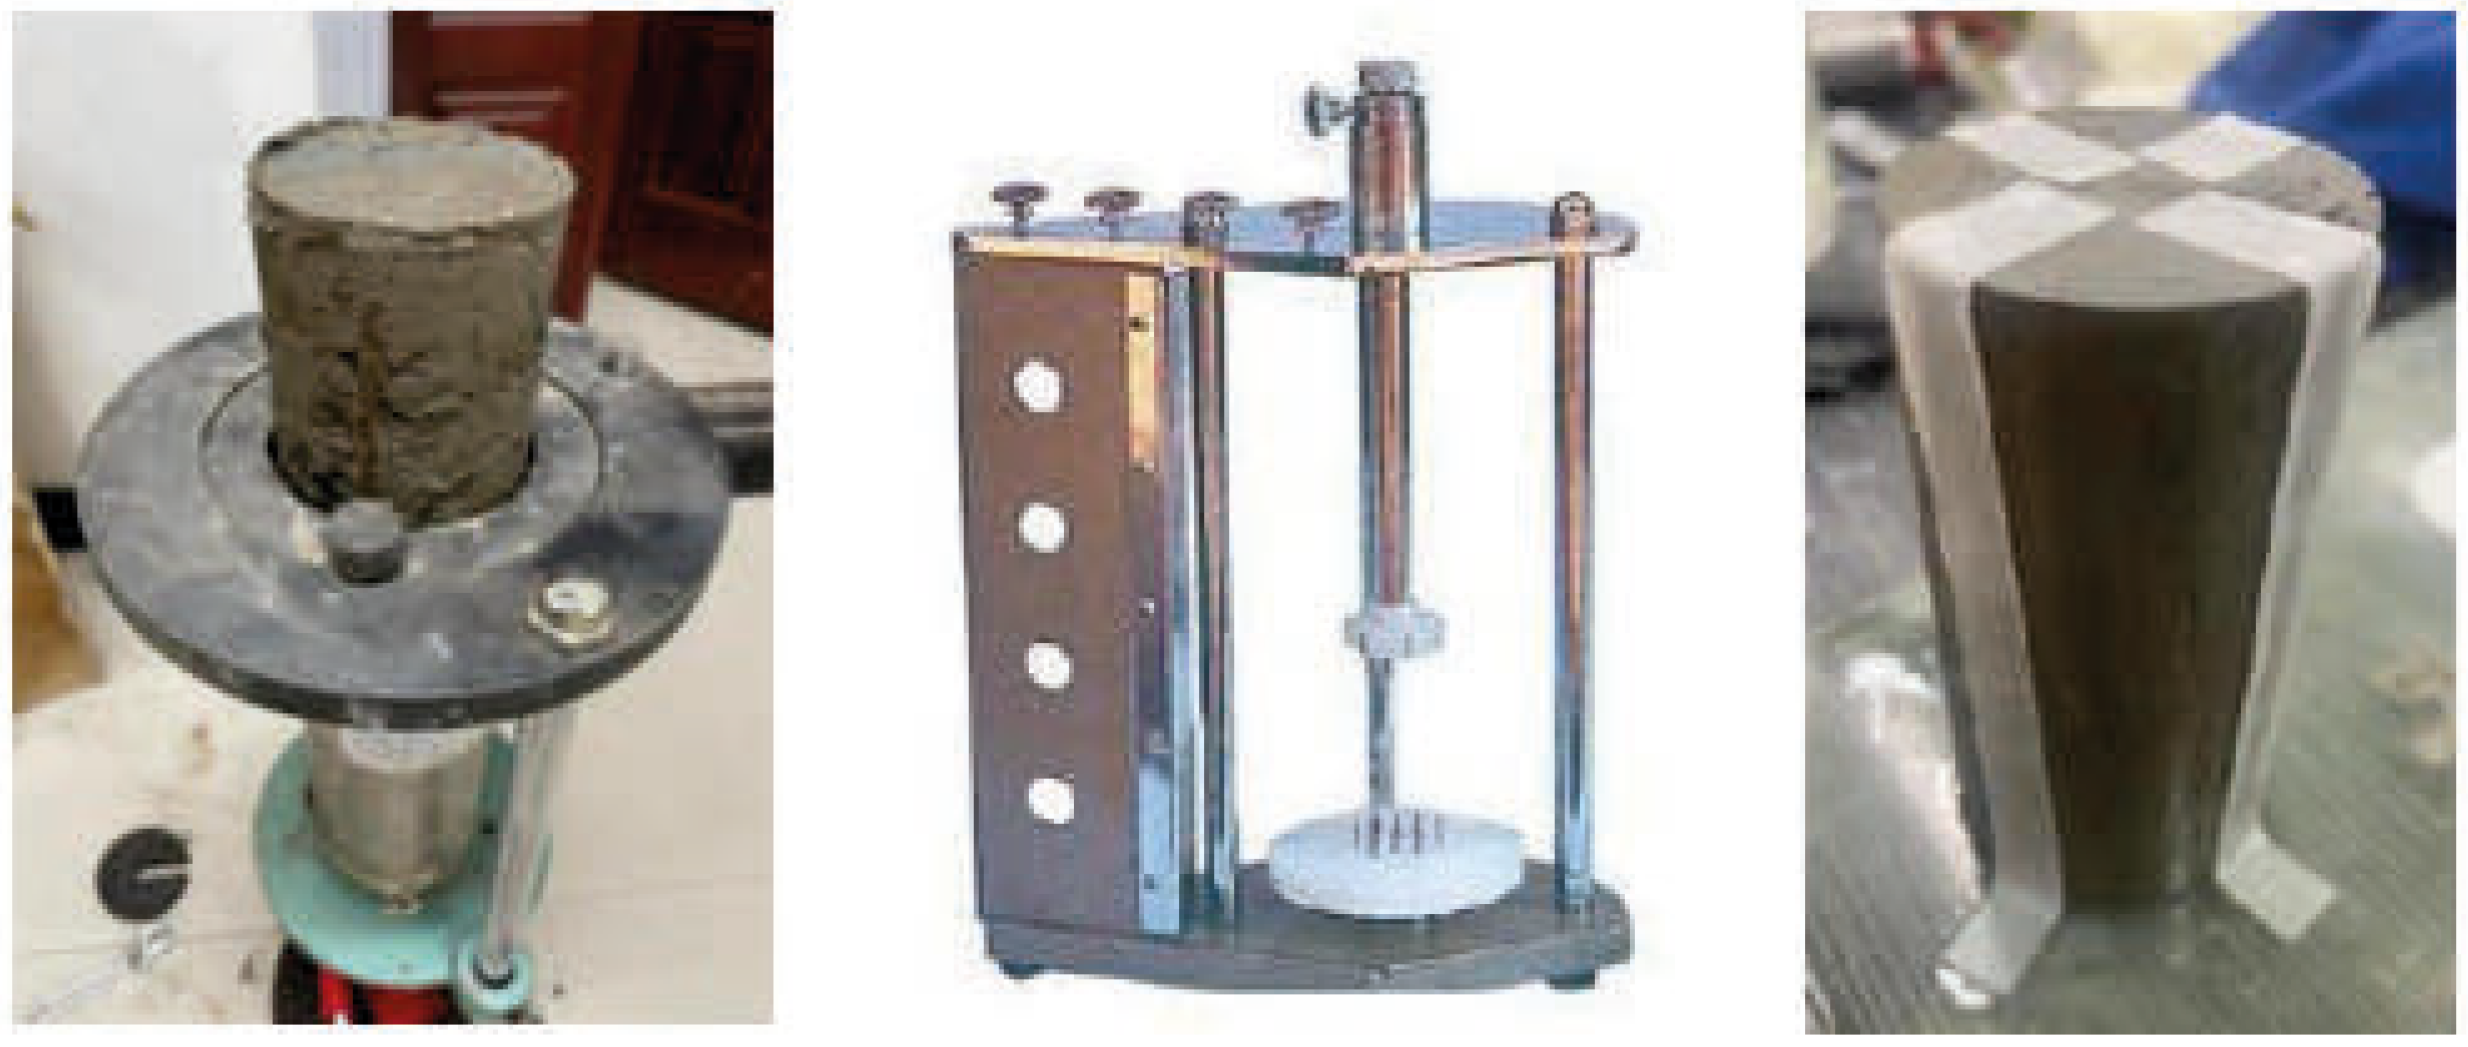
The undisturbed soft soil specimens were extracted using a reaction-frame-equipped jack system (Figure 5). The extraction procedure involved the following: (1) removing the sampler head, (2) applying vertical pressure via the sampling jack to extrude the specimen, (3) carefully trimming the top layer to minimize disturbance. For the one-dimensional consolidation tests, specimens were prepared by direct pushing of cutting rings. Triaxial specimens were prepared as shown in Figure 6 using specialized trimming techniques to maintain fabric integrity.
2.
Preparation of specimens for detailed structural testing
The meso-test specimens required specific pretreatment to ensure uncontaminated surfaces and intact fabric. Specimens were freeze-dried (Figure 7) to accommodate high-vacuum testing conditions. Preparation involved (1) sectioning samples into 12 × 12 × 10 mm observation blocks, (2) flash-freezing them in liquid nitrogen for 10 min, (3) 24 h of lyophilization to sublimate pore water through controlled vacuum dehydration—a critical process preventing microstructural distortion from water phase change.

2.4. Test Plan and Test Steps

The one-dimensional creep testing program investigated stress level (12.5–1600 kPa), overconsolidation ratio (OCR = 1, 2, 4, 8), and time effects (2, 7, 15, 30, 90 days). Ten test conditions were evaluated, considering both sampling locations and depths (0–20 m) for undisturbed soft soil, with a detailed experimental matrix presented in Table 4.
The experimental program investigated confining pressure effects on creep behavior through controlled stress-path loading (Table 5). Following consolidation under specified σ3, incremental deviatoric stress (q) was applied until creep failure, with each loading stage maintained until strain stabilization prior to subsequent stress increment.
The 1D creep test employed stress-controlled incremental loading (12.5, 25, 50, 100, 200, 400, 800, 1600 kPa) with 2-day holding periods. Deformation data was continuously recorded via an automated acquisition system, capturing minute-scale settlements. The loading protocol ensured secondary consolidation (creep rate <0.005 mm/hr after 48 h) was achieved at each stress level before proceeding, as confirmed by post-test analysis.
Before conducting the three-axis creep test, the samples were was first evacuated to saturation. The saturation degree is calculated using the formula shown in Equation (1).
s r = w s r G s e
where Sr is the saturation of the sample (%); wsr is the moisture content after sample saturation (%); Gs is the soil particle specific gravity.

2.5. Secondary Consolidation Coefficient

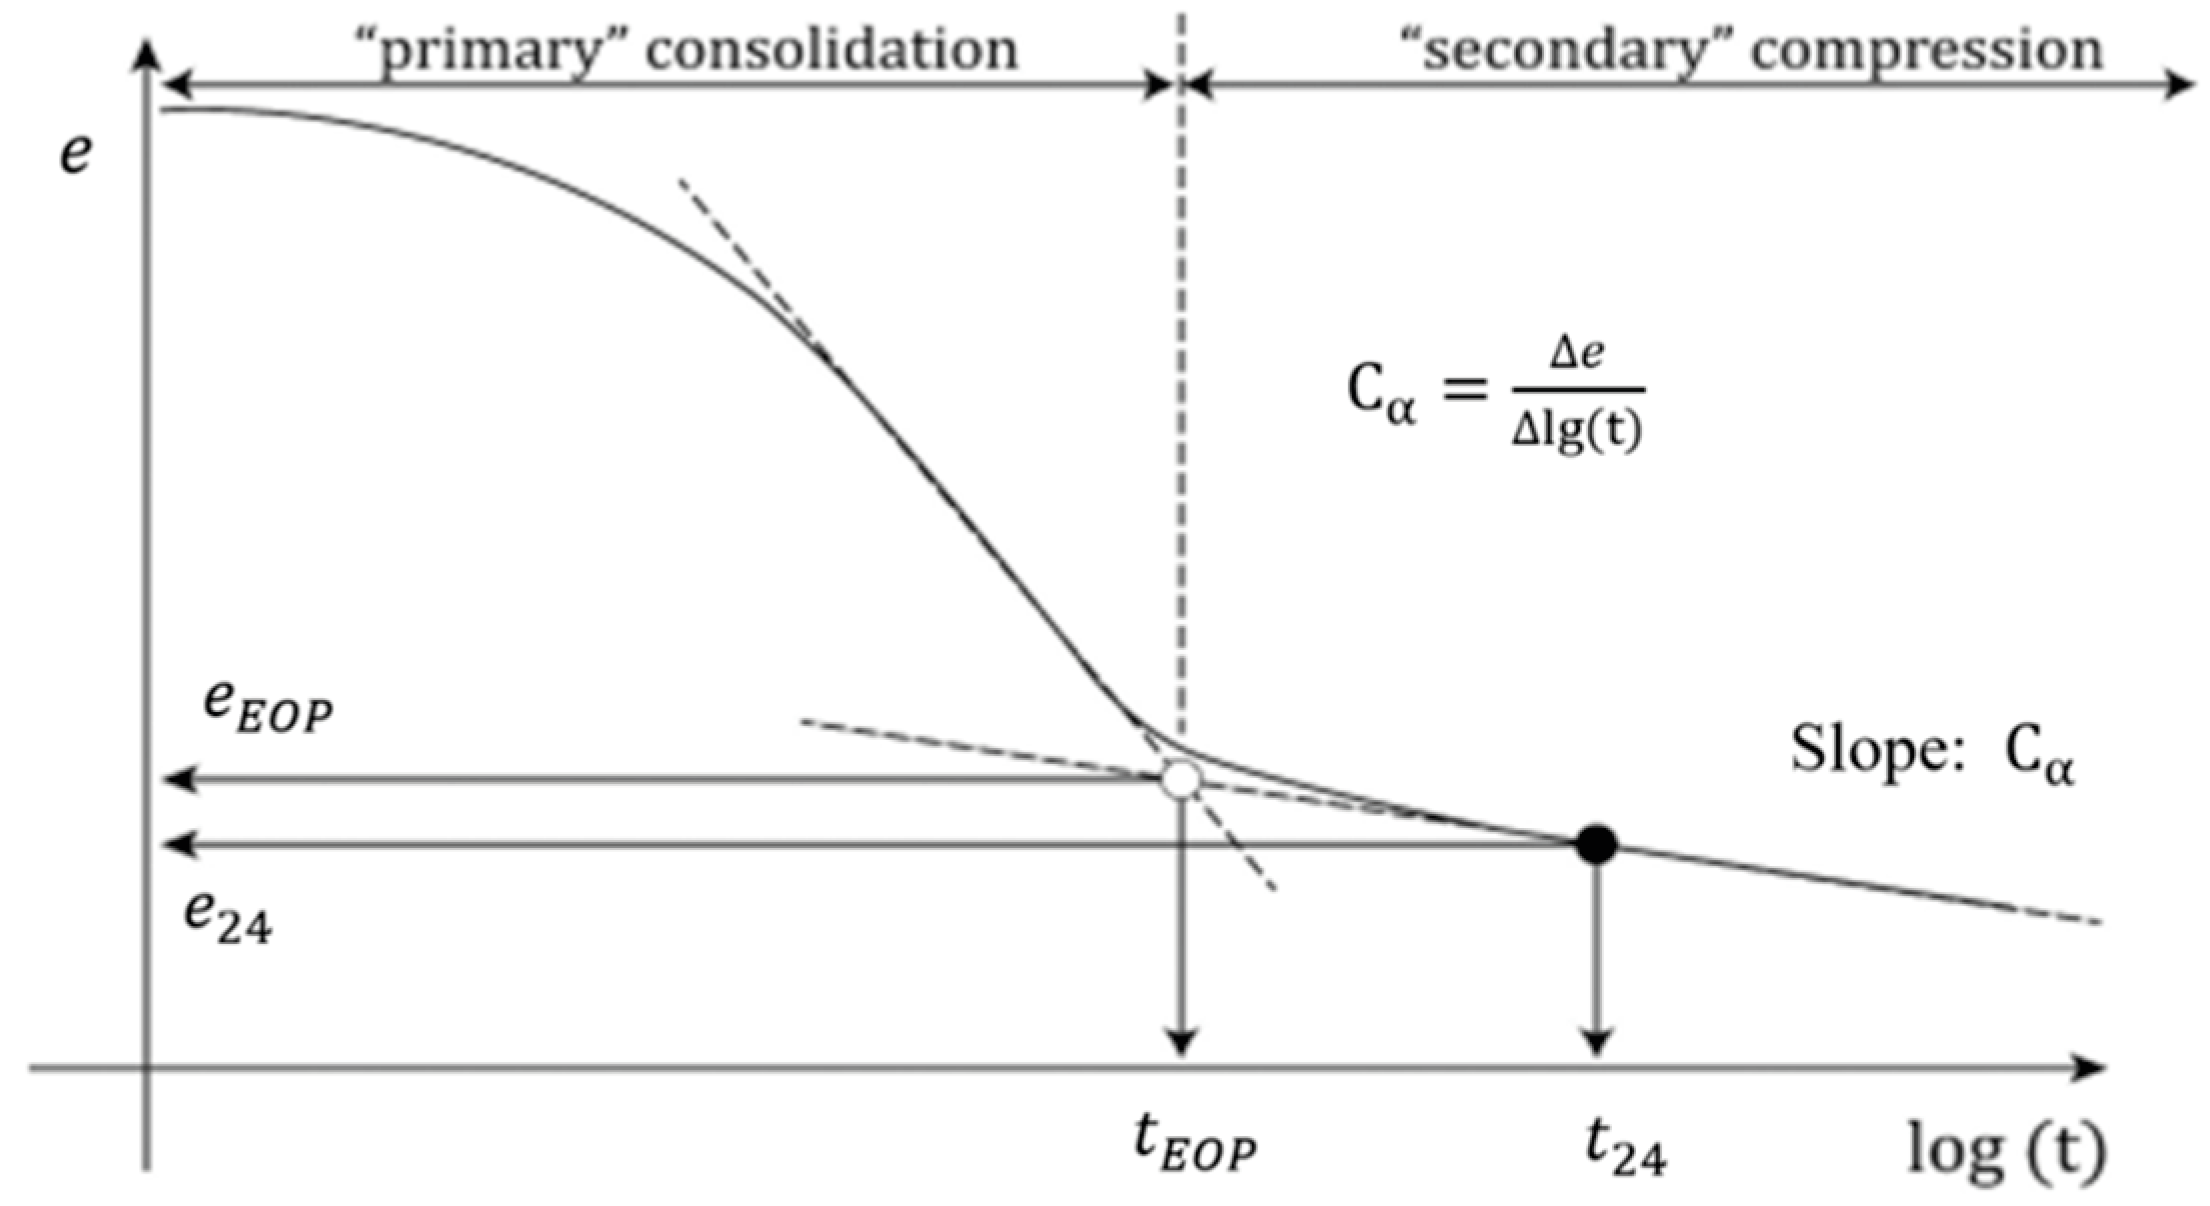
In this paper, the one-dimensional creep characteristics of Wenzhou soft soil and its solidified soil are mainly mapped by the Casagrande method, as shown in Figure 8. The secondary consolidation coefficient characterizes the time-dependent deformation of soil that continues after the dissipation of excess pore water pressure, i.e., during the secondary compression stage. It is commonly defined as the slope of the linear portion of the void ratio–logarithm of time curve in this phase, and can be expressed as:
C α = Δ e Δ log t
where Δe is the change in void ratio over the corresponding logarithmic time interval Δlogt. Physically, Cα reflects the rate of soil structure adjustment and particle rearrangement under constant effective stress after primary consolidation. Including this parameter is important for describing long-term settlement behavior, particularly in soft soils, and is therefore directly relevant to the analyses presented in this paper.

3. One-Dimensional Creep Characteristics

3.1. The Effect of Stress Level on Creep Characteristics

  • Pore ratio–time relationship
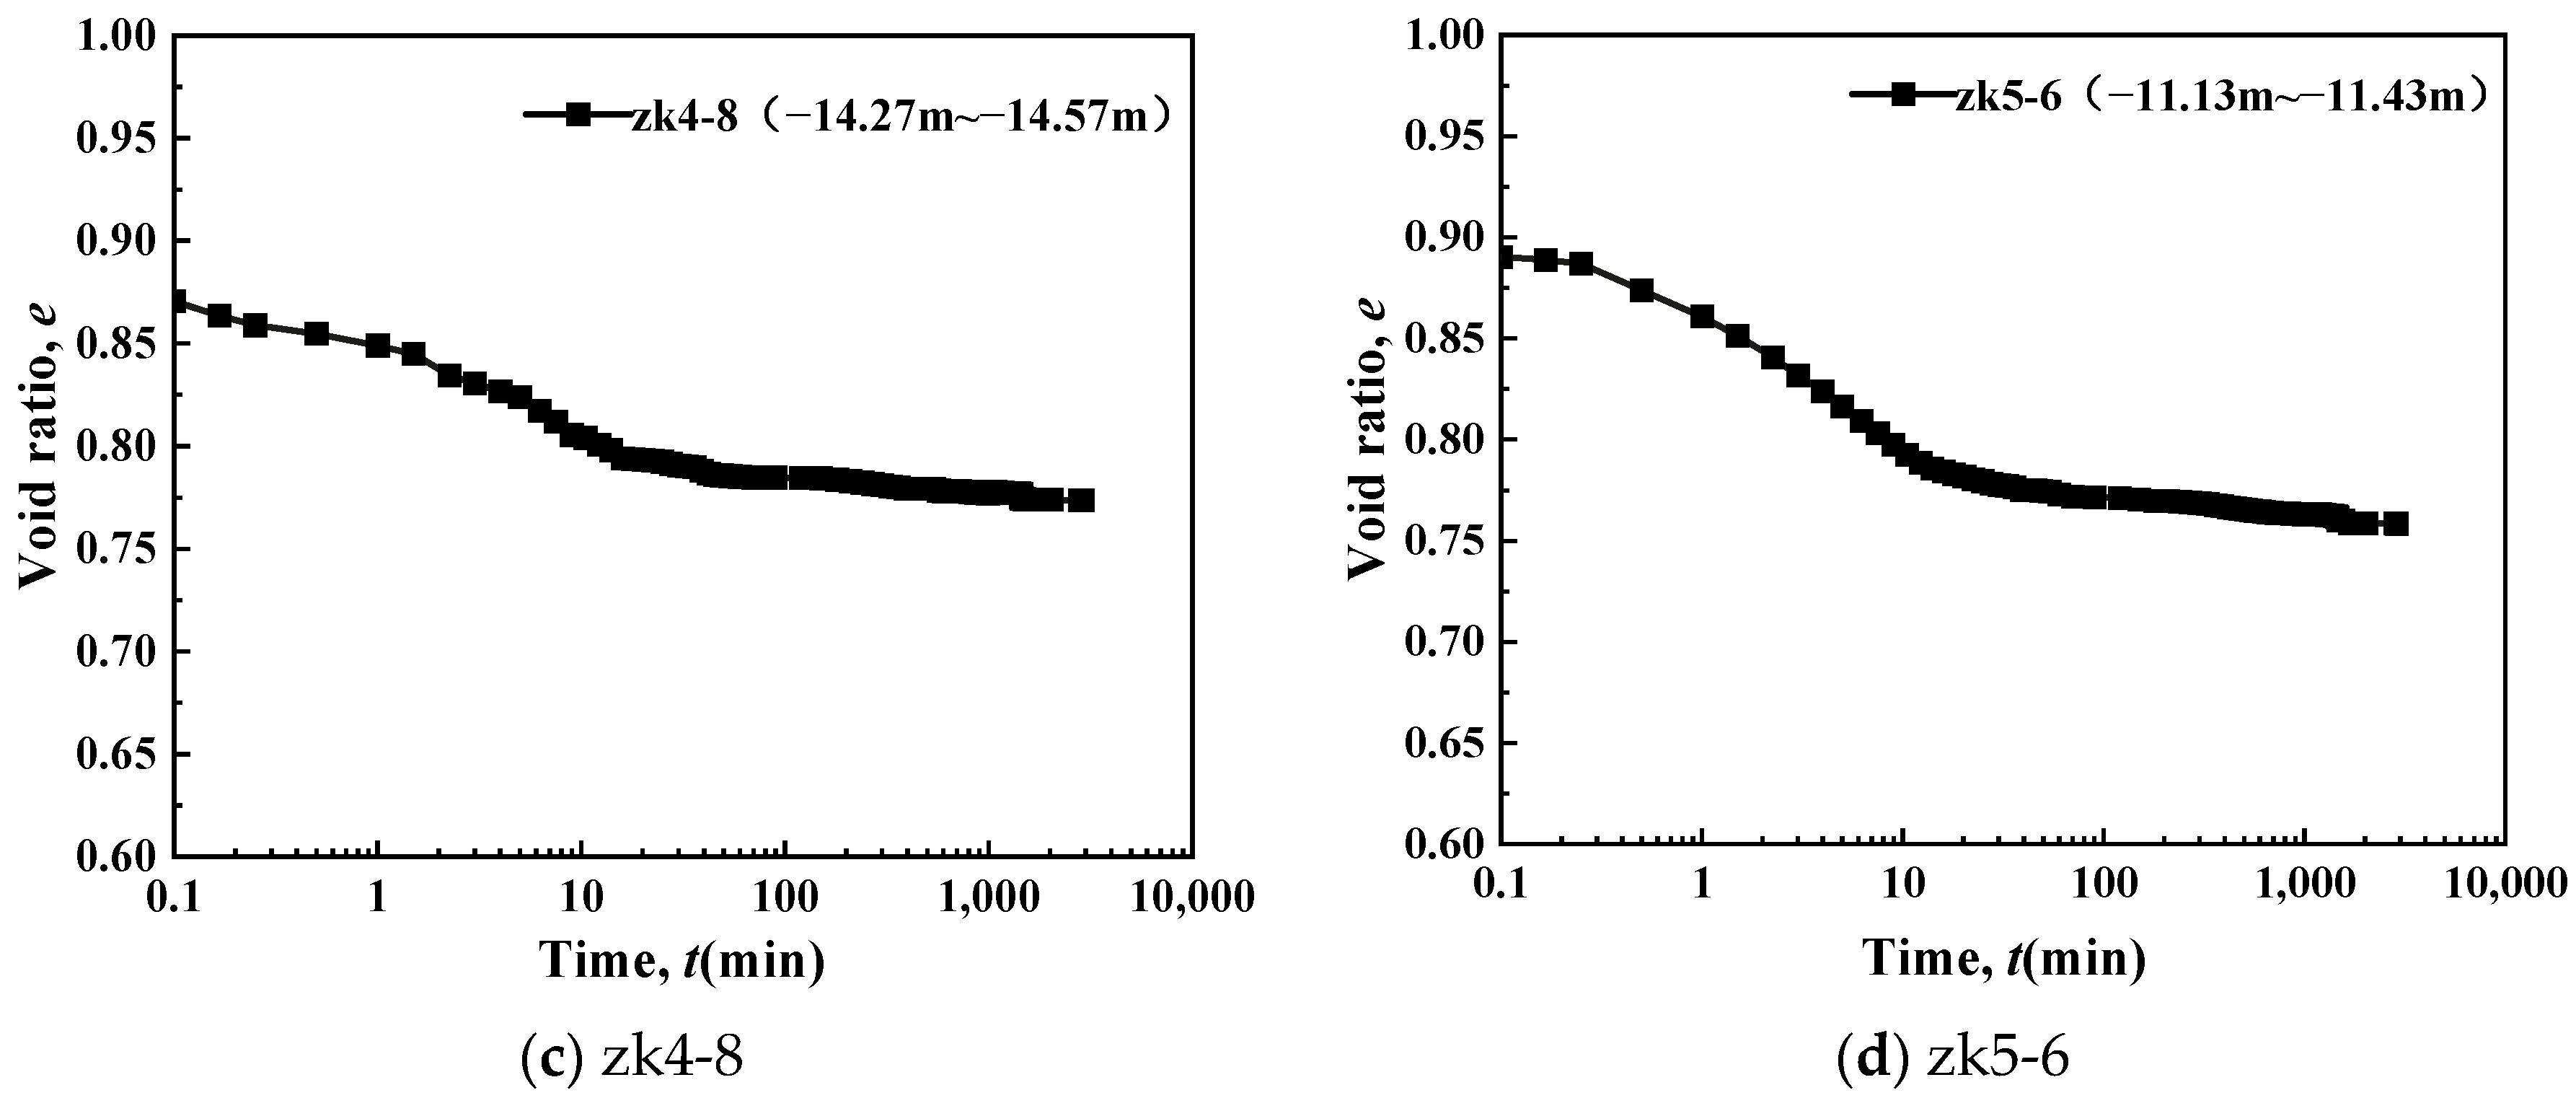
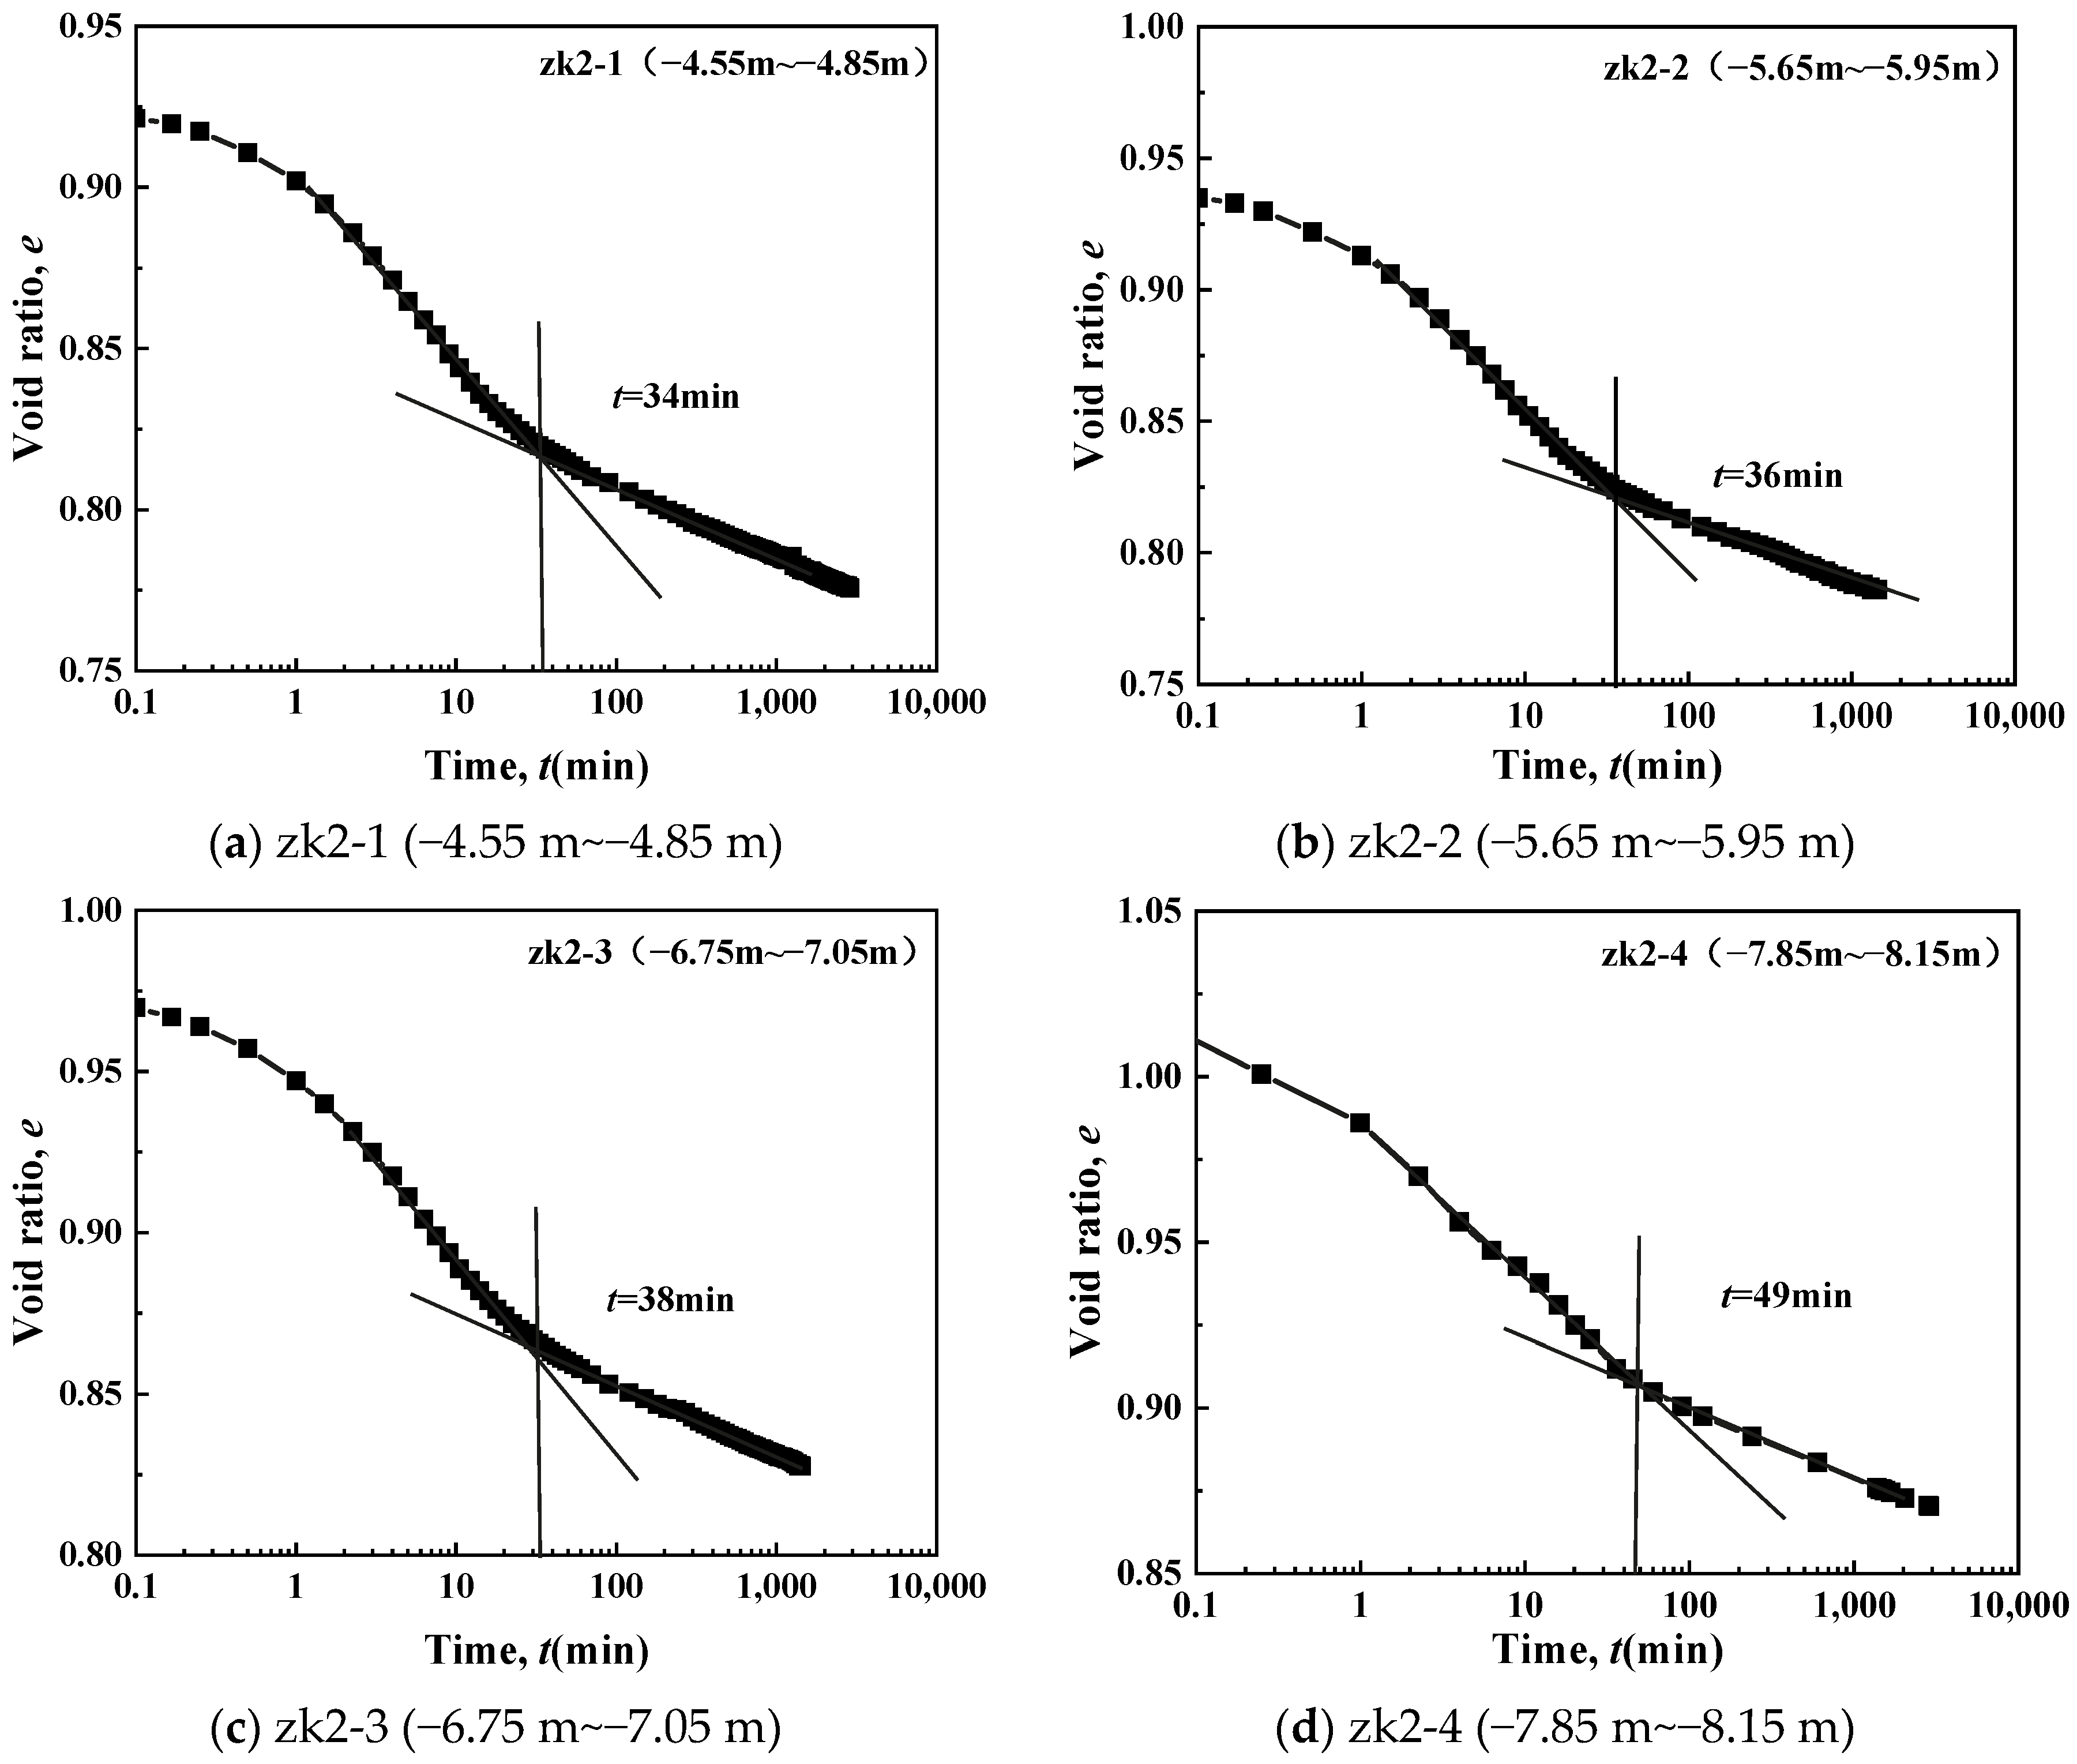
The creep tests conducted on 10 undisturbed soft soil specimens under varying stress levels revealed distinct e-log t relationships (Figure 9), showing characteristic inflection points that demarcate the secondary compression stage. Notably, at low stress levels (<100 kPa) these inflection points become less pronounced due to minimal void ratio changes that fall within the measurement resolution threshold of standard semi-logarithmic plots.
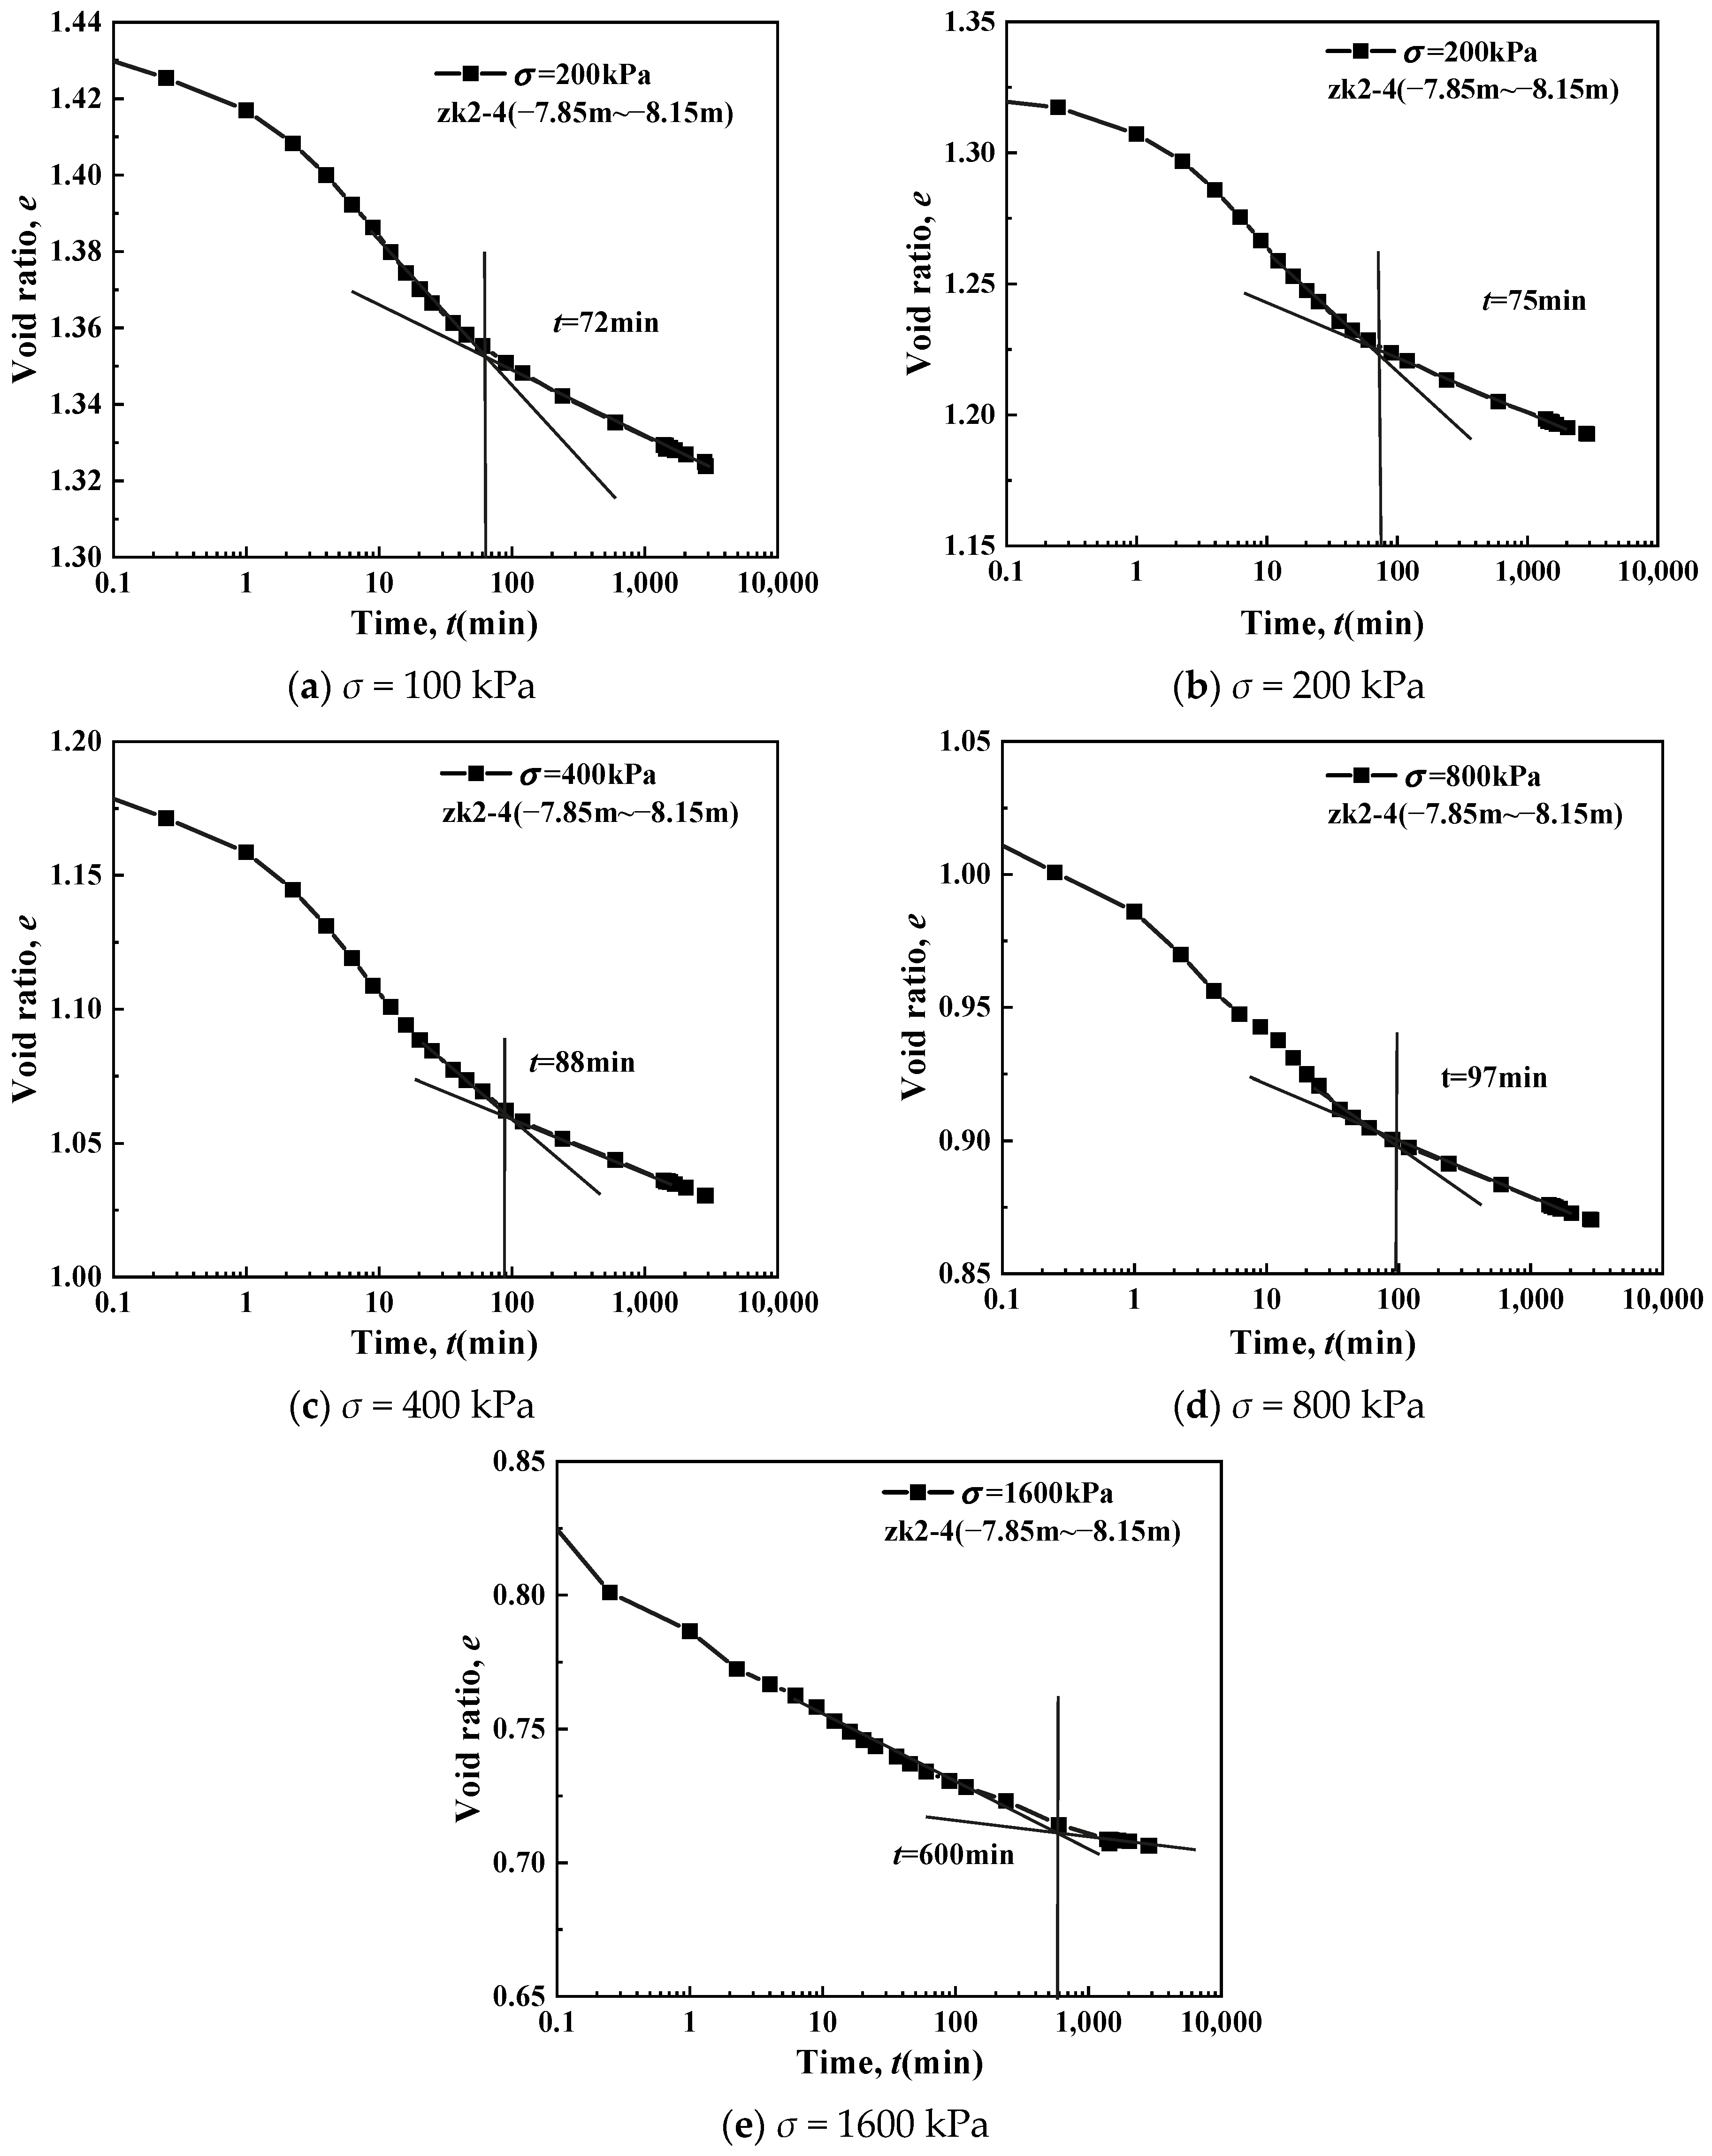
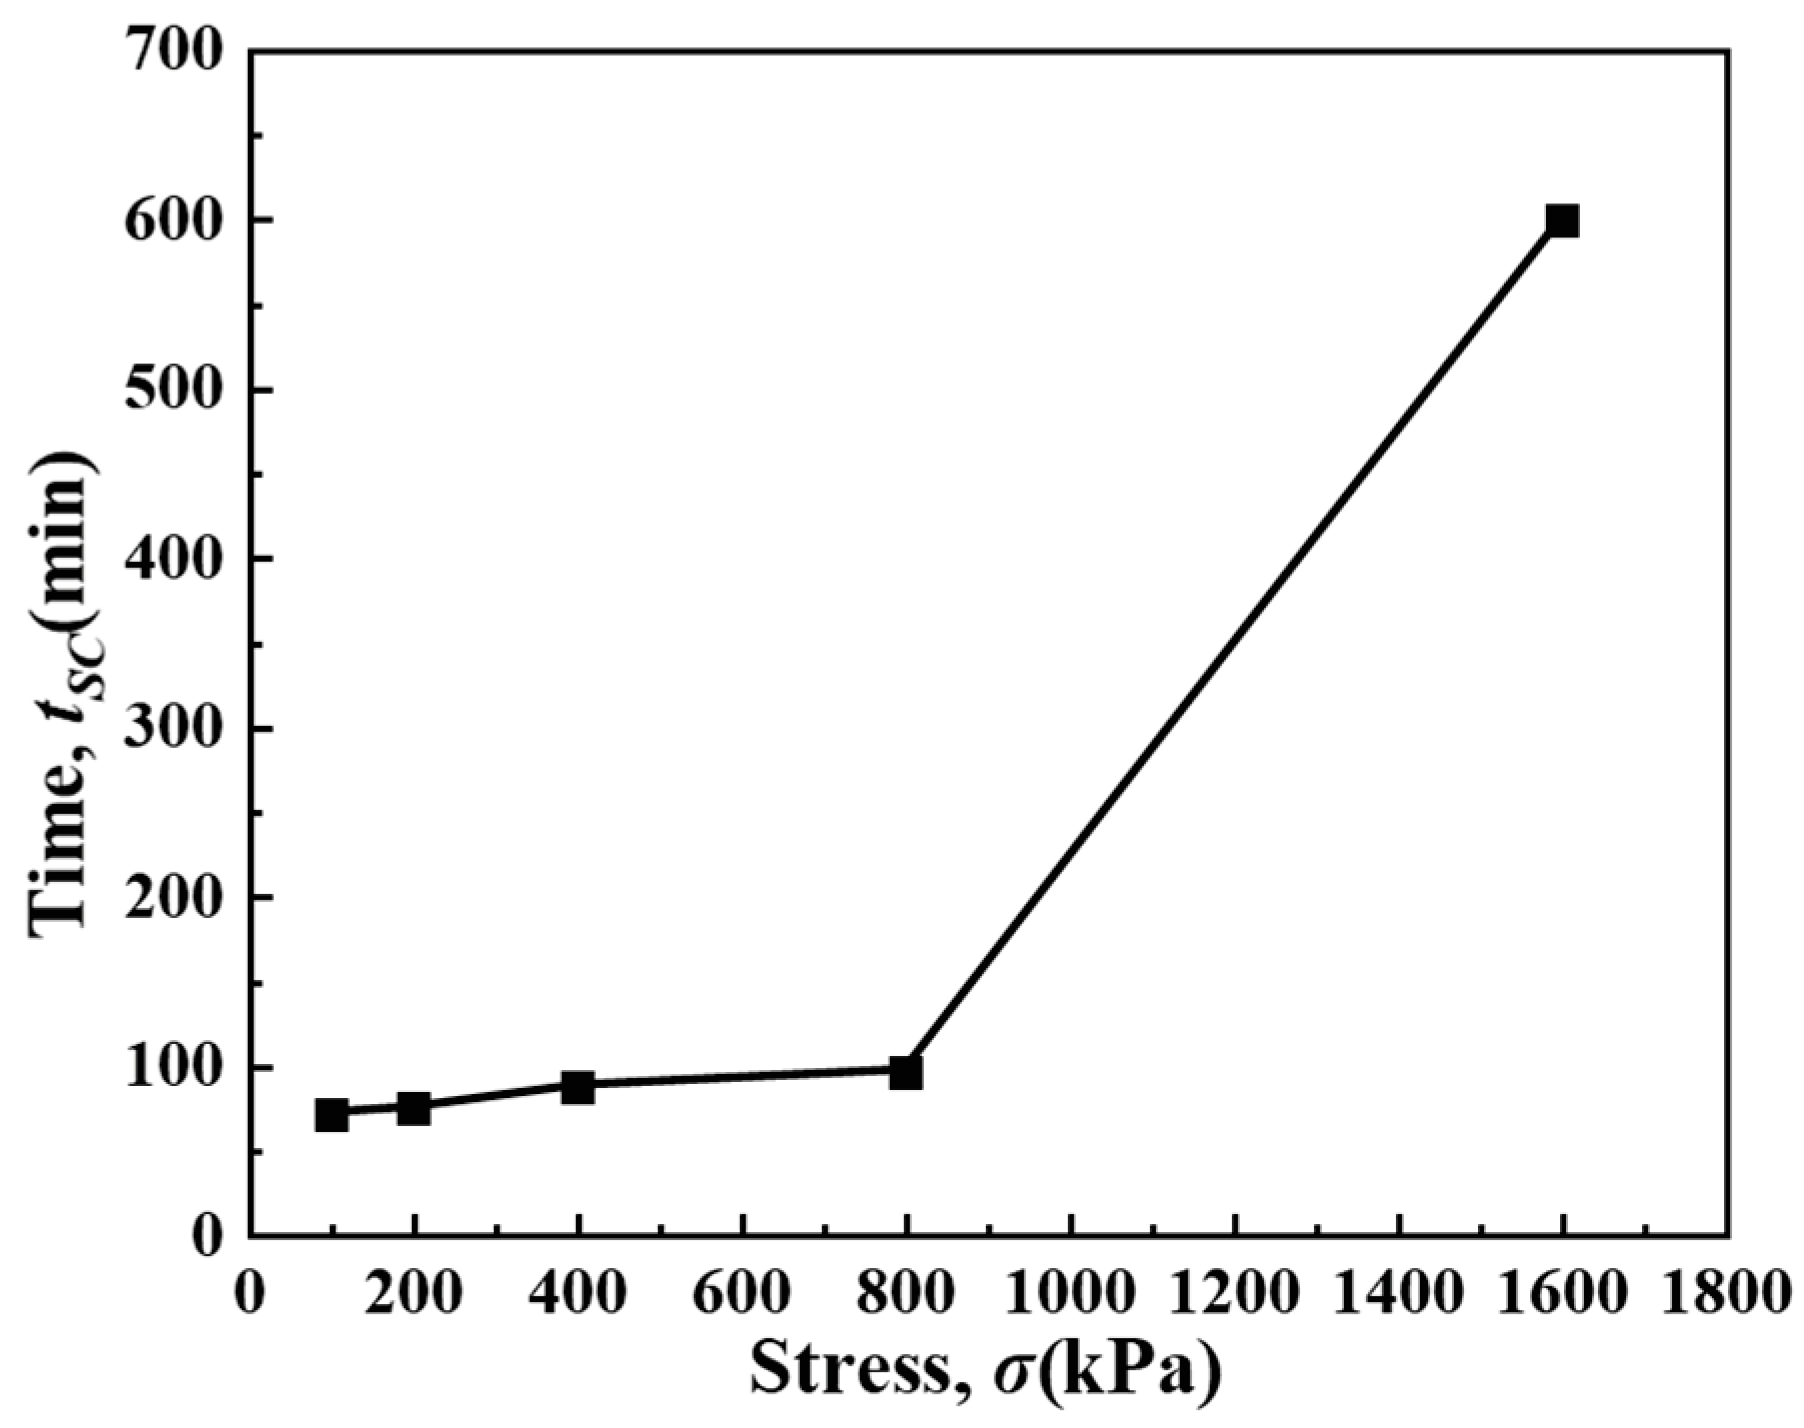
Figure 10 presents the e-log t curves of undisturbed soft soil specimen ZK2-4 (7.85–8.15 m depth) under varying vertical stresses, clearly demonstrating two key aspects of its secondary compression characteristics: (1) the primary–secondary consolidation transition point systematically shifts rightward with increasing stress levels; (2) creep deformation constitutes a progressively larger proportion of the primary consolidation phase at higher stresses, mechanistically explaining the delayed phase transition. This stress-dependent behavior reflects the growing dominance of time-dependent particle rearrangements over hydrodynamic consolidation as stress intensifies.
Figure 11 presents the e-logt curves of undisturbed soft soil sample ZK2-4 (depth: 7.85–8.15 m) under different vertical stresses, clearly demonstrating its secondary compression characteristics. The results show that the primary–secondary consolidation transition point progressively shifts rightward with increasing stress levels. Furthermore, the proportion of creep deformation during the primary consolidation phase significantly increases under higher stresses, which mechanistically explains the observed delayed phase transition.
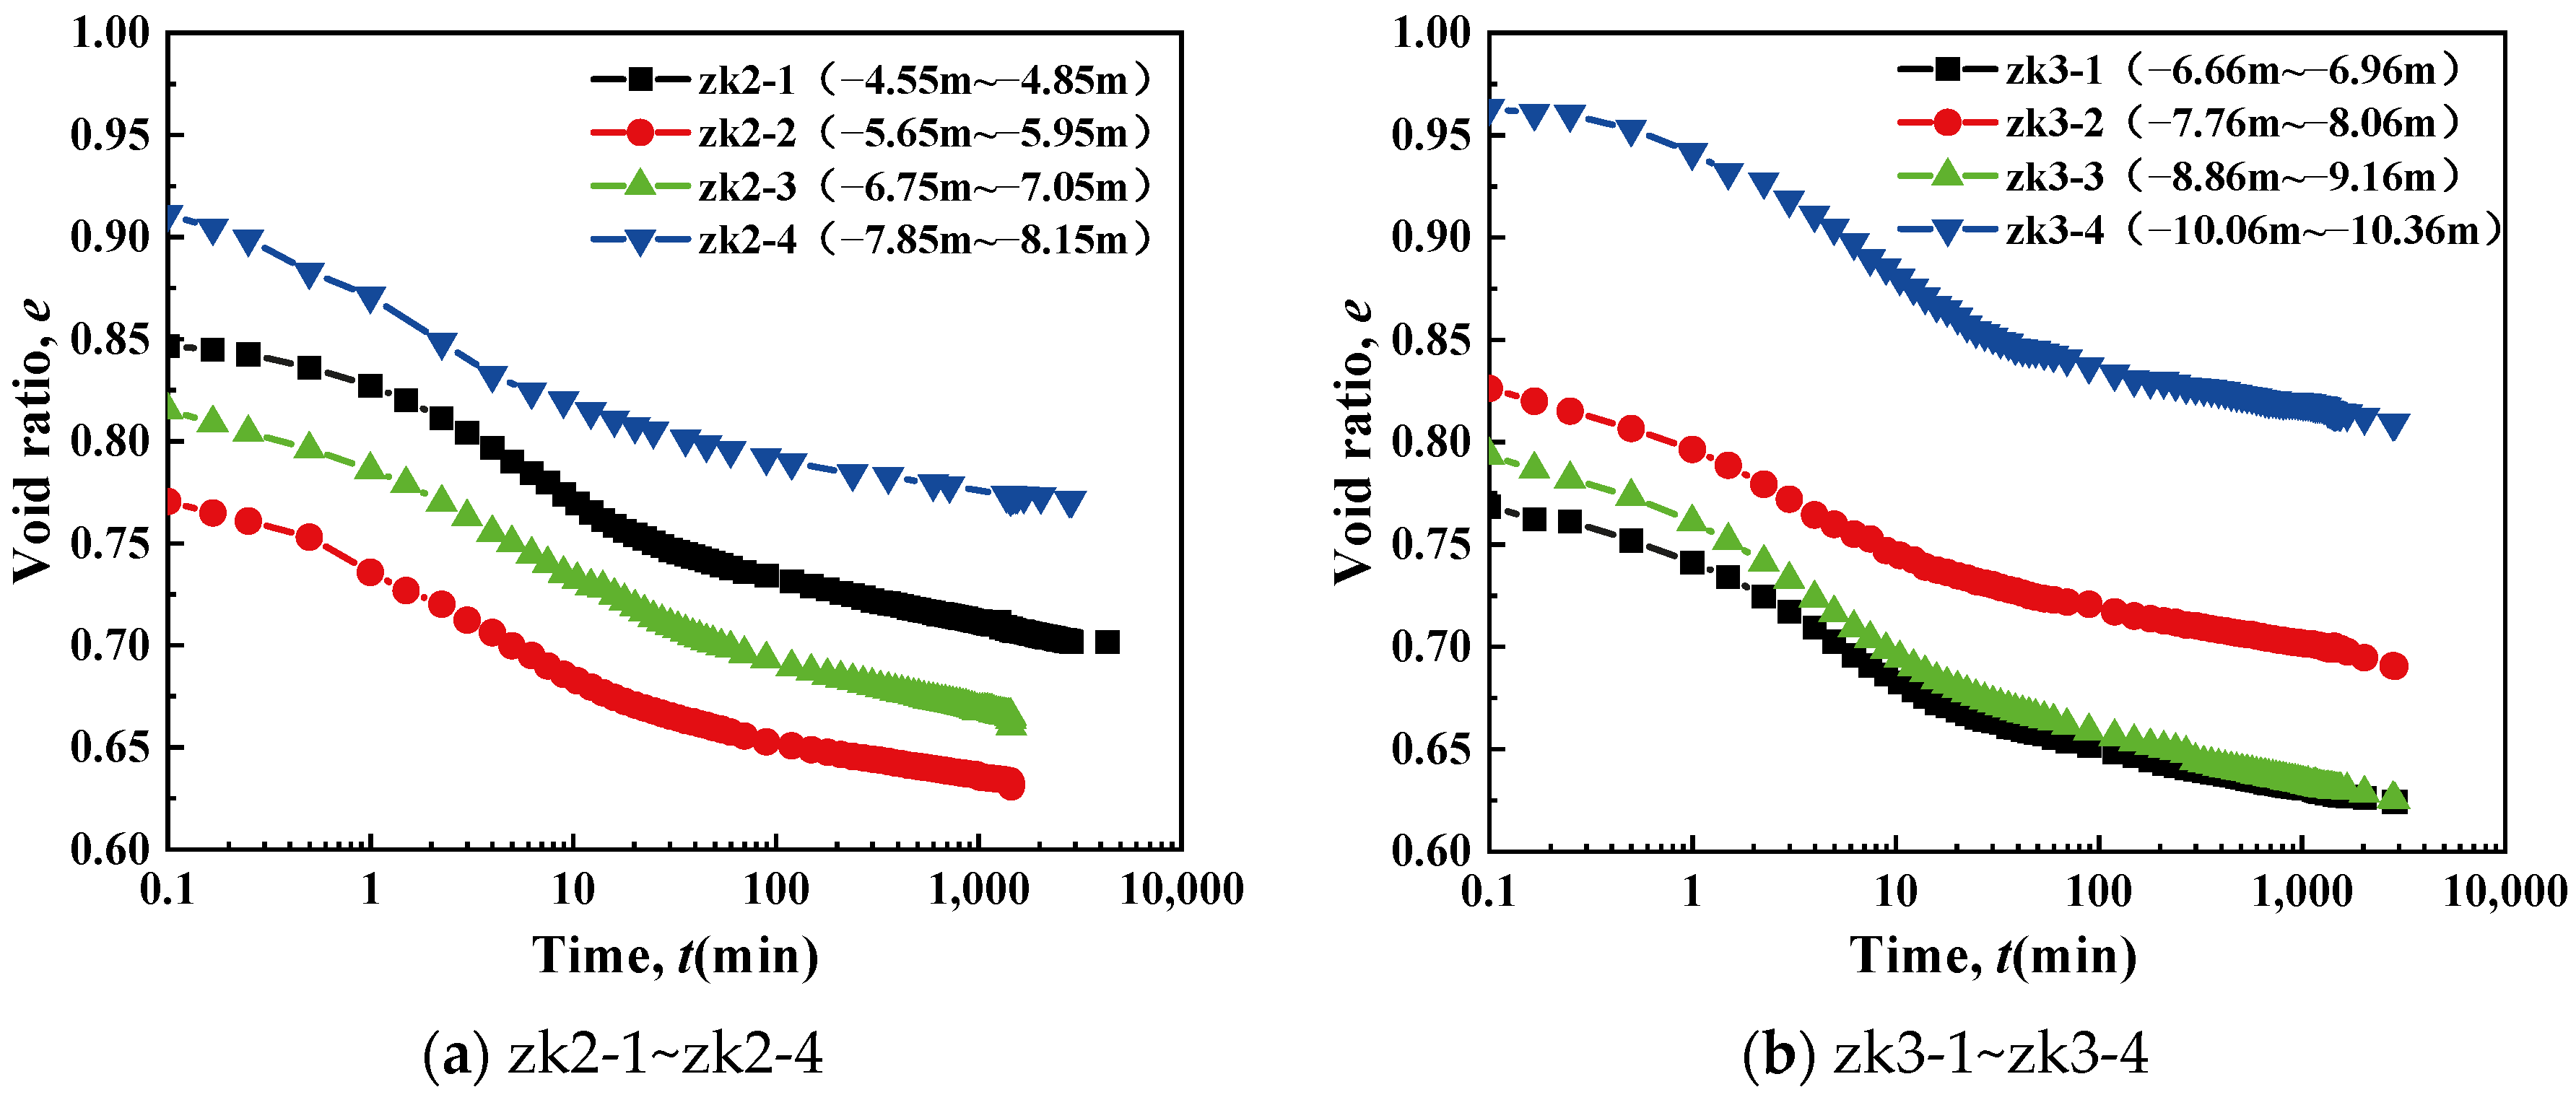
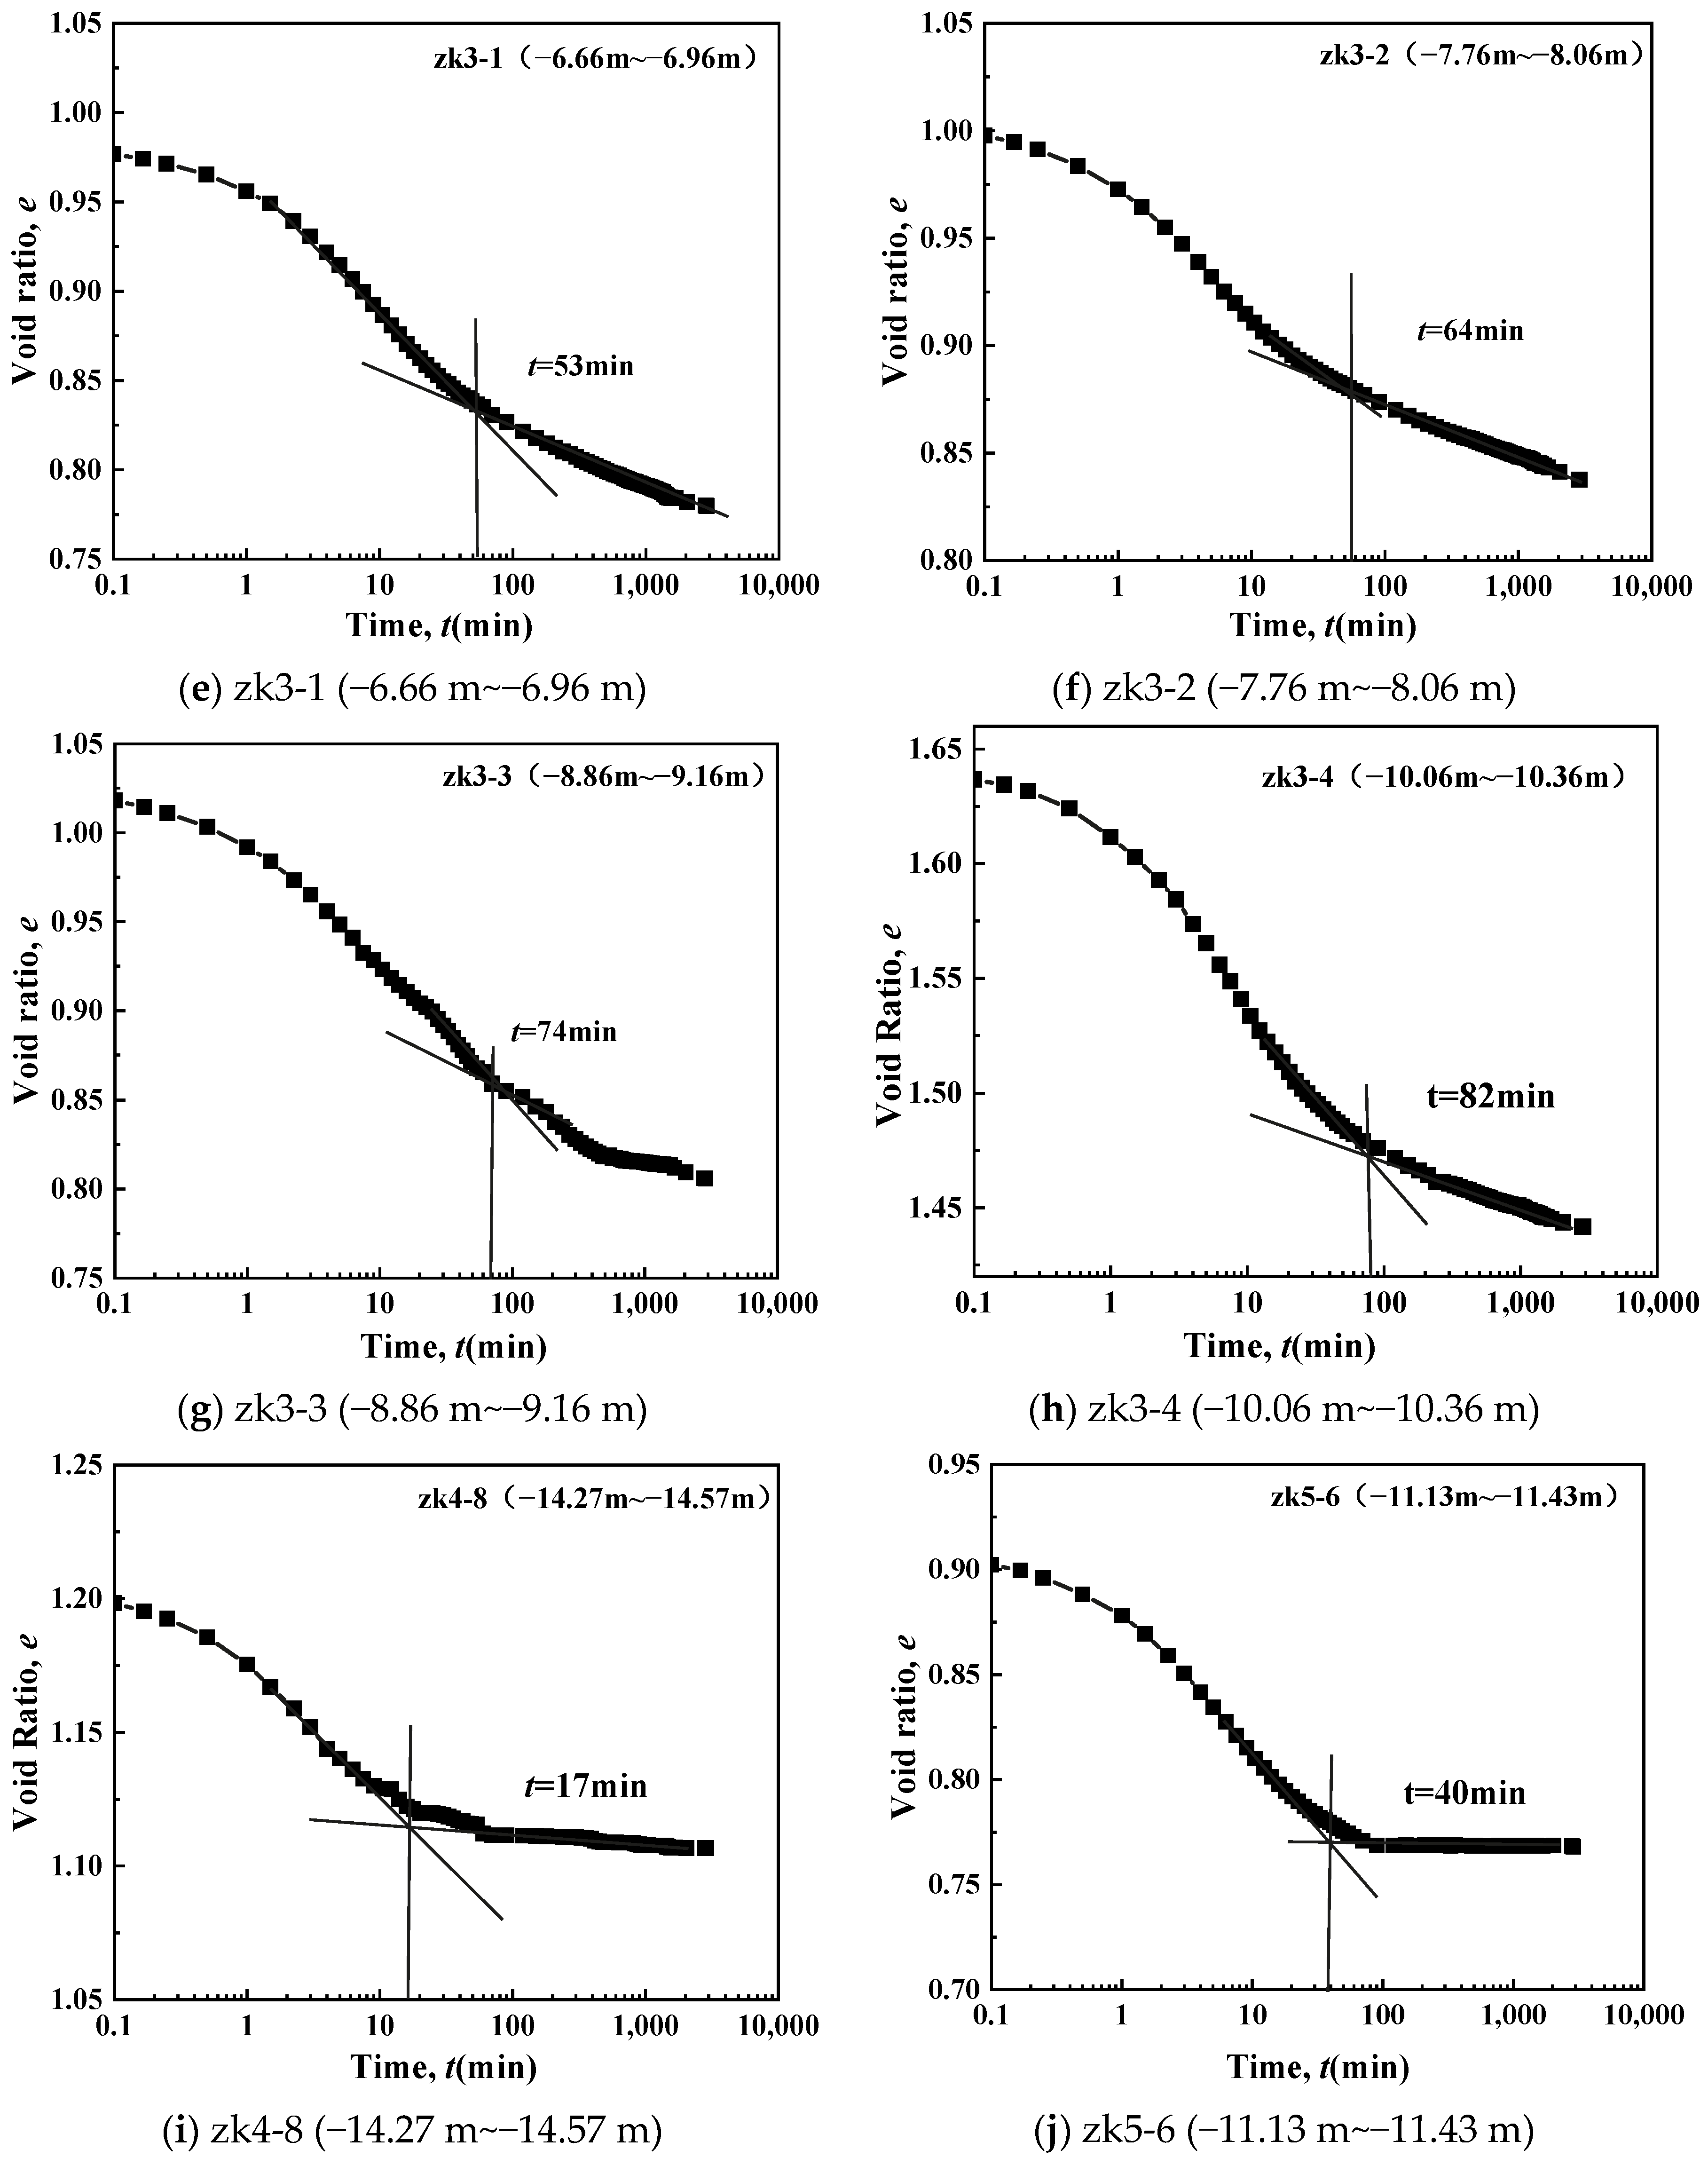
Figure 12 compares the void ratio versus time relationships for 10 undisturbed soft soil specimens under 1600 kPa stress at different sampling depths. The results demonstrate that (1) all specimens exhibited clear inflection points around 100 min, marking the transition to the secondary consolidation stage; (2) after 2 days of creep, the slopes of the secondary compression curves showed remarkable consistency across various depths, indicating depth-independent void ratio evolution under high-stress conditions.
Figure 13 presents the e-lgt curves of undisturbed soft soil under 1600 kPa consolidation pressure across all sampling depths, showing distinct inflection points that clearly separate the primary and secondary consolidation phases. The primary consolidation completion times for specimens ZK2-1 to ZK2-4 were 34, 36, 38, and 49 min, respectively, while ZK3-1 to ZK3-4 required 53, 64, 74, and 82 min. Specimens ZK4-8 and ZK5-6 exhibited shorter durations of 17 and 40 min, with all primary–secondary consolidation transitions occurring within 100 min, as clearly demonstrated in Figure 14, which shows the e-lgt relationships under 1600 kPa consolidation pressure.
Figure 14 presents the relationship between the initiation time of secondary consolidation tsc and sampling depth for undisturbed soft soil under 1600 kPa stress. The results demonstrate a clear positive correlation, where tsc increases systematically with greater sampling depth. This behavior corresponds with the previously established trend of increasing preconsolidation pressure with depth. The observed delay in secondary compression initiation may be attributed to enhanced soil compressibility associated with higher preconsolidation pressures at greater depths, suggesting that soils with stronger stress history require a longer duration to transition from the primary to secondary consolidation phase under high-stress conditions.
2.
Secondary consolidation coefficient
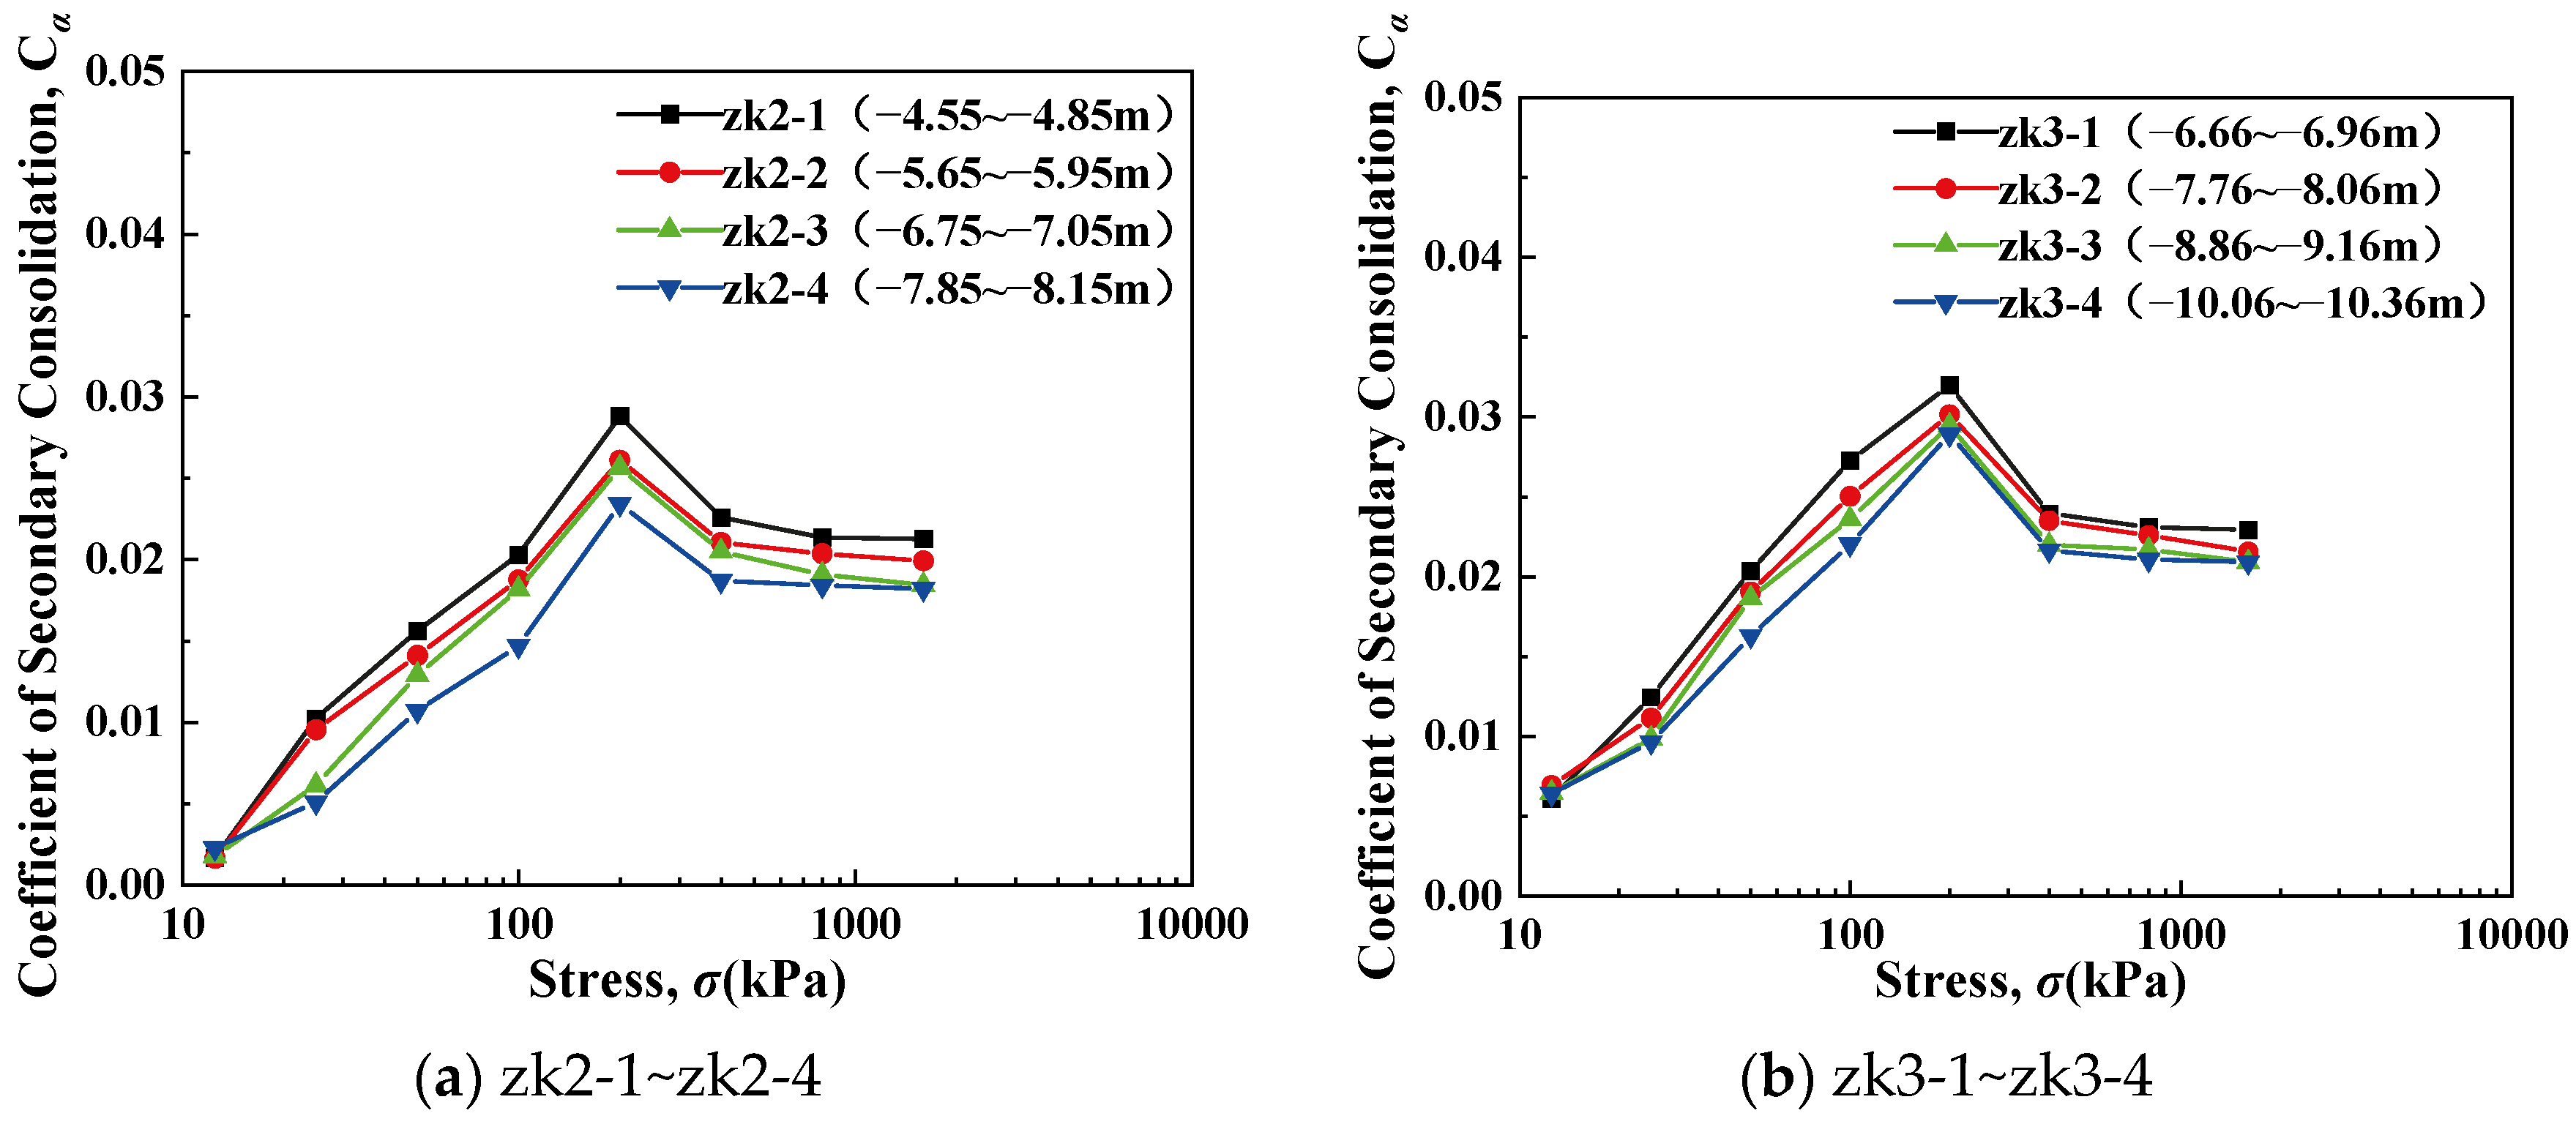
Figure 15a,b present the variation in secondary consolidation coefficient with stress levels for eight undisturbed soft soil specimens from boreholes ZK2 and ZK3. The results demonstrate that the secondary consolidation coefficient initially increases rapidly with stress, peaks at approximately 200 kPa (corresponding to 2–3 times the yield stress), and subsequently decreases before stabilizing. Notably, unlike reconstituted specimens whose secondary consolidation coefficient typically peaks near the preconsolidation pressure, the undisturbed soft soil exhibits this characteristic peak at significantly higher stress levels, revealing its distinct structural behavior.
The undisturbed soft soil demonstrates a peak secondary consolidation coefficient reaching 0.03, with stabilized values ranging between 0.019 and 0.026, approximately 5 times greater than that of reconstituted specimens. This significant discrepancy primarily results from the undisturbed soil’s higher initial void ratio and more open, metastable fabric structure. Experimental data further reveal a consistent decrease in the secondary consolidation coefficient with increasing sampling depth, showing an approximately fifteen to twenty percent reduction per five meter depth increment due to enhanced soil fabric stability under greater overburden pressure.

3.2. Effect of Time on Creep Characteristics

1.
Stress–strain relationship
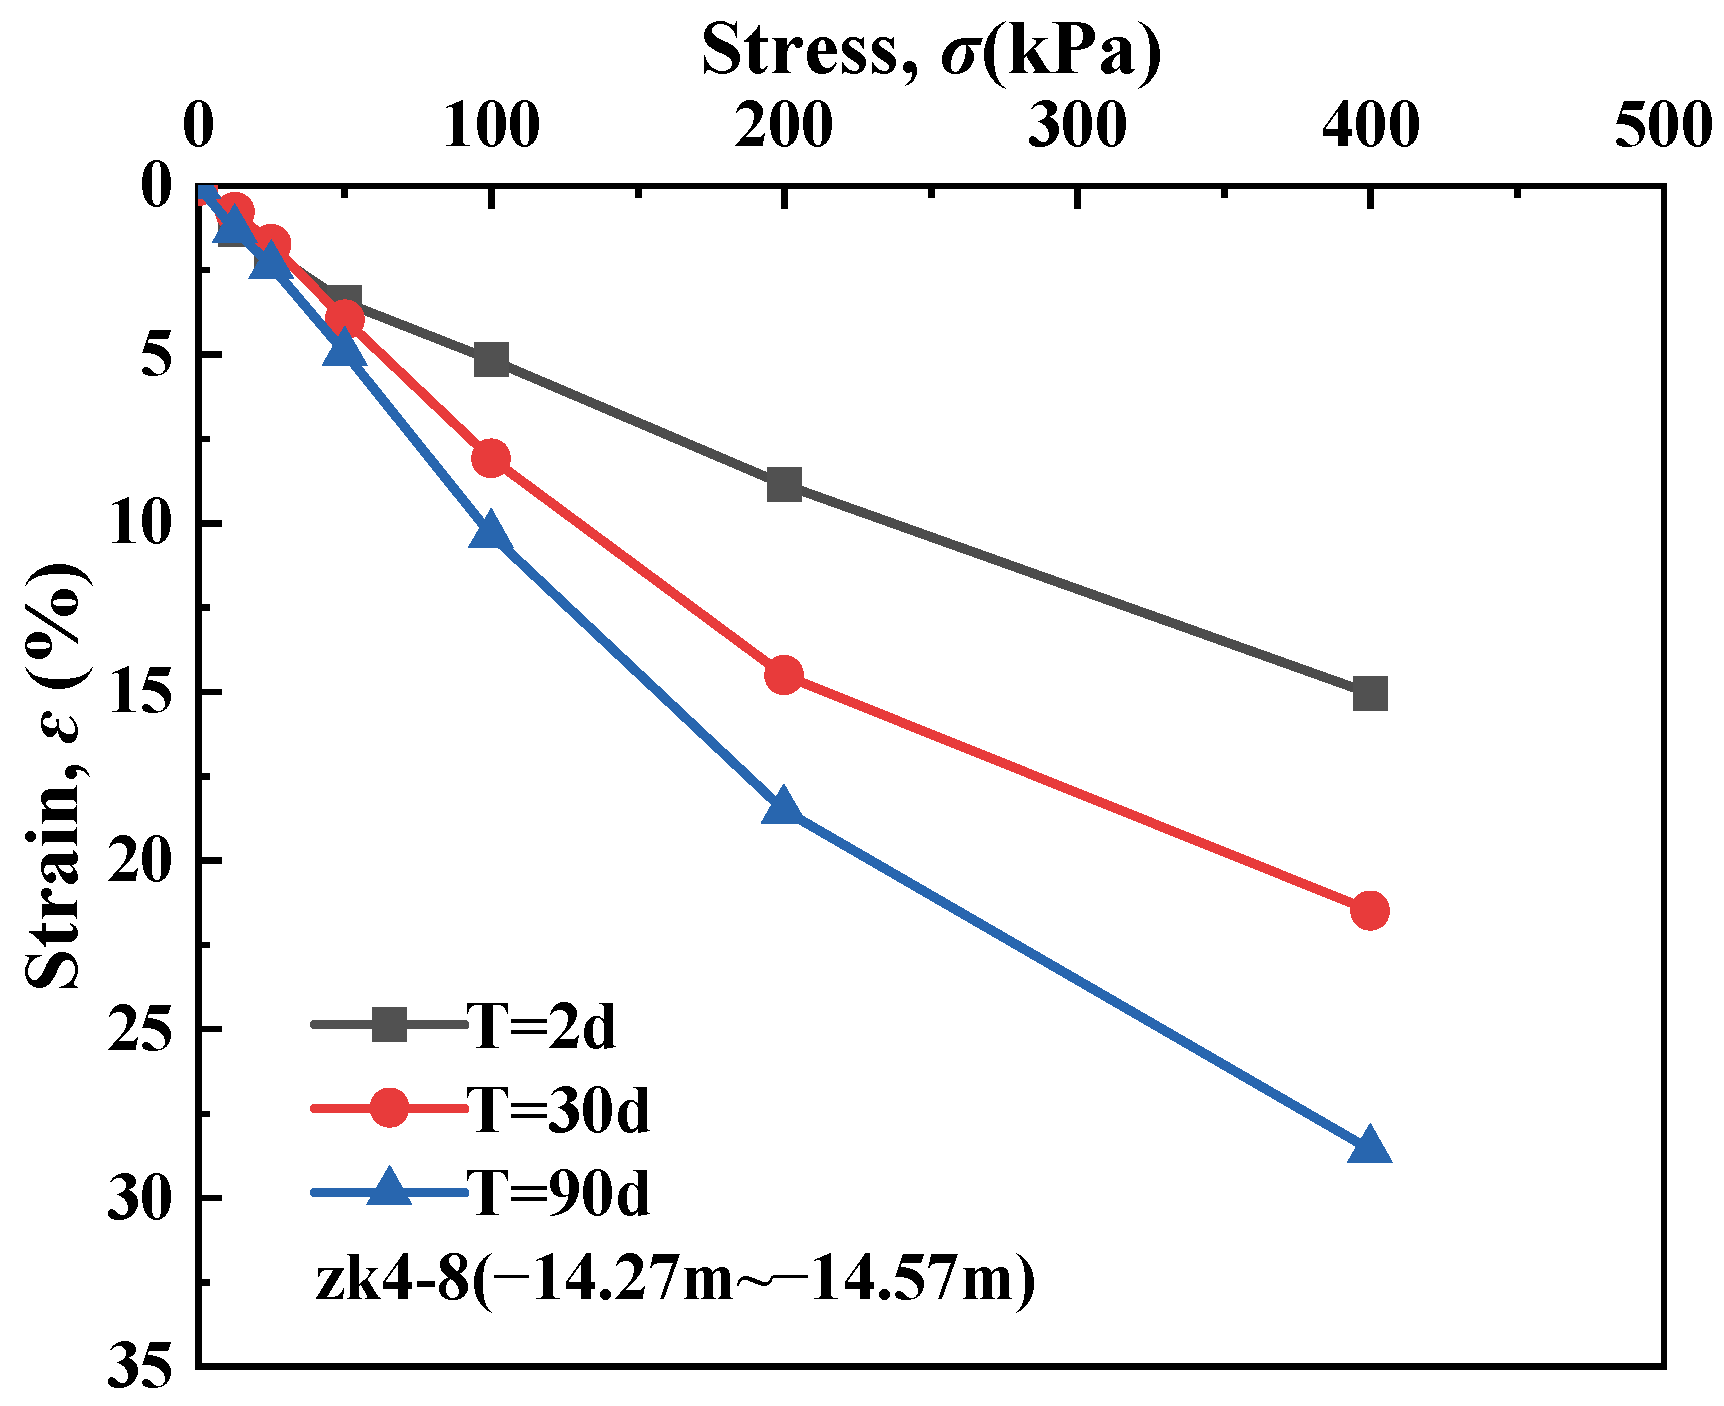
Figure 16 presents the stress–strain relationships of undisturbed soft soil specimens zk4-8 (−14.27~−14.57 m) over different time durations (2, 30, and 90 days). The results demonstrate significant time-dependent deformation accumulation: at 100 kPa, axial strains increase from 5.155% to 8.085% and 10.345%, while at 400 kPa, strains progress from 15.055% to 21.505% and 28.595%. Notably, higher stress levels amplify the strain increment rate, confirming that time-dependent pore structure evolution accelerates under greater stresses.
2.
Pore ratio–time relationship
Figure 17 presents the e-lgt relationships of undisturbed soft soil at various depths over different loading durations, revealing three critical findings: (1) At 400 kPa, the e-lgt curves essentially overlap across depths, whereas significant divergence occurs at 1600 kPa, demonstrating stress-accelerated creep effects. (2) The zk2-1 specimen (shallowest depth) exhibits clear secondary compression initiation after 100 min in 30-day tests (Figure 17b), with earlier phase transition observed in shallower samples. (3) Extended loading to 90 days (Figure 17c) reveals four-stage behavior—instantaneous deformation (Stage I), primary consolidation (Stage II), secondary compression with progressively increasing rates (Stage III), and accelerated creep (Stage IV)—confirming that prolonged loading ultimately reactivates creep acceleration through structural degradation.
3.
Secondary consolidation coefficient
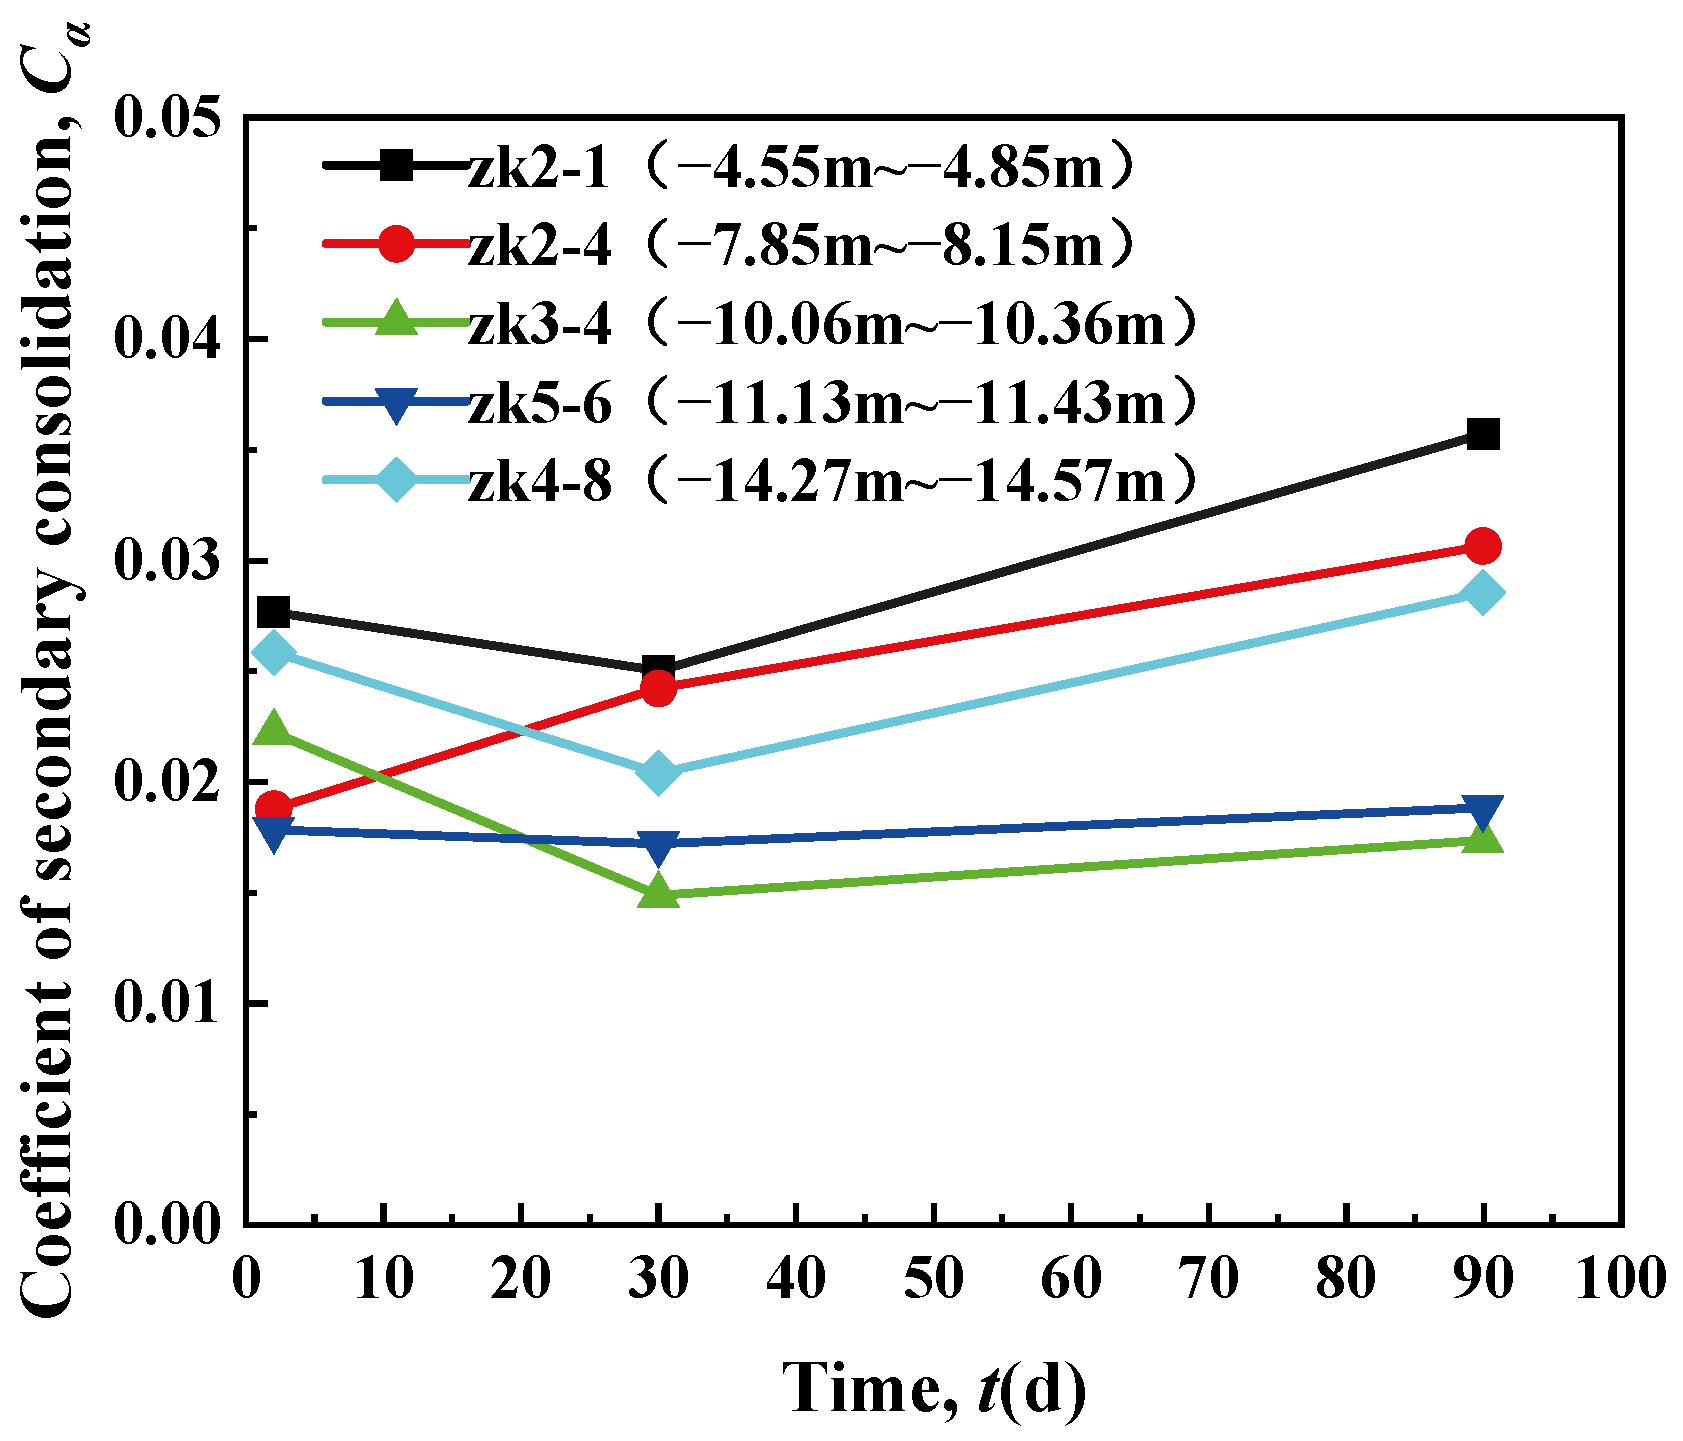
Figure 18 shows the relationship between the secondary consolidation coefficient and time for undisturbed soft soil. During the initial 2 to 30 days, the secondary consolidation coefficient remains relatively stable, fluctuating between 0.015 and 0.028, likely due to sampling disturbance effects across different depths. From 30 to 90 days, the coefficient exhibits a marked increase, ranging from 0.015 to 0.035, demonstrating time-dependent behavior consistent with observations in remolded soft soil. Furthermore, the secondary consolidation coefficient generally decreases with increasing sampling depth at all time intervals, highlighting the influence of overburden pressure on long-term soil deformation.

3.3. Stress–Strain Isochronous Relationship Curve

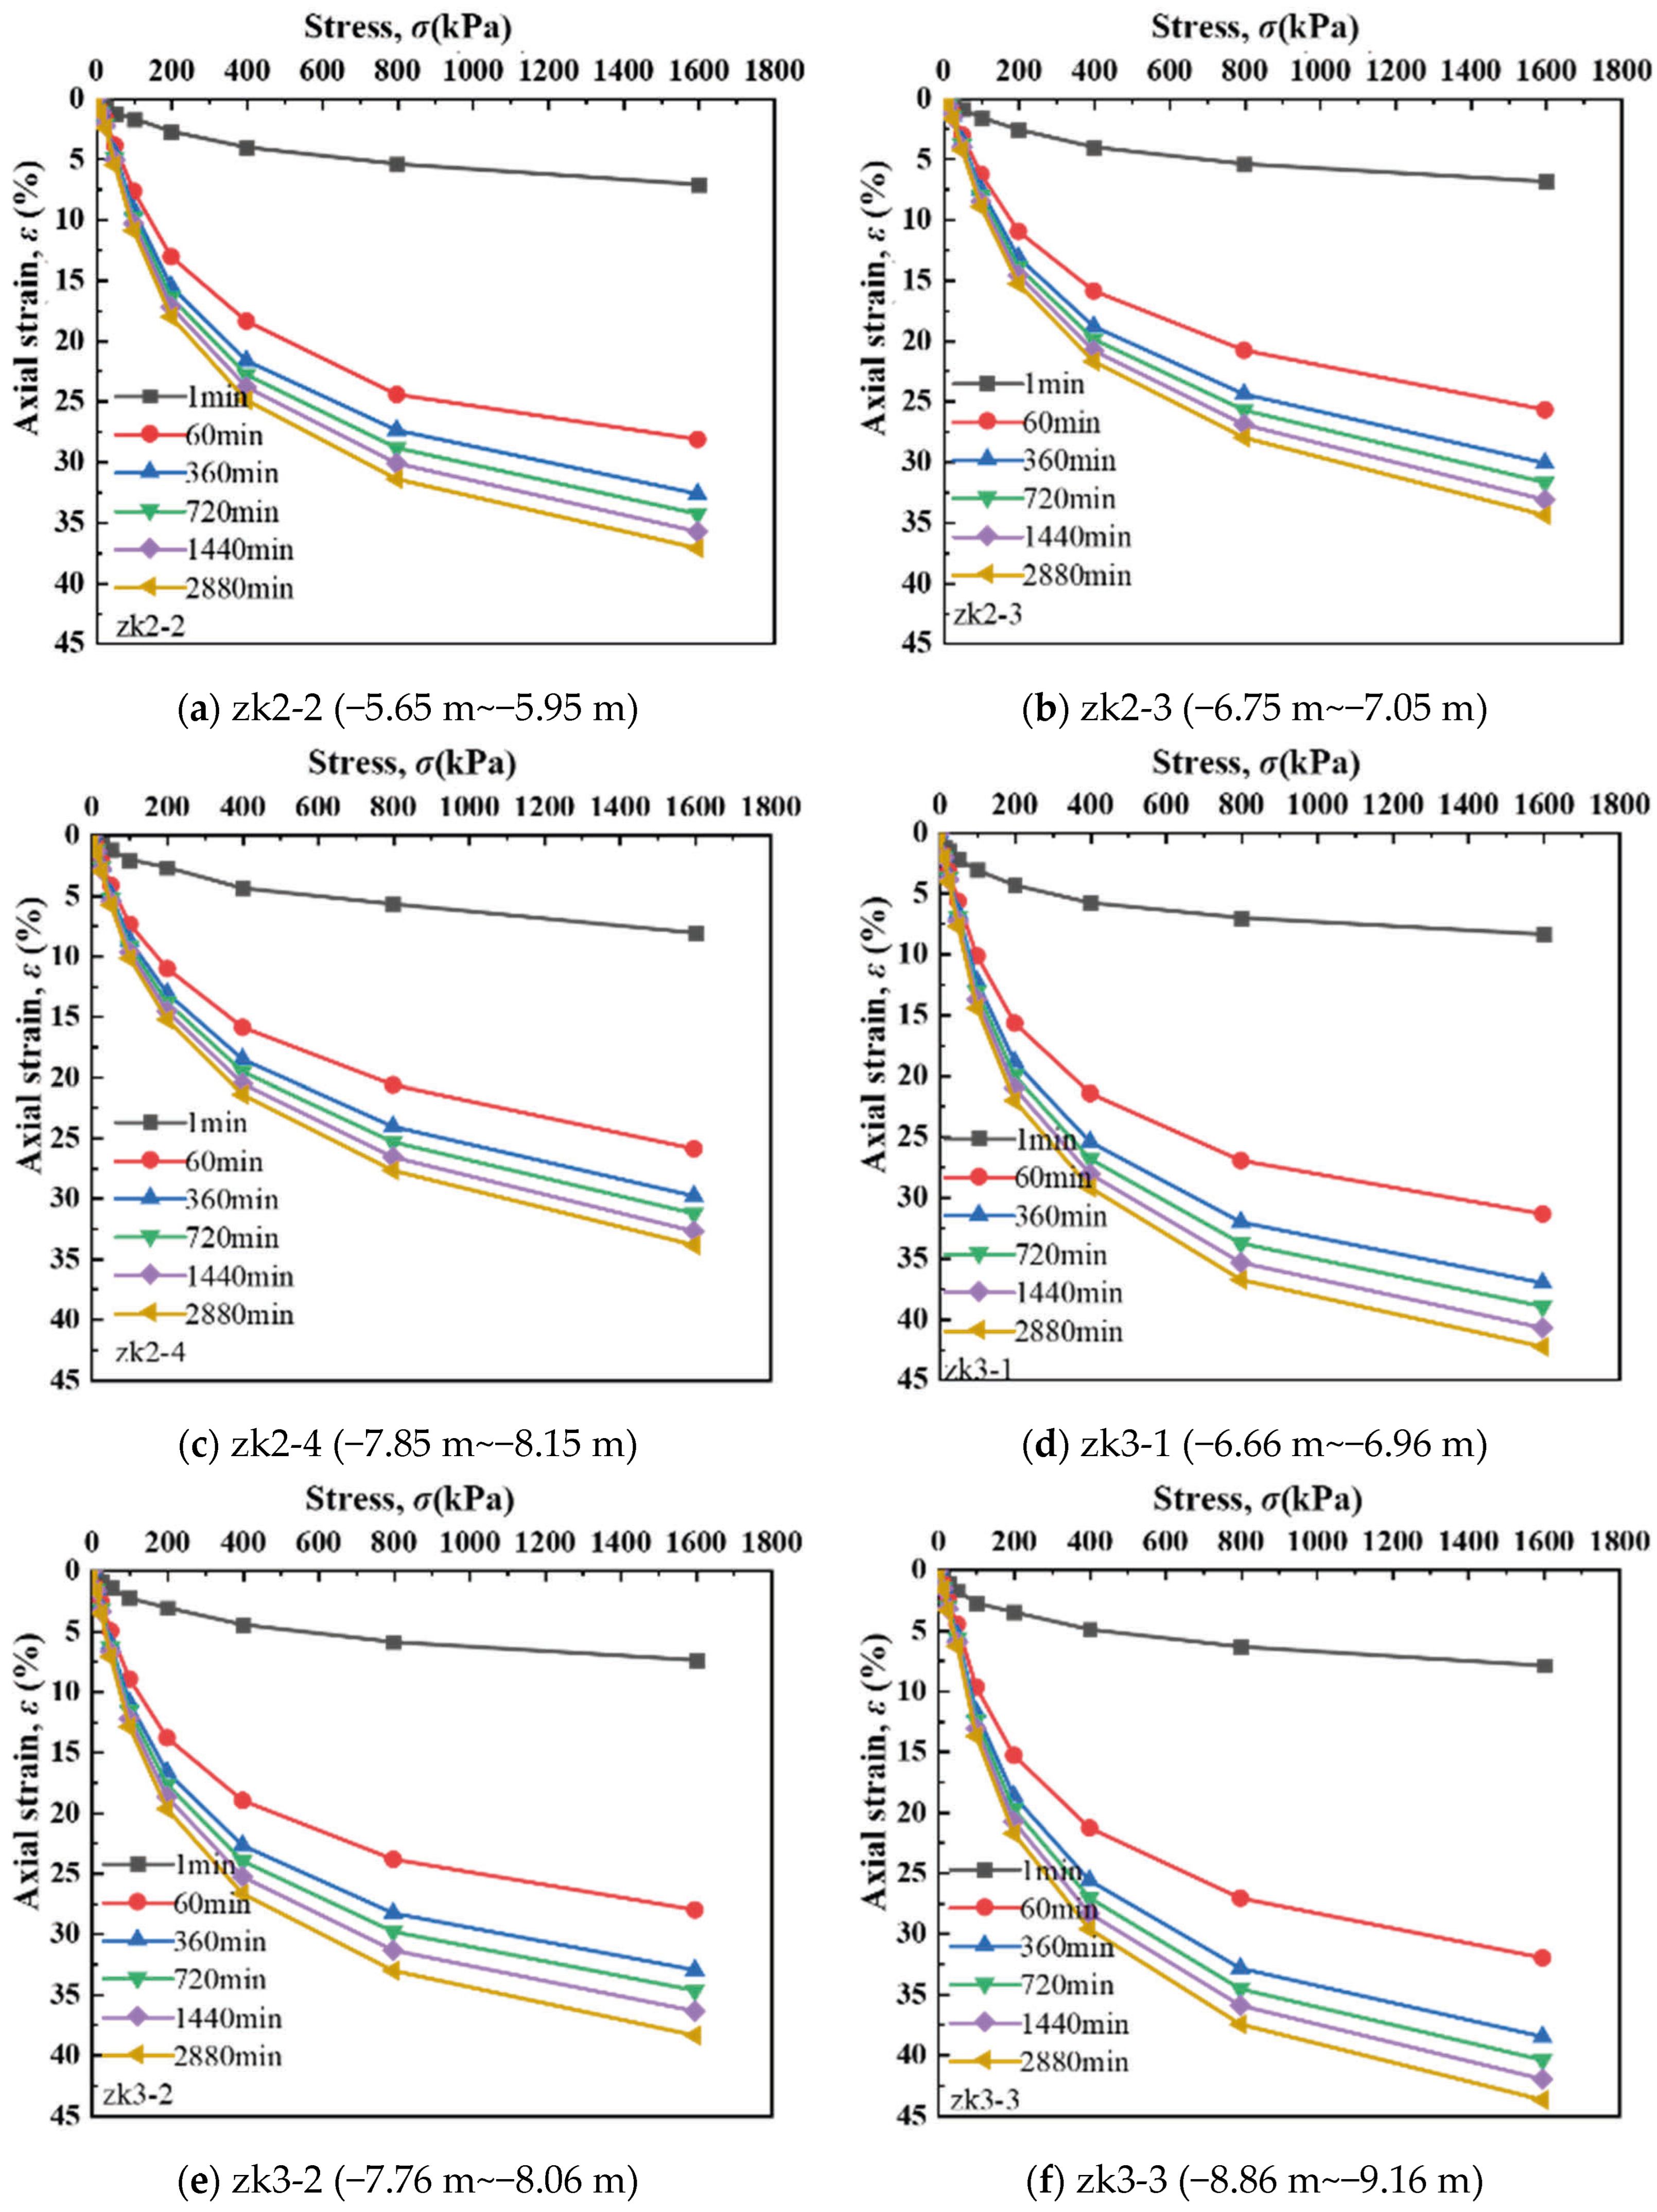
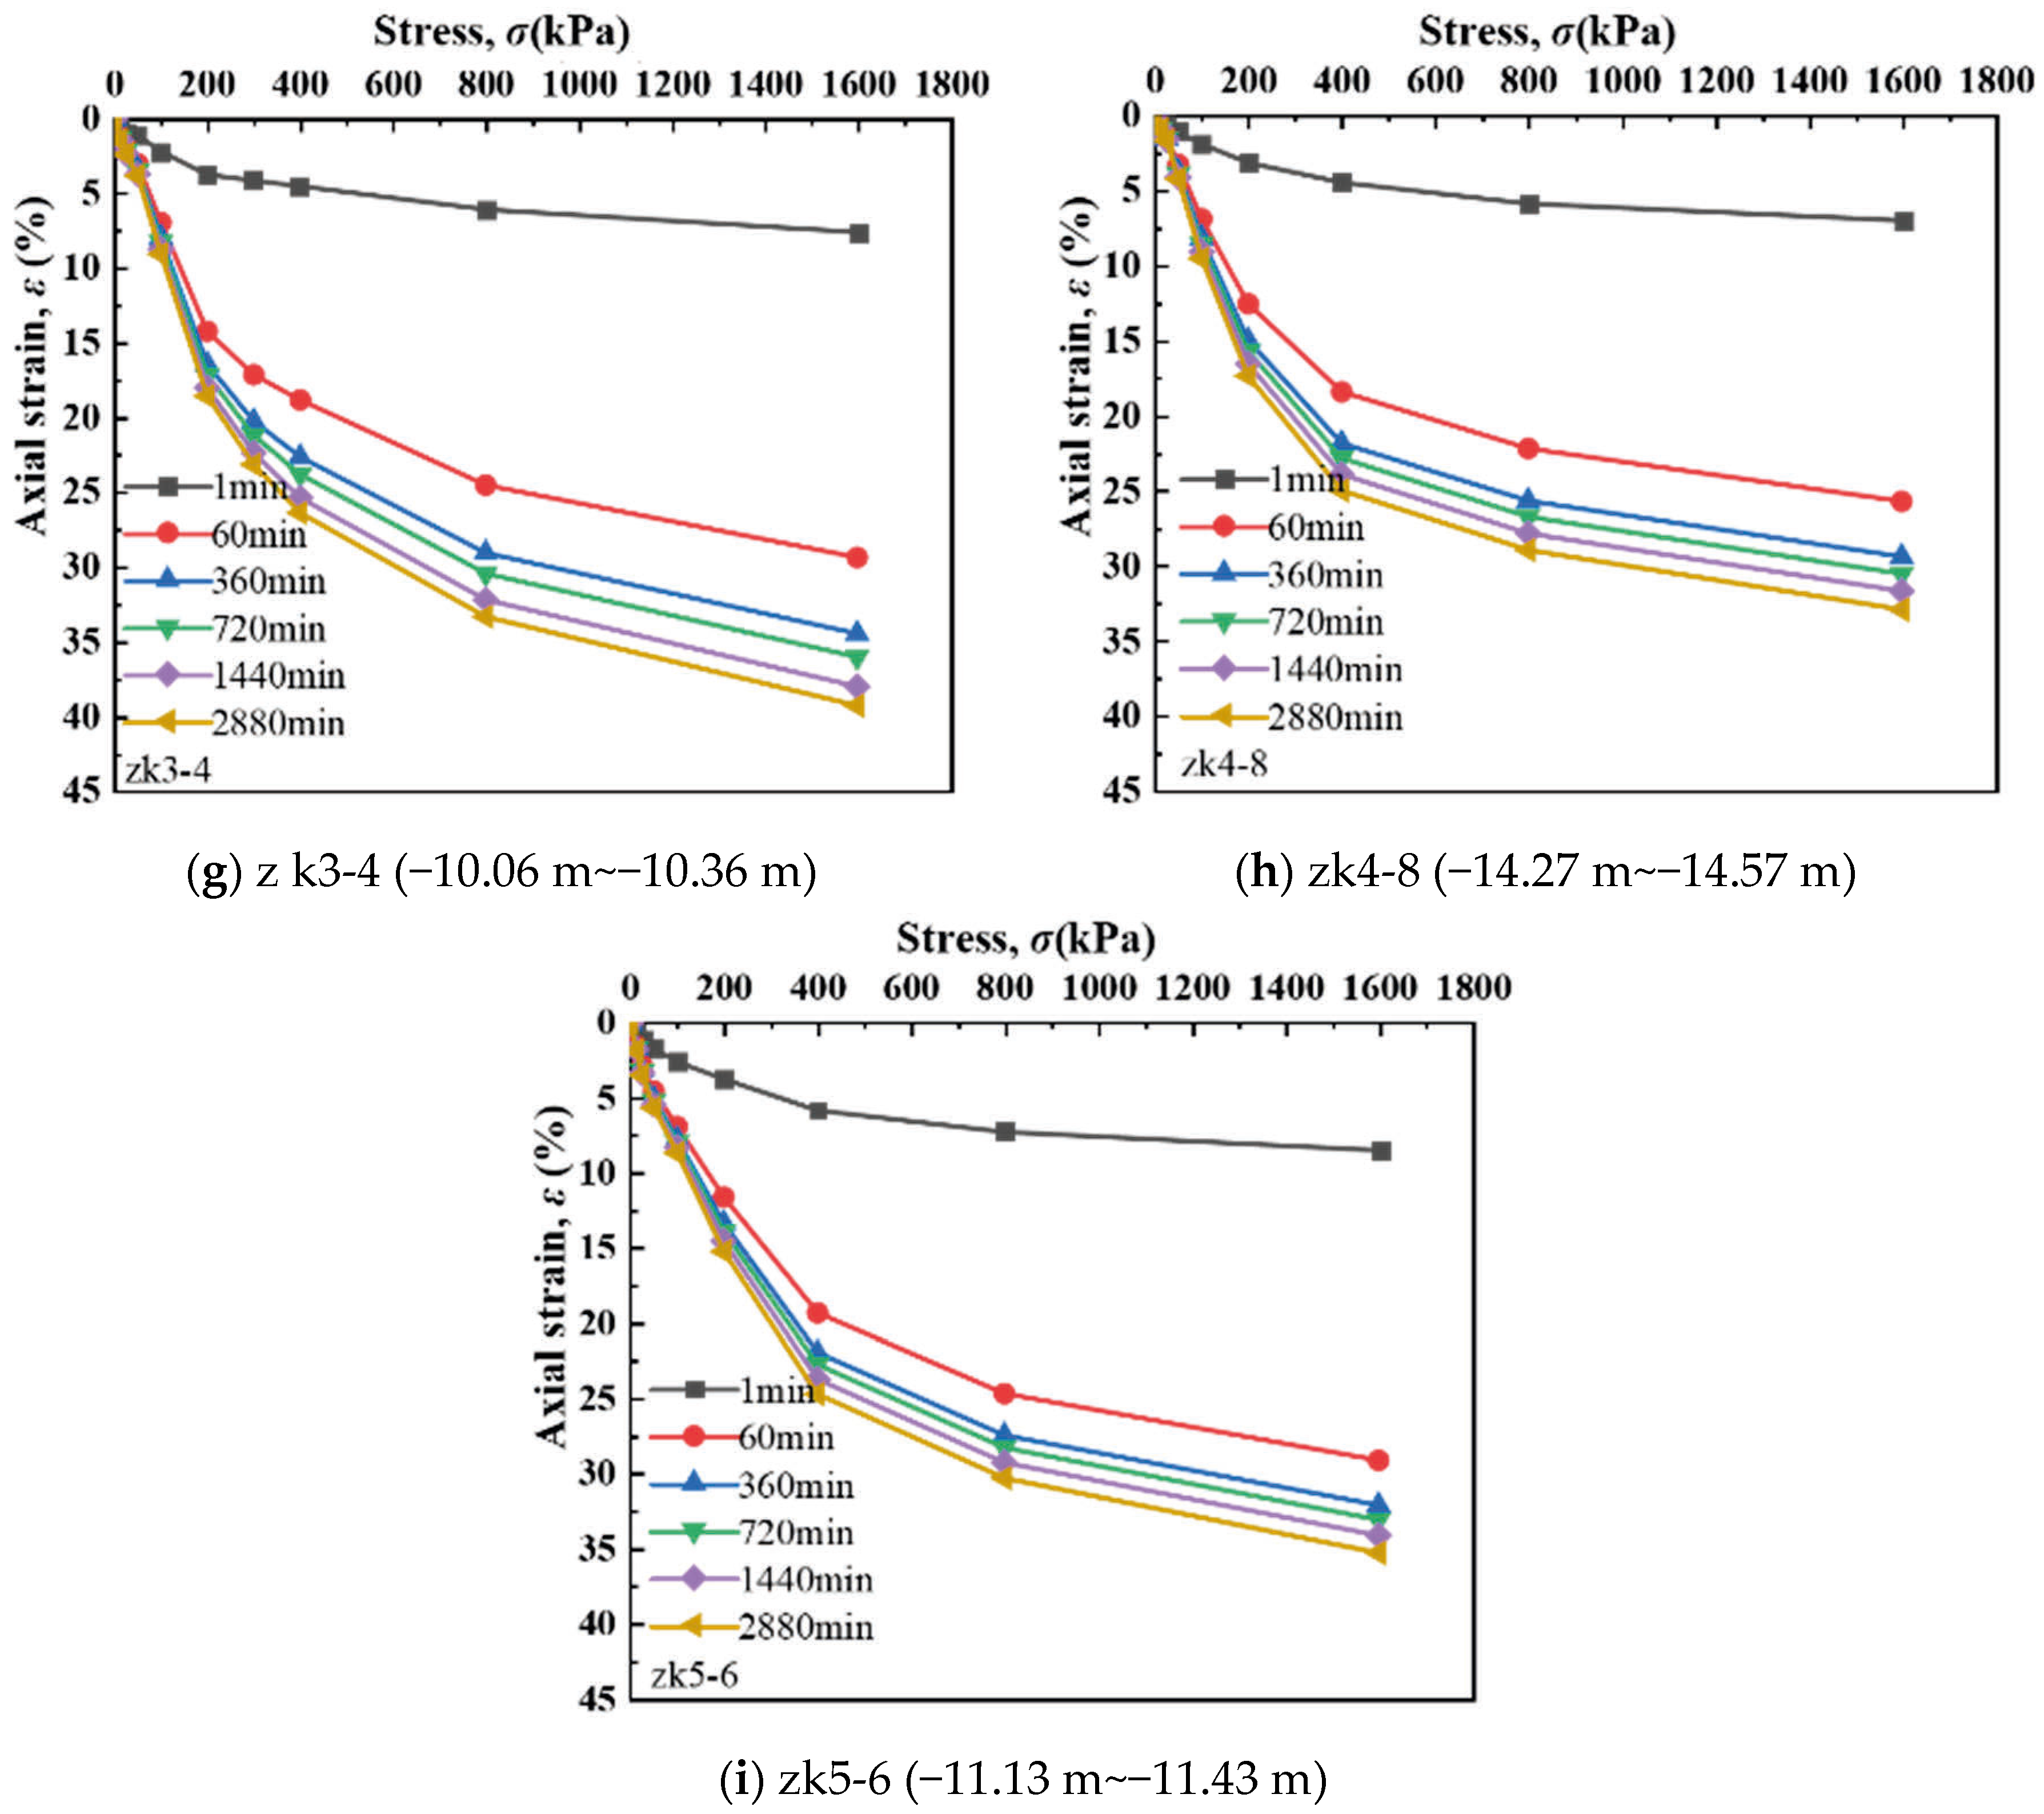
Figure 19 presents the isochronous stress–strain curves of undisturbed soft soil at various sampling depths, demonstrating three key mechanical responses: (1) The curves exhibit progressive nonlinearity with time, showing increasing slopes and a transition from stress-axis to strain-axis orientation, reflecting time-dependent deformation characteristics where strain increments decrease logarithmically with time. (2) A distinct yield point emerges near 100 kPa, separating viscoelastic behavior (slopes of 1.2–1.5 MPa below yield) from viscoplastic flow (slopes of 0.4–0.6 MPa above yield). (3) The deformation mechanism evolves through three phases: initial cementation-controlled response, followed by progressive bond breakage, and finally particulate creep as structural integrity degrades under sufficient stress.

4. Three-Axis Creep Characteristics

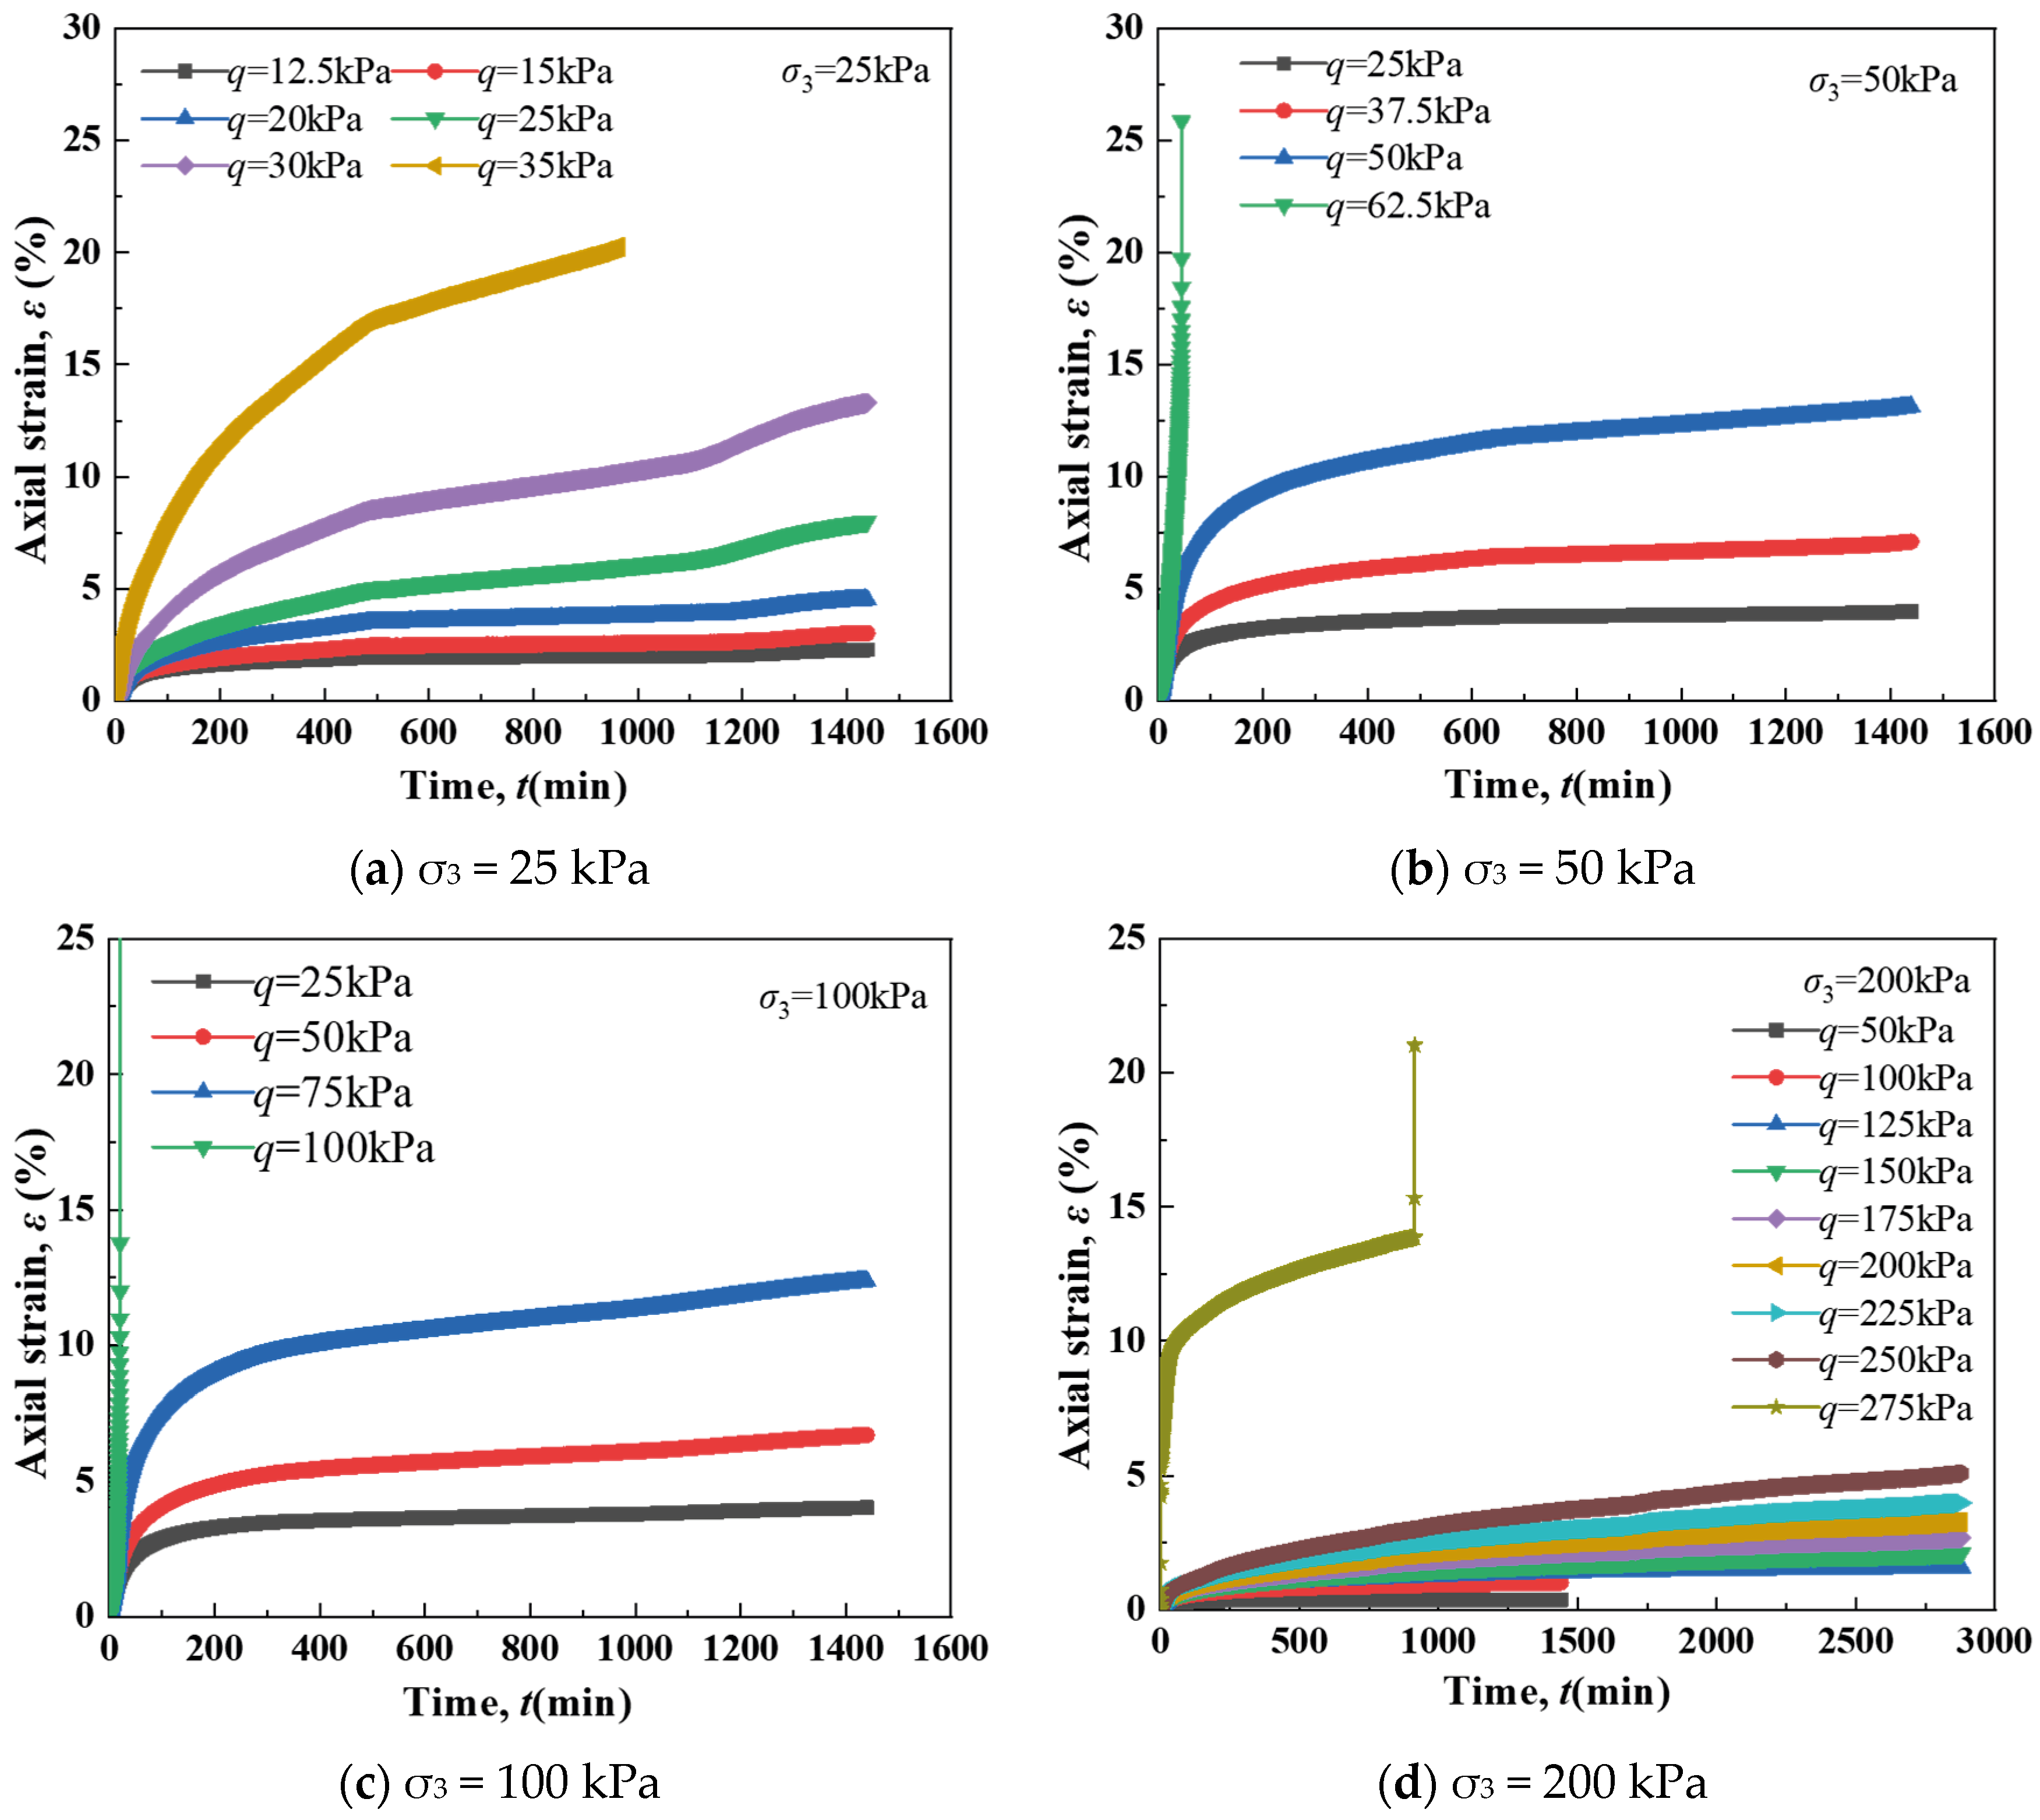
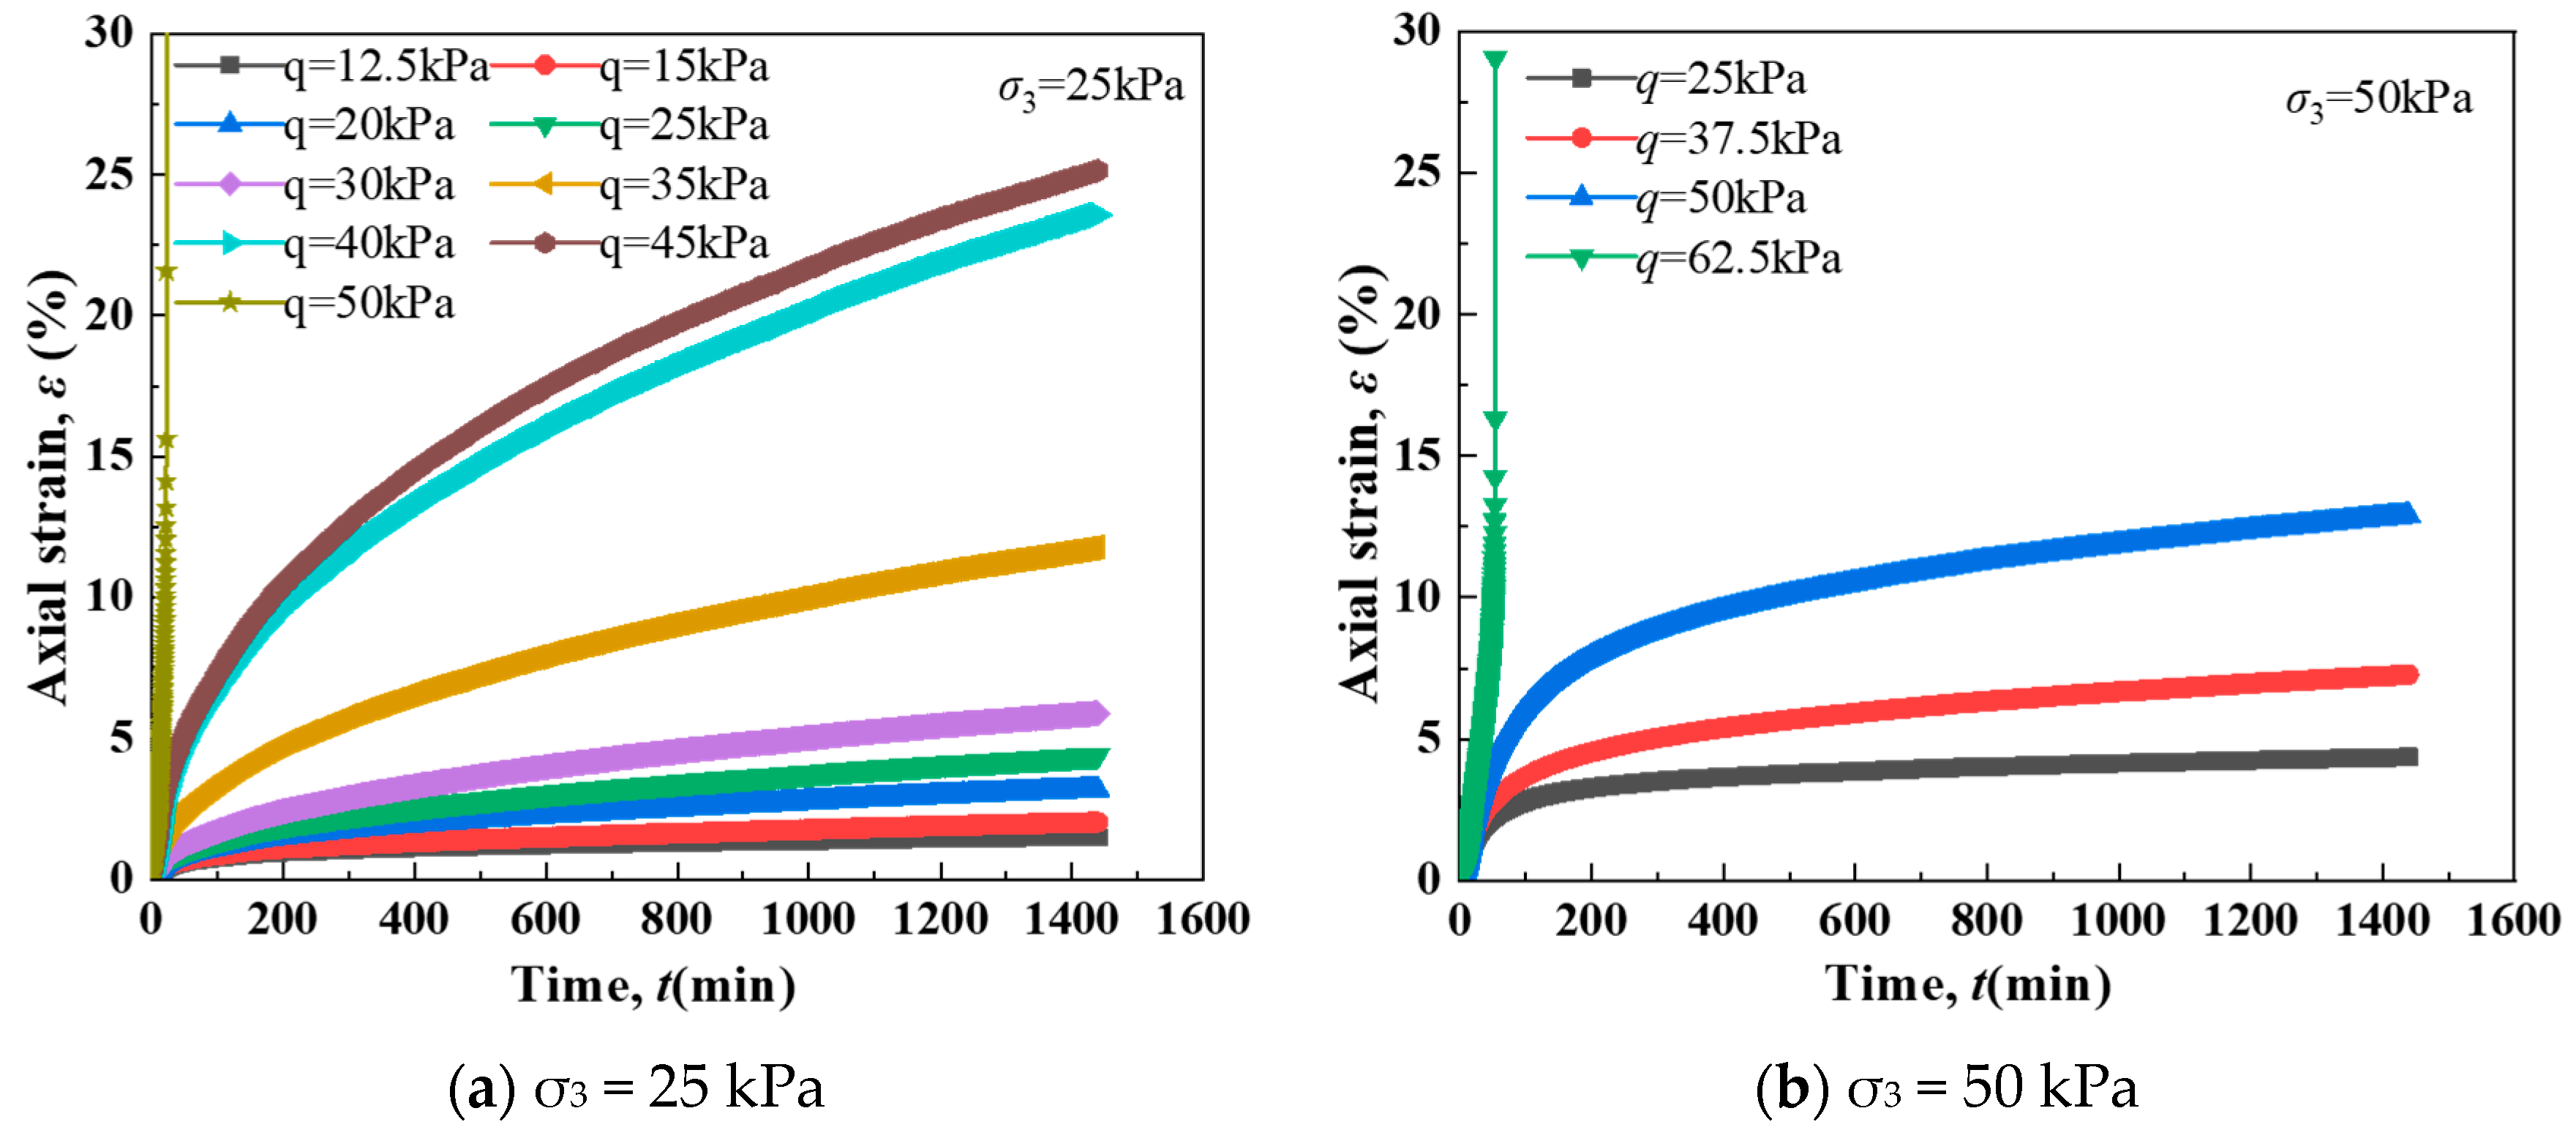
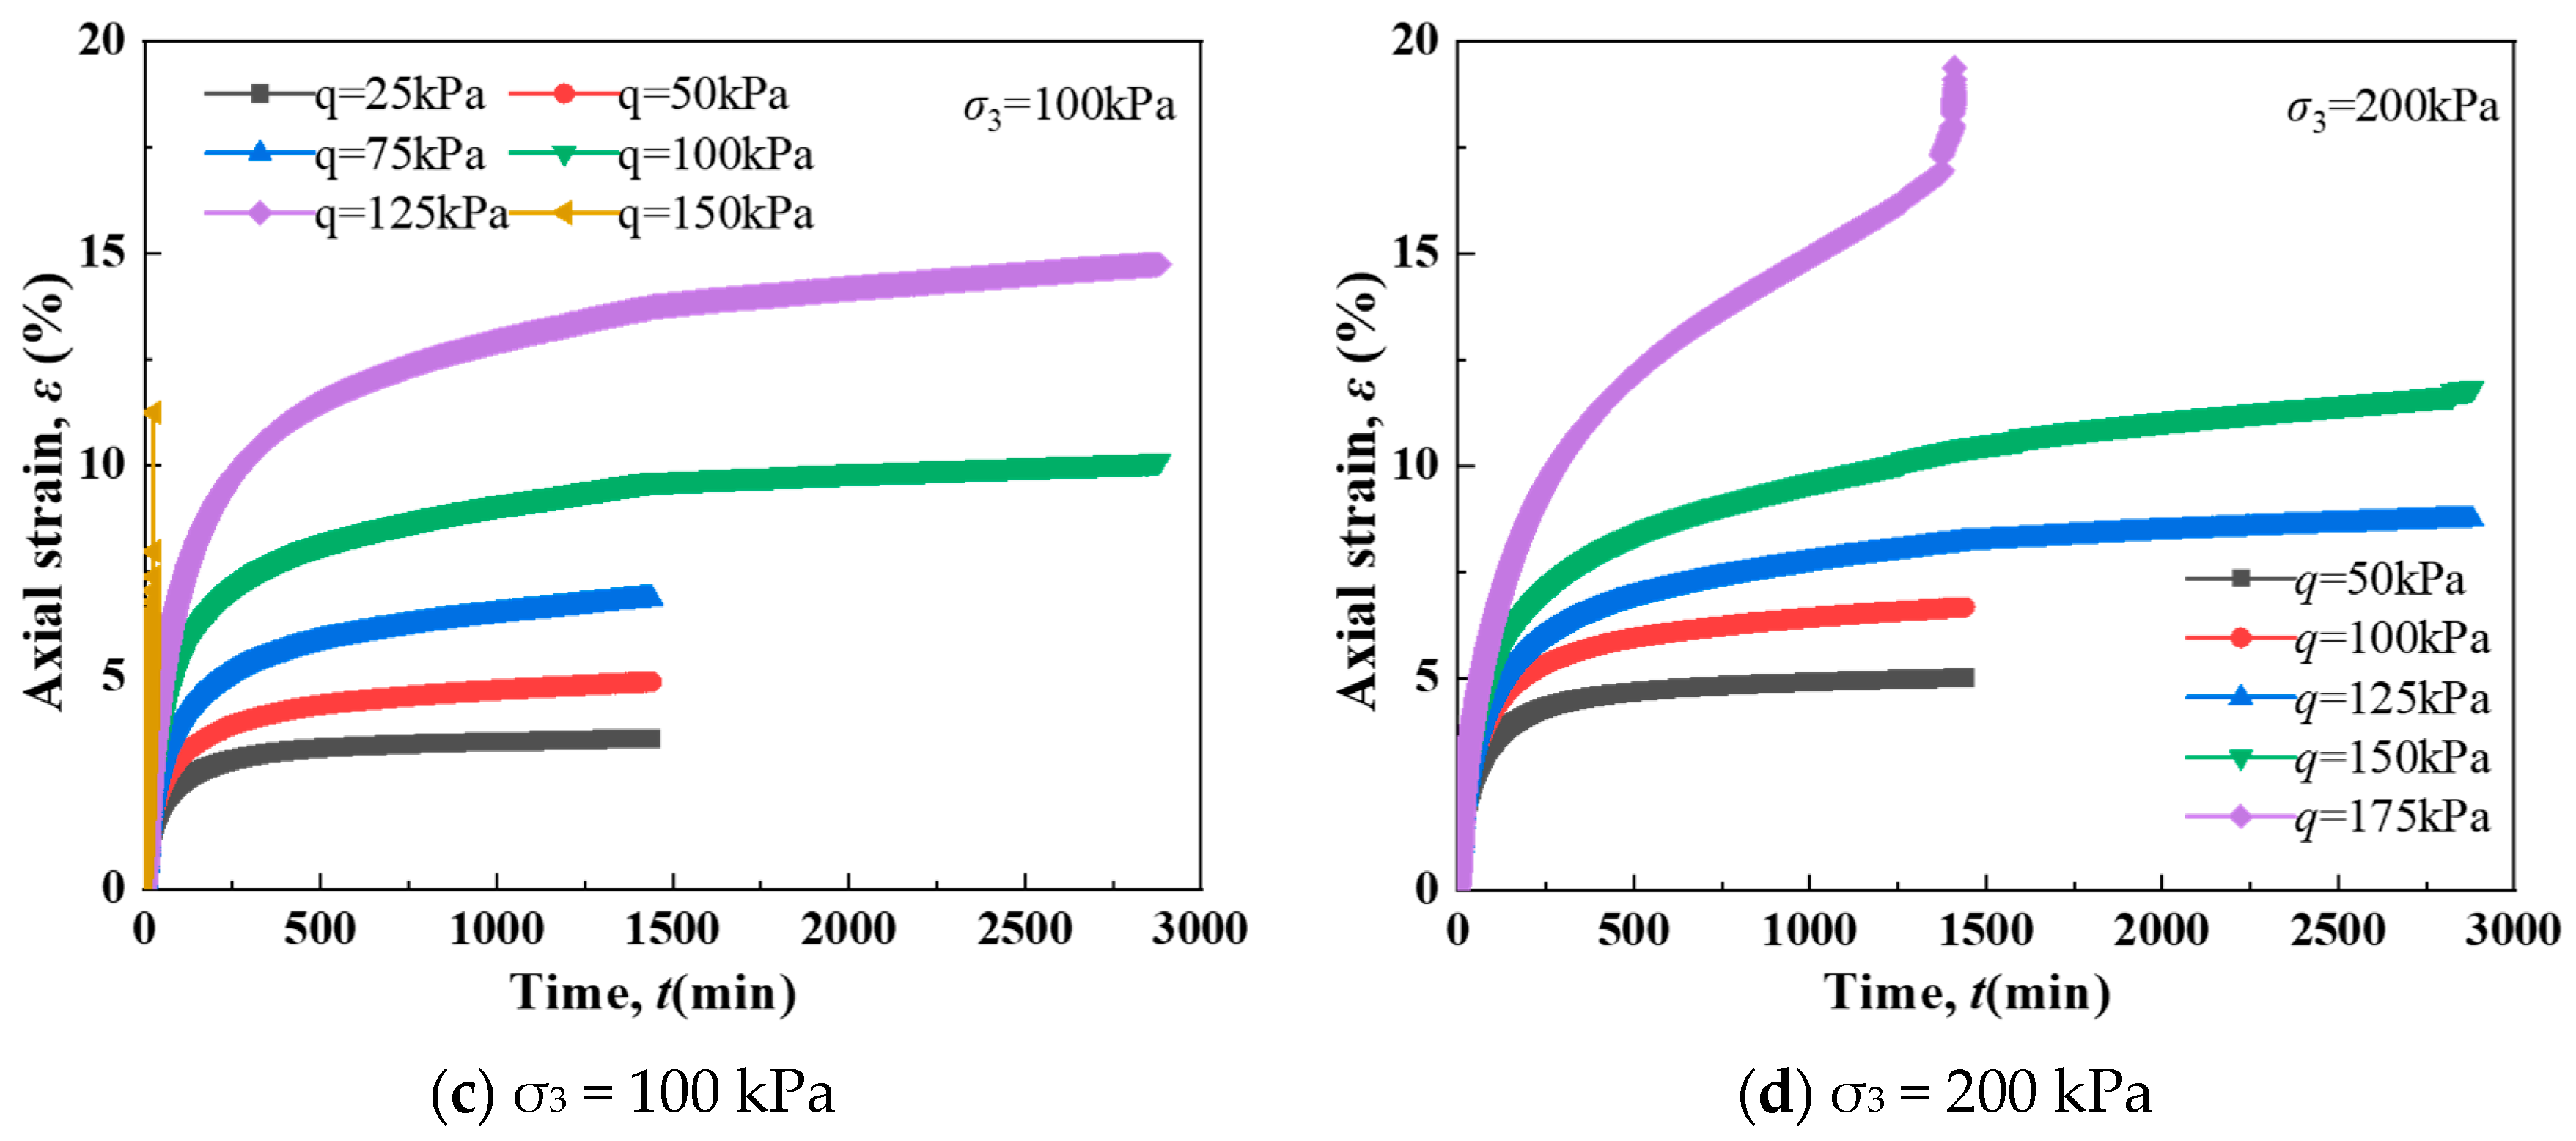
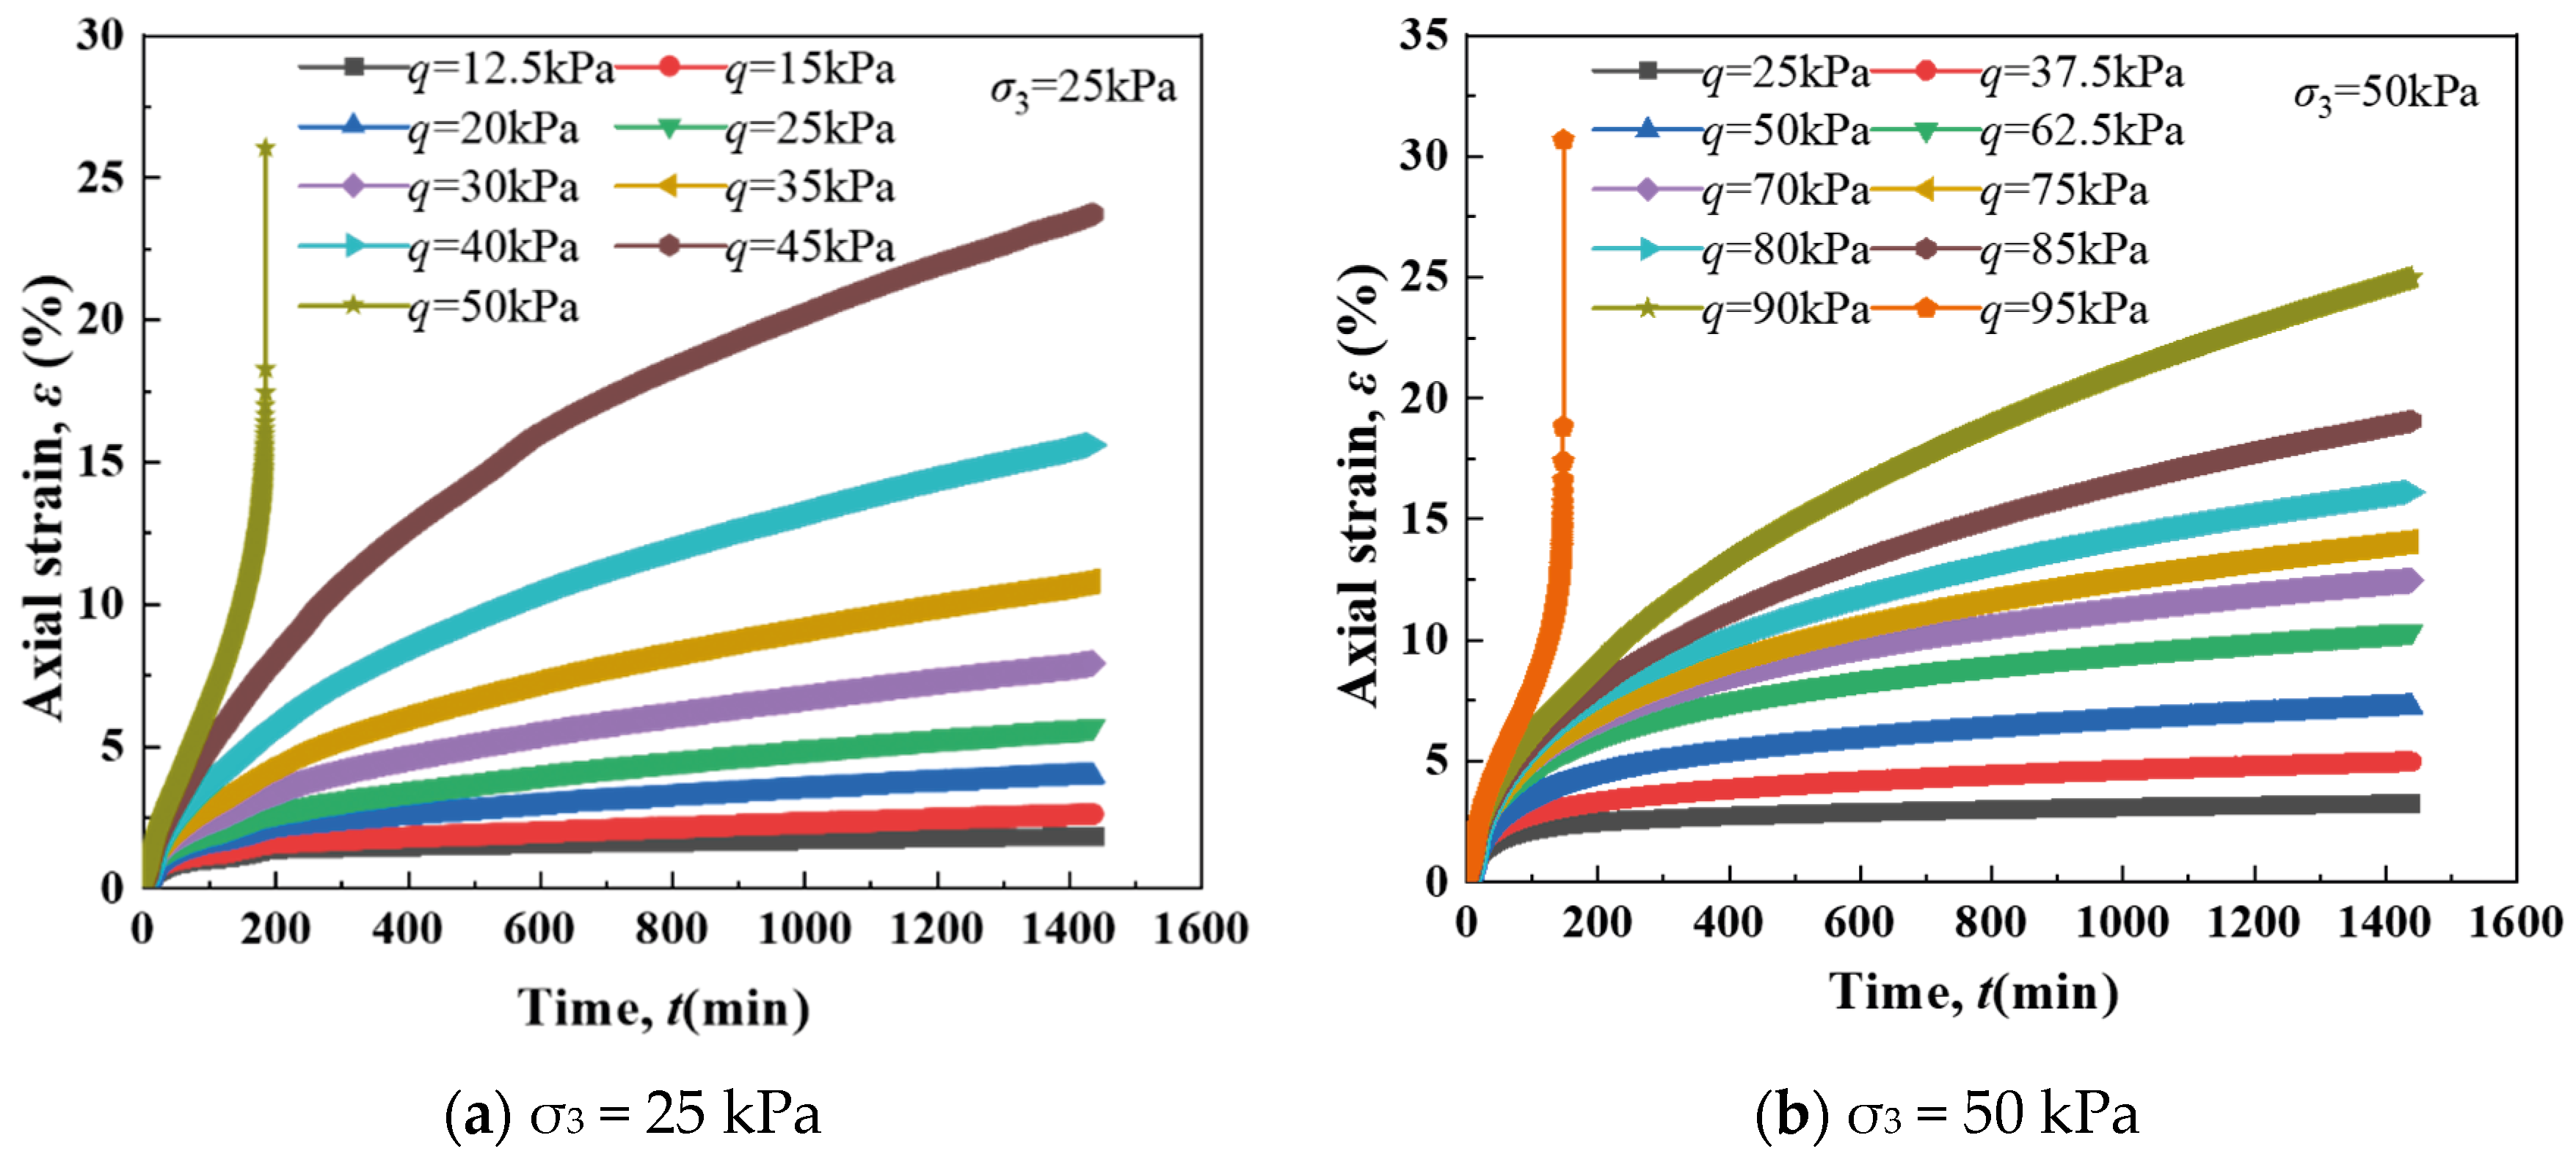
The triaxial creep tests were conducted on undisturbed soft soil specimens with sampling depths and basic physico-mechanical parameters as listed in Table 6. For each sampling tube, four tests were performed under different confining pressures (25 kPa, 50 kPa, 100 kPa, and 200 kPa) to systematically investigate the creep behavior.

4.1. Axial Strain–Time Relationship

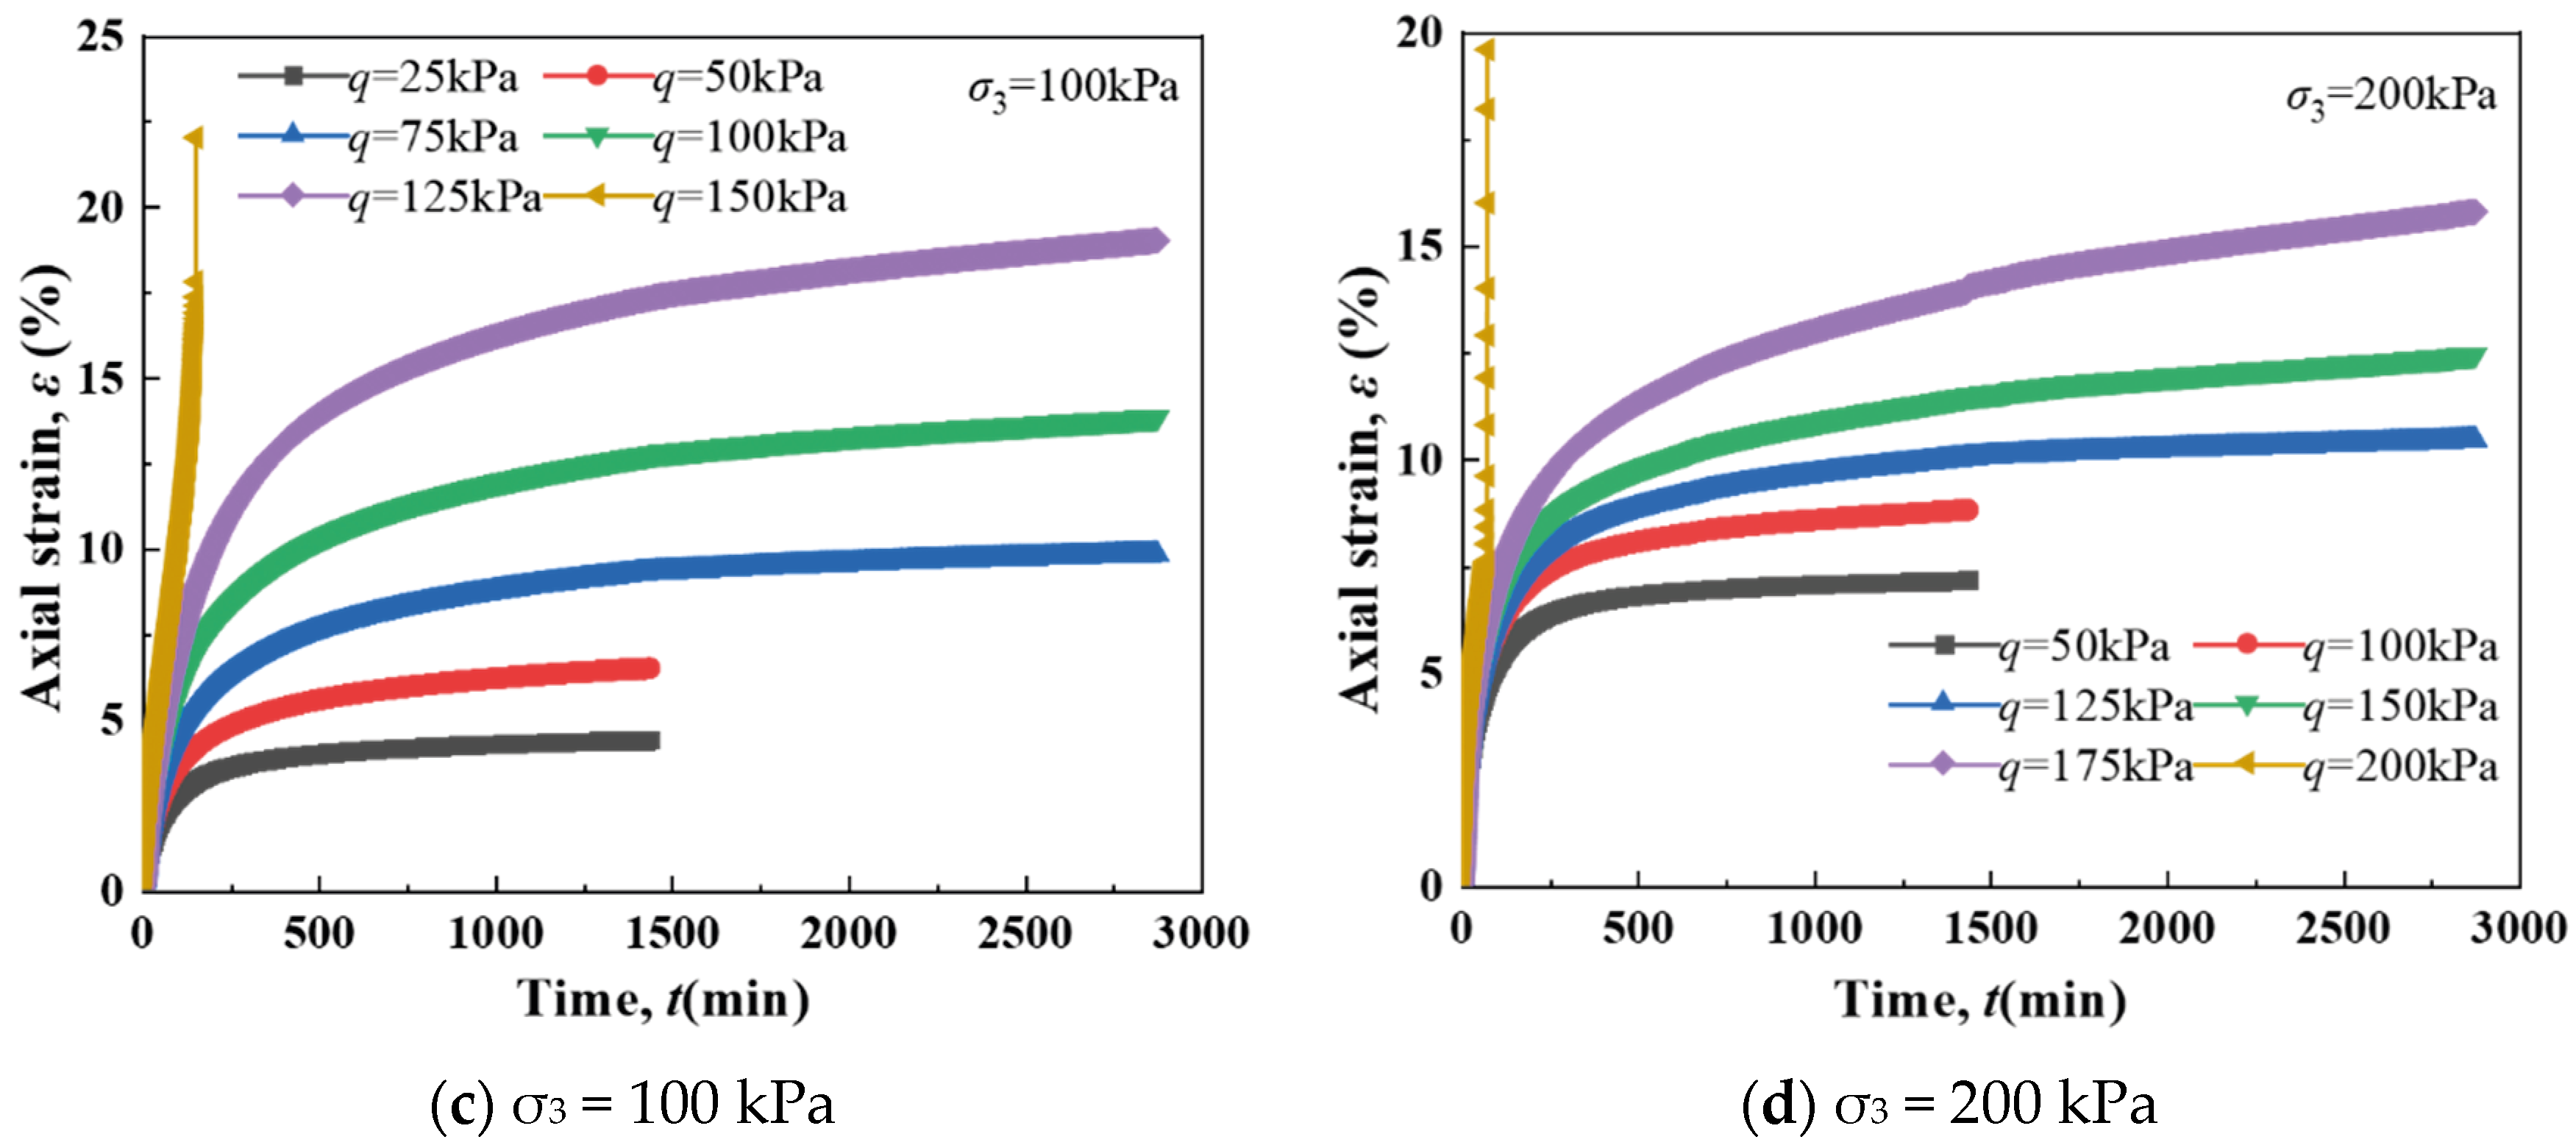
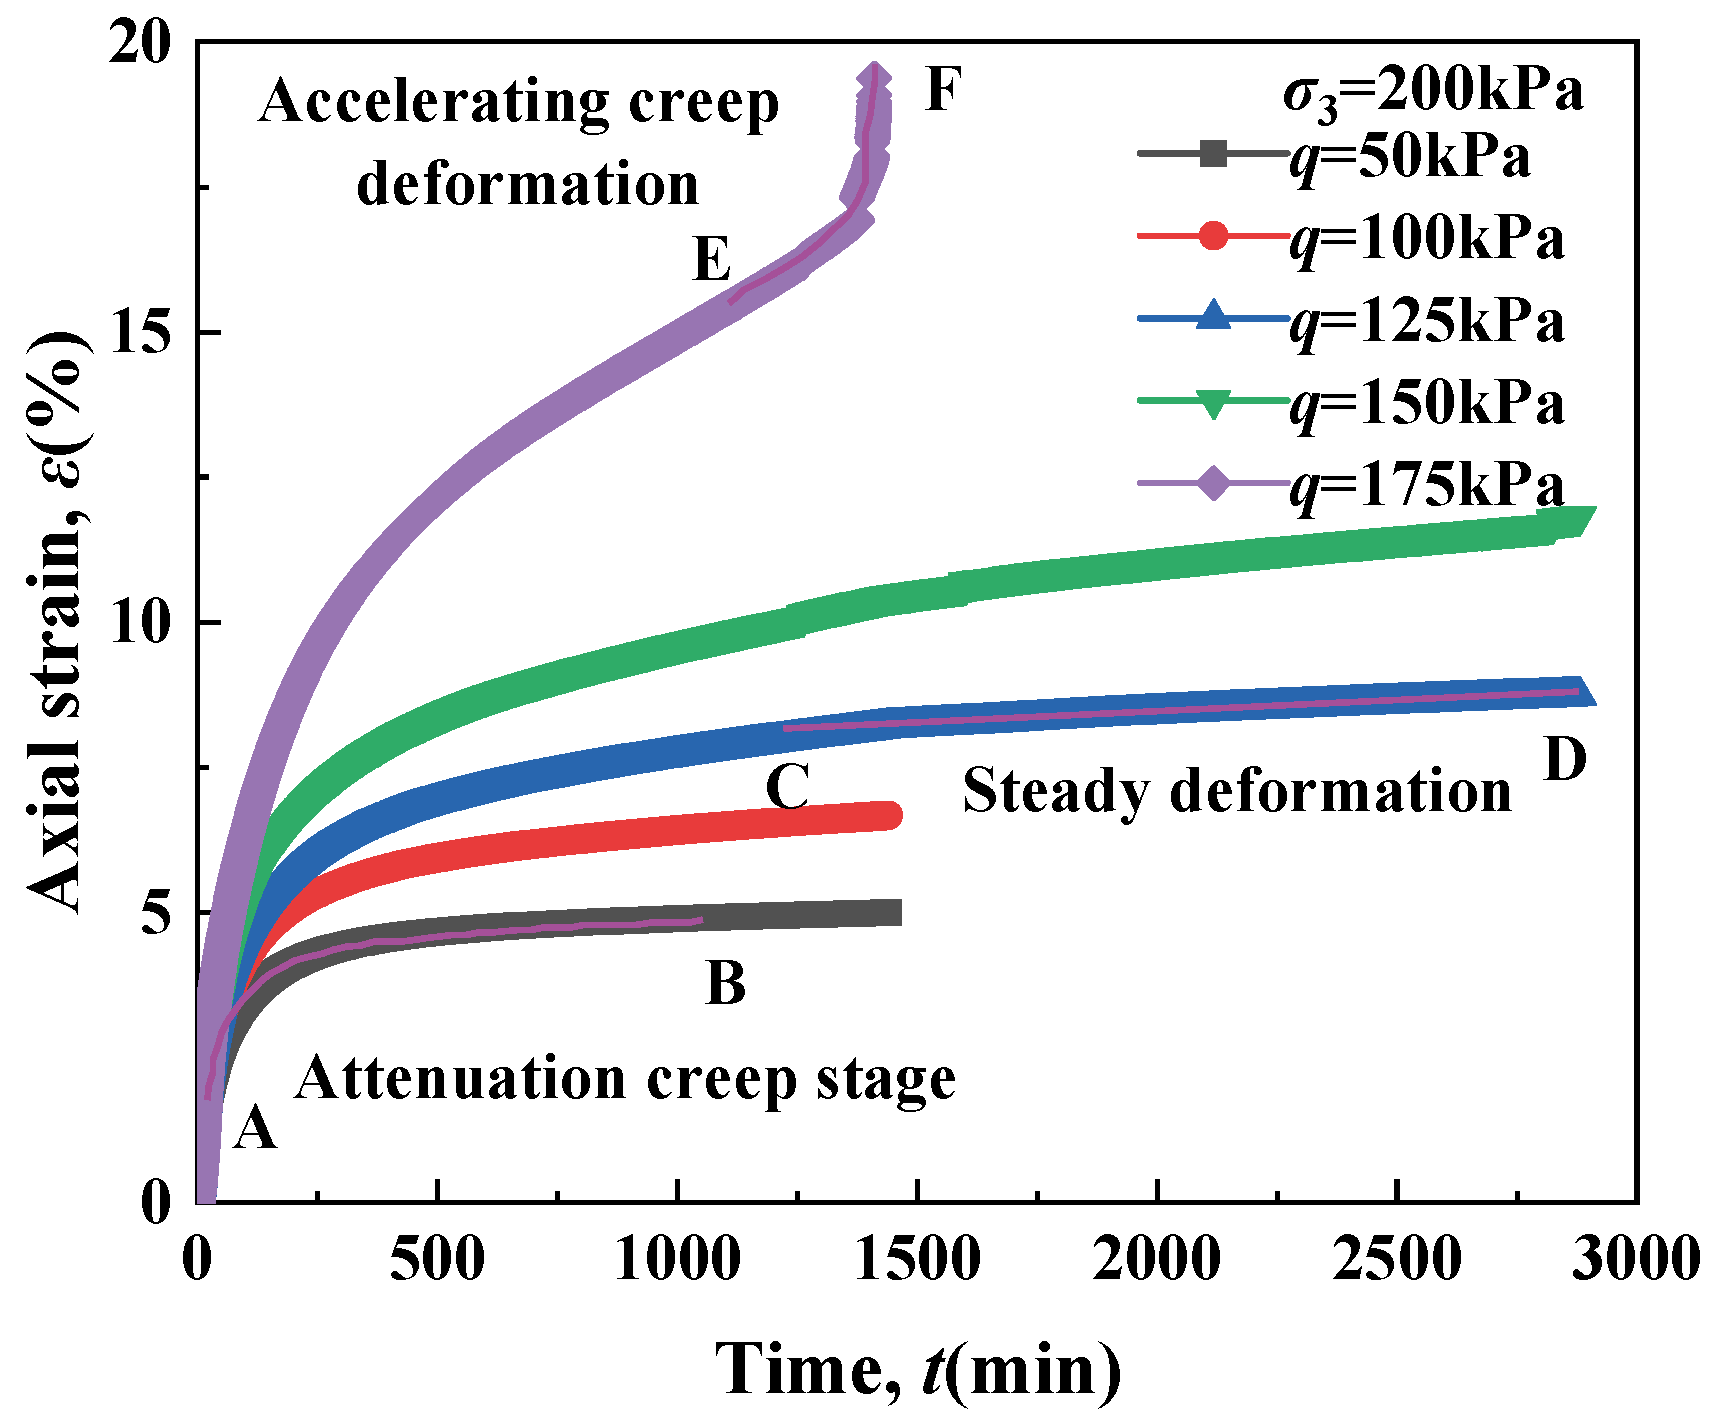
Figure 20, Figure 21 and Figure 22 present the axial strain–time relationships of the undisturbed soft soil specimens under triaxial stress conditions, exhibiting three characteristic creep phases: decelerating creep under low-strain conditions, steady-state creep at moderate strains, and accelerating creep approaching failure at high strains. As demonstrated in Figure 23 for a representative specimen, the creep behavior transitions through distinct regimes: initial strain stabilization (decelerating phase) under low stress, followed by constant-rate deformation (steady phase) at intermediate stress levels, and ultimately rapid structural collapse (accelerating phase) when subjected to high-stress conditions. These transitions correspond to progressive microstructural changes, from initial fabric adjustment to interparticle bond breakage and finally complete structural failure.
The test results in Figure 20, Figure 21 and Figure 22 reveal two fundamental characteristics of undisturbed soft soil under triaxial creep conditions: (1) The deviatoric stress at failure q consistently approximates 1.25 times the confining pressure, representing lower strength compared to remolded specimens due to the undisturbed soil’s higher initial void ratio and more open fabric structure. (2) Creep behavior shows stress-dependent stabilization periods, where higher deviatoric stresses prolong the time required for strain stabilization while simultaneously increasing the magnitude of creep deformation, with the rate of accumulation following a characteristic rise–peak–decline pattern over time.

4.2. Stress–Strain Isochronous Relationship Curve

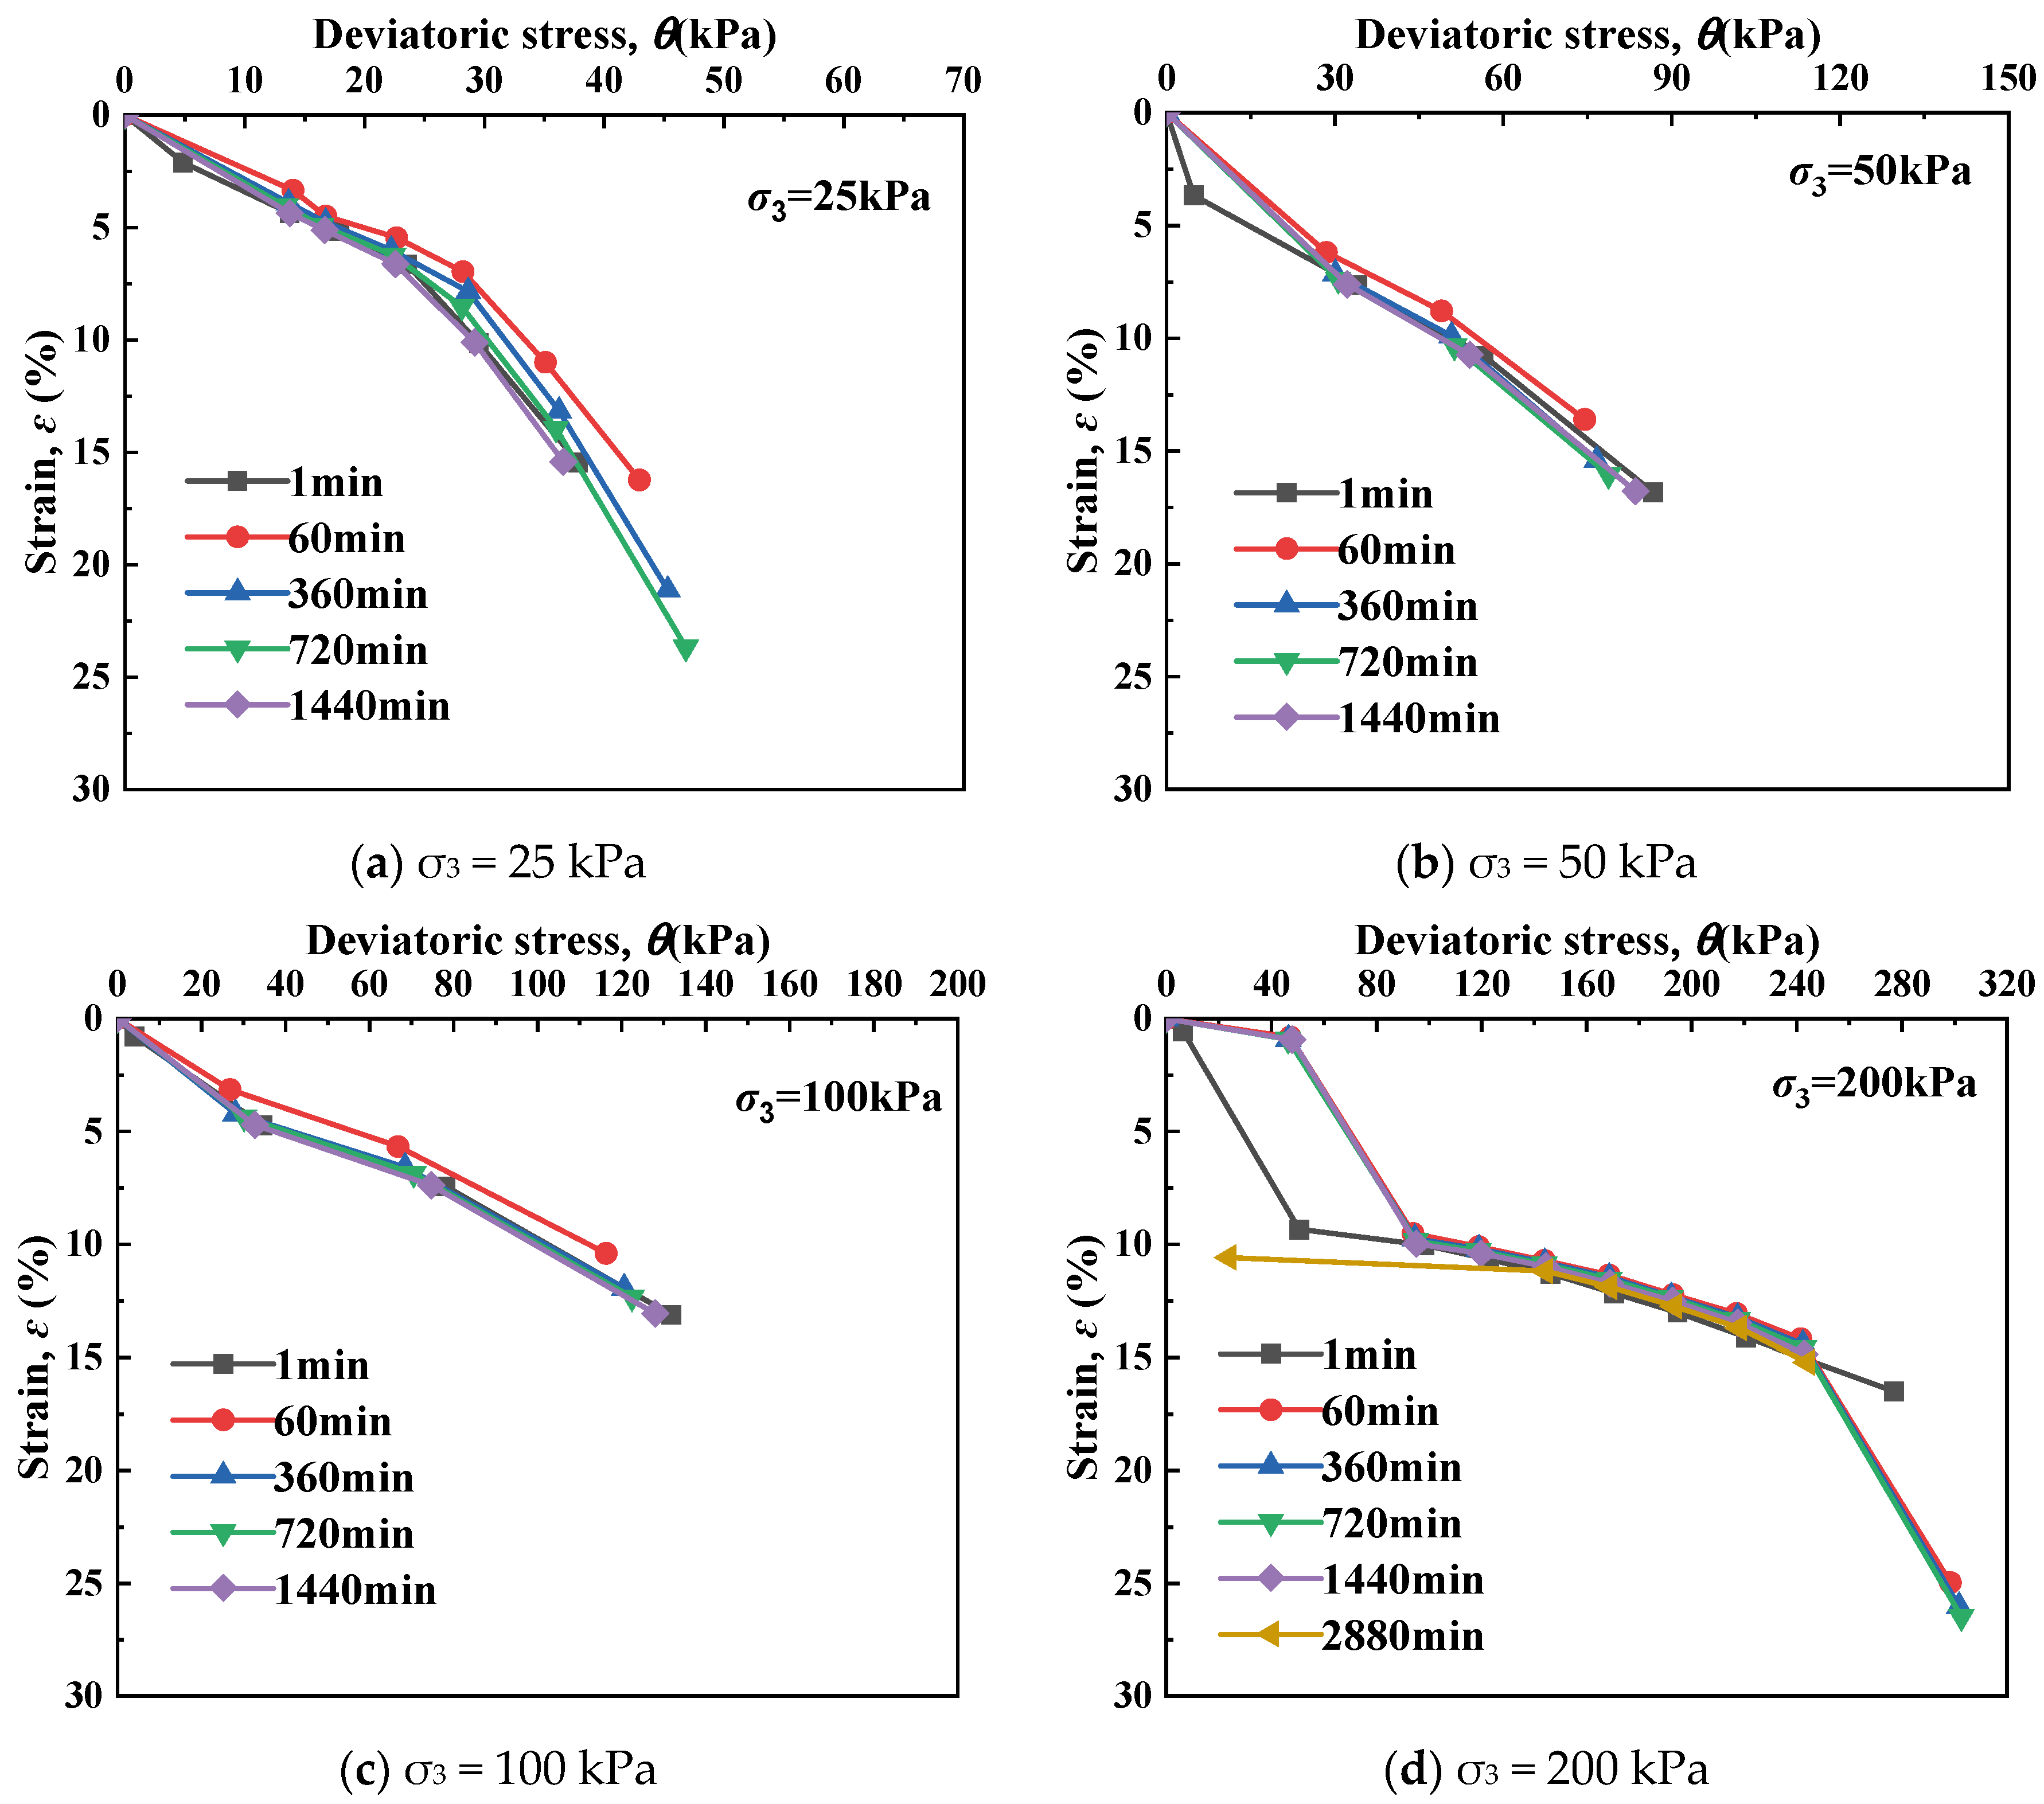
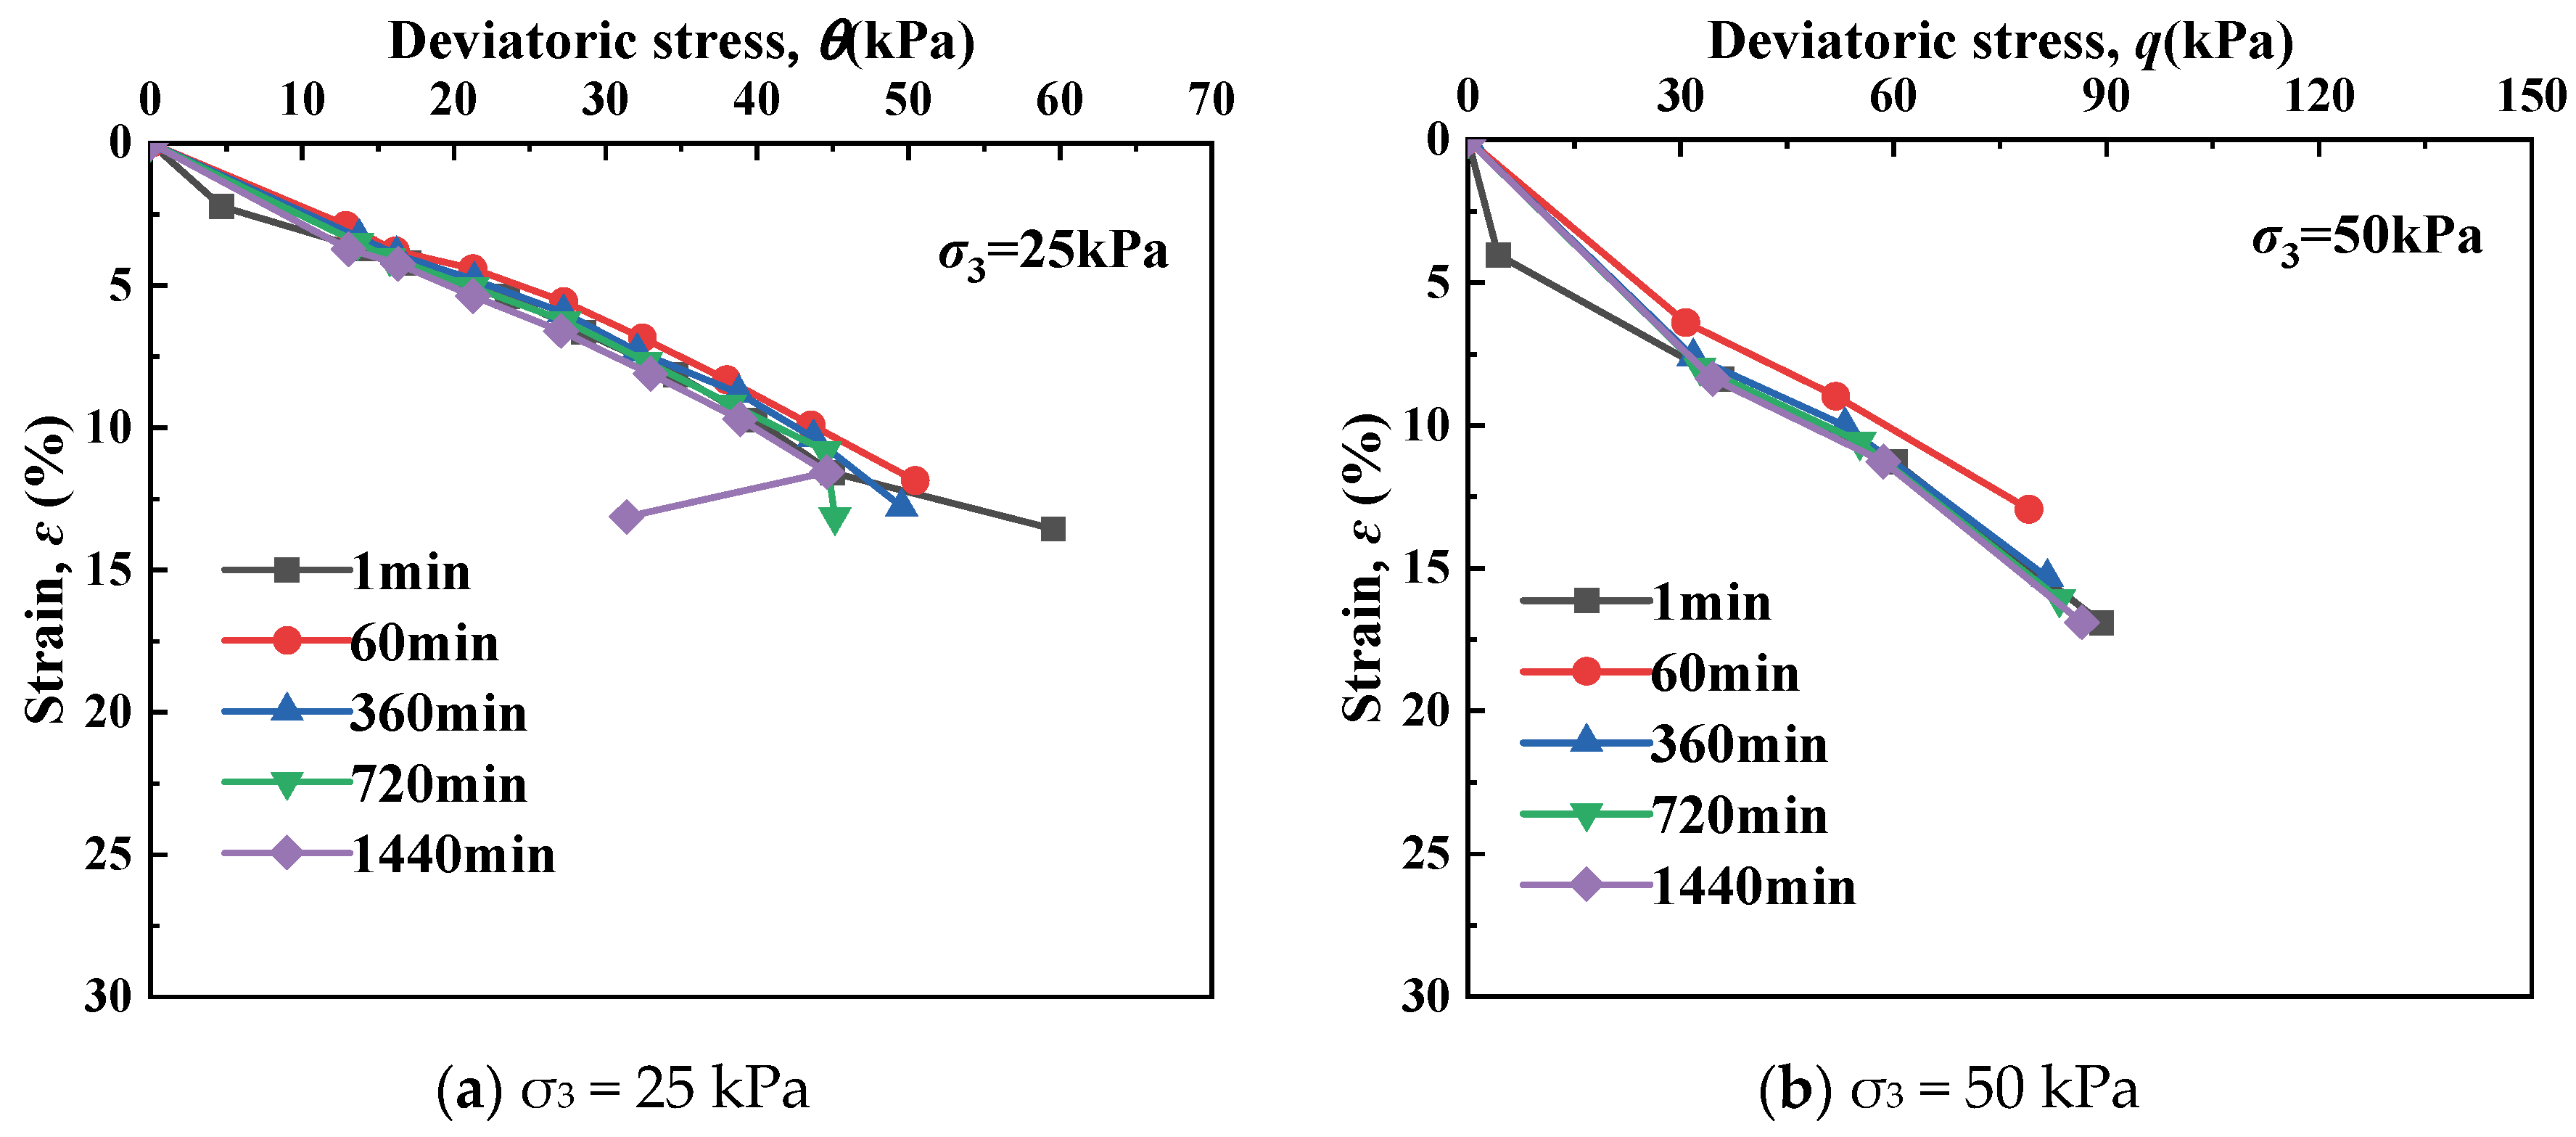
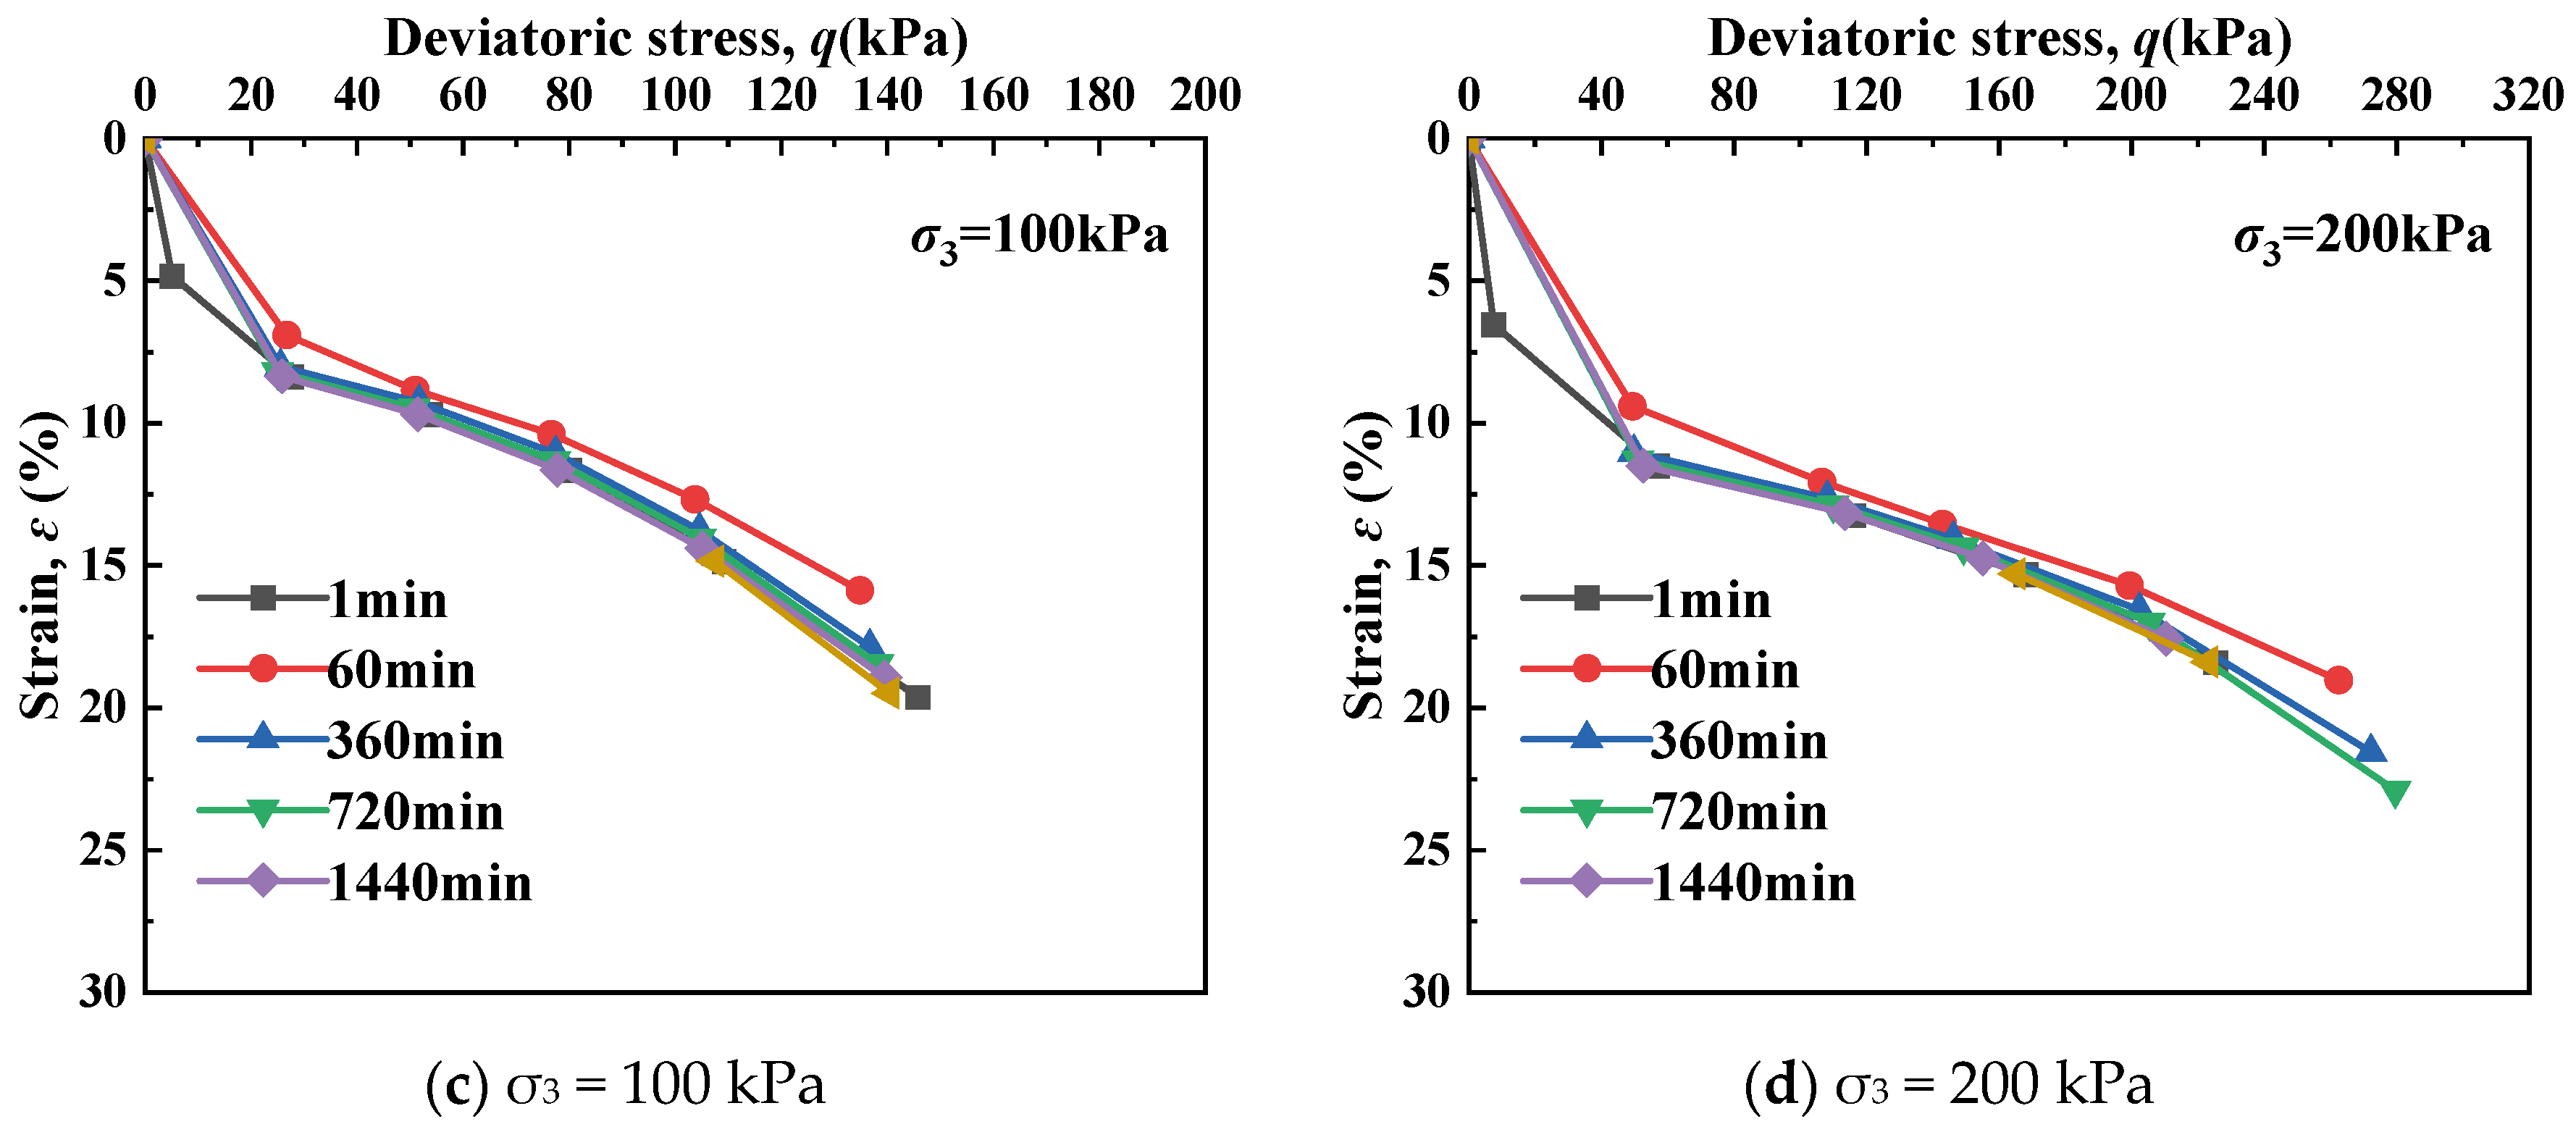
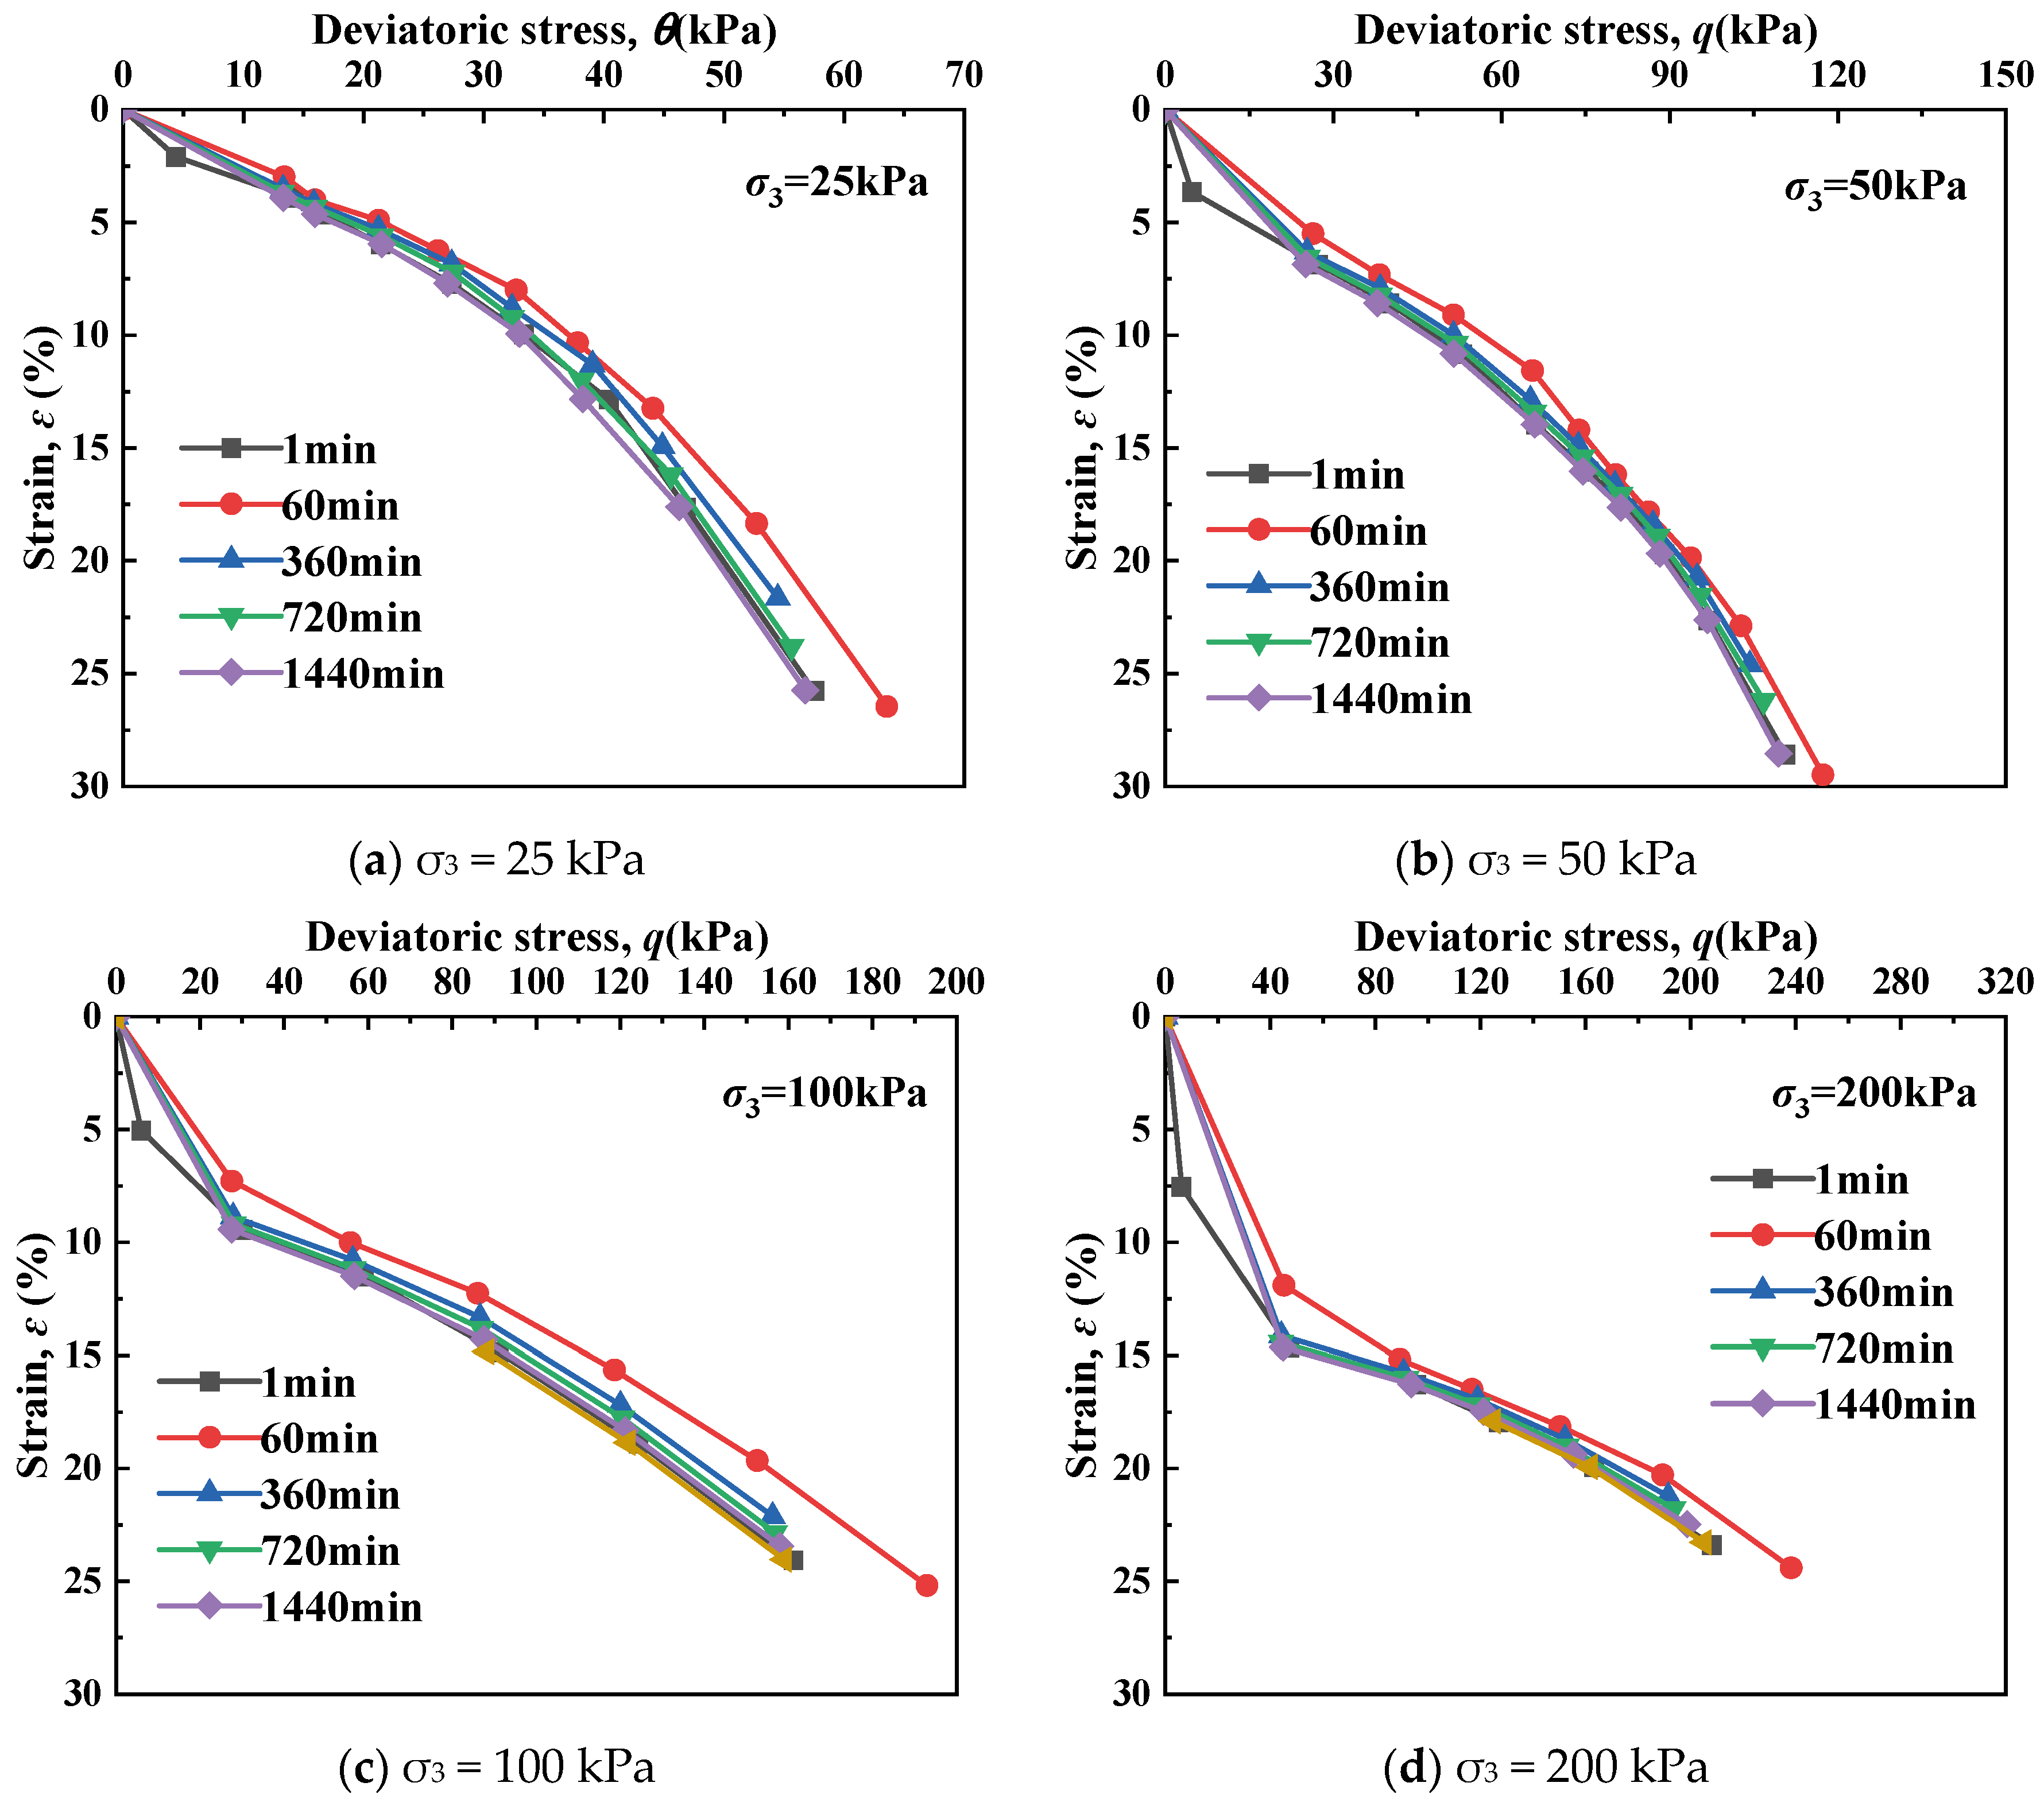
The isochronous deviatoric stress–strain curves of undisturbed soft soil (specimens ZK3-1, ZK3-2, and ZK3-3 in Figure 24, Figure 25 and Figure 26) were plotted using strain values measured at 1, 60, 360, 720, 1440, and 2880 min after stress application. Under triaxial conditions, these curves exhibit near-linear behavior distinct from the nonlinear patterns observed in the one-dimensional tests, demonstrating three characteristic response phases: (1) pre-yield linear deformation, reflecting structural micro-adjustments; (2) yield-point transition, marking initial fabric collapse with strain acceleration; (3) post-yield development of a secondary structure unable to match external loading rates, ultimately leading to structural failure. The curves progressively migrate toward the strain axis over time, showing enhanced nonlinearity through disproportionate strain increases at high stresses (Figure 24d) and greater cumulative deformation under prolonged loading.
In summary, the isochronous curves demonstrate distinct mechanical responses under different stress conditions. When the deviatoric stress is relatively small, the curves exhibit nearly linear trends, indicating the viscoelastic behavior of the soil. As the applied deviatoric stress increases, the curves progressively shift toward the strain axis, revealing viscoplastic characteristics that become most pronounced under higher confining pressures. Under identical conditions, the yield stress of soil specimens increases with greater confining pressure. The transition point between the linear and curved segments of the isochronous curves serves as the boundary between viscoelastic and viscoplastic behavior. The stress corresponding to this inflection point can be regarded as the yield stress: when the applied stress is below this yield stress, the deformation remains in the viscoelastic stage; when the stress exceeds the yield stress, the deformation enters the viscoplastic stage.

5. Creep Microstructural Evolution

5.1. Evolutionary Patterns with Loading

Figure 27 presents the mercury intrusion porosity (eMIP) and pore size distribution (PSD) curves of specimen ZK4-8 under different one-dimensional vertical stresses. Key observations include the following: (1) The cumulative void ratio decreases from 1.351 to 1.127 as vertical stress increases from 400 kPa to 1600 kPa, demonstrating significant soil compaction. (2) The eMIP curves (Figure 28a) show reduced mercury-intruded void ratios with increasing stress. (3) The unimodal PSD curves (Figure 27b) indicate homogeneous soil structure, with peak pore density decreasing from 2.431 to 1.518 and dominant pore diameter shrinking from 0.685 μm to 0.584 μm under elevated stress, confirming that load-induced deformation primarily results from compression of macro-pores. These microstructural changes in undisturbed soft soil under loading exhibit similar patterns to those observed in remolded specimens.

5.2. Evolutionary Patterns with Respect to Soil Depth

Figure 28 presents the pore size distribution (PSD) curves of undisturbed soft soil at different sampling depths under both initial conditions and after 1600 kPa loading. The initial PSD curves (Figure 28a) exhibit unimodal distributions with progressively decreasing peak pore densities at greater depths (from 3.2 at shallow layers to 1.5 at deeper strata), confirming enhanced soil densification with overburden pressure that correlates with the creep characteristics discussed in Section 4.2. Under 1600 kPa loading (Figure 28b), representative specimen zk2-2 demonstrates significant pore compression, with peak pore densities reducing sharply from 1.5 to 3.2 to 0.7–1.0 while dominant pore diameters decrease by 30–45%, quantitatively verifying stress-induced structural collapse. These microstructural changes systematically explain the macroscopic creep reduction observed in deeper specimens.

5.3. Evolutionary Patterns over Creep Time

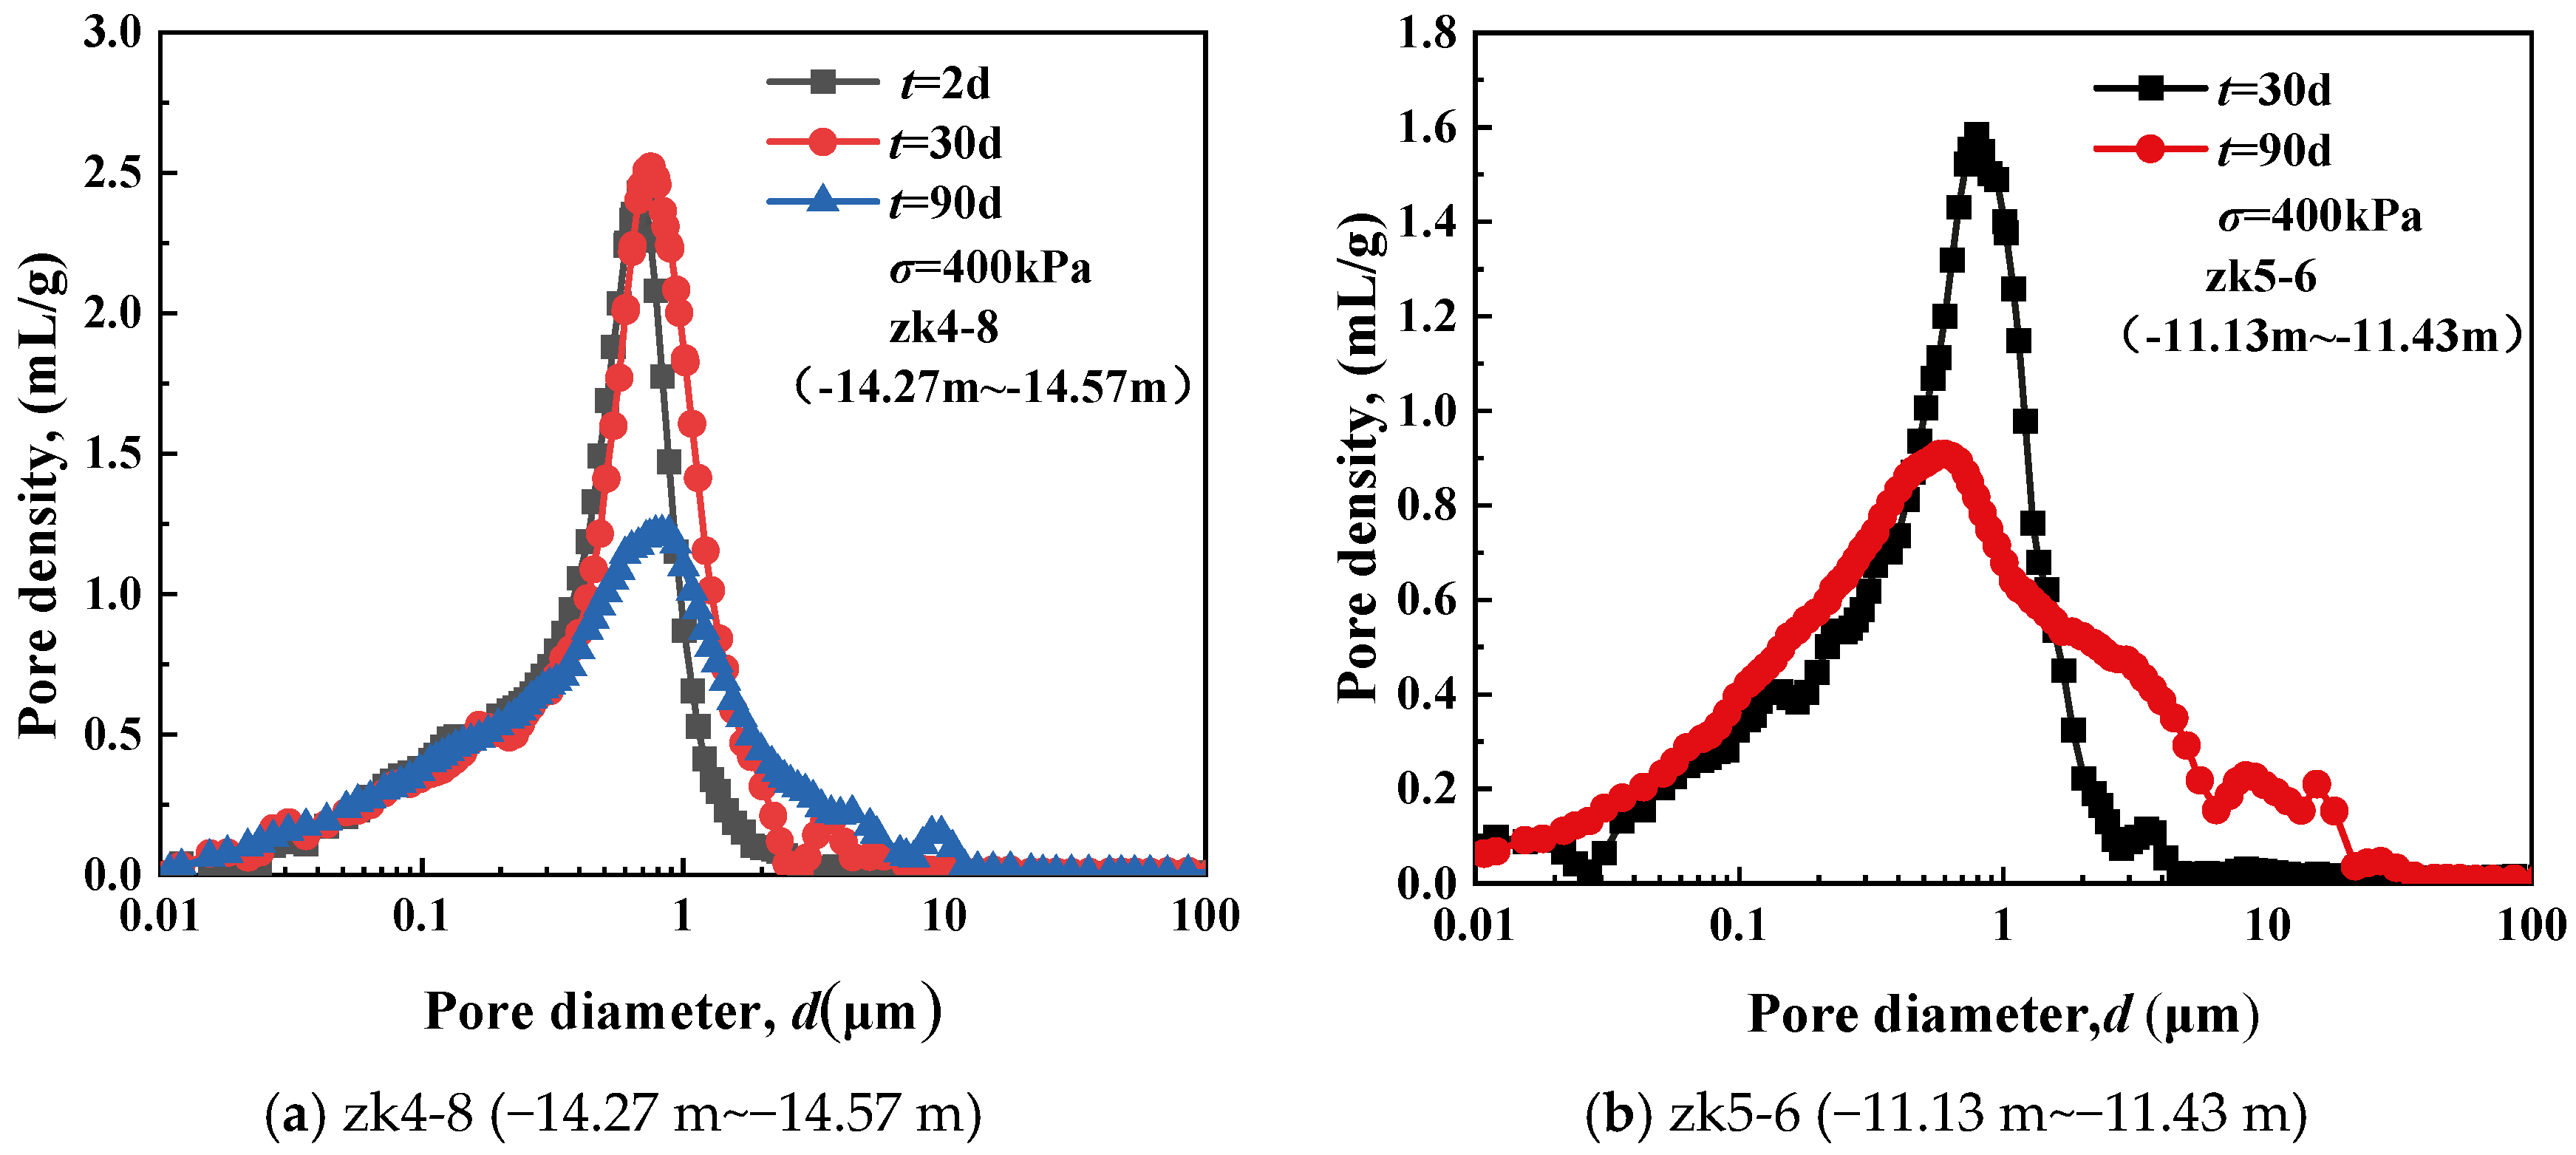
Figure 29 presents the pore size distribution (PSD) curves of specimens ZK4-8 and ZK5-6 under 400 kPa stress after different creep durations, demonstrating time-dependent microstructural evolution similar to that in remolded soil. For ZK4-8 (Figure 30a), increasing creep time from 2 to 90 days reduces the peak pore density progressively from 2.51 to 1.222, while ZK5-6 (Figure 29b) shows corresponding decreases in both mercury-intruded void ratio (1.366→1.220) and peak pore density (1.579→0.899) between 30 and 90 days. These systematic reductions in both dominant pore diameter and pore density quantitatively explain the macroscopic observation of accelerated void ratio reduction during long-term creep, revealing how time-dependent particle rearrangements progressively compress the pore structure.
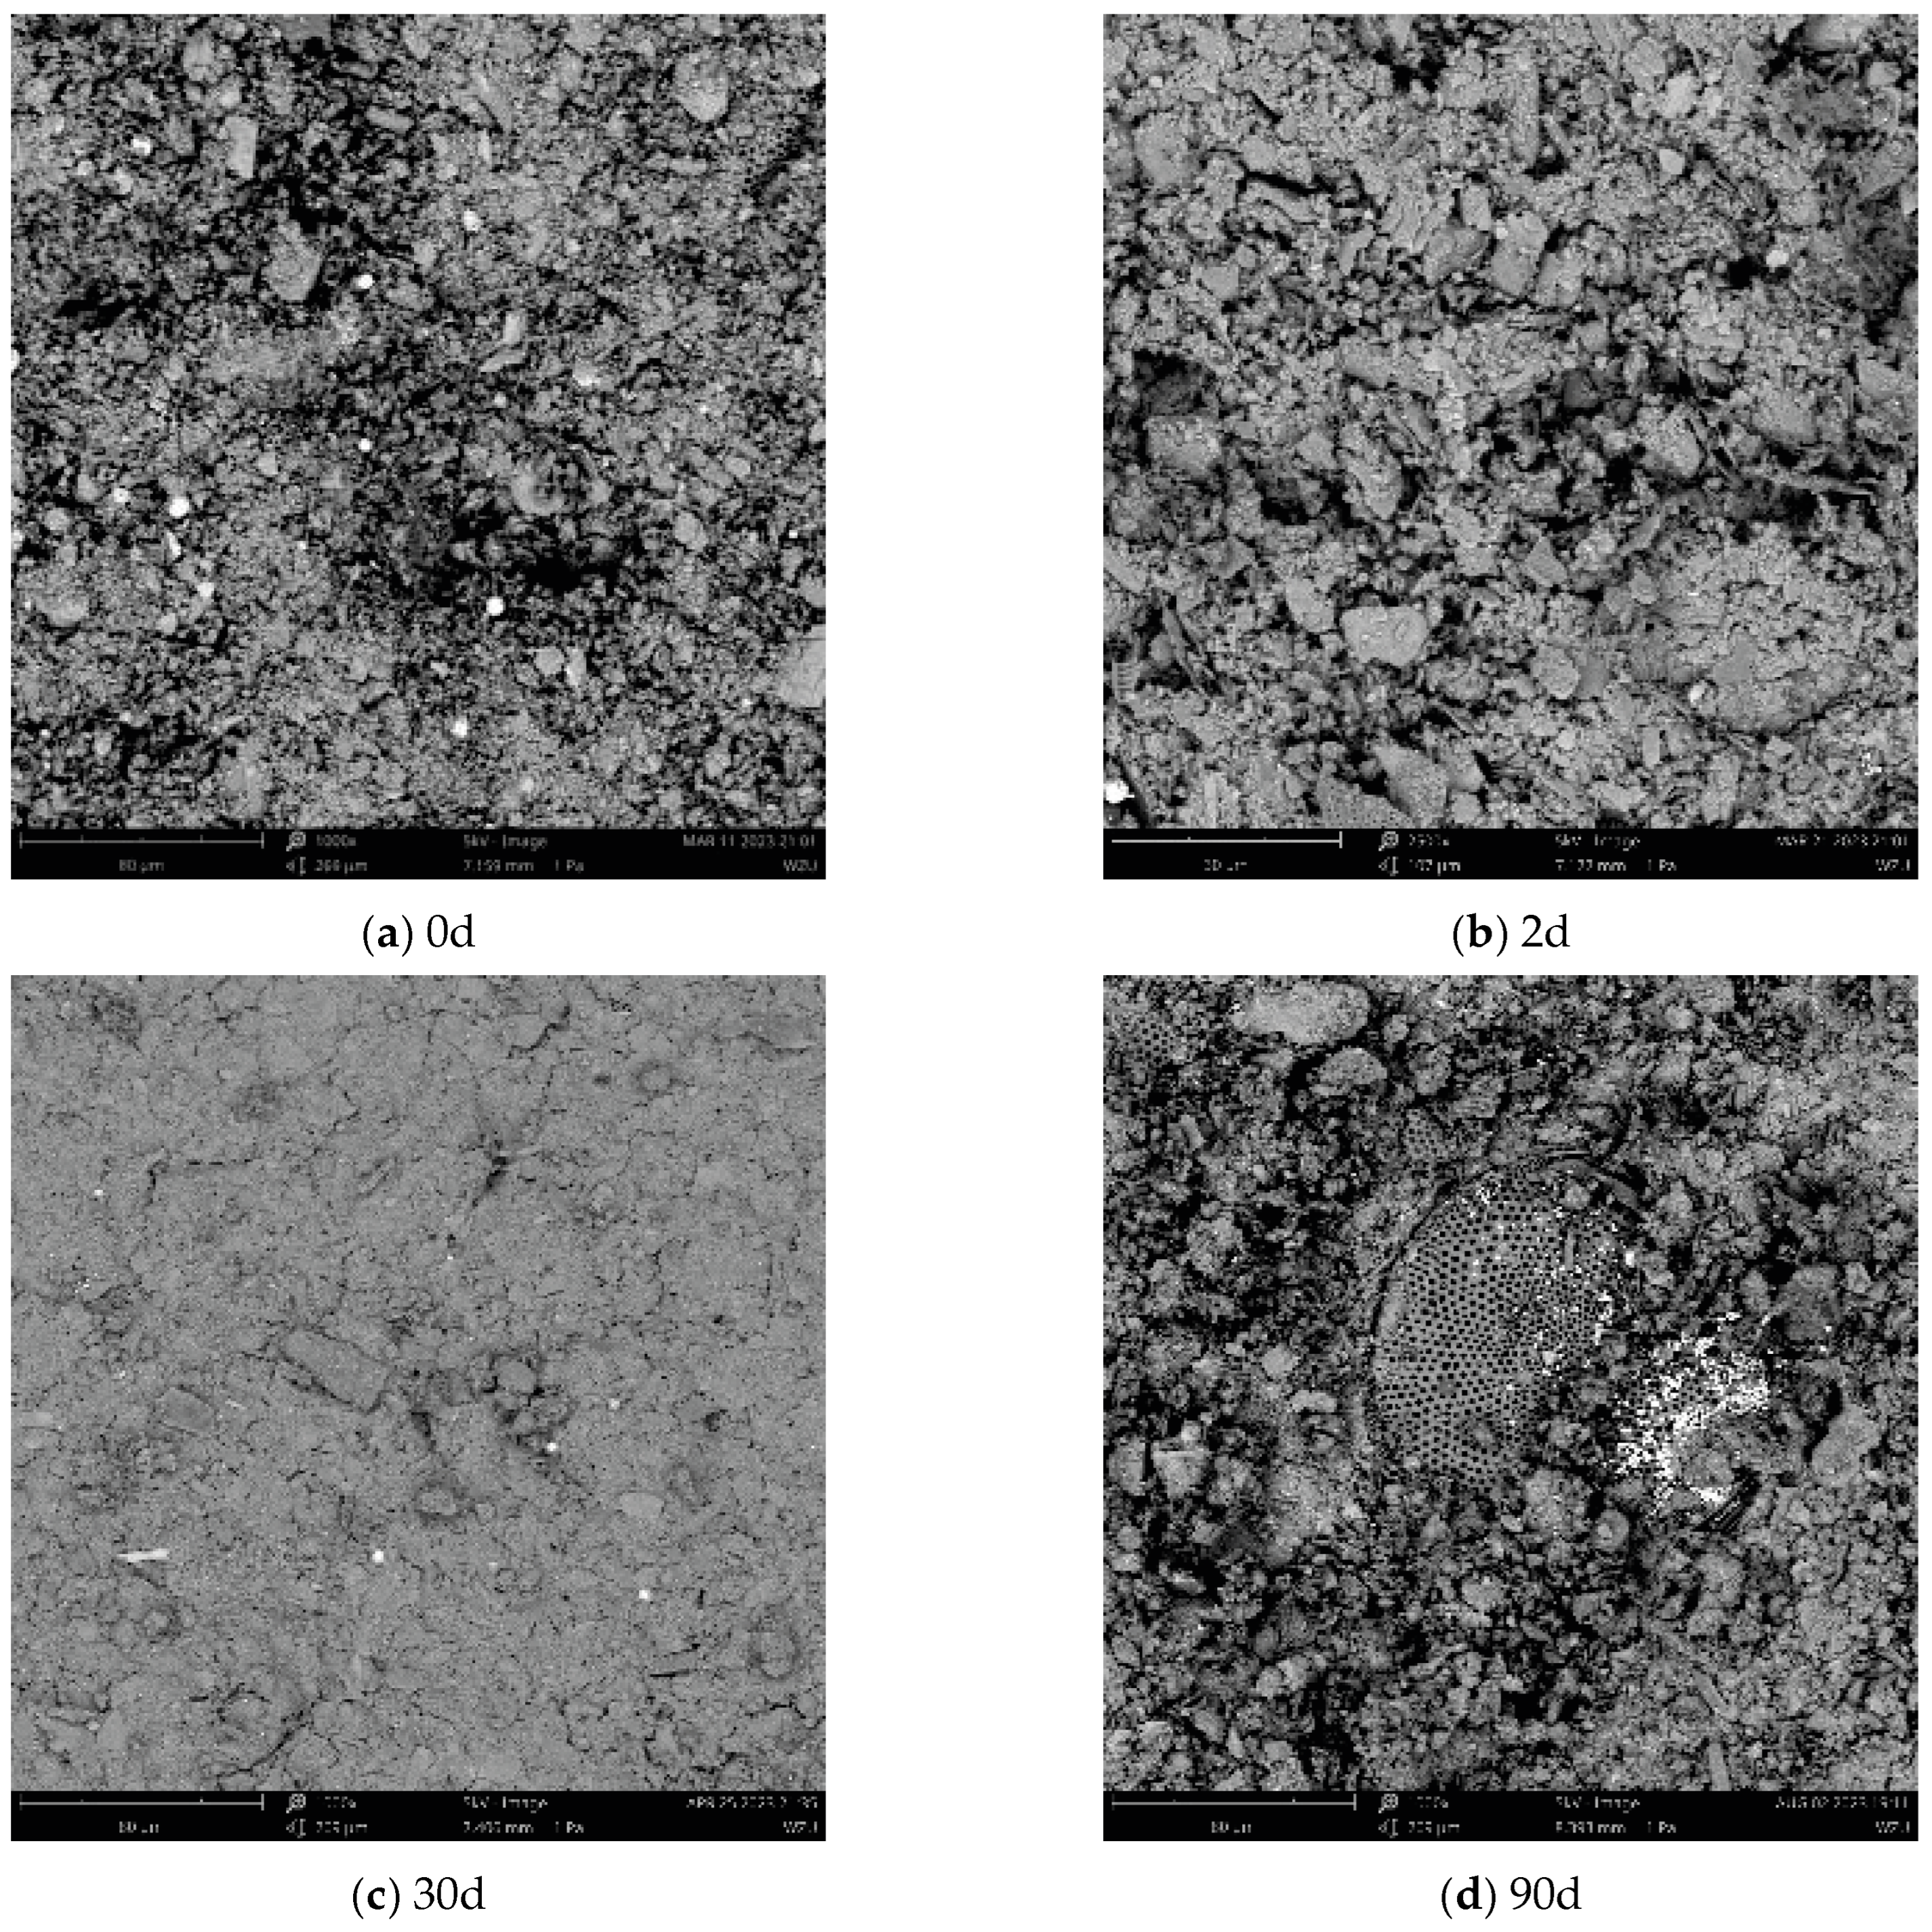
Figure 30 presents scanning electron microscopy (SEM) images of undisturbed soft soil specimen ZK4-8 after creep testing, showing progressive microstructural changes under stress. The images reveal (1) reduced pore quantity with increasing stress, consistent with PSD data; (2) structural compaction from initial flocculent/frame configurations to compressed honeycomb arrangements; (3) particle reorganization creating finer pore networks. The microstructural evolution involves frame structure compression, honeycomb formation, and development of aggregated structures where original particles maintain integrity while forming stronger bonds. These changes explain the observed creep behavior through pore reduction and particle rearrangement.
In this paper, the pore size distribution curves and SEM images are mainly used to qualitatively describe the microstructural evolution in the creep process, but there are still some quantitative deficiencies. In fact, pore area ratio, fractal dimension, particle orientation indices, and other indicators can more intuitively reflect microscopic mechanisms such as pore compression, particle rearrangement, and structural orientation. These quantitative parameters have been proven to be able to establish a good relationship between microstructural changes and macroscopic creep deformation in existing studies, thus deepening the interpretation of creep mechanisms. Due to the limitations of our experimental conditions, this study failed to fully calculate the above indicators, but the existing data can still preliminarily prove that the macroscopic creep is mainly due to the compression of macro-pores and the reconstruction of particle skeletons. Subsequent work will further introduce fractal and orientation parameter analysis to achieve quantitative coupling of micro–macro creep characteristics.
Annotation: In order to ensure the standardization of the test operation and the reliability of the data, these experiments strictly followed the corresponding international standards, national standards, and industry standards: Code for Soil Physical Property Tests (GB/T 50123-2019) [24], Standard Test Method for Laboratory Determination of Water (Moisture) Content of Soil (ASTM D2216-19) [25], Code for Soil Consolidation Tests (GB/T 50123-2019, Chapter 14), Test Method for One-Dimensional Creep of Soil (SL 237-054-1999) [26], Code for Soil Triaxial Compression Tests (GB/T 50123-2019, Chapter 20), Standard Test Method for Triaxial Creep of Soil (ASTM D7181-11) [27], Test Method for Pore Size Distribution of Porous Materials-Mercury Intrusion Method (GB/T 21650.1-2008) [28], Standard Test Method for Determination of Pore Volume and Pore Volume Distribution of Soil and Rock by Mercury Intrusion Porosimetry (ASTM D4404-18) [29], Method for Electron Microscopy Analysis of Soil (NY/T 1121.13-2006) [30], and the General Rules for Analytical Methods of Scanning Electron Microscopy (JY/T 0584-2020) [31].

6. Conclusions

This study systematically investigates the creep characteristics of undisturbed soft soil through one-dimensional creep tests, triaxial creep tests, and microstructural analyses, examining the effects of stress level, sampling depth, and creep duration. The research elucidates the microstructural evolution during creep deformation, with principal conclusions as follows.
(1) With the increase in stress level, the secondary consolidation coefficient of undisturbed soft soil increases rapidly at first, then decreases gradually and tends to be stable. The maximum secondary consolidation coefficient is 0.03 at a yield stress of 2–3 times the baseline, which is much larger than that of remolded soft soil due to the high initial porosity. The secondary consolidation coefficient of undisturbed soft soil gradually decreases with the increase in soil depth as the creep time increases.
(2) Under the long-term action, the e-lgt curve of undisturbed soft soil shows the following stages: an instantaneous deformation stage, main consolidation deformation stage, secondary consolidation deformation stage, and accelerated secondary consolidation deformation stage. The secondary consolidation coefficient increases with creep time, indicating that the creep characteristics of soft soil are not stable and have a time effect.
(3) The isochronous stress–strain curves of undisturbed soft soil exhibit limited nonlinearity while demonstrating significant dependence on confining pressure. With increasing confining pressure, these curves progressively develop more pronounced yield characteristics and undergo systematic rotation from stress-axis dominance toward strain-axis orientation, reflecting the enhanced structural constraint and modified stress path under greater confinement conditions.
(4) The microstructural test results demonstrate that the pore size distribution (PSD) curves of undisturbed soft soil exhibit a unimodal pattern. With increasing stress, sampling depth, and creep duration, both the peak pore size and pore density decrease significantly, indicating progressive compression of macro-pores. These observations confirm that the creep deformation of undisturbed soft soil primarily results from the compression and collapse of macro-pores under sustained loading.

Author Contributions

Conceptualization, Y.C. and W.Q.; Methodology, J.Q., W.Q. and Y.L.; Software, J.Q., Z.Z., G.P., K.L. and Y.L.; Validation, Y.S., J.Q., Z.Z., G.P., K.L. and Y.L.; Formal analysis, Y.C., J.Q., Z.Z., G.P., K.L. and Y.L.; Investigation, Y.C., Y.S., J.Q., Z.Z., K.L. and Y.L.; Resources, Y.C., Y.S., J.Q., G.P., K.L. and Y.L.; Data curation, Y.C., J.Q., Z.Z., G.P., K.L. and Y.L.; Writing—original draft, Y.C., Y.S., W.Q., Z.Z., G.P., K.L. and Y.L.; Writing—review & editing, Y.C., Y.S., J.Q., W.Q., Z.Z., G.P. and K.L.; Visualization, J.Q., Z.Z., G.P., K.L. and Y.L.; Supervision, W.Q.; Project administration, Y.C., Y.S. and W.Q.; Funding acquisition, W.Q. All authors have read and agreed to the published version of the manuscript.

Funding

This study is supported by the Wenzhou Science and Technology Commissioner Program (Grant No. X2023102), National Natural Science Foundation of China (Grant No. 52178349), Education Department of Zhejiang Province (Grant No. Y202454521; Y202351959), and Graduate Scientific Research Foundation of Wenzhou University (Grant No. 3162024003089; 3162024004134; 3162024004129; 3162024003086).

Data Availability Statement

The original contributions presented in this study are included in the article. Further inquiries can be directed to the corresponding authors.

Conflicts of Interest

Authors Yongwei Chen, Yi Shi and Junju Qiu were employed by the company Wenzhou Electrical Power Design Co., Ltd. The remaining authors declare that the research was conducted in the absence of any commercial or financial relationships that could be construed as a potential conflict of interest.

References

  1. Ren, X.-W.; Xu, Q.; Teng, J.-D.; Zhao, N.; Lv, L. A Novel Model for the Cumulative Plastic Strain of Soft Marine Clay under Long-Term Low Cyclic Loads. Ocean Eng. 2018, 149, 194–204. [Google Scholar] [CrossRef]
  2. Qin, W.; Cai, S.-Y.; Dai, G.-L.; Wang, D.; Chang, K.-T. Soil Resistance during Driving of Offshore Large-Diameter Open-Ended Thin-Wall Pipe Piles Driven into Clay by Impact Hammers. Comput. Geotech. 2023, 153, 105085. [Google Scholar] [CrossRef]
  3. Zhang, T.; Li, T.; Feng, S. Elastoplastic Modelling for Long-Term Cyclic Stability of Soft Clays with Consideration of Structure Damage. Soil Dyn. Earthq. Eng. 2023, 166, 107727. [Google Scholar] [CrossRef]
  4. Chen, Z.-W.; Deng, H.-Y.; Dai, G.-L.; Zhu, M.-X.; Gong, W.-M.; Azadi, M.R. Study on the Influence of Unsymmetrical Surcharge on Adjacent Pile Foundations in a Coastal Soft Soil Area. Soil Dyn. Earthq. Eng. 2025, 194, 109365. [Google Scholar] [CrossRef]
  5. Zhou, Q.-J.; Chen, X.-P. Experimental Study on Creep Characteristics of Soft Soils. Chin. J. Geotech. Eng. 2006, 28, 626–630. [Google Scholar]
  6. Liang, R.-K.; Zhang, Q.-J.; Zhang, C.; Dong, L.I.; Dong, S.U.; Qiang, L.I. Creep Characteristics and Model Parameters of Qianhai Soft Soil. Chin. J. Geotech. Eng. 2021, 43, 133–136. [Google Scholar] [CrossRef]
  7. De-An, S.; Chen, B. Mechanical Behavior of Remolded Overconsolidated Shanghai Soft Clay and Its Elastoplastic Simulation. Rock Soil Mech. 2010, 31, 1739–1743. [Google Scholar]
  8. Shao, G.-H.; Liu, S.-Y. Research on Secondary Consolidation of Structural Marine Clays. Rock Soil Mech. 2013, 29, 2057–2062. [Google Scholar]
  9. Sun, M.-Q.; Wang, Q.; Niu, C.-C.; Sun, T. Consolidation and Creep Theory Based on Terzaghi Consolidation Theory and Empirical Creep Model. J. Northeast. Univ. (Nat. Sci.) 2016, 37, 1188. [Google Scholar] [CrossRef]
  10. Chen, X.-P.; Zhou, Q.-J.; Zhu, H.-H.; Zhang, B. Research on Creep and Consolidation Characteristics of Soft Soil. Rock Soil Mech. 2014, 28, 1–10. [Google Scholar]
  11. Chen, X.-P.; Zhu, H.-H.; Zhang, F.-Z.; Zhang, B. Experimental Study on Time-Dependent Deformation of Soft Soil. Chin. J. Rock Mech. Eng. 2005, 24, 2142–2148. [Google Scholar]
  12. Zhu, H.-H.; Chen, X.-P.; Cheng, X.-J.; Zhang, B. Study on Creep Characteristics and Model of Soft Soil Considering Drainage Condition. Rock Soil Mech. 2013, 27, 694–698. [Google Scholar]
  13. Yang, A.-W.; Zhang, Z.-J.; Kong, L.-W. Experimental Study of Creep Property of Soft Clay under Different Stress Conditions. Rock Soil Mech. 2014, 35, 53–60. [Google Scholar]
  14. Lapierre, C.; Leroueil, S.; Locat, J. Mercury Intrusion and Permeability of Louiseville Clay. Can. Geotech. J. 1990, 27, 761–773. [Google Scholar] [CrossRef]
  15. Gutierrez, N.H.M.; de Nóbrega, M.T.; Vilar, O.M. Influence of the Microstructure in the Collapse of a Residual Clayey Tropical Soil. Bull. Eng. Geol. Env. 2009, 68, 107–116. [Google Scholar] [CrossRef]
  16. Xie, X.; Qi, S.-W.; Zhao, F.-S.; Wang, D.-H. Creep Behavior and the Microstructural Evolution of Loess-like Soil from Xi’an Area, China. Eng. Geol. 2018, 236, 43–59. [Google Scholar] [CrossRef]
  17. Asadoullahtabar, S.R.; Asgari, A.; Mohammad Rezapour Tabari, M. Assessment, Identifying, and Presenting a Plan for the Stabilization of Loessic Soils Exposed to Scouring in the Path of Gas Pipelines, Case Study: Maraveh-Tappeh City. Eng. Geol. 2024, 342, 107747. [Google Scholar] [CrossRef]
  18. Burton, G.J.; Pineda, J.A.; Sheng, D.; Airey, D. Microstructural Changes of an Undisturbed, Reconstituted and Compacted High Plasticity Clay Subjected to Wetting and Drying. Eng. Geol. 2015, 193, 363–373. [Google Scholar] [CrossRef]
  19. Sun, H.; Chen, J.F.; Ge, X.R. Deformation Characteristics of Silty Clay Subjected to Triaxial Loading, by Computerised Tomography. Geotechnique 2004, 54, 307–314. [Google Scholar] [CrossRef]
  20. Sun, H.; Hou, M.-X.; Chen, C.; Ge, X.-R. Microstructure Investigation of Soft Clay Subjected to Triaxial Loading. Eng. Geol. 2020, 274, 105735. [Google Scholar] [CrossRef]
  21. Kuo, Y.S.; Lin, C.S.; Chai, J.F.; Chang, Y.W.; Tseng, Y.H. Case Study of the Ground Motion Analyses and Seabed Soil Liquefaction Potential of Changbin Offshore Wind Farm. J. Mar. Sci. Technol. 2019, 27, 448–462. [Google Scholar] [CrossRef]
  22. Adalier, K.; Elgamal, A.; Meneses, J.; Baez, J.I. Stone Columns as Liquefaction Countermeasure in Non-Plastic Silty Soils. Soil Dyn. Earthq. Eng. 2003, 23, 571–584. [Google Scholar] [CrossRef]
  23. Asgari, A.; Ahmadtabar Sorkhi, S.F. Wind Turbine Performance under Multi-Hazard Loads: Wave, Wind, and Earthquake Effects on Liquefiable Soil. Results Eng. 2025, 26, 104647. [Google Scholar] [CrossRef]
  24. GB/T 50123-2019; Code for Soil Physical Property Tests. Ministry of Housing and Urban-Rural Development of the People’s Republic of China: Beijing, China, 2019.
  25. ASTM D2216-19; Standard Test Method for Laboratory Determination of Water (Moisture) Content of Soil by Mass. ASTM International: West Conshohocken, PA, USA, 2019.
  26. SL 237-054-1999; Test Method for One-Dimensional Creep of Soil. Ministry of Water Resources of the People’s Republic of China: Beijing, China, 1999.
  27. ASTM D7181-11; Standard Test Method for Consolidated Drained Triaxial Compression Test for Soils. ASTM International: West Conshohocken, PA, USA, 2011.
  28. GB/T 21650.1-2008; Test Method for Pore Size Distribution of Porous Materials—Mercury Intrusion Method. Standardization Administration of China: Beijing, China, 2008.
  29. ASTM D4404-18; Standard Test Method for Determination of Pore Volume and Pore Volume Distribution of Soil and Rock by Mercury Intrusion Porosimetry. ASTM International: West Conshohocken, PA, USA, 2018.
  30. NY/T 1121.13-2006; Method for Electron Microscopy Analysis of Soil. Ministry of Agriculture of the People’s Republic of China: Beijing, China, 2006.
  31. JY/T 0584-2020; General Rules for Analytical Methods of Scanning Electron Microscopy. Ministry of Education of the People’s Republic of China: Beijing, China, 2020.
Figure 1. Schematic diagram of Ml line project of Wenzhou rail transit.
Jmse 13 01943 g001
Figure 2. Sampling hole location map.
Jmse 13 01943 g002
Figure 3. Soil sample dimensions.
Jmse 13 01943 g003
Figure 4. e-lgσ curves.
Jmse 13 01943 g004aJmse 13 01943 g004bJmse 13 01943 g004c
Figure 5. In situ soft soil excavation process.
Jmse 13 01943 g005
Figure 6. Triaxial specimen preparation for in situ soft soil.
Jmse 13 01943 g006
Figure 7. Sample preparation for fine structure observation: (a) clods of earth; (b) liquid nitrogen tank; (c) vertical freeze-dryer.
Jmse 13 01943 g007
Figure 8. One-dimensional consolidation of soil.
Jmse 13 01943 g008
Figure 9. e-lgt curves for in situ soft soil.
Jmse 13 01943 g009aJmse 13 01943 g009b
Figure 10. e-lgt curves of in situ soft soil under different vertical stresses.
Jmse 13 01943 g010
Figure 11. Stress versus time at the beginning of the secondary consolidation curve.
Jmse 13 01943 g011
Figure 12. e-lgt curves for in situ soft soil at different extraction depths (σ = 1600 kPa).
Jmse 13 01943 g012aJmse 13 01943 g012b
Figure 13. e-lgt curves of in situ soft soil at σ = 1600 kPa for different extraction depths.
Jmse 13 01943 g013aJmse 13 01943 g013b
Figure 14. Depth of extraction vs. time.
Jmse 13 01943 g014
Figure 15. Secondary consolidation coefficient versus stress curves.
Jmse 13 01943 g015
Figure 16. Stress–strain relationship curve of in situ soft soil.
Jmse 13 01943 g016
Figure 17. Different time/e-lgt curves for in situ soft soil at different extraction depths.
Jmse 13 01943 g017
Figure 18. Plots of secondary consolidation coefficient vs. time.
Jmse 13 01943 g018
Figure 19. Stress–strain isochronous relationship curves.
Jmse 13 01943 g019aJmse 13 01943 g019b
Figure 20. zk3-1 axial strain–time relationship curves for in situ soft soil.
Jmse 13 01943 g020
Figure 21. zk3-2 axial strain–time relationship curves for in situ soft soil.
Jmse 13 01943 g021aJmse 13 01943 g021b
Figure 22. zk3-3 axial strain–time relationship curves for in situ soft soil.
Jmse 13 01943 g022aJmse 13 01943 g022b
Figure 23. Triaxial creep test curves of in situ soft soil.
Jmse 13 01943 g023
Figure 24. zk3-1 isochronous relationship curves of bias stress–strain under different enclosure pressures.
Jmse 13 01943 g024
Figure 25. zk3-2 isochronous relationship curves of bias stress–strain under different enclosure pressures.
Jmse 13 01943 g025aJmse 13 01943 g025b
Figure 26. zk3-3 isochronous relationship curves of bias stress–strain under different enclosure pressures.
Jmse 13 01943 g026
Figure 27. PSD curves of zk4-8 at different stresses: (a) eMIP curve; (b) PSD curve.
Jmse 13 01943 g027
Figure 28. PSD curves at different depths of extraction.
Jmse 13 01943 g028
Figure 29. zk4-8 SEM (×1000) photographs at 400 kPa with different creep times.
Jmse 13 01943 g029
Figure 30. PSD curves of in situ soft soils at different times.
Jmse 13 01943 g030
Table 1. Basic physical properties of in situ soft soils.
Specific Gravity
(Gs)
Liquid Limit
(WL)
Plastic Limit
(WP)
Plasticity Index
(IP)
Porosity Ratio
(e)
Moisture Content
(w)
2.6565.56%32.73%32.931.58864.41%
Table 2. In situ soft soil components.
Test ItemsPhysical AppearanceProportionTest ItemsPhysical AppearanceProportion
Lithological analysisCalcite4 ± 1%Lithological analysisAmphibolite0.5%
Dolomite21 ± 1%Clinochlore5 ± 1%
Quartz22 ± 2%Hematite4 ± 1%
Albite9 ± 2%Anatase0.7%
Microcline4 ± 2%Illite3 ± 1%
Kaolinite10 ± 2%Amorphous-phase material15 ± 3%
Mica21 ± 1%
Specific surface area/31.3 m2/g
Table 3. List of indicators of mechanical properties of in situ soft soils.
Drill
Hole
Number
Soil
Sample
Number
Sampling
Depth
Mechanical Properties
Compression Coefficient Compressive ModulusCompression IndexPreliminary Consolidation Pressure
aEsCcPc
MPa−1MPa-kPa
ZK21−4.55 m~−4.85 m1.931.3940.64153
ZK22−5.65 m~−5.95 m1.851.4030.61549
ZK23−6.75 m~−7.05 m1.611.5740.53561
ZK24−7.85 m~−8.15 m1.331.9750.44272
ZK31−6.66 m~−6.96 m2.141.3140.71140
ZK32−7.76 m~−8.06 m1.871.4670.62147
ZK33−8.86 m~−9.16 m2.321.2450.77145
ZK34−10.06 m~−10.36 m2.831.0540.94070
ZK48−14.27 m~−14.57 m2.071.2780.68860
ZK56−13.53 m~−13.83 m1.781.5240.59290
Table 4. One-dimensional in situ soil creep test program.
SoilDrill Hole Numberσ (kPa)T (d)
Undisturbed soft soilzk2-1, zk2-2, zk2-3, zk2-4, zk3-1, zk3-2, zk3-3, zk3-4, zk4-8, zk5-616002
4002, 30, 90
Note: The sampling depths for undisturbed soft soil are as follows: zk2-1 (−4.55 m~−4.85 m), zk2-2 (−5.65 m~−5.95 m), zk2-3 (−6.75 m~−7.05 m), zk2-4 (−7.85 m~−8.15 m), zk3-1 (−6.66 m~−6.96 m), zk3-2 (−7.76 m~−8.06 m), zk3-3 (−8.86 m~−9.16 m), zk3-4 (−10.06 m~−10.36 m), zk4-8 (−14.27 m~−14.57 m), zk5-6 (−11.13 m~−11.43 m).
Table 5. Triaxial creep test program.
SoilConfining Pressure σ3 (kPa)Axial Stress
σ1
(kPa)
Axial
Deviatoric Stress
q
(kPa)
Each Level of Time (d)
Undisturbed Soft Soil (zk3-1, zk3-2, zk3-3)2537.512.51
4015
4520
5025
5530
6035
5075251
87.537.5
10050
112.562.5
12070
12575
100125251
15050
17575
2001002
225125
250150
200250501
300100
3251252
350150
375175
400200
Table 6. Basic physico-mechanical parameters of in situ soft soils.
Drill Hole Number
Soil Sampling Depth
Water Content
W (%)
Specific Gravity
Gs
Density
ρ (g/cm3)
Porosity Ratio
e
Liquid Limit
WL (%)
Plastic Limit
Wp (%)
zk3-1 (−6.66 m~−6.96 m)68.212.6481.5831.81357.7025.03
zk3-2 (−7.76 m~−8.06 m)65.052.6311.5831.74457.7029.64
zk3-3 (−8.86 m~−9.16 m)70.871.8891.5611.88959.2333.77
Disclaimer/Publisher’s Note: The statements, opinions and data contained in all publications are solely those of the individual author(s) and contributor(s) and not of MDPI and/or the editor(s). MDPI and/or the editor(s) disclaim responsibility for any injury to people or property resulting from any ideas, methods, instructions or products referred to in the content.