Life Cycle Assessment of Shipbuilding Materials and Potential Exposure Under the EU CBAM: Scenario-Based Assessment and Strategic Responses
Abstract
1. Introduction
1.1. Background
1.2. Current Issue
1.2.1. Implications of CBAM Uncertainty
1.2.2. Maritime LCA and Prior Studies
1.3. Research Gap
1.4. Objectives and Contributions
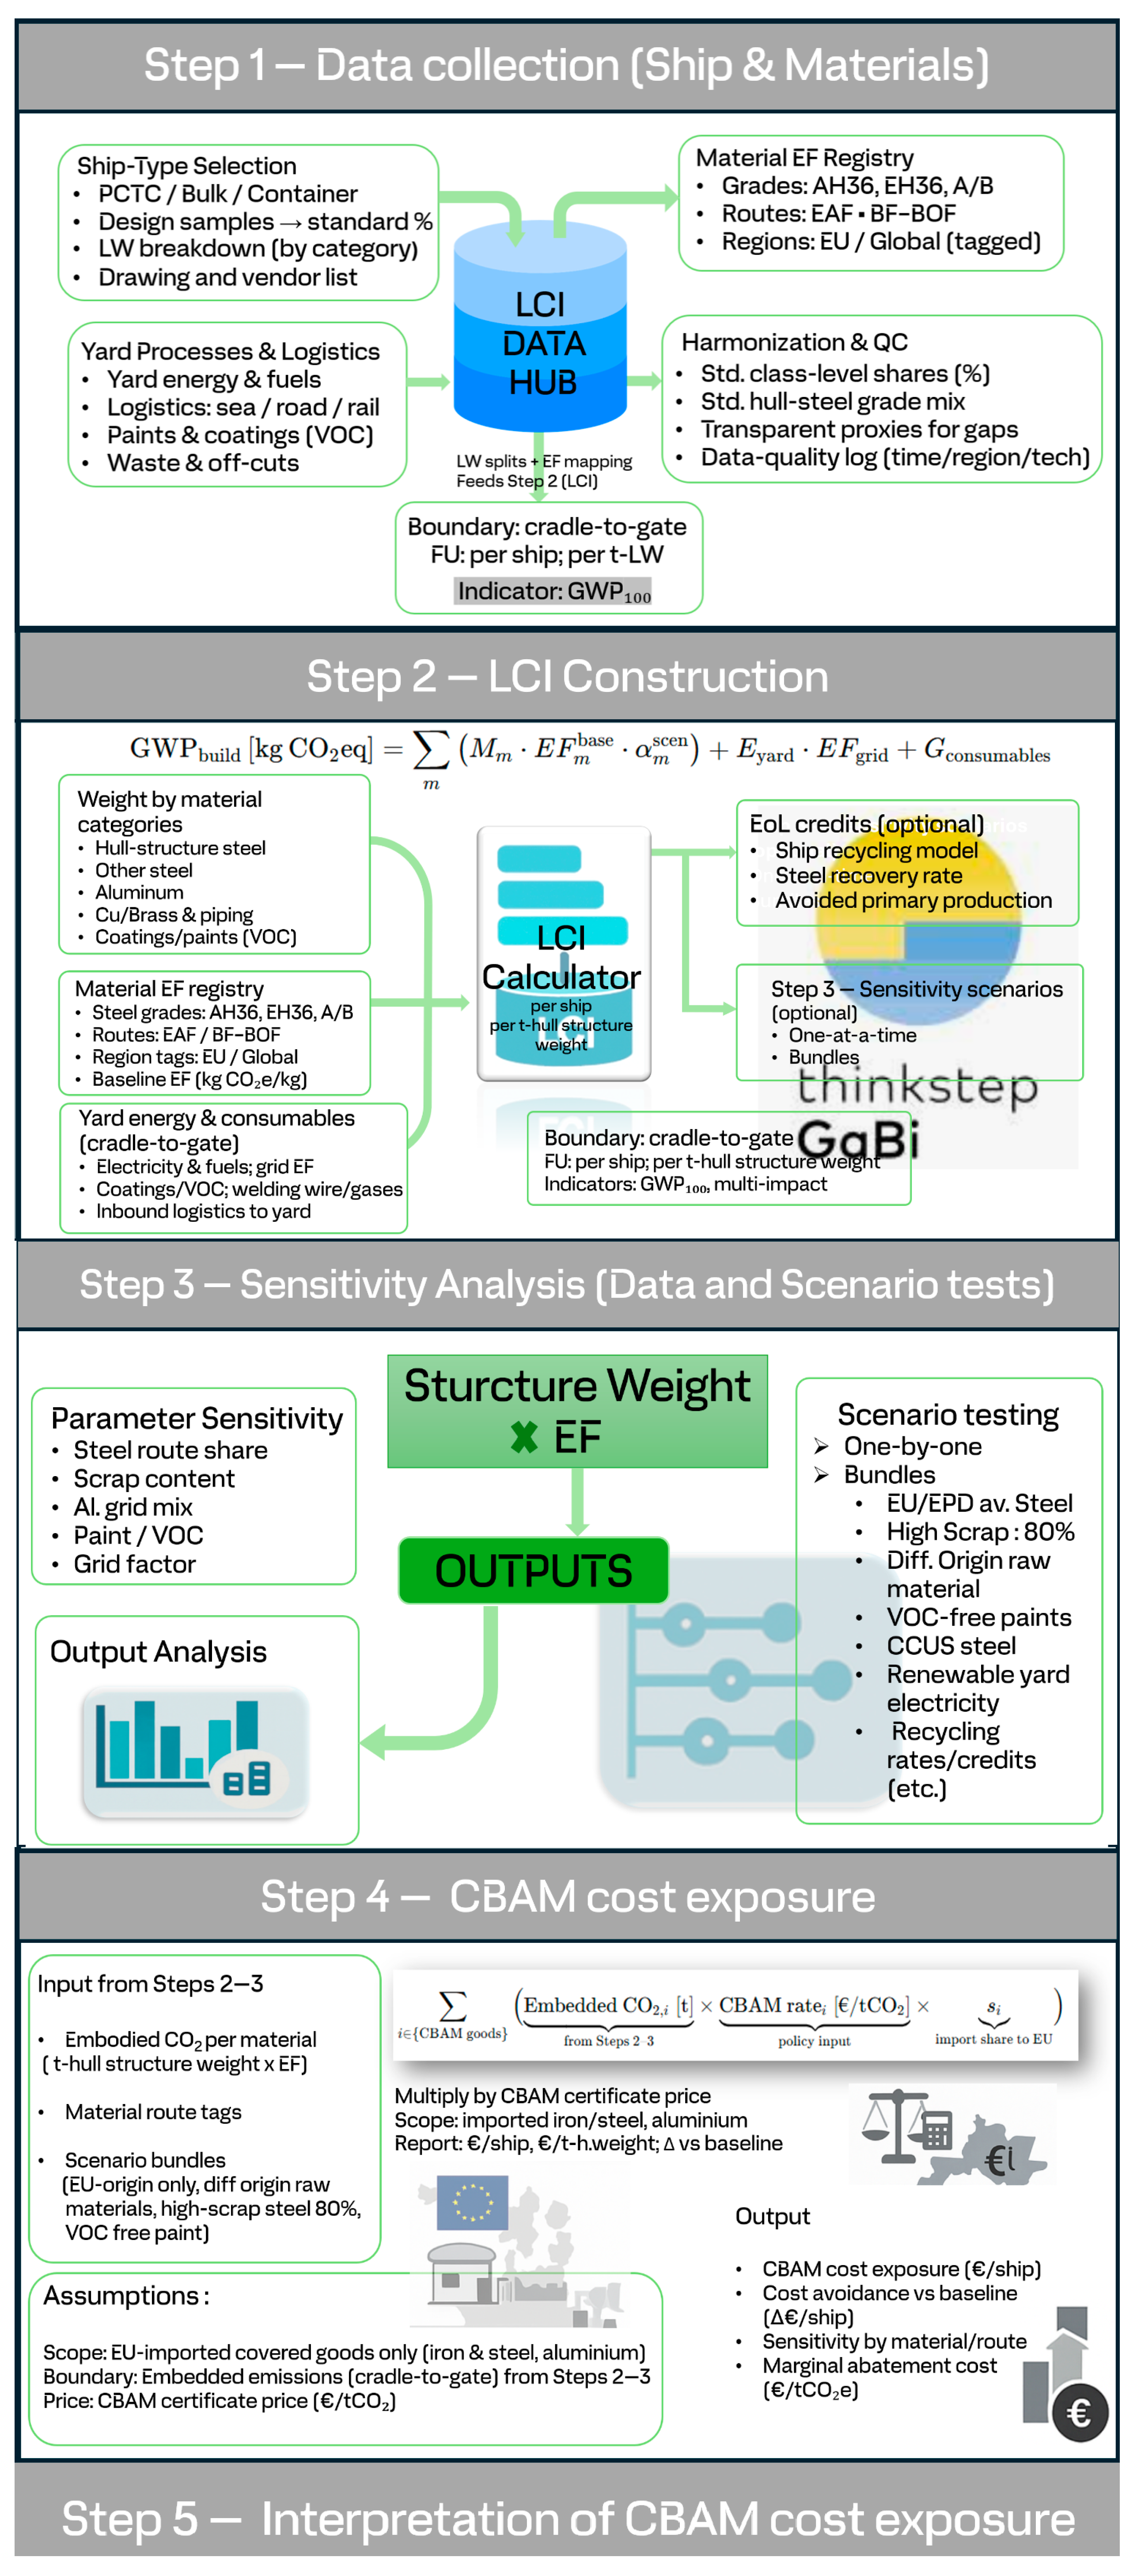
2. Methodology (Overview and Study Boundary)
- total greenhouse gas (GHG) emissions normalized per ton of hull structure steel (primary FU, kg CO2-eq/t steel), and
- total emissions per ship (kg CO2-eq/ship) to reflect absolute scale.
2.1. Step 1: Data Collection (Ship and Materials)
2.2. Step 2: Life Cycle Inventory (LCI) Construction
- Mm: mass of material m
- EFm_base: baseline emission factor
- αm,scen: scenario-based adjustment factor
- Eyard: shipyard energy use
- EFgrid: emission intensity of the electricity used
- Gconsumables: emissions from paint, welding, and other consumables.
- total CO2-equivalent emissions per ship,
- emissions per ton of hull structure steel (main reference unit),
- optionally, emissions per ton of lightweight or per ton-nautical mile.
Life Cycle Inventory (LCI) Setup
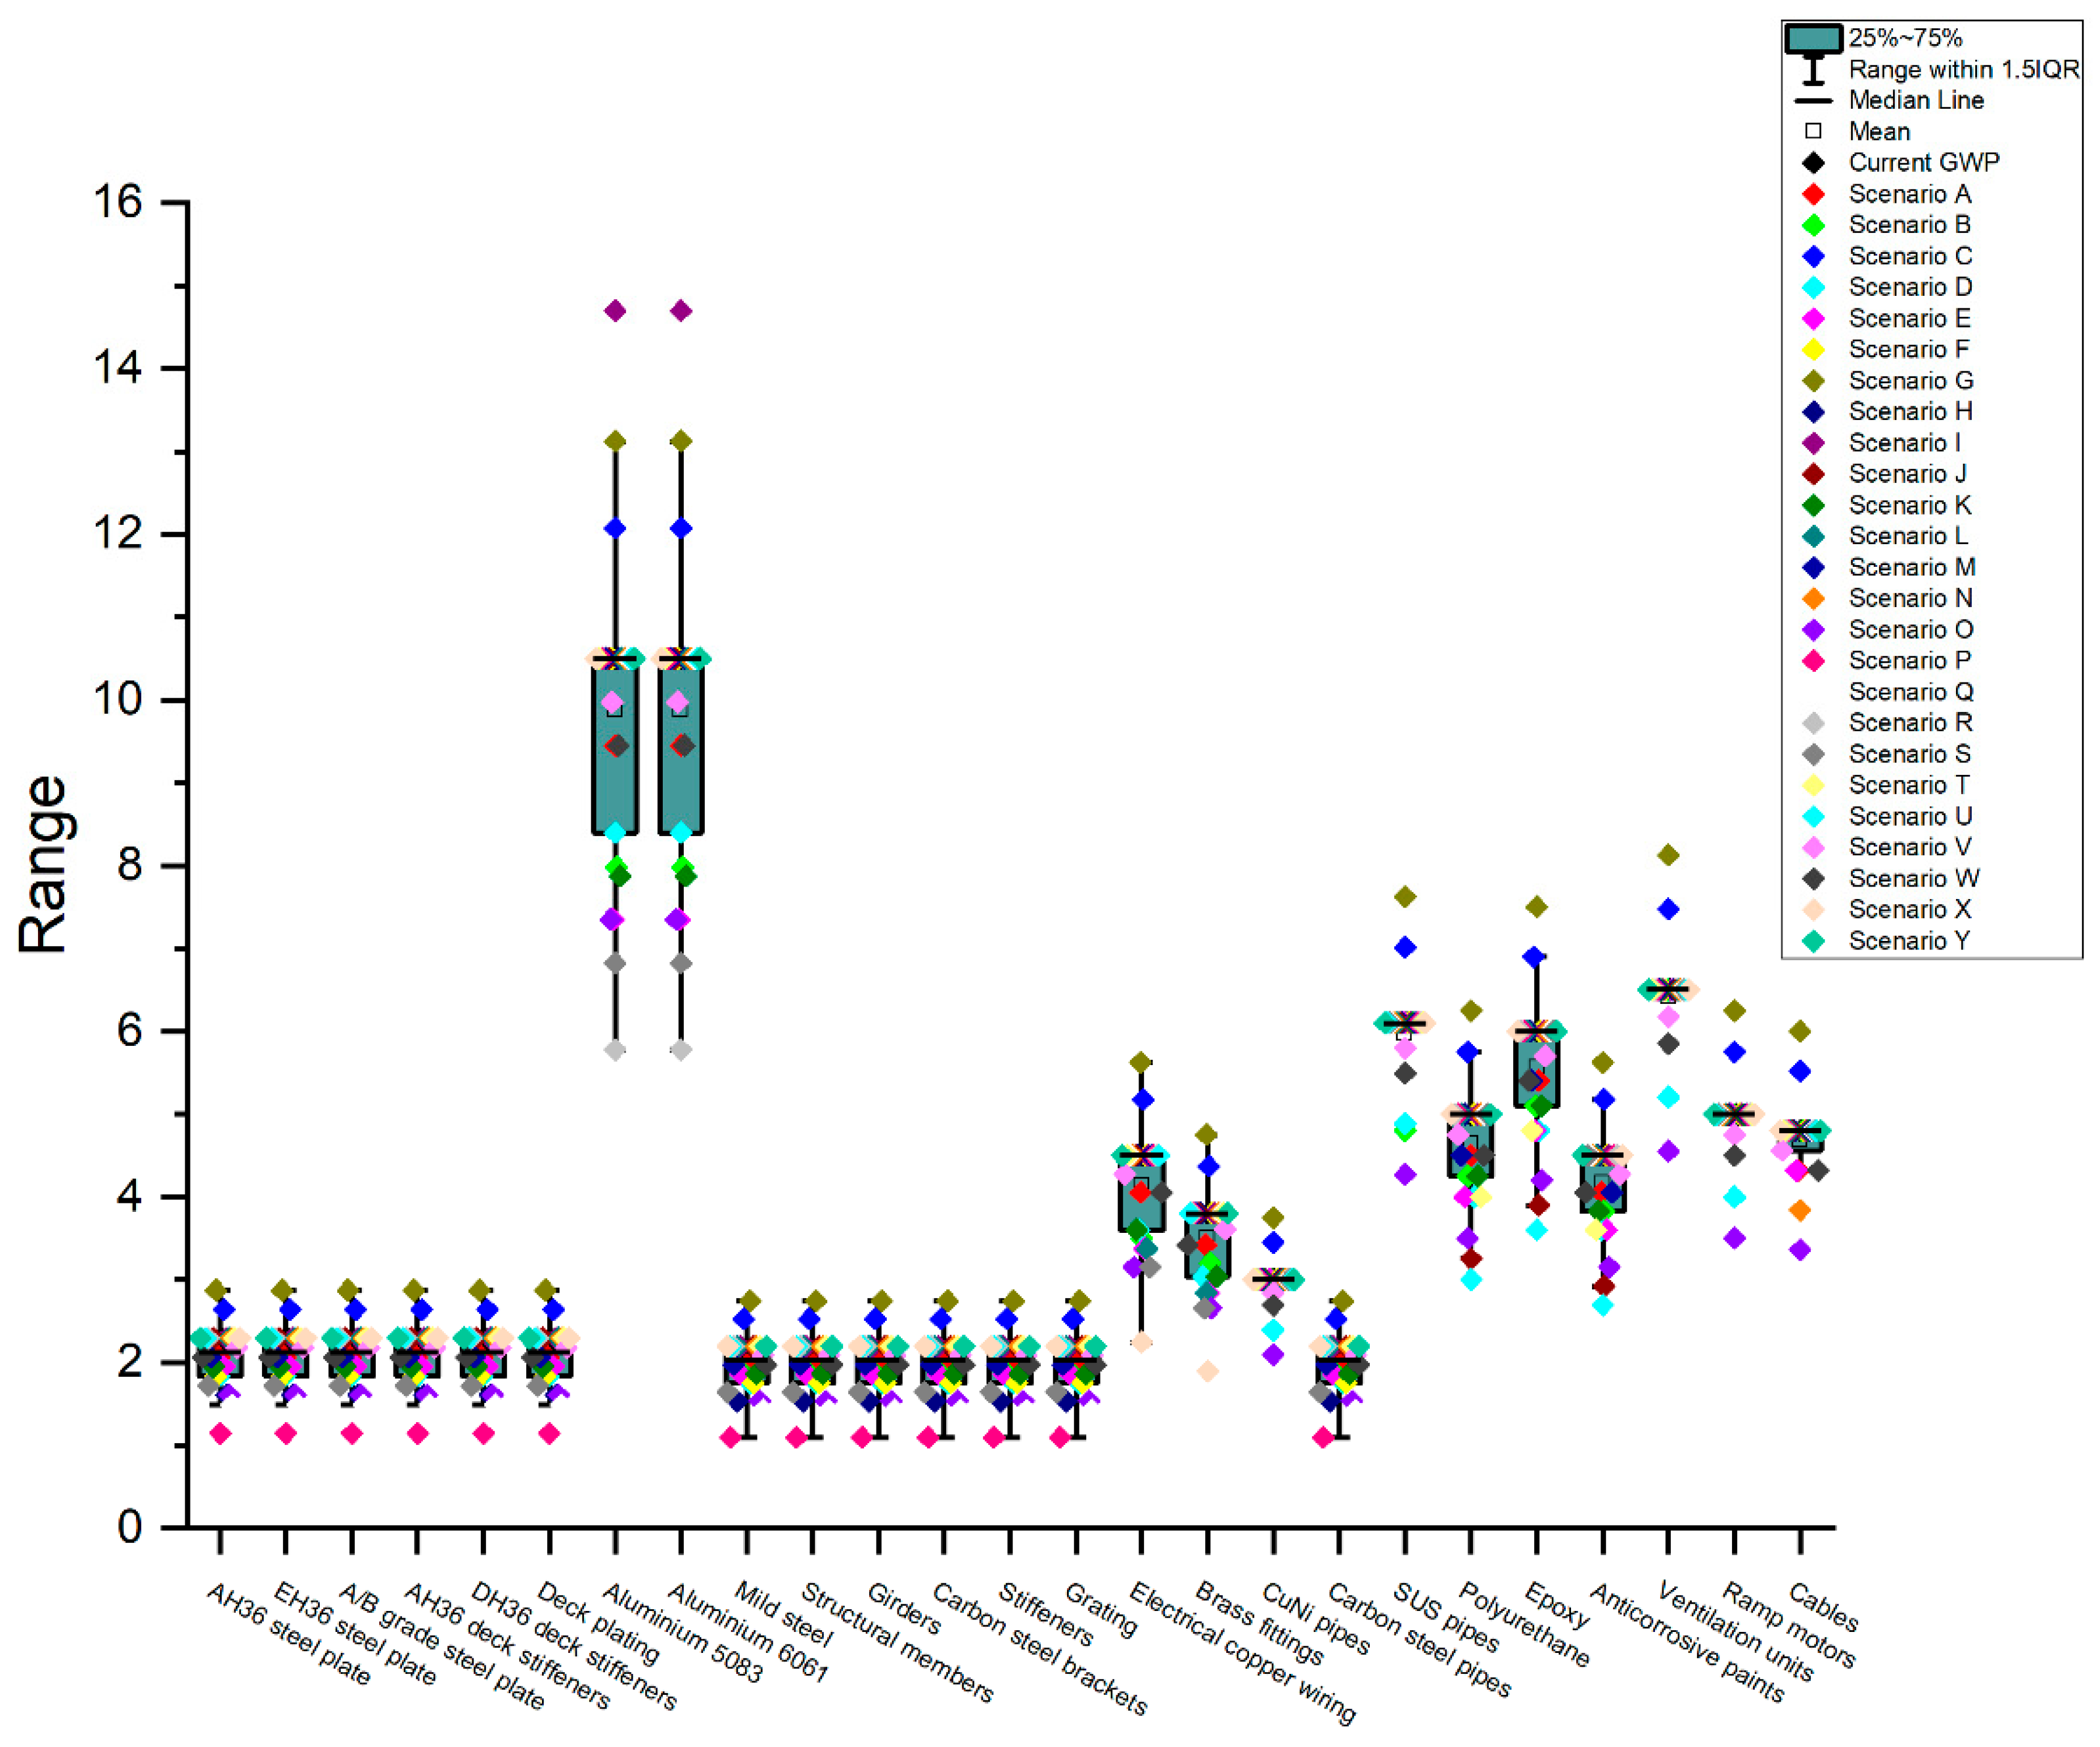
2.3. Step 3: Sensitivity Analysis (Input Ranges and Scenarios)
- Input variation: Key parameters such as steel production method, scrap ratio, aluminium electricity source, coating type, and recycling rate were perturbed individually in a one-at-a-time (OAT) fashion. The resulting absolute changes in total embedded GHG emissions and EUR/ship CBAM exposure were quantified. Results are presented as sensitivity bar charts, ranking the relative influence of each factor.
- Scenario testing: grouped assumptions are applied to reflect realistic procurement or design strategies, complementing the OAT analysis by illustrating how combined measures shift total outcomes.
- using steel from EU/EAF routes,
- selecting high-scrap content,
- applying VOC-free or bio-based paints,
- shortening supply chains,
- or reducing structure mass.
2.4. Step 4: Carbon Cost Exposure Under CBAM
- Total CBAM exposure per ship (EUR/ship)
- Breakdown by material category and region of origin
- Scenario-based comparisons to quantify potential cost avoidance from low-carbon sourcing strategies.
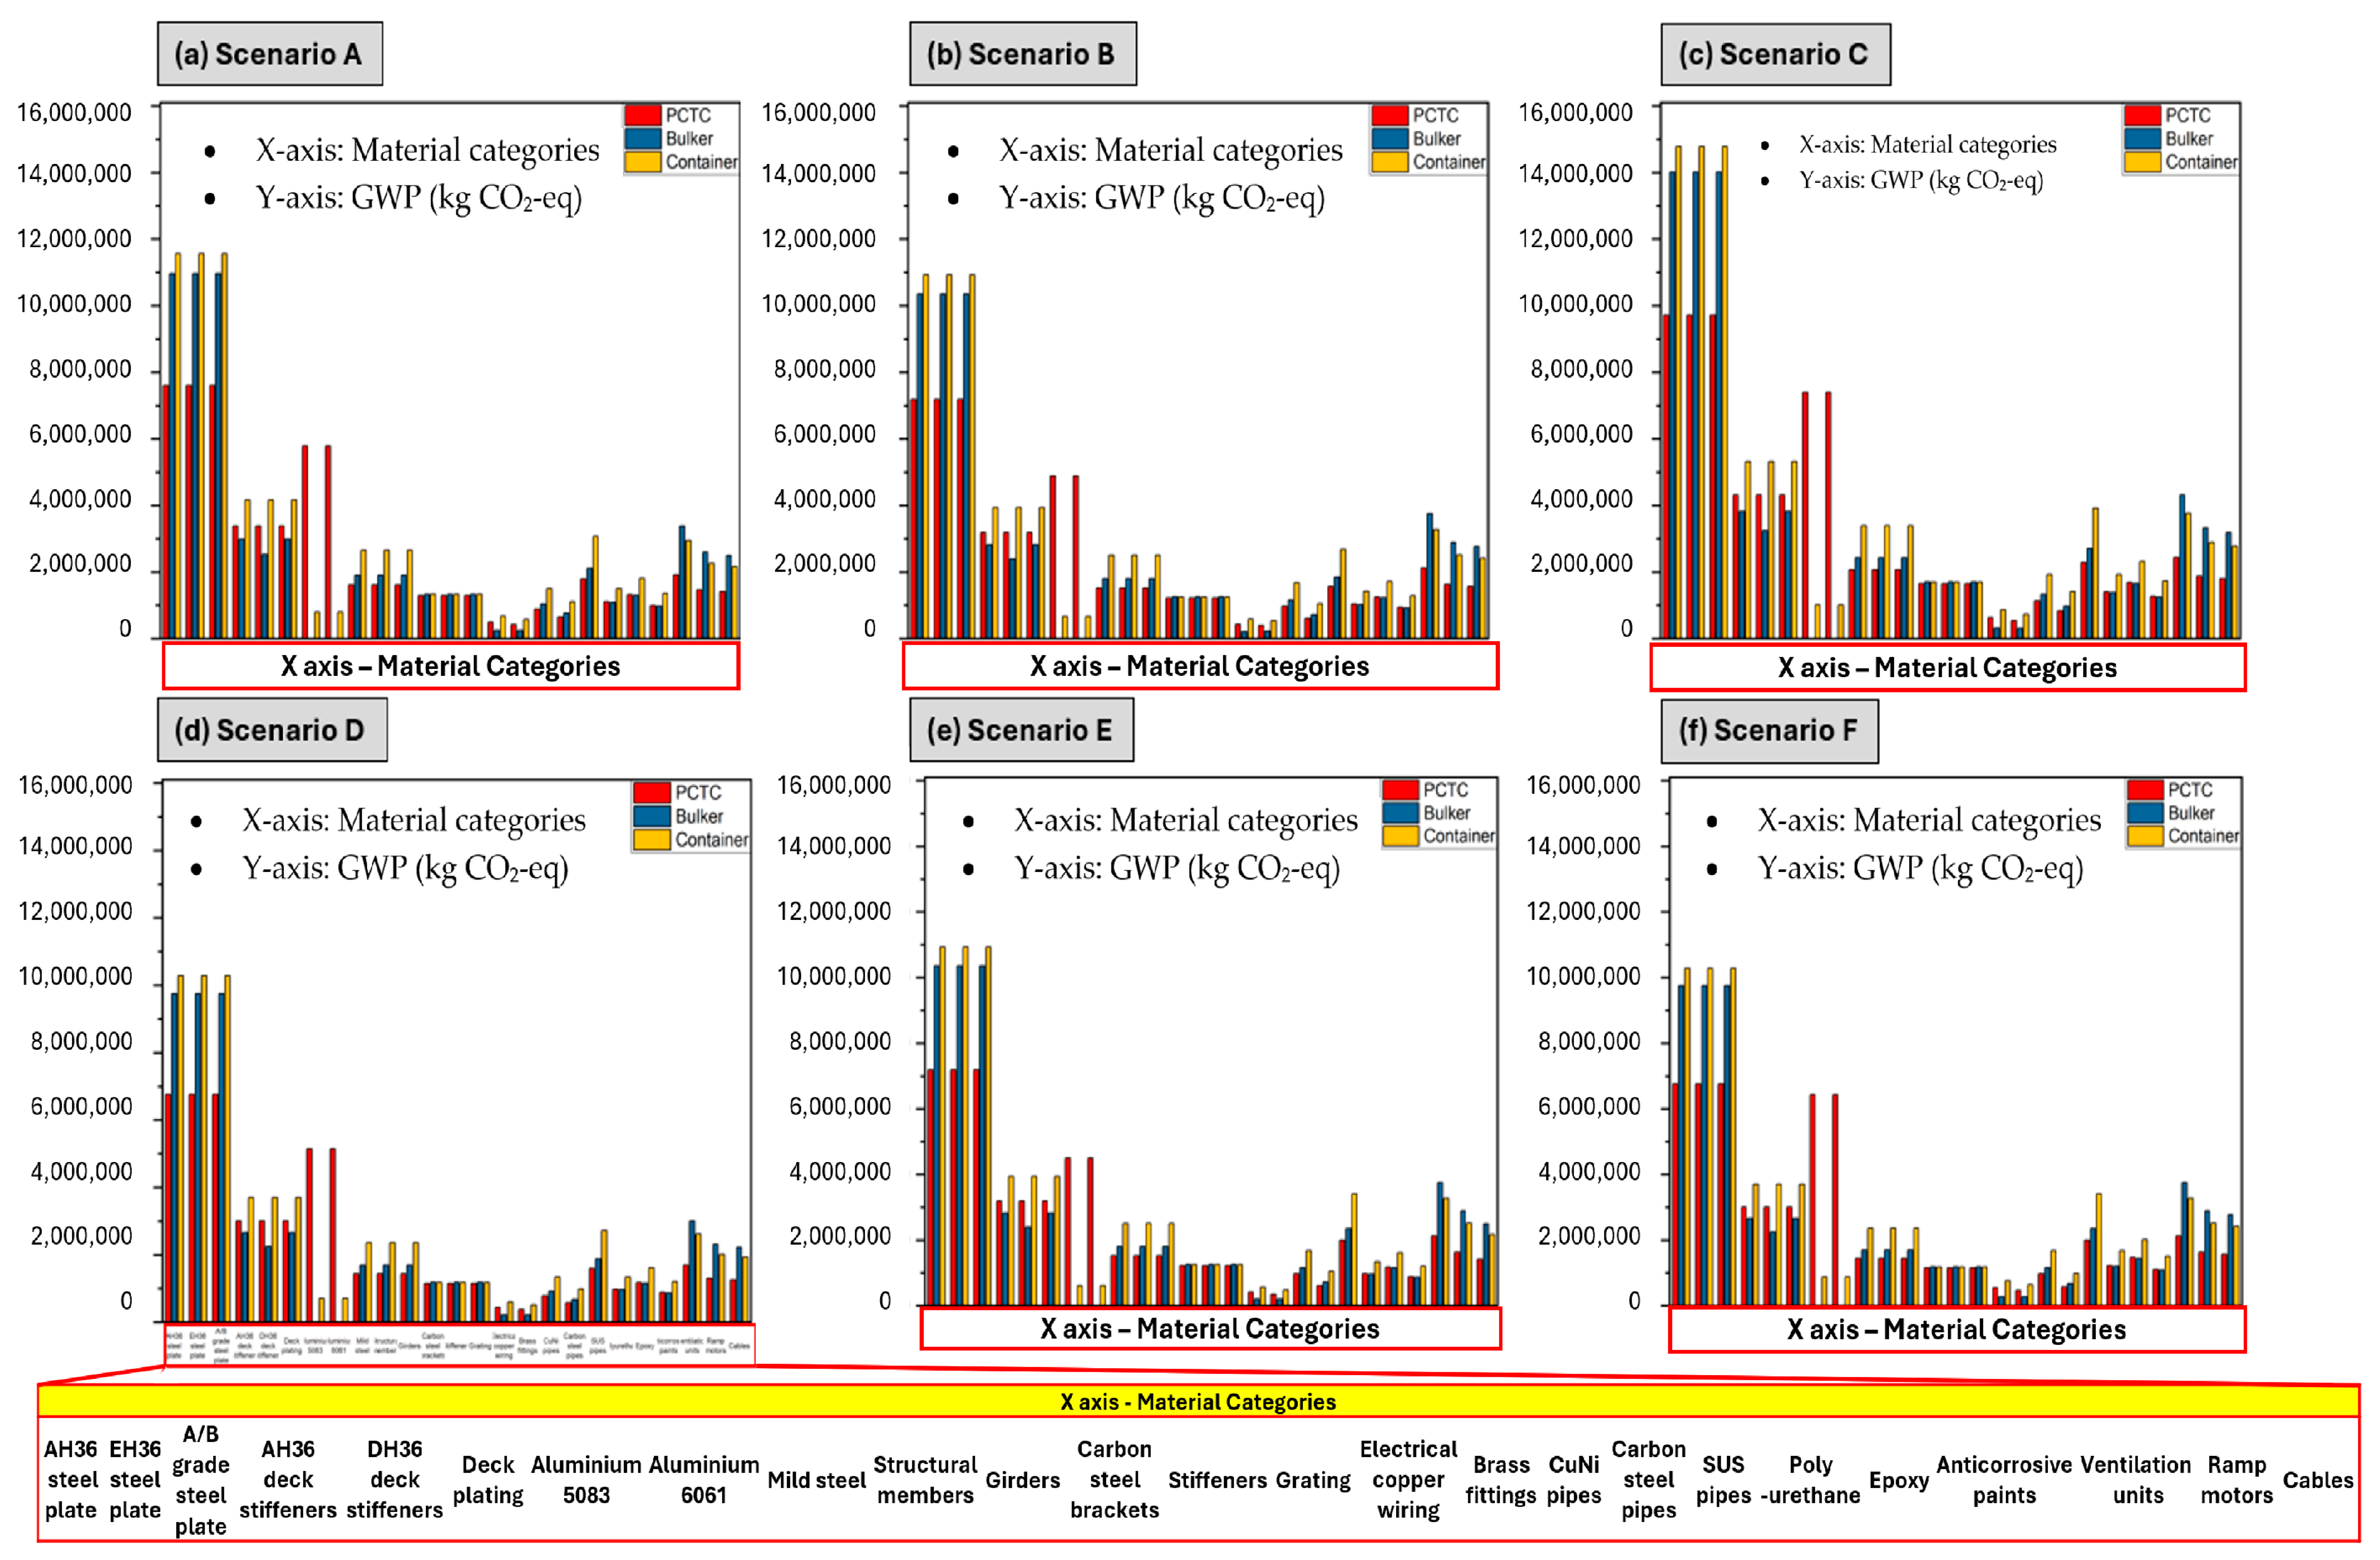
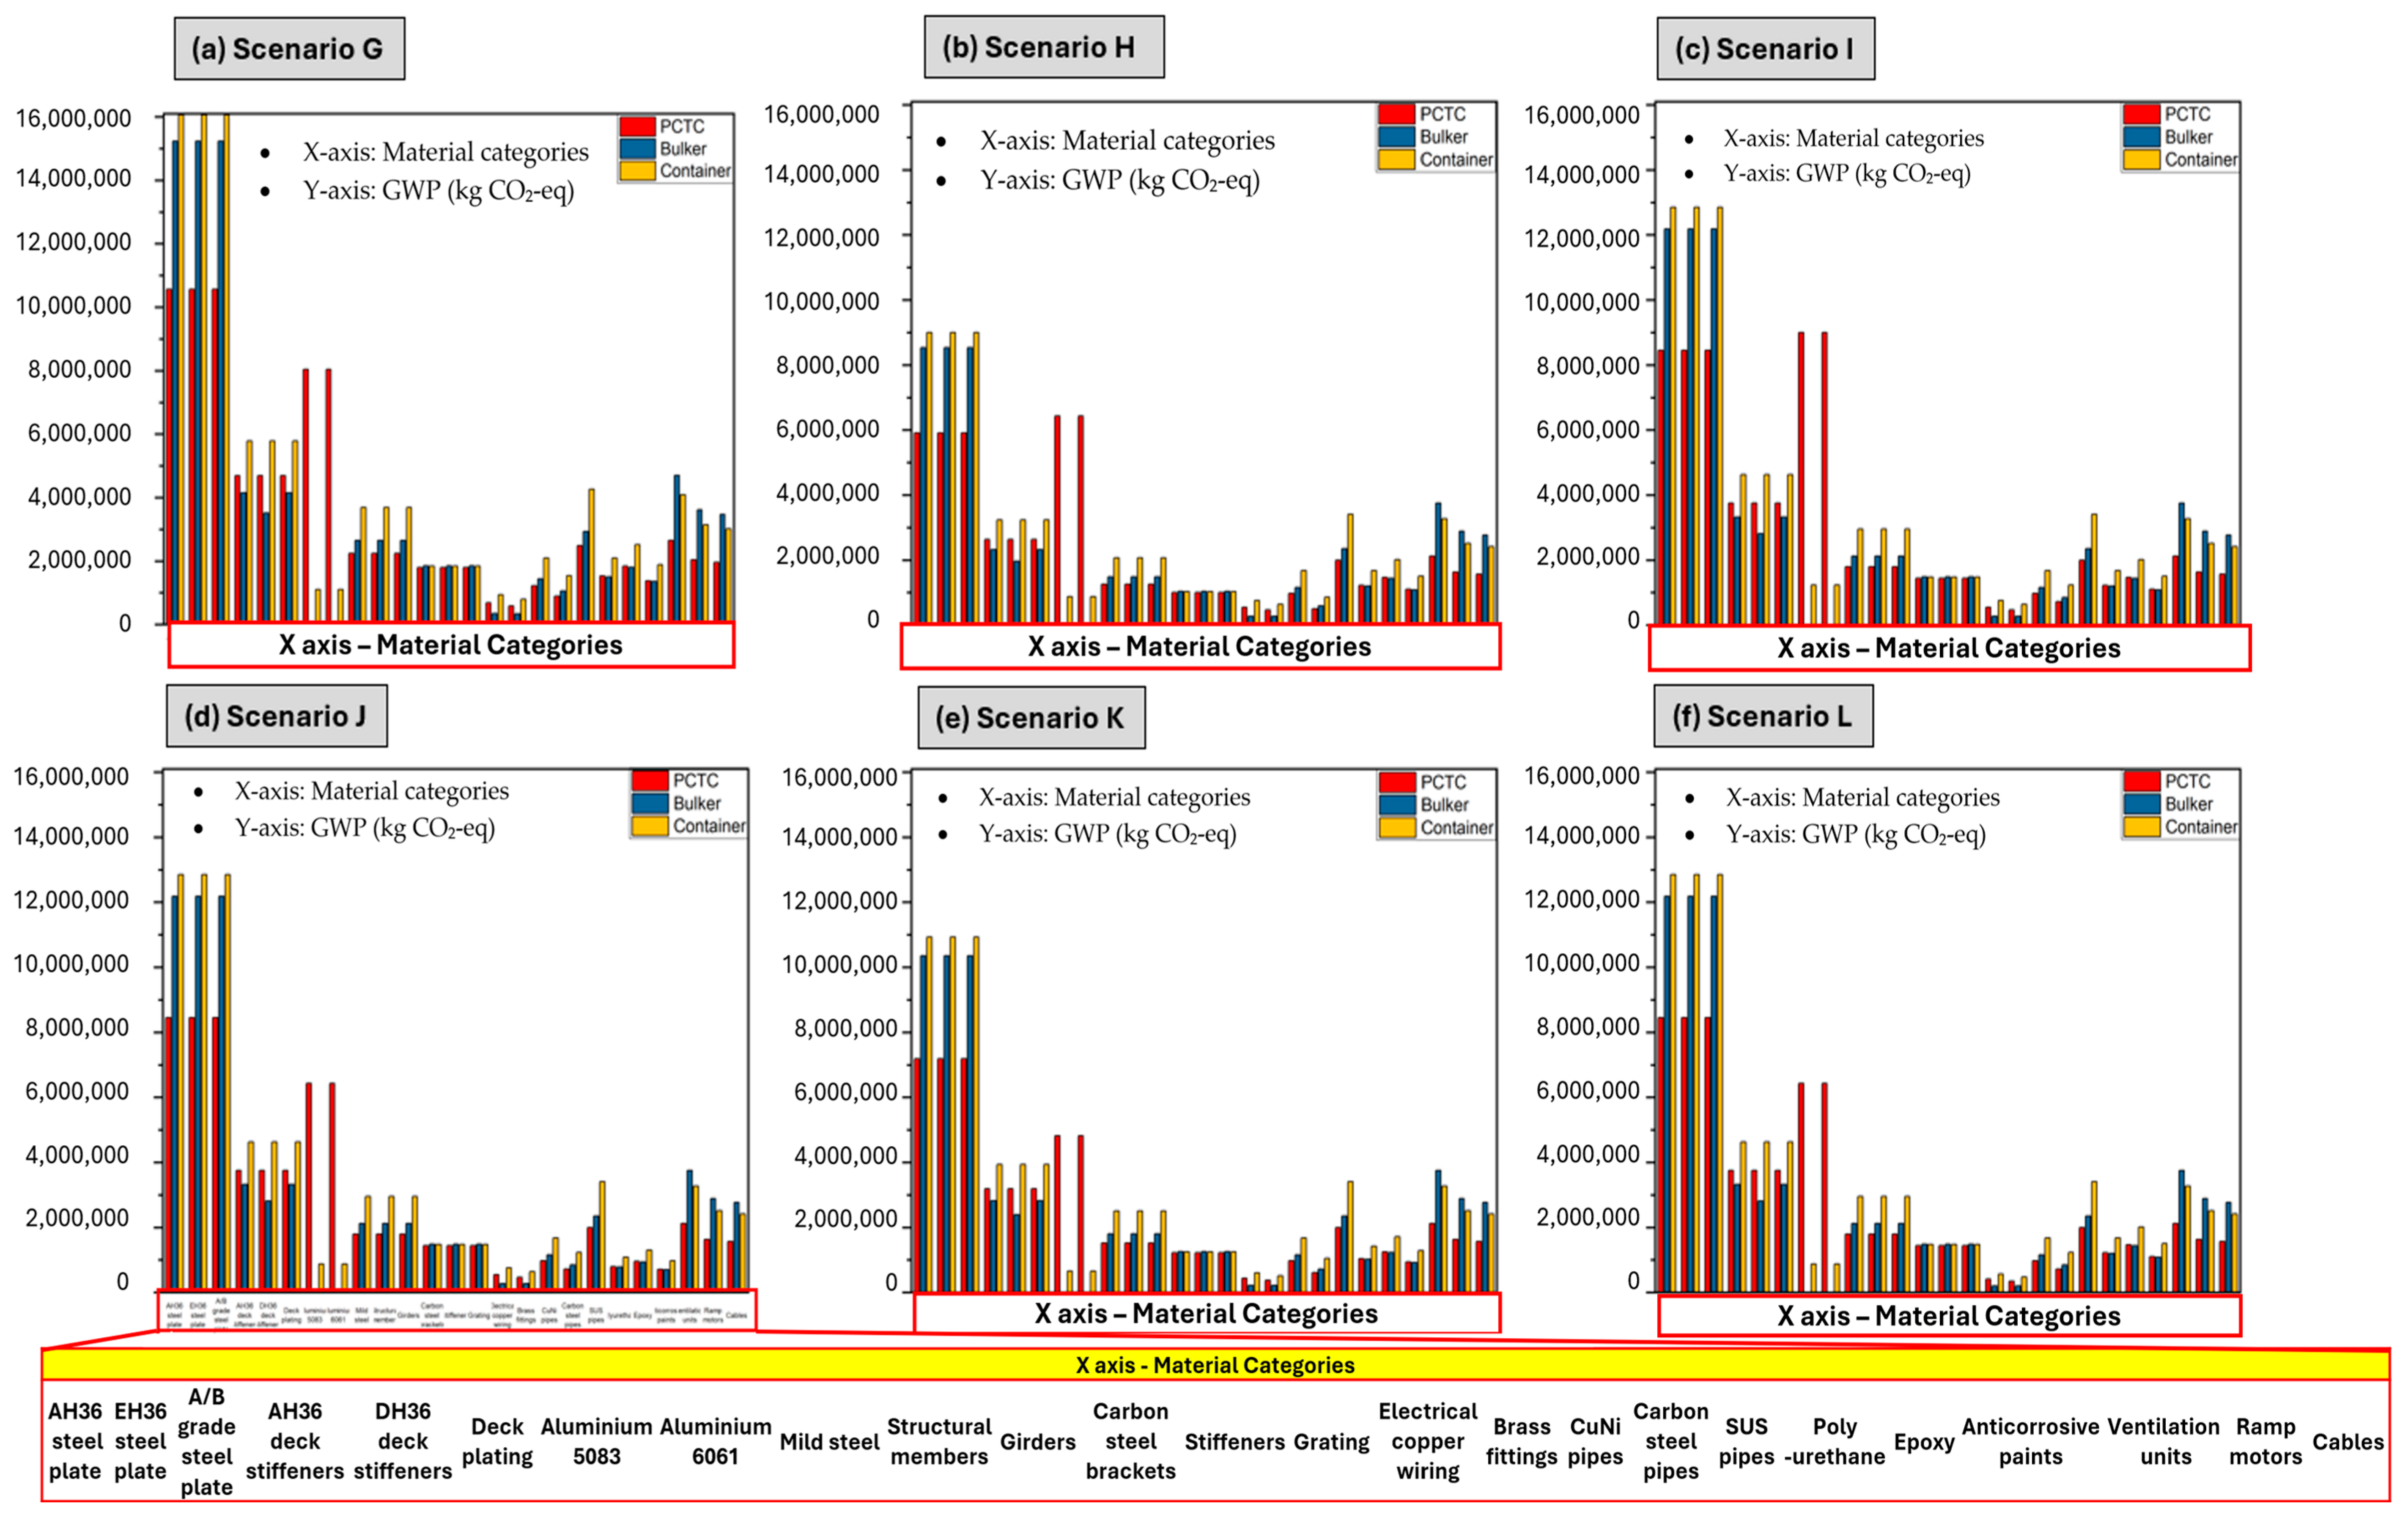
- Baseline and stress range adjustment—to test uncertainty bounds (e.g., A, C, and G);
- Material-specific procurement strategies—assessing impact from sourcing choices for steel, aluminium, and copper (e.g., B, F, H, etc.);
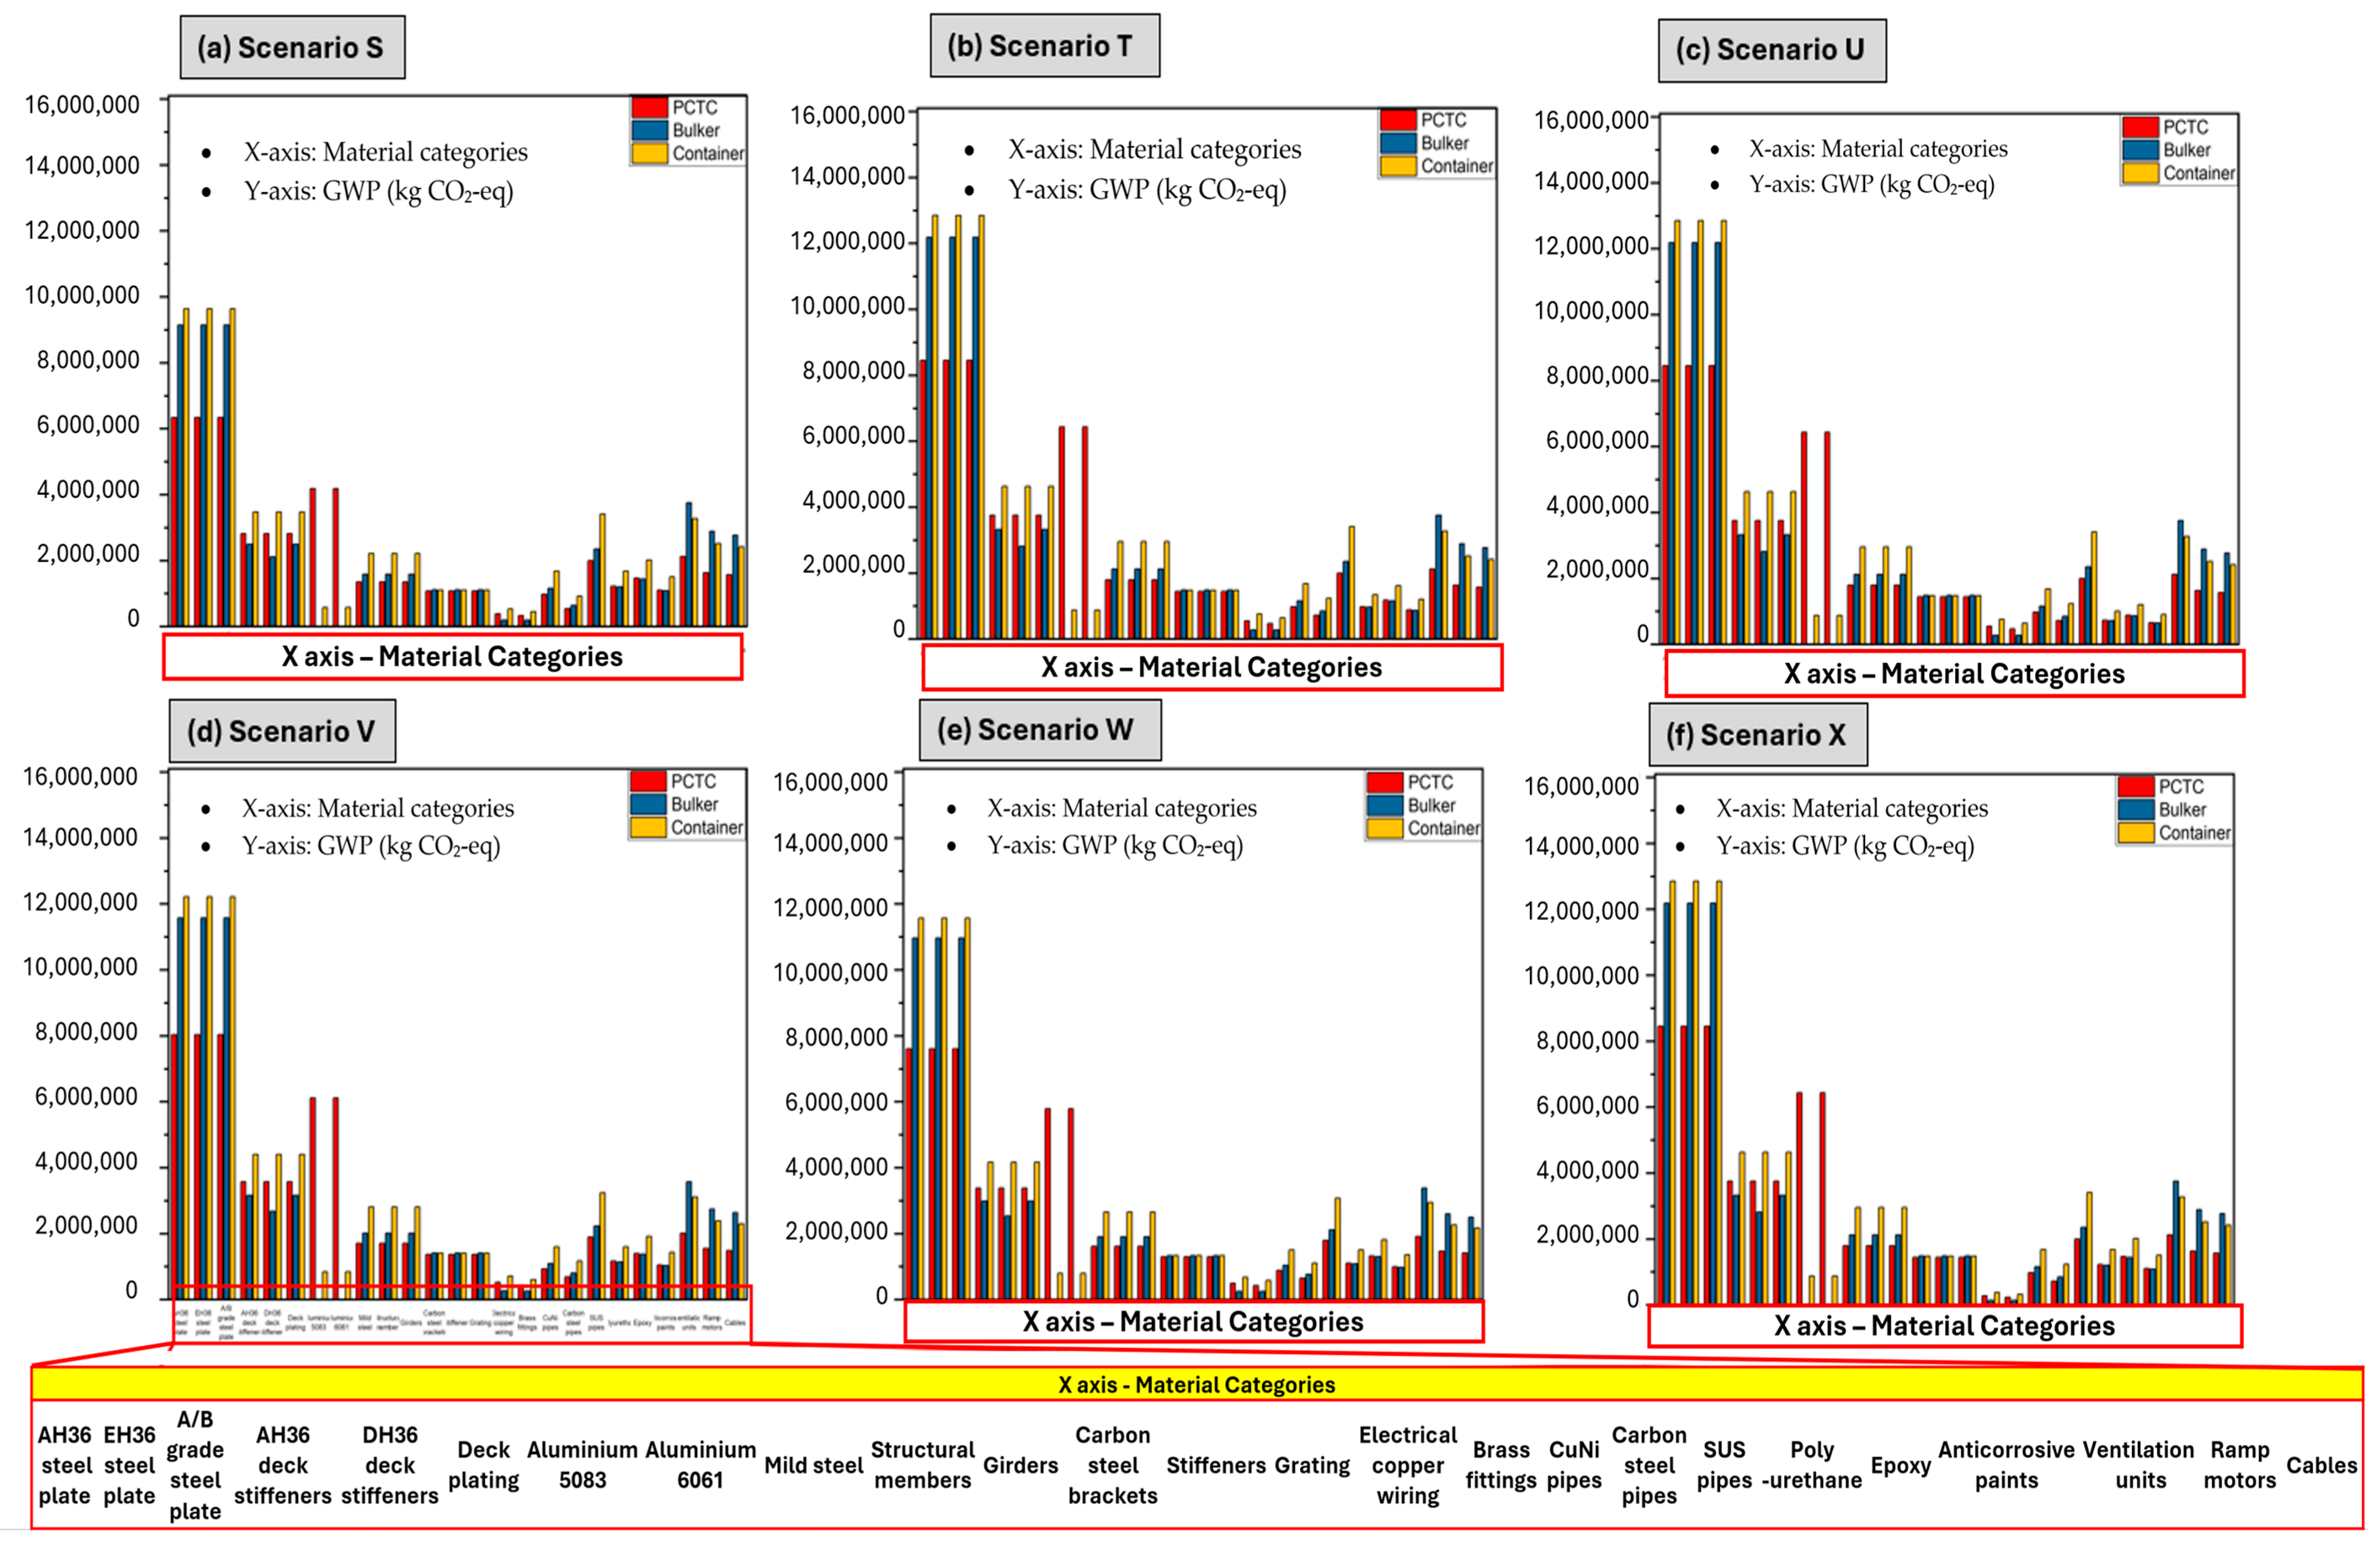
- Coating system alternatives—VOC-free or renewable coatings and energy inputs (e.g., E, J, T, and U);
- Logistics and supply chain optimization—localized or efficient transport (V, W);
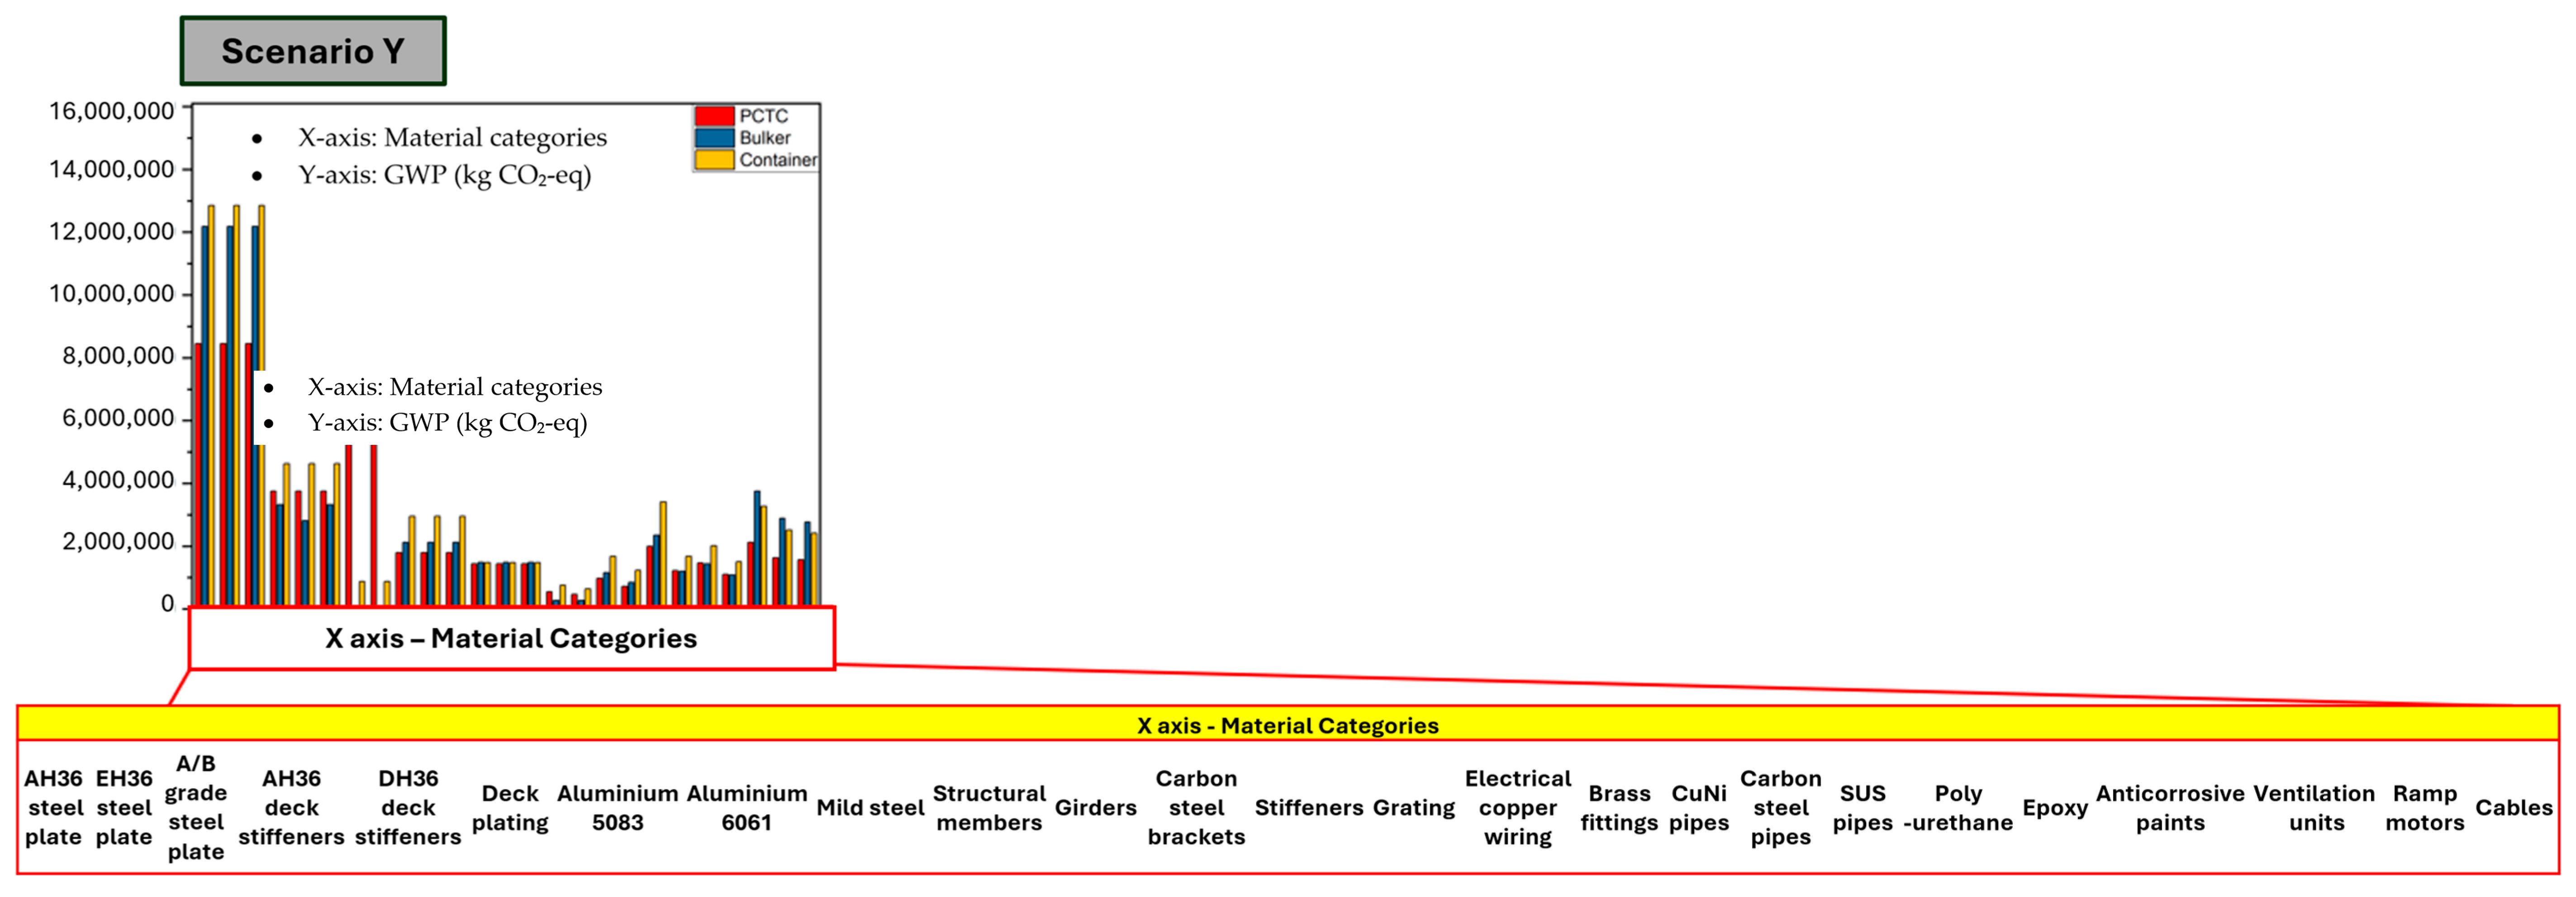
- Structural redesign and material reduction—design-based material savings or substitution (D, M, N, and Y).
2.5. Step 5: Interpretation of CBAM Cost Exposures
3. Results
3.1. Base Assessment (Step 1–2)
3.1.1. Baseline Assessment Pure Car and Truck Carrier (PCTC, ~7000 CEU (Car Equivalent Unit))
3.1.2. Baseline Assessment Bulk Carrier (200 k DWT)
3.1.3. Baseline Assessment 20,000 TEU Class Container Vessel
3.2. Sensitivity Analysis and CBAM Cost Exposure (Step 3)
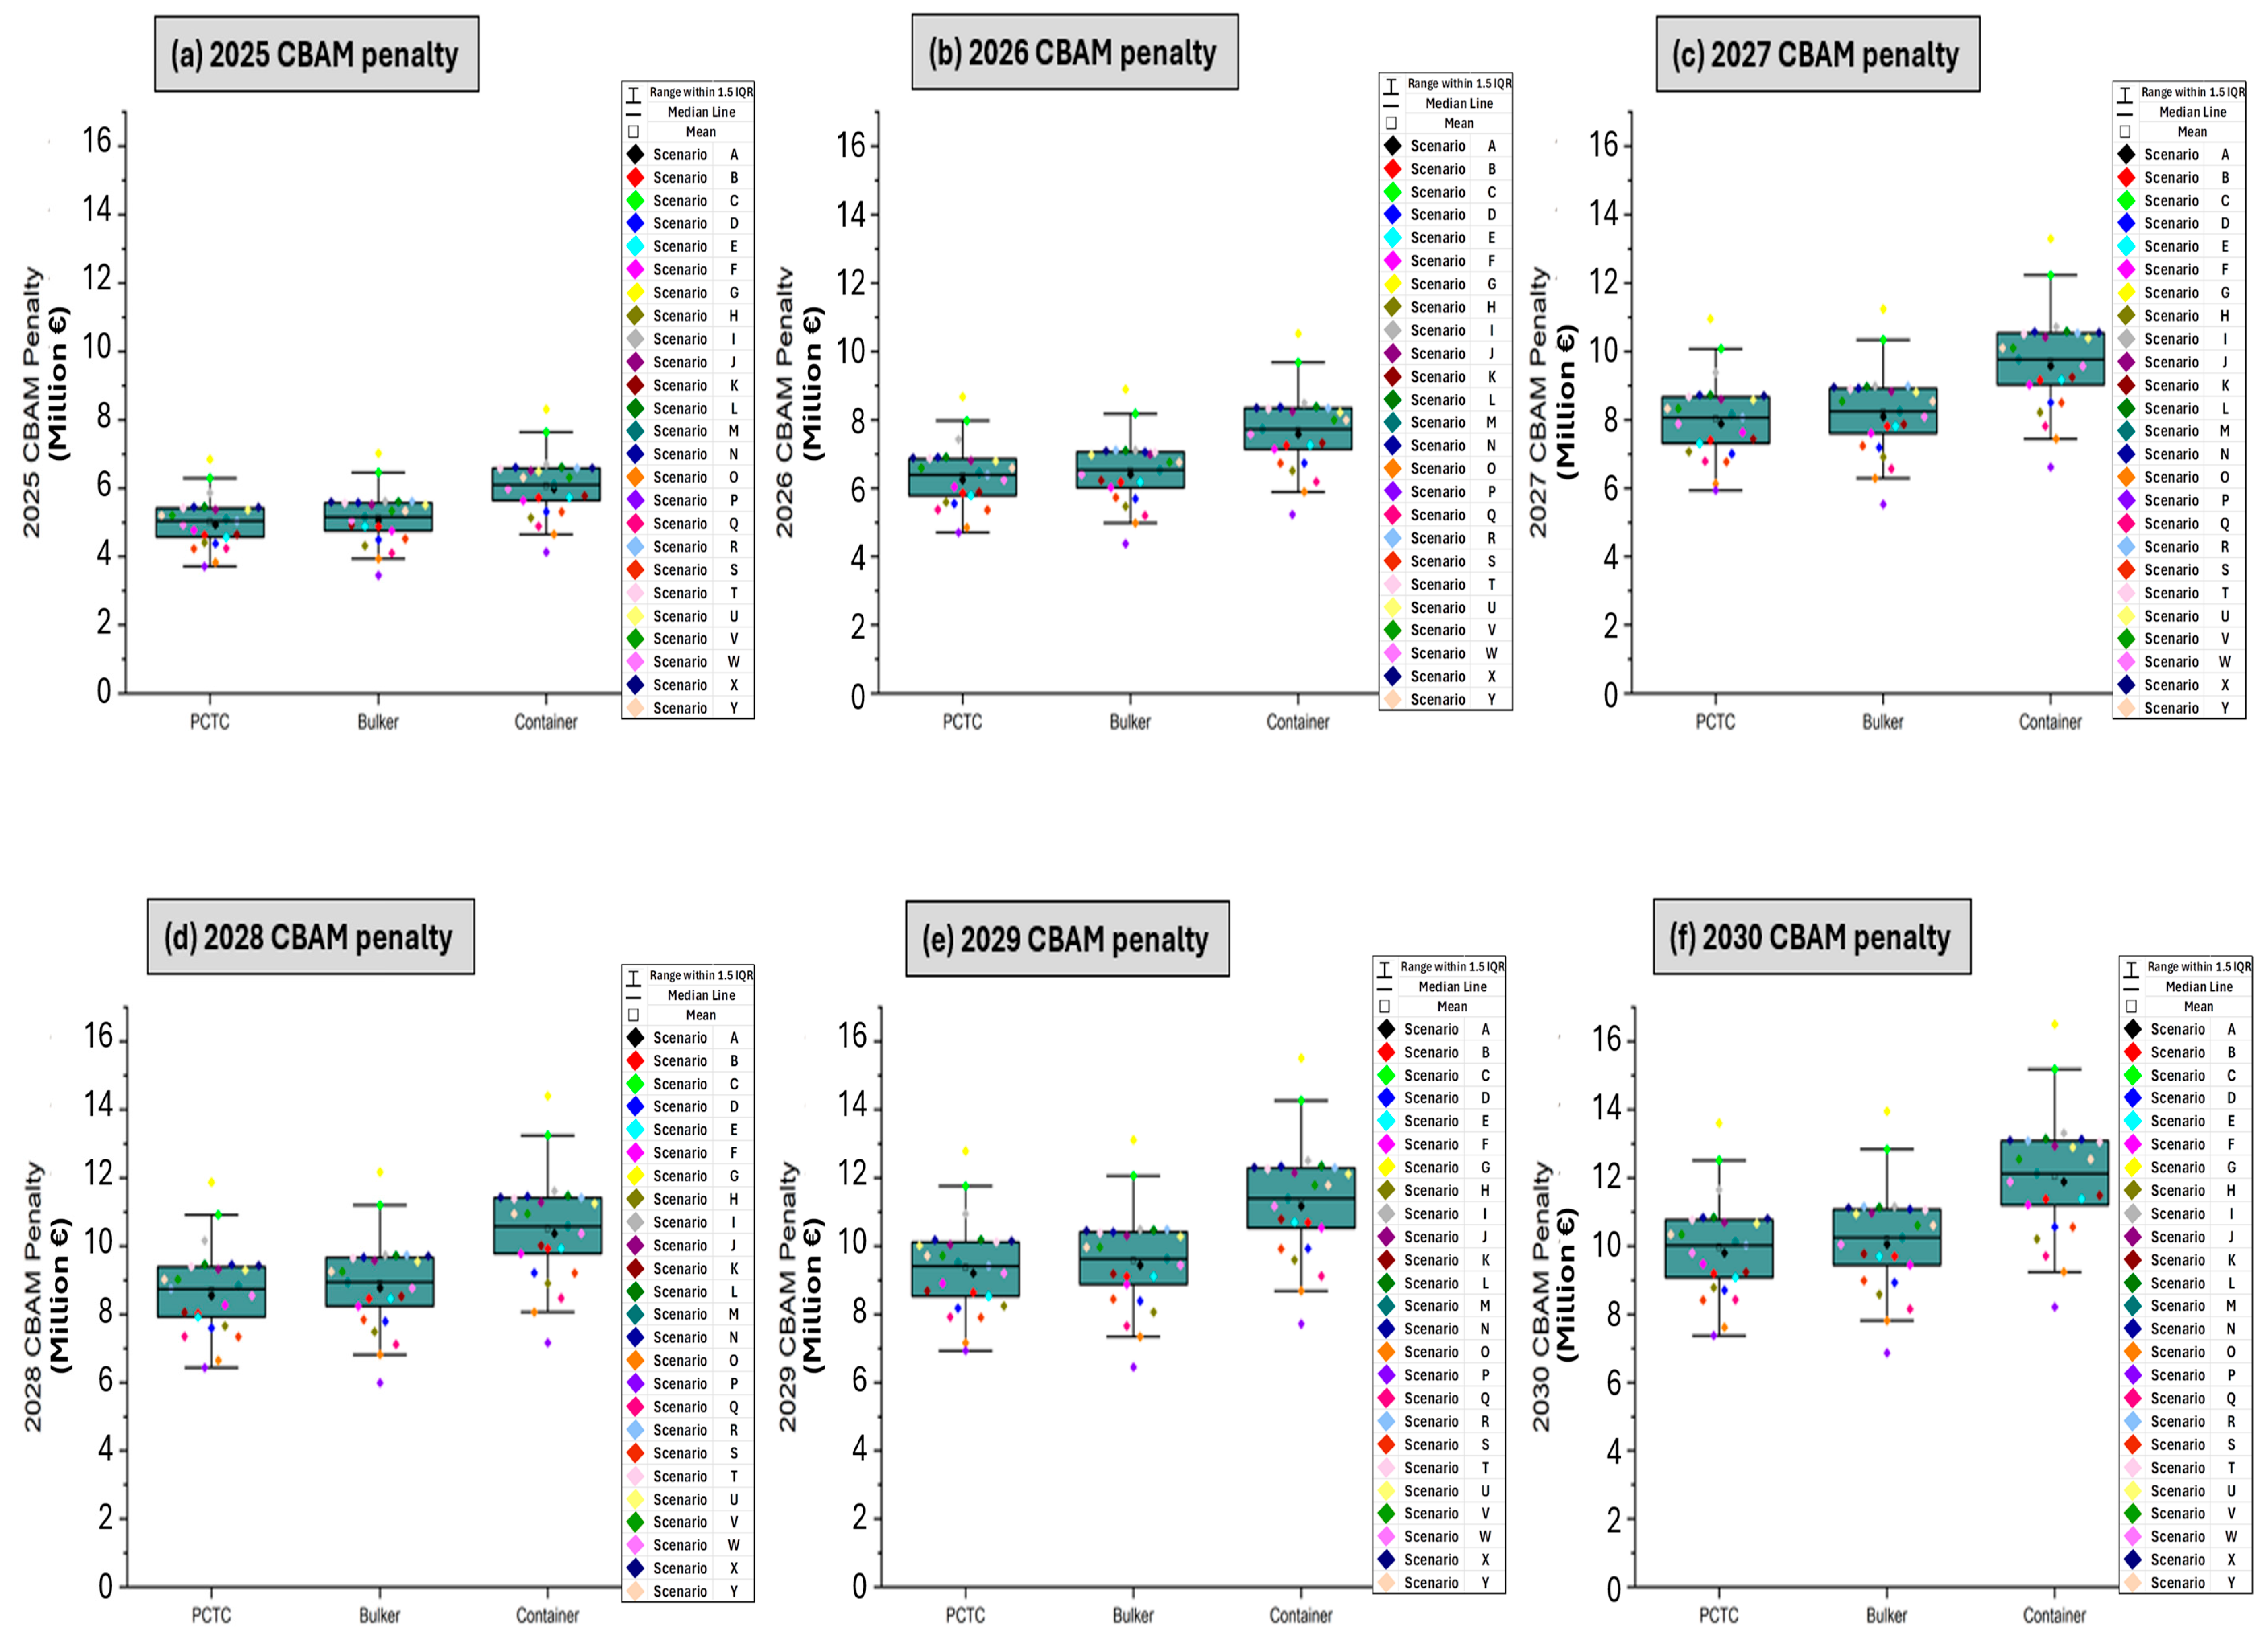
3.2.1. 7000 CEU PCTC—Scenario Results (2026–2030, Million EUR/Ship CBAM Penalty)
3.2.2. Bulk Carrier 200 k DWT—Scenario Results (2026–2030, Million EUR/Ship CBAM Penalty)
| Scenario | Description | 2026 (EUR 95/t) | 2027 (EUR 120/t) | 2028 (EUR 130/t) | 2029 (EUR 140/t) | 2030 (EUR 149/t) |
|---|---|---|---|---|---|---|
| A | Technological optimization (−10%) | 6.4 | 8.09 | 8.76 | 9.44 | 10.04 |
| B | Regional average (EU/EPD) | 6.18 | 7.81 | 8.46 | 9.11 | 9.7 |
| C | Conservative baseline (+15%) | 8.18 | 10.34 | 11.2 | 12.06 | 12.84 |
| D | Strategic material shift (−20%) | 5.69 | 7.19 | 7.79 | 8.39 | 8.93 |
| E | Green compliance | 6.18 | 7.81 | 8.46 | 9.11 | 9.7 |
| F | EU-origin steel only | 6.02 | 7.6 | 8.24 | 8.87 | 9.44 |
| G | High-emission source (+25%) | 8.9 | 11.24 | 12.17 | 13.11 | 13.95 |
| H | High-scrap steel (80%) | 5.47 | 6.91 | 7.49 | 8.06 | 8.58 |
| I | Low-scrap aluminium (+40%) | 7.12 | 8.99 | 9.74 | 10.49 | 11.16 |
| J | VOC-free paints | 6.99 | 8.83 | 9.57 | 10.3 | 10.97 |
| K | Owner EPD compliance | 6.23 | 7.87 | 8.53 | 9.18 | 9.77 |
| L | Electric copper refining | 7.1 | 8.97 | 9.72 | 10.47 | 11.14 |
| M | Korea–domestic mix | 6.53 | 8.25 | 8.94 | 9.63 | 10.25 |
| N | Recycled plastics in equipment | 7.06 | 8.92 | 9.67 | 10.41 | 11.08 |
| O | Full IMO GHG compliance | 4.98 | 6.29 | 6.82 | 7.34 | 7.81 |
| P | 100% green steel (hydrogen DRI) | 4.38 | 5.53 | 5.99 | 6.45 | 6.86 |
| Q | CCUS-equipped steelmaking | 5.2 | 6.57 | 7.11 | 7.66 | 8.15 |
| R | Aluminium closed-loop recycling | 7.12 | 8.99 | 9.74 | 10.49 | 11.16 |
| S | Multi-metal recycling synergy | 5.73 | 7.24 | 7.84 | 8.44 | 8.99 |
| T | Renewable shipyard electricity | 7.05 | 8.9 | 9.64 | 10.38 | 11.05 |
| U | Bio-based coatings | 6.97 | 8.81 | 9.54 | 10.28 | 10.94 |
| V | Low-carbon logistics | 6.76 | 8.54 | 9.25 | 9.96 | 10.6 |
| W | Localized supply chain (≤500 km) | 6.4 | 8.09 | 8.76 | 9.44 | 10.04 |
| X | Circular copper program | 6.81 | 8.96 | 9.7 | 10.45 | 11.12 |
| Y | Advanced material substitution | 6.76 | 8.54 | 9.25 | 9.96 | 10.6 |
3.2.3. 20,000 TEU Class Container Vessel—Scenario Results (2026–2030, Million EUR/Ship CBAM Penalty)
| Scenario | Description | 2026 (EUR 95/t) | 2027 (EUR 120/t) | 2028 (EUR 130/t) | 2029 (EUR 140/t) | 2030 (EUR 149/t) |
|---|---|---|---|---|---|---|
| A | Technological optimization (−10%) | 7.57 | 9.57 | 10.37 | 11.16 | 11.88 |
| B | Regional average (EU/EPD) | 7.25 | 9.16 | 9.93 | 10.69 | 11.38 |
| C | Conservative baseline (+15%) | 9.68 | 12.23 | 13.24 | 14.26 | 15.18 |
| D | Strategic material shift (−20%) | 6.73 | 8.51 | 9.21 | 9.92 | 10.56 |
| E | Green compliance | 7.26 | 9.17 | 9.93 | 10.7 | 11.38 |
| F | EU-origin steel only | 7.14 | 9.02 | 9.78 | 10.53 | 11.21 |
| G | High-emission source (+25%) | 10.52 | 13.29 | 14.4 | 15.5 | 16.5 |
| H | High-scrap steel (80%) | 6.51 | 8.22 | 8.91 | 9.59 | 10.21 |
| I | Low-scrap aluminium (+40%) | 8.48 | 10.72 | 11.61 | 12.5 | 13.31 |
| J | VOC-free paints | 8.24 | 10.41 | 11.28 | 12.15 | 12.93 |
| K | Owner EPD compliance | 7.32 | 9.25 | 10.02 | 10.79 | 11.48 |
| L | Electric copper refining | 8.38 | 10.59 | 11.47 | 12.35 | 13.15 |
| M | Korea–domestic mix | 7.73 | 9.77 | 10.58 | 11.39 | 12.13 |
| N | Recycled plastics in equipment | 8.37 | 10.57 | 11.45 | 12.34 | 13.13 |
| O | Full IMO GHG compliance | 5.89 | 7.44 | 8.06 | 8.68 | 9.24 |
| P | 100% green steel (hydrogen DRI) | 5.24 | 6.61 | 7.16 | 7.72 | 8.21 |
| Q | CCUS-equipped steelmaking | 6.19 | 7.82 | 8.47 | 9.12 | 9.71 |
| R | Aluminium closed-loop recycling | 8.34 | 10.54 | 11.41 | 12.29 | 13.08 |
| S | Multi-metal recycling synergy | 6.73 | 8.5 | 9.21 | 9.91 | 10.55 |
| T | Renewable shipyard electricity | 8.32 | 10.51 | 11.38 | 12.26 | 13.05 |
| U | Bio-based coatings | 8.22 | 10.38 | 11.25 | 12.11 | 12.89 |
| V | Low-carbon logistics | 8 | 10.1 | 10.94 | 11.78 | 12.54 |
| W | Localized supply chain (≤500 km) | 7.57 | 9.57 | 10.37 | 11.16 | 11.88 |
| X | Circular copper program | 8.35 | 10.55 | 11.43 | 12.31 | 13.1 |
| Y | Advanced material substitution | 8 | 10.1 | 10.94 | 11.78 | 12.54 |
3.3. Interpretation of CBAM Cost Exposure (Embedded Carbon Cost Lens) (Step 4–5)
3.3.1. Interpretation of Scenario—PCTC
3.3.2. Sensitivity and Stakeholder Implications—PCTC
- (a)
- Sensitivity to Carbon Price Trajectories
- (b)
- Sensitivity to Material Pathways
- (c)
- Stakeholder Implications
- For shipowners:
- For shipyards:
- For regulators:
- (d)
- Uncertainty and Robustness
3.3.3. Interpretation of Scenario—Bulk Carrier
3.3.4. Sensitivity and Stakeholder Implications—Bulk Carrier
- (a)
- Sensitivity to Carbon Price Trajectories
- (b)
- Sensitivity to Material Pathways
- (c)
- Stakeholder Implications
- (d)
- Uncertainty and Robustness
3.3.5. Interpretation of Scenario—Container Vessel
3.3.6. Sensitivity and Stakeholder Implications—Container Vessel
- (a)
- Sensitivity to Carbon Price Trajectories
- (b)
- Sensitivity to Material Pathways
- (c)
- Stakeholder Implications
- (d)
- Uncertainty and Robustness
4. Discussion
4.1. Original Contributions to the Industry
- (a)
- Research impacts for enhancing LCA-based shipbuilding
- (b)
- Digitalization and Model-Based Approval
- (c)
- OCX as a Practical Enabler of Integration
- Automatic mapping of BOM and process data to emission factor databases.
- Scenario-based evaluation of alternative material and sourcing options within the digital design workflow.
- Benchmarking of design alternatives for both carbon and cost performance.
4.2. Recommendations for Industry and Policy
- Shipyards should adopt LCA-informed design practices to pre-empt CBAM penalties. Even a modest material substitution or sourcing decision can result in several million euros of avoided exposure over a newbuild.
- Shipowners are advised to integrate embedded emissions into procurement and contracting decisions. Vessels optimized for lower CBAM exposure may secure favorable financing conditions and improve long-term competitiveness in European trades.
- Regulators and classification societies should facilitate the adoption of transparent and standardized methodologies for embedded carbon accounting, ensuring comparability across designs and regions. Equally important, they should strengthen requirements for transparent and verifiable emission data, as credible datasets will determine whether domestic carbon pricing schemes in exporting countries can be recognized under CBAM. Such mechanisms would help avoid double regulation while maintaining environmental integrity.
4.3. Limitations of the Study
- Data limitations
- Uncertainty analysis
- Vessel scope
- Regulatory modeling
- Primary data gaps
- Policy scope
4.4. Suggestions for Future Research
- Expansion of vessel scope and inventory detail. Applying the framework to additional ship types (e.g., LNG carriers, offshore units, and cruise ships) and refining inventories for specific materials, such as advanced composites or alternative steels, will improve generalizability and provide more robust benchmarks across segments.
- Collaborative acquisition of process-level datasets. A critical next step is to combine yard-level measurements (e.g., welding energy use, coating application, and block transport logistics) with established LCA databases. Such collaborative efforts with shipyards and research institutes can replace proxies with verifiable data and significantly enhance the accuracy of scenario-based assessments.
- Regional differentiation of emission factors. Future research should explicitly capture supplier origin and production processes (e.g., EAF vs. BF–BOF steelmaking, aluminium under different grid intensities, copper refining routes, and coating systems) to benchmark procurement strategies across regions and supply chains.
- Integration of operational and construction phases. Linking embedded carbon (CBAM) with operational emissions regulated under EU ETS and FuelEU Maritime can create a holistic lifecycle compliance model, enabling optimization across the full life cycle rather than in isolation.
- Dynamic policy modeling. Probabilistic approaches should be applied to capture carbon price volatility, transitional exemptions, and evolving regulatory designs. This would allow stakeholders to evaluate exposure under multiple regulatory futures rather than a single deterministic pathway.
- Investigating digital pathways for automation. Future research may explore extending standardized data exchange formats, such as the open class exchange (OCX), with sustainability modules. Pursuing these digital pathways could enable semi-automated mapping of the bills of materials (BOM) and bills of process (BOP) to emission factor databases, lowering the manual workload of LCAs and embedding carbon accounting directly into design, approval, and verification workflows.
5. Conclusions
- (1)
- Integration of LCA into early-stage ship design
- (2)
- Scenario-based risk and sensitivity analysis
- (3)
- Implications for shipyards, owners, and regulators
- (4)
- Digitalization as an enabler for adoption
Author Contributions
Funding
Data Availability Statement
Acknowledgments
Conflicts of Interest
Appendix A
Appendix A.1. Scenario Descriptions and Rationale (A–Y)
- Scenario A—Technological Optimization (−10%)
- Scenario B—Regional Average (EU/EPD)
- Scenario C—Conservative Baseline (+15%)
- Scenario D—Strategic Material Shift (−20%)
- Scenario E—Green Compliance
- Scenario F—EU-Origin Steel Only
- Scenario G—High-Emission Source (+25%)
- Scenario H—High-Scrap Steel (80%)
- Scenario I—Low-Scrap Aluminium (+40%)
- Scenario J—VOC-Free Coatings (−35%)
- Scenario K—Owner EPD Compliance
- Scenario L—Electric Copper Refining (−25%)
- Scenario M—Korea–Domestic Mix
- Scenario N—Recycled Plastics in Equipment (−30%)
- Scenario O—Full IMO GHG Compliance (−35%)
- Scenario P—100% Green Steel (Hydrogen DRI)
- Scenario Q—CCUS-equipped Steelmaking
- Scenario R—Aluminium Closed-loop Recycling
- Scenario S—Multi-metal Recycling Synergy
- Scenario T—Renewable Shipyard Electricity (−20% coatings)
- Scenario U—Bio-Based Coatings (−40%)
- Scenario V—Low-Carbon Logistics (−5%)
- Scenario W—Localized Supply Chain (−10%)
- Scenario X—Circular Copper Program (−50%)
- Scenario Y—Material Substitution (Lightweighting, 5–10%)
Appendix A.2. CBAM Price Assumptions (2026–2030)
- 2026: EUR 95/tCO2
- 2027: EUR 120/tCO2
- 2028: EUR 130/tCO2
- 2029: EUR 140/tCO2
- 2030: EUR 149/tCO2.
References
- Wróblewskaa, M.; Zmitrowiczb, M. Carbon Border Adjustment Mechanism as proposed EU regulation to combat climate change. Interact. Law Econ. Sustain. Dev. 2024, 260–269. [Google Scholar] [CrossRef]
- Pollard, M.; Buckley, T. A Price on Carbon: Building Towards an Asian CBAM; Climate Energy Finance: Sydney, Australia, 2025. [Google Scholar]
- Karyoti, M. Carbon Pricing Options for Maritime Emissions; University of Piraeus: Piraeus, Greece, 2023. [Google Scholar]
- Mitsche, S. Impact and Repercussions of Regional Industrial and Environmental Regulations on Austria’s STEEL Industry in the Context of an Inhomogenous Global Economy and Policy Suggestions for a Profitable Green Transition; Technische Universität Wien: Vienna, Austria, 2024. [Google Scholar]
- Meng, Z.; Jeong Cho, H.; Gore, K. Tracing the Steel Supply Chain of the Shipbuilding Industry 2024; International Council on Clean Transportation (ID 174): Washington, DC, USA, 2024. [Google Scholar]
- Register, L.S. Shipping and Steel: Addressing Scope 3 Emissions; Lloyd’s Register Maritime Decarbonisation Hub: London, UK, 2023. [Google Scholar]
- Initiative, S.S. Reen Steel and Shipping: Exploring the Material Flow of Steel and Potential for Green Steel in the Shipping Sector; Sustainable Shipping Initiative: London, UK, 2023. [Google Scholar]
- Catalyst, C. Turning the Tide: Ship Recycling as a Source of Green Steel in India; The Climate Change Organisation (Climate Catalyst): London, UK, 2024. [Google Scholar]
- Zang, G.; Sun, P.; Elgowainy, A.; Bobba, P.; McMillan, C.; Ma, O.; Podkaminer, K.; Rustagi, N.; Melaina, M.; Koleva, M. Cost and life cycle analysis for deep CO2 emissions reduction of steelmaking: Blast furnace-basic oxygen furnace and electric arc furnace technologies. Int. J. Greenh. Gas Control. 2023, 128, 103958. [Google Scholar] [CrossRef]
- Jakhar, T.C.A.T.R. Beyond Borders: CBAM’s Revolutionary Potential and Challenges in Achieving Carbon Neutrality. Policy 2024, 3, 4. [Google Scholar] [CrossRef]
- Gilbert, P.; Wilson, P.; Walsh, C.; Hodgson, P. The role of material efficiency to reduce CO2 emissions during ship manufacture: A life cycle approach. Marine Policy 2017, 75, 227–237. [Google Scholar] [CrossRef]
- Miyake, R. IMO Guidelines on Life Cycle GHG Intensity of Marine Fuels. ClassNK Tech. J. 2024, 2024, 17–26. [Google Scholar]
- Tuan, D.D.; Wei, C. Cradle-to-gate life cycle assessment of ships: A case study of Panamax bulk carrier. Proc. Inst. Mech. Eng. Part M J. Eng. Marit. Environ. 2019, 233, 670–683. [Google Scholar] [CrossRef]
- Chopra, J.; Rangarajan, V.; Rathnasamy, S.; Dey, P. Life cycle assessment as a key decision tool for emerging pretreatment technologies of biomass-to-biofuel: Unveiling challenges, advances, and future potential. BioEnergy Res. 2024, 17, 857–876. [Google Scholar] [CrossRef]
- Ellingsen, H.; Fet, A.; Aanondsen, S. Tool for environmental efficient ship design. In Proceedings of the the Marine Science and Technology for Environmental Sustainability, ENSUS, Newcastle upon Tyne, UK, 18 December 2002. [Google Scholar]
- Islam, H.; Zhang, G.; Setunge, S.; Bhuiyan, M.A. Life cycle assessment of shipping container home: A sustainable construction. Energy Build. 2016, 128, 673–685. [Google Scholar] [CrossRef]
- Tincelin, T.; Mermier, L.; Pierson, Y.; Pelerin, E.; Jouanne, G. A Life Cycle Approach to Shipbuilding and Ship Operation. In Proceedings of the RINA Conference “Ship Design and Operation for Environmental Sustainability”, London, UK, 20–22 October 2010. [Google Scholar]
- ISO 14040:2006; Environmental Management — Life Cycle Assessment — Principles and Framework. International Organization for Standardization: Geneva, Switzerland, 2006.
- ISO 14044:2006; Environmental Management — Life Cycle Assessment — Requirements and Guidelines. International Organization for Standardization: Geneva, Switzerland, 2006.
- Sphera. GaBi: Software-System and Databases for Life Cycle Engineering. Leinfelden-Echterdingen, Germany. Available online: https://sphera.com/solutions/product-stewardship/life-cycle-assessment-software-and-data/ (accessed on 1 October 2025).
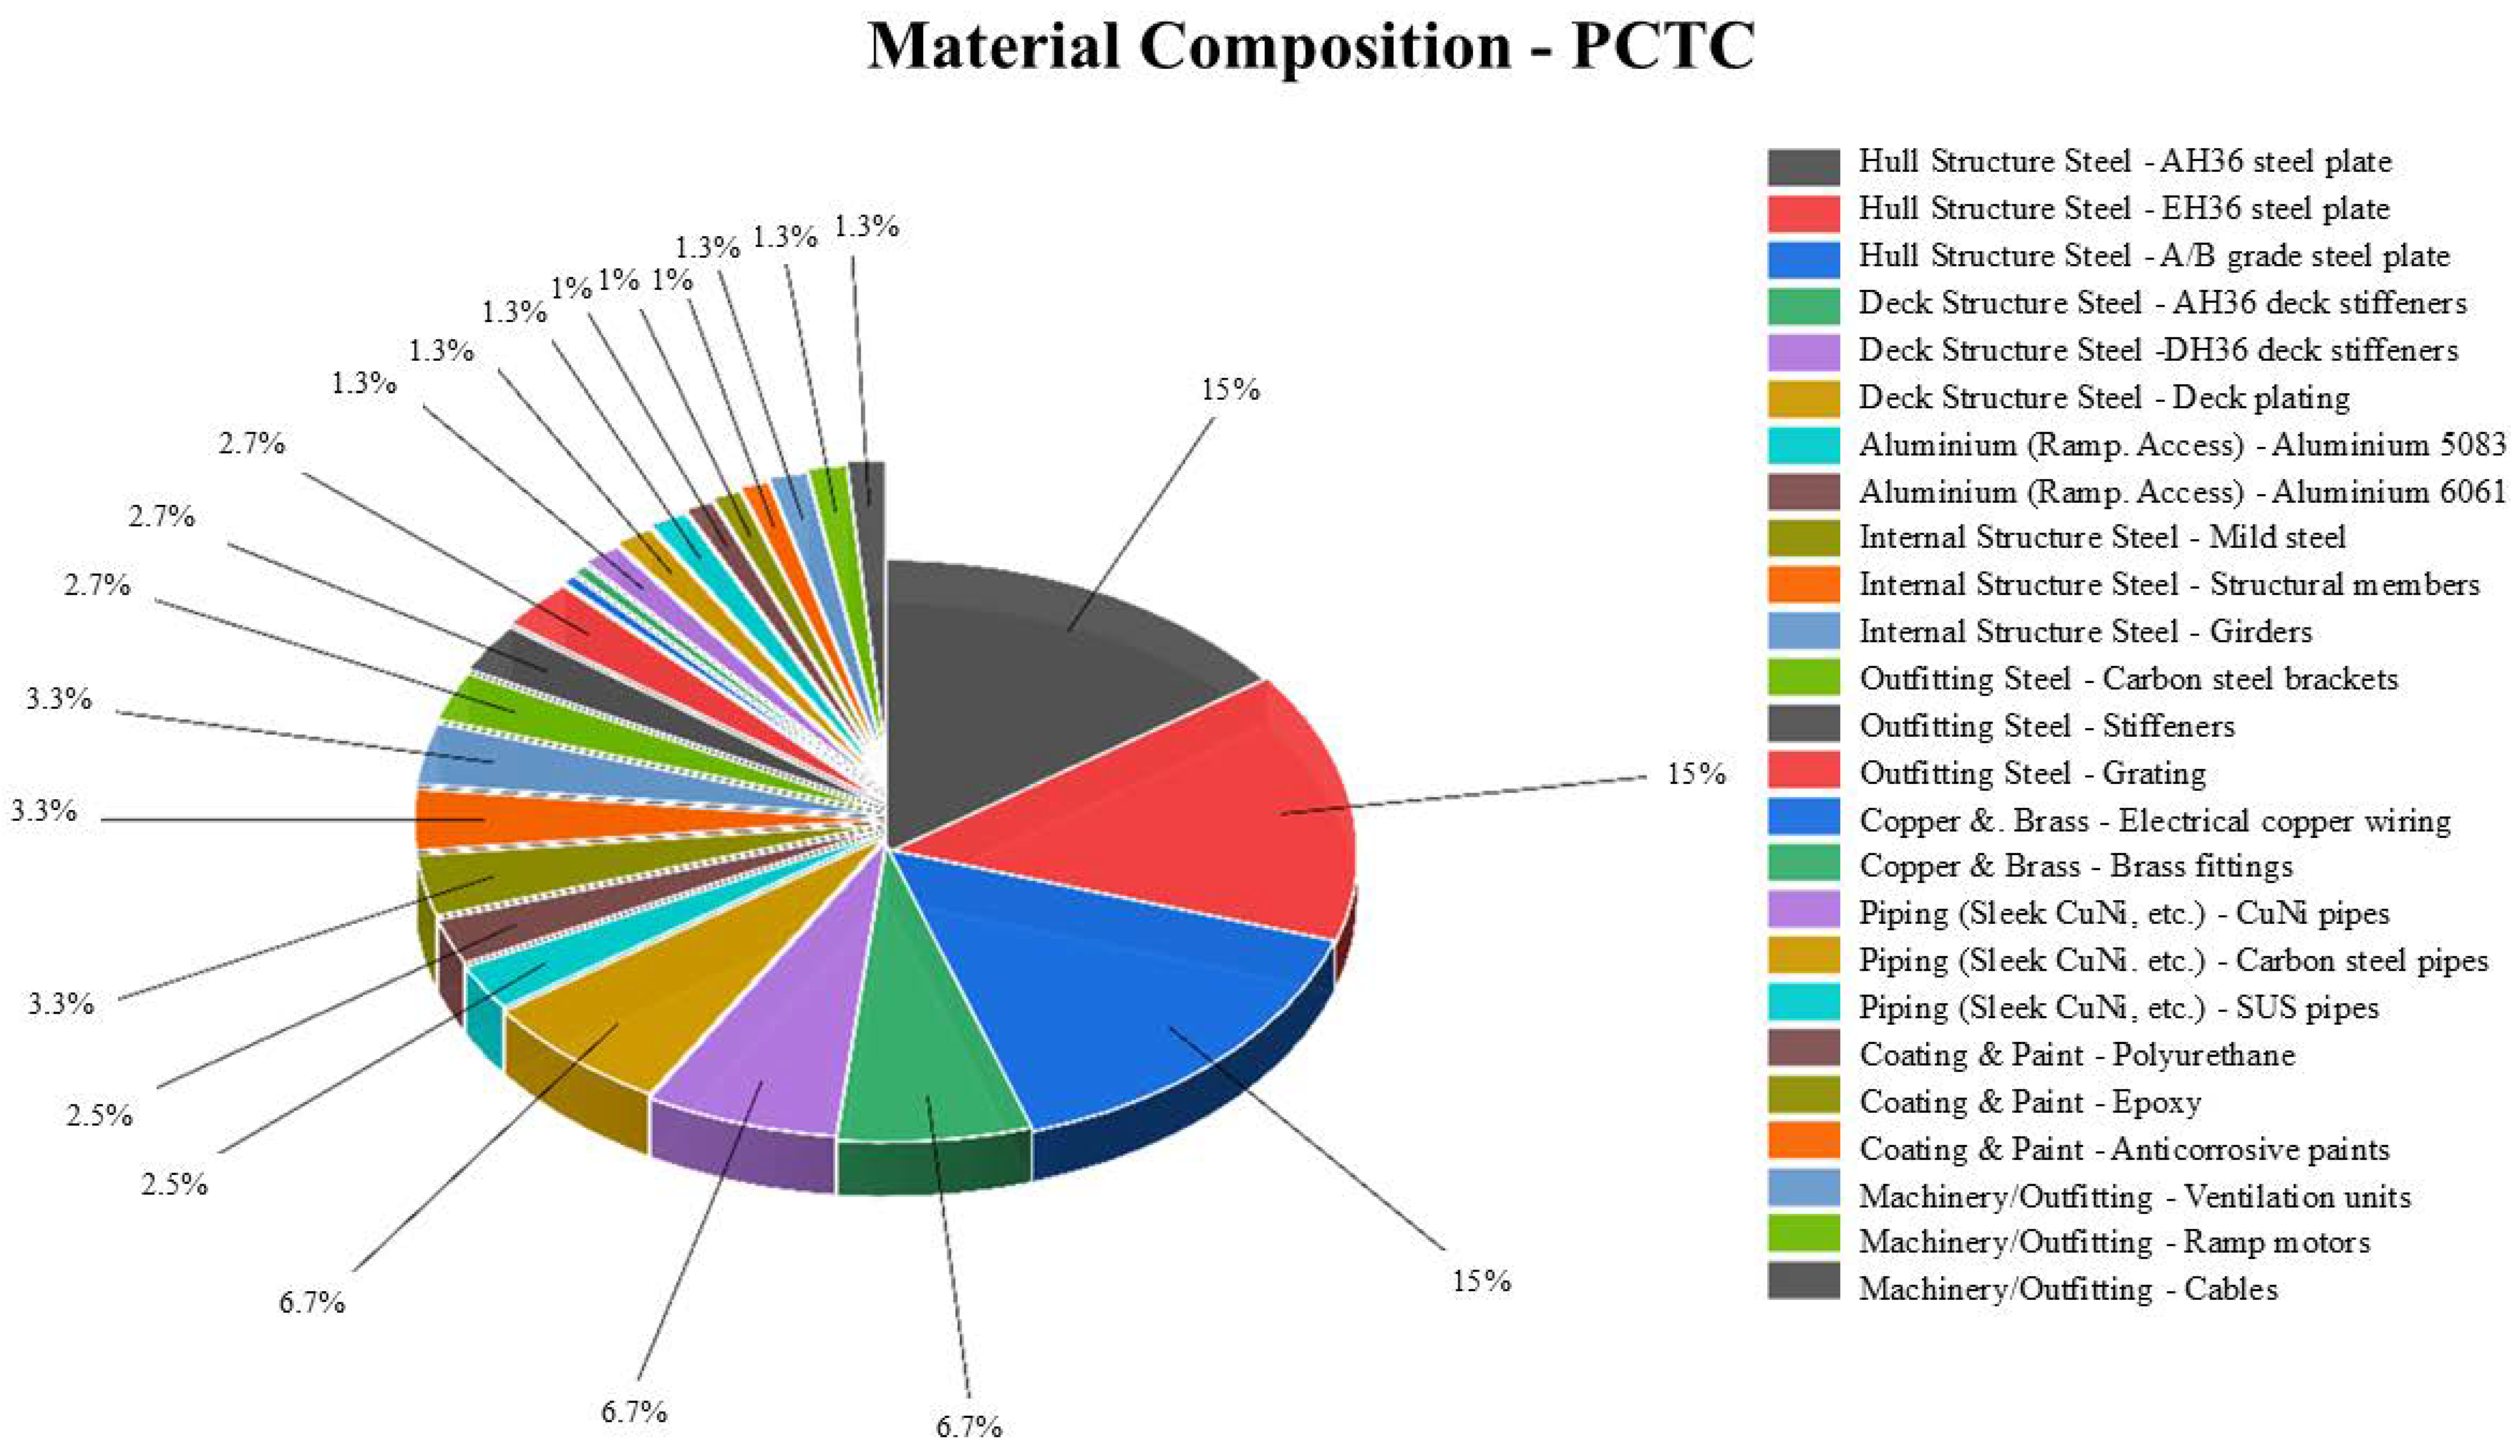
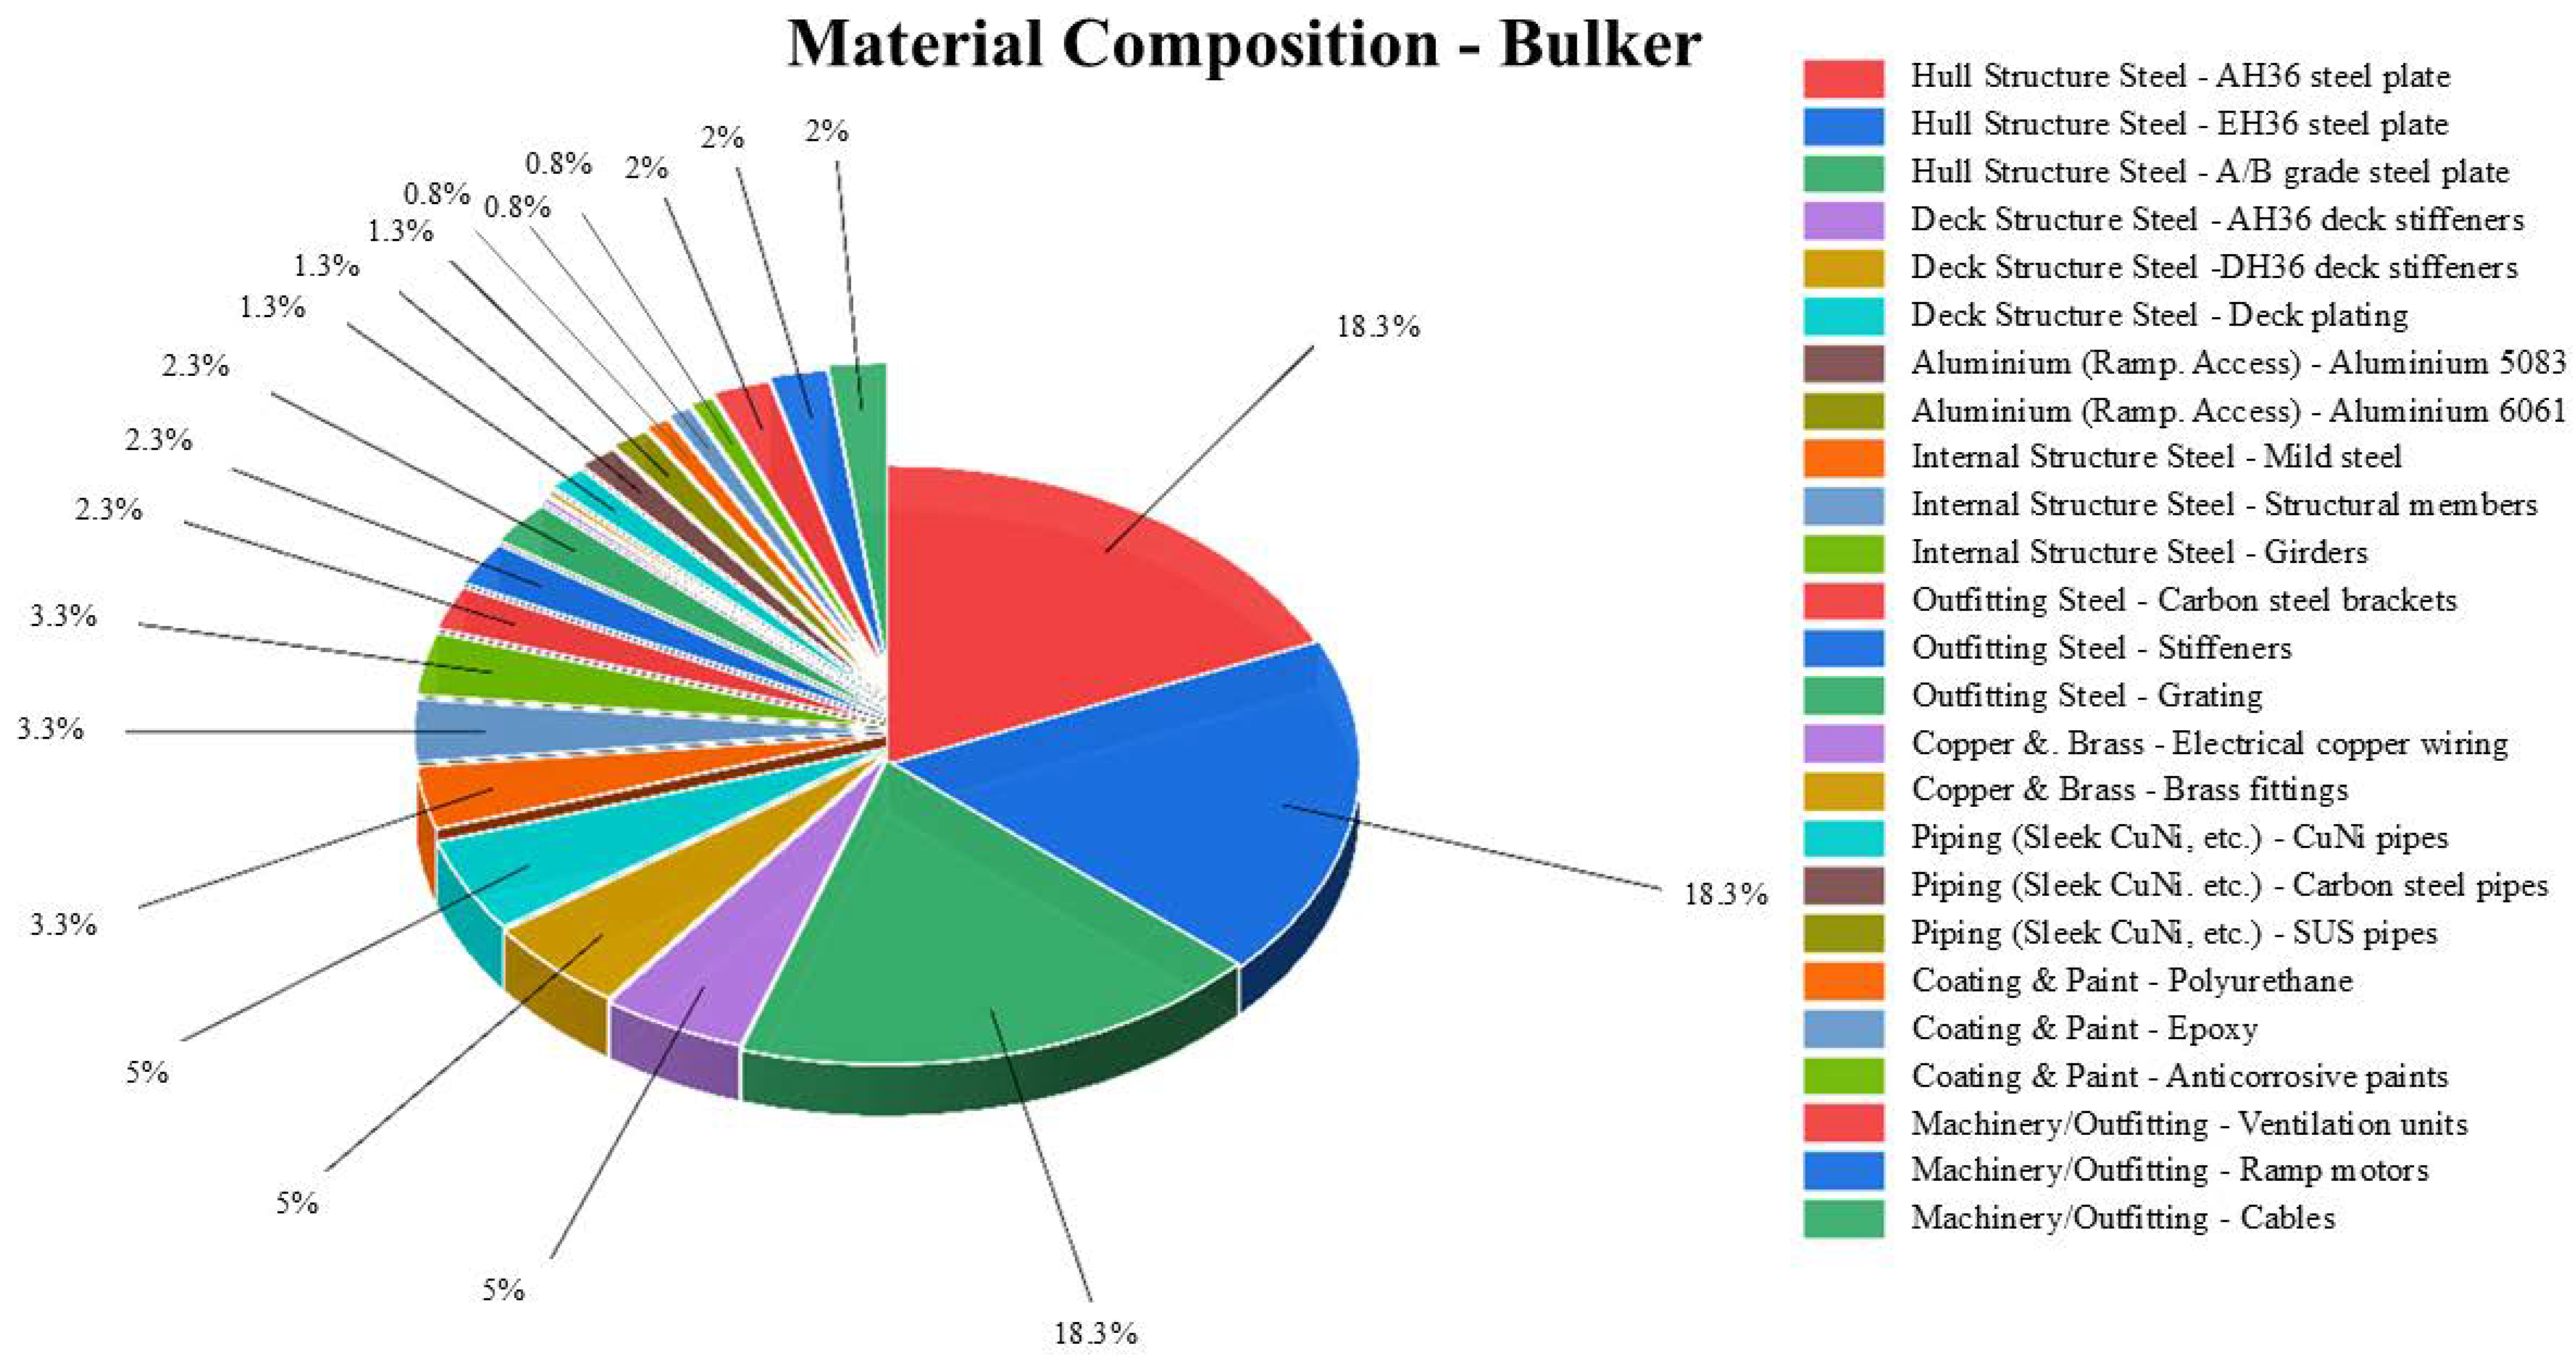



| Material Category | PCTC (Approx. %) | Bulk Carrier (Approx. %) | Container Vessel (Approx. %) |
|---|---|---|---|
| Hull structure steel | 45.0 | 55.0 | 50.0 |
| Deck structure steel | 20.0 | 15.0 | 18.0 |
| Aluminium (ramp, access) | 5.0 | 0.0 | 0.5 |
| Internal structure steel | 10.0 | 10.0 | 12.0 |
| Outfitting steel | 8.0 | 7.0 | 6.0 |
| Copper and brass | 1.0 | 0.5 | 1.0 |
| Piping (steel, CuNi, etc.) | 4.0 | 4.0 | 5.0 |
| Coating and paint | 3.0 | 2.5 | 3.0 |
| Machinery/outfitting | 4.0 | 6.0 | 4.5 |
| Category | Material | LCA Value (kg CO2-eq/kg) | Correct Source(s) | Justification |
|---|---|---|---|---|
| Hull structure steel | AH36 steel plate | 2.3 | Worldsteel LCI (Hot Rolled Plate), GaBi | Produced via BOF/EAF + hot rolling > 6 mm; alloying has negligible GWP effect vs. process emissions |
| Hull structure steel | EH36 steel plate | 2.3 | Worldsteel LCI, GaBi | Same process route as AH36; composition differences minor |
| Hull structure steel | A/B grade steel plate | 2.3 | Worldsteel LCI, GaBi | Same as AH36, chemistry differences negligible |
| Deck structure steel | AH36 deck stiffeners | 2.3 | Worldsteel LCI, GaBi | Hot rolled stiffener sections; dataset aligned |
| Deck structure steel | DH36 deck stiffeners | 2.3 | Worldsteel LCI (Sections), GaBi | HR section route matches |
| Deck structure steel | Deck plating | 2.3 | Worldsteel LCI, GaBi | Same as AH36 plates |
| Aluminium (ramp, access) | Aluminium 5083 | 10.5 | European Aluminium EPD, GaBi | Marine-grade 5xxx alloy; dataset scope matches |
| Aluminium (ramp, access) | Aluminium 6061 | 10.5 | European Aluminium EPD, GaBi | 6xxx alloy, rolled; consistent with dataset |
| Internal structure steel | Mild steel | 2.2 | Worldsteel LCI (HR coil/section), GaBi | Generic low-carbon HR coil |
| Internal structure steel | Structural members | 2.2 | Worldsteel LCI, GaBi | Rolled sections; dataset aligned |
| Internal structure steel | Girders | 2.2 | Worldsteel LCI, GaBi | Channels/beams from same route |
| Outfitting steel | Carbon steel brackets | 2.2 | Worldsteel LCI, GaBi | Fabrication within HR section dataset scope |
| Outfitting steel | Stiffeners | 2.2 | Worldsteel LCI, GaBi | Plate-based stiffeners; same route |
| Outfitting steel | Grating | 2.2 | Worldsteel LCI, GaBi | HR section dataset |
| Copper and brass | Electrical copper wiring | 4.5 | ICA LCA (cathode copper), Ecoinvent | Cu rod drawing → conductor, dataset aligned |
| Copper and brass | Brass fittings | 3.8 | Brass EPD, GaBi | Cu-Zn alloy fittings, dataset covers |
| Piping (Steel, CuNi, etc.) | CuNi pipes | 3.0 | ICA (copper), Nickel Institute, GaBi | Weighted Cu-Ni alloy composition |
| Piping (Steel, CuNi, etc.) | Carbon steel pipes | 2.2 | Worldsteel LCI, GaBi | Welded/seamless pipe manufacturing dataset |
| Piping (Steel, CuNi, etc.) | SUS pipes | 6.1 | Outokumpu Stainless EPD, GaBi | Austenitic Cr-Ni stainless pipes |
| Coating and paint | Polyurethane | 5.0 | PlasticsEurope Eco-profile, GaBi | PU resin binder dataset matches marine coating binder |
| Coating and paint | Epoxy | 6.0 | Generic coating EPD, GaBi | Epoxy resin production, marine grade |
| Coating and paint | Anticorrosive paints | 6.5 | Literature review, GaBi | Resin + pigment stage; marine anticorrosive formulations |
| Machinery/ outfitting | Ventilation units | 4.5 | HVAC unit EPD, GaBi | Mixed metal/plastic assembly dataset |
| Machinery/ outfitting | Ramp motors | 6.5 | Electric motor EPD, GaBi | Copper winding, casing, assembly |
| Machinery/ outfitting | Cables | 5.0 | Cable EPD, GaBi | Copper wiring + insulation, dataset scope |
| Scenarios | Description | Rationale (Why Considered/What It Shows) | Adjustment Rule |
|---|---|---|---|
| A—technological optimization | Improved efficiency in material processing and yard energy use without changing suppliers. | Represents “low-hanging fruit”: marginal improvements achievable with current suppliers and processes; provides realistic minimum-gain scenario. | All materials ×0.90 |
| B—Regional average (EU/EPD) | Applies Environmental Product Declaration (EPD) or EU-average emission factors for major materials. | Reflects a greener procurement pathway aligned with European supply chains; shows compliance-level carbon intensity if certified data are used. | Steel ×0.85; Al ×0.76; Cu ×0.78; brass ×0.84; coatings ×0.85 |
| C—Conservative baseline | Assumes poor supply chains with +15% higher emission factors. | Serves as an upper-bound stress test; highlights penalty risk if verification is weak or sourcing is uncontrolled. | All materials ×1.15 |
| D—Strategic material shift | Active substitution to lower-impact material grades or suppliers. | Demonstrates effect of deliberate design/procurement strategy; connects directly to ESG-driven corporate choices. | All materials ×0.80 |
| E—Green compliance | Selection aligned with ecolabel or owner green-procurement rules. | Shows real-world requirement from charterers/financiers; provides benchmark for market-driven decarbonization. | Steel ×0.85; Al ×0.70; Cu/brass ×0.75; coatings ×0.80; cables ×0.90 |
| F—EU-origin steel only | All hull and deck steel sourced from EU EAF-based suppliers. | Illustrates strong leverage of steel sourcing on CBAM exposure; demonstrates potential advantage of certified EU supply. | Steel ×0.80 |
| G—High-emission source | Assumes coal-intensive or uncontrolled global supply chains (+25%). | Provides worst-case bound; useful for quantifying maximum CBAM penalty exposure. | All materials ×1.25 |
| H—High-scrap steel | Steel produced with ~80% recycled scrap via EAF route. | Tests realistic pathway of steel sector decarbonization; shows benefits of circularity and high scrap availability. | Steel ×0.70 |
| I—Low-scrap aluminium | Aluminium sourced primarily from virgin production (low recycling rate). | Highlights sensitivity of aluminium to recycling; quantifies penalty if recycled content is not available. | Al ×1.40 |
| J—VOC-free coatings | Use of solvent-free or water-based paints. | Addresses health/environmental co-benefits; shows effect of coating system switch on total GWP. | Coatings ×0.65 |
| K—Owner EPD compliance | Materials restricted to certified EPD-compliant suppliers. | Simulates procurement rules of major shipowners; ensures transparency and comparability across supply chains. | Steel ×0.85; Al ×0.75; Cu/brass ×0.80; coatings ×0.85 |
| L—Electric copper refining | Copper produced with clean electricity (renewable-powered smelting). | Tests impact of decarbonized electricity in energy-intensive non-ferrous metals. | Cu/Brass ×0.75 |
| M—Korea–domestic mix | Emission factors based on domestic (Korea) industry-average datasets. | Reflects sourcing pathway common to Korean yards; important baseline for East Asia vs. EU comparison. | Steel/aluminium/copper/brass × regional Korea LCI values |
| N—Recycled plastics in equipment | Introduces recycled plastic share in outfitting/equipment components. | Captures emerging trend of recycled polymers; quantifies potential but smaller contribution. | Plastics in equipment ×0.70 |
| O—Full IMO GHG compliance | Assumes materials and processes aligned with IMO decarbonization targets. | Provides forward-looking compliance pathway; shows alignment with sectoral regulation beyond CBAM. | All materials ×0.70 (as per IMO-aligned pathway) |
| P—100% green steel (hydrogen DRI, −50%) | Steel produced entirely via hydrogen-based direct reduced iron (H2-DRI) combined with EAF route. | Represents one of the most transformative decarbonization pathways. Targets the dominant material in shipbuilding; ~65% lower EF vs. BF–BOF. Demonstrates how large-scale adoption of H2-DRI can dramatically cut embedded emissions and CBAM liability. | Steel ×0.50 |
| Q—Low-carbon steel (H2-DRI) | BF–BOF steelmaking route with ~60–70% carbon capture efficiency. | Transitional pathway for regions where BF–BOF remains dominant. Delivers meaningful reductions without full technological replacement; pragmatic but capital-intensive. | Steel ×0.60 |
| R—Aluminium closed-loop recycling (−45%) | Aluminium fully supplied via closed-loop recycling streams (e.g., ramps, outfitting). | Strong circular economy strategy; ~50% reduction vs. global average aluminium. Reduces reliance on virgin smelting and lowers CBAM exposure. | Al ×0.55 |
| S—Multi-metal recycling synergy (−30%) | Bundled recycling of multiple inputs: scrap-based EAF steel, recycled aluminium, renewable-sourced copper, and recycled plastics. | Demonstrates synergy effects across materials. Shows that multi-stream circularity can deliver cumulative reductions larger than individual measures. | Steel ×0.75; Al ×0.65; Cu/brass ×0.70. |
| T—Renewable shipyard electricity | Yard painting and fabrication powered by renewables. | Captures indirect but controllable emissions; reflects green-shipyard initiatives. | Per-kg EF unchanged; yard energy factor adjusted |
| U—Bio-based coatings | Substitution of petroleum-based resins with bio-based binders. | Demonstrates effect of renewable feedstocks; aligns with emerging ecolabels. | Coatings ×0.60 |
| V—Low-carbon logistics | Optimized transport modes and load factors for material supply. | Reflects incremental reductions through logistics efficiency; highlights scope-3 control potential. | All materials ×0.95 (excl. W) |
| W—Localized supply Chain | All key suppliers within 500 km radius. | Tests effect of localization; relevant to nearshoring and regional content rules. | All materials ×0.90 (excl. V) |
| X—Circular copper program | Full closed-loop recycling of copper/brass components. | Illustrates long-term circularity potential in non-ferrous metals. | Cu/Brass ×0.50 |
| Y—Material substitution | Lightweight redesign reduces material mass by 5–10%. | Represents design-driven reductions; connects directly to naval architecture trade-offs. | Mass ×(1–δ); EF unchanged |
| Scenario | Description | 2026 (EUR 95/t) | 2027 (EUR 120/t) | 2028 (EUR 130/t) | 2029 (EUR 140/t) | 2030 (EUR 149/t) |
|---|---|---|---|---|---|---|
| A | Technological optimization (−10%) | 6.24 | 7.89 | 8.54 | 9.2 | 9.79 |
| B | Regional average (EU/EPD) | 5.86 | 7.4 | 8.02 | 8.64 | 9.19 |
| C | Conservative baseline (+15%) | 7.98 | 10.08 | 10.92 | 11.76 | 12.51 |
| D | Strategic material shift (−20%) | 5.55 | 7.01 | 7.59 | 8.18 | 8.7 |
| E | Green compliance | 5.79 | 7.31 | 7.92 | 8.53 | 9.08 |
| F | EU-origin steel only | 6.04 | 7.63 | 8.27 | 8.91 | 9.48 |
| G | High-emission source (+25%) | 8.67 | 10.95 | 11.87 | 12.78 | 13.6 |
| H | High-scrap steel (80%) | 5.6 | 7.07 | 7.66 | 8.25 | 8.78 |
| I | Low-scrap aluminium (+40%) | 7.43 | 9.38 | 10.16 | 10.94 | 11.65 |
| J | VOC-free paints | 6.81 | 8.6 | 9.32 | 10.04 | 10.68 |
| K | Owner EPD compliance | 5.89 | 7.44 | 8.06 | 8.68 | 9.23 |
| L | Electric copper refining | 6.91 | 8.73 | 9.46 | 10.19 | 10.84 |
| M | Korea–domestic mix | 6.45 | 8.15 | 8.83 | 9.51 | 10.12 |
| N | Recycled plastics in equipment | 6.91 | 8.73 | 9.45 | 10.18 | 10.83 |
| O | Full IMO GHG compliance | 4.86 | 6.13 | 6.65 | 7.16 | 7.62 |
| P | 100% green steel (hydrogen DRI) | 4.7 | 5.94 | 6.43 | 6.93 | 7.38 |
| Q | CCUS-equipped steelmaking | 5.37 | 6.79 | 7.35 | 7.92 | 8.43 |
| R | Aluminium closed-loop recycling | 6.39 | 8.07 | 8.74 | 9.41 | 10.02 |
| S | Multi-metal recycling synergy | 5.36 | 6.77 | 7.34 | 7.9 | 8.41 |
| T | Renewable shipyard electricity | 6.86 | 8.67 | 9.39 | 10.12 | 10.77 |
| U | Bio-based coatings | 6.79 | 8.58 | 9.3 | 10.01 | 10.65 |
| V | Low-carbon logistics | 6.59 | 8.32 | 9.02 | 9.71 | 10.34 |
| W | Localized supply chain (≤500 km) | 6.24 | 7.89 | 8.54 | 9.2 | 9.79 |
| X | Circular copper program | 6.89 | 8.7 | 9.43 | 10.15 | 10.8 |
| Y | Advanced material substitution | 6.59 | 8.32 | 9.02 | 9.71 | 10.34 |
| Vessel Type | Exposure Range (EUR/Ship, 2026–2030) | Key Drivers of Variability | Best-Performing Scenario(s) | Worst-Performing Scenario(s) |
|---|---|---|---|---|
| PCTC (~7000 CEU) | EUR 4.7 M–EUR 13.6 M | Steel sourcing (BF–BOF vs. H2-DRI), aluminium recycling, coating choice | Scenario P (100% green steel, H2-DRI); Scenario H (high-scrap steel) | Scenario G (high-emission sourcing); Scenario I (low-scrap aluminium) |
| Bulk carrier (200 k DWT) | EUR 4.4 M–EUR 14.0 M | Steel mass intensity, aluminium pathways, copper/coatings secondary effects | Scenario P (100% green steel, H2-DRI); Scenario O (IMO GHG compliance) | Scenario G (high-emission sourcing); Scenario C (conservative baseline) |
| Container vessel (20,000 TEU) | EUR 5.2 M–EUR 16.5 M | Steel sourcing, aluminium recycling, copper and coating systems | Scenario P (100% green Steel, H2-DRI); Scenario O (IMO GHG compliance) | Scenario G (high-emission sourcing); Scenario C (conservative baseline) |
Disclaimer/Publisher’s Note: The statements, opinions and data contained in all publications are solely those of the individual author(s) and contributor(s) and not of MDPI and/or the editor(s). MDPI and/or the editor(s) disclaim responsibility for any injury to people or property resulting from any ideas, methods, instructions or products referred to in the content. |
© 2025 by the authors. Licensee MDPI, Basel, Switzerland. This article is an open access article distributed under the terms and conditions of the Creative Commons Attribution (CC BY) license (https://creativecommons.org/licenses/by/4.0/).
Share and Cite
Kwon, B.-j.; Oh, S.-j.; Jeong, B.-u.; Park, Y.-m.; Shin, S.-c. Life Cycle Assessment of Shipbuilding Materials and Potential Exposure Under the EU CBAM: Scenario-Based Assessment and Strategic Responses. J. Mar. Sci. Eng. 2025, 13, 1938. https://doi.org/10.3390/jmse13101938
Kwon B-j, Oh S-j, Jeong B-u, Park Y-m, Shin S-c. Life Cycle Assessment of Shipbuilding Materials and Potential Exposure Under the EU CBAM: Scenario-Based Assessment and Strategic Responses. Journal of Marine Science and Engineering. 2025; 13(10):1938. https://doi.org/10.3390/jmse13101938
Chicago/Turabian StyleKwon, Bae-jun, Sang-jin Oh, Byong-ug Jeong, Yeong-min Park, and Sung-chul Shin. 2025. "Life Cycle Assessment of Shipbuilding Materials and Potential Exposure Under the EU CBAM: Scenario-Based Assessment and Strategic Responses" Journal of Marine Science and Engineering 13, no. 10: 1938. https://doi.org/10.3390/jmse13101938
APA StyleKwon, B.-j., Oh, S.-j., Jeong, B.-u., Park, Y.-m., & Shin, S.-c. (2025). Life Cycle Assessment of Shipbuilding Materials and Potential Exposure Under the EU CBAM: Scenario-Based Assessment and Strategic Responses. Journal of Marine Science and Engineering, 13(10), 1938. https://doi.org/10.3390/jmse13101938


