Article

Research on the Scheme and System Parameter Matching of a Wastewater-Driven Diaphragm Pump Group for Slurry Transport in Deep-Sea Mining

1
School of Mechanical and Electrical Engineering, Central South University, Changsha 410083, China
2
National Key Laboratory of Deep-Sea Mineral Researches Development and Utilization Technology, Changsha 410083, China
3
School of Mechatronics Engineering and Automation, Foshan University, Foshan 528000, China
*
Author to whom correspondence should be addressed.
J. Mar. Sci. Eng. 2025, 13(10), 1934; https://doi.org/10.3390/jmse13101934
Submission received: 20 August 2025 / Revised: 29 September 2025 / Accepted: 7 October 2025 / Published: 9 October 2025
(This article belongs to the Section Ocean Engineering)

Abstract

Prior research has proposed a basic configuration for a deep-sea mining system integrating slurry transport and wastewater discharge, and examined the operational characteristics of water-driven diaphragm pumps. Against the backdrop of commercial deep-sea polymetallic nodule exploitation, this study focuses on the technical design of seabed diaphragm pump groups and hydraulic parameter matching for a coupled slurry transport-wastewater discharge system. The solid–liquid two-phase output characteristics of the water-driven diaphragm pump were analyzed, leading to the proposal of a four-pump staggered configuration to ensure continuous particulate discharge throughout the full operating cycle. To meet commercial mining capacity requirements, the system consists of two sets (each with four pumps) operating with a phase offset to reduce fluctuations in slurry output concentration. A centralized output device was developed for the pump group, and a centralized mixing tank was designed based on analyses of outlet pipe length and positional effects. CFD-DEM simulations show that the combined effects of phased pump operation and centralized mixing tank mixing result in the slurry concentration delivered to the riser pipeline staying within ±1% of the mean for up to 57.8% of the system’s operational time. Considering the characteristics of both diaphragm and centrifugal pumps, the system is designed to output high-concentration slurry from the seabed diaphragm pumps, driven solely by wastewater, while centrifugal pumps provide lower-concentration transport by adding supplementary water from a buffer—thus reducing the risk of clogging. Under the constraints of centrifugal pump capacity, the system’s hydraulic parameters were optimized to maximize overall slurry transport efficiency while minimizing the energy consumption from wastewater discharge. The resulting configuration defines the flow rate and slurry concentration of the diaphragm pump group. Compared with conventional centrifugal pump-based transport schemes, the proposed system increases the slurry pipeline efficiency from 53.14% to 55.43% and reduces wastewater discharge-related pipeline resistance losses from 475.9 mH2O to 361.7 mH2O.

1. Introduction

The exploitation of deep-sea polymetallic nodules requires transporting nodules from several thousand meters below sea level to mining vessels at the surface. The prevailing method is hydraulic pipeline lifting, achieved through the use of subsea lift pumps and riser pipelines. Once the slurry reaches the surface, a dewatering process is carried out on the mining vessel. Solid particles exceeding a certain size are retained onboard for shipment to shore-based smelting facilities, while finer sediment particles and seawater are returned to the ocean as mining wastewater [1]. Studies have shown that discharging this wastewater at the ocean surface can lead to suspended particles obstructing light penetration and clogging the filter-feeding mechanisms of surface-dwelling marine organisms, thereby disrupting the biological communities in the photic zone [2]. More recent research has revealed that mid-water discharge of wastewater can result in the formation of ambient plumes, which may disperse over vast areas through advection over extended periods [3]. As a result, redirecting mining wastewater to the seabed for discharge is increasingly viewed as an essential environmental requirement for the responsible exploitation of deep-sea polymetallic nodules. On the other hand, most current mining system configurations rely on multiple sets of centrifugal electric pumps. For mining depths reaching 6000 m, the lowest set of centrifugal pump driven by an electric motor must be placed below 1500 m [4]. If positive displacement pumps are used instead, their installation would be located even closer to the seabed [5]. High-power subsea electric pumps deployed at great depths require equally deep-rated subsea power cables for operation. However, the cost of deep-sea power cables is extremely high; beyond a certain depth, the cable cost may even exceed that of the pump itself. Moreover, increasing the number of subsea cables raises the risk of interference with other components of the mining system, such as riser pipes and additional cables. The winches required to manage these cables also occupy valuable deck space on the mining vessel. In view of the dual considerations of utilizing mining wastewater discharge and reducing seabed cable applications, prior research proposed a new mining system scheme utilizing mining wastewater to drive a seabed diaphragm pump for mineral transport [6].
There are existing applications of seawater-driven diaphragm pumps for subsea slurry transport. In 2001, companies such as Conoco and Hydril introduced a subsea mud-lifting drilling technique, in which seawater was pumped from a surface platform to the seafloor to drive diaphragm pumps that returned drilling fluids and cuttings to the surface [7]. This seawater-driven lifting technology has since been widely adopted in dual-gradient drilling systems [8]. In 2010, Nautilus Minerals proposed a lifting system for its commercial polymetallic sulfide mining project at a depth of 1800 m, in which mining wastewater was used to drive seabed diaphragm pumps for mineral slurry transport [9]. Subsea diaphragm pumps were developed and tested on the seafloor [10]; however, due to the project not progressing to production, the system was not implemented in commercial operations. By contrast, there has been relatively limited research on the design and transport characteristics of water-driven diaphragm pump systems for subsea mineral transport. Schulte conducted a theoretical analysis of a water-driven seabed diaphragm pump system for mineral transport within the context of Nautilus Minerals’ mining configuration [11]. The analysis applied empirical equations and Newtonian mechanics to examine the pressure–flow characteristics at the pump’s inlet and outlet. However, an implicit assumption in the study was that the seabed diaphragm pump would behave similarly to a conventional mechanically driven diaphragm pump, with sinusoidal variations in inflow and outflow rates. Notably, this assumption lacks experimental validation. Kang et al. proposed a coupled system for mineral lifting and wastewater discharge in the context of deep-sea polymetallic nodule mining. Given the considerable mining depth, the proposed system employed seabed diaphragm pumps driven by wastewater, operating in tandem with centrifugal pumps positioned closer to the mining vessel [6]. Hu et al. conducted this research within the context of deep-sea polymetallic nodule transport, establishing a test platform to simulate solid–liquid two-phase flow in a water-driven diaphragm pump. Transport experiments using synthetic nodule particles were carried out, and Computational Fluid Dynamics–Discrete Element Method (CFD–DEM) simulations were performed in conjunction with physical testing to evaluate the pump’s transport performance. The experimental and simulation results consistently demonstrated that, when supplied with a steady inflow of water at constant pressure, the diaphragm pump produced an almost uniform and steady outflow, with only a slight decrease in pressure. These findings reveal output characteristics that are fundamentally different from those of conventional mechanically or mechano-fluidically driven diaphragm pumps, indicating a novel “dual-sided fluid-driven” operating mechanism and output behavior [12]. Xu also proposed a diaphragm-based lifting pump for deep-sea mineral transport. The design consists of a flat-panel diaphragm pump with dual interconnected chambers, driven by seawater. In this configuration, high-pressure water in one chamber actuates a central connecting shaft and diaphragm in the adjacent chamber, generating a negative pressure that draws in seabed slurry. This operating principle is essentially the same as that of conventional land-based diaphragm pumps [13]. However, due to the flat-panel configuration, the pump chamber volume is relatively small. At a slurry concentration of 10%, the output flow rate of a single pump is less than 15   m 3 / h . The study did not further address how such a design could meet the total hydraulic pipeline flow requirement of approximately 1800   m 3 / h necessary for commercial-scale production systems.
Overall, in response to the requirement for seabed discharge of mining wastewater in deep-sea operations, earlier studies have proposed an integrated mining system in which seabed diaphragm pumps are driven by mining wastewater to transport polymetallic nodules. Experimental and simulation studies of such pumps have shown that this wastewater-driven transport mechanism operates based on a “dual-sided fluid-driven” principle, exhibiting distinctive flow–pressure characteristics and solid–liquid two-phase transport capabilities, particularly for coarse particles. Building upon this foundation, the present study focuses on the design of a diaphragm pump group for commercial-scale deep-sea polymetallic nodule mining, along with the parameter matching of the coupled mineral transport and wastewater discharge system. Based on the slurry transport characteristics of the dual-sided fluid-driven seabed diaphragm pumps and the production capacity requirements of commercial operations, a configuration scheme for the pump group is proposed and its transport performance analyzed. Furthermore, with the objective of maximizing the overall system efficiency in both mineral lifting and wastewater discharge, the key structural and process parameters of the diaphragm pump group are analyzed and optimized. The result is a less harmful and technically efficient solution for mineral transport and wastewater discharge in deep-sea polymetallic nodule mining systems.

2. Technical Scheme and Parameter Requirements of the Wastewater-Driven Slurry Transport System for Polymetallic Nodule Mining

2.1. Technical Scheme of the Coupled Wastewater Discharge and Slurry Transport System Under Commercial Mining Conditions

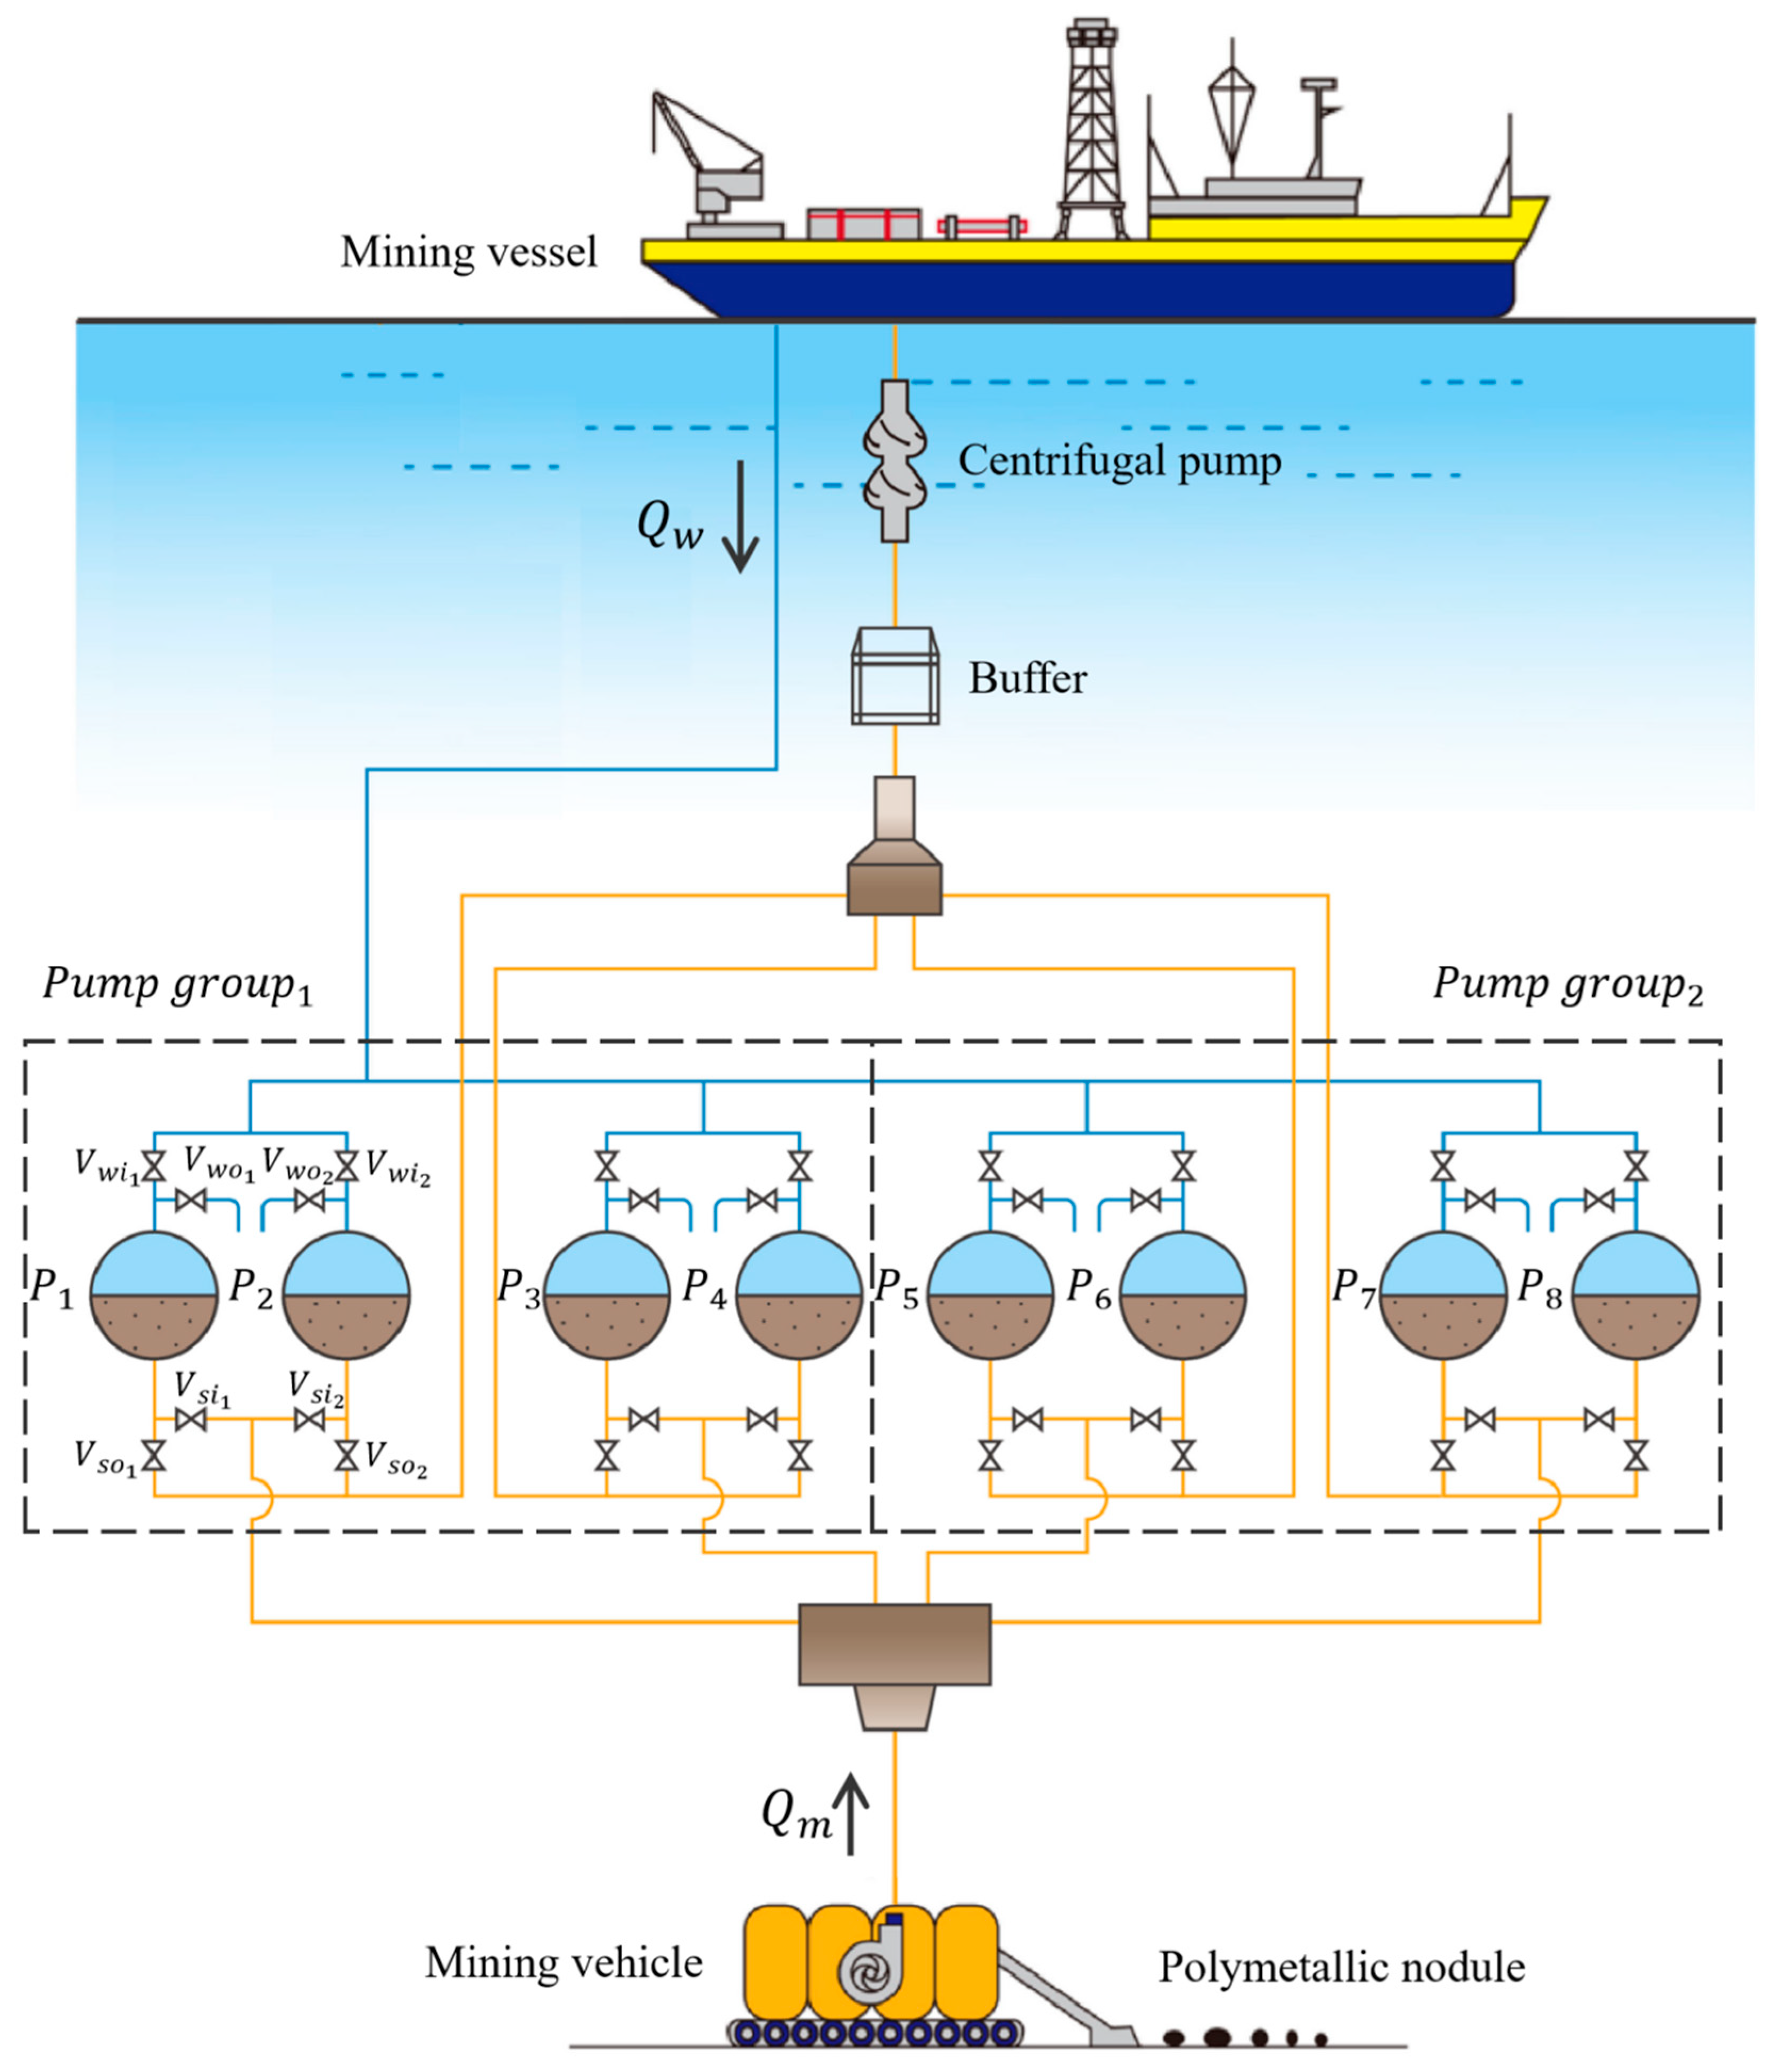
The exploitation process of deep-sea polymetallic nodules can be divided into three main stages: First, the mining vehicle collects nodules from the seabed, crushes them to a specified particle size, and transfers them to the slurry transport system. Second, the transport system pumps the nodule-bearing slurry from the seabed to the surface mining vessel via a vertical riser pipeline. Third, following dewatering on the vessel, the nodules are stored onboard for subsequent transport to shore-based processing facilities, while the wastewater is discharged back into the ocean. Building upon the basic technical framework proposed in prior research [6]—where mining wastewater is used to drive diaphragm pumps for slurry transport—this paper develops an enhanced coupled system design to meet the requirements of commercial-scale mining operations, as illustrated in Figure 1. In this scheme, mining wastewater designated for seabed discharge at a depth of 6000 m is first utilized to drive a group of seabed diaphragm pumps. These pumps convey the nodule slurry collected by the mining vehicle to an intermediate buffer located at a depth of 4000 m. From there, two sets of centrifugal pumps, installed at depths within 800 m of the surface, lift the slurry in stages to the dewatering system aboard the mining vessel.
In the diagram, Q s   ( t / h ) represents the mass flow rate of nodules per unit time, as determined by the system’s production capacity. Q m c   ( m 3 / h ) and Q m d   ( m 3 / h ) denote the slurry flow rates handled by the centrifugal pump and the diaphragm pump, respectively. Q w   ( m 3 / h ) is the flow rate of mining wastewater discharged back into the ocean. Q w b   ( m 3 / h ) indicates the volume of supplementary water naturally added from the buffer tank when required by the centrifugal pump. The flow from the mining vehicle to the inlet of the diaphragm pump group, represented by Q m   ( m 3 / h ) , may be conveyed using a volute casing centrifugal pump capable of handling high-concentration slurry transport.

2.2. Basic Parameter Requirements for the Coupled Wastewater Discharge and Slurry Transport System

Production capacity is the most critical metric for any commercial mining system. According to the recommendations of a United Nations panel of technical experts, a commercial development project must meet a baseline requirement of producing 3 million tons of dry nodules per year [1,14]. From the perspective of technology and engineering implementation, this is usually achieved by using two independent system modules, with each module producing 1.5 million tons of dry nodules per year. Based on calculations considering an annual operation of 250 days (24 h of operation per day) and a moisture content of approximately 30% in deep-sea nodules, the required production capacity of a deep-sea polymetallic nodule mining system should be no less than 360 tons per hour (wet weight) [1].
Slurry concentration is a key technical parameter in pipeline transport. Analytical studies have shown that, for underwater vertical transport of polymetallic nodules, a volumetric concentration of approximately 15% yields relatively high efficiency [6]. However, when typical centrifugal pumps with space guide vanes structure are used, the particle concentration is typically limited to 10–12% to reduce the risk of clogging within the pump chambers [15].
Based on the above parameters, the slurry transportation flow rate required for a commercial mining system can be roughly calculated as follows:
First, according to the nodule density, the volumetric flow rate of nodules Q s v   ( m 3 / h ) corresponding to the mass flow rate of nodules Q s   ( t / h ) can be calculated by Equation (1).
Q s v = 1000 Q s ρ s
In the equation, ρ s denotes the density of the nodules ( k g / m 3 ), set at 2000 k g / m 3 .
Then, according to the volumetric concentration of solid particles in the slurry, denoted as C v (%), the slurry transport flow rate Q (m3/h) of the mining system can be calculated as follows:
Q = Q s v C v
Herein, the value of C v depends on the operating conditions of the deep-sea mining system.
Based on the calculation, when Q s = 360   t / h and C v ranges from 10% to 15% [6], the required slurry transport flow rate is between 1200 m 3 / h and 1800 m 3 / h . Research analysis shows that a diaphragm pump group consisting of two pumps with spherical chambers of 1 m diameter and a working cycle of 8 s yields an output flow rate of only 450 m 3 / h . Therefore, to meet the production requirements of the system, the seabed diaphragm pump group must consist of a greater number of pumps arranged in parallel.
In addition, polymetallic nodules collected from the seabed are hydraulically transported to the mining vessel via vertical riser pipelines. According to engineering design standards for pipeline transport, the slurry velocity within the pipeline should exceed the settling velocity of solid particles by a factor of 3 to 5. Experimental studies by Chen et al. indicate that a single simulated nodule particle with a diameter of 10 mm and a density of 2000 k g / m 3 exhibits a terminal settling velocity of approximately 0.539 m/s in vertical water columns with internal diameters of 200 mm and 500 mm [16]. Accordingly, the slurry lifting velocity within the system should be maintained above 2.5 m/s.

3. Technical Scheme and Output Characteristics of the Diaphragm Pump Group for Wastewater-Driven Slurry Transport

3.1. Experimental Study on the Output Characteristics of Coarse-Particle Solid–Liquid Two-Phase Flow in a Dual-Sided Fluid-Driven Diaphragm Pump

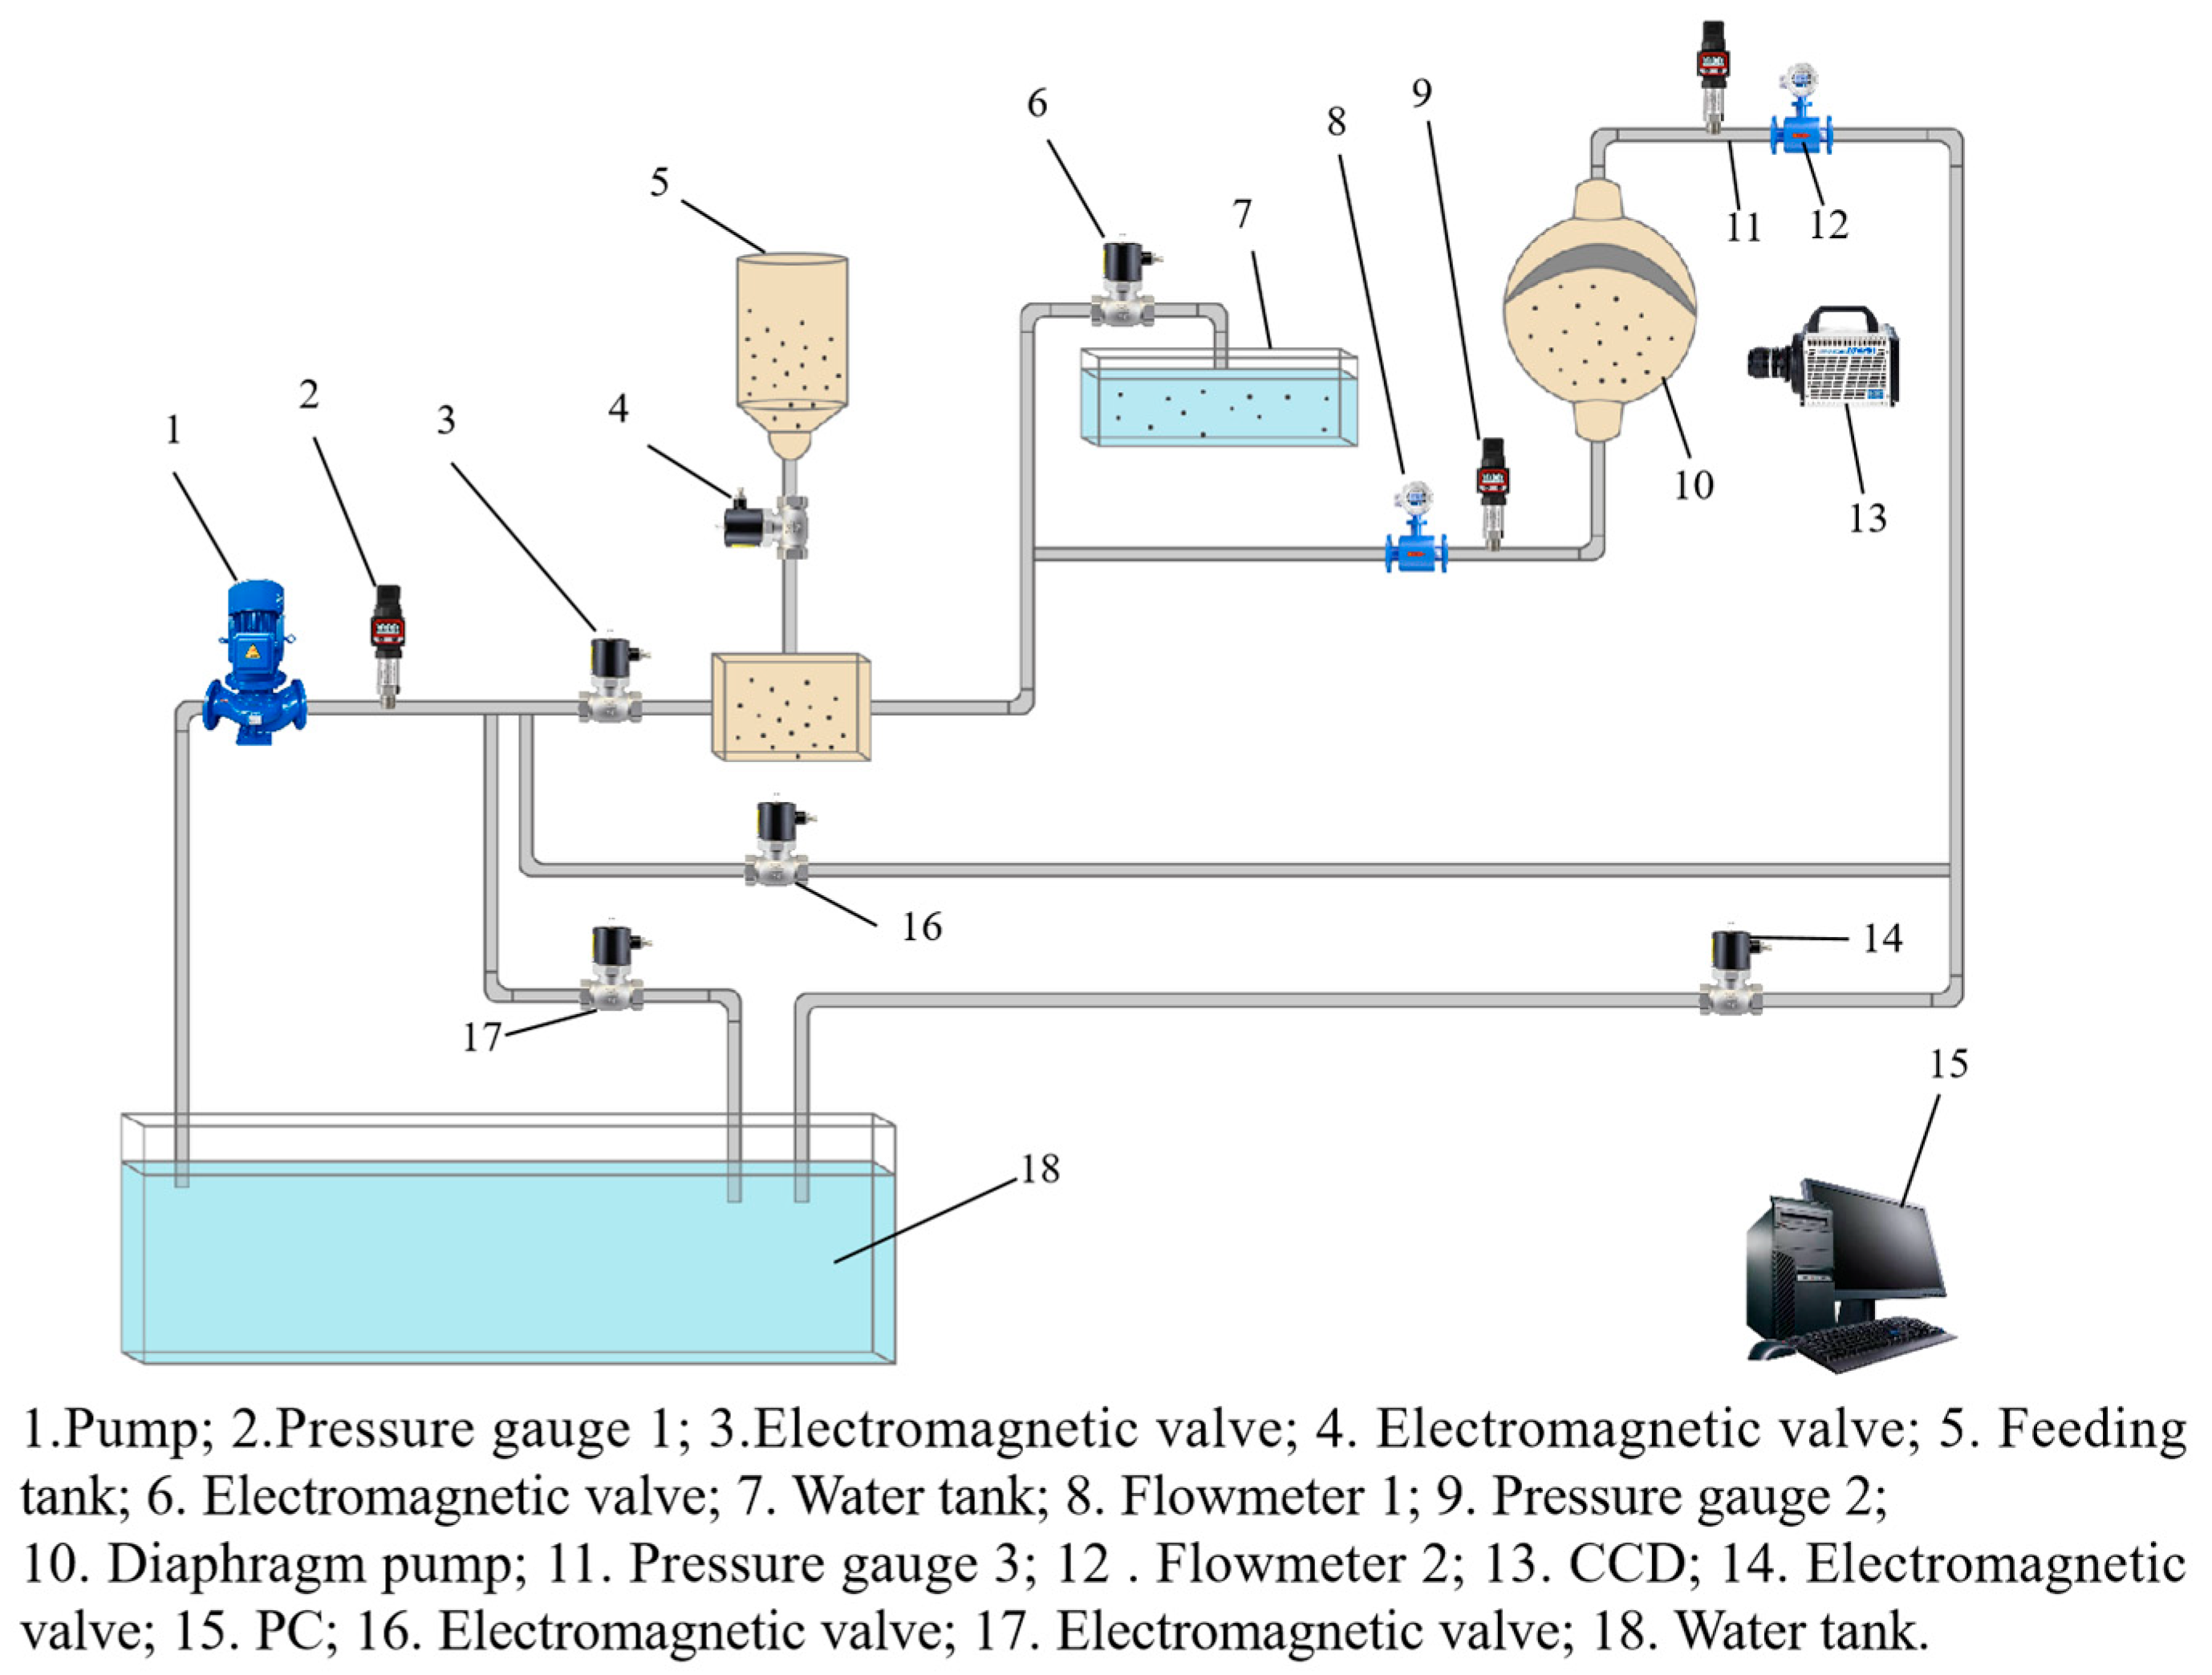
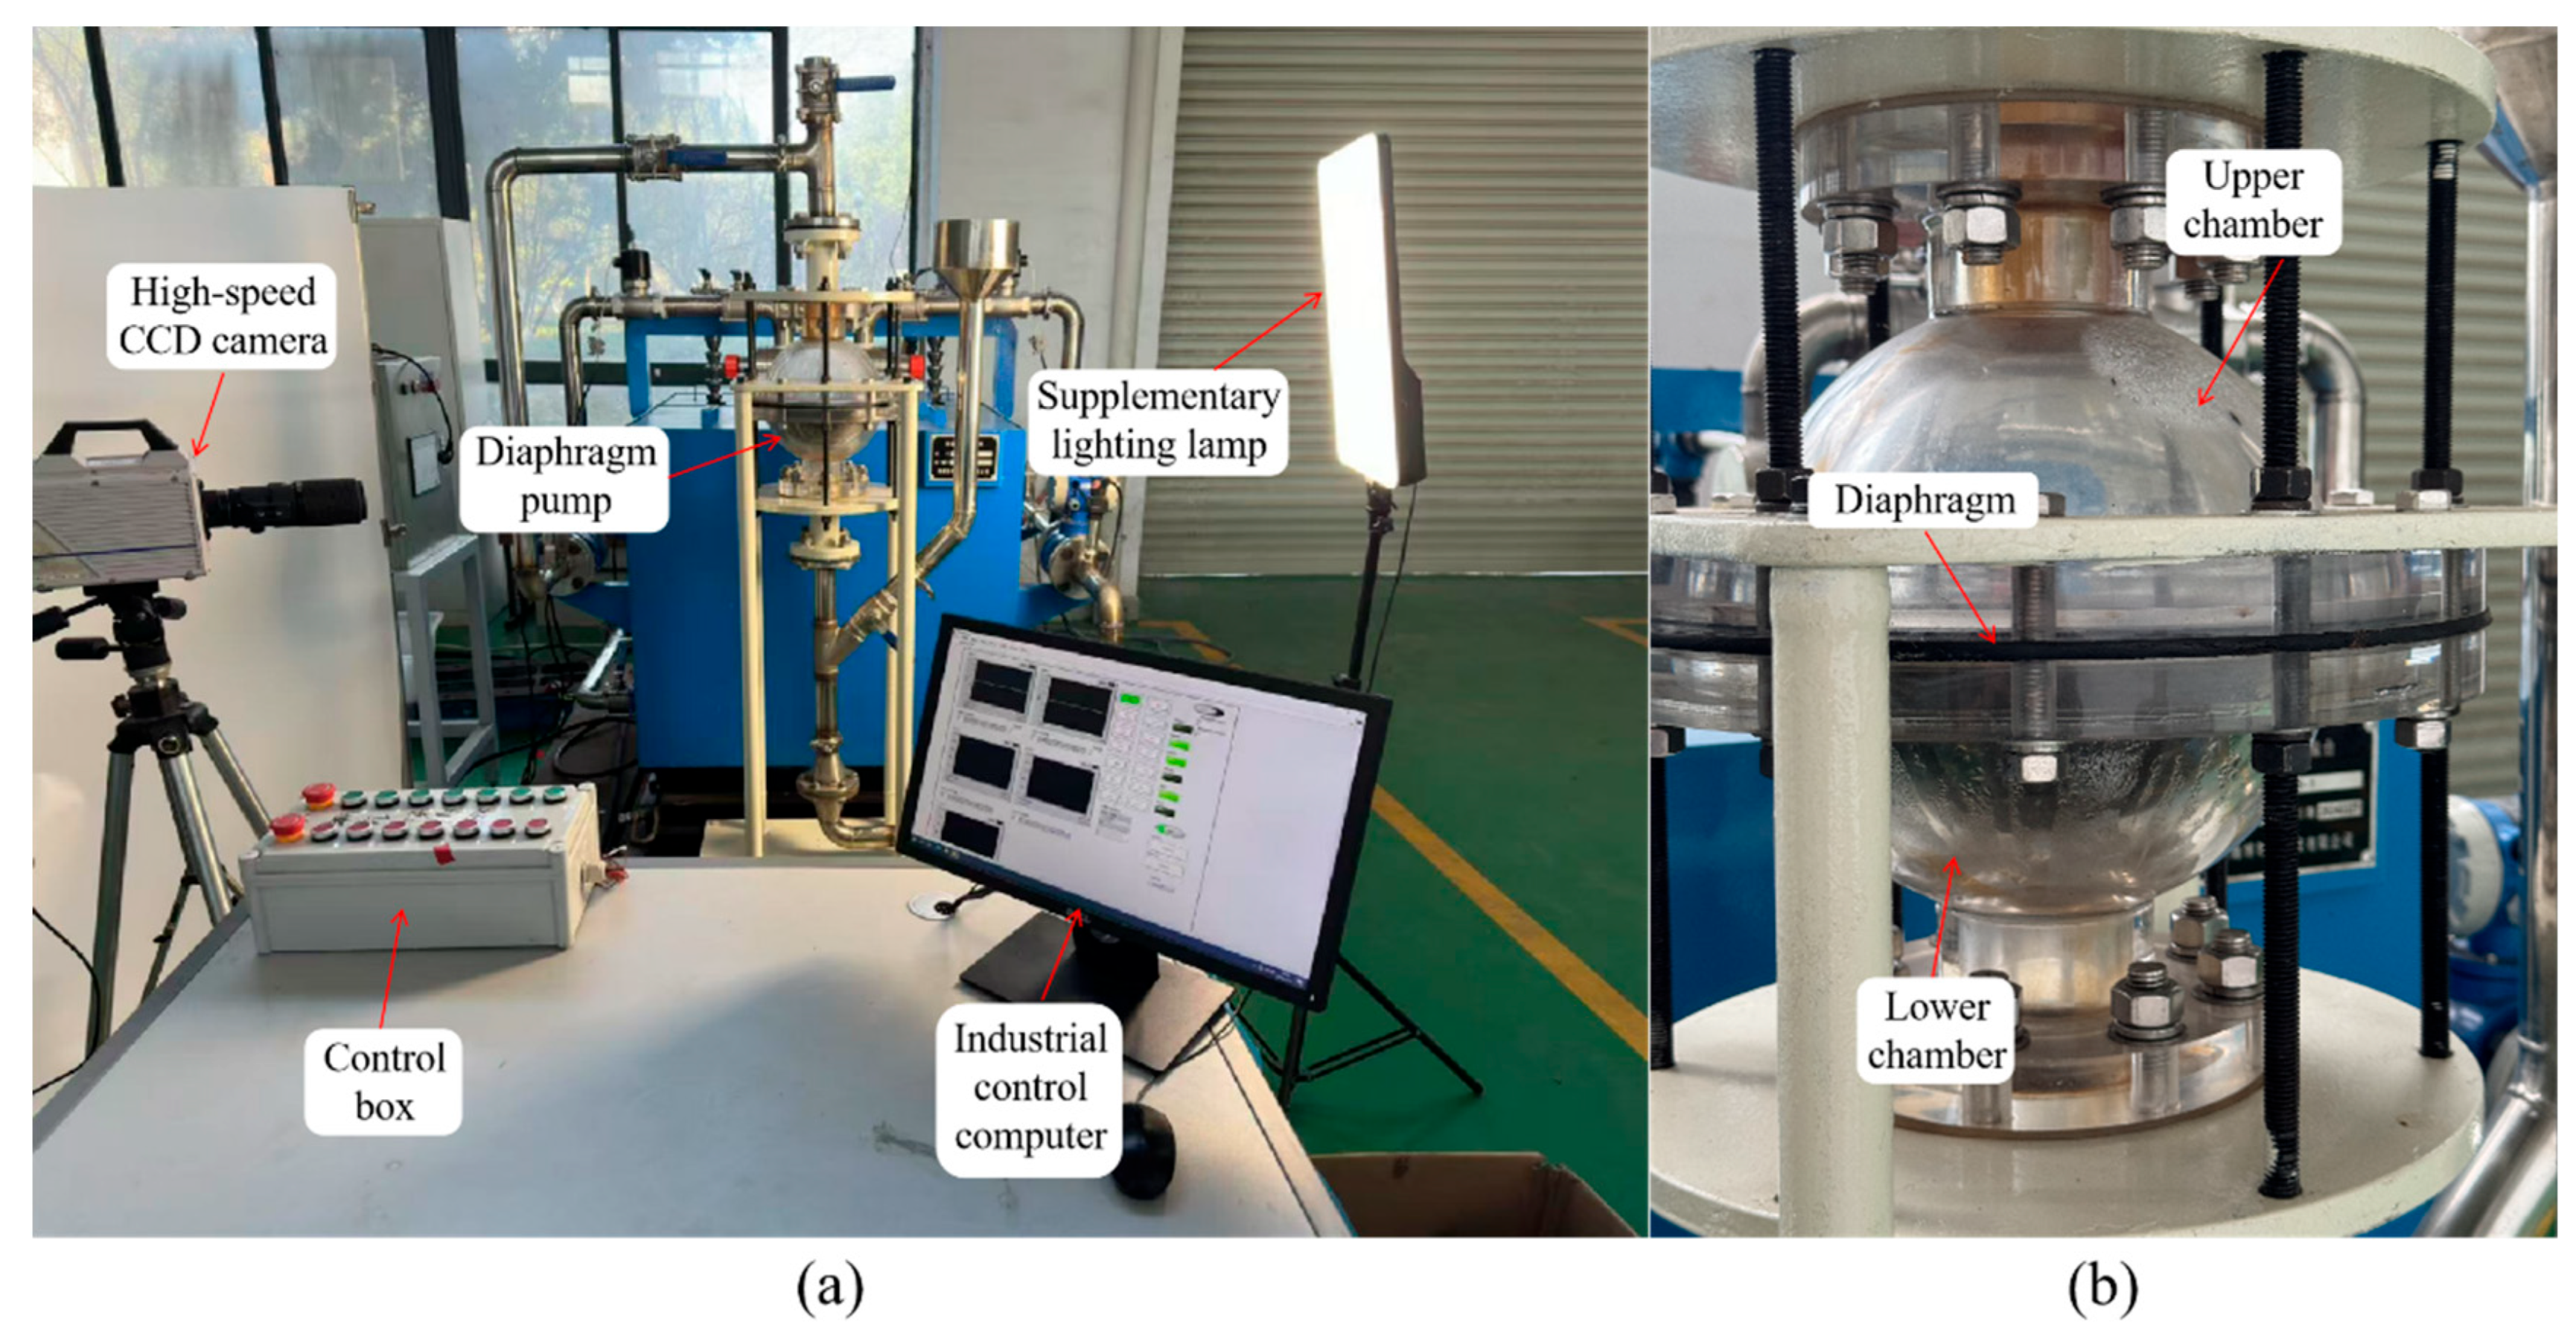
To investigate the slurry transport characteristics of water-driven diaphragm pumps, a dual-sided fluid-driven diaphragm pump test system for solid–liquid two-phase flow was constructed. Figure 2 presents the schematic diagram of this experimental setup. In the experimental system, the spherical diaphragm pump (Component 10) was fabricated from transparent acrylic material, with a pump chamber diameter of 20 cm and vertically mounted on the test bench. A variable-speed centrifugal pump (Component 1) was connected to the water tank (Component 18), and dual-sided fluid drive was achieved by controlling the solenoid valves (Components 3, 6, 14, and 16). During the solid–liquid two-phase flow experiment, a filter screen plate is installed in the pipeline at solenoid valve 4. Based on the volume of the test pump and the internal volume of the pipeline between valve 4 and the test pump, the volume of particles to be added is calculated according to the particle volume concentration of the current experiment. Before the experiment, particles with the corresponding volume, specified density, and particle size are added from the feed tank (Component 5), enabling the diaphragm pump to transport and discharge the test particles at a controlled concentration. Flow meters (Range: 0–4 MPa, accuracy: ± 0.5 % FS) and pressure sensors (Range: 0–23 m 3 / h , accuracy: ±0.5% FS) were installed at both the inlet and outlet of the diaphragm pump to monitor and record real-time flow rate and pressure data. A high-speed CCD Camera (Photron FASTCAM SA1.1, Component 13) was used to capture particle trajectories inside the pump chamber. Combined with digital image processing techniques, this enabled quantitative analysis of the spatial distribution and motion velocity of particles. Figure 3 shows a photograph of the physical experimental setup. It should be noted that the experimental system was focused on a specific diaphragm pump to investigate the fundamental characteristics of coarse-particle solid–liquid two-phase flow transport, while also validating CFD-DEM simulations.
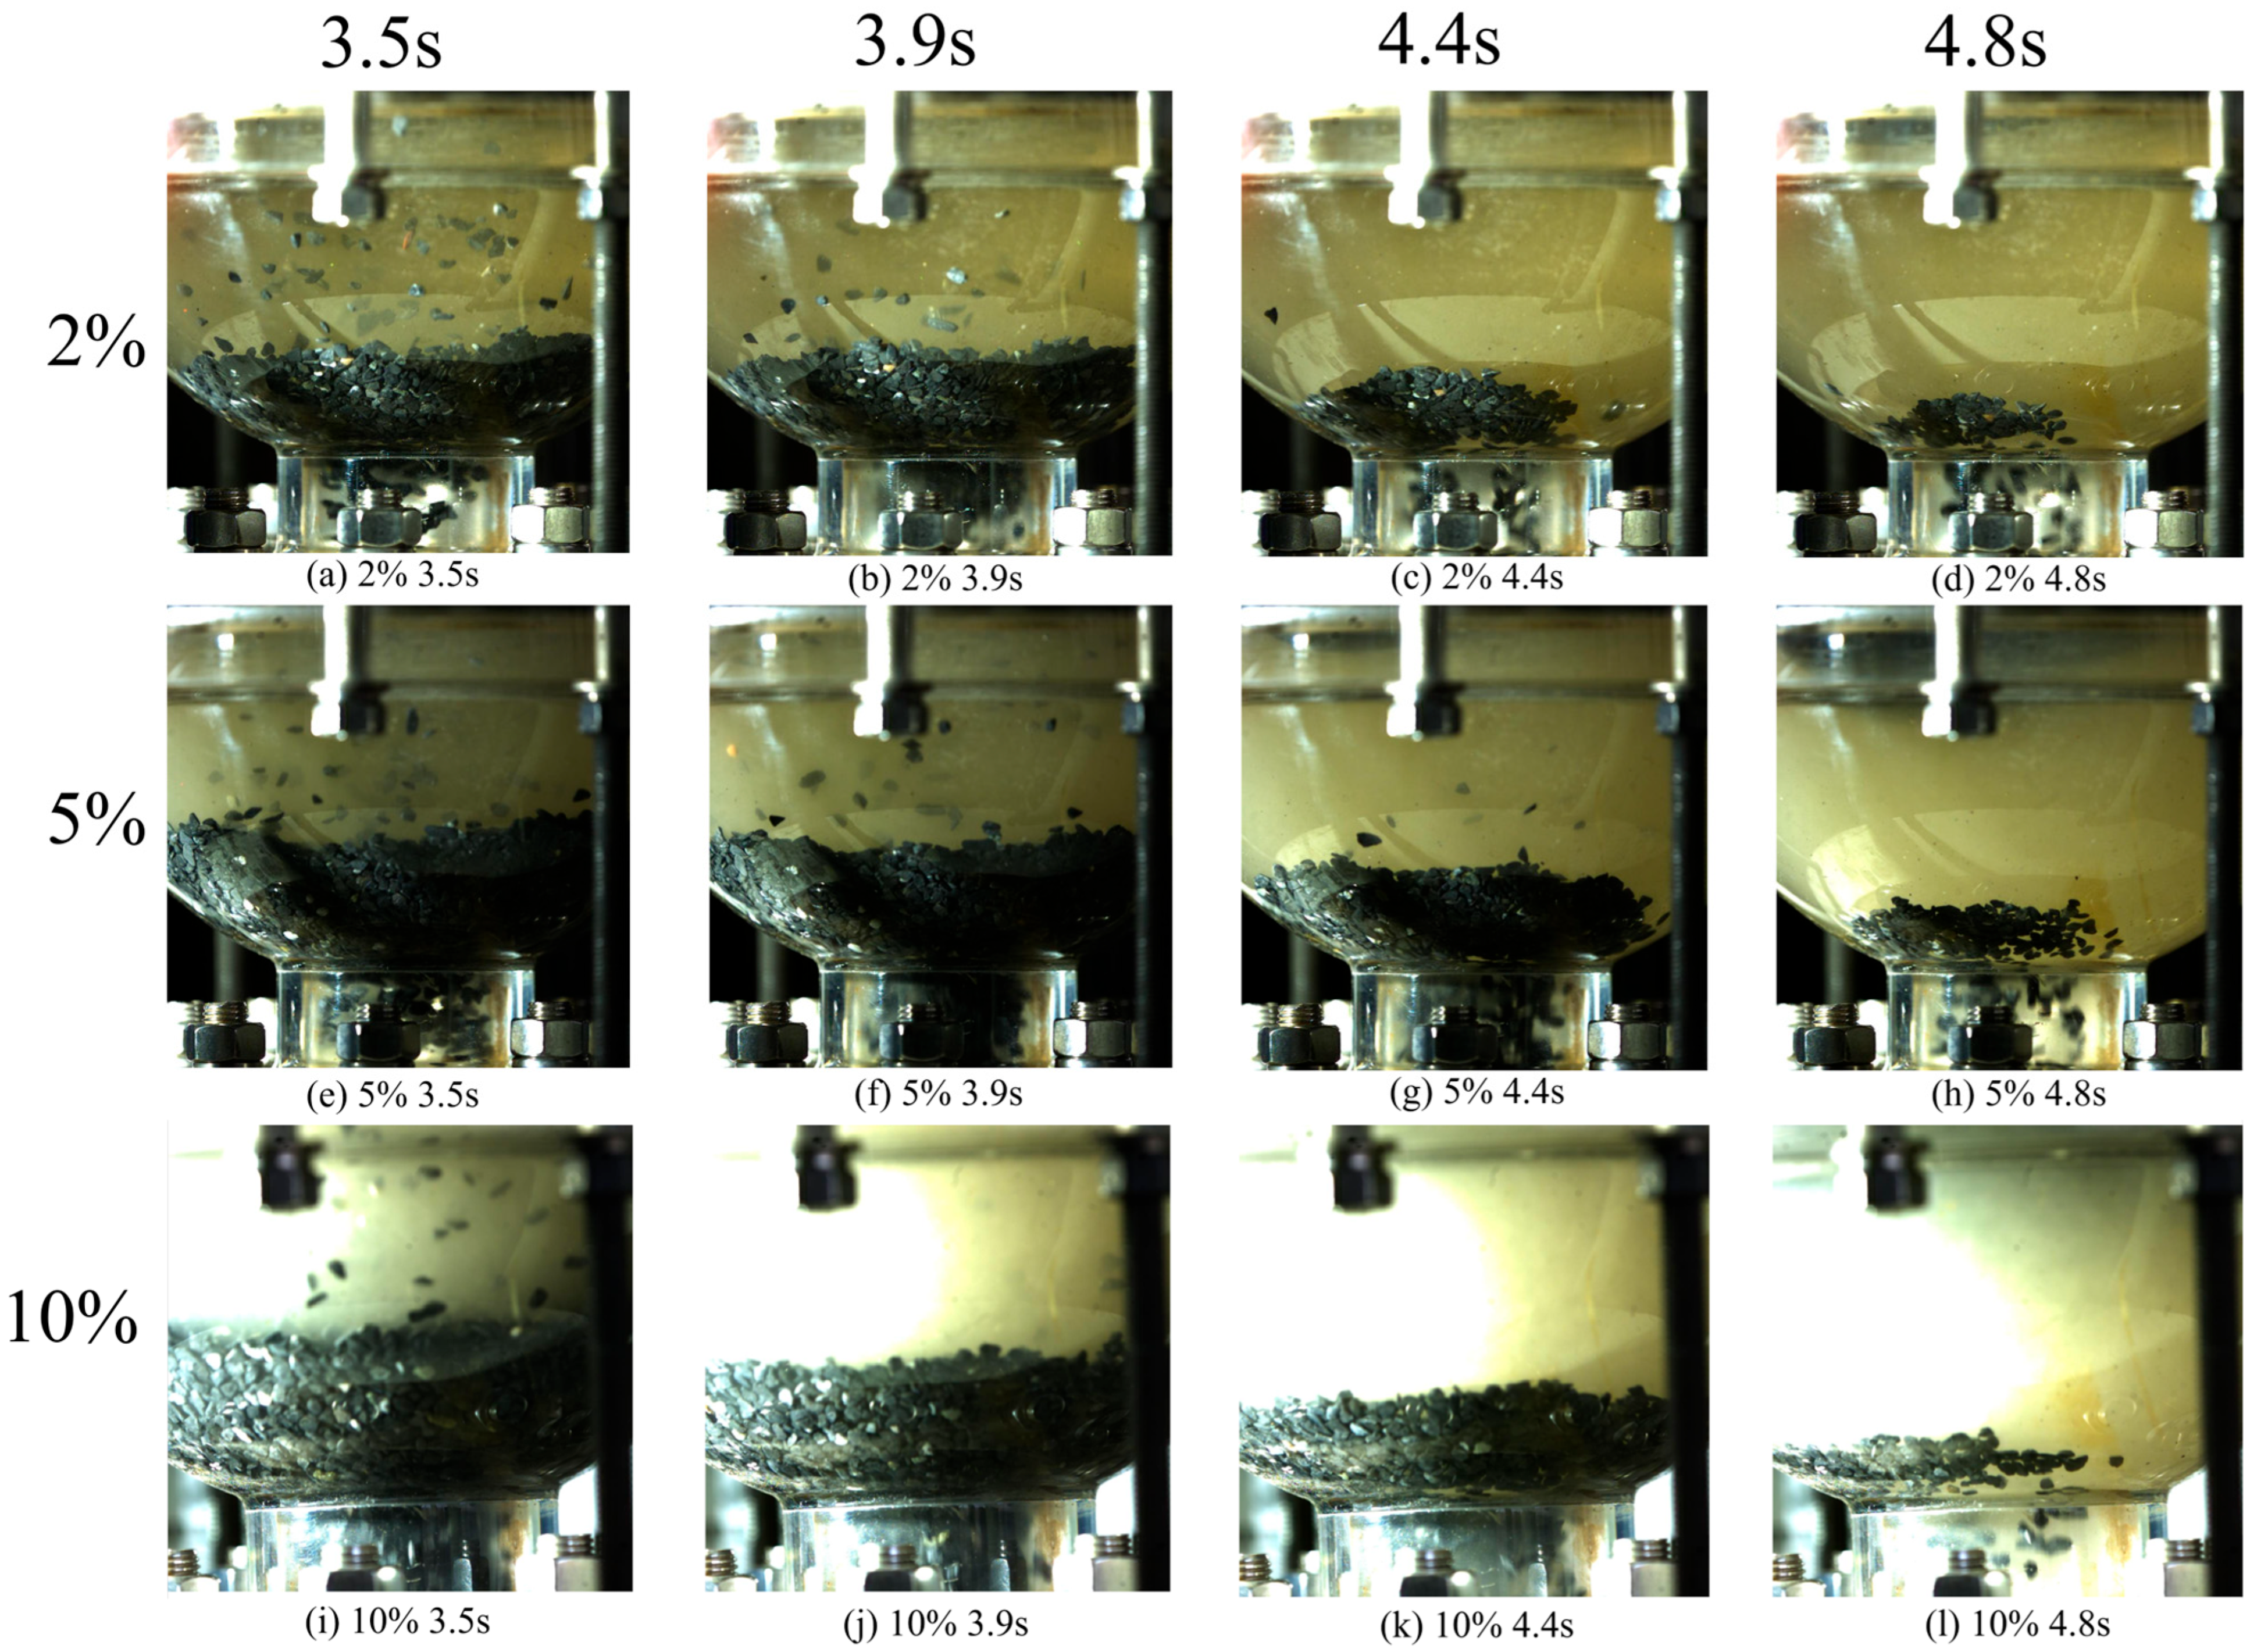
Solid–liquid two-phase flow experiments were conducted under the following operating conditions: a transport flow rate of 4   m 3 / h , a delivery pressure of 0.3   M P a , and a working cycle of 6.6   s . The test particles were specially fabricated to simulate the properties of polymetallic nodules, with a density of 2000 kg/m3 and a particle size range of 2–5 mm. Experiments were carried out at particle volumetric concentrations of 1%, 2%, 3%, 5%, 7.5%, and 10%, respectively. During the experiments, a high-speed CCD camera was employed to capture the lower chamber of the diaphragm pump at a frame rate of 250 fps.
On-site experimental observations and the high-speed CCD camera footage revealed that, during the inlet phase, particles rapidly decelerated upon entering the pump chamber and dispersed outward before gradually settling at the chamber bottom. During the outlet phase, particles quickly converged toward the outlet at the chamber base. Most of the particles were effectively discharged during the first half of the outlet cycle.
This study investigates the impact of diaphragm pump groups’ output characteristics on slurry transport system performance. Consequently, particular focus is placed on the flow behavior of nodule particles during the discharge phase of diaphragm pumps. Figure 4 presents a series of images showing particle distribution and accumulation within the pump chamber at different time points—3.5 s, 3.9 s, 4.4 s, and 4.8 s—which correspond to the first half of the outlet phase. Subfigures (a)–(d), (e)–(h), and (i)–(l) correspond to particle concentrations of 2%, 5%, and 10%, respectively. Comparative analysis indicates that the behavior of particle aggregation and discharge in the pump chamber is largely consistent across different concentrations. At the beginning of the outlet phase, a substantial quantity of particles had already gathered at the chamber bottom and were discharged in dense, high-concentration flow streams. The discharge of particles was generally completed within the first half of the outlet cycle.

3.2. CFD–DEM Analysis of Polymetallic Nodule Slurry Transport Characteristics in a Wastewater-Driven Diaphragm Pump

To comprehensively understand the characteristics and mechanisms of coarse-particle solid–liquid two-phase flow transport in water-driven diaphragm pumps, a CFD-DEM simulation model was developed based on the experimental system dimensions, specifically investigating the two-phase flow behavior in dual-sided fluid-driven diaphragm pumps.
(1)
CFD–DEM Methodology for Analyzing the Transport Performance of Water-Driven Diaphragm Pumps
In the diaphragm pump, seawater acts as a viscous, incompressible fluid and is treated as a continuous phase, with the governing equations solved in ANSYS Fluent 2024 R1. Given the low concentration and coarse particle size typical of polymetallic nodule slurry, an Euler–Lagrange approach was adopted. A CFD–DEM coupling method that accounts for particle physical properties, volume fraction, and inter-particle collisions was employed to simulate the interactions between the fluid and particles. A two-way coupled seawater–particle model was developed using the Fluent–Rocky simulation platform, providing a realistic representation of the flow conditions within the seabed diaphragm pump.
The Reynolds number is a dimensionless parameter that characterizes the flow regime in fluid dynamics, defined as the ratio of inertial forces to viscous forces [17]. It is calculated using Equation (3):
R e = ρ l V D μ l
In Equation (3), ρ l denotes the fluid density (kg/m3), V represents characteristic flow velocity (m/s), D is the characteristic length (m), and μ l is the dynamic viscosity (Pa·s).
The continuity equation for the liquid phase is given by Equation (4):
ϕ ρ l t + ϕ ρ l u j x j = 0
In Equation (4), ρ l denotes the fluid density (kg/m3), t represents time (s), u j is the velocity component of the fluid in the j direction (m/s), x j is the spatial coordinate component in the j direction, and ϕ is porosity (f). The porosity is directly determined by the current slurry transport concentration.
The momentum equation for the liquid phase is expressed as Equation (5):
ϕ ρ l u i t + ϕ ρ l u i u j x j = P x i + x j μ e u i x j + u j x i + 2 ϕ ρ l ε i m k ω l u k +   ρ s ϕ τ r s u s i u i
In this equation, subscripts l and s represent the fluid and particle phases, respectively. P is the effective pressure incorporating centrifugal force (Pa), ω denotes the angular velocity (rad/s), μ e is the effective dynamic viscosity (Pa·s), and τ r s is the particle relaxation time (s).
In the simulation, the RNG k-ε model is employed. The transport equations for the turbulent kinetic energy (k) and turbulent dissipation rate (ϵ) are, respectively, given by Equations (6) and (7):
t ( ρ k ) + x i ( ρ u i k ) = x j α k μ e f f k x j + G k + G b ρ ε Y M + S k
t ρ ε + x i ρ u i ε = x j α k μ e f f k x j + C l ε ε k G k + C 3 ε G b C 2 ε ρ ε 2 k R ε + S ε
In these equations, G k is the turbulent kinetic energy production term due to mean velocity gradients (kg/m·s3), expressed by Equation (8); G b is the turbulent kinetic energy production term due to buoyancy effects (kg/m·s3), and in this study, since the temperature field remains constant with no buoyancy effects generated, it is taken as zero [18]; Y M represents the contribution of fluctuating dilatation to the total dissipation rate in compressible turbulence (kg/m·s3); α k and α ε are the reciprocals of the effective Prandtl numbers for k and ϵ, respectively; C 1 ε , C 2 ε , and C 3 ε are empirical constants; R ε is the most important enhancement of the RNG k-ε model over the standard model, which adds an additional term to the dissipation rate equation, expressed by Equation (9); and S k and Sϵare user-defined source terms.
G k = μ t u k ¯ x i + u i ¯ x k u i ¯ x k
R ε = C μ ρ ( 1 η / η 0 ) 1 + β η 3 ε 2 k
In these equations, η = S k / ε ; η 0 = 4.38; β = 0.012; C 1 ε = 1.42; C 2 ε = 1.68; and C 3 ε = 0.0845.
The solid particles within the computational domain are modelled using a soft-sphere approach. Their motion obeys the laws of momentum conservation, as described by the translational momentum Equation (10) and the rotational (angular) momentum Equation (11):
m s d V s d t = m s g + F d + F p + F B + F l M + F l S + F a m + F c
d ω s d t = M f s + r c F c + M c
In these equations, V s is the particle velocity (m/s), m s denotes the particle mass (kg), ω s is the angular velocity of the particle (rad/s), and I s represents the moment of inertia ( k g · m 2 ). The terms F d , F p , F B , F l M , F l S , and F a m correspond to the hydrodynamic forces acting on the particle, namely drag force, pressure gradient force, Basset history force, Magnus lift, Saffman lift, and added mass force (N), respectively. F c denotes the contact force between particles (N). M f s is the hydrodynamic torque exerted by the fluid (N·m), r c is the vector from the particle’s centre of mass to the contact point (m), and M c is the torque due to rolling friction between particles (N·m).
During CFD-DEM unsteady transient simulations, particles experience fluid-mediated forces, including drag force, pressure gradient force, Basset force, Magnus lift force, Saffman lift force, and added mass force.
The drag force—essential for particle motion in viscous fluids—acting on a spherical particle is calculated as:
F d = 1 8 π C d ρ l d 2 ( u l V s ) 2
In the equation, C d represents the drag coefficient, d is particle diameter (m), u l denotes the fluid velocity at the particle centroid (m/s).
The pressure gradient force arising from fluid pressure gradients is given by:
F p = ( 1 6 π d 3 ) p x
In the equation, p / x represents the fluid pressure gradient along the x-axis (Pa/m).
The Basset force, generated when fluid inertia prevents instantaneous response to particle acceleration/deceleration, is defined as:
F B = C B π ρ l μ l d 2 t d ( u l V s ) / d τ t τ d τ
In the equation, C B denotes the Basset force coefficient; μ l represents the fluid dynamic viscosity (Pa·s).
Particle lift forces comprise the Magnus lift force (from particle rotation) and Saffman lift force (from fluid velocity gradients), expressed, respectively, as:
F l M = π 8 d 3 ρ l ω s ( u l V s )
F l S = 1.615 ρ l v d 2 ( u l V s ) d u l d y
In the equation, v is fluid kinematic viscosity ( m 2 / s ); d u l / d y represents the fluid velocity gradient along the y-axis ( s 1 ).
The added mass force—resulting from fluid inertial resistance when accelerating particles entrain surrounding fluid—can be conceptualized as an effective mass increase, calculated by:
F a m = 1 2 ρ l ( 1 6 π d 3 ) d d t ( u l V s )
(2)
CFD–DEM Simulation and Experimental Comparison of Solid–Liquid Two-Phase Transport in the Test Pump
A CFD–DEM simulation model of the experimental setup was developed to analyse the slurry transport performance under a 2% particle concentration condition. The simulation results were compared with experimental observations. Based on Equation (3), the Reynolds number at the bottom pipeline of the diaphragm pump is calculated to be approximately 3.3 × 10 4 . In Fluent 2024 R1, the flow field was configured using the RNG k - ε turbulence model, with standard wall functions applied. In the computational fluid dynamics (CFD) model, the governing equations for pressure, momentum, turbulent kinetic energy, and turbulent dissipation rate are all solved using the second-order upwind discretization scheme. In the simulation setup, all residual convergence criteria were set to 1 × 10 4 to ensure the accuracy of the computational results. This simulation employs the SIMPLE (Semi-Implicit Method for Pressure-Linked Equations) algorithm to solve the pressure field and couples it with the velocity field. Water was defined as the working fluid, with a density of 0.99 g/cm3 and a dynamic viscosity of 1.002 mPa·s. The boundary conditions at both pipe orifices were set as pressure inlet and pressure outlet. Solid-phase material properties were configured in Rocky 2024 R1. The particle density was set to 2000 kg/m3 with a Poisson’s ratio of 0.4 [19]. All particles were assumed to be spherical, with a diameter of 3 mm. The spherical pump casing was made of acrylic glass (density: 950 kg/m3, Poisson’s ratio: 0.45). The spherical pump casing pipelines were made of duplex stainless steel (density: 7850 kg/m3, Poisson’s ratio: 0.33), while the diaphragm was made of nitrile rubber (density: 950 kg/m3, Poisson’s ratio: 0.45). The adhesive force was modelled using the JKR model [20]. Drag forces were calculated using the Huilin–Gidaspow model [21], while lift forces were computed based on the Saffman model [22].
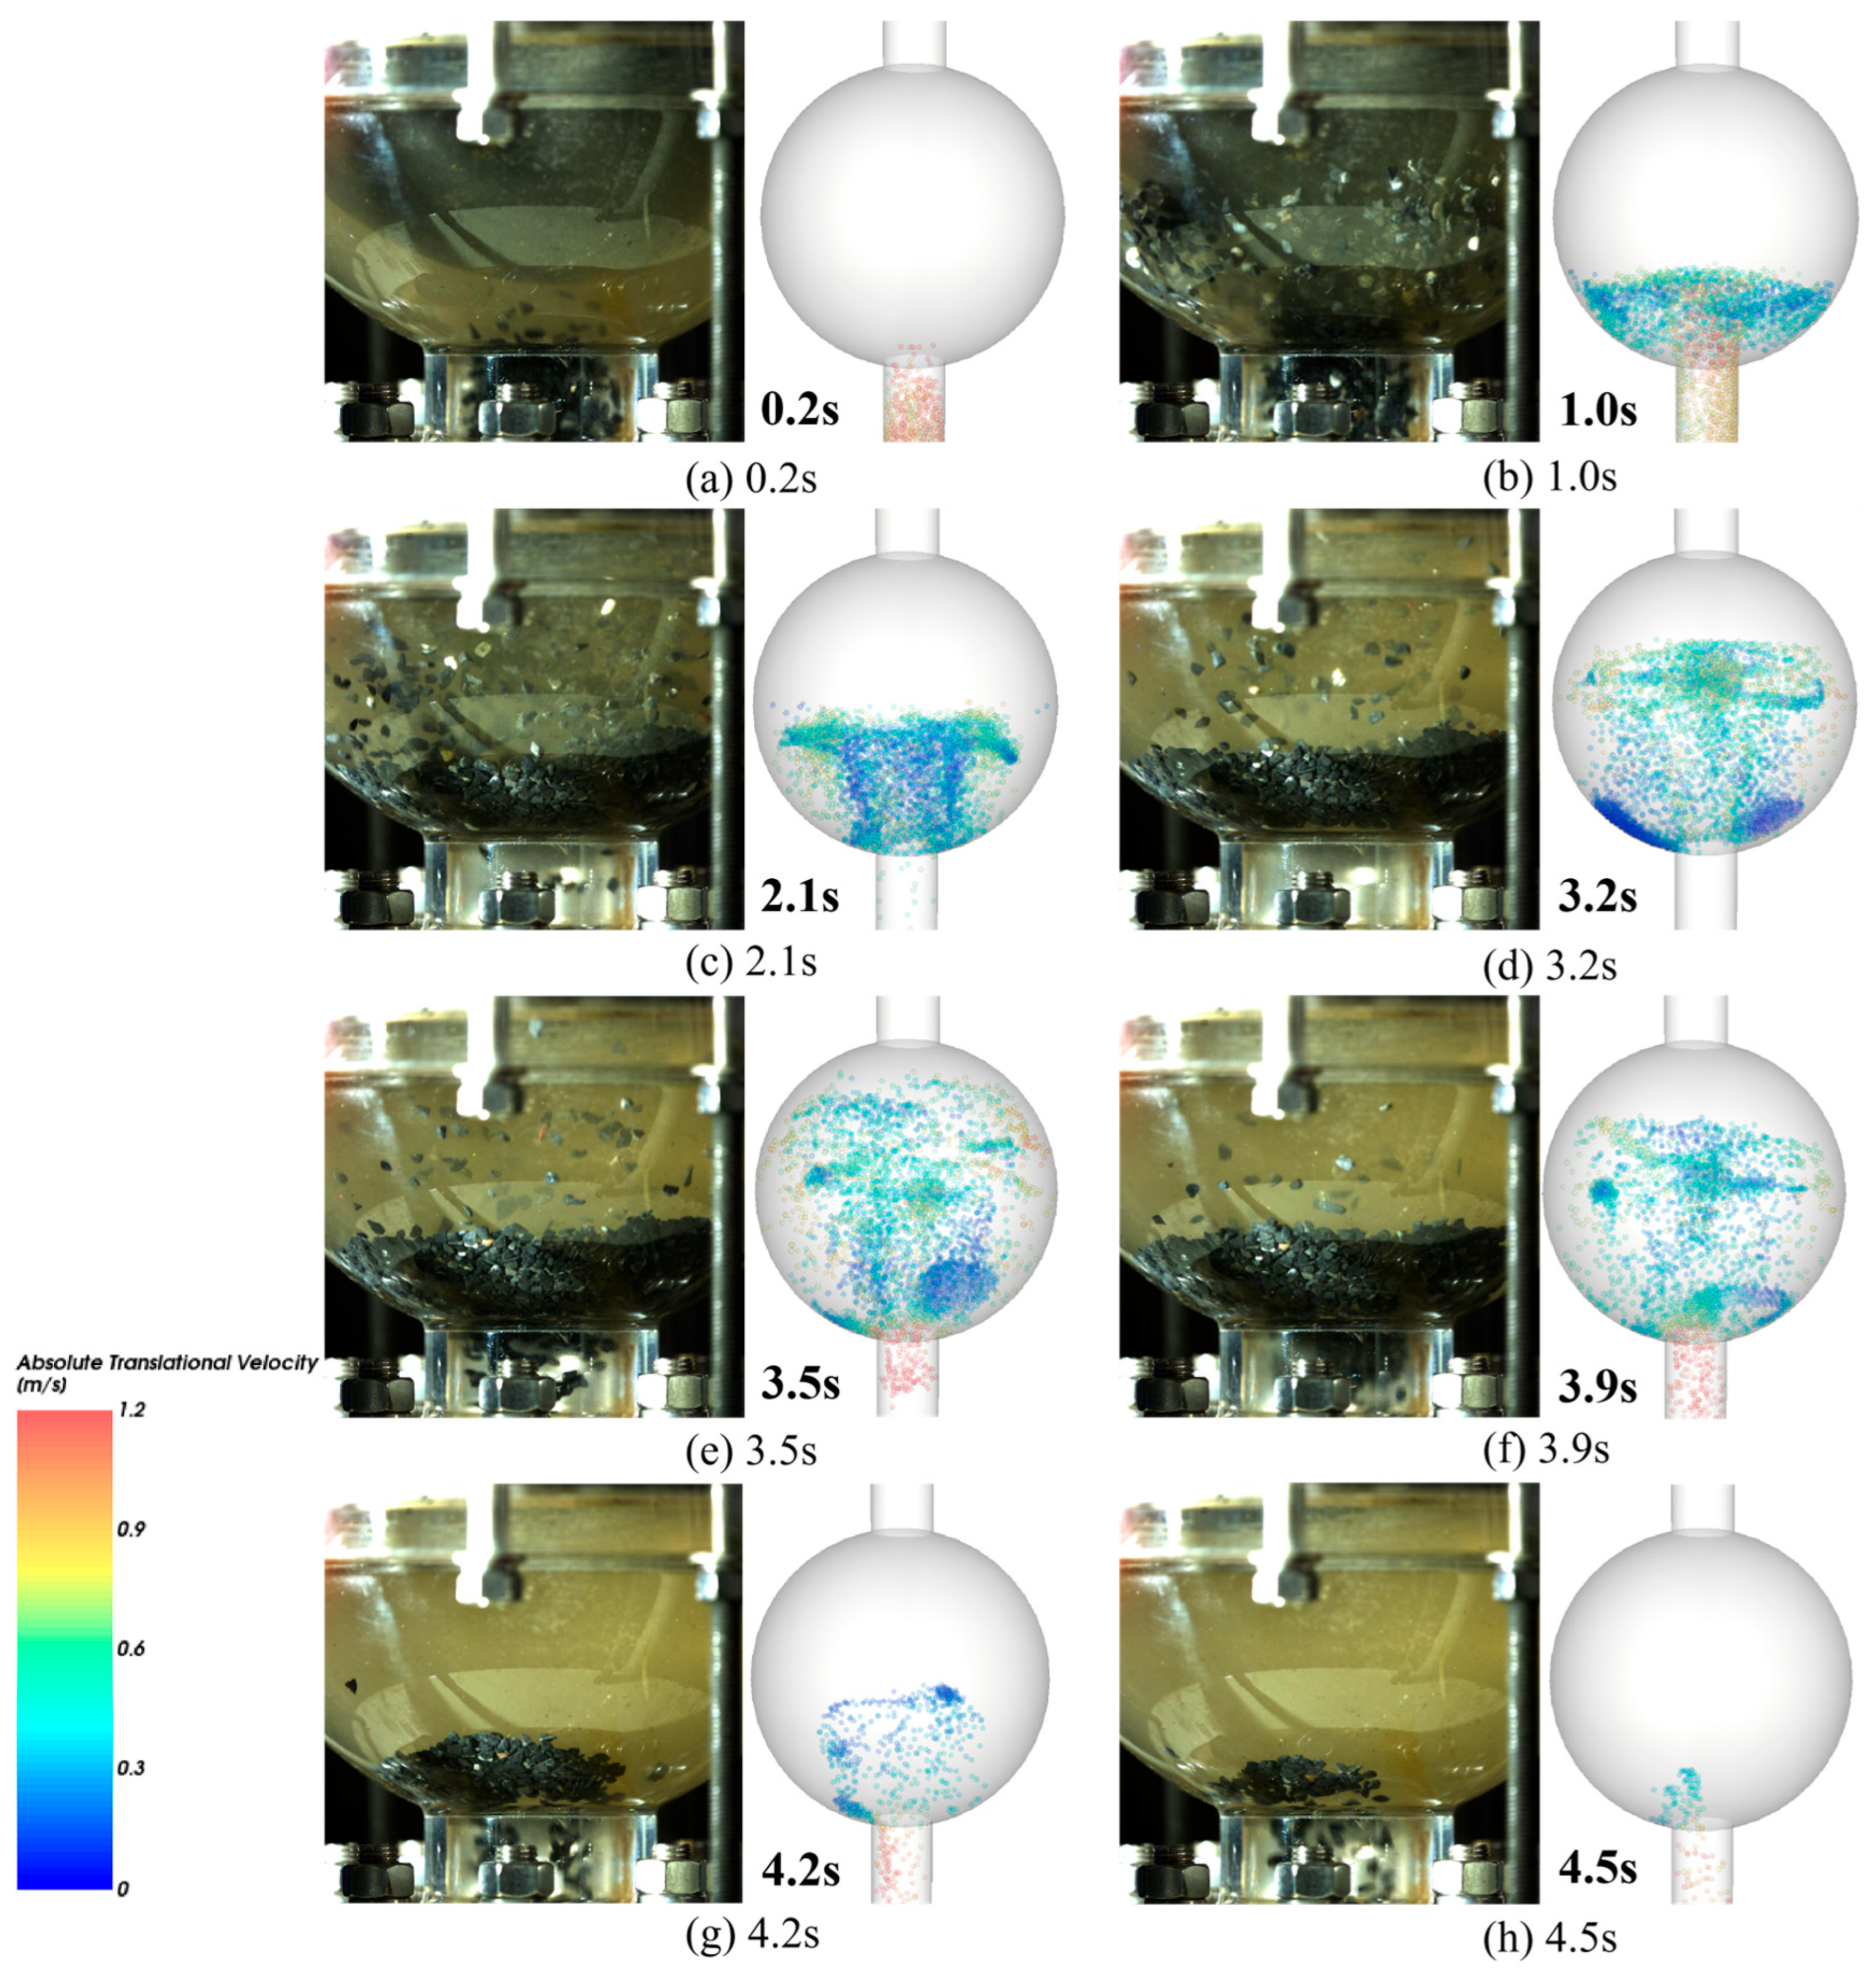
Figure 5 presents a comparison of particle distribution during a full pump cycle (6.6 s), as observed in both the simulation and the experiment. Panels (a)–(d) illustrate the particle distribution during the inflow stage at 0.2 s, 1.0 s, 2.1 s, and 3.2 s, respectively; panels (e)–(h) correspond to the outflow stage at 3.5 s, 3.9 s, 4.2 s, and 4.5 s. It should be noted that when the diaphragm moves into the upper pump chamber, particles within this region become visually obscured. Consequently, experimental imaging was deliberately limited to the lower pump chamber section. Analysis of high-speed CCD camera images shows that during the inflow phase, particles entered the pump chamber, decelerated rapidly, and dispersed radially. In the outflow phase, particles converged towards the outlet at the base of the pump and were discharged. Within 1.6 s (the first half of the outflow phase), particles were almost completely cleared from the pump chamber. During the late intake phase and early discharge phase, particles in the simulation exhibited greater dispersion and slower settling to the pump chamber base, potentially related to the particle shape settings in the model. Overall, however, the particle flow patterns and distribution trends observed in the simulation closely match those of the experiment, reflecting the fundamental transport behavior across the pump cycle. These results also verify the reliability of the CFD–DEM modelling approach adopted in this study. It should be further explained that in previous studies, we conducted clear water transportation tests using the test system shown in Figure 3. We also established a CFD model for the clear water transportation process and conducted simulations by adopting a method similar to that in this paper. Both the simulation-calculated and experimentally measured flow rate and pressure input–output characteristic curves showed a high degree of consistency. The relevant results have been presented and explained in Reference [12], which can also demonstrate the feasibility of the simulation model and method adopted in this study.
(3)
CFD–DEM Simulation of Slurry Transport by Seabed Diaphragm Pumps under Commercial Mining Conditions
Using the CFD–DEM approach described above, a simulation analysis was conducted to evaluate the performance of seabed diaphragm pumps in transporting polymetallic nodule slurry under commercial mining conditions, with a target production capacity of 360 t/h.
In SpaceClaim 2024 R1, a structured mesh was generated for both the diaphragm pump domain and the pipeline domain. The spherical diaphragm pump had a diameter of 1000 mm, while the transport pipeline had a diameter of 150 mm and a length of 500 mm. Based on Equation (3), under the operating condition with a particle concentration of 15%, the Reynolds number at the bottom pipeline of the diaphragm pump is calculated to be approximately 6.7 × 10 5 . Meanwhile, under the operating conditions with particle concentrations of 10% and 13%, the Reynolds number is even higher. In Fluent 2024 R1, the flow field was configured using the RNG k-ε turbulence model, with standard wall functions applied. Seawater was defined as the working fluid, with a density of 1.03 g/cm3 and a dynamic viscosity of 1.08 mPa·s. All particles were assumed to be spherical, with a diameter of 10 mm. The spherical pump casing and pipelines were made of duplex stainless steel (density: 7850 kg/m3, Poisson’s ratio: 0.33), while the diaphragm was made of nitrile rubber (density: 950 kg/m3, Poisson’s ratio: 0.45). The adhesive force was modelled using the JKR model [20]. Drag forces were calculated using the Huilin–Gidaspow model [21], while lift forces were computed based on the Saffman model [22].
Simulations were conducted for slurry concentrations of 10%, 13%, and 15%. To maintain the required system throughput, the diaphragm pump’s operating cycle was adjusted accordingly: 8 s for the 10% concentration case, 10.8 s for 13%, and 12.4 s for 15%. In each case, the first half of the cycle was designated for slurry intake, while the second half was allocated to slurry discharge.
Figure 6 illustrates the variation in particle concentration within the diaphragm pump chamber and transport pipeline under different slurry concentrations.
The concentration profiles across different slurry concentrations exhibit broadly similar trends. During the intake phase, the particle concentration within the pump chamber increases linearly, reaching the target concentration by the end of the phase, indicating effective particle entry into the chamber. At the beginning of the discharge phase, particles previously settled at the chamber base, along with those in the inlet pipe yet to enter the chamber, are rapidly expelled. This results in a sharp rise in particle concentration within the pipeline, forming the first peak, followed by a rapid decline. As the particle velocity in the chamber decreases and a large volume of particles are carried by the fluid towards the outlet, the pipeline concentration rises again, forming a second peak, as the remaining particles are discharged. In all concentration scenarios, the majority of particle discharge is completed within the first half of the outflow phase.

3.3. Design of a Diaphragm Pump Group Configuration for Slurry Transport in a Commercial Wastewater-Driven Mining System

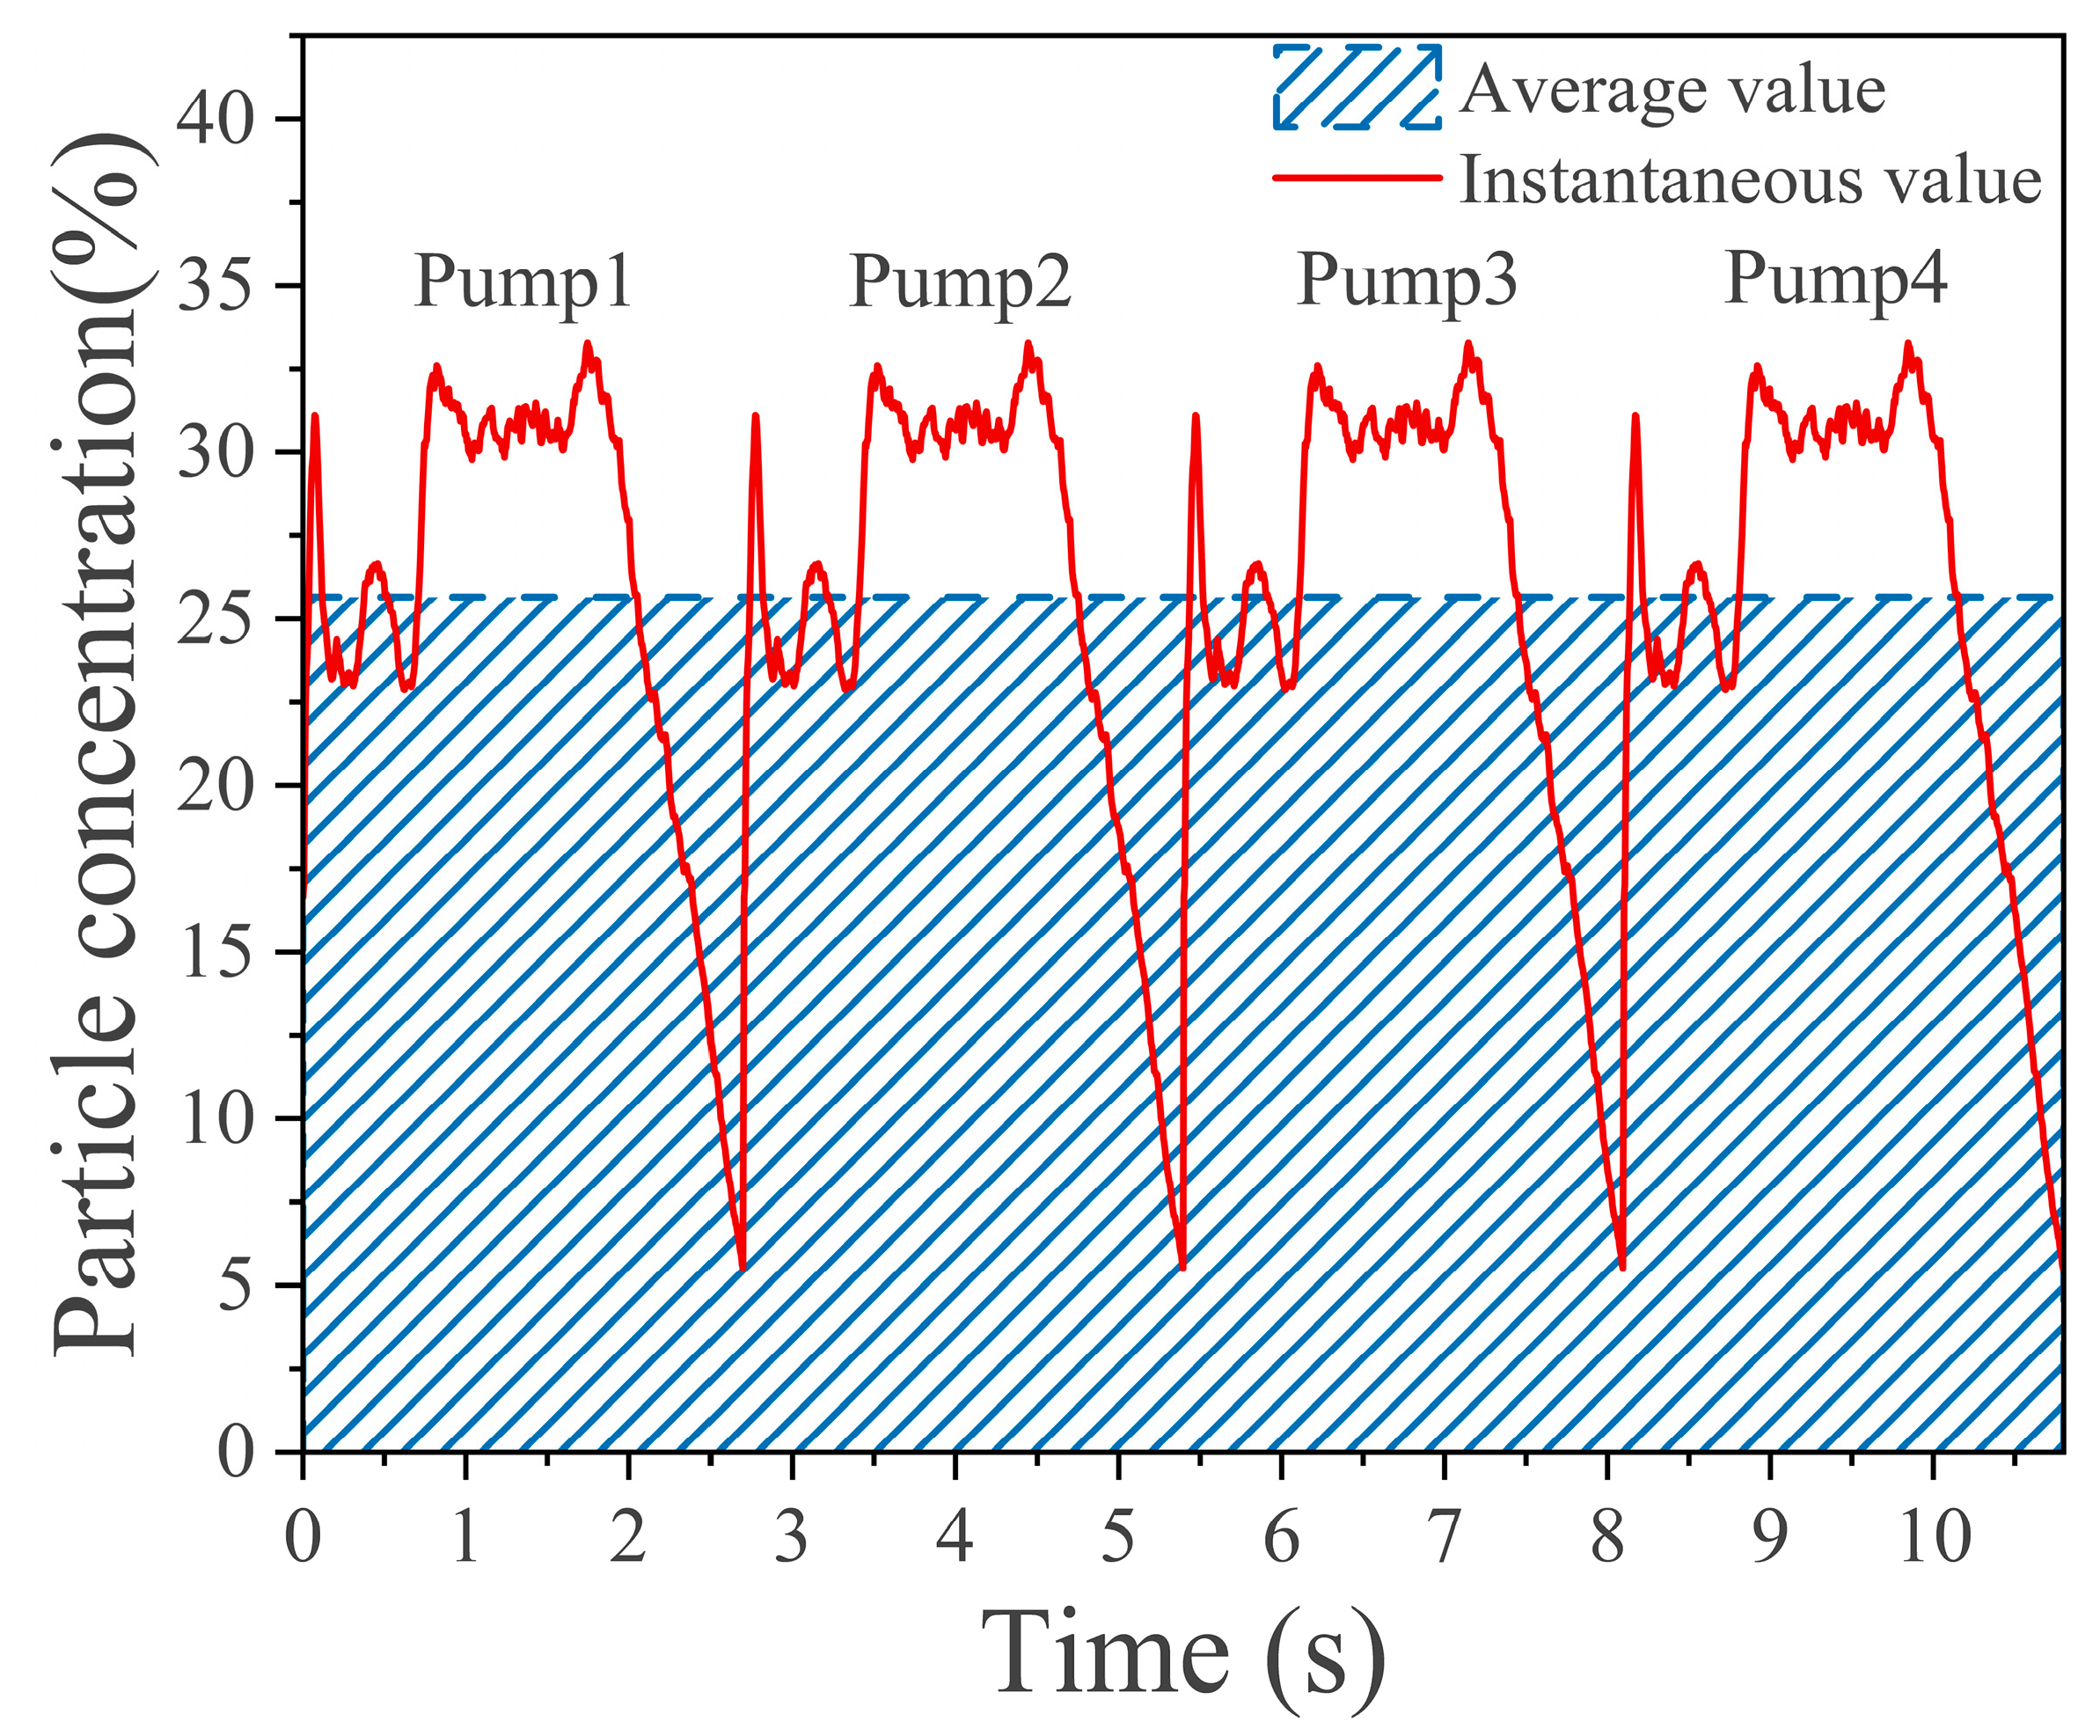
The diaphragm pump is a reciprocating type of pump that typically operates in two phases within a cycle—slurry intake during one half and discharge during the other. To ensure continuous transport, systems generally employ two or more diaphragm pumps in parallel. However, for the water-driven diaphragm pump applied to polymetallic nodule slurry transport in this study, both experimental and simulation results indicate that across a range of concentrations from 2% to 15%, the nodules are almost entirely discharged within the first half of the outflow phase. This implies that during a complete cycle, only one-quarter of the period effectively delivers nodule-laden slurry. To achieve continuous nodule output under these conditions, a group of four diaphragm pumps can be arranged to operate sequentially with a quarter-cycle phase shift, as illustrated in Figure 7 (corresponding to the scenario with a 13% volumetric concentration). At any given moment, two pumps are in the intake phase and two are in the discharge phase. Among the two pumps discharging, only one is delivering slurry with a mean particle concentration of 25.7%, while the other, having completed its particle discharge, is now transporting particle-free fluid. The mixture of outputs from both pumps yields an average concentration of approximately 12.85%, closely matching the input slurry concentration.
For commercial mining operations, ensuring system throughput is a key performance metric. As calculated in Section 2.2, to meet the production requirement of 360   t / h of nodules at a slurry concentration of 10%, the seabed diaphragm pump group must comprise eight pumps, each with a diameter of 1 metre. While it is theoretically possible to meet the slurry transport and production requirements using only four pumps by increasing the volume of each diaphragm chamber, this presents significant engineering challenges. In subsea applications, oversized pump bodies, pipelines, and valves can introduce serious operational and logistical complications. Therefore, configuring the system as two sets of four diaphragm pumps—forming a combined group of eight—is a more technically feasible and balanced engineering approach.
An additional advantage of configuring the seabed diaphragm pump group as two separate sets is the potential to reduce fluctuations in the slurry output concentration through staggered operation. As shown in Figure 7, although the nodules are almost completely discharged during the first half of the outflow phase, the concentration of discharged particles is not uniform, ranging from approximately 5% to 33%. Taking the case of a 13% transport concentration as an example, Figure 6b shows that after an initial sharp peak, the slurry concentration can be approximated as a stepped waveform formed by two square pulses, which then declines rapidly. By operating the two pump sets with an appropriate phase offset, their respective output concentration curves can complement each other—peaks in one coinciding with troughs in the other—thereby enhancing the overall concentration stability of the seabed diaphragm pump group.
In Figure 8, Curves 2 and 3 represent the output concentration profiles of two four-pump sets, operating with a 1 s phase offset. Curve 1 shows the combined output concentration of the entire seabed diaphragm pump group. As shown, each individual four-pump set exhibits output concentration fluctuations ranging from approximately 5% to 33%, with only 33.5% of the cycle duration maintaining a slurry concentration within the desirable range of 22% to 30%. In contrast, the combined output from the staggered operation of both pump sets demonstrates a narrower fluctuation range—from 18% to 32%—with 66.5% of the cycle duration maintaining the concentration within the 22% to 30% range. This clearly indicates that phase-shifted operation enables complementary peaks and troughs between the two sets, significantly improving the overall stability of the output slurry concentration from the seabed diaphragm pump group.
Based on the above considerations, a water-driven diaphragm pump group scheme for slurry transport is proposed, as illustrated in Figure 9. In this configuration, V w i 1 and V w o 1 denote Wastewater Inlet Valve 1 and Wastewater Outlet Valve 1, respectively; V s i 1 and V s o 1 denote Slurry Inlet Valve 1 and Slurry Outlet Valve 1, respectively.

3.4. Structural Design of the Centralized Slurry Output Device for the Diaphragm Pump Group

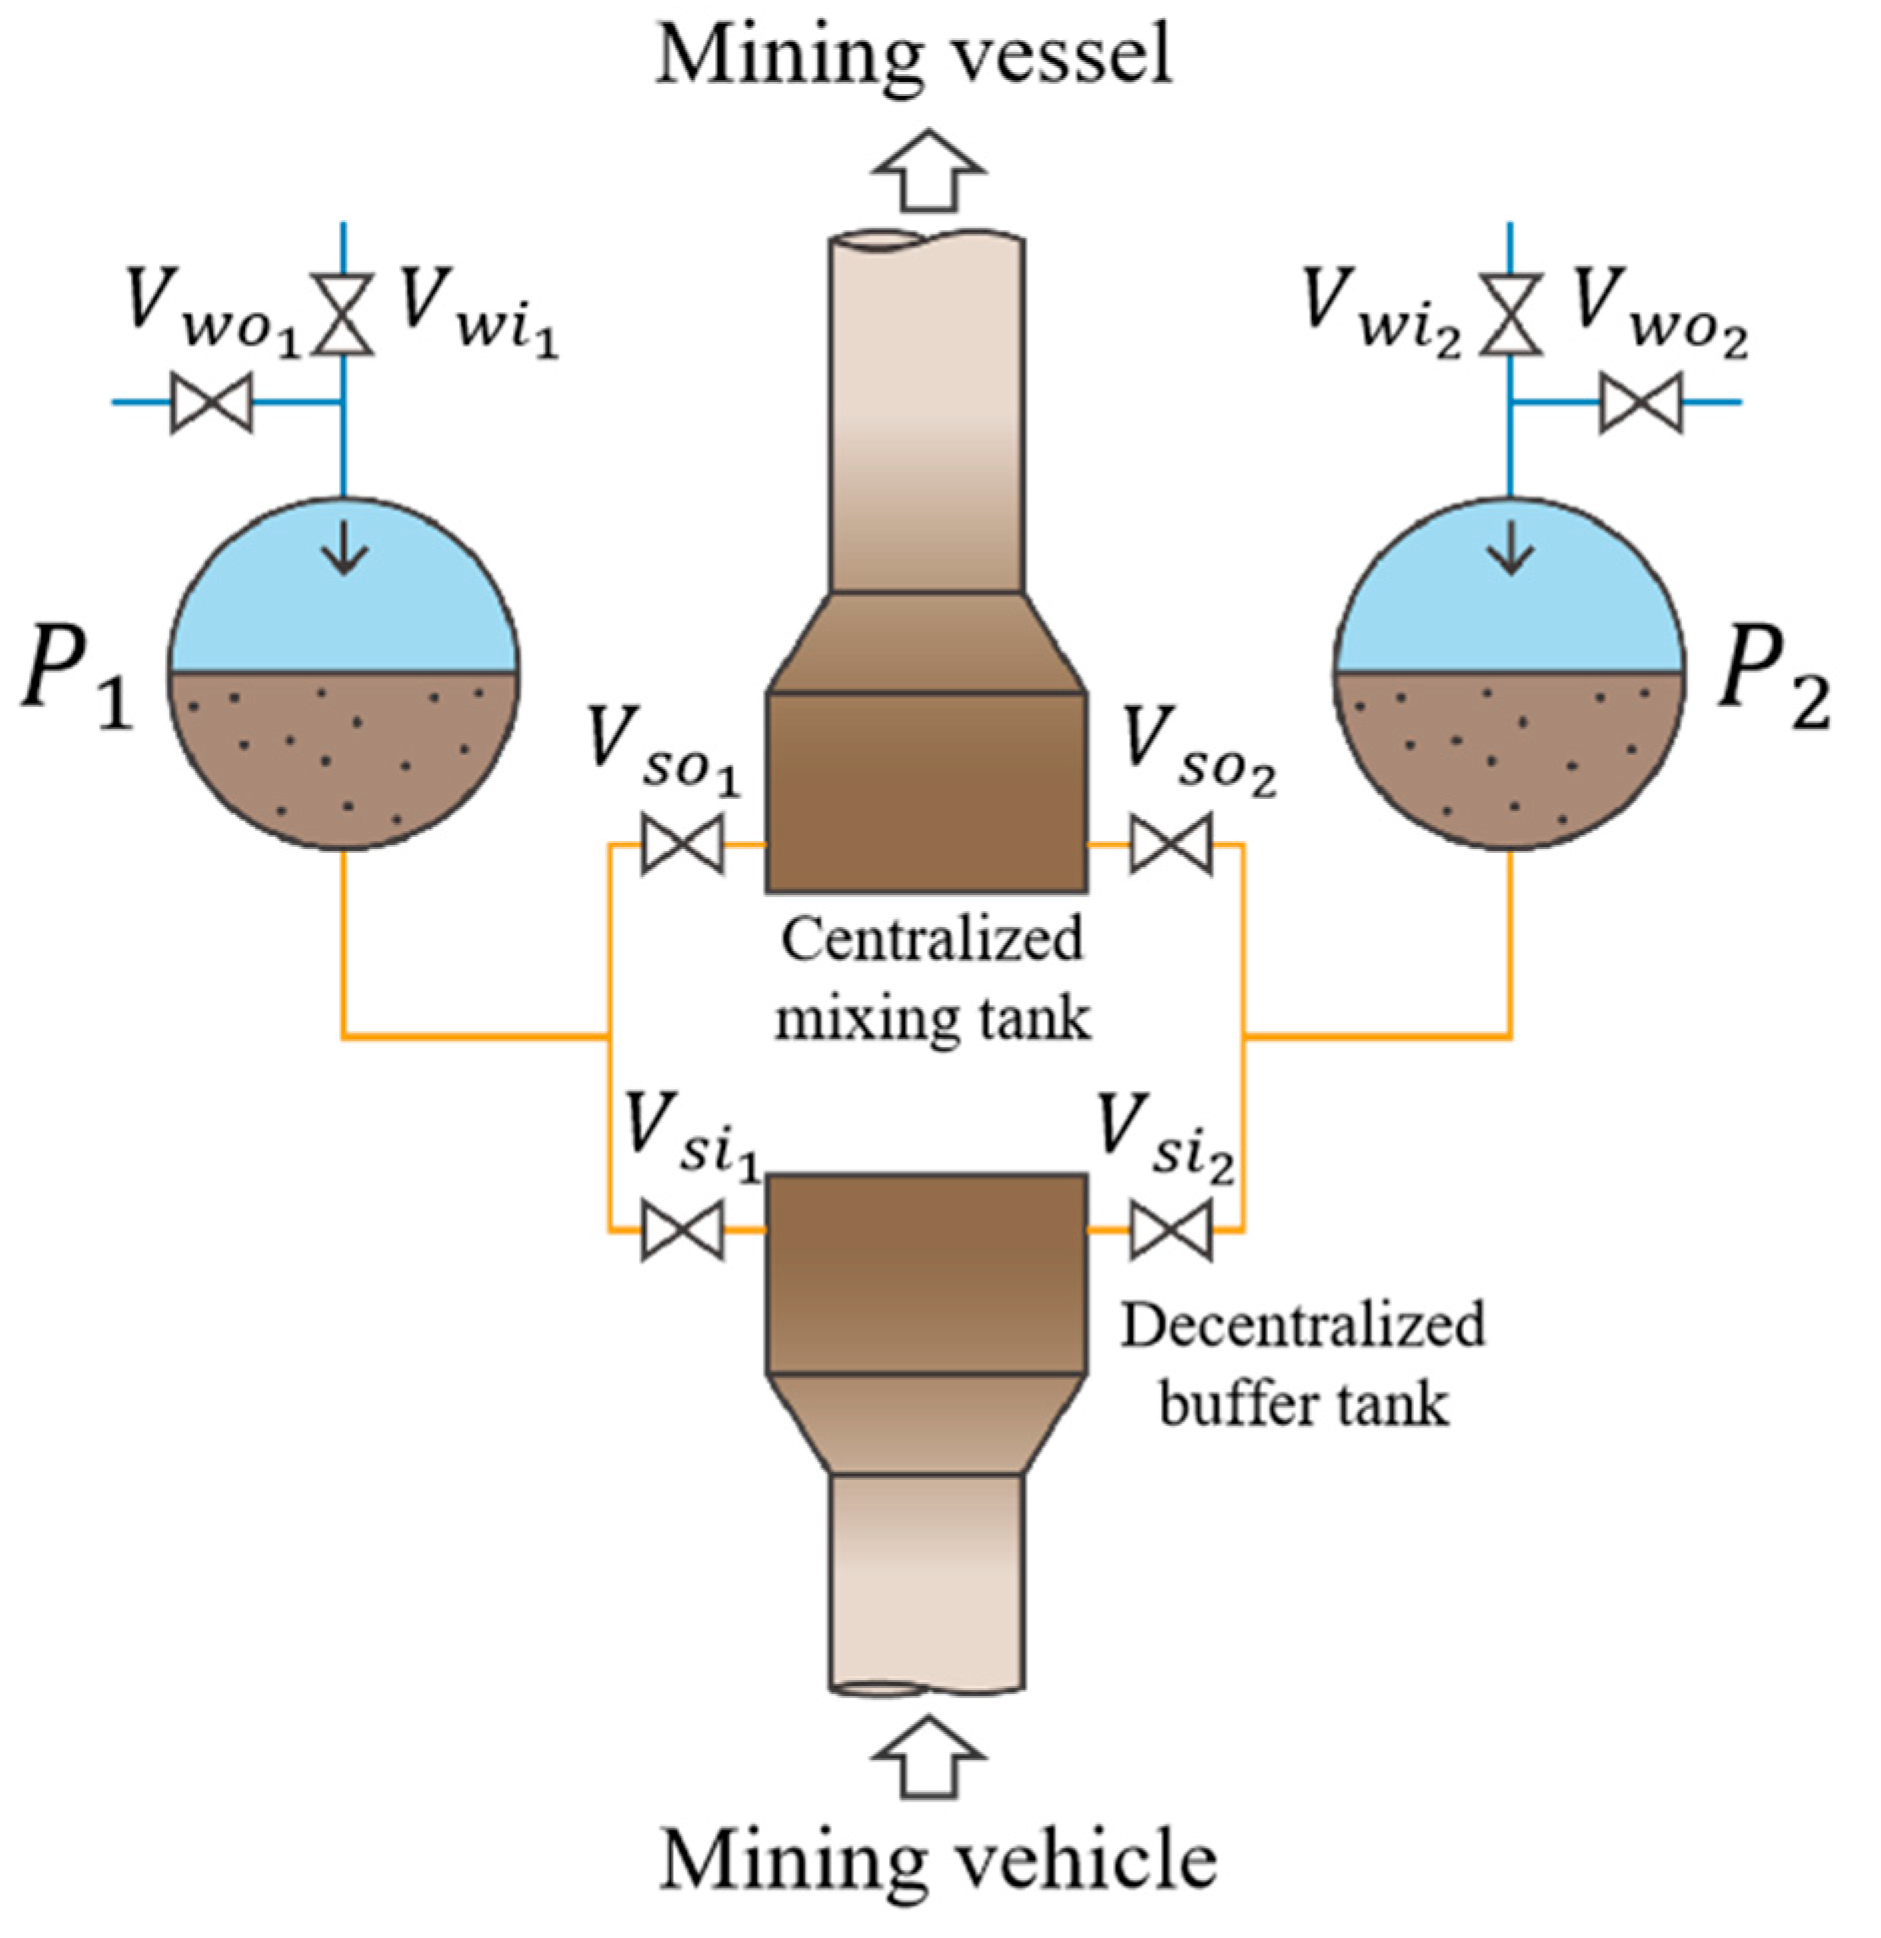
To channel the output slurry from the eight diaphragm pumps of the seabed pump group into the system’s riser pipeline for upward transport, a centralized mixing tank is required as the pump group’s slurry output convergence device. Similarly, a decentralized buffer tank is also required between the mineral transport hose from the mining collector and the diaphragm pump group, as illustrated in Figure 10. In this configuration, P 1 and P 2 represent the first diaphragm pump in each of the two pump sets. The two pumps are symmetrically arranged around the centralised mixing tank, delivering slurry from opposite directions to enhance mixing uniformity within the tank. At this moment, the states of the eight control valves are as follows: V w i 1 , V w i 2 , V s o 1 , and V s o 2 are open, while V w o 1 , V w o 2 , V s i 1 , and V s i 2 are closed. The positive displacement pumps aboard the mining vessel deliver wastewater to the upper chambers of the diaphragm pumps, driving the diaphragms downward to discharge slurry into the riser pipeline.
In the design of the centralized mixing tank, the length and arrangement of bottom pipelines significantly impact slurry transport performance. For alternative design schemes, 3D models of the centralized tank were constructed and meshed, with coarse-particle solid–liquid two-phase flow numerically simulated using the Fluent–Rocky platform to evaluate transport performance across configurations. Results indicated that the pipeline length between the diaphragm pump outlet control valves and the mixing tank should be minimized; otherwise, the rapid discharge of residual nodules in the pipelines upon valve opening would cause significant fluctuations in the pump group’s output concentration. Simulations showed that increasing the pipeline length between the control valve and the mixing tank from 50 mm to 200 mm results in a 39% increase in the standard deviation of nodule concentration at the mixing tank outlet. Furthermore, the simulations indicated that arranging the eight pipelines in two vertical layers (four per layer) hinders effective mixing in the tank, leading to a 102% increase in the standard deviation of nodule concentration at the riser outlet, compared with a single-layer configuration.
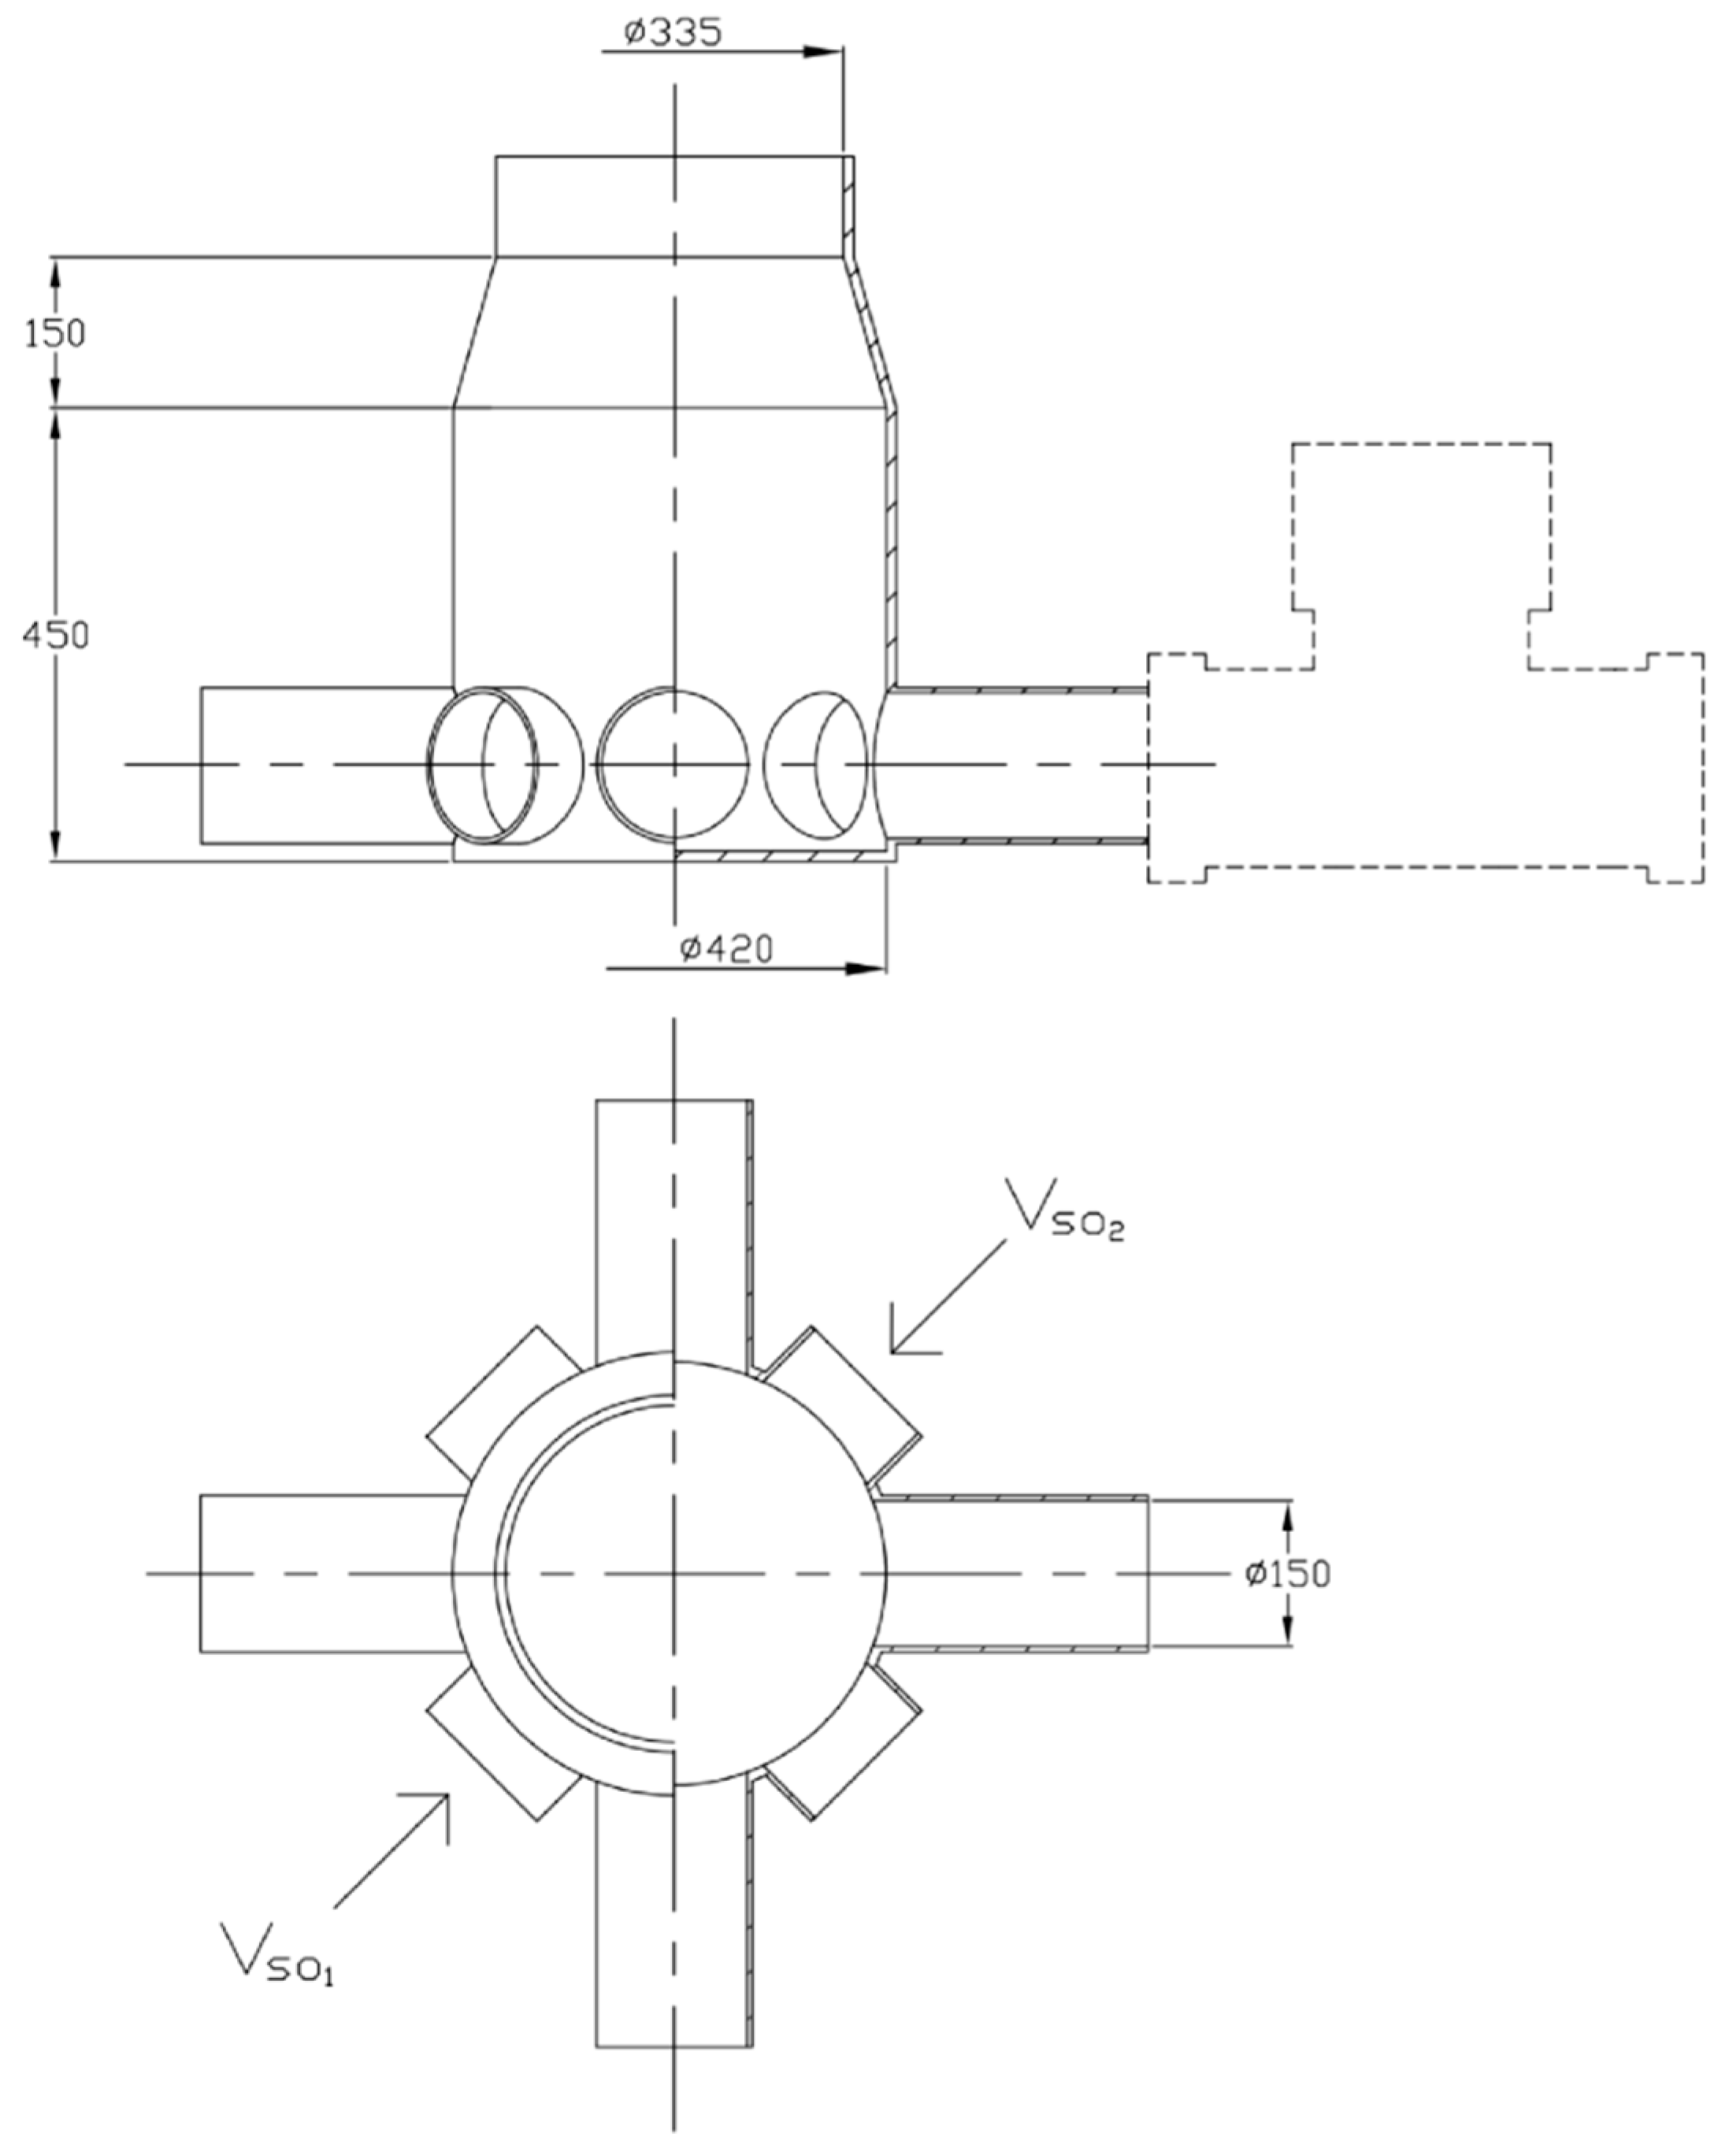
Based on these findings, the mixing tank was designed as a cylindrical vessel with a diameter of 420 mm and height of 450 mm, connected at the top via a conical pipe to the main riser (with an internal diameter of 335 mm in this case), as illustrated in Figure 11. The eight slurry outlet pipes from the diaphragm pumps are connected at the same horizontal level to the base of the cylindrical tank. To accommodate the minimum installation dimensions of the control valves (indicated by dashed boxes in Figure 11, the pipe lengths between the valves and the tank are arranged in an alternating long–short pattern, as shown in Figure 11. Here, V s o 1 and V s o 2 represent the slurry outlet valves of Pump 2 in each pump group, delivering flow from opposite directions for improved mixing.

3.5. Analysis of Slurry Output Concentration for the Diaphragm Pump Group, Centralised Tank, and Adjacent Riser Pipeline Section

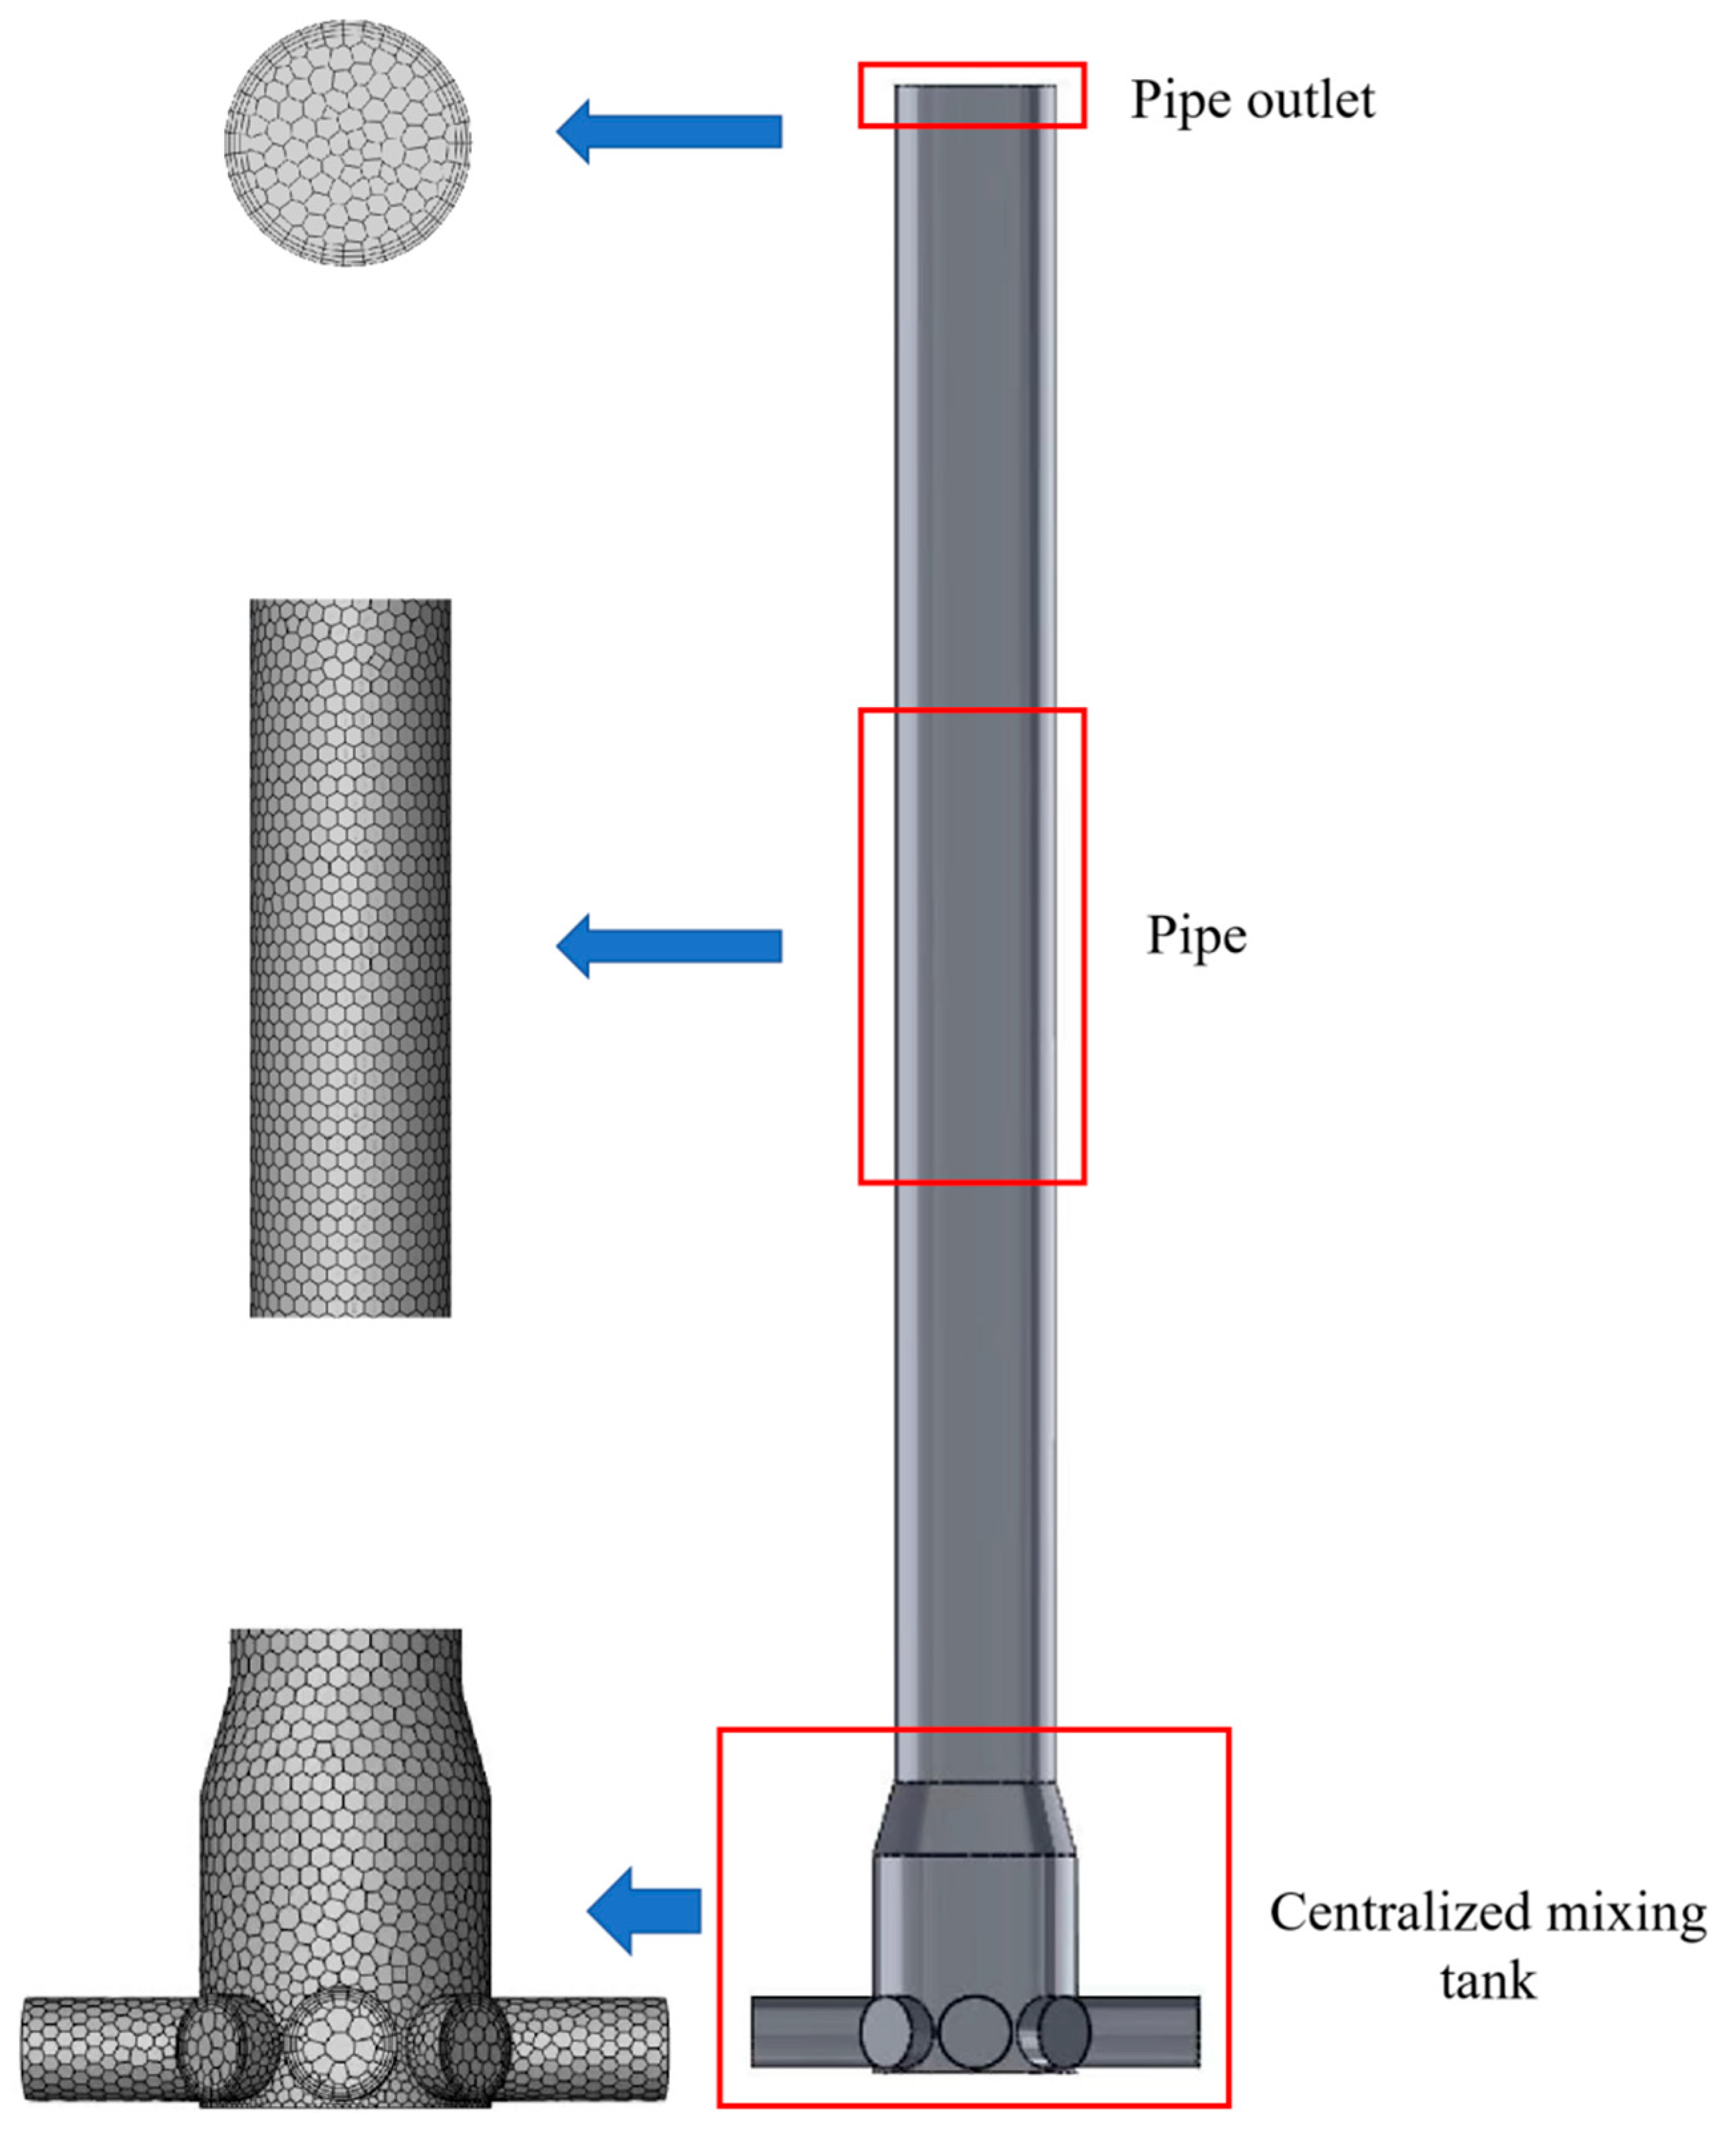
Based on the design of the centralized mixing tank, a numerical model was established to analyze the solid–liquid two-phase flow characteristics in the riser pipeline connected to the diaphragm pump group. The slurry inlet and outlet pipes from the diaphragm pump were set to 150 mm in diameter, while the riser pipeline was 335 mm in diameter and 3500 mm in length. The connection point between the mixing tank and the riser pipeline was positioned at a height of 150 mm. Using these parameters, four mesh refinement schemes were developed. The specific attributes of each grid are presented in Table 1. Following comparisons of computational error, convergence behavior, and simulation time, the mesh configuration using 57,219 cells was selected. The key attributes of this mesh are summarized in Table 2. This mesh choice satisfied accuracy requirements while significantly reducing computational time. The geometry of the diaphragm pump group and its associated riser pipeline model is depicted in Figure 12.
A numerical simulation of solid–liquid two-phase slurry transport in the diaphragm pump group riser pipeline was conducted using the Fluent–Rocky coupled simulation platform. The computational methods and parameters were largely consistent with those employed in the diaphragm pump two-phase flow simulations. The boundary condition at the bottom pipeline inlet was set as a velocity inlet, while the boundary condition at the top coarse-pipe outlet was configured as a pressure outlet.
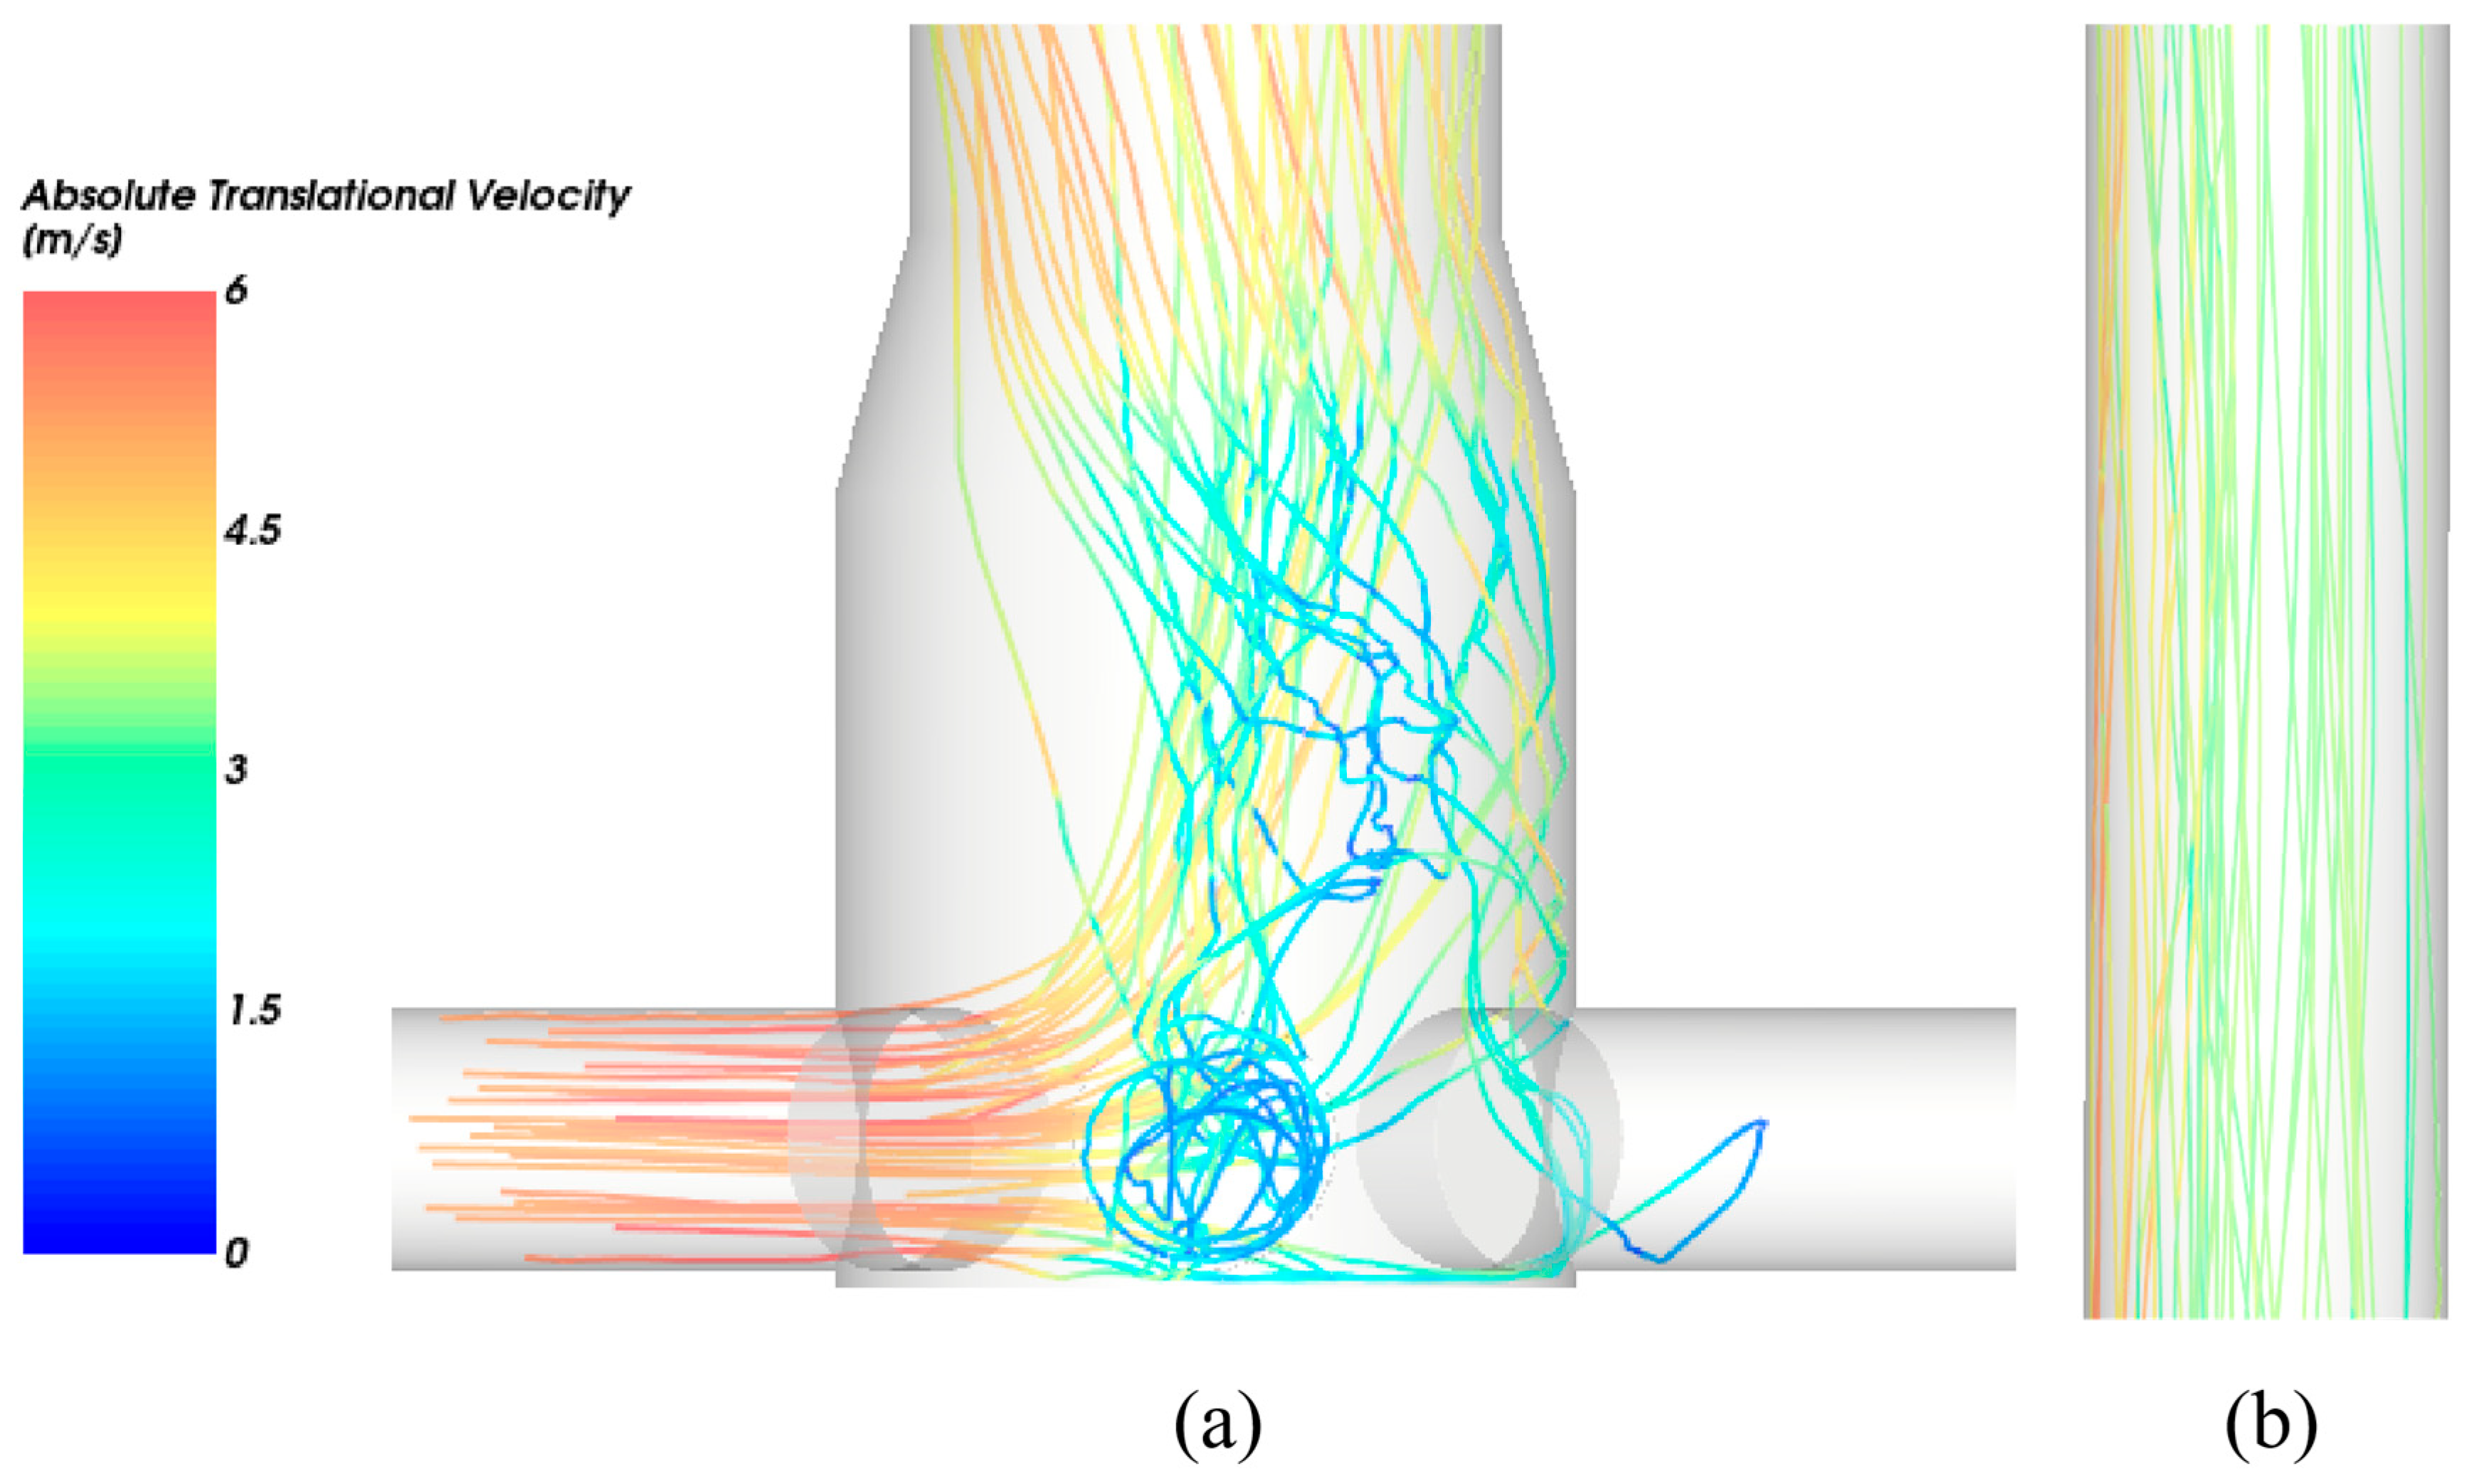
Figure 13 illustrates the particle trajectory lines within the diaphragm pump group system. A total of 50 particles were selected from an initial batch of 300 particles within the pipeline at the first time step (0.005 s), sampled at intervals of every six particles. The simulation results show that particles enter the centralized mixing tank at high velocity from the bottom pipelines. Upon convergence at the tank center, their velocity decreases sharply, and the particles disperse outward. Subsequently, most of the particles are carried out of the tank by fluid flow, while a small portion remains in the inlet pipelines that were inactive during this cycle. Once entering the riser pipeline, particles in the central region primarily move upward along the axis in a straight trajectory, whereas those near the pipe wall exhibit a helical motion pattern, gradually transitioning toward linear motion as they ascend.
Figure 14 presents the variation curves of local particle concentration and average particle velocity along the vertical height of the simulation domain. It can be observed that as the axial position increases, the particle velocity gradually rises and stabilizes at approximately 4.05 m/s, while the particle concentration monotonically decreases and stabilizes at around 13.93% near the outlet.
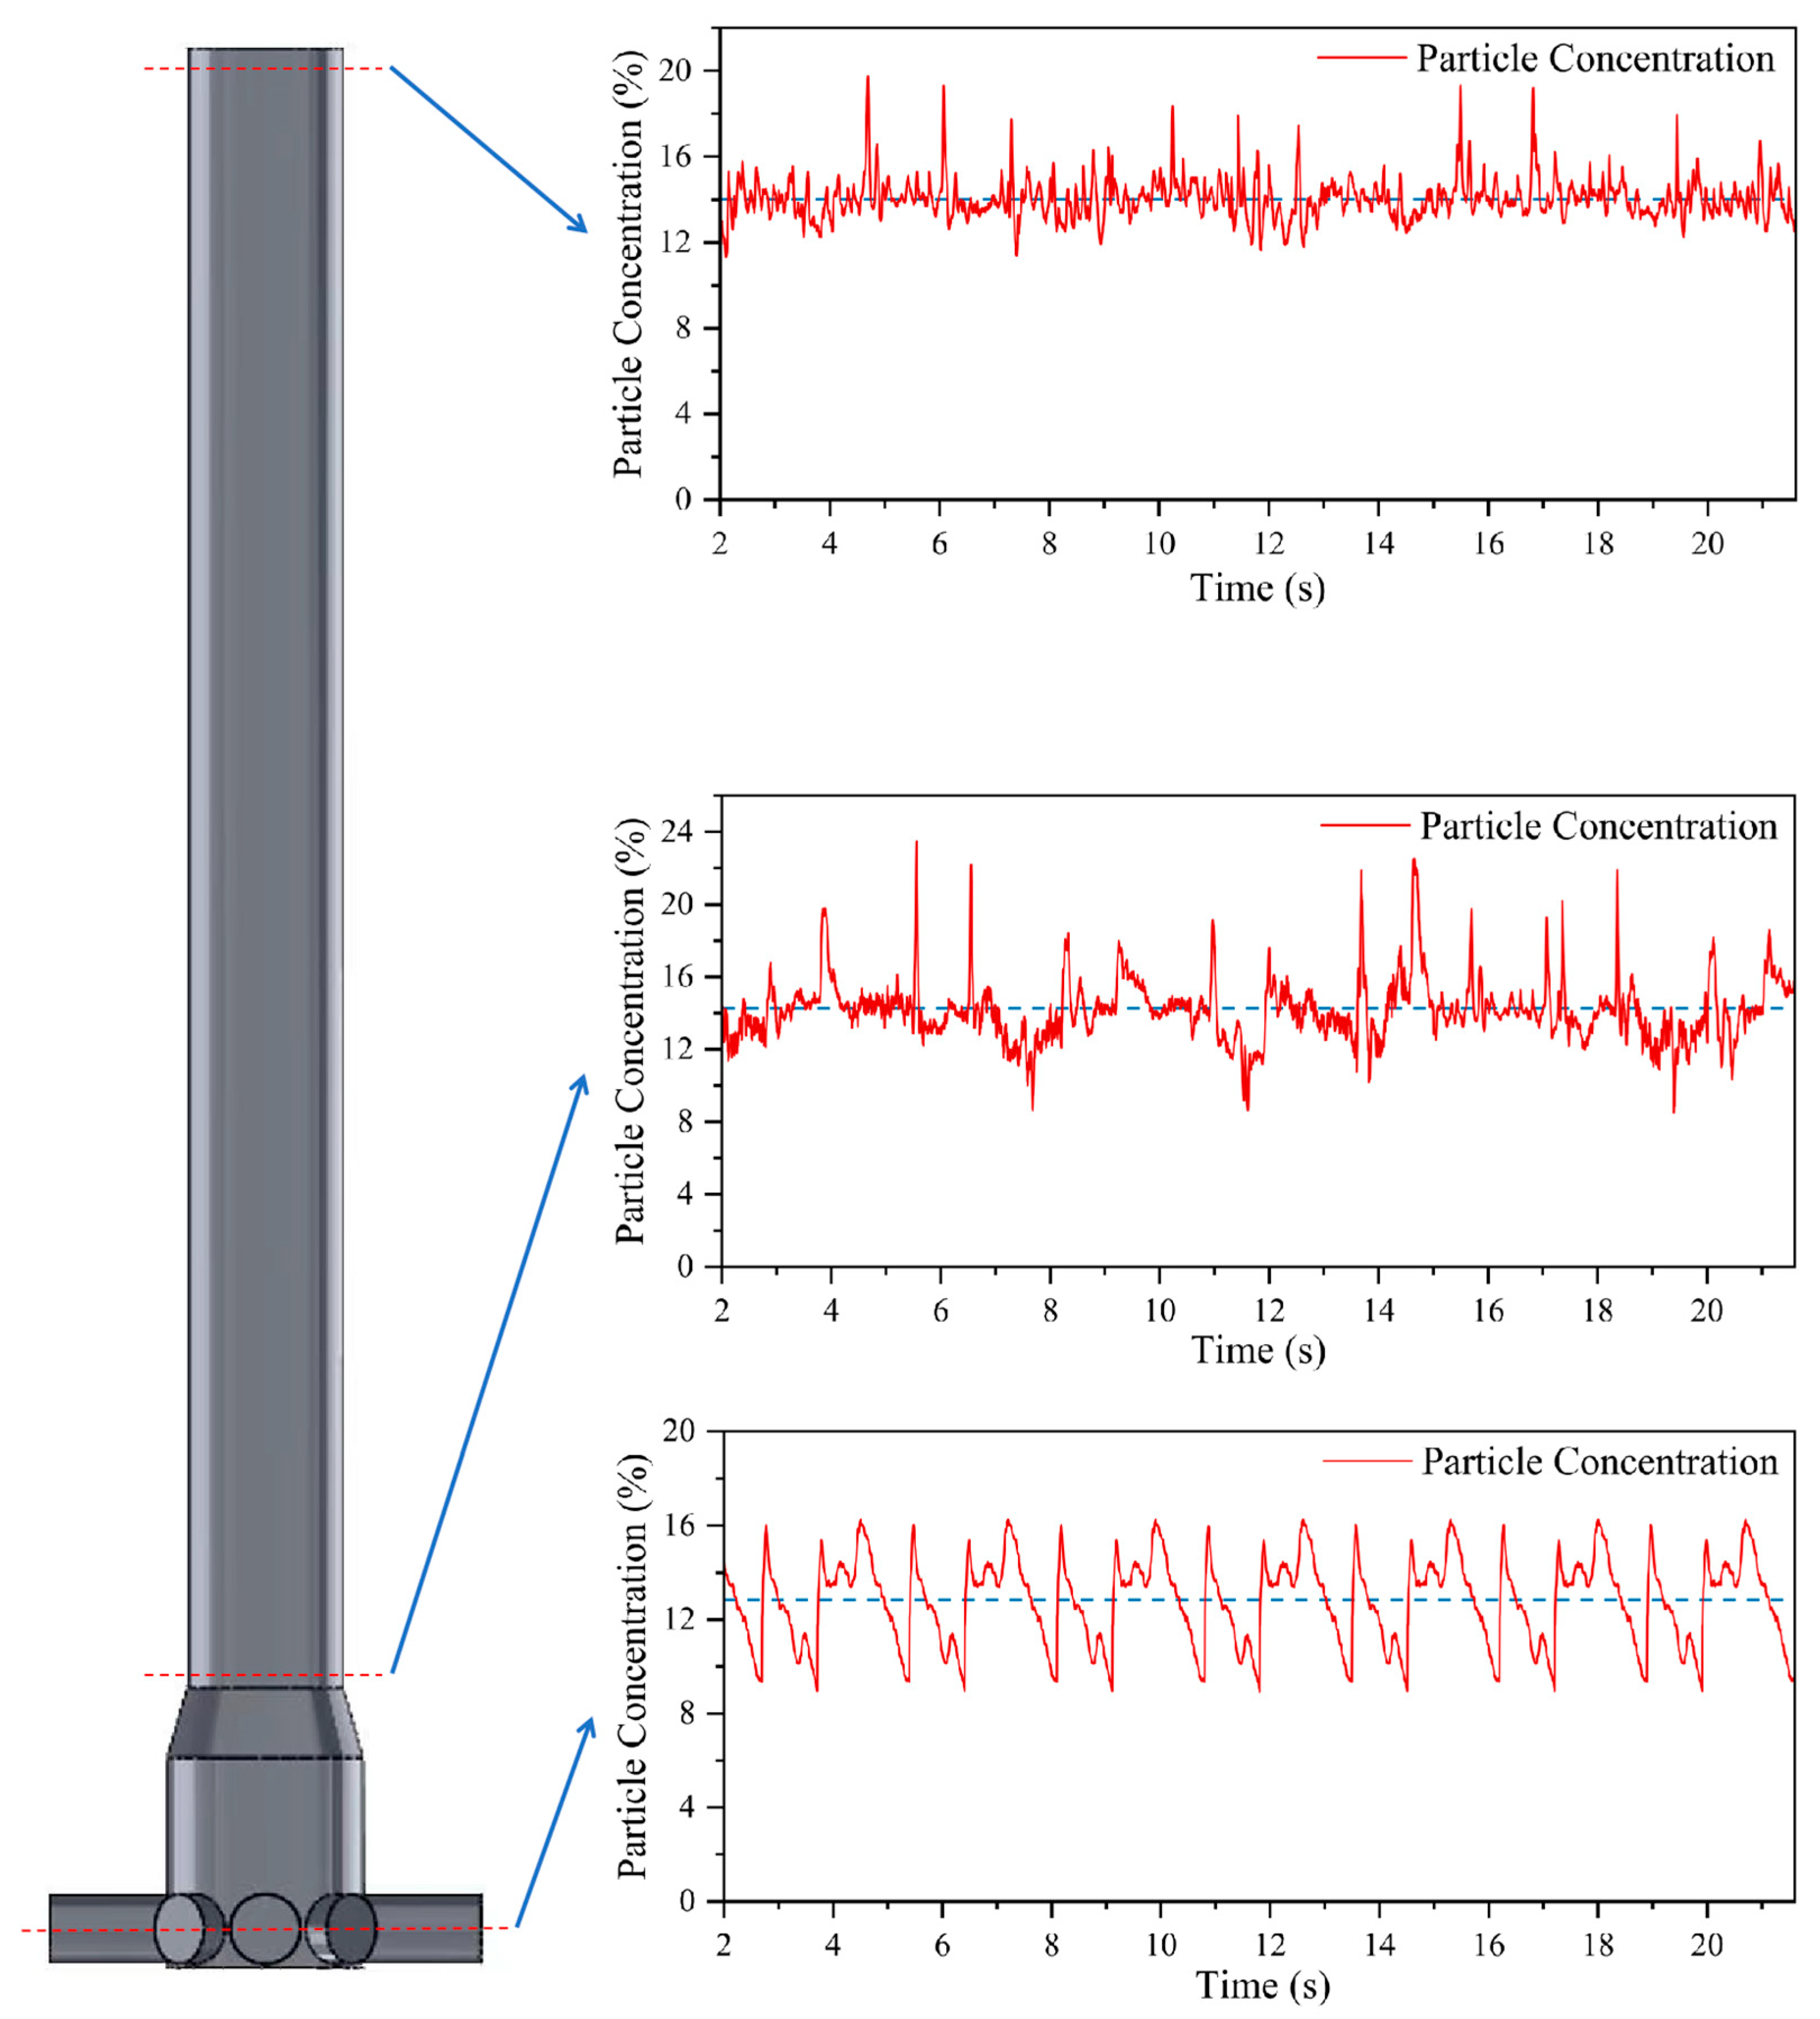
Figure 15 illustrates the slurry concentration variation curves at the outlet of the seabed diaphragm pump group, the outlet of the centralized mixing tank, and the outlet of the simulated riser pipeline segment (3.5 m). Statistical analysis of the time proportion during which the slurry concentration remains within ±1% of the mean value reveals that the slurry concentration maintains this range for 38.4% of the operating time at the pump group outlet, 57.8% at the mixing tank outlet, and 79.2% at the riser outlet. These results indicate that, through multipump combination and staggered operation, optimized mixing tank design, and natural homogenization in the riser pipeline, the slurry concentration stabilizes within a few meters of entering the pipeline, ensuring steady slurry transport throughout the system.

4. Coupled Slurry Transport and Wastewater Discharge System: Coordination of Transport Parameters and Efficiency Analysis

4.1. Analysis of Hydraulic Parameter Coordination in the Coupled Slurry Transport and Wastewater Discharge System

As shown in Figure 1, the slurry delivered to the mining vessel undergoes dewatering, after which the solid particles, such as nodules, are directed to storage silos. Consequently, the volume of wastewater returned to the seabed is necessarily less than the slurry volume pumped to the vessel by the centrifugal pumps. However, according to the working principle of the dual-side fluid-driven diaphragm pump, the slurry flow rate delivered by the diaphragm pump group must be equal to the flow rate of the wastewater driving it. In its polymetallic sulfide mining system design, Nautilus Minerals addressed this mismatch by installing dedicated pumps on the mining vessel to supply additional water as makeup flow [23]. Nevertheless, compared to using wastewater—already destined for discharge at the seabed—as the driving medium, extracting seawater from the sea surface and pumping it to the seabed incurs additional energy consumption.
On the other hand, as previously noted, pipeline transport of polymetallic nodules achieves maximum efficiency at a slurry concentration of around 15%. Yet to prevent clogging within the pump, slurry concentrations for centrifugal pump transport are typically set between 10% and 12% [24]. As a positive displacement pump, the diaphragm pump generally performs better at higher slurry concentrations. In the context of this study, both experimental and simulation results demonstrate that even at concentrations as high as 15%, nodule particles can be completely discharged within the first half of the output cycle.
Therefore, for the system shown in Figure 1, it is feasible to leverage the contrasting characteristics of diaphragm and centrifugal pumps by adopting different slurry concentrations at different stages: the seabed diaphragm pump group transports slurry at higher concentrations and is driven solely by wastewater intended for seabed discharge, whereas the upper centrifugal pumps operate at lower concentrations by naturally receiving makeup water from the intermediate buffer—thus reducing the risk of clogging.

4.2. Selection of Slurry Concentrations for Diaphragm and Centrifugal Pump Groups with Consideration of Overall System Efficiency Optimization

From Figure 1, the following relationship can be derived:
Q m c = Q s v + Q w
Similarly,
Q m c = Q m d + Q w b
Since the slurry flow rate transported by the seabed diaphragm pumps must equal the volume of wastewater used to drive them, it follows that if all the discharged wastewater is used to drive the diaphragm pumps:
Q m d = Q w
Combining Equations (18)–(20) yields:
Q w b = Q s v
That is, the volume of make-up water in the intermediate chamber equals the volumetric flow rate of the solid nodules in the system.
Q m c = Q s v C v c
Q m d = Q s v C v d
C v c and C v d respectively denote the volumetric concentration of the slurry handled by the centrifugal pump and the diaphragm pump, and their values depend on the operating conditions of the mining system.
Accordingly, the relationship between the flow rates and concentrations of the centrifugal and diaphragm pumps can be expressed as follows:
Q m c C v c = Q m d C v d
Based on Equations (18) and (19), the following can be derived:
Q m d = Q m c Q s v
Substituting into Equation (23) yields:
C v d = Q m c C v c Q m c Q s v
That is, once the system’s production capacity and the slurry concentration for centrifugal pumping are determined, and assuming that all the wastewater discharged to the seabed is used to drive the diaphragm pumps, the slurry concentration for the diaphragm pumps is effectively fixed. Therefore, in the system shown in Figure 1, the selection of slurry concentrations for both centrifugal and diaphragm pumps essentially depends on the chosen concentration for the centrifugal pump.
Accordingly, to maximize the efficiency of the entire slurry transport system, the slurry concentration of the centrifugal pump can be treated as a variable, and the matching concentrations for both types of pumps can be determined by targeting optimal transport efficiency.
According to previous studies [6,25,26], and without considering mechanical or motor efficiency, the effective power required for vertical hydraulic lifting per unit time in the pipeline is given by:
E p o t = Q s [ ( ρ s ρ s w ) g H + ρ s g H 1 ] 3.6 ρ s ( J )
The energy consumed for lifting the nodule slurry per unit time is given by:
E s p e c = P z V m S ρ m g ( J )
Then, the lifting efficiency of the pipeline system can be expressed as:
η = E p o t E s p e c = Q s [ ( ρ s ρ s w ) g H + ρ s g H 1 ] 3.6 P z V m S ρ m ρ s g × 100 %
In Equations (27)–(29), ρ s , ρ s w , and ρ m represent the densities of the nodules, seawater, and slurry, respectively (kg/m3); H is the vertical height of the pipe segment under consideration (m); H 1 is the vertical height of the pipeline above sea level (m), taken as 30 m; S is the cross-sectional area of the lifting pipeline ( m 2 ); V m is the slurry velocity in the pipe (m/s); and P Z is the total head loss due to resistance in the pipeline for mineral lifting, expressed in meters of water column ( m H 2 O ) [4,6].
Because the slurry concentration and flow velocity differ between the centrifugal and diaphragm pump pipelines, the overall efficiency of the slurry transport system shown in Figure 1 must be determined by first calculating the efficiencies of each subsystem separately and then combining them for a total system efficiency as follows:
η = E p o t 1 + E p o t 2 E s p e c 1 + E s p e c 2
E p o t 1 , E s p e c 1 , E p o t 2 and E s p e c 2 represent the effective work performed and the energy consumed for mineral lifting in the centrifugal pump section and the diaphragm pump section, respectively.
Based on the previous analysis, when the centrifugal pump slurry concentration C v c ranges between 10% and 12%, the corresponding diaphragm pump concentration and the overall pipeline lifting efficiency of the slurry transport system can be calculated, as summarised in Table 3:
Accordingly, a centrifugal pump slurry concentration of 12% can be selected based on boundary conditions, corresponding to a diaphragm pump slurry concentration of 13.47%. Under this configuration, the overall system efficiency can reach 55.43%. Furthermore, based on Equations (22) and (23), the required slurry flow rates for the centrifugal pump and diaphragm pump, respectively, are 1500   m 3 / h and 1320   m 3 / h to meet the target production capacity of polymetallic nodules. In accordance with the API Spec 5 L standard, 16-inch and 14-inch seamless steel pipes can be selected for the centrifugal pump and diaphragm pump sections, respectively. These correspond to internal diameters of 376.22 mm and 335 mm. The resulting slurry flow velocities in the centrifugal and diaphragm pump pipelines are 3.75 m/s and 4.16 m/s, both exceeding the minimum required slurry transport velocity of 2.5 m/s for vertical lifting of nodules.
Additionally, based on the above analysis, the wastewater discharge rate for the system illustrated in Figure 1 can also be determined. From a structural perspective [4,6], two 10-inch small-diameter pipes (with an internal diameter of 241 mm) can be selected for wastewater discharge. Under this configuration, the calculated internal flow velocity of wastewater reaches 4.02 m/s.

4.3. Analysis of System Efficiency Improvement Enabled by Higher Slurry Concentration in the Diaphragm Pump Group

Employing a higher slurry concentration in the diaphragm pump group contributes to improved system energy efficiency through multiple mechanisms. The analysis is as follows:
Firstly, by utilizing a high slurry concentration of 13.47% in the approximately 2000 m pipeline near the seabed, the overall efficiency of the slurry transport pipeline system reaches 55.43%. In contrast, if a uniform slurry concentration of 12% were maintained throughout the entire 6000 m subsea pipeline and the 30 m segment above sea level, the calculated transport efficiency—based on Equation (28)—would be only 53.14%. Moreover, the higher concentration in the diaphragm pump section allows the use of smaller-diameter pipelines, which is advantageous in reducing the subsea weight of the system and minimizing the deck space required for pipe storage on the mining vessel [6].
On the other hand, using a 13.47% concentration also ensures that the seabed diaphragm pump can be entirely driven by wastewater that is already destined for discharge at the seabed, thereby eliminating the need for additional makeup water. Since the mining wastewater, after dewatering, can be regarded as a pure liquid, the pipeline pressure loss can be evaluated using standard fluid transport formulas [11].
p r , l o s s = 1 2 ξ f + ξ v H + λ H D ρ s w V s w 2 g H 1 ρ s w
In the equation, ξ f represents the local pressure loss coefficient at the inlet and outlet of the lifting pipeline, which can be taken as 1.0 based on engineering experience. ξ v denotes the pressure loss coefficient caused by valves, bends, joints, and other fittings in the wastewater discharge pipeline. Assuming a local pressure loss coefficient of 0.04 per joint and approximately 220 joints in the entire pipeline system, the total local pressure loss is calculated as ξ v H = 10.8 [4,6]. The Darcy friction factor λ , which depends on the Reynolds number and the pipe wall roughness, is obtained from the Moody diagram and is taken as λ = 0.018 . In this study, pure water parameters are used to calculate the friction factor of wastewater pipelines, as dehydrated wastewater is a low-concentration fluid ( C v < 1%). Risks are mitigated via conservative assumptions (λ = 0.018) and system design (buffer tanks), while the friction effects of high-concentration slurries are incorporated into mineral transport pipeline losses through direct numerical simulation. V s w represents the flow velocity of the wastewater in the discharge pipeline.
It can be calculated that, to deliver wastewater at a flow rate of Q w ( 1320   m 3 / h ) to a depth of 6000 m, a pressure loss of 361.7   m H 2 O ; must be overcome. In contrast, delivering wastewater combined with supplementary water at a flow rate equivalent to Q w + Q s v (1500 m 3 / h ) to the same depth would require overcoming a pressure loss of 475.9   m H 2 O . This does not include the energy consumption and additional equipment required to extract the supplementary water Q s v from the mining vessel.

5. Conclusions

Prior research proposed a fundamental deep-sea mining system that utilizes discharged wastewater to drive subsea diaphragm pumps for mineral slurry transport, and studied the flow and pressure characteristics of subsea diaphragm pumps driven by dual-side fluid input. Building upon this foundation, this study focuses on the technical scheme of subsea diaphragm pump groups and the hydraulic parameter matching of the coupled mineral transport and wastewater discharge system, in the context of commercial deep-sea polymetallic nodule mining. The key findings and advancements are as follows:
For polymetallic nodule transport, experimental and CFD-DEM simulations on water-driven diaphragm pumps’ slurry transport under coarse-particle solid–liquid flow showed that particles were fully discharged from the pump chamber in the first half of the output phase within 1%–15% concentration. A four-pump staggered scheme was proposed for continuous particle discharge; a two four-pump group configuration was designed to meet commercial productivity, and a staggered scheme was developed by analyzing single-group concentration fluctuations to enhance total output concentration stability.
A design study was conducted for the pump group’s centralized slurry output unit (the centralized mixing tank). Effects of output pipe length and positioning on tank outlet concentration uniformity were analyzed, and a mixing tank structural scheme was proposed. CFD-DEM simulations studied internal particle transport; analysis of slurry concentration variations showed the time proportion of concentration within ±1% of the average was 38.4% at the pump group outlet, 57.8% at the mixing tank outlet and 79.2% at 3.5 m into the lifting pipeline—validating the configuration’s role in stable slurry transport.
A transport scheme was proposed: diaphragm pump groups deliver high-concentration slurry with discharged wastewater as the sole drive, while the centrifugal pump conveys lower-concentration slurry supplemented by naturally supplied water from the intermediate tank to reduce pump clogging risk. Flow rate-concentration relationships were analyzed to meet nodule output requirements. Considering centrifugal pump capabilities and aiming for optimal transport efficiency (accounting for wastewater discharge energy consumption), the diaphragm pump groups’ output flow rate and concentration were determined, optimizing the coupled system’s parameter matching. Compared with conventional centrifugal pump-based systems, this scheme raises pipeline transport efficiency from 53.14% to 55.43% and cuts wastewater discharge pipeline hydraulic resistance loss from 475.9   m H 2 O to 361.7   m H 2 O .

Author Contributions

Conceptualization, Q.H., J.F., Y.K. and S.L.; methodology, S.L.; software, J.F., J.H. and K.W.; validation, Q.H., J.F., Y.K., S.L., J.H. and K.W.; formal analysis, Q.H., J.F., S.L. and K.W.; investigation, Q.H., Y.K. and K.W.; resources, Y.K.; data curation, Q.H., J.F., S.L. and K.W.; writing—original draft preparation, Q.H., J.F., S.L. and J.H.; writing—review and editing, Q.H., J.F. and S.L.; visualization, Q.H., J.F., J.H. and K.W.; supervision, J.F. and S.L.; project administration, Y.K. and S.L.; funding acquisition, Q.H. All authors have read and agreed to the published version of the manuscript.

Funding

This research was funded by the National Key Research and Development Project of China (2023YFC2811300) and the National Natural Science Foundation of China (52201314).

Data Availability Statement

The original contributions presented in this study are included in the article. Further inquiries can be directed to the corresponding author.

Acknowledgments

The authors would like to thank the anonymous reviewers and editor for their constructive suggestions, which comprehensively improved the quality of the paper. All individuals have consented to the acknowledgement.

Conflicts of Interest

The authors declare no conflicts of interest.

References

  1. Kang, Y.J.; Liu, S.J. The development history and latest progress of deep-sea polymetallic nodule mining technology. Minerals 2021, 11, 1132. [Google Scholar] [CrossRef]
  2. Amos, A.F.; Roels, O.A. Environmental aspects of manganese nodule mining. Mar. Pol. 1977, 1, 156–163. [Google Scholar] [CrossRef]
  3. Muñoz-Royo, C.; Peacock, T.; Alford, M.H.; Smith, J.A.; Le Boyer, A.; Kulkarni, C.S.; Lermusiaux, P.F.J.; Haley, P.J., Jr.; Mirabito, C.; Wang, D.; et al. Extent of impact of deep-sea nodule mining midwater plumes is influenced by sediment loading, turbulence and thresholds. Commun. Earth Environ. 2021, 2, 148. [Google Scholar] [CrossRef]
  4. Alex, R.; Chen, X.D.; Tang, X.X.; Wang, Z.N.; Llc, O.T.; Li, J.; Liu, T.J.; Wang, R.J. A riser and lifting system (RALS) concept for deep sea polymetallic Nodule Mining. In Proceedings of the 50th Underwater Minerals Conference, St. Petersburg, FL, USA, 2–7 October 2022. [Google Scholar]
  5. Babu, R. Design of Hydraulic Transportation System Using Positive Displacement Pump for Deep Sea Mining. J. Therm. Fluid Sci. 2022, 3, 14–27. [Google Scholar] [CrossRef]
  6. Kang, Y.J.; Wang, K.L.; Hu, Q.; Liu, S.J. Research on a coupled system design for mineral lifting and wastewater drainage in deep-sea mining applications. Ocean Eng. 2024, 299, 117260. [Google Scholar] [CrossRef]
  7. Schumacher, J.P.; Dowell, J.D.; Ribbeck, L.R.; Eggemeyer, J.C. Subsea mud lift drilling: Planning and preparation for the first Subsea field test of a full-scale dual gradient drilling system at Green Canyon 136, Gulf of Mexico. In SPE Annual Technical Conference and Exhibition; SPE: Calgary, AB, Canada, 2001; p. SPE-71358-MS. [Google Scholar] [CrossRef]
  8. Smith, K.L.; Gault, A.D.; Witt, D.E.; Weddle, C.E. Sub Sea Mud Lift drilling joint industry project: Delivering dual gradient drilling technology to industry. In SPE Annual Technical Conference and Exhibition; SPE: Calgary, AB, Canada, 2001; p. SPE-71357-MS. [Google Scholar] [CrossRef]
  9. Judge, R.A.; Yu, A. Subsea slurry lift pump for Deepsea mining. In Proceedings of the ASME 2010 29th International Conference on Ocean, Offshore and Arctic Engineering, ASMEDC, Shanghai, China, 6–11 June 2010; Volume 3, pp. 181–188. [Google Scholar] [CrossRef]
  10. Leach, S.; Smith, G.; Berndt, R. SME Special Session: Subsea Slurry Lift Pump Technology—SMS Development. In Proceedings of the Offshore Technology Conference, OTC, Houston, TX, USA, 30 April–3 May 2012; p. OTC-23224-MS. [Google Scholar] [CrossRef]
  11. Schulte, S. Vertical transport methods in deep sea mining. In Van Oord Dredging & Marine Contractors; Delft University of Technology: Delft, The Netherlands, 2013. [Google Scholar]
  12. Hu, Q.; Huang, J.Q.; Kang, Y.J.; Liu, S.J.; Feng, J.X.; Wang, K.L. Study on the transportation characteristics of wastewater-driven deep-sea diaphragm pumps for slurry transportation. Appl. Ocean. Res. 2025, 158, 104567. [Google Scholar] [CrossRef]
  13. Zhai, X.Y. Research on Multi-Objective Optimization Design and Anti-Blocking Measures for Multi-Stage Deep-Sea Mining Pump; Central South University: Changsha, China, 2023. [Google Scholar] [CrossRef]
  14. UN Ocean Economics Technology Branch. Report for 1986–87 on the Activities in Marine Affairs; UN Ocean Economics Technology Branch: New York, NY, USA, 1987. [Google Scholar]
  15. Deng, L.W. Numerical and Experimental Study on the Hydraulics and Particle Transport Characteristics of Deep Sea Lifting Pump; Central South University: Changsha, China, 2022. [Google Scholar]
  16. Chen, G.G.; Yang, N.; Tang, D.S.; Jin, X.; Xiao, H. Study on the settling regularity of solid particles in vertical pipelines. J. Sediment Res. 2010, 4, 16–21. [Google Scholar] [CrossRef]
  17. Charlton, A.J.; Blandin, G.; Leslie, G.; Leclech, P. Impact of Forward Osmosis Operating Pressure on Deformation, Efficiency and Concentration Polarisation with Novel Links to CFD. Membranes 2021, 11, 161. [Google Scholar] [CrossRef] [PubMed]
  18. Hu, Q.; Chen, J.; Deng, L.W.; Liu, S.J. CFD-DEM coupled simulation and experimental study of deep sea lifting mine pump under extreme working conditions. Chin. J. Nonferrous Met. 2021, 31, 2926–2937. [Google Scholar] [CrossRef]
  19. Tang, P.; Xie, B.; Zhao, G.; Zhu, W.; Wang, W.; Ma, W. Study on the crushing characteristics of polymetallic nodules based on the single-tooth roller crusher. Powder Technol. 2025, 462, 121138. [Google Scholar] [CrossRef]
  20. Johnson, K.L.; Kendall, K.; Roberts, A.D. Surface energy and the contact of elastic solids. Proceed. Royal Society of London. A. Math. Phys. Sci. 1997, 324, 301–313. [Google Scholar] [CrossRef]
  21. Huilin, L.; Gidaspow, D. Hydrodynamics of binary fluidization in a riser: CFD simulation using two granular temperatures. Chem. Eng. Sci. 2003, 58, 3777–3792. [Google Scholar] [CrossRef]
  22. Saffman, P.G. The lift on a small sphere in a slow shear flow. J. Fluid Mech. 1965, 22, 385–400. [Google Scholar] [CrossRef]
  23. Blackburn, J.; Jankowski, P.; Heymann, E.; Chwastiak, P.; See, A.; Munro, P.; Lipton, I. Offshore Production System Definition and Cost Study. 2010. Available online: https://actnowpng.org/sites/default/files/Solwara%201%20Production%20System%20Definition%20and%20Cost%20Study%202010.pdf (accessed on 19 August 2025).
  24. Kang, Y.J.; Liu, S.J.; Zou, W.S.; Zhao, H.; Hu, X.Z. Design and analysis of an innovative deep-sea lifting motor pump. Appl. Ocean. Res. 2019, 82, 22–31. [Google Scholar] [CrossRef]
  25. Zou, W.S.; Li, H.T.; Kang, Y.J. Theoretical design on slurry pump hydraulic lift system for marine mineral resources exploitation. Chin. J. Nonferrous Met. 2021, 31, 2953–2962. [Google Scholar]
  26. Li, P.C. Studies on Mechanism of Hydraulic Hoist of Coarse Particle in Vertical Pipe. Ph.D. Dissertation, Tsinghua University, Beijing, China, 2007. [Google Scholar]
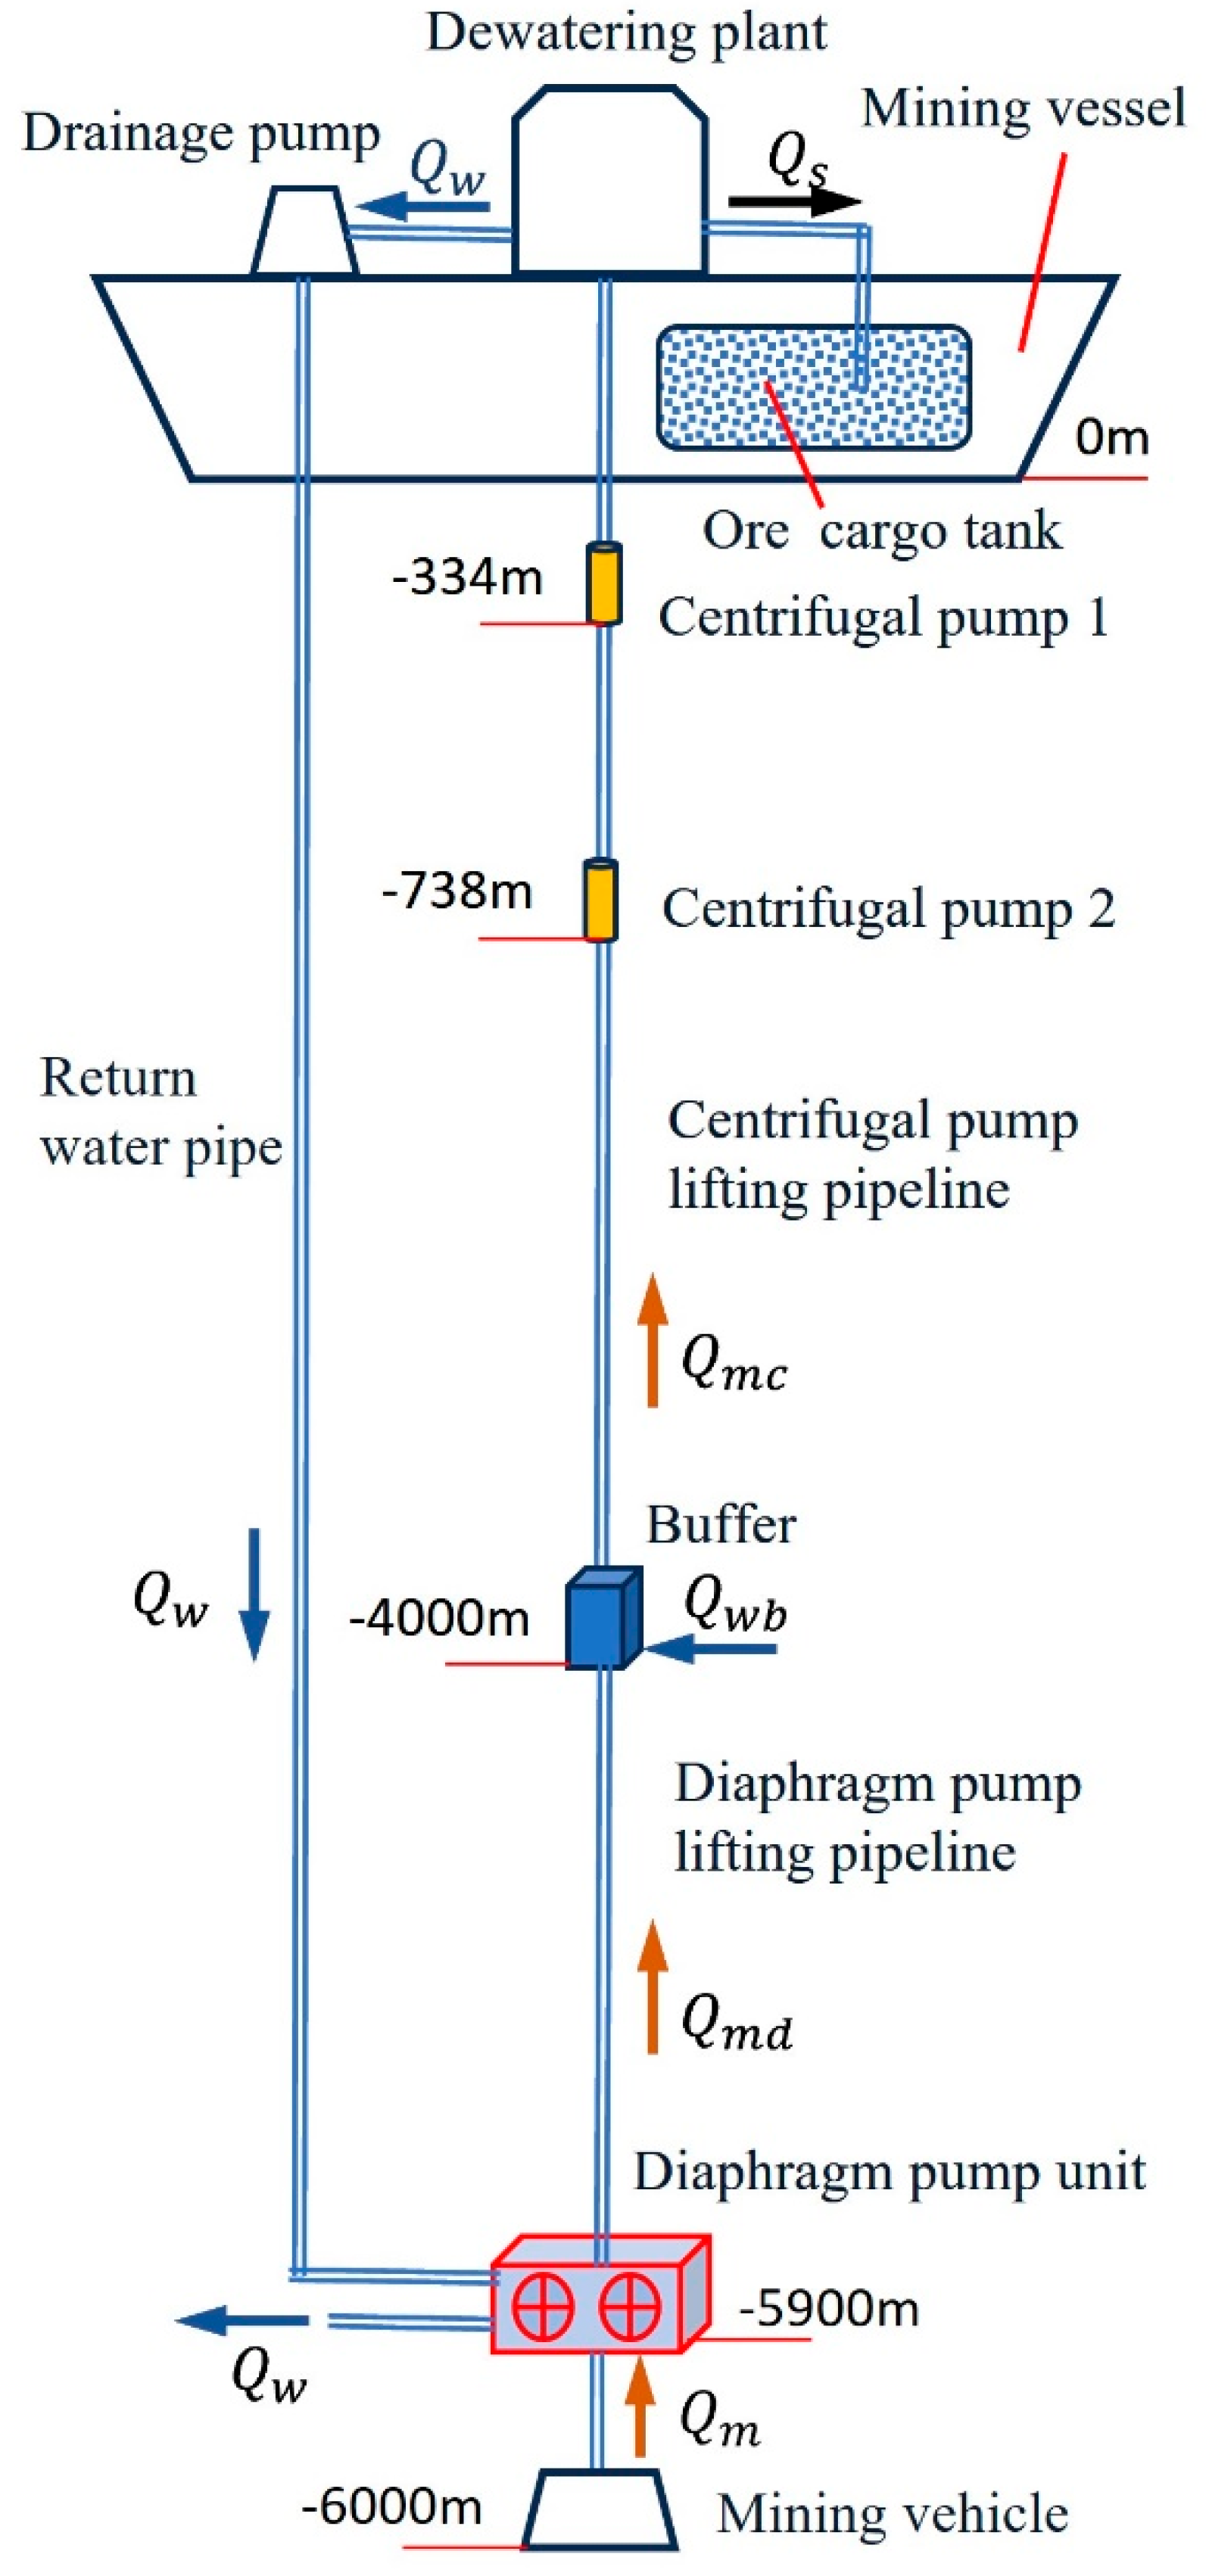
Figure 1. Schematic diagram of the coupled wastewater discharge and mineral slurry lifting system for deep-sea polymetallic nodule mining.
Jmse 13 01934 g001
Figure 2. Schematic diagram of the dual-sided fluid-driven diaphragm pump test system for slurry transport.
Jmse 13 01934 g002
Figure 3. Photographs of the experimental setup: (a) test platform and monitoring/control system; (b) diaphragm pump used in the experiment.
Jmse 13 01934 g003
Figure 4. Particle distribution within the diaphragm pump during the first half of the outlet phase at different concentrations.
Jmse 13 01934 g004
Figure 5. Comparison of particle distribution between CFD–DEM simulation and experimental observation.
Jmse 13 01934 g005
Figure 6. Particle concentration profiles in the diaphragm pump chamber and pipeline under different slurry concentrations.
Jmse 13 01934 g006
Figure 7. Phase-shifted synchronization of four diaphragm pumps for particulate slurry transport (13% concentration).
Jmse 13 01934 g007
Figure 8. Coordinated slurry transport by two staggered diaphragm pump sets.
Jmse 13 01934 g008
Figure 9. Configuration of the water-driven diaphragm pump group for slurry transport.
Jmse 13 01934 g009
Figure 10. Working schematic diagram of the centralized buffer tank and decentralized buffer tank.
Jmse 13 01934 g010
Figure 11. Schematic diagram of the centralised mixing tank structure.
Jmse 13 01934 g011
Figure 12. Model of the Riser Pipeline for the Diaphragm Pump Group.
Jmse 13 01934 g012
Figure 13. Illustration of the particle trajectories: (a) within the centralised mixing tank and (b) inside the riser pipeline.
Jmse 13 01934 g013
Figure 14. Variation trends of local particle concentration and average particle velocity with height.
Jmse 13 01934 g014
Figure 15. Shows the variation in particle concentration from the outlet of the diaphragm pump group to the entrance of the riser pipeline.
Jmse 13 01934 g015
Table 1. Mesh Independence Verification for the Lifting Pipeline of the Diaphragm Pump Group.
Number of CellsMesh QualityVelocity (m/s)Error (Compared to Fine Mesh)
23,246Coarse3.89310.83%
35,616Medium4.2432.82%
57,219Good4.3630.07%
137,324Fine4.366-
Table 2. Mesh Attributes of the Diaphragm Pump Group Riser Pipeline.
ParameterValue
Number of cells57,219
Cell volume4.11 × 10−8 to 5.03 × 10⁻⁵ m3
Cell angles9.12° to 89.05°
Orthogonal qualityAverage: 0.957, Minimum: 0.384
Table 3. Lifting Efficiency at Different Slurry Concentrations.
Centrifugal Pump Slurry Concentration (%)Diaphragm Pump Group Slurry Concentration (%)Lifting Efficiency (%)
1011.2346.48
10.511.7949.10
1112.3551.46
11.512.9153.56
1213.4755.43
Disclaimer/Publisher’s Note: The statements, opinions and data contained in all publications are solely those of the individual author(s) and contributor(s) and not of MDPI and/or the editor(s). MDPI and/or the editor(s) disclaim responsibility for any injury to people or property resulting from any ideas, methods, instructions or products referred to in the content.