Article

Interannual Variations in Headland-Bay Beach Profiles and Sediment Under Artificial Island Influence: A Case Study of Puqian Bay, Hainan Island, China

1
College of Electronic and Information Engineering, Guangdong Ocean University, Zhanjiang 524088, China
2
College of Chemistry and Environment, Guangdong Ocean University, Zhanjiang 524088, China
*
Author to whom correspondence should be addressed.
J. Mar. Sci. Eng. 2025, 13(10), 1930; https://doi.org/10.3390/jmse13101930
Submission received: 2 September 2025 / Revised: 6 October 2025 / Accepted: 7 October 2025 / Published: 9 October 2025

Abstract

Beaches are important geomorphic units shaped by land–sea interactions. Changes in their profiles and surface sediments are directly influenced by both natural processes and human activities. This study is based on continuous topographic and sediment monitoring from 2021 to 2023 on the open and sheltered beaches of Puqian Bay, Hainan Island. It investigates the interannual profile evolution and the spatiotemporal response of sediment grain size under the influence of an artificial island. The results show that the Guilinyang Beach profile is mainly characterized by seasonal erosion–accretion cycles and the seaward migration of sandbars, while the Hilton Beach profile has undergone long-term erosion. At Hilton, sediment grain size changes are strongly coupled with profile erosion and accretion. Seasonal waves drive spatial differences in both profile and grain-size variation across Puqian Bay. The artificial island has reshaped local alongshore sediment transport and wave energy distribution. This has led to continuous erosion and coarsening in the open sector, while the sheltered sector remains morphologically stable. These findings reveal the spatiotemporal response patterns of headland-bay beaches under both natural and anthropogenic forcing, and provide scientific evidence for understanding coastal sediment dynamics and the impacts of artificial structures.

1. Introduction

Beaches play a key role in buffering wave energy, mitigating shoreline erosion, and maintaining coastal ecosystem services [1,2,3]. Their profile morphology and sediment characteristics are highly sensitive to nearshore hydrodynamic processes such as waves and longshore currents, making them vulnerable to disturbance, and human activities have further intensified erosion. This has led to shoreline retreat and a reduction in beach width [4,5]. Sedimentary processes on beaches are highly complex, exhibiting dynamic changes across multiple temporal and spatial scales [6,7,8,9]. The erosion–accretion cycles of beach systems are also influenced by multiscale forcing factors [10]. Previous studies have highlighted that seasonal wave energy is a primary driver of beach profile adjustment and sediment grain size variation [11]. For example, Pradhan et al. [12], through investigating the sedimentary characteristics of sandy coasts along the east-central coast of India, demonstrated that grain-size distribution is regulated by the combined effects of morphological settings and local hydrodynamic processes. The strong correlations between sediment grain size and beach morphometric parameters have also been verified by global field datasets [13].
International research has progressively developed systematic knowledge on the sedimentological characteristics and hydrodynamic responses of sandy beaches [14]. Further studies indicate that sediment parameters, when combined with alongshore morphodynamic indices, can be used to infer coastal processes and to explore the patterns of beach evolution [15,16]. Although the coupling between hydrodynamics and sediment dynamics has been extensively studied, most investigations focus on natural beaches, while the mechanisms under anthropogenic disturbance remain poorly understood. Artificial coastal structures modify nearshore wave refraction/diffraction and longshore sediment transport, thereby reshaping local depositional patterns and shoreline responses [17]. Studies of reclamation projects and large artificial islands have shown contrasting depositional trends on their opposing flanks [18,19], confirming that beach morphology and sediment grain-size adjustments are strongly coupled under anthropogenic influence. Moreover, the engineering scale, offshore distance, and structural configuration play decisive roles in this reorganization process [20,21,22]. These factors further impact sediment grain-size distribution and sorting [23]. In such cases, nearby beaches may undergo cumulative passive erosion over time, while small-scale physical models often exhibit inherent ambiguities [24]. Until the mechanisms of beach response are more clearly understood, the application of such structures is likely to remain relatively limited [25]. Therefore, more empirical studies across different regions and representative cases are needed to better explain these processes.
Most existing studies rely on numerical modeling or remote sensing. They provide limited direct and continuous empirical evidence of the synchronous responses of beach profiles and sediment grain size following the construction of artificial islands. This gap in data and process understanding constrains our ability to fully comprehend hydrodynamic–sedimentary coupling under anthropogenic forcing [26,27,28,29]. This study aims to address this gap by investigating the profile evolution and sedimentary response of headland-bay beaches under the influence of artificial islands. Puqian Bay, located on Hainan Island, provides a representative setting that is controlled by typical headland-bay hydrodynamic processes [30,31,32,33]. Based on continuous monitoring of beach profiles and surface sediments from 2021 to 2023, we compare two representative coastal sectors: an exposed segment strongly influenced by the artificial island and a sheltered segment that is less affected by it. By analyzing their profile evolution, grain-size response, and seasonal wave coupling, this study reveals the mechanisms through which artificial islands restructure nearshore hydrodynamic processes. It also provides empirical evidence for the environmental impact assessment of similar coastal engineering projects.

2. Materials and Methods

2.1. Research Area

Hainan Island, located in the northwestern South China Sea, is China’s second largest island. Puqian Bay belongs to Haikou City in northern Hainan (Figure 1A) and is part of the Qiong lei Depression. The bay covers a total area of 145 km2. An artificial island, named Ruyi Island, is situated in the northwest of Puqian Bay. Construction officially began in 2015 but was substantially suspended between 2017 and 2018, by which time the island’s foundational structures were already completed. The closest distance from the island to the shoreline is approximately 4.3 km. The island extends about 8 km in the east–west direction and 0.5–1.6 km in the north–south direction, with a total reclaimed area of 716.34 ha. The island is built on a rubble foundation with a concrete revetment on the upper layer.
Two beach segments were selected in Puqian Bay for field surveys, including profile measurements and surface sediment sampling. The Guilinyang beach profile is located behind Yang gang Mazu Temple along the coast, representing a sheltered segment at the headland of Puqian Bay. The Hilton Beach profile is located behind the Luneng Hilton Hotel, representing an exposed segment of the headland-bay beach. The two profiles are about 10 km apart. Guilinyang Beach has a gently sloping and wide foreshore, whereas Hilton Beach is narrower with a steeper slope (Figure 1B,C).
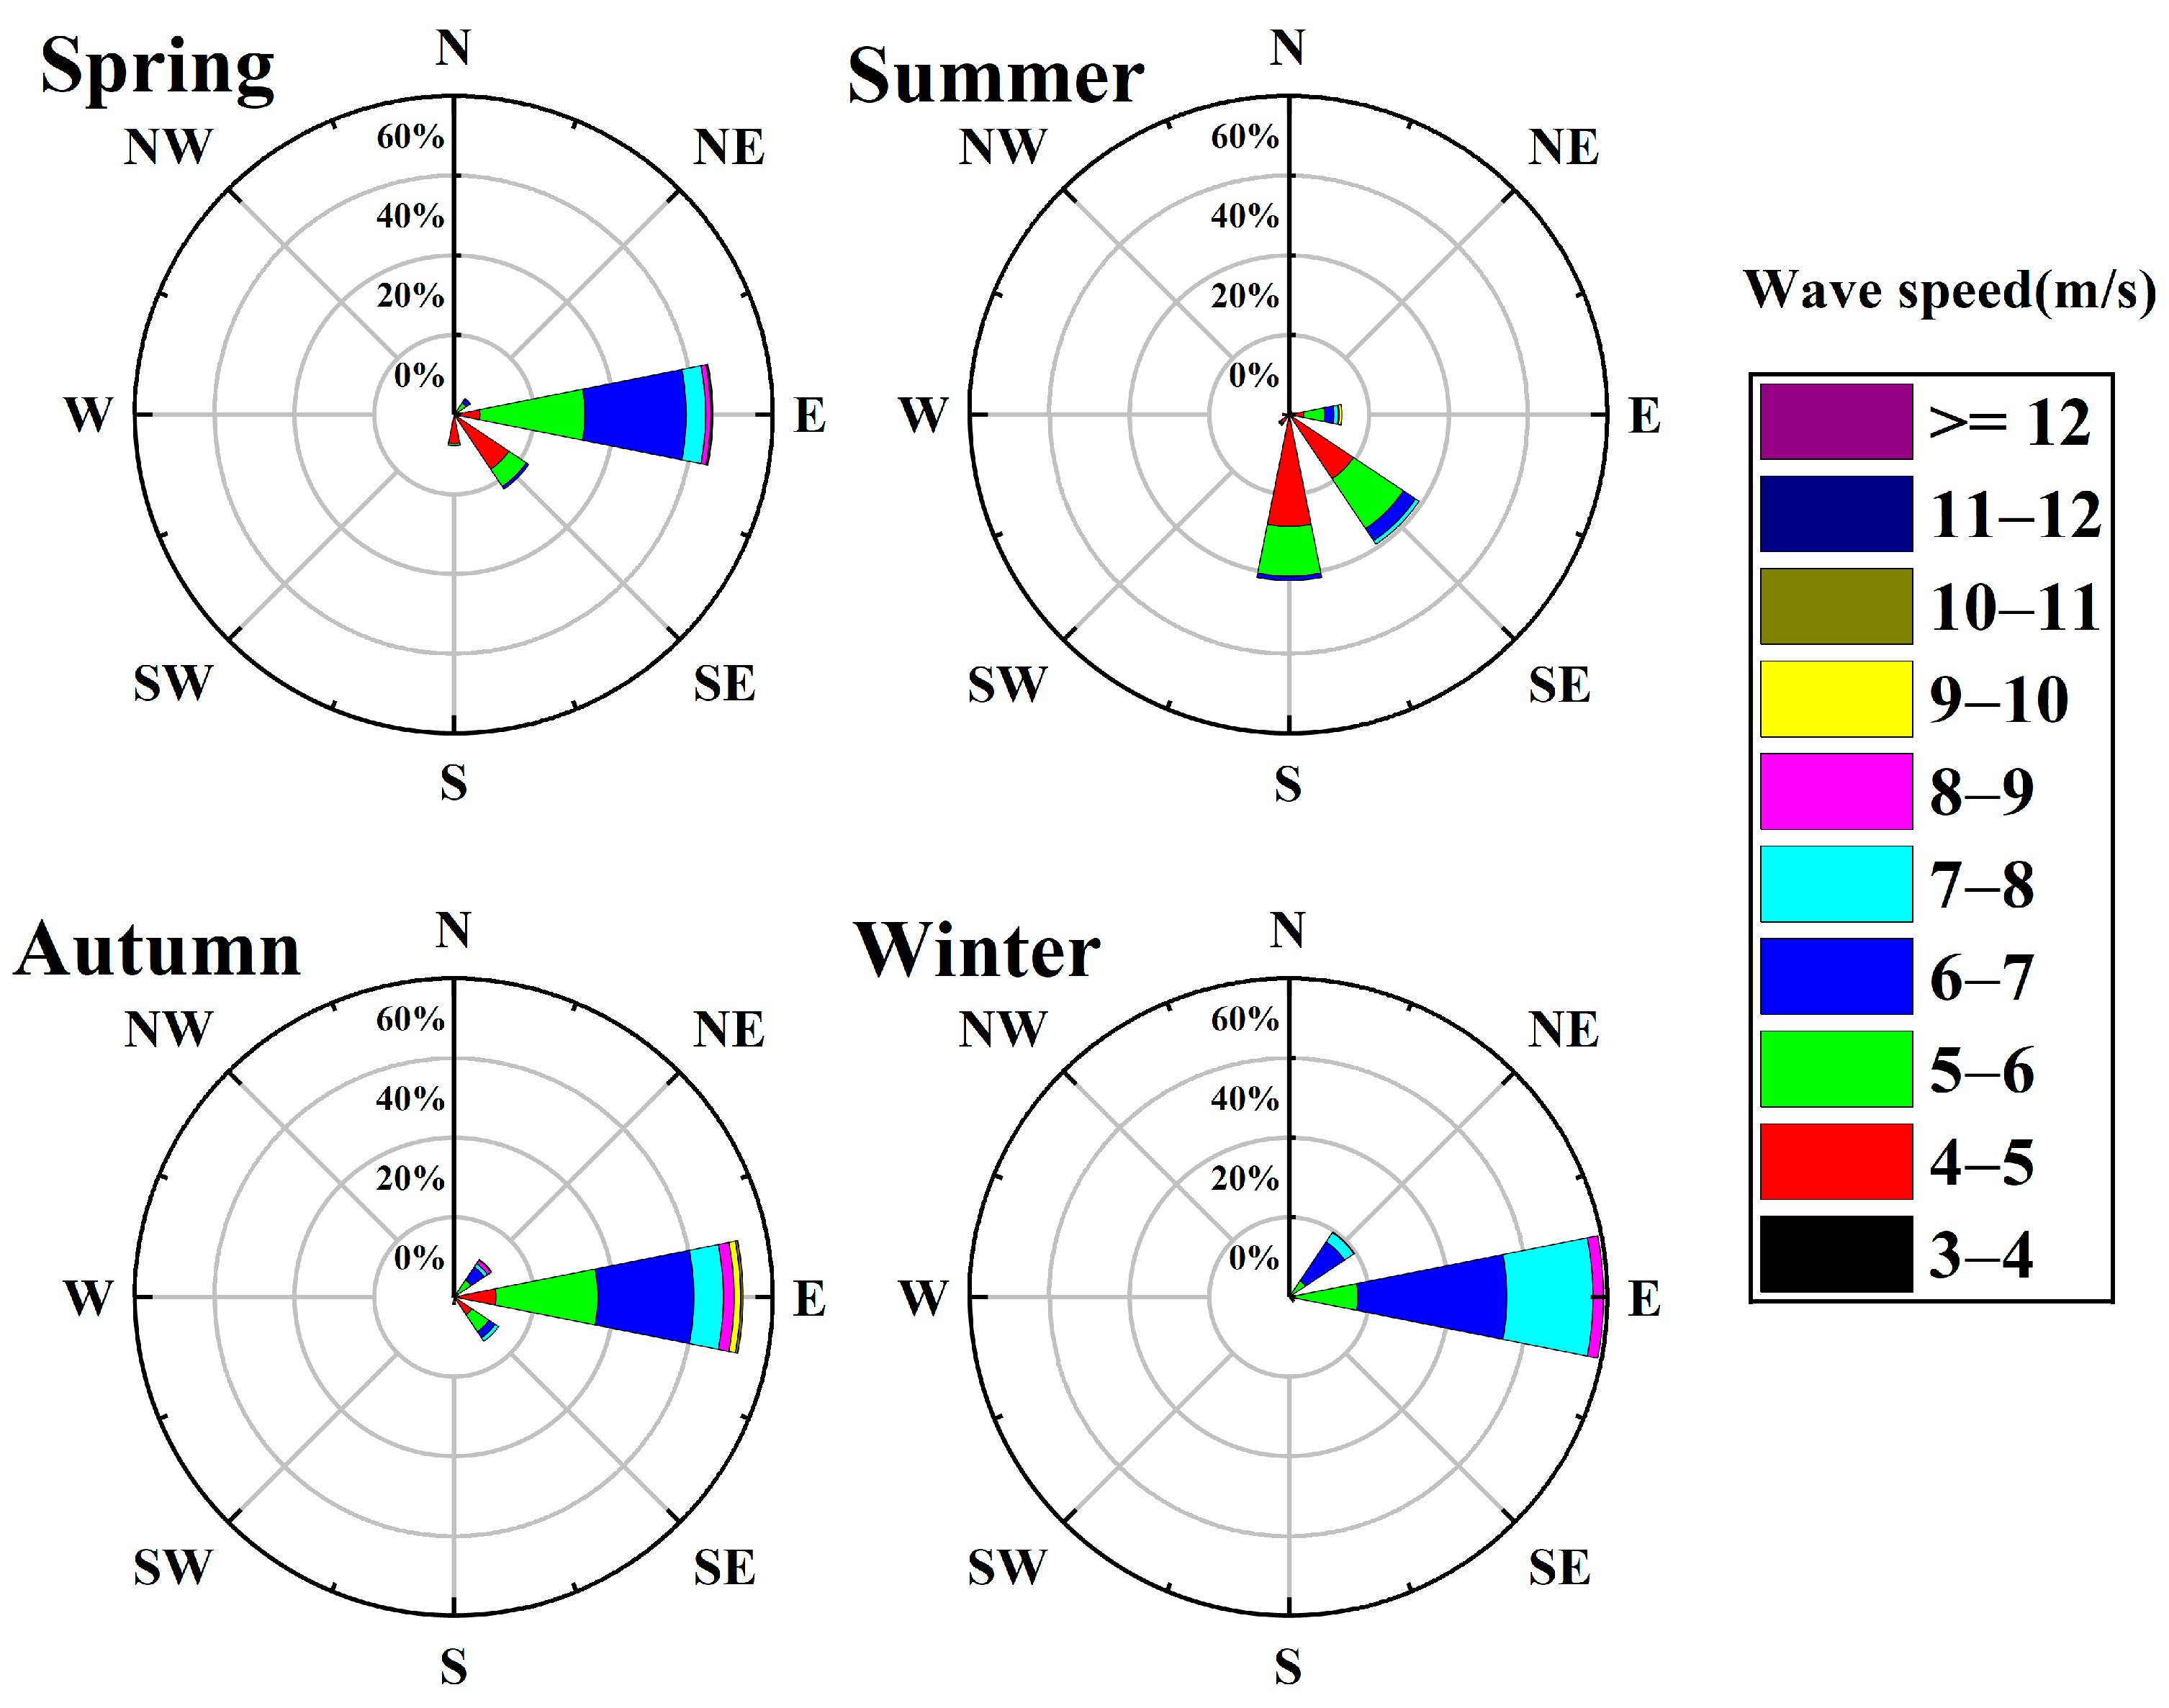
Seasonal wave conditions in Puqian Bay vary. In spring, waves mainly come from the east and southeast, with a frequency exceeding 40%. Summer waves are predominantly from the southeast and south, with two major wave components and a small contribution from long-period eastward waves. Autumn waves are mainly eastward, with a frequency close to 60%, and long-period waves occur most frequently during this season. Winter waves mainly come from the north–northeast and exhibit the most concentrated directions. Overall, wave periods are mostly between 4 and 7 s, with relatively low energy, primarily influenced by regional wind waves. Longer-period waves (>8 s) occur less frequently and mainly in autumn, depending on offshore swell events and extreme weather (Figure 2: deep-water wave data from the European Centre for Medium Range Weather Forecasts, ERA5).

2.2. Methods

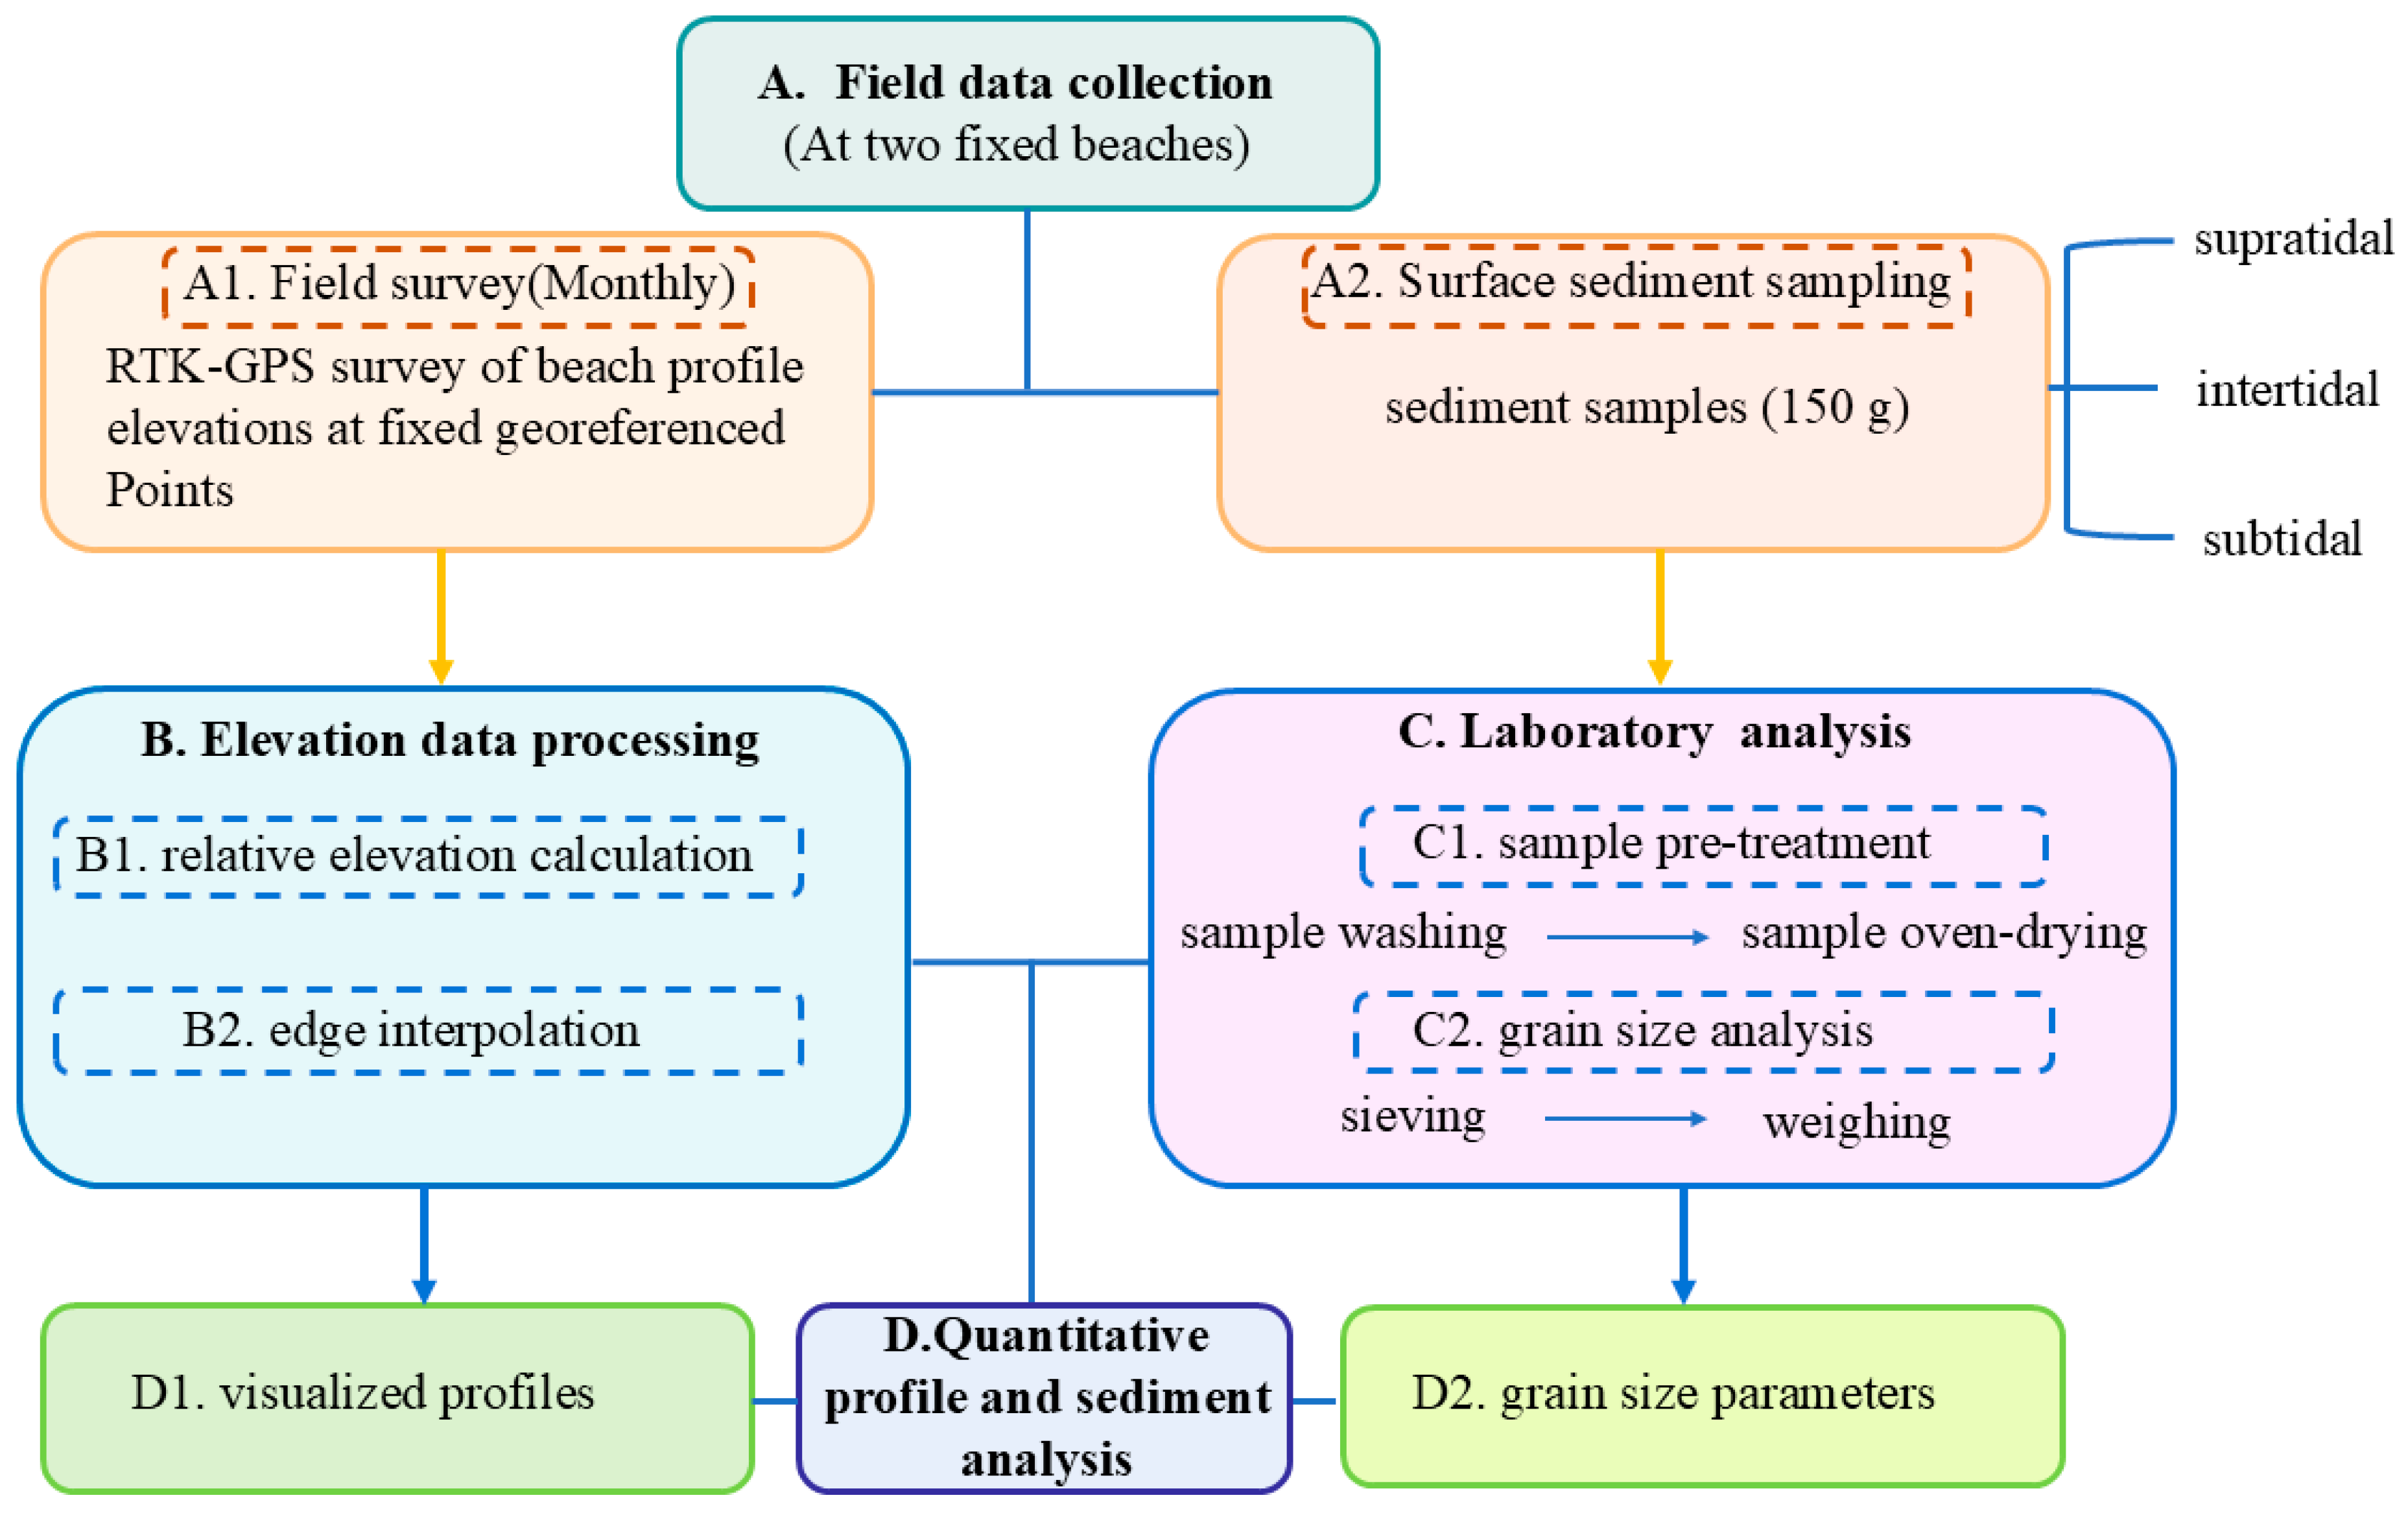
To clearly illustrate the procedures of data collection and processing, a flowchart is presented below (Figure 3).

2.2.1. Sampling and Data Collection

The field survey, conducted from January 2021 to December 2023, measured two observation beach profiles in Puqian Bay using GPS-RTK at monthly intervals. The initial measurement locations were set at the junction of the shelterbelt and the beach, as well as behind artificial structures. For subsequent surveys, the base points were fixed in latitude and longitude to ensure consistent transect coordinates, and measurements extended seawards to the deepest wadeable point. During each survey, 150 g surface sediment samples were collected from the supratidal, intertidal, and subtidal zones. The supratidal zone was defined as the transition between vegetation and the beach foreshore, the intertidal zone as the area between the local mean high water and mean low water, and the subtidal zone as below the mean low water level. According to tidal observations at Haikou station from 2021 to 2023, relative to the local tidal datum, the mean high tide was 2.33 m, the mean low tide was 0.89 m, and the mean tidal range was 1.44 m.
After the samples were brought back to the laboratory, and following international conventions for sediment sample pretreatment and sieving [34], the collected surface sediment samples were cleaned to remove impurities, shells, and saline clumps, and then oven-dried at 60 °C in a constant-temperature electric drying oven. Subsequently, the samples were sieved using a series of sieves ranging from 4 to 230 mesh with 0.5 Φ intervals, and the weights of each fraction were measured using an electronic balance. Using the Φ scale by Folk & Ward [35], the mean grain size (Mz) and sorting coefficient (σi) of the surface sediments were calculated via the moment method.
Offshore wave data were obtained from the ECMWF ERA5 dataset, with a temporal resolution of 1 h, at 20.5° N, 110.9° E, located at the connection between Puqian Bay and the open sea (Figure 2). Satellite images from Landsat were accessed via Google Earth Engine (GEE, https://earthengine.google.com/) with a maximum cloud cover set to 80%.

2.2.2. Empirical Orthogonal Function (EOF) Analysis

EOF analysis can reduce data dimensionality and extract dominant patterns from complex spatiotemporal datasets, revealing the intrinsic structure and variability of the data. In beach research, EOFs can separate the main temporal and spatial modes of beach profile morphology [36], which helps to identify the most significant trends at specific scales, thereby determining the dominant factors controlling beach processes.
To characterize the evolution of the beach at different scales and identify controlling factors, the elevations observed at m survey stations along a profile over n time points were organized into a mean-subtracted data matrix X ∈ Rm × n, where rows represent time and columns represent space. The spatial covariance matrix was calculated as C = 1/(n − 1) XXT, and its eigenvalue problem was solved to obtain the orthogonal spatial modes (EOF modes) and the corresponding temporal coefficients. The eigenvalues λi were arranged in descending order, and the corresponding orthogonal spatial modes (EOF modes) and temporal coefficients were obtained. The variance contribution of each mode was determined by R i = λ i k = 1 m λ k .
To study the seasonal variation patterns of beach profiles at different shoreline sections, profile data from March, June, September, and December of 2021–2023 were selected as representative profiles for spring, summer, autumn, and winter at the monitored beaches.

3. Results

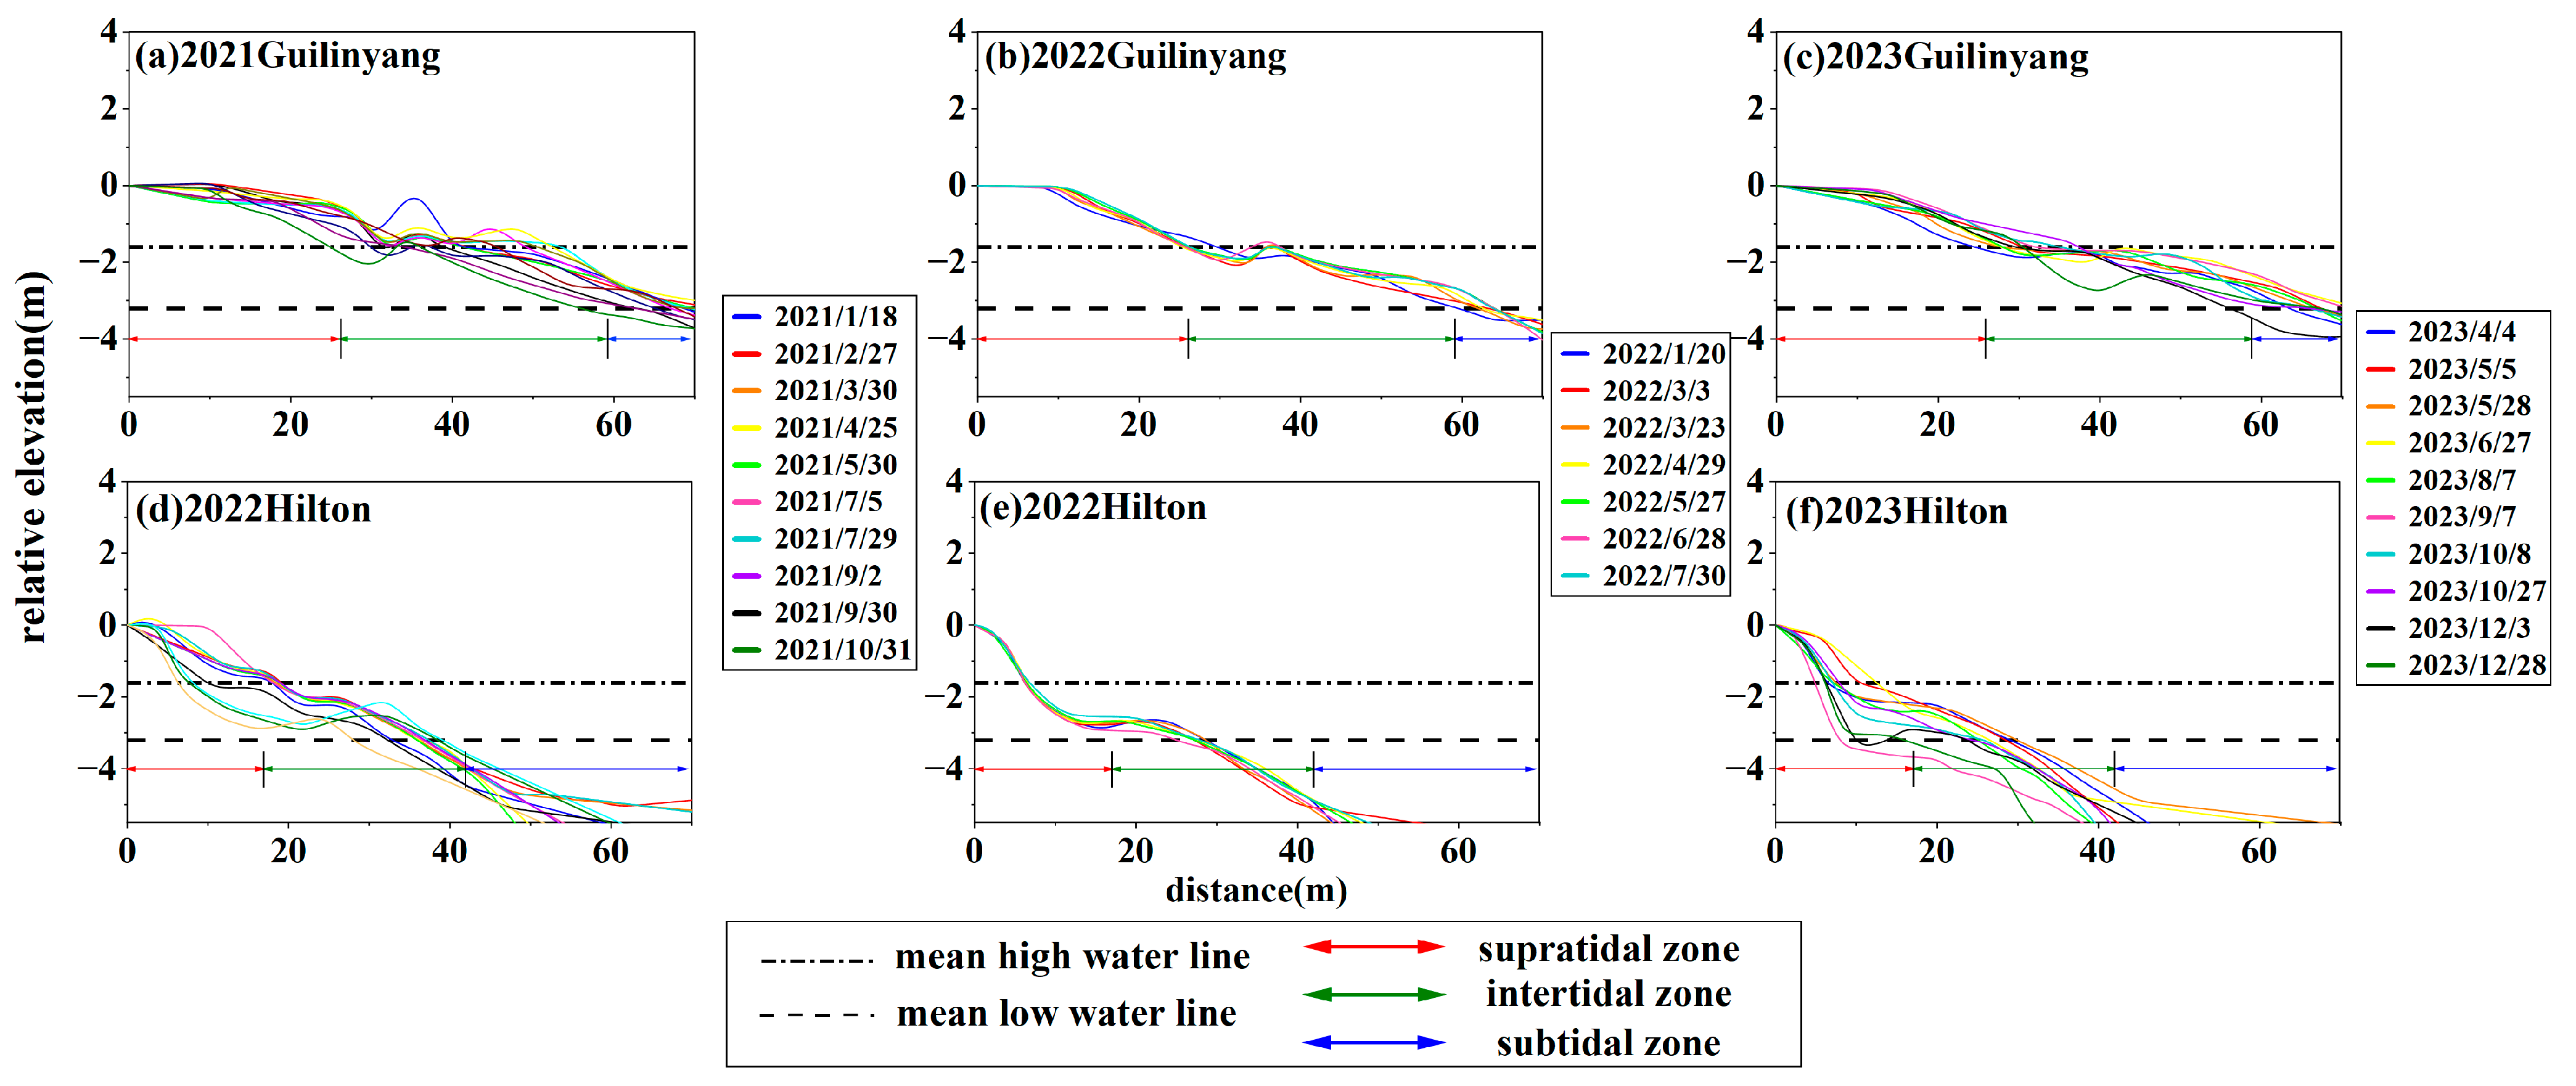
For subsequent data processing, the relative elevations at a fixed offshore distance of 60 m were extracted from each profile to plot profile change diagrams. For profiles with shorter measured distances, linear interpolation was used to extend them to the control length. Profile elevations were calibrated using a fixed reference point as the relative zero, producing the measured profile change diagrams (Figure 4).

3.1. Beach Profile Changes

Guilinyang Beach is broad and gently sloping. Its profile is strongly influenced by seasonal waves, with sediment transported onshore, causing minor accretion at the beach shoulder, ranging from 0.1 to 0.4 m. By December 2023, the lowest elevation at 60 m offshore reached −3.47 m, and the highest −2.44 m. The beach remained relatively stable in spring and autumn, with minor lower beach erosion and upper beach accretion; the overall erosion–accretion state showed little variation. During summer, extreme weather events such as typhoons caused significant changes in the profile morphology. In winter 2023, the beach was generally eroding, with the beach elevation decreasing by 0.1–0.2 m (Figure 4a–c). Hilton Beach is steep and narrow, with a beach width of approximately 40 m. The profile evolved rapidly, exhibiting severe erosion. After 2021, the central section experienced annual lowering, while the beach shoulder showed minor accretion of 0.3–0.5 m. Overall, the beach surface lowered by 2–3 m per year, and the minimum relative elevation at 60 m offshore reached −10.89 m (after linear extrapolation of shorter profile data points) by 2023. The beach became steeper, and the slope increased. Between 2022 and 2023, the beach shoulder migrated landward: in 2022 it was located 35–40 m offshore, and in 2023 it retreated to 25–30 m, averaging 5–10 m landward. The supratidal and subtidal zones experienced significant erosion, while the intertidal zone showed minor accretion. The foredune beach advanced landward, and the beach slope became steeper (Figure 4d–f).

3.2. Interannual Grain Size Variations

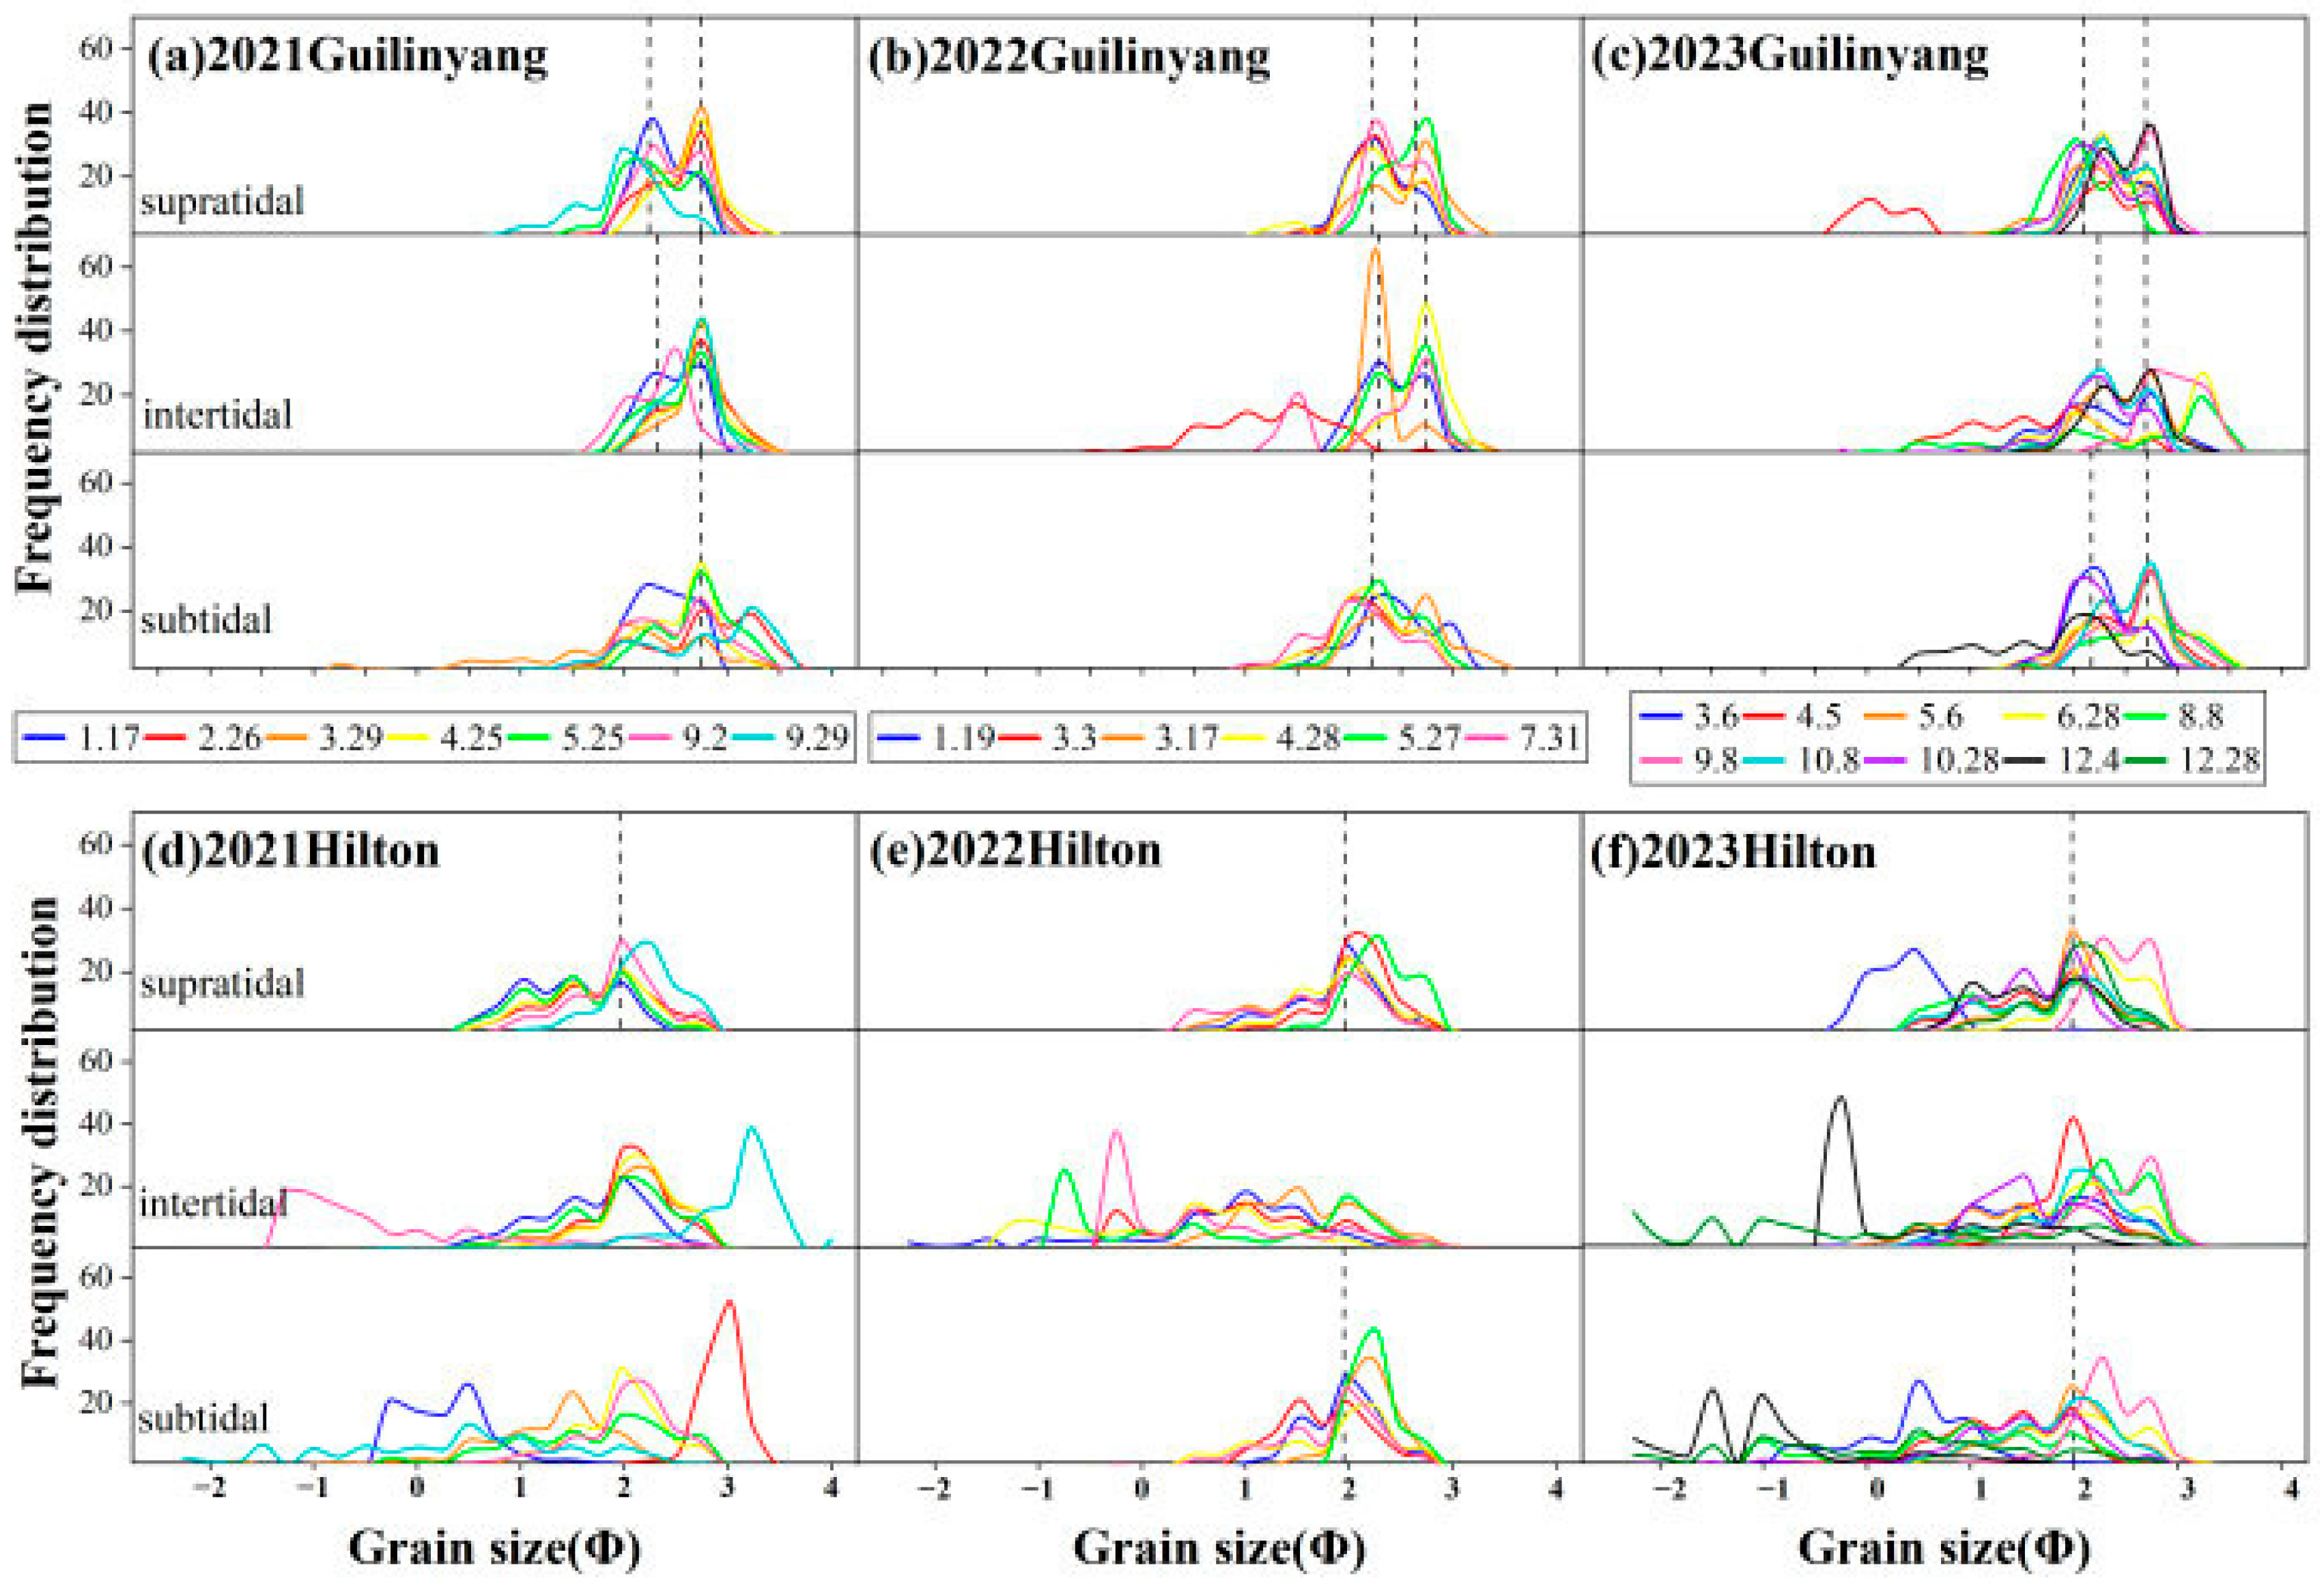
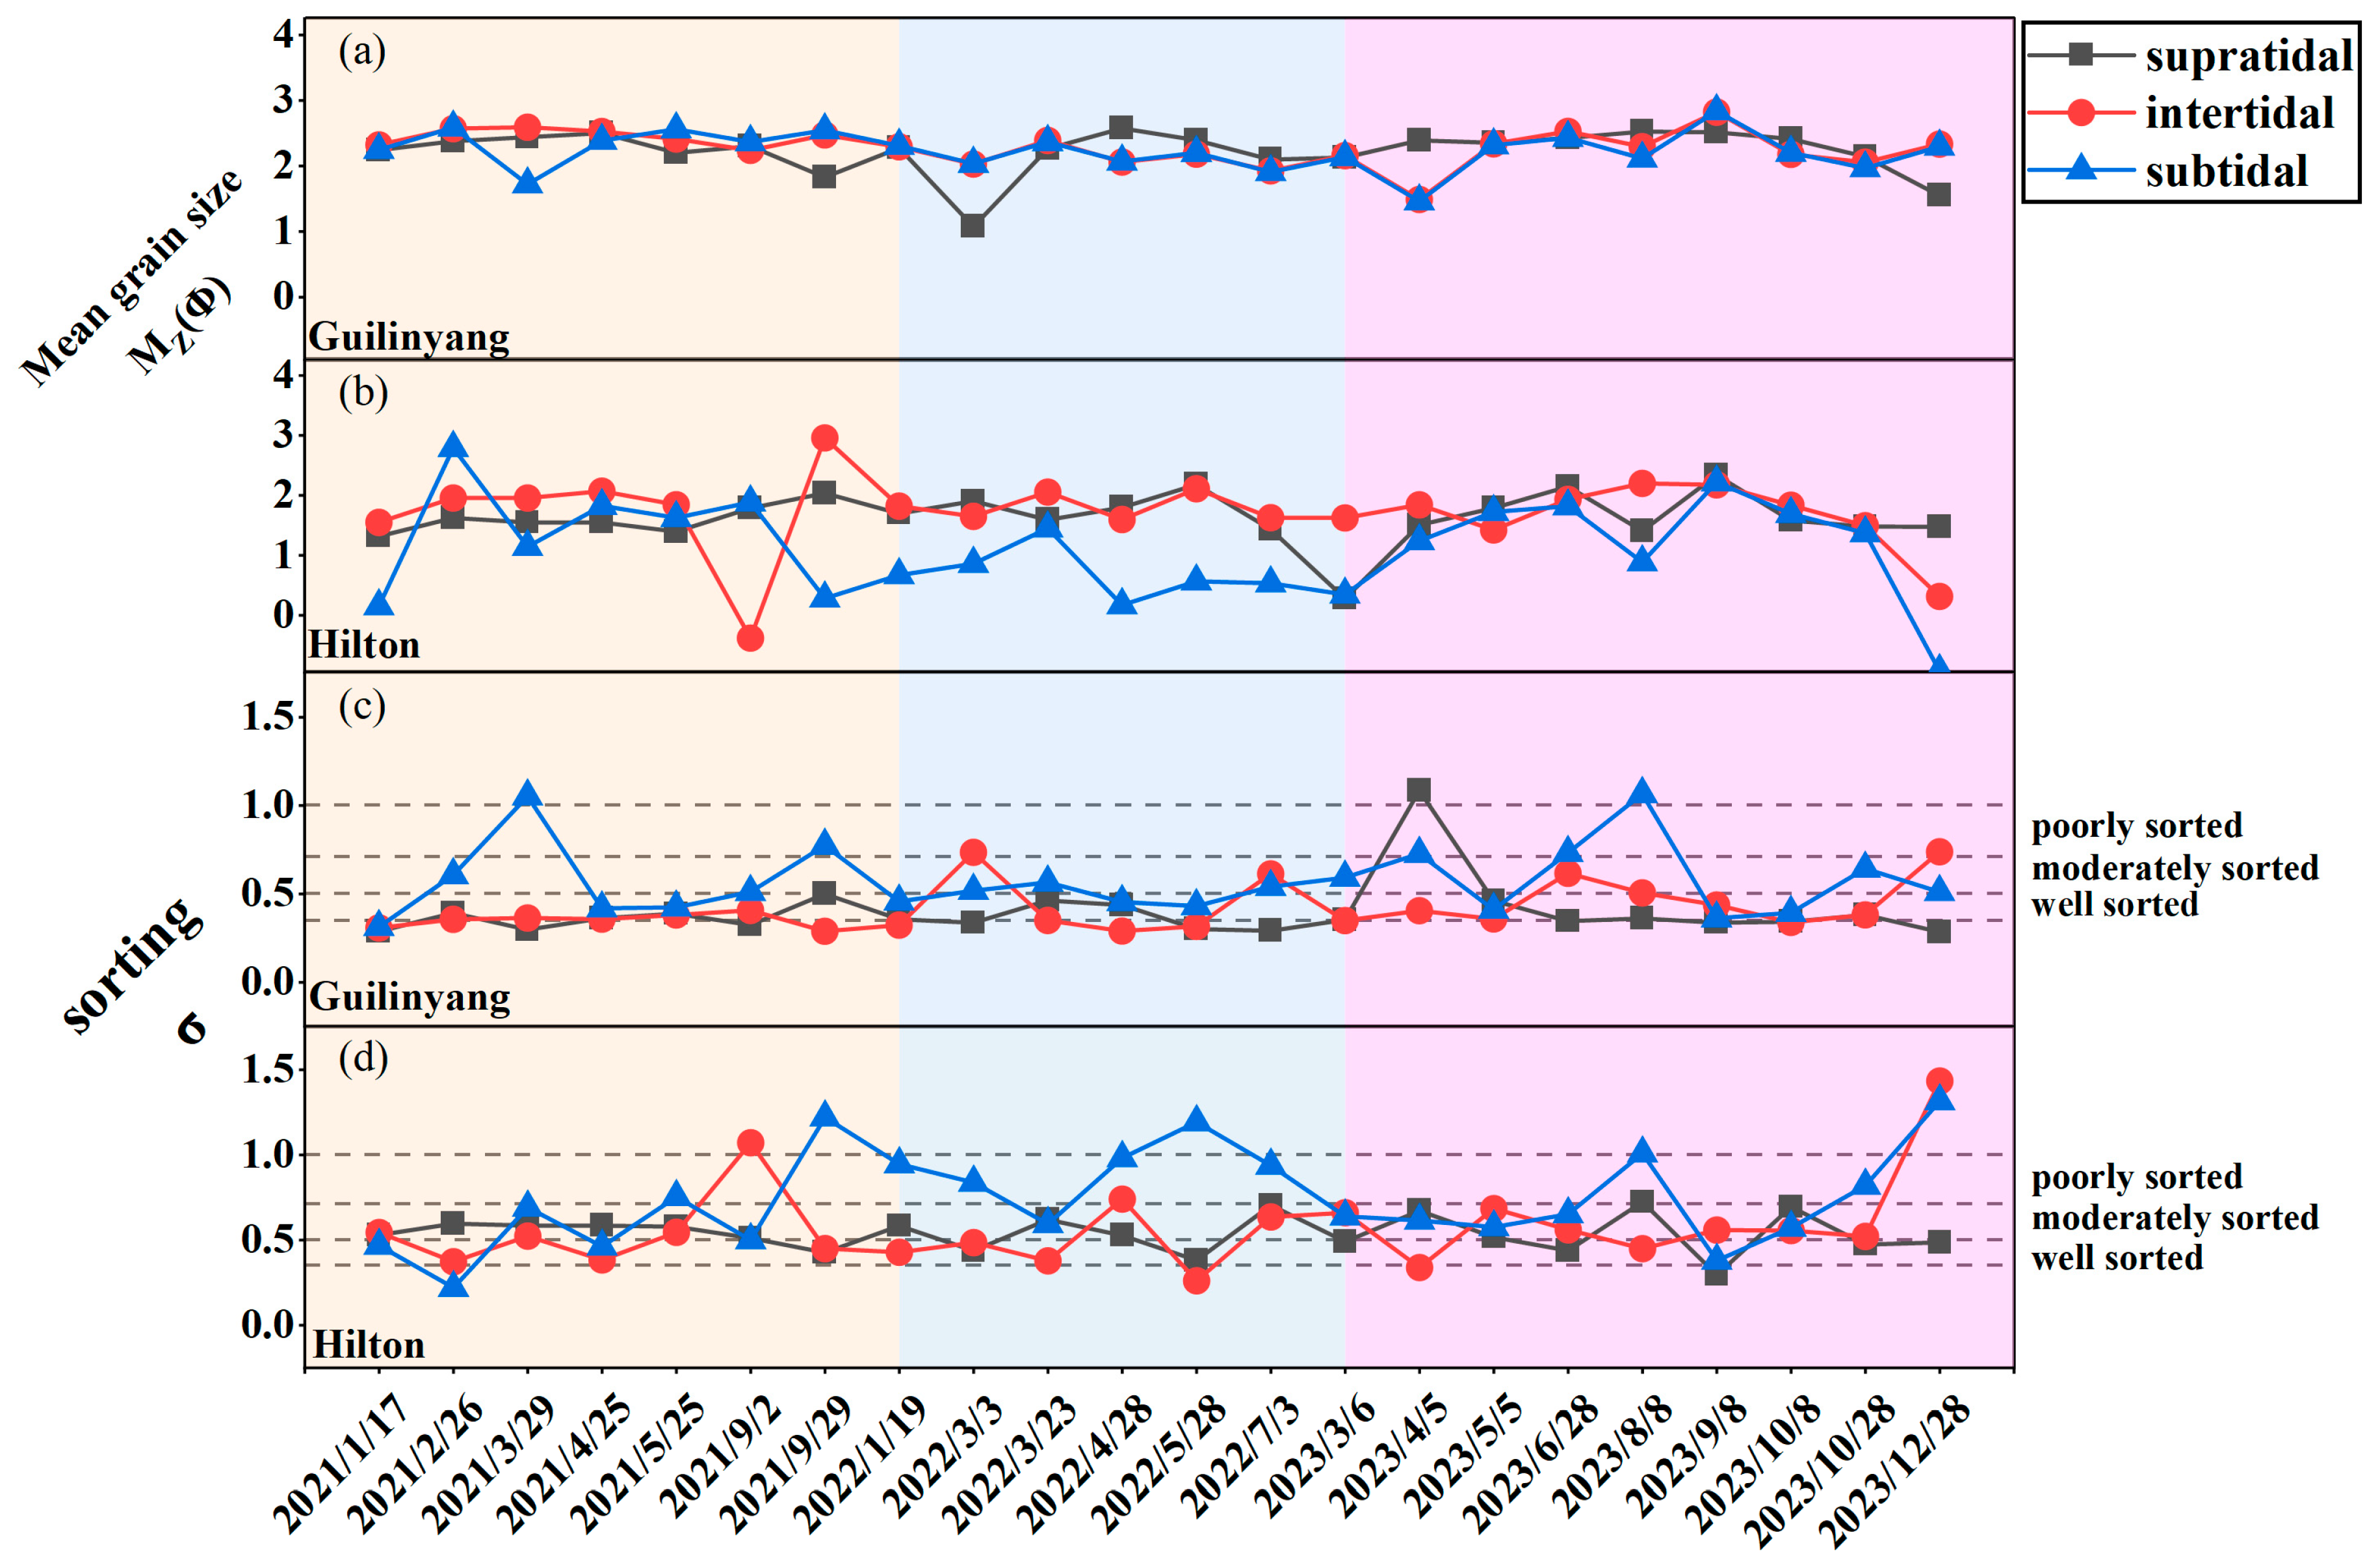
At the interannual scale (Figure 5), Guilinyang Beach exhibits a systematic negative skewness trend: the supratidal and intertidal zones are persistently dominated by fine sand (D < 2.0 Φ), while the subtidal zone develops a mixed fine-to-medium sand depositional system (1.7–2.4 Φ). The grain size distribution curves (Figure 5a,b) indicate that, since autumn 2021, the frequency of grains in the 2.0–2.5 Φ range has shown a pronounced unimodal increase (cumulative annual increase of 12%). By 2023, a bimodal pattern generally formed, accompanied by a continuous loss of medium sand, and the sorting deteriorated (Figure 6d).
In contrast, Hilton Beach shows a nearly symmetric trend, with interannual changes abruptly increasing in 2023. Overall, sand coarsened, with increases in mean and median grain sizes. Fine and coarse sand components grew simultaneously: in the supratidal zone, the grain size distribution shifted from a unimodal state (main peak at 2.0 Φ in 2021) to a multimodal state, with coarse sand frequency increasing by 21% in 2023. The intertidal and subtidal zones developed a broad multimodal structure (Figure 5f), and the sorting deterioration was significantly more severe than at Guilinyang.
Seasonal dynamics show that Guilinyang grain sizes fluctuate by 0.5–0.8 Φ monthly (Figure 6a). During summer, typhoon-driven coarsening occurs, with mean grain sizes reaching up to 1.8 Φ. After typhoons, hydrodynamic conditions stabilize, fine sediments redeposit, and grain size returns to 2.2 Φ. In winter, fine sediments reach 2.4 Φ. At Hilton Beach, grain sizes sharply increase by 1.2 Φ during summer typhoon periods, with sorting becoming poorer (Figure 6d); under winter tidal control, coarse and fine components show spatial segregation: finer particles accumulate in the supratidal zone, while coarser particles deposit in the intertidal and subtidal zones near the shoreline.
Sorting evolution shows characteristic headland bay beach geomorphic zonation. At Guilinyang, the supratidal zone is best sorted (σi = 0.29–1.09), while the subtidal zone, affected by wave disturbance, exhibits the greatest variability (Δσi = 0.78). Mean grain size changes are small, with the proportion of sediment within specific size ranges gradually increasing, reflecting dynamic seasonal improvements in sorting. Sediments in the supratidal and intertidal zones are basically well sorted (0.35 ≤ σi ≤ 0.5).
At Hilton Beach, overall sorting is poor and continuously deteriorates across all zones, with large fluctuations. The spatial heterogeneity is strong in the intertidal zone, Δσi = 1.24 in the subtidal zone), reaching poorly sorted or worse during autumn and winter 2023. The sediment sorting is strongly constrained by the dominant grain size components. Guilinyang Beach exhibits pronounced seasonal sedimentary regularity, whereas Hilton Beach shows weaker regularity (Figure 6).

4. Discussion

4.1. Spatial Differences in Headland-Bay Beach Evolution

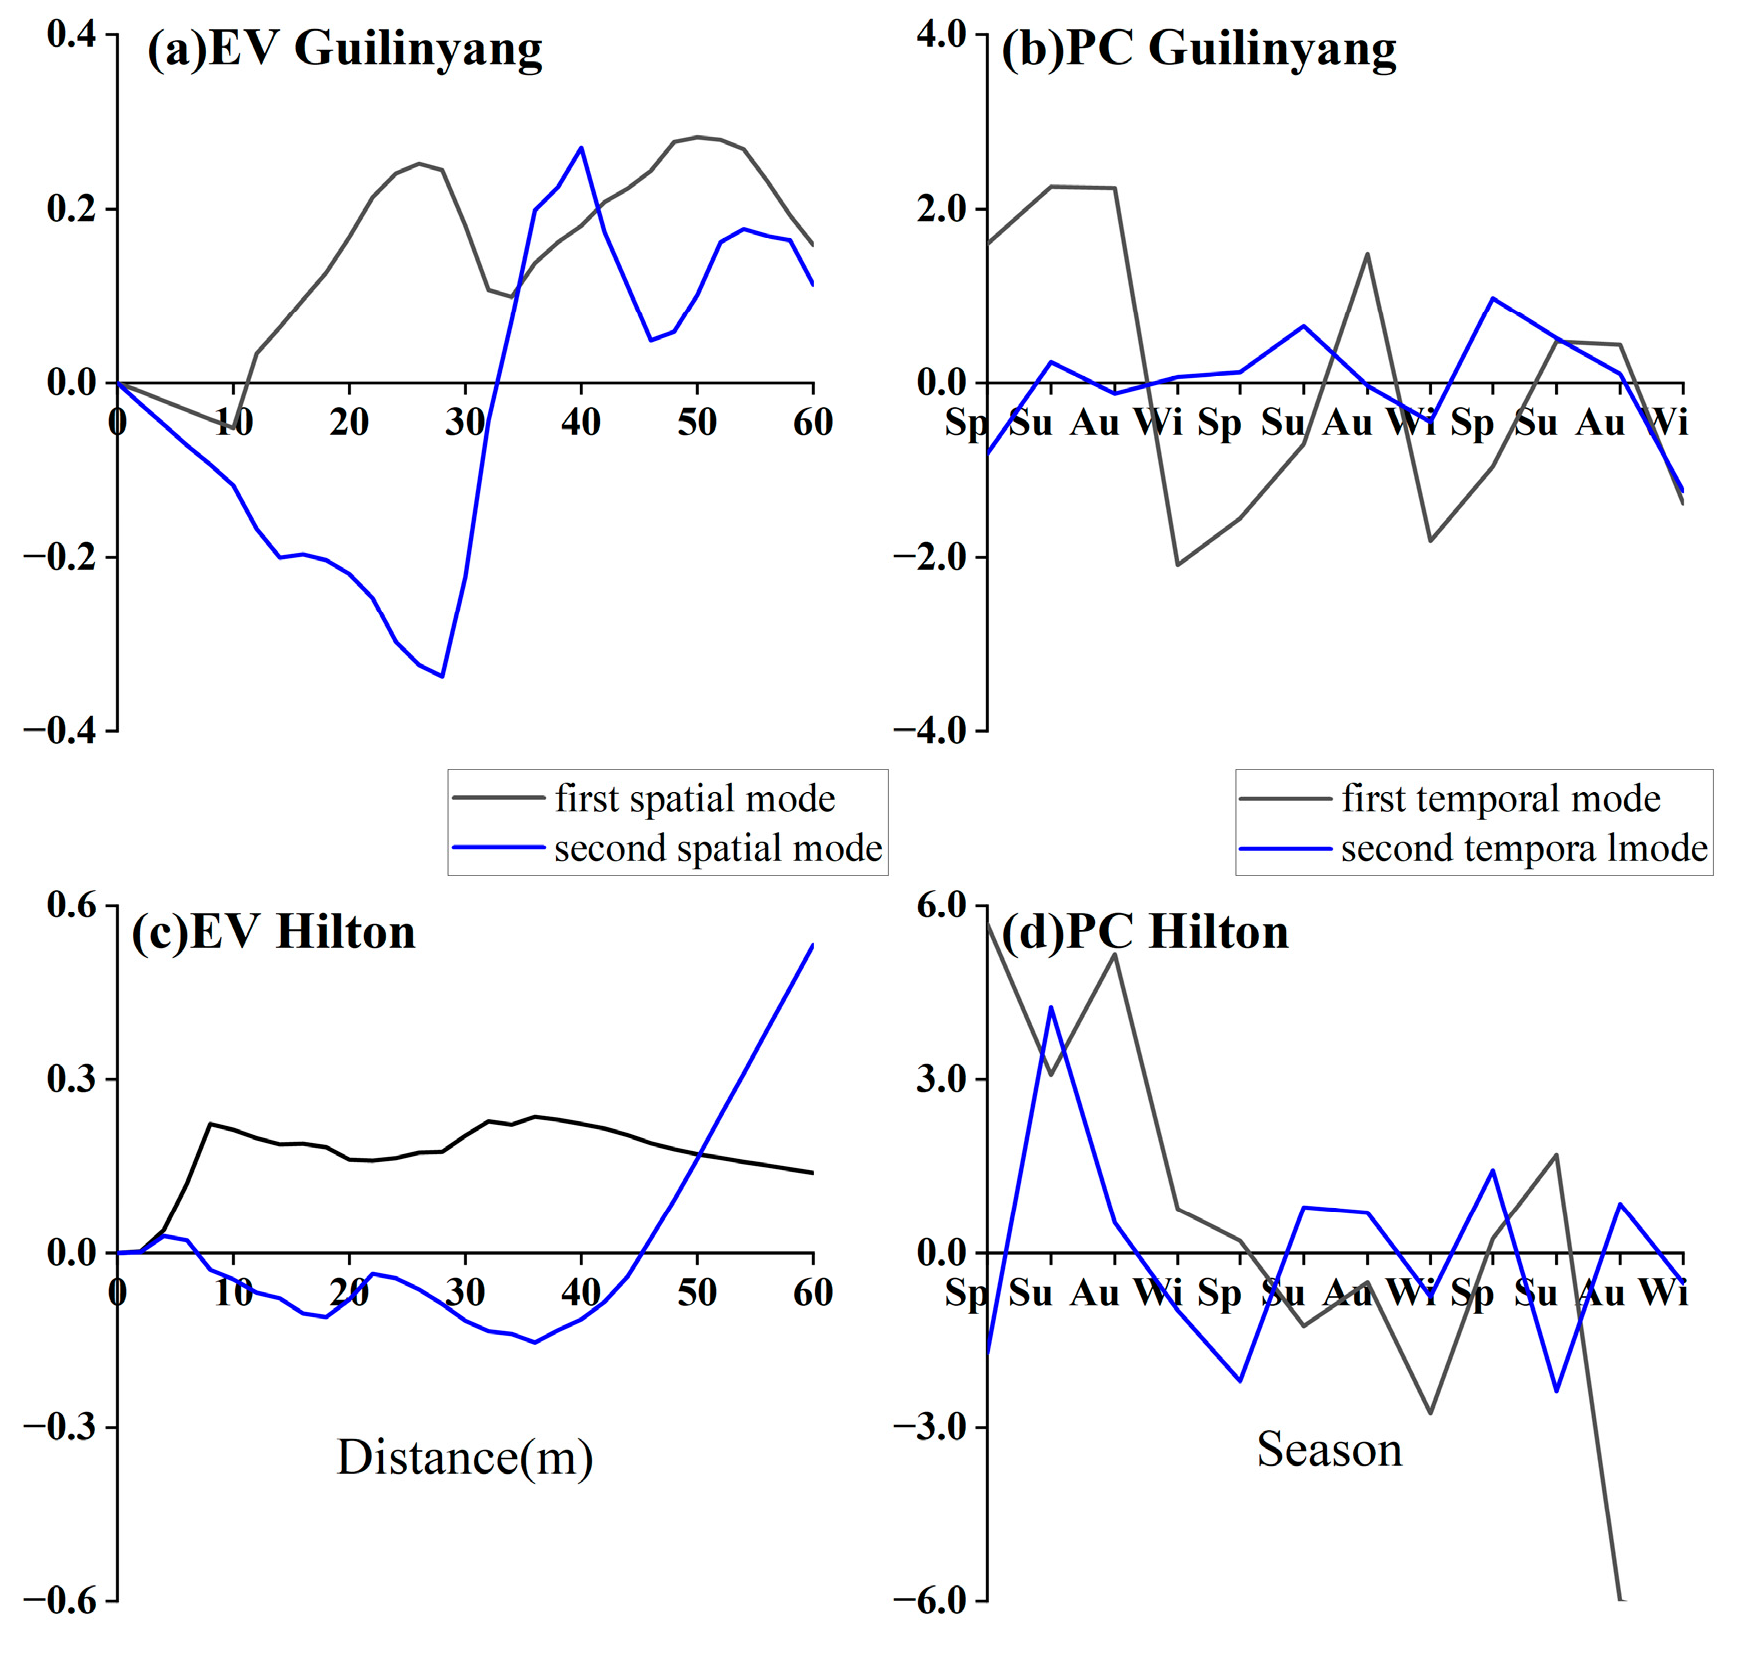
To explain the differences in morphodynamic responses of headland bay beaches under hydrodynamic forcing, we performed EOF analysis on two representative beach profiles. The first two modes accounted for more than 85% of the total variance, so the first and second modes were selected for detailed analysis (Figure 7).

4.1.1. Guilinyang Beach Profile Evolution: Natural Wave-Dominated, Sheltered Headland Bay Section

First Mode (Contribution: 75.27%): The first mode of the Guilinyang profile exhibits distinct seasonal accretion–erosion patterns. In the spatial mode, the berm shows an overall decrease in elevation, with amplitude fluctuations being more pronounced near the berm, and sediment accumulation at 30 m offshore is smaller than at the backshore nearshore (Figure 7a); sediment is transported offshore by undertow [37]. The temporal mode indicates profile rise in spring and summer, zero-crossings between autumn and winter, and pronounced oscillations (Figure 7b). During this period, sediment moves from nearshore to offshore, transported from the supratidal to the intertidal zone, associated with the “onshore–offshore” sediment transport cycle in the surf zone [38]. The first mode demonstrates clear winter–summer seasonal alternation, indicating that Guilinyang Beach morphology is primarily controlled by seasonal offshore wave direction variations, with limited influence from the artificial island.
Second Mode (Contribution: 10.89%): The second mode primarily reflects sandbar migration. In the spatial mode, the backshore undergoes erosion, while the foreshore exhibits minor accretion fluctuations; sediment changes between 20 and 32 m offshore (erosion) and 32–40 m offshore (accretion) are balanced (Figure 7a), indicating that cross-shore sediment transport is biased offshore, with sandbars migrating seaward under this mode. The temporal mode shows minor summer effects and enhanced influence during winter high tides, mainly in the subtidal zone. Seasonality is still present, but the amplitude is smaller than the first mode (Figure 7b). This indicates that local high-energy waves primarily influence subtidal sandbar evolution during winter, while overall profile changes remain dominated by the first mode.

4.1.2. Hilton Beach Profile Evolution: Erosional Open Headland Bay Section Under Artificial Island Influence

First Mode (Contribution: 75.83%): The first mode of the Hilton profile shows overall erosion, with minor spatial variation offshore. Its temporal mode exhibits weak regularity, continuously decreasing amplitude, and persistent negative correlation with beach profile changes. Seasonal variation is minimal, while long-term interannual differences from 2021 to 2023 are pronounced, indicating progressive erosion over time (Figure 7c,d). This phenomenon is strongly linked to changes in wave direction after artificial island construction, which altered alongshore sediment transport from eastward to westward, acting as the main driving factor [39].
Second Mode (Cumulative Contribution: 18.06%): The second spatial mode generates foreshore accretion while the backshore continues to erode. At 45 m offshore, partial sediment exchange occurs between the subtidal sandbar and beach face (Figure 7d), driving sediment from the berm and berm front to the offshore zone, forming sandbars in the subtidal area [26]. The temporal mode indicates slow onshore sediment transport during summer and extensive offshore transport during winter. Therefore, the second mode reflects surf zone sediment dynamics under hydrodynamic forcing, characterized by gradual onshore berm advance, erosion above the berm, and slow accretion below, consistent with measured profiles (Figure 4).
Overall, Guilinyang Beach morphology mainly exhibits seasonal accretion–erosion and sediment cycling between the supratidal and intertidal zones, with both spatial and temporal modes reflecting the effects of seasonal waves and showing limited influence from the artificial island. Hilton Beach shows long-term erosion, significant subtidal sandbar deposition, weak temporal mode regularity, and long-term negative correlation, indicating that the natural beach evolution pattern has been altered after artificial island construction (Figure 7).

4.2. Influence of the Artificial Island

The nearshore artificial construction of Ruyi Island in Puqian Bay has exerted a significant impact on the observed beaches. The wave rose diagram of Puqian Bay (Figure 2) indicates that, during winter, local waves predominantly approach from the north–northeast (NNE), with high frequency and strong energy. Prior to the construction of the artificial island, the dominant waves acted directly on the bay coastline, and the sedimentary patterns and energy distribution were relatively balanced. The sheltering and diffraction effects of the artificial island altered the northeastward wave direction, which is likely one of the major driving mechanisms behind the reduced sediment flux at Hilton Beach. This reorganization of hydrodynamic conditions has led to persistent erosion of the Hilton Beach profile; it is characterized by increased beach slope, profile retreat, and significant coarsening of sand grain size, consistent with the typical erosion mechanisms induced by alongshore sediment transport gradients in areas dominated by coastal currents [40,41].
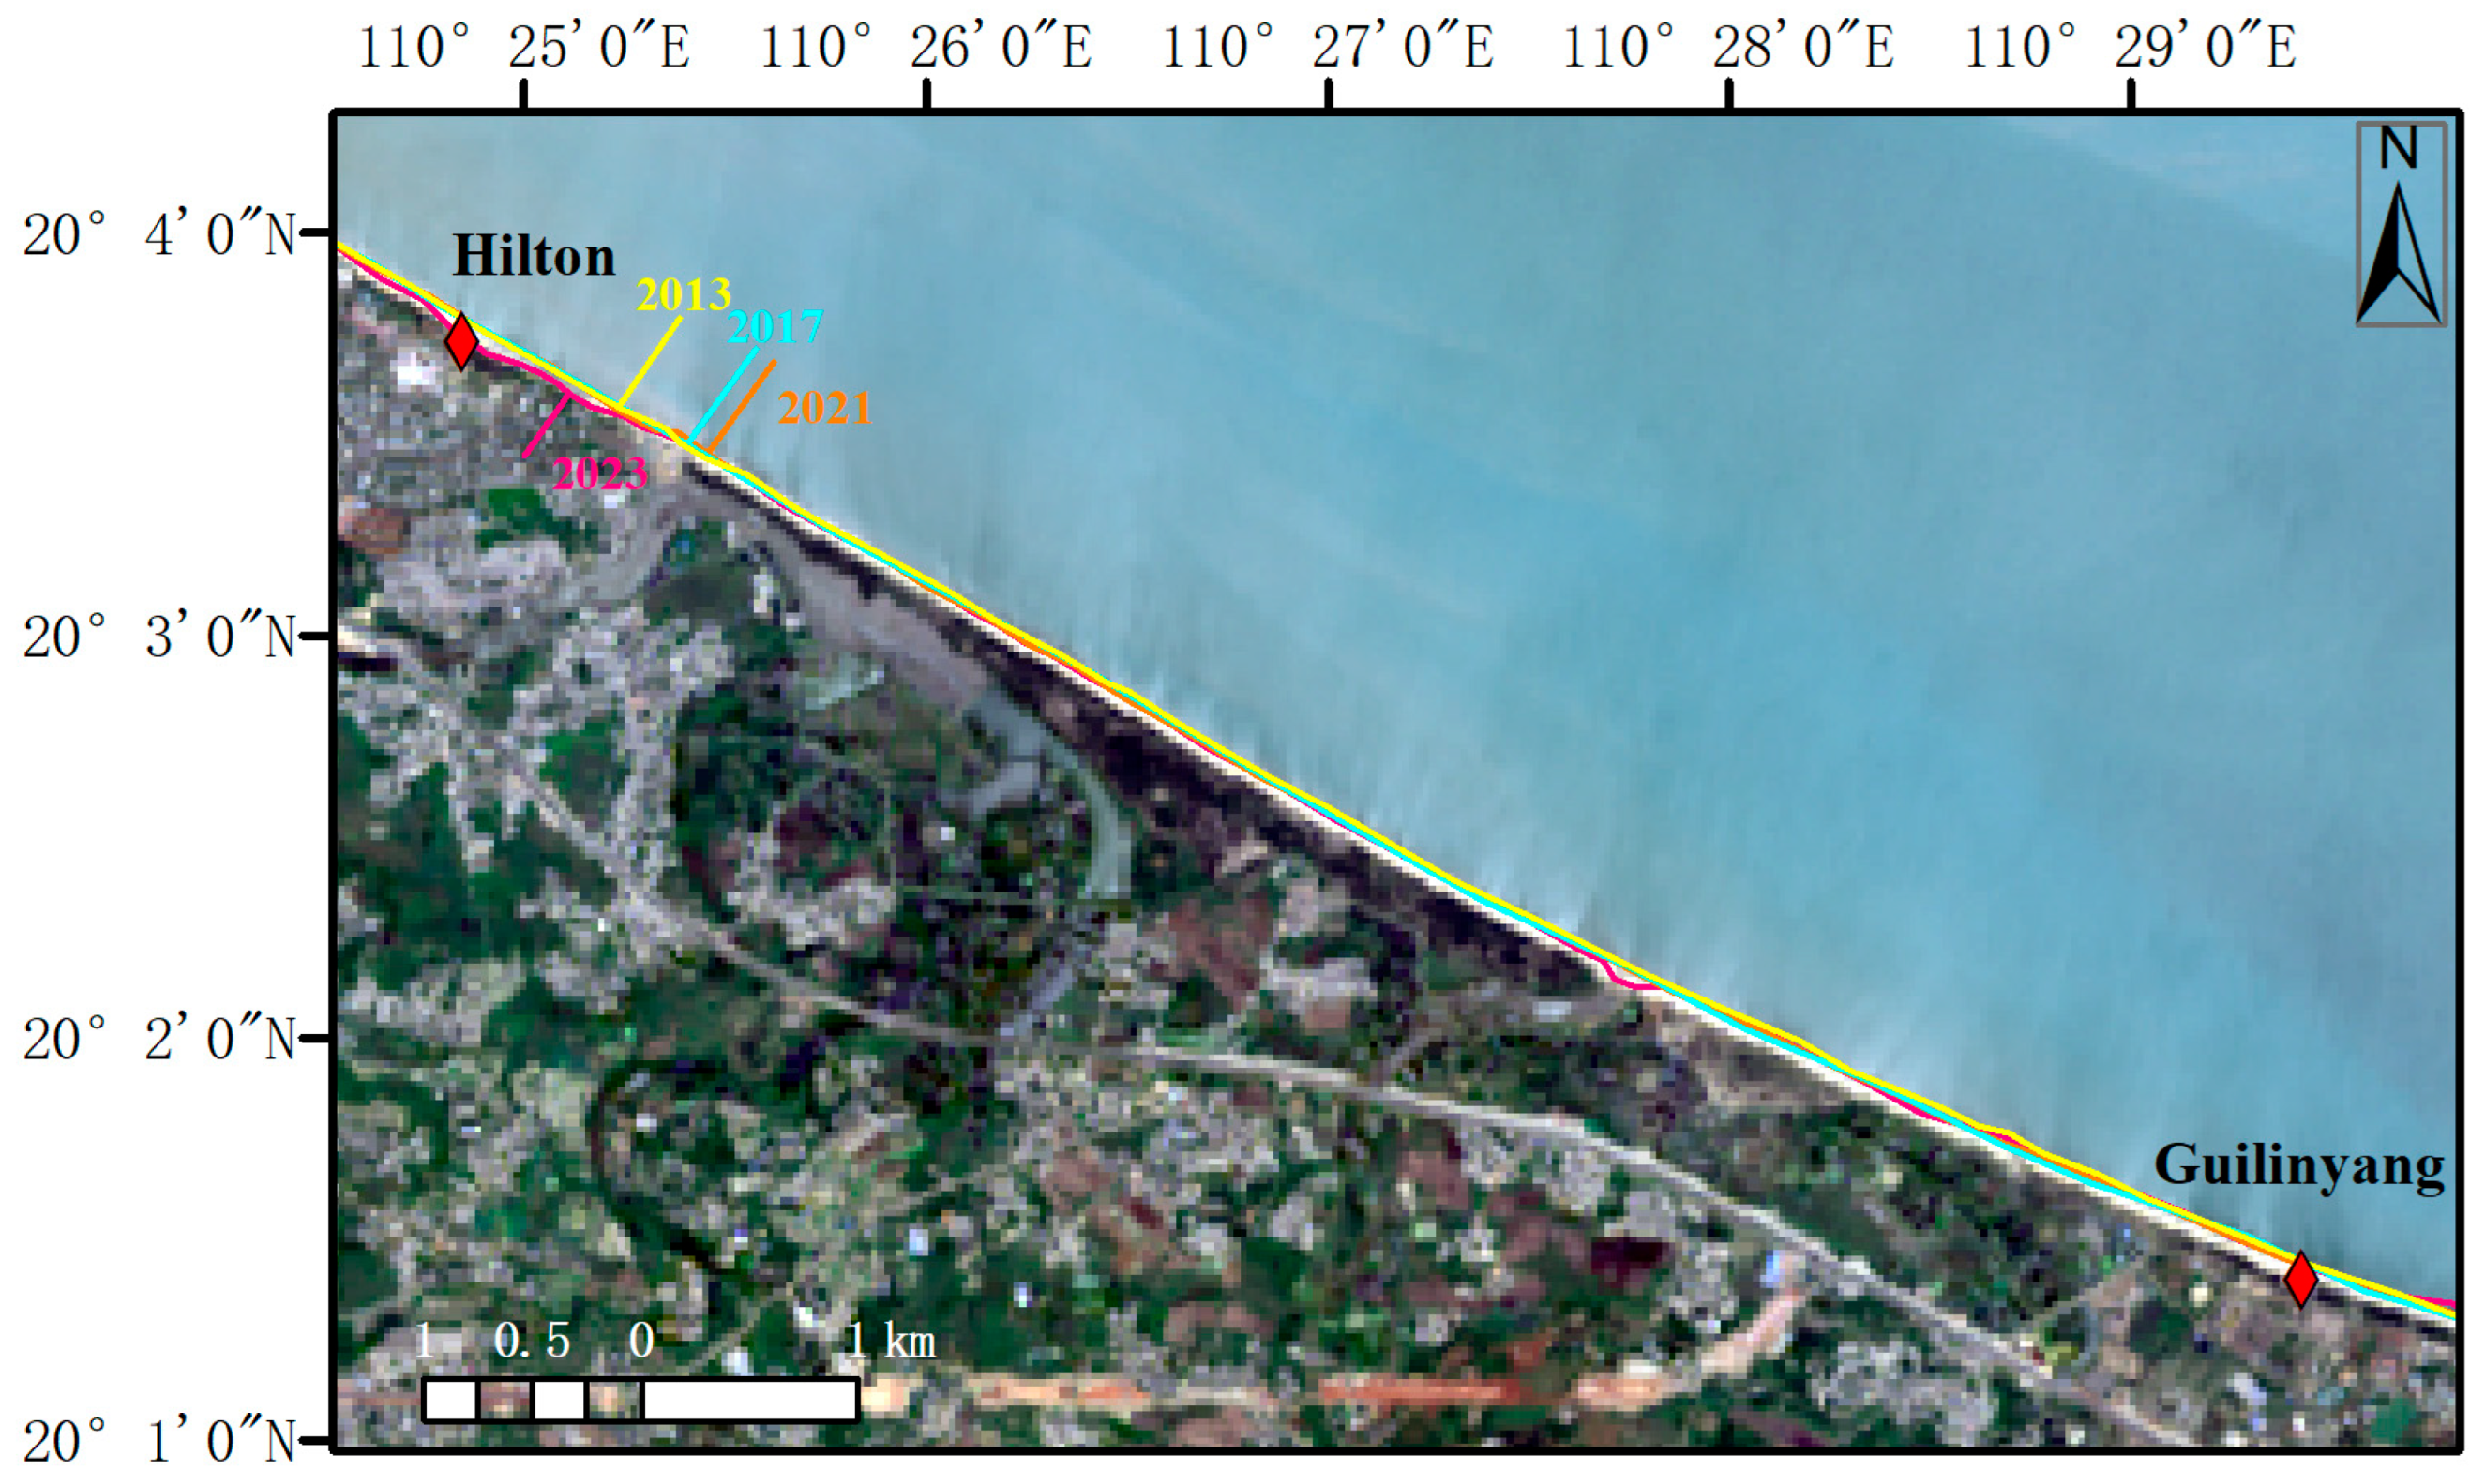
Remote sensing images of the coastline (Figure 8) show that the parallel shoreline segment beneath the artificial island, where Hilton Beach is located, falls within the shadow zone, experiencing continuous retreat. Since the commencement of the artificial island project in 2017, the rate of shoreline recession has accelerated; over the decade from 2013 to 2023, the maximum profile retreat in the shadow zone reached 64 m, while Hilton Beach retreated 27 m, including approximately 10 m between 2021 and 2023. In contrast, Guilinyang Beach exhibited minimal change. These observations are consistent with our profile monitoring results (Figure 4), which show the shoreline at Hilton Beach migrating landward, providing multi-directional evidence for the morphological changes induced by the artificial island. This observation aligns with the findings reported by Zhang Li [42], confirming that the artificial island has altered local coastal sedimentary dynamics. Similar phenomena were noted by Hu et al. (2024) based on satellite imagery analyses [29], where in Hong tang Bay, the updrift shoreline segment of Pearl Island experienced accretion, while the downdrift segment underwent erosion due to wave shadowing, demonstrating headland-like hydrodynamic obstruction and selective sedimentation effects.
In contrast, Guilinyang Beach is located in a laterally open zone on the leeward side of the artificial island, at a relatively greater distance, experiencing weak diffraction effects and situated within the headland bay’s sheltered area. The magnitude of morphological change is small, with seasonal summer-winter profile fluctuations within 0.7 m, minor berm accretion of approximately 0.1–0.4 m, and the maximum profile difference at 60 m offshore between 2023 and 2021 being only 1.45 m. The wide beach surface and gentle slope allow for relatively long migration distances of the sandbar crest, further enhancing the dissipation of high-energy waves and conferring substantial stability to the beach [43]. Our findings also provide empirical support for the inference that artificial structures can induce pronounced heterogeneity in coastal dynamics depending on their orientation and location [44,45].
It is evident that, after construction, the artificial island functions similarly to a headland, providing wave energy obstruction and diffraction, exhibiting characteristics of a detached artificial headland [46]. The wave energy is concentrated at the headland front, while the sheltered areas are distributed within the lateral bay zones, reconstructing the original wave propagation paths and sedimentary patterns of the bay. Consequently, the artificial island controls a new cycle of beach profile evolution and sedimentary dynamic differentiation throughout the bay. Through combined effects of wave attenuation, alongshore currents, and tidal flows, it modifies the nearshore dynamic feedback mechanisms [47] and may drive regional shoreline evolution on longer timescales.
On a seasonal scale, Hilton Beach exhibits a pronounced winter-strong and summer-weak hydrodynamic pattern. In winter, wave energy is high with long wavelengths, driving the primary erosion period. In summer, waves mainly approach from the south–southeast (SSE), and waves entering the bay are weakened by the headland influence and deflected away from the artificial island, reducing the shielding effect and slowing erosion rates. In contrast, Guilinyang exhibits small variations in hydrodynamic conditions, maintaining a dynamically balanced micro-erosion profile with minor summer accretion and winter erosion. Therefore, the artificial island likely influences wave propagation direction, inducing long-term and spatially selective differential responses in beach profiles across different areas of the headland bay.

4.3. Differences in Sediment Grain Size Characteristics

Variations in sediment grain size not only reflect the cross-shore erosion-deposition and hydrodynamic intensity but also reveal the heterogeneous responses of different locations within the headland bay under the same wave conditions [48,49,50]. Under similar-scale wave and climatic forcing, beaches typically show regionally coherent behavior [27]. However, structural circulation induced by headlands can significantly enhance lateral sediment transport [51].
Guilinyang and Hilton Beaches exhibit distinct grain-size evolution, consistent with their profile morphology changes. Beyond the typical differences between open and sheltered sections of the headland bay [52], the construction of the artificial island has created differentiated hydrodynamic environments on the east and west sides of the bay, further amplifying heterogeneity in alongshore sediment deposition.
Comparing the 2023 grain-size characteristics of Hilton Beach with measurements from 2022 and 2021, the profile’s sediment composition gradually became more complex. From being moderately sorted in 2021, it became poorly sorted by 2023, with pronounced sorting fluctuations. The monthly variation amplitudes of ∆σi in the supratidal, intertidal, and subtidal zones reached 0.39, 0.91, and 0.57, respectively. Months showing transitions toward poorer sorting generally occurred in early autumn, during which the subtidal zone, containing the coarsest particles, exhibited an increase in mean grain size from 1.63 φ to 0.28 φ. This corresponds to enhanced long-period waves in autumn and winter, combined with sediment redistribution driven by diffraction from the artificial island [52]. In addition, tidal currents are squeezed and converged through the narrow channel of the artificial island, and the unique reciprocating flows in the Qiong Zhou Strait [53] further contribute to the asymmetrical local hydrodynamic effects, as illustrated in Figure 9. This creates multi-directional energy convergence and strong sediment transport capacity, resulting in significant local erosion [54,55] and a mixture of coarse and fine sediments. Long-term uneven erosion and sediment supply cause the profile to accumulate coarse sand, showing a continuing coarsening trend. The sediment composition is expected to become increasingly complex, resulting in a looser beach structure.
In contrast, Guilinyang Beach is dominated by fine sand, with even distribution across tidal zones. Sorting remains between well sorted and moderately sorted, indicating high stability (Figure 6). Interannual variation is minor, showing a typical seasonal cycle: slight coarsening in summer, fine sediment replenishment in autumn, with wave dissipation and sheltering effects remaining stable. Compared with Hilton Beach, its profile morphology and grain-size evolution reflect natural seasonal patterns.
These sedimentary differences primarily result from the artificial island altering local wave propagation paths and alongshore current distribution. Hilton Beach is located in a wave energy-concentrated zone downstream of the island. It exhibits pronounced sediment exchange across tidal zones, tending toward uneven coarse-sand accumulation. Guilinyang Beach, in contrast, lies within the original sheltered environment of the headland bay, largely unaffected by wave diffraction from the artificial island, maintaining balanced sedimentation and fine-sand dominance with natural seasonal cycles. These differences are highly consistent with long-term profile trends, and ten-year shoreline changes observed in remote sensing imagery also confirm this pattern. On a seasonal scale, the grain-size evolution and profile changes at both beaches further demonstrate the amplifying effect of headland bay morphology on sediment dynamics [56]. Overall, the distinct hydrodynamic environments result in long-term differentiated responses between the two beaches. This mechanistic understanding provides empirical support for numerical modeling and offers scientific reference for artificial island construction and beach restoration.

4.4. Limitations and Implications of the Study

This study represents a descriptive, site-specific case investigation. Through three consecutive years of profile measurements and sediment sampling, combined with wave data and EOF analysis, it elucidates the mechanisms by which the artificial island affects wave propagation within the bay, alongshore sediment transport patterns and beach sedimentary responses. The addition of long-term field observations provides reference data for other headland bay beaches with artificial structures. It also offers theoretical support for regional coastal protection engineering.
However, several limitations remain. First, although the study period captures seasonal variations, the overall temporal scale is relatively short and does not include pre-construction sediment monitoring, limiting a comprehensive assessment of the combined effects of beach profiles and wave fields. Second, the study is based on two representative profiles, which reflect typical alongshore differences but may not fully capture spatial heterogeneity across a broader area. Third, while the comparison with shoreline changes derived from remote sensing corroborates the profile observations, the accuracy of shoreline retreat rates may be affected by image resolution and tidal conditions.
Future research could be advanced in the following aspects: expanding the coverage of profiles and sampling points, including sites with different geomorphic types and environmental conditions, to construct a more complete sediment budget and shoreline evolution pattern. This approach would further validate the generality of the identified hydrodynamic mechanisms and explore their broader applicability.

5. Conclusions

This study examined the interannual and seasonal morphodynamic and sedimentary responses of Puqian Bay beaches, as well as the impacts of the artificial island. The main conclusions are summarized as follows:
  • Beach profiles and sediment grain-size variations in Puqian Bay are governed by seasonal waves. Guilinyang Beach exhibits a seasonal accretion–erosion cycle with seaward sandbar migration, whereas Hilton Beach shows long-term erosion linked to changes in wave direction and artificial structures, reflecting spatial hydrodynamic differences and local geomorphologic control.
  • The construction of the artificial island altered wave propagation directions and energy distribution, reshaping sedimentary patterns in Puqian Bay. This has led to persistent erosion and sediment coarsening at Hilton Beach, demonstrating the “quasi-headland” effect of the artificial island, which has become a major factor governing beach profile evolution and sediment transport in the region.
This study is based on observations of beaches in different morphodynamic settings that exhibit clear responses to artificial structures. It provides long-term, high-frequency empirical data and addresses a gap in related research. The results show that artificial structures interact with natural coastal dynamics, and the sedimentary processes exhibit pronounced spatial and temporal variability. These findings not only offer a representative case for physical experiments and model predictions, but also indicate that coastal engineering design and planning should consider long-term passive erosion of beaches at larger scales. Overall, this work advances scientific understanding of coastal morphodynamics under engineering impacts.

Author Contributions

Conceptualization, Z.L.; methodology; software, X.W.; validation, Z.L., X.W., D.Z. and X.B.; formal analysis, X.W.; investigation, Z.L., X.W., D.Z., X.B. and Y.S.; resources, Z.L.; data curation, X.W.; writing—original draft preparation, X.W. and Z.L.; writing—review and editing, Z.L.; visualization, X.W. and Z.L.; supervision, Z.L.; project administration, Z.L.; funding acquisition, Z.L. All authors have read and agreed to the published version of the manuscript.

Funding

This work was supported by the National Natural Science Foundation of China [42176167]; the Guangdong Basic and Applied Basic Research Foundation [2024A1515011427].

Data Availability Statement

The data presented in this study are available upon request from the corresponding author.

Conflicts of Interest

The authors declare no conflicts of interest.

References

  1. Kulkarni, S.J.; Deshbhandari, P.G.; Jayappa, K.S. Seasonal variation in textural characteristics and sedimentary environments of beach sediments, Karnataka coast, India. Aquat. Procedia 2015, 4, 117–124. [Google Scholar] [CrossRef]
  2. Vila-Concejo, A.; Fellowes, T.E.; Gallop, S.; Alejo, I.; Angnuureng, D.B.; Benavente, J.; Bosma, J.W.; Brempong, E.K.; Dissanayake, P.; Gazi, Y.; et al. Morphodynamics and management challenges for beaches in modified estuaries and bays. Camb. Prism. Coast. Futures 2024, 2, e11. [Google Scholar] [CrossRef]
  3. Barbier, E.B.; Hacker, S.D.; Kennedy, C.; Koch, E.W.; Stier, A.C.; Silliman, B.R. The value of estuarine and coastal ecosystem services. Ecol. Monogr. 2011, 81, 169–193. [Google Scholar] [CrossRef]
  4. Di Paola, G.; Rodríguez, G.; Rosskopf, C.M. Shoreline Dynamics and Beach Erosion. Geosciences 2023, 13, 74. [Google Scholar] [CrossRef]
  5. Masselink, G.; Short, A.D. The effect of tide range on beach morphodynamics and morphology: A conceptual beach model. J. Coast. Res. 1993, 9, 785–800. [Google Scholar]
  6. Nnafie, A.; de Swart, H.E.; Falqués, A.; Calvete, D. Long-term morphodynamics of a coupled shelf-shoreline system forced by waves and tides: A model approach. J. Geophys. Res. Earth Surf. 2021, 126, e2021JF006315. [Google Scholar] [CrossRef]
  7. Rodriguez-Padilla, I.; Marino-Tapia, I.; De Alegria-Arzaburu, A.R. Daily timescale analysis of sediment transport and topographic changes on a mesotidal sandy beach under low to moderate wave conditions. Mar. Geol. 2024, 474, 107323. [Google Scholar] [CrossRef]
  8. Xu, W.; Chen, S.; Ji, H.; Hu, T.; Zhong, X.; Li, P. Dynamics of sandy shorelines and their response to wave climate change in the east of Hainan Island, China. J. Mar. Sci. Eng. 2024, 12, 1921. [Google Scholar] [CrossRef]
  9. Lazarus, E.D.; Harley, M.D.; Blenkinsopp, C.E.; Turner, I.L. Environmental signal shredding on sandy coastlines. Earth Surf. Dyn. 2019, 7, 77–86. [Google Scholar] [CrossRef]
  10. D’Alessandro, F.; Tomasicchio, G.R.; Frega, F.; Leone, E.; Francone, A.; Pantusa, D.; Foti, G. Beach–dune system morphodynamics. J. Mar. Sci. Eng. 2022, 10, 627. [Google Scholar] [CrossRef]
  11. Casamayor, M.; Alonso, I.; Valiente, N.G.; Sánchez-García, M.J. Seasonal response of a composite beach in relation to wave climate. Geomorphology 2022, 408, 108245. [Google Scholar] [CrossRef]
  12. Pradhan, U.; Mishra, P.; Mohanty, P.K. Beach and nearshore sediment textural characteristics of a monsoonal wave-dominated micro-tidal, human perturbed environment, Central East Coast of India. Arab. J. Geosci. 2022, 15, 667. [Google Scholar] [CrossRef]
  13. McFall Brian, C. The relationship between beach grain size and intertidal beach face slope. J. Coast. Res. 2019, 35, 1080. [Google Scholar] [CrossRef]
  14. Dean, R.G. Equilibrium beach profiles: Characteristics and applications. J. Coast. Res. 1991, 7, 53–84. [Google Scholar]
  15. Li, Y.; Yao, H.; Chen, Z.; Luo, W.; Zhang, S. Morphology and evolution of submarine sand ridges and sand waves off the southwestern coast of Hainan Island, China. Front. Mar. Sci. 2025, 12, 1561392. [Google Scholar] [CrossRef]
  16. Darsan, J. Beach morphological dynamics at Cocos Bay (Manzanilla), Trinidad. Atl. Geosci. 2013, 49, 151–168. [Google Scholar] [CrossRef]
  17. Qu, K.; Chen, K.; Wang, N.; Zheng, J.; Lu, P. Geomorphological processes following the construction of an offshore artificial island in the radial sand ridges of the South Yellow Sea. Coast. Eng. 2024, 192, 104545. [Google Scholar] [CrossRef]
  18. Chen, L.; Zhou, Z.; Xu, M.; Xu, F.; Tao, J.; Zhang, C. Exploring the influence of land reclamation on sediment grain size distribution on tidal flats: A numerical study. Coast. Eng. Proc. 2018, 1, 85. [Google Scholar] [CrossRef]
  19. Flemming, B.W.; Nyandwi, N. Land reclamation as a cause of fine-grained sediment depletion in backbarrier tidal flats (Southern North Sea). Neth. J. Aquat. Ecol. 1994, 28, 299–307. [Google Scholar] [CrossRef]
  20. Li, S.; Lv, B.; Yang, Y.; Yang, Y.; Wang, C. Effects of Offshore Artificial Islands on Beach Stability of Sandy Shores: Case Study of Hongtang Bay, Hainan Province. Front. Earth Sci. 2022, 16, 876–889. [Google Scholar] [CrossRef]
  21. Zhu, G.; Ren, B.; Wen, H.; Lin, P. Numerical simulation on the influence of artificial island on reef hydrodynamics. Appl. Ocean. Res. 2024, 153, 104266. [Google Scholar] [CrossRef]
  22. Lim, C.; Lim, T.M.; Lee, J.-L. Severe beach erosion induced by shoreline deformation after a large-scale reclamation project for the Samcheok liquefied natural gas (LNG) terminal in South Korea. Nat. Hazards Earth Syst. Sci. 2025, 25, 3239–3255. [Google Scholar] [CrossRef]
  23. Van Ginkel, M.; Olsthoorn, T.N. Distribution of grain size and resulting hydraulic conductivity in land reclamations constructed by bottom dumping, rainbowing and pipeline discharge. Water Resour. Manag. 2019, 33, 993–1012. [Google Scholar] [CrossRef]
  24. Ranasinghe, R.; Turner, I.L. Shoreline response to submerged structures: A review. Coast. Eng. 2006, 53, 65–79. [Google Scholar] [CrossRef]
  25. Kraus, N.C.; McDougal, W.G. The effects of seawalls on the beach: Part I, an updated literature review. J. Coast. Res. 1996, 12, 691–701. [Google Scholar]
  26. Harley, M.D.; Turner, I.L.; Short, A.D.; Ranasinghe, R. A reevaluation of coastal embayment rotation: The dominance of cross-shore versus alongshore sediment transport processes, Collaroy-Narrabeen Beach, southeast Australia. J. Geophys. Res. Earth Surf. 2011, 116, F04033. [Google Scholar] [CrossRef]
  27. Bracs, M.A.; Turner, I.L.; Splinter, K.; Short, A.D.; Mortlock, T.R. Synchronised patterns of erosion and deposition observed at two beaches. Mar. Geol. 2016, 380, 196–204. [Google Scholar] [CrossRef]
  28. Yuan, R.; Xu, R.; Zhang, H.; Hua, Y.; Zhang, H.; Zhong, X.; Chen, S. Detecting shoreline changes on the beaches of Hainan Island (China) for the period 2013–2023 using multi-source data. Water 2024, 16, 1034. [Google Scholar] [CrossRef]
  29. Hu, R.; Fan, Y.; Zhang, X. Satellite-derived shoreline changes of an urban beach and their relationship to coastal engineering. Remote Sens. 2024, 16, 2469. [Google Scholar] [CrossRef]
  30. Zhu, Y.; Zhou, Y.; Zeng, W.; Feng, W.; Jiang, Y. The feedback from a beach berm during post-storm recovery and how to improve the berms restorative efficiency. Water 2024, 16, 1955. [Google Scholar] [CrossRef]
  31. Tan, Z.; Lin, C.; He, S.; Lou, Q. Analysis of erosion and deposition evolution of the beach of Puqian Bay in Haikou. J. Mar. Sci. Technol. 2023, 42, 78–86. (In Chinese) [Google Scholar] [CrossRef]
  32. Wu, D.; Zhang, H.; Zhang, D.; Fu, G. Annual changes characteristics of beach topography in the northeastern bays of Hainan Province. Coast. Eng. 2021, 40, 29–36. (In Chinese) [Google Scholar] [CrossRef]
  33. Zhu, Y.; Zeng, W.; Zhou, Y.; Zhang, J. Shoreline behavior in response to coastal structures: A case study in Haikou Bay, China. Water 2024, 16, 3106. [Google Scholar] [CrossRef]
  34. U.S. Environmental Protection Agency. Methods for Collection, Storage and Manipulation of Sediment Samples for Laboratory Analysis; U.S. EPA: Washington, DC, USA, 2001. [Google Scholar]
  35. Folk, R.L. The distinction between grain size and mineral composition in sedimentary-rock nomenclature. J. Geol. 1954, 62, 344–359. [Google Scholar] [CrossRef]
  36. Miller, J.K.; Dean, R.G. Shoreline variability via empirical orthogonal function analysis: Part II relationship to nearshore conditions. Coast. Eng. 2007, 54, 133–150. [Google Scholar] [CrossRef]
  37. Hu, T.; Li, Z.; Zeng, C.; Li, G.; Zhang, H. Applications of EMD to analyses of high-frequency beachface responses to Storm Bebinca in the Qing’an Bay, Guangdong Province, China. Acta Oceanol. Sin. 2022, 41, 147–162. [Google Scholar] [CrossRef]
  38. Chen, W.; van der Werf, J.J.; Hulscher, S.J.M.H. A review of practical models of sand transport in the swash zone. Earth-Sci. Rev. 2023, 238, 104355. [Google Scholar] [CrossRef]
  39. Cao, L.; Xu, W.; Wang, P.; Shi, P.; Feng, W. Response of hydrodynamic and erosion–deposition pattern to artificial island construction in Puqian Bay. Mar. Lake Bull. 2013, 3, 161–171. (In Chinese) [Google Scholar] [CrossRef]
  40. Davidson-Arnott, R.; Bauer, B.; Houser, C. Introduction to Coastal Processes and Geomorphology; Cambridge University Press: Cambridge, UK, 2019. [Google Scholar]
  41. Anthony, E.J. Beach erosion. In Encyclopedia of Coastal Science; Springer: Cham, Switzerland, 2019; pp. 234–246. [Google Scholar]
  42. Zhang, L.; Qian, D. Impact of artificial island construction on the shoreline of Puqian Bay. China Water Transp. 2017, 17, 234–237. (In Chinese) [Google Scholar]
  43. Kuriyama, Y. Medium-term bar behavior and associated sediment transport at Hasaki, Japan. J. Geophys. Res. Ocean. 2002, 107, 15-1–15-12. [Google Scholar] [CrossRef]
  44. Ge, L.; Xu, Y.; Kang, G.; Chen, S. Experimental Study on Beach Restoration under the Influence of Artificial Islands. Water 2025, 17, 972. [Google Scholar] [CrossRef]
  45. Liu, G.; Qi, H.; Cai, F.; Zhu, J.; Zhao, S.; Liu, J.; Lei, G.; Cao, C.; He, Y.; Xiao, Z. Initial Morphological Responses of Coastal Beaches to a Mega Offshore Artificial Island. Earth Surf. Process. Landf. 2022, 47, 1355–1370. [Google Scholar] [CrossRef]
  46. Pan, Y.; Kuang, C.; Chen, Y.; Yin, S.; Yang, Y.; Zhang, J.; Qiu, R.; Zhang, Y. A Comparison of the Performance of Submerged and Detached Artificial Headlands in a Beach Nourishment Project. Ocean. Eng. 2018, 159, 295–304. [Google Scholar] [CrossRef]
  47. Fu, G.; Li, J.; Yuan, K.; Song, Y.; Fu, M.; Wang, H.; Wan, X. Wind-Wave-Current Coupled Modeling of the Effect of Artificial Island on the Coastal Environment. Appl. Sci. 2023, 13, 7171. [Google Scholar] [CrossRef]
  48. Huisman, B.J.A.; De Schipper, M.A.; Ruessink, G.B. Sediment Sorting at the Sand Motor at Storm and Annual Time Scales. Mar. Geol. 2016, 381, 209–226. [Google Scholar] [CrossRef]
  49. Guillén, J.; Hoekstra, P. The “Equilibrium” Distribution of Grain Size Fractions and Its Implications for Cross-Shore Sediment Transport: A Conceptual Model. Mar. Geol. 1996, 135, 15–33. [Google Scholar] [CrossRef]
  50. Lamy, A.; Robin, N.; Smyth, T.A.G.; Hesp, P.A.; René, C.; Feyssat, P.; Raynal, O.; Hebert, B. Impact of Temporal Beach Grain Size Variability on Aeolian Sediment Transport and Topographic Evolution in a Microtidal Environment. Geomorphology 2024, 453, 109126. [Google Scholar] [CrossRef]
  51. Wishaw, D.; Leon, J.X.; Barnes, M.; Fairweather, H. Tropical Cyclone Impacts on Headland Protected Bay. Geosciences 2020, 10, 190. [Google Scholar] [CrossRef]
  52. Wright, L.D.; Short, A.D. Morphodynamic Variability of Surf Zones and Beaches: A Synthesis. Mar. Geol. 1984, 56, 93–118. [Google Scholar] [CrossRef]
  53. Saengsupavanich, C.; Ariffin, E.H.; Yun, L.S.; Pereira, D.A. Environmental Impact of Submerged and Emerged Breakwaters. Heliyon 2022, 8, e12626. [Google Scholar] [CrossRef]
  54. Chen, L.; Lin, G.; Gong, W. The impact of artificial island construction on the headland vortex and bed level change in headland–bay coastal systems: A case study in Puqian Bay, Hainan Island. J. Coast. Res. 2023, 39, 1123–1138. (In Chinese) [Google Scholar]
  55. Kuhnle, R.A.; Jia, Y.; Alonso, C.V. Measured and Simulated Flow Near a Submerged Spur Dike. J. Hydraul. Eng. 2008, 134, 916–924. [Google Scholar] [CrossRef]
  56. Harley, M.D.; Turner, I.L.; Short, A.D. New Insights into Embayed Beach Rotation: The Importance of Wave Exposure and Cross-Shore Processes. J. Geophys. Res. Earth Surf. 2015, 120, 1470–1484. [Google Scholar] [CrossRef]
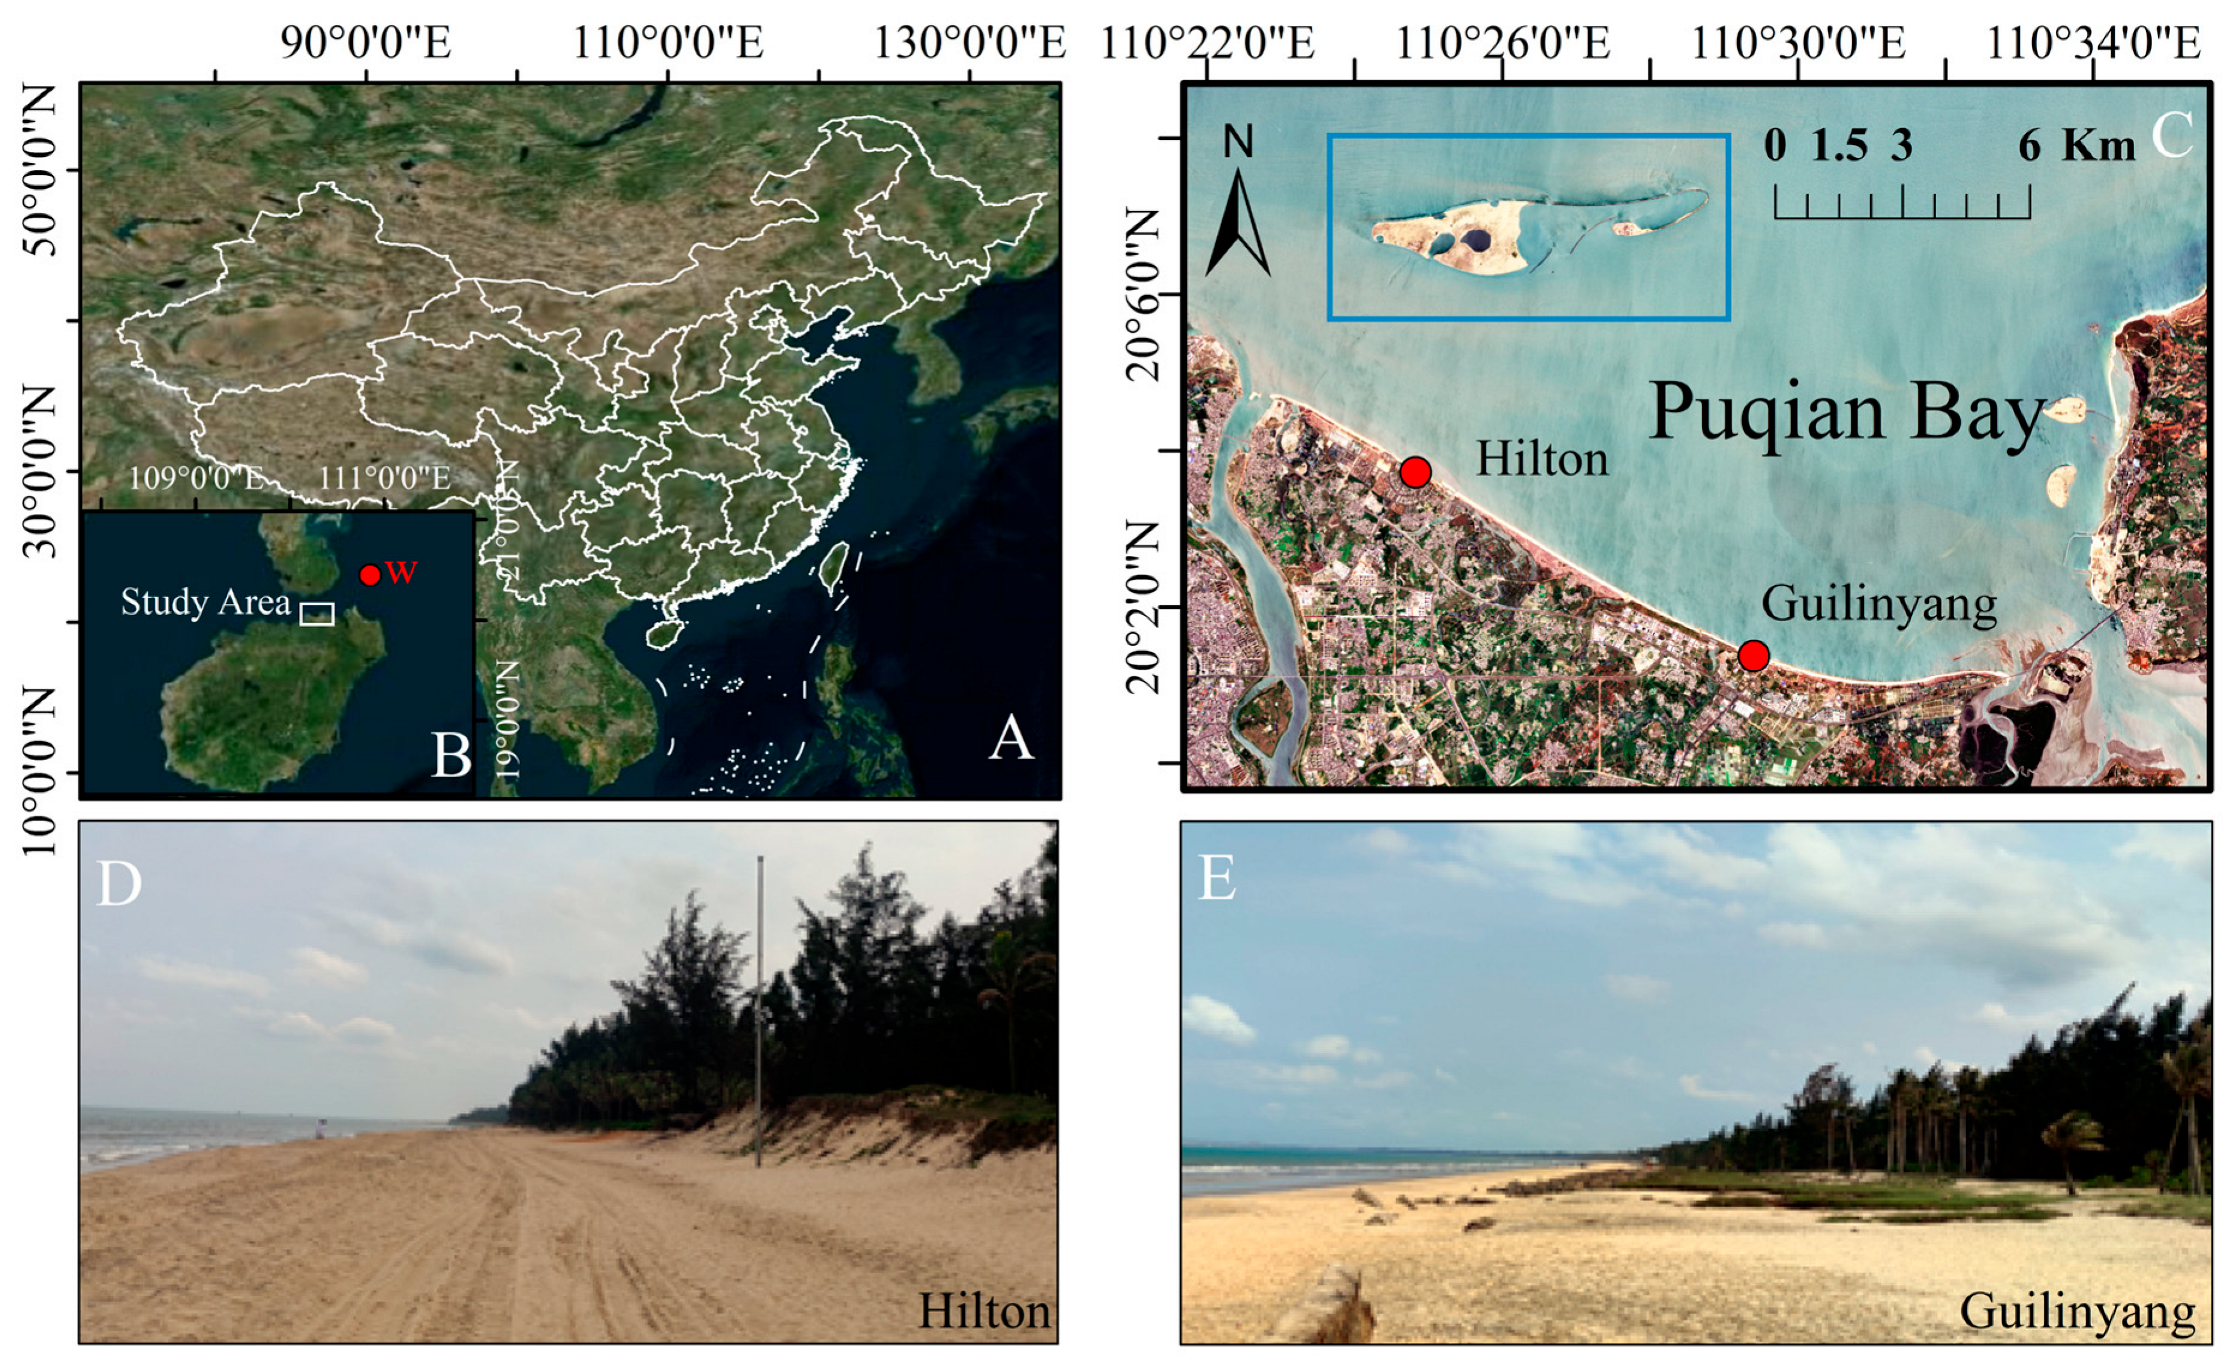
Figure 1. Location of the study area and field profiles in Puqian Bay. ((A,B): Location of the study area, with point W representing the wave measurement site; (C): Locations of Hilton and Guilinyang sampling points and the artificial island within the bay; (D): Measured profile of Hilton Beach; (E): Measured profile of Guilinyang Beach).
Jmse 13 01930 g001
Figure 2. Wave rose in Puqian Bay, 2021–2023.
Jmse 13 01930 g002
Figure 3. Flowchart of data collection.
Jmse 13 01930 g003
Figure 4. Temporal evolution of beach profiles. (ac) Guilinyang Beach profiles in 2021, 2022, and 2023; (df) Hilton Beach profiles in 2021, 2022, and 2023.
Jmse 13 01930 g004
Figure 5. Grain size frequency distributions of surface sediments.
Jmse 13 01930 g005
Figure 6. Temporal variation of sediment parameters. ((a,b): Mean grain size; (c,d): sorting).
Jmse 13 01930 g006
Figure 7. Principal spatial and temporal modes of Guilinyang and Hilton headland-bay beaches.
Jmse 13 01930 g007
Figure 8. Shoreline changes from 2013 to 2023 derived from Landsat satellite imagery.
Jmse 13 01930 g008
Figure 9. Schematic diagram of current transformation in Puqian Bay under the influence of the artificial island.
Jmse 13 01930 g009
Disclaimer/Publisher’s Note: The statements, opinions and data contained in all publications are solely those of the individual author(s) and contributor(s) and not of MDPI and/or the editor(s). MDPI and/or the editor(s) disclaim responsibility for any injury to people or property resulting from any ideas, methods, instructions or products referred to in the content.