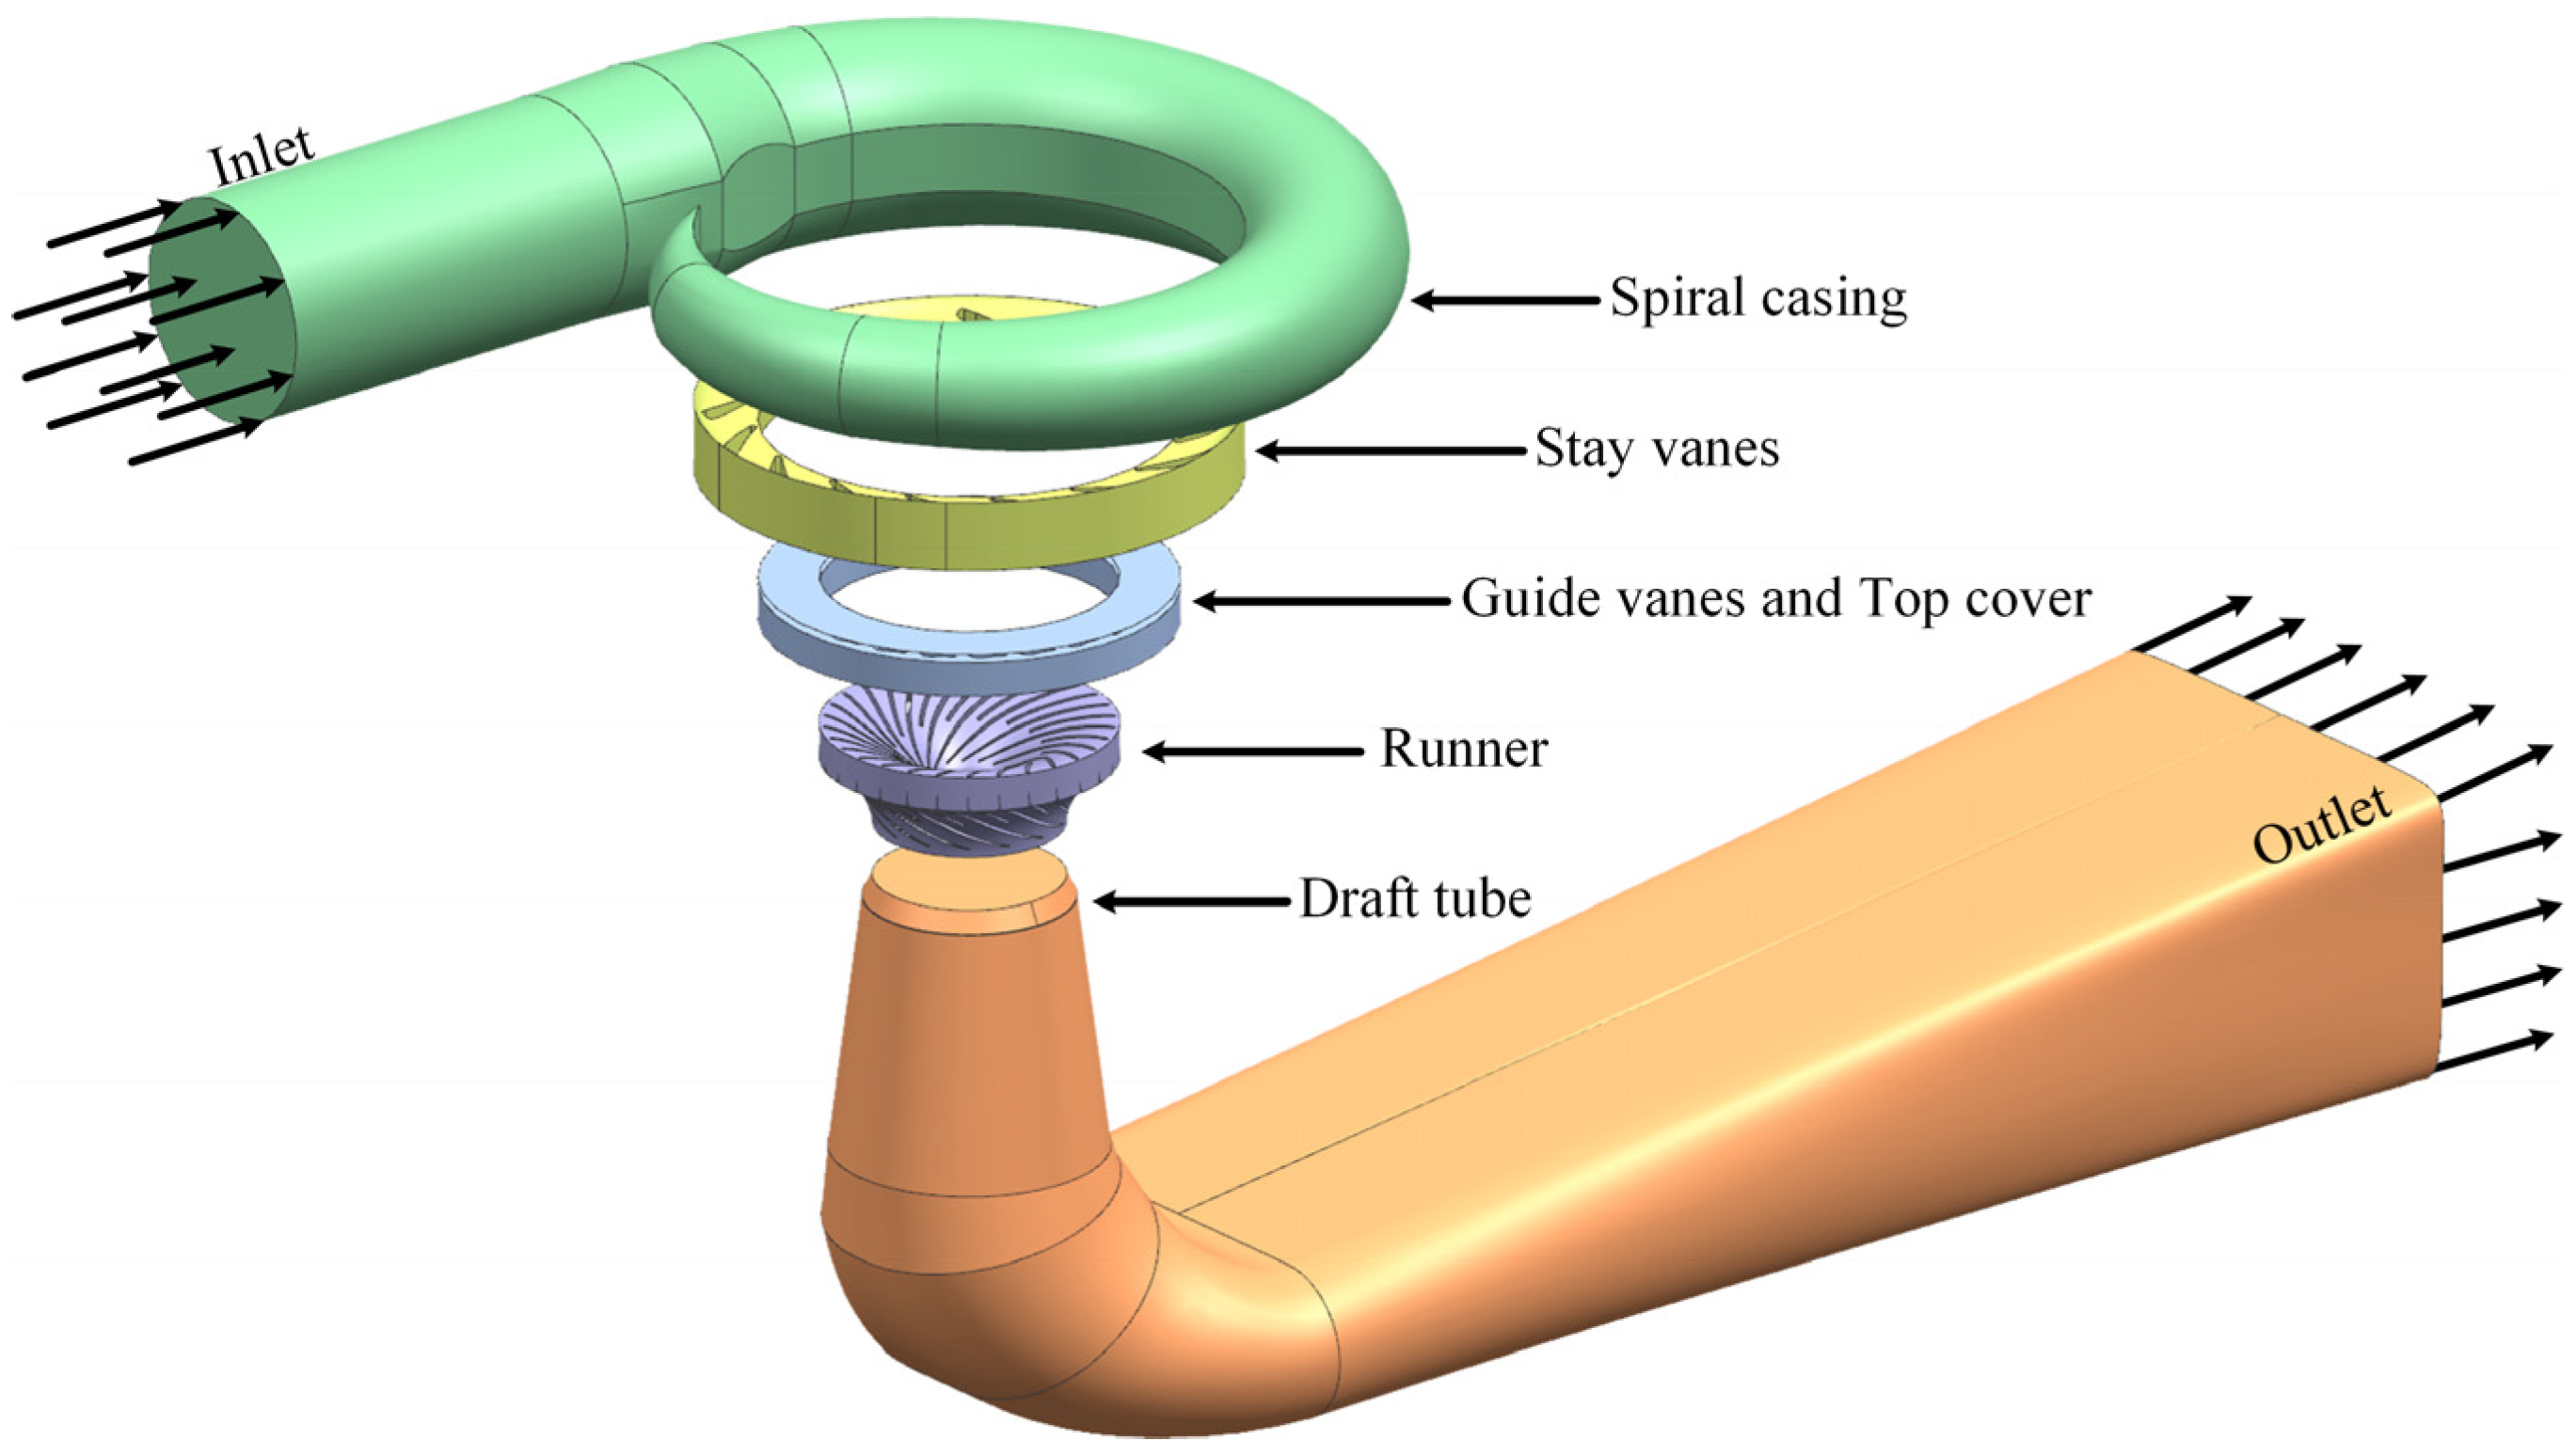
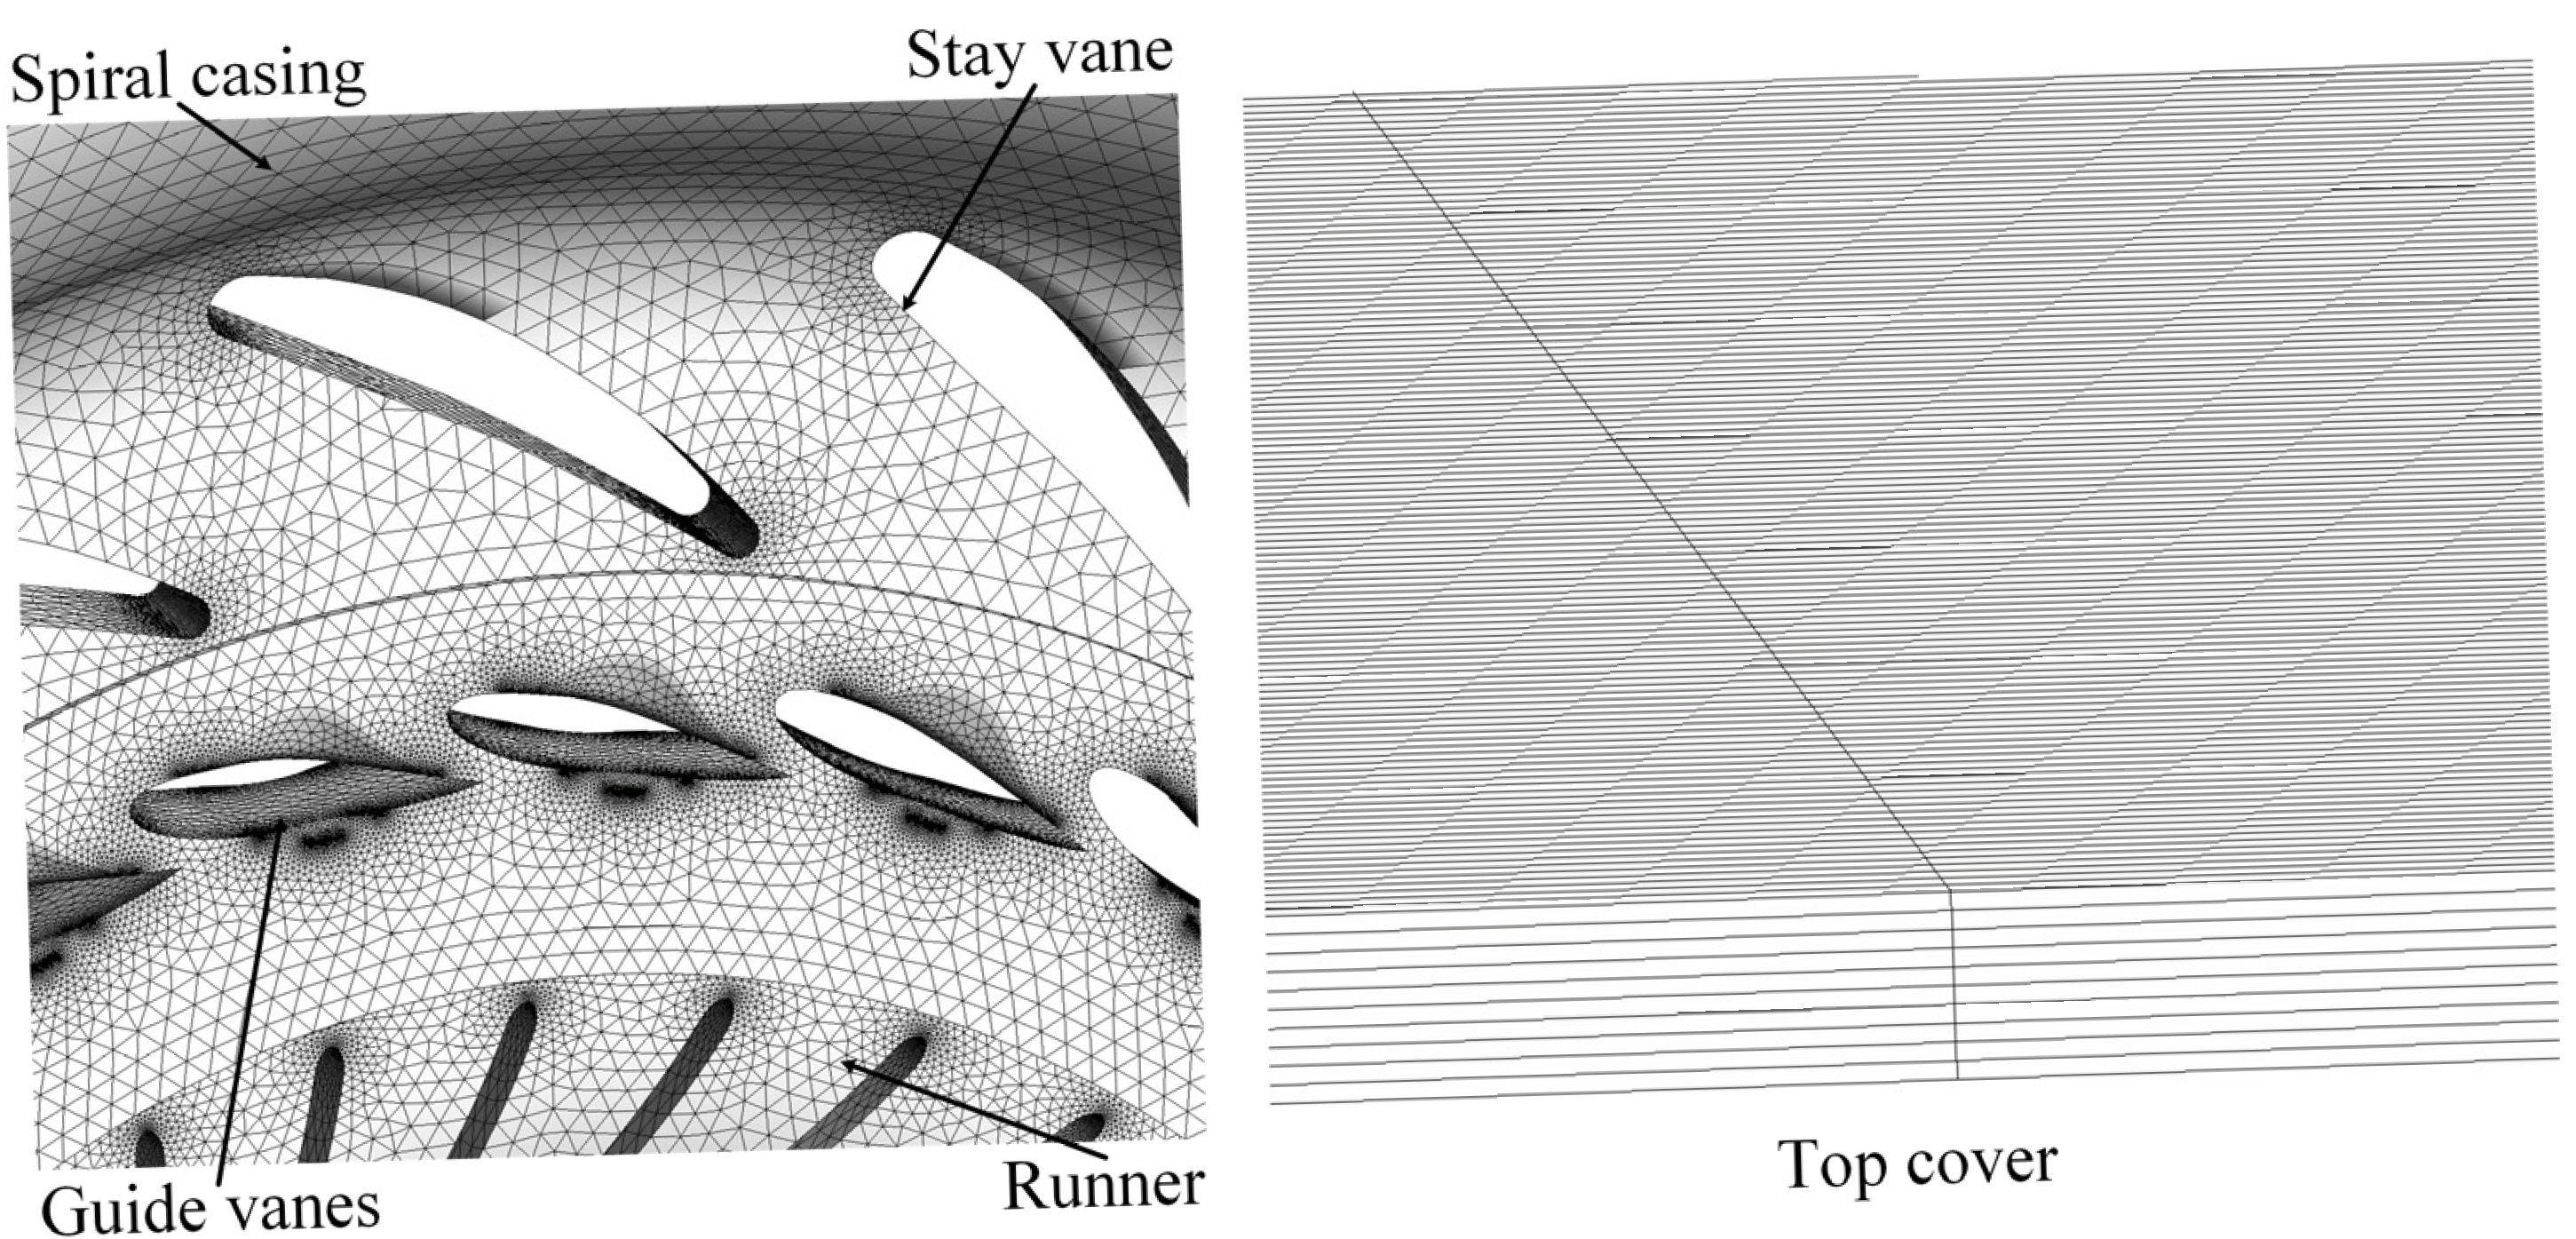
1. Introduction
The safe, steady, and efficient operation of hydraulic turbines is essential to the overall functionality of hydropower-producing facilities. Sediment-laden rivers, sediment erosion, or the combined impact of sediment erosion and cavitation significantly contribute to the deterioration of flow-passing components of turbines, resulting in performance degradation, efficiency loss, reduced service life, and potential structural damage. The Francis turbines, owing to their extensive employment, experience severe sediment erosion in the guiding vane area, characterized by elevated flow velocities and complicated flow patterns. The guide vane top cover, a key sealing and supporting component, is particularly susceptible to erosion failure due to the constant impact of high-velocity sediment-laden flow. This not only raises maintenance expenses and downtime but also poses a direct threat to the safe and stable functioning of the power station.
Recent years have witnessed substantial advancements in the study of solid–liquid two-phase flow and sediment erosion in hydraulic turbines. Liu Xiaobing [
1] developed a
k-
ε two-equation turbulence model and a volume fraction turbulence model to simulate turbulent solid–liquid two-phase flow and to estimate wall sediment erosion in hydraulic machinery channels. Min Su Roh et al. [
2] formulated an optimization model for the blade angles of Francis turbines, utilizing response surface methods and numerical simulations, resulting in an efficiency enhancement of up to 1.42% while sustaining an output power of 30 MW. Biraj Singh Thapa et al. [
3] developed an improved empirical model for sediment erosion in Francis turbine runners, establishing a predictive method that demonstrates good agreement with field measurement data. Ujjwal et al. [
4] conducted a numerical analysis of a Francis turbine to identify places susceptible to erosion and examine the correlation between sediment characteristics and sediment erosion. Wei Xinyu et al. [
5] investigated sediment erosion in turbines functioning in hilly rivers, demonstrating the relationship between inter-blade vortices and erosion distribution based on actual sediment gradation and flow characteristics. Acharya N. et al. [
6] integrated numerical simulation with experimental validation to systematically investigate leakage vortices and corresponding sediment erosion mechanisms in the guide vane and rotor-stator gaps of a Francis turbine at the Bhilangana III Hydroelectric Project in India, emphasizing the influence of these flow structures on overall turbine performance. Poudel R. et al. [
7] performed experiments on a Francis model turbine within a non-circulating sediment test rig, employing visual coating techniques to qualitatively assess erosion on the runner and guide vanes across diverse operating conditions, while quantitatively measuring cumulative erosion rates and mass loss percentages for a brass runner subjected to elevated sediment concentrations. Zhao Zilong et al. [
8] suggested a passive flow control technique utilizing biomimetic protuberances. Utilizing integrated numerical and experimental methodologies, they evidenced that these structures can diminish sediment erosion by over 50% by inhibiting inter-blade vortex formation, generating small-scale vortices, and expediting vortex dissipation. Longgang Sun et al. [
9] utilized numerical simulations to examine the effects of sediment concentration, particle size, and operational parameters on sediment erosion in high-head Francis turbines, proposing a multi-condition, multi-objective optimization design methodology that balances erosion resistance and hydraulic efficiency. B. Rajkarnikar et al. [
10] developed a rotating disc apparatus specifically designed for testing sediment erosion on Francis turbine runner blades under high-sediment flow conditions in Nepal, thereby validating the susceptibility of conventional design methodologies to material damage in such operating environments. Wang et al. [
11] employed the Tabakoff-Grant erosion model and the ZGB cavitation model to investigate the factors contributing to erosion in guide vane of high-head power stations and suggested solutions to mitigate sediment erosion. Zhao Zilong et al. [
12] employed a dynamic mesh-based Eulerian–Lagrangian methodology to elucidate the mechanism by which the interaction between leakage flow and main flow generates leakage vortices, resulting in significant erosion in critical regions such as the top cover, thereby clarifying the coupling effect between erosion deformation and alterations in the flow field. Song Xiji et al. [
13] enhanced the gap erosion model and illustrated that particle size substantially influences particle impact characteristics in gap flow, intensifying erosion around the guide vane jet and runner crown, thus predominating energy dissipation. Zhou Ziyao et al. [
14] developed a single-channel sediment erosion testing apparatus utilizing numerical simulation and similarity theory, investigating the solid–liquid two-phase flow characteristics and sediment erosion mechanisms in the Francis-99 turbine under sediment-laden conditions, and performed sediment erosion tests on its guiding components. Pang Jiayang et al. [
15] employed a
k-
ε multiphase turbulence model to numerically simulate sediment-laden flow in both long- and short-blade Francis turbines for high-head applications in the Min River, and developed a calculation formula for the sediment erosion rate of 0Cr13Ni5Mo material flow-passing components based on experimental investigations. Rakish Shrestha et al. [
16] has systematically reviewed experimental research methodologies and findings on sediment erosion in hydraulic machinery, identifying Francis turbine guide vanes and runners as critical components susceptible to erosion, thereby synthesizing quantitative models for erosion prediction and associated experimental simplification strategies.
To limit sediment erosion, the industry has taken numerous methods, including better hydraulic design, the use of wear-resistant materials, altered operational tactics, and improved sediment evacuation facilities. Among these, the precise control of the internal flow field within the turbine is recognized as a significant technical avenue. Ravi Koirala et al. [
17] conducted a computational analysis of the impact of guide vane clearance on the overall performance of a Francis turbine and integrated the findings with empirical correlations to forecast clearance leakage flow. Chitrakar S. et al. [
18] conducted a literature survey that elucidated the interplay between sediment erosion and secondary flow effects, which together result in heightened losses, vibrations, fatigue, and turbine failure. They deliberated on mitigating cumulative impacts by regulating either sediment erosion or secondary flow in turbines and underscored the necessity of comprehending the interplay between these two phenomena. Ravi Koirala et al. [
19] employed numerical simulations and rotating disc experiments to demonstrate that non-symmetric airfoil guide vanes can effectively balance erosion resistance requirements with performance stability in Francis turbines operating under sediment-laden flow conditions, thereby providing an optimized design solution for hydropower plants facing severe abrasion issues. Thapa et al. [
20] revealed that sediment erosion can lead to an increase in the clearance between the guide vanes and the top cover in low-specific-speed Francis turbines. Due to the pressure gradient between the surfaces of the guide vanes, leakage flow is generated within this gap. Khullar et al. [
21] investigated the impact of non-uniform variations in the clearance between the guide vanes and the top cover on both erosion and leakage flow. Gautam S. et al. [
22] conducted a numerical simulation utilizing the replacement gap approach, indicating that the vortex intensity induced by the guide vane clearance leakage flow in a Francis turbine increases with the enlargement of the clearance. They also found that asymmetric guide vanes can lessen the vortex velocity. The pressure pulsations induced by this leakage flow exhibit a frequency of half the rotational frequency and are identified as the principal cause of sediment erosion in the runner of low-specific-speed units. Jin Zhiqiang et al. [
23] applied the Eulerian-Lagrangian technique coupled with the Tabakoff erosion model, indicating that a smaller guide vane aperture in a Francis turbine leads to a more substantial impact on the vortex structures and particle distribution within the runner. Biraj Singh Thapa et al. [
24] conducted research on a guide vane cascade, discovering that when the guide vane clearance in a Francis turbine climbs to 2 mm, the leakage flow interacts with the main flow, generating vortices that enter the runner. This leads in the relative velocity at the crown at the runner inlet increasing up to thrice, highlighting the significant influence of clearance expansion on the runner’s flow characteristics. Saroj Gautam et al. [
25] concentrated on a low-specific-speed Francis turbine in an Indian power station. Through numerical simulations, they identified the guide vane clearance leakage flow as the main cause of erosion at the runner blade inlet and confirmed a positive association between the size and shape of quartz particles and the erosion rate. Jianjun Feng et al. [
26] compared CFD results with model experiments, demonstrating that the disc friction loss in a Francis turbine runner increases with the unit speed, with a bigger contribution from the shroud surface. While an increase in clearance reduces the total friction loss, it results in a drop in efficiency. Their findings proved the accuracy of CFD in estimating hydraulic efficiency around the optimal efficiency point. Ravi Koirala et al. [
27], through guide vane cascade studies, observed that, after sediment erosion begins on Francis turbine guide vanes, the pressure on both sides of the blade and at the outlet increases dramatically. This illustrates the important importance of erosion morphology on the flow parameters in the guide vane region. Sailesh Chitrakar et al. [
28] investigated the issue of guide vane clearance wear in a Francis turbine at a power station in Nepal. Ravi Koirala et al. [
29] carefully examined the erosion of Francis turbine guide vanes in sediment-laden water, uncovering intricate flow modifications generated by erosion, such as lateral clearance flow and trailing edge leakage, and their impact on hydraulic performance. Kumar Sahu Rohit et al. [
30] performed a comprehensive analysis of the erosion mechanism of Francis turbine guide vanes in sediment-laden flow. They highlighted flow anomalies generated by erosion, including secondary flows and horseshoe vortices, and their implications on unit efficiency, combining findings from field observations, experiments, and numerical models. Their research demonstrates that regions dominated by complex secondary flows and tip leakage flows are prone to forming zones characterized by high flow velocity, intense shear, and low pressure. These conditions can induce cavitation and exacerbate impact wear from sediment particles, making such areas critical targets for erosion mitigation strategies.
In contrast to previous studies, this paper systematically investigates the effects of guide vane top cover clearance height (0.3, 0.5, 1.0 mm) on the internal flow field and sediment wear of the top cover plate in the Francis turbine of the Gengda Power Station under sediment-laden flow. Based on full-passage numerical simulation results, an experimental test section satisfying dynamic similarity was designed, and comparative wear tests were conducted on the base material (cast steel) and the wear-resistant plate material (04Cr13Ni5Mo). Furthermore, a mathematical model for the sediment wear rate was established, tailored to the specific operating conditions and material properties of this power station, for engineering life prediction.
3. Experimental Study
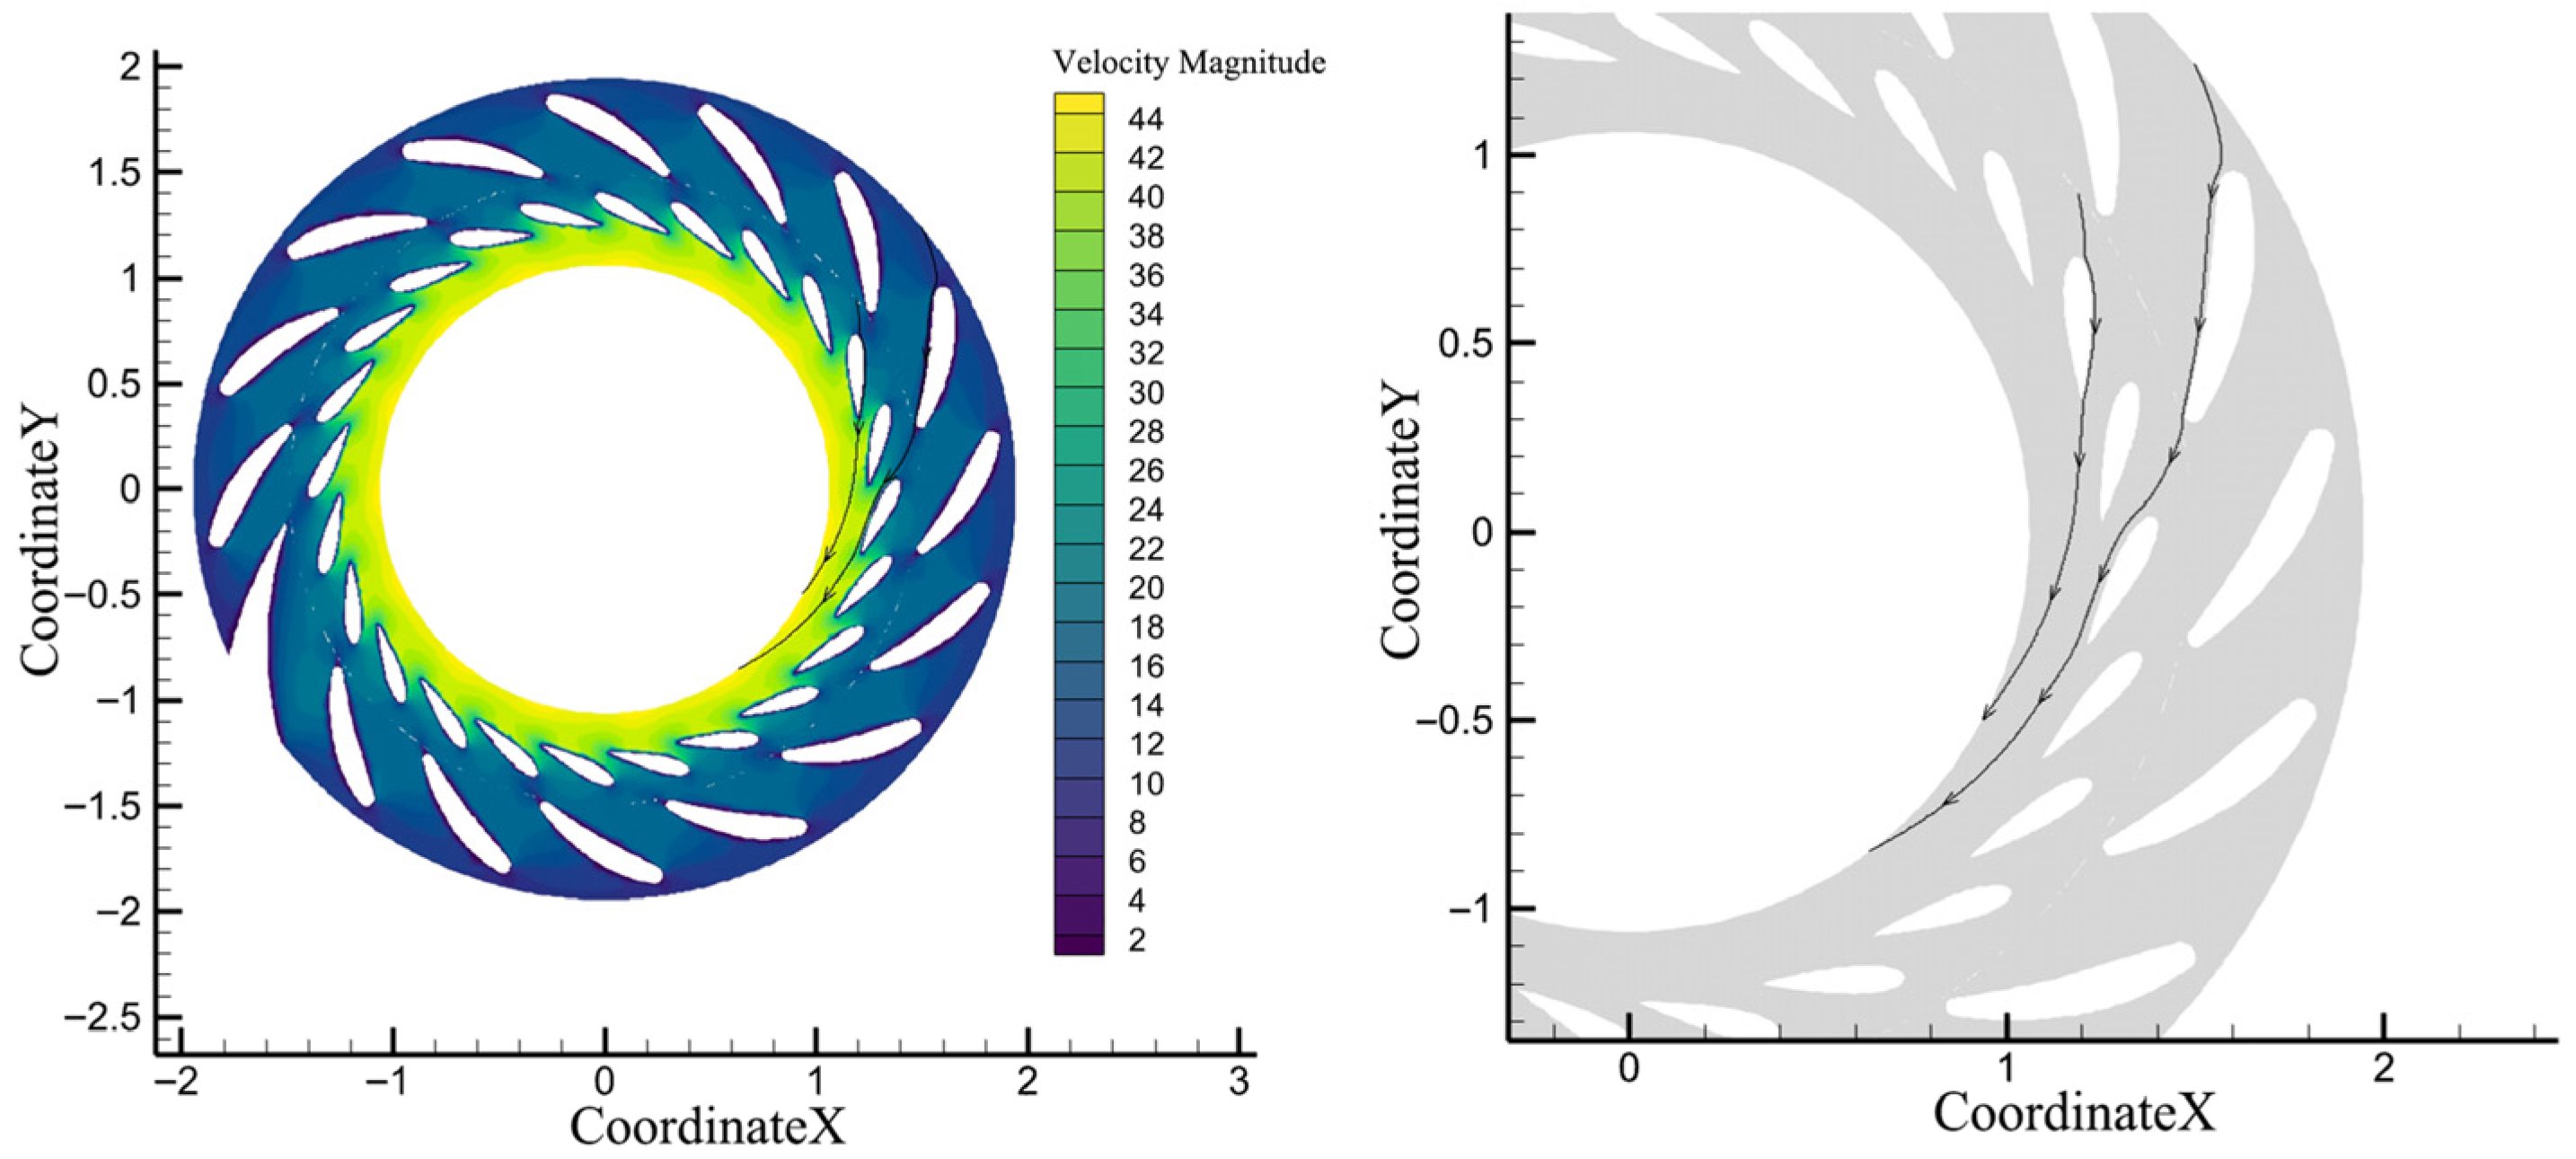
Full-flow passage numerical simulations of the sediment-laden flow under the specified parameters yielded the sand-water velocity distribution, streamline patterns around the guide vanes, and sediment concentration on the top cover surface. An experimental setup was devised to perform sediment erosion studies based on the flow parameters within the guide vane passage. The experimental model’s design guaranteed that flow conditions mirrored those of the actual flow channel, hence ensuring consistency between experimental results and real-world performance.
A test section mimicking the top cover flow passage under rated operating conditions for sediment erosion testing on the guide vanes’ top cover of the Genda Power Station turbine was constructed based on geometric and kinematic similarity principles. This methodology guaranteed that the test segment precisely reflected the flow dynamics in the prototype turbine.
The velocity and sediment concentration distributions on the top cover surface in the guide vane region of the prototype turbine at rated circumstances were determined by full-passage CFD simulations. Based on these distributions and following the dynamic similarity criteria, the test section was designed to ensure that the flow conditions (velocity, sediment concentration, Reynolds number) within it were similar to those in the critical regions of the prototype. The influence of the clearance height is thus indirectly represented in the tests by adjusting these flow field parameters. The tests try to replicate material wear behavior under certain flow circumstances, rather than explicitly reproducing the geometric structures of varied clearance heights.
3.1. Test Section Design
The top cover’s foundation material in the guiding vane region of the Genda Power Station turbine is cast steel, whilst the sediment erosion-resistant plate utilized for repairs is composed of 04Cr13Ni5Mo. The experimental apparatus was constructed using the specified materials.
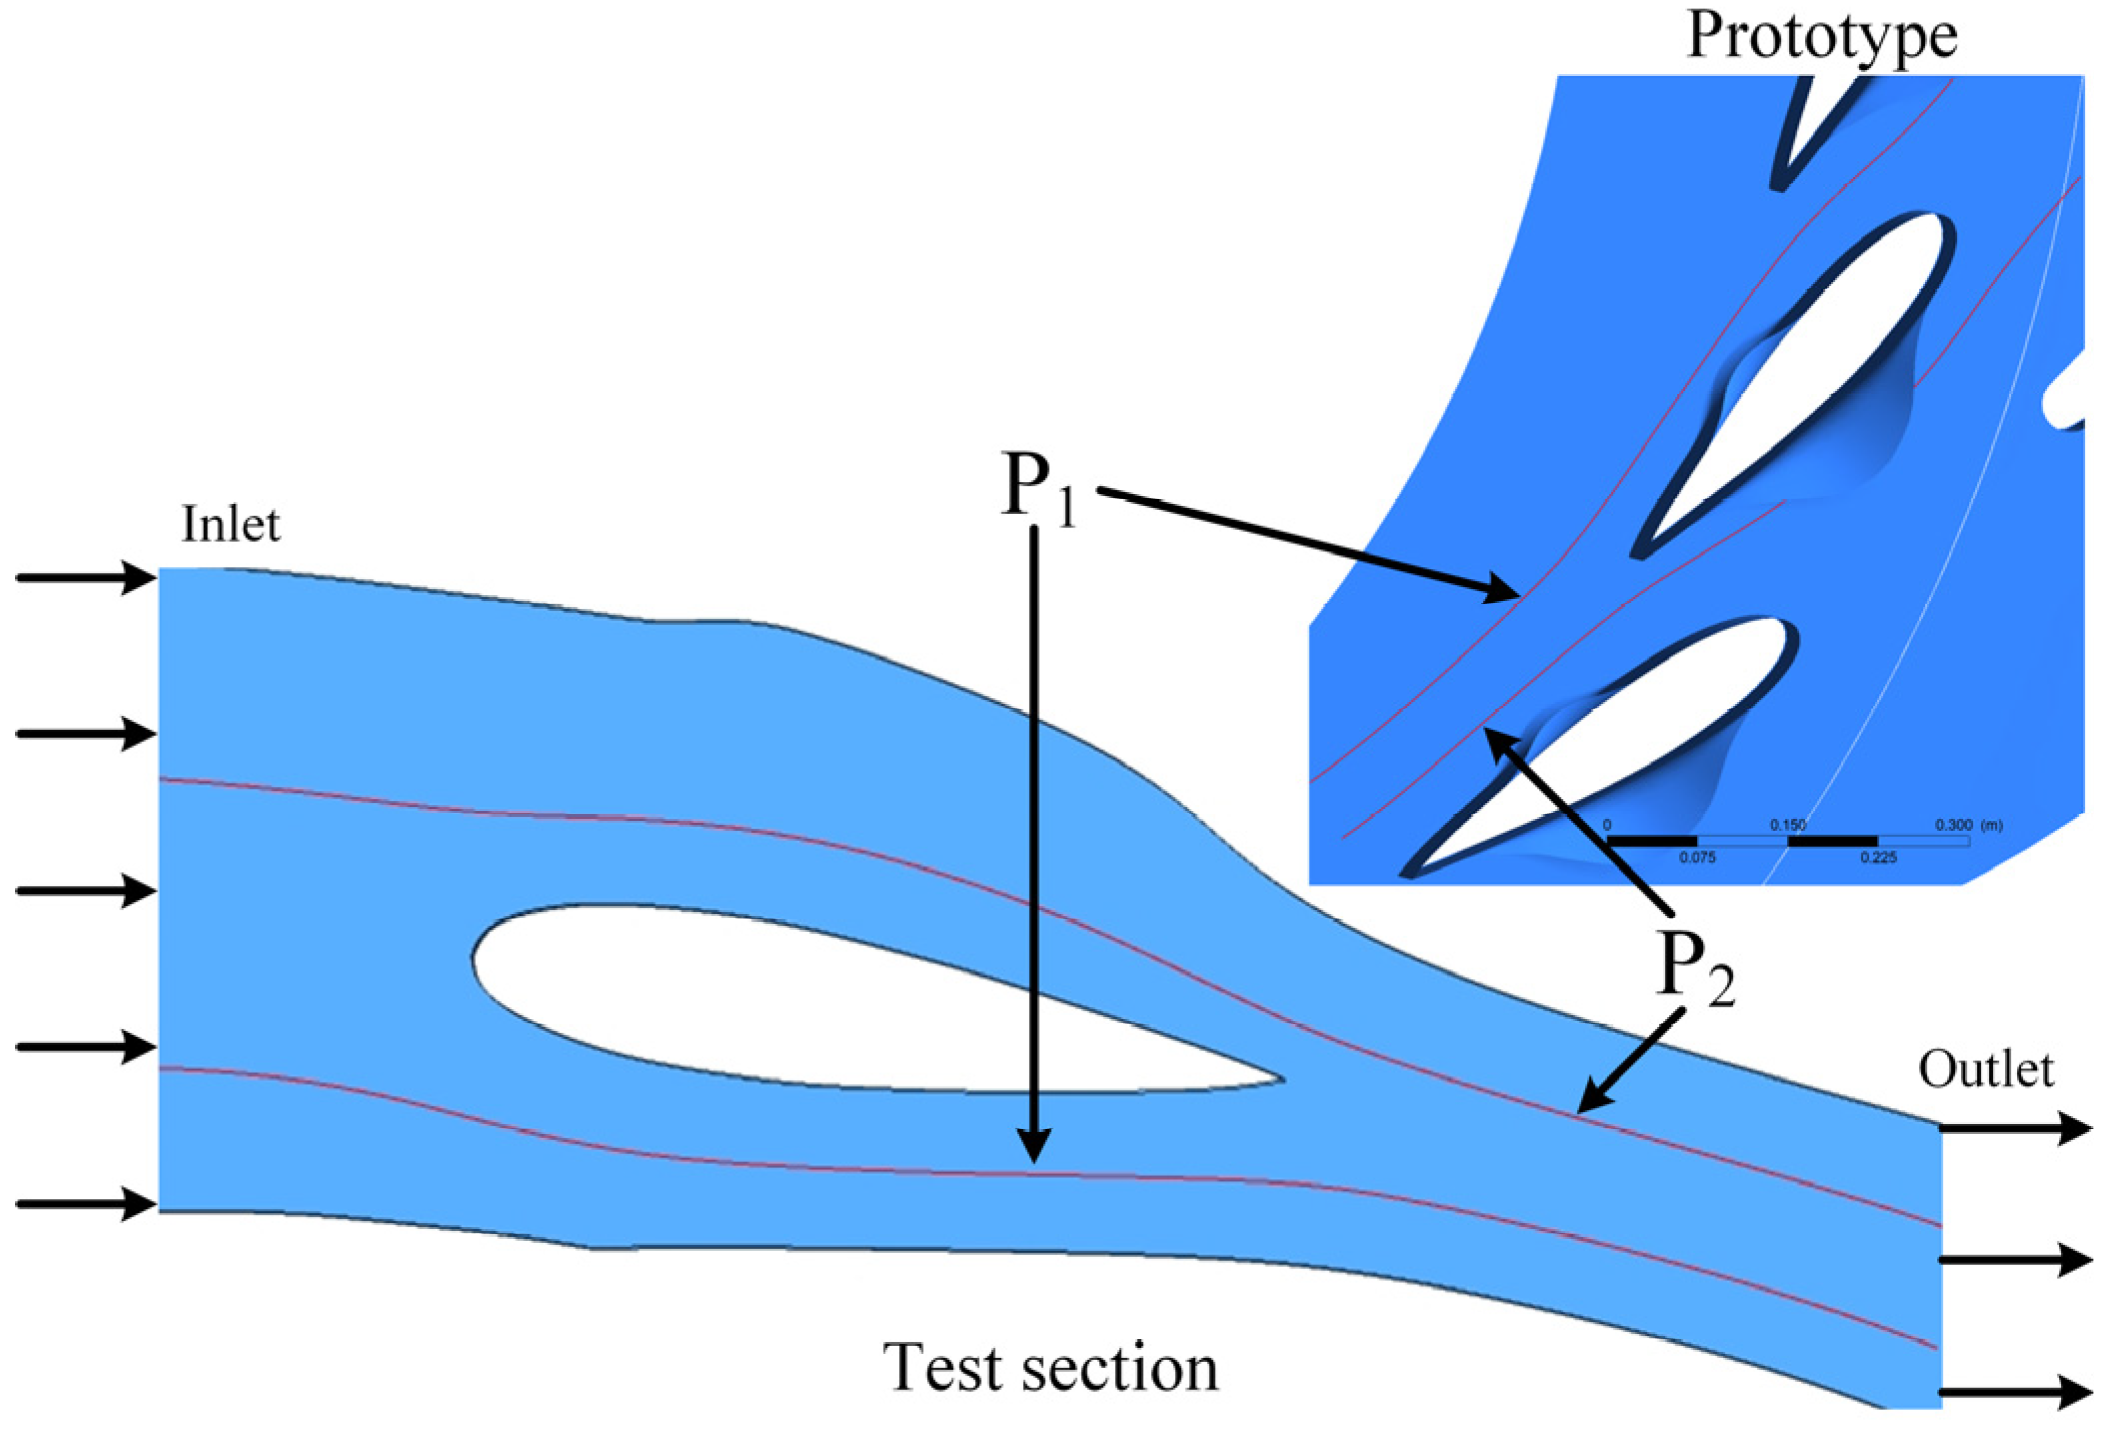
Erosion of the sediment on the flow-passing surface of the top cover largely occurs due to the impact and abrasion of sediment-laden flow within the guide vane passage. Two example streamlines from the guide vane domain were extracted based on numerical simulation results of the full-flow passage under rated conditions, as illustrated in
Figure 9. The delineations of these streamlines were employed to establish the flow boundaries of the test section, so assuring hydraulic equivalence between the experimental apparatus and the actual turbine.
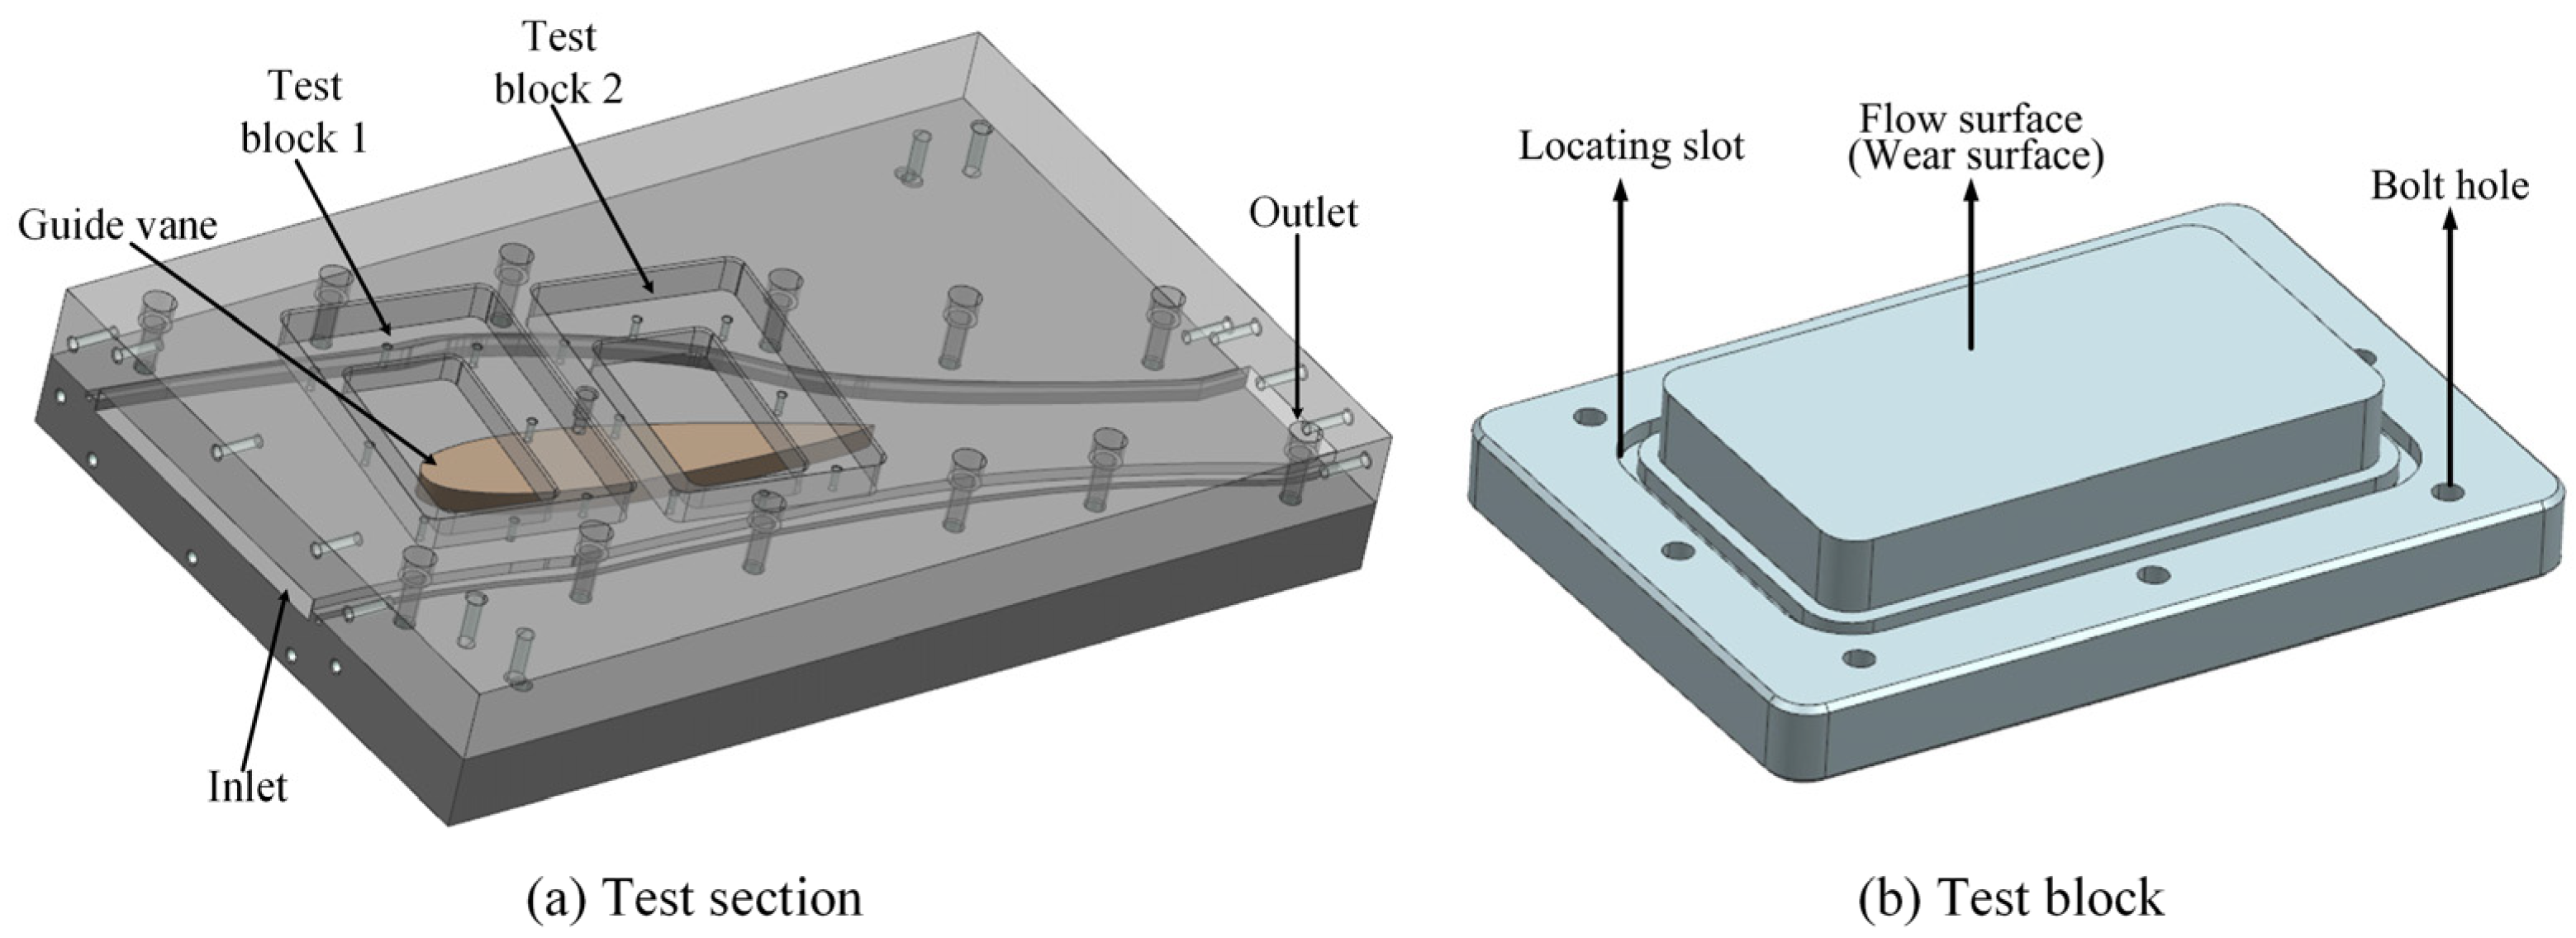
The geometric model of the turbine guide vane was utilized to construct the guide vane within the flow path of the test section. The model, along with the delineated wall limits, formed the test section for assessing the efficacy of the sediment erosion-resistant plate.
Figure 10 presents a cross-sectional view of the test portion.
The numerical simulation results of the prototype turbine indicated that the average inlet velocity of the test section was 14 m/s, with the design flow rate of the test system established at 280 m3/h. The intake height of the test section was set to be 20 mm to ensure that the inlet velocity matches that of the corresponding cross-section of the prototype.
Test block 1 was produced from sediment erosion-resistant plate material (04Cr13Ni5Mo), whereas Test block 2 was constructed from the top cover base material (cast steel). A 0.3 mm end-face clearance was preserved between the test blocks and the guide vane, in accordance with the real layout of the prototype turbine.
Figure 11 illustrates the three-dimensional model of the test section and the test blocks.
3.2. Rationality Verification of Test Section Design
To validate the rationality of the test section design, it is essential to ensure the dynamic similarity of the sediment-laden flow parameters between the test section and the prototype turbine flow passage (obtained via full-passage numerical simulation). This section evaluates the similarity between the two by comparing the flow velocity, sediment concentration, and Reynolds number at corresponding locations in the test section and the prototype flow passage (numerical model).
Figure 12 illustrates that the validation segment of the test section was developed using two extracted streamlines (P
1 and P
2) from the prototype flow passage. The streamlines were integrated into the test section model to acquire appropriate data. To statistically assess the flow similarity between the test section and the prototype, a comparison was conducted along a normalized trajectory from the inlet (designated as position “0”) to the outlet (designated as position “1”). Sequential locations were picked along this course, and essential characteristics such as sediment velocity, sediment concentration, and Reynolds number were compared and analyzed at each position.
3.2.1. Comparison of Sediment Velocity
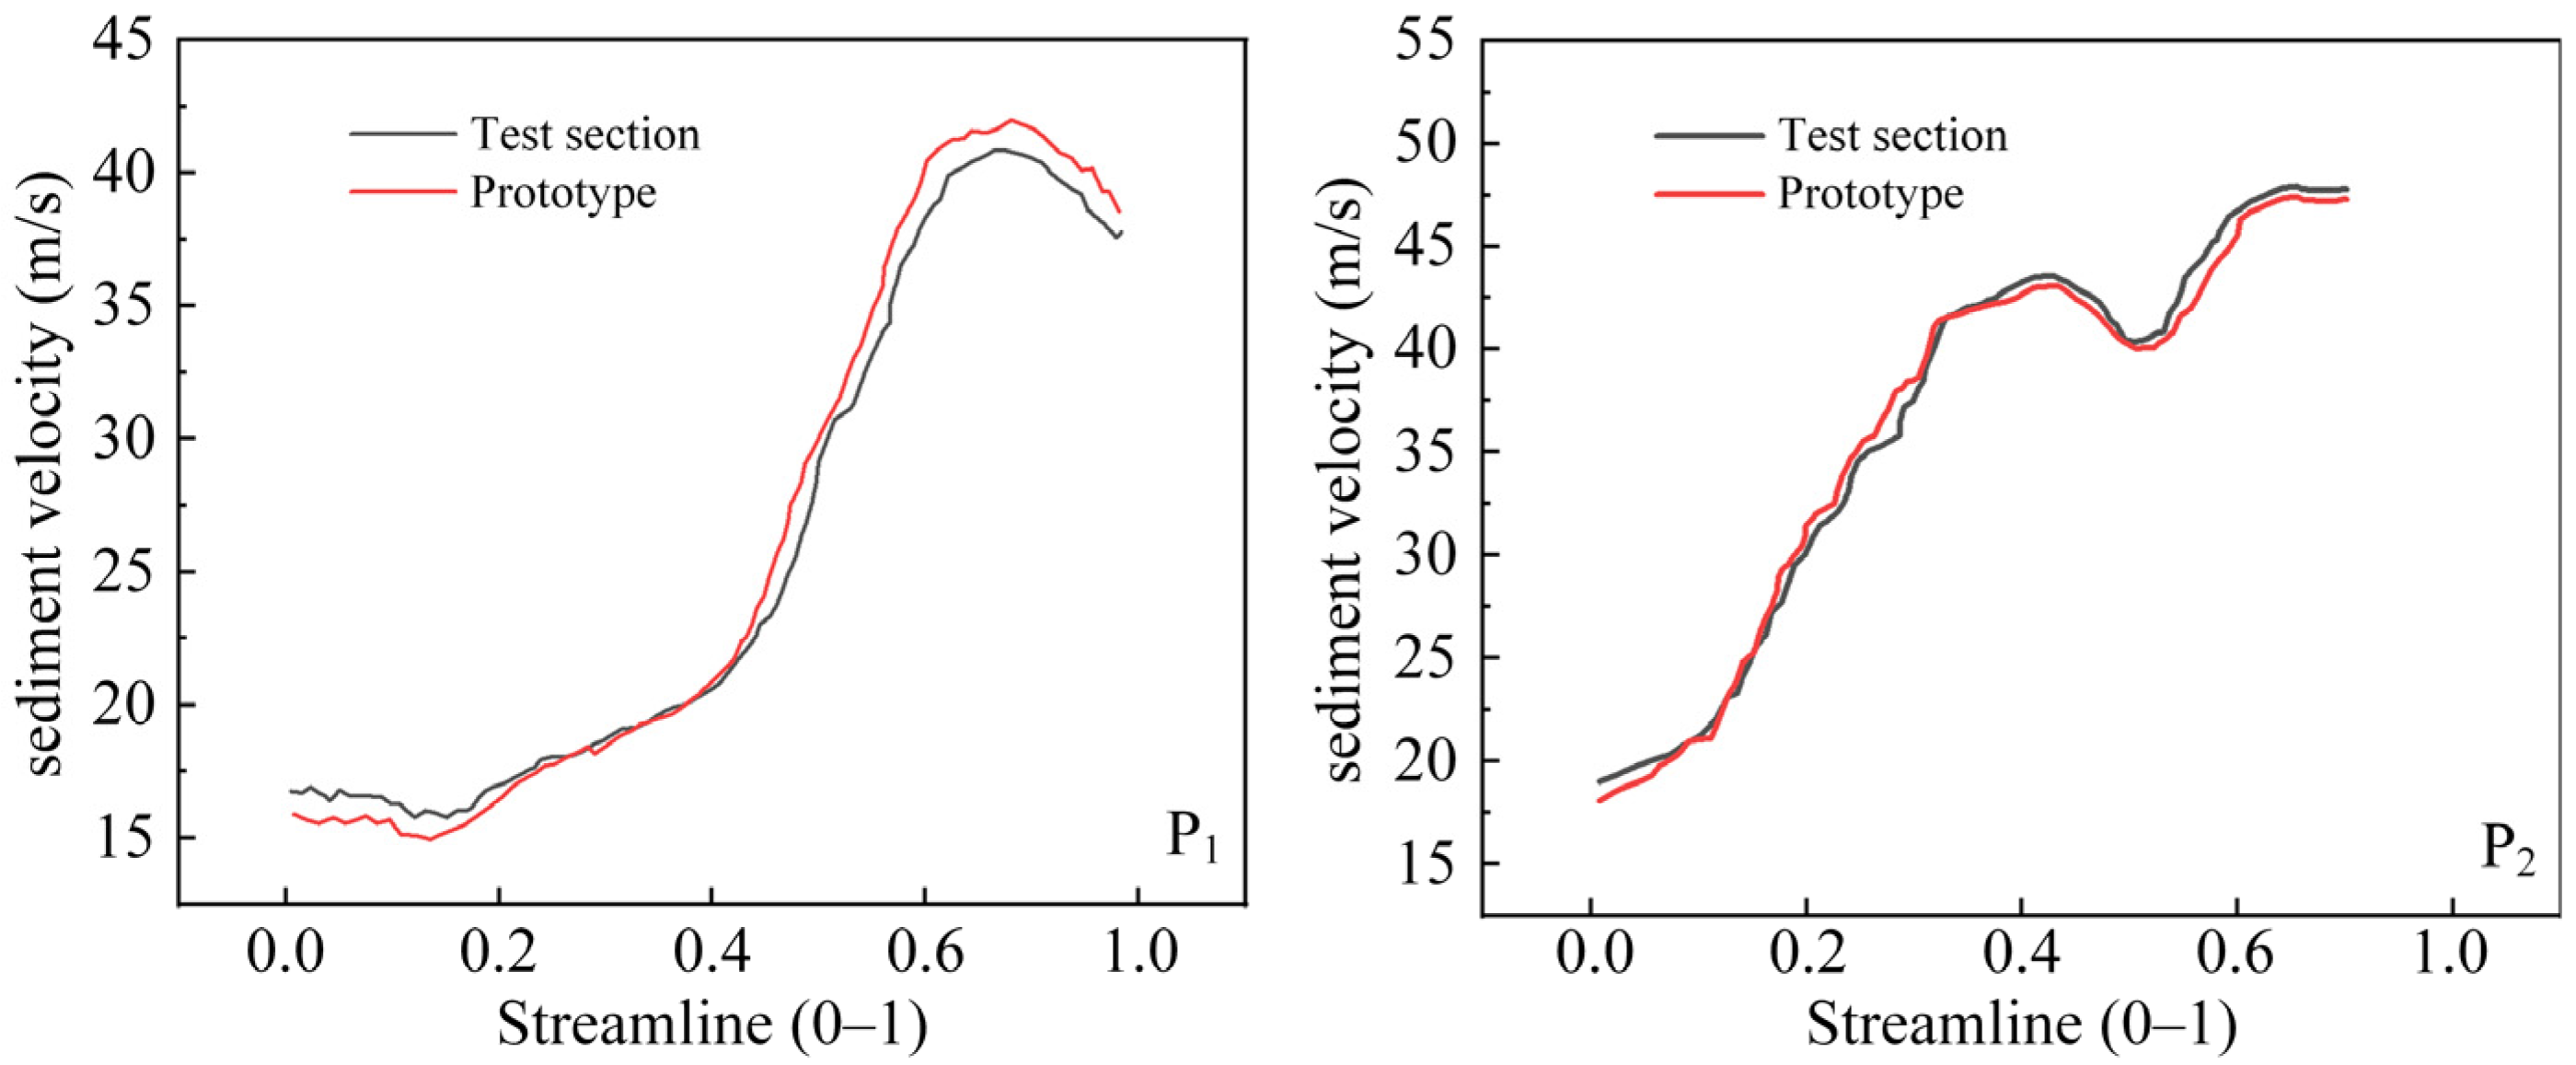
The curves in the figure are derived from the numerical simulation results, obtained by extracting and comparing data from corresponding streamlines in the prototype flow passage and the test section. Sediment velocity is a critical factor governing its kinetic energy upon impact with the wall surface, and is thus directly related to the erosive impact.
Figure 13 presents a quantitative comparison of sediment velocity between the test section and the prototype turbine. The sediment velocity curves for streamlines P
1 and P
2 exhibit strong concordance between the test section and the prototype, demonstrating consistent fluctuation patterns and similar magnitude ranges.
3.2.2. Comparison of Sediment Concentration
The curves in the figure are derived from the numerical simulation results, obtained by extracting and comparing data from corresponding streamlines in the prototype flow passage and the test section.
Figure 14 illustrates the comparison of sediment concentration. The sediment concentration variation trends along both P
1 and P
2 streamlines are broadly consistent between the test section and the prototype. The test segment demonstrates a slightly elevated sediment content compared to the prototype at P
1, while exhibiting a considerably reduced concentration at P
2. The disparities in silt concentration between the test section and the prototype are negligible along both streamlines.
3.2.3. Comparison of Reynolds Number
The Reynolds number (Re) is an essential similarity criteria in fluid mechanics, fulfilling three primary functions: (1) It establishes the flow regime—laminar flow at Re < 2300, turbulent flow at Re > 4000, and transitional flow in the intermediate range; (2) It forecasts resistance characteristics by directly affecting the variation of drag coefficients in the flow around objects; (3) It directs model testing by ensuring dynamic similarity between prototype and model through the equivalence of Reynolds numbers.
The formula for calculating the Reynolds number (
Re) is as follows:
where
V,
v, and
d denote the flow velocity, kinematic viscosity coefficient, and characteristic length of the fluid, respectively.
The formula for calculating the ratio
K between the Reynolds number
Re1 of the test section and
Re2 of the prototype section is given as follows:
where the subscript “1” indicates parameters of the test section, and the subscript “2” signifies parameters of the prototype portion, with
d1 = d2. It is important to observe that for low sediment concentrations, the viscosity of the sediment-laden flow is directly proportional to the sediment concentration.
Thus, Equation (9) may be simplified into the following form:
where
S1 and
S2 denote the sediment concentration in the test section and the prototype section, respectively.
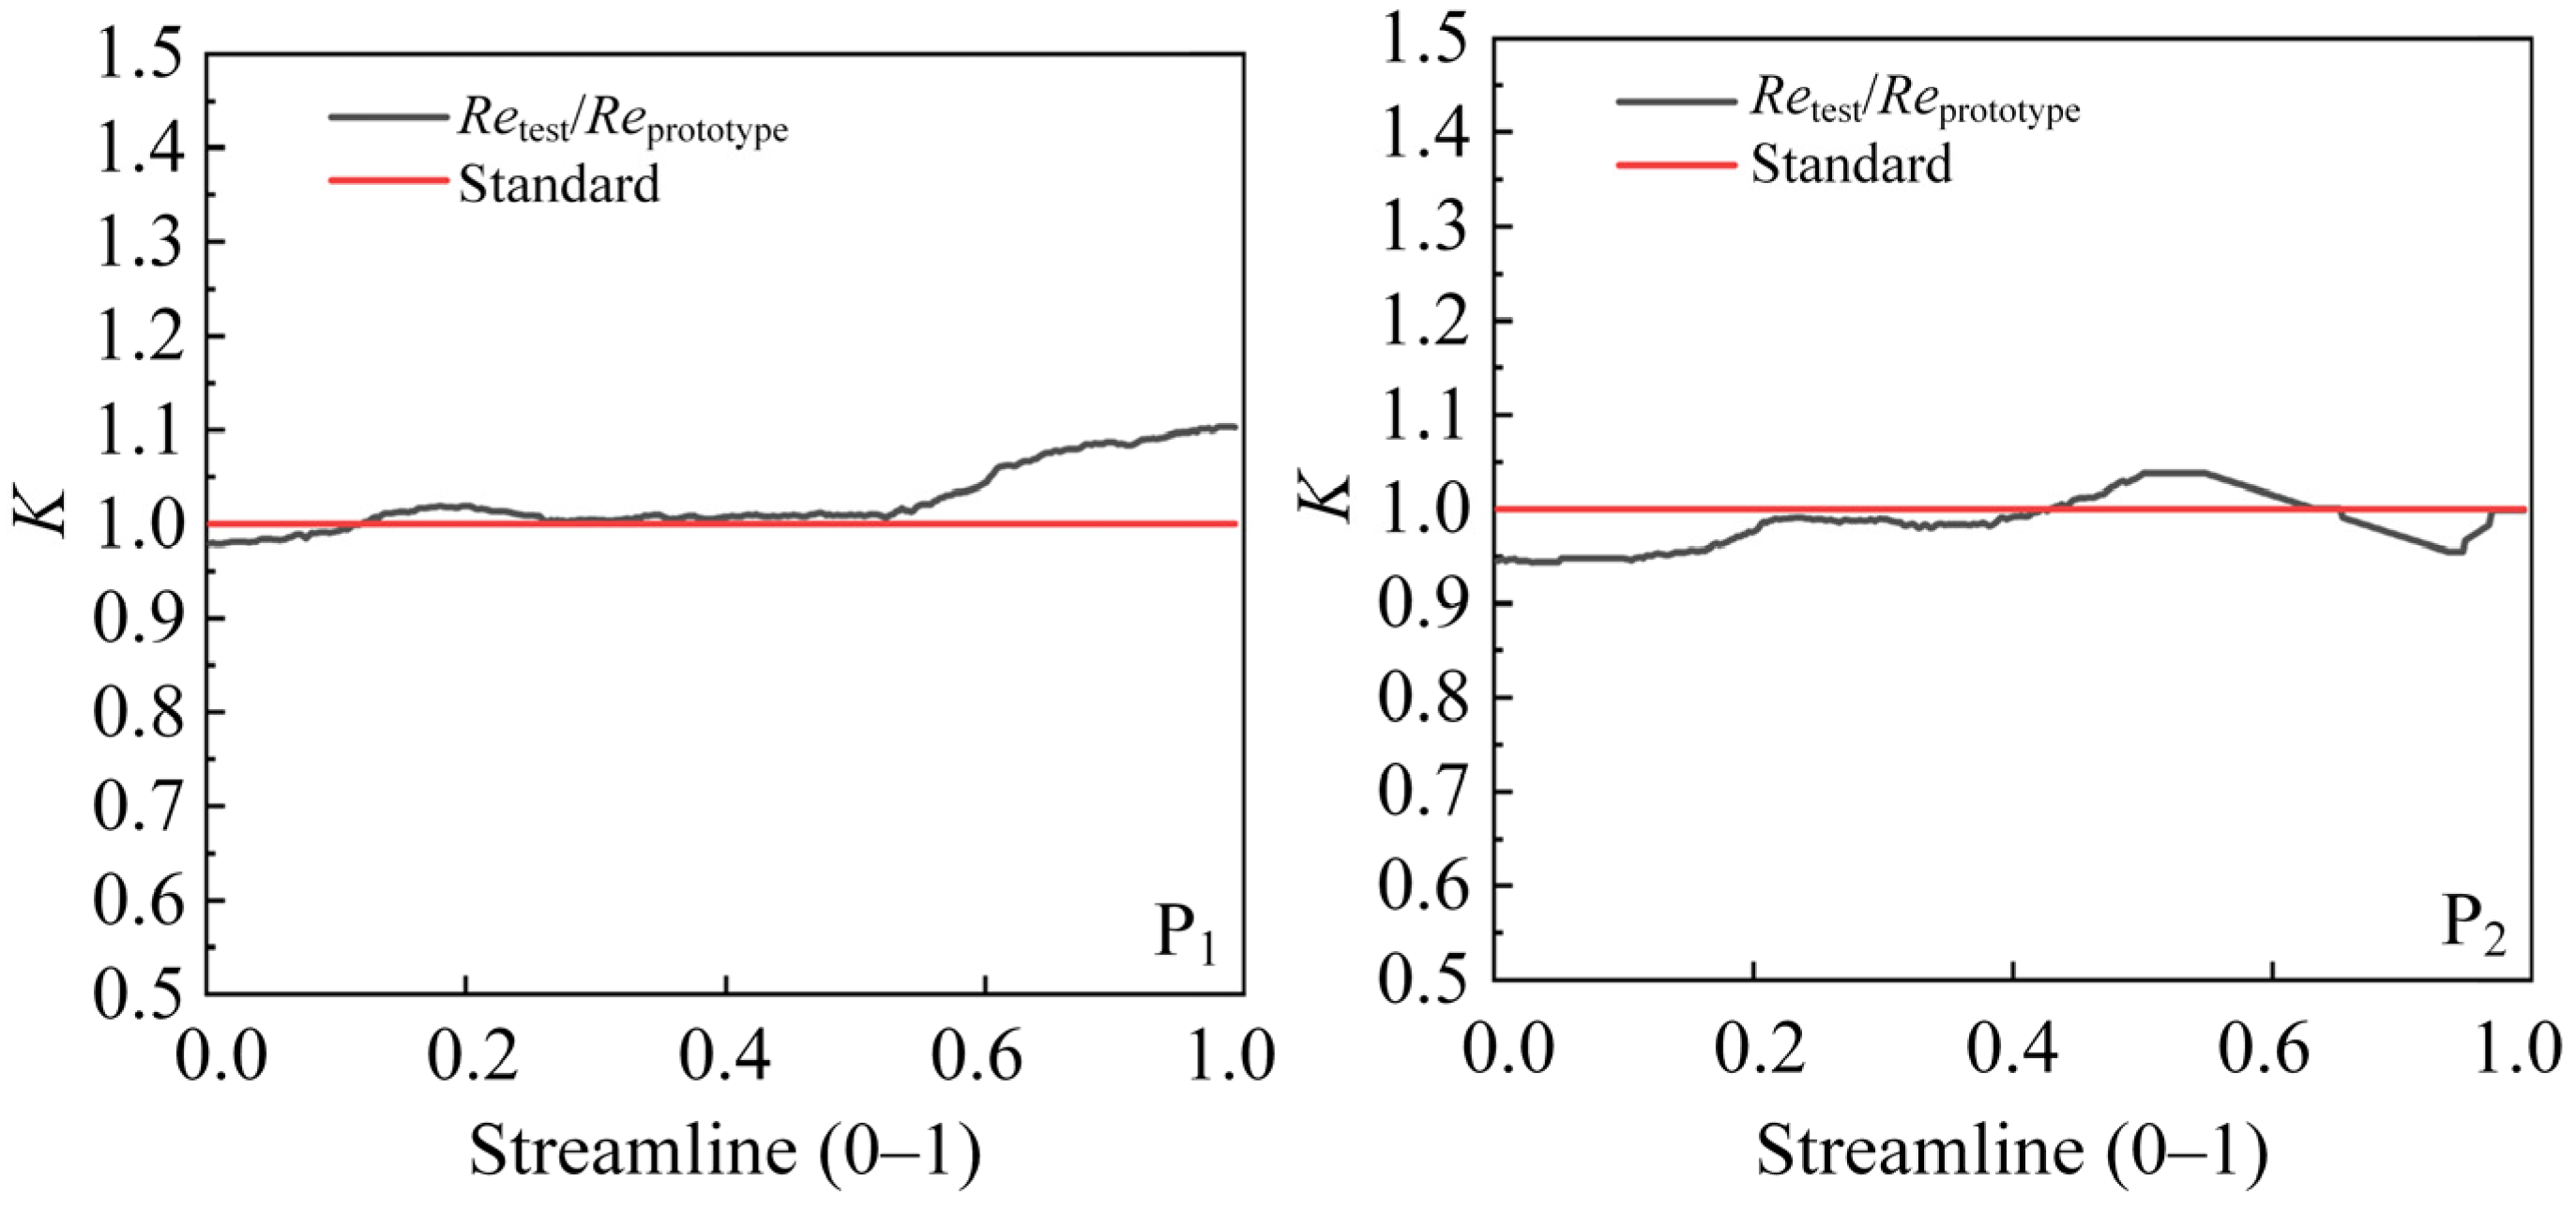
Figure 15 illustrates the correlation between the similarity coefficient
K and the positions along streamlines P
1 and P
2. The
K-values at all places throughout the three comparative segments are approximately 1, signifying little discrepancies in Reynolds numbers between the test section and the prototype turbine at each respective position. This verifies that the flow in the test section meets the Reynolds number similarity condition in relation to the prototype.
3.3. Test System
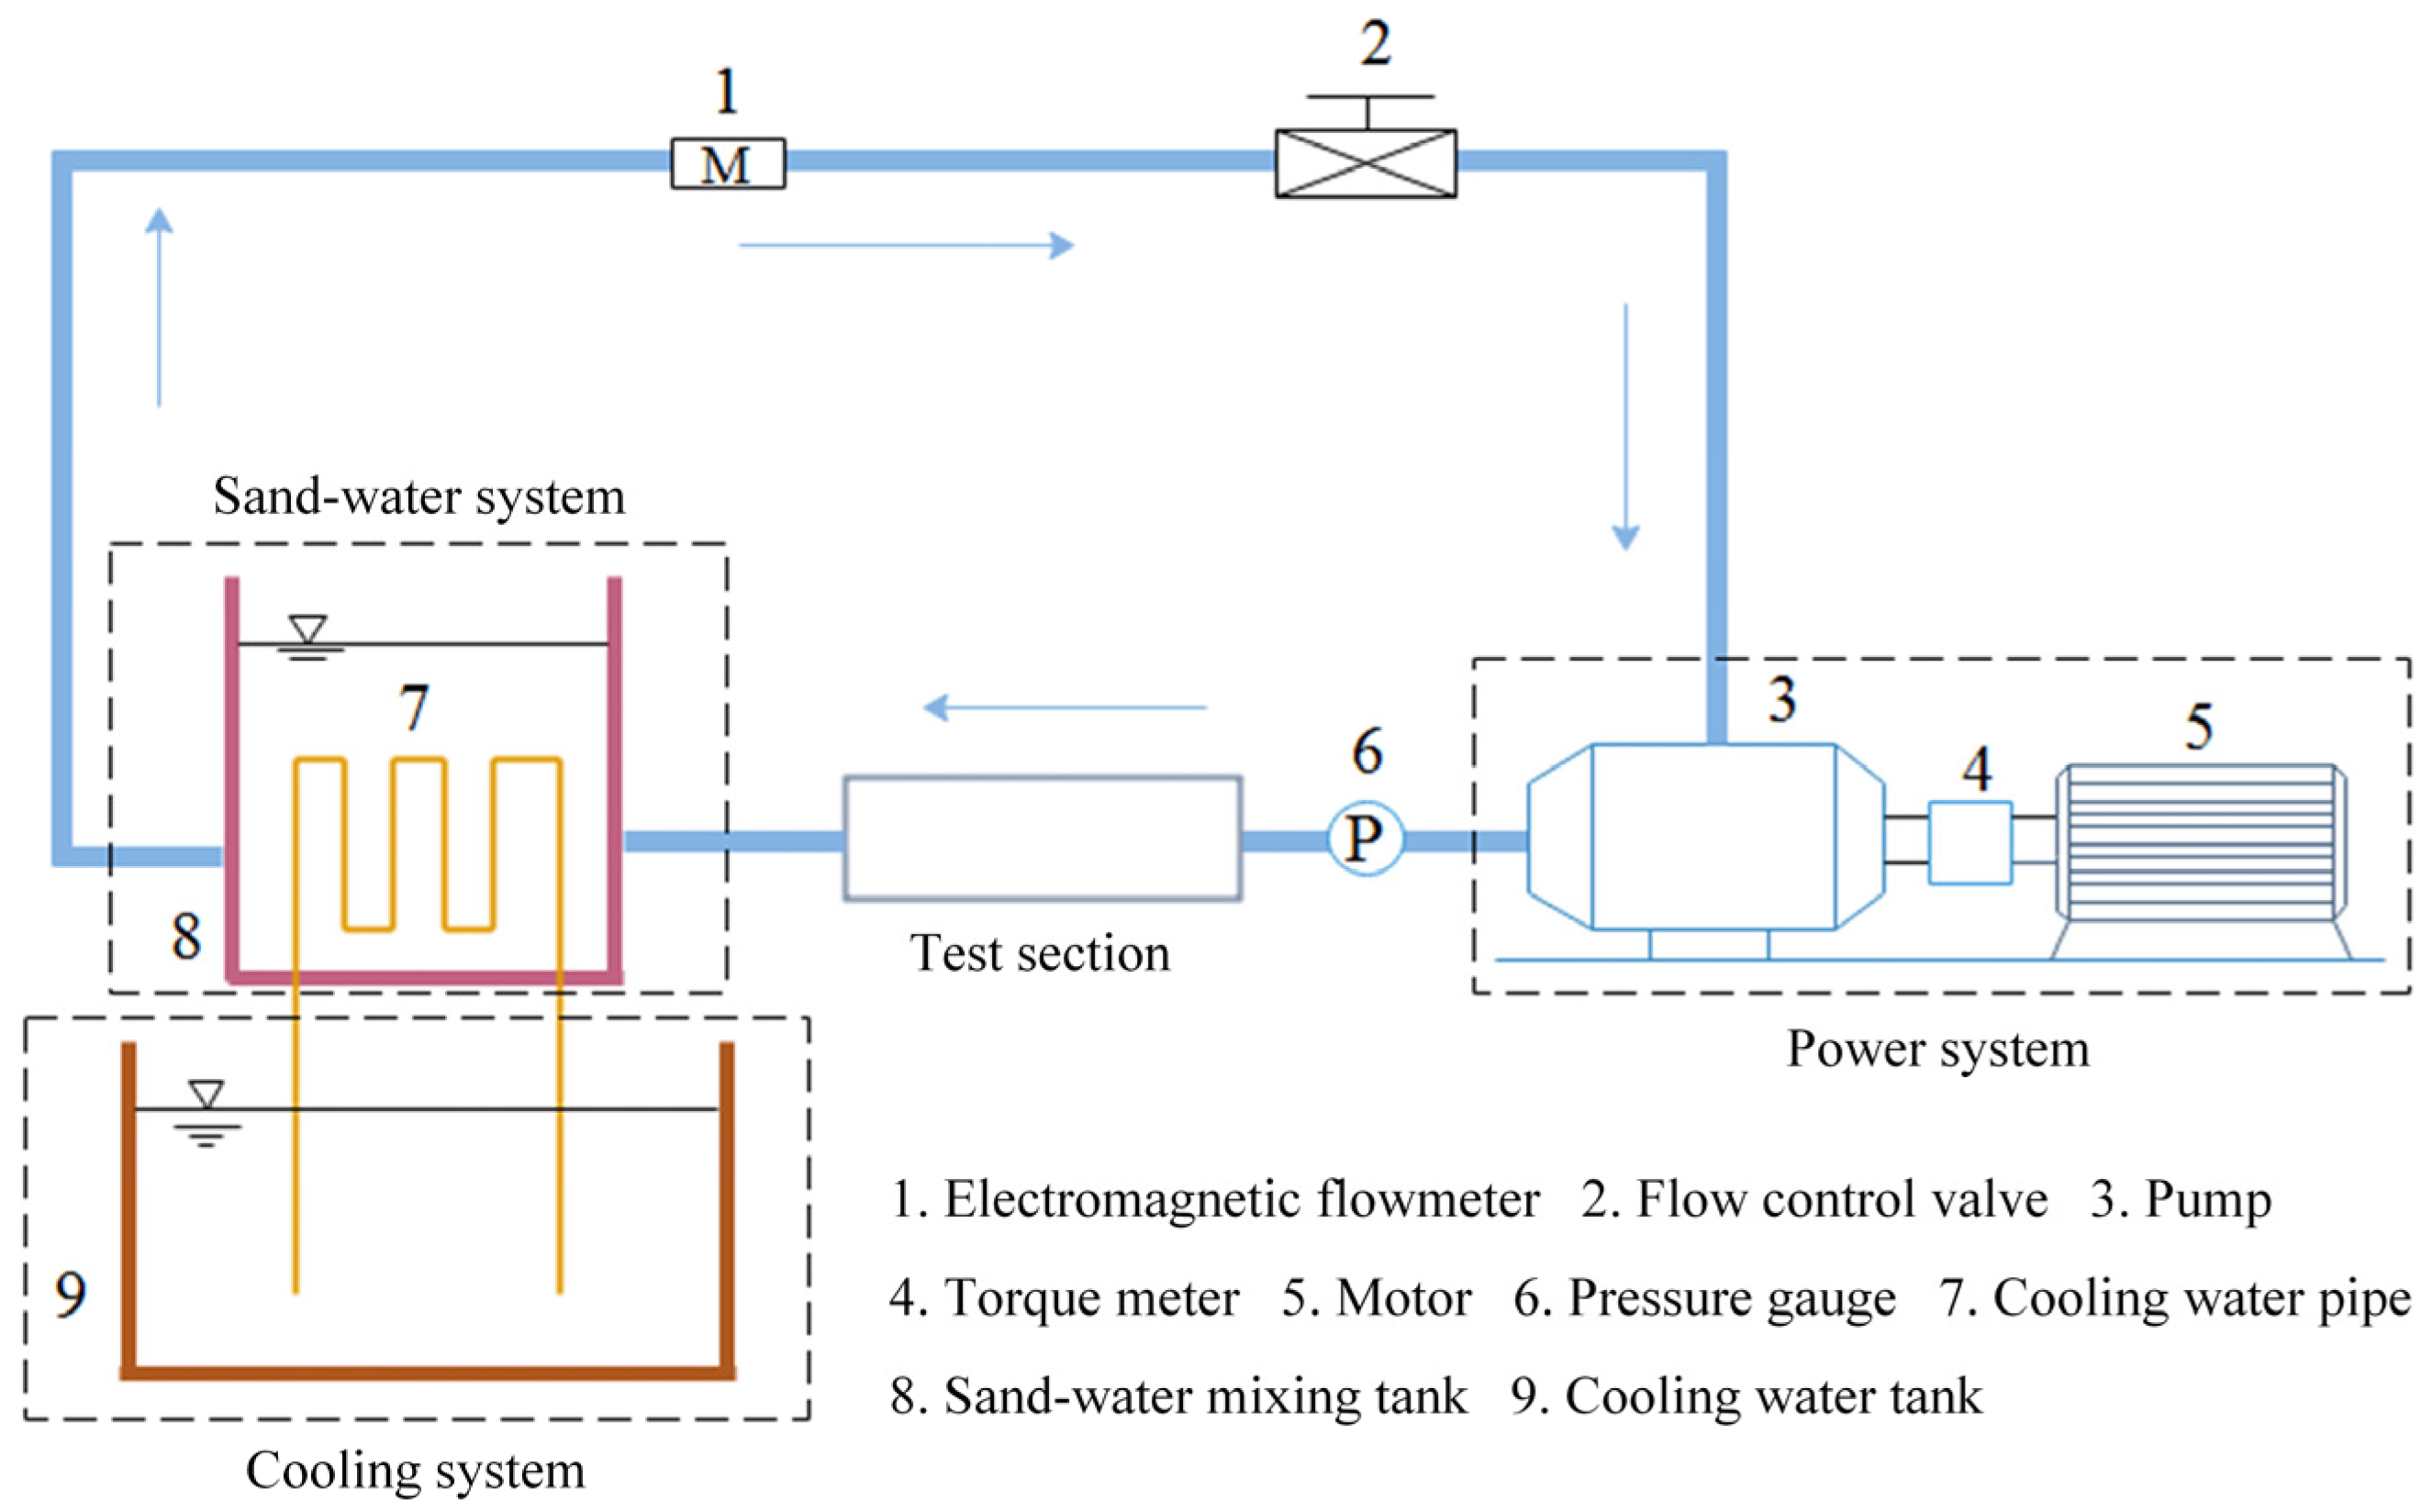
Figure 16 depicts the developed sediment erosion test system. The system comprises four primary components: a power unit, a sediment mixing apparatus, a cooling module, and the test section. The power unit features a high-capacity 630 kW motor, capable of generating a system pressure corresponding to a 376 m water column and a rated flow rate of 482 m
3/h. The sediment mixing apparatus employs high-velocity water impact to attain homogeneous suspension of sediments. The cooling system utilizes a serpentine pipe to circulate groundwater for thermal exchange. The test section, as the fundamental element, possesses a modular design that allows for tailored modifications based on particular research requirements, facilitating experiments under diverse operating situations. The system employs a modular architecture, with all functional units collaborating to create a dependable experimental platform for hydraulic turbine research. Based on the study objectives, several test sections and test blocks might be constructed to fulfil particular experimental criteria.
Figure 17 illustrates the comprehensive setup of the sediment erosion test section.
3.4. Measurement Method of Test Results
The laser rangefinder is a high-precision device for measuring distances, utilizing laser modulation technology. The operational principle entails producing modulated pulsed laser beams (either single or sequential pulses) and employing a highly sensitive photodetector to capture the reflected signal from the target, thus precisely calculating the round-trip time of flight.
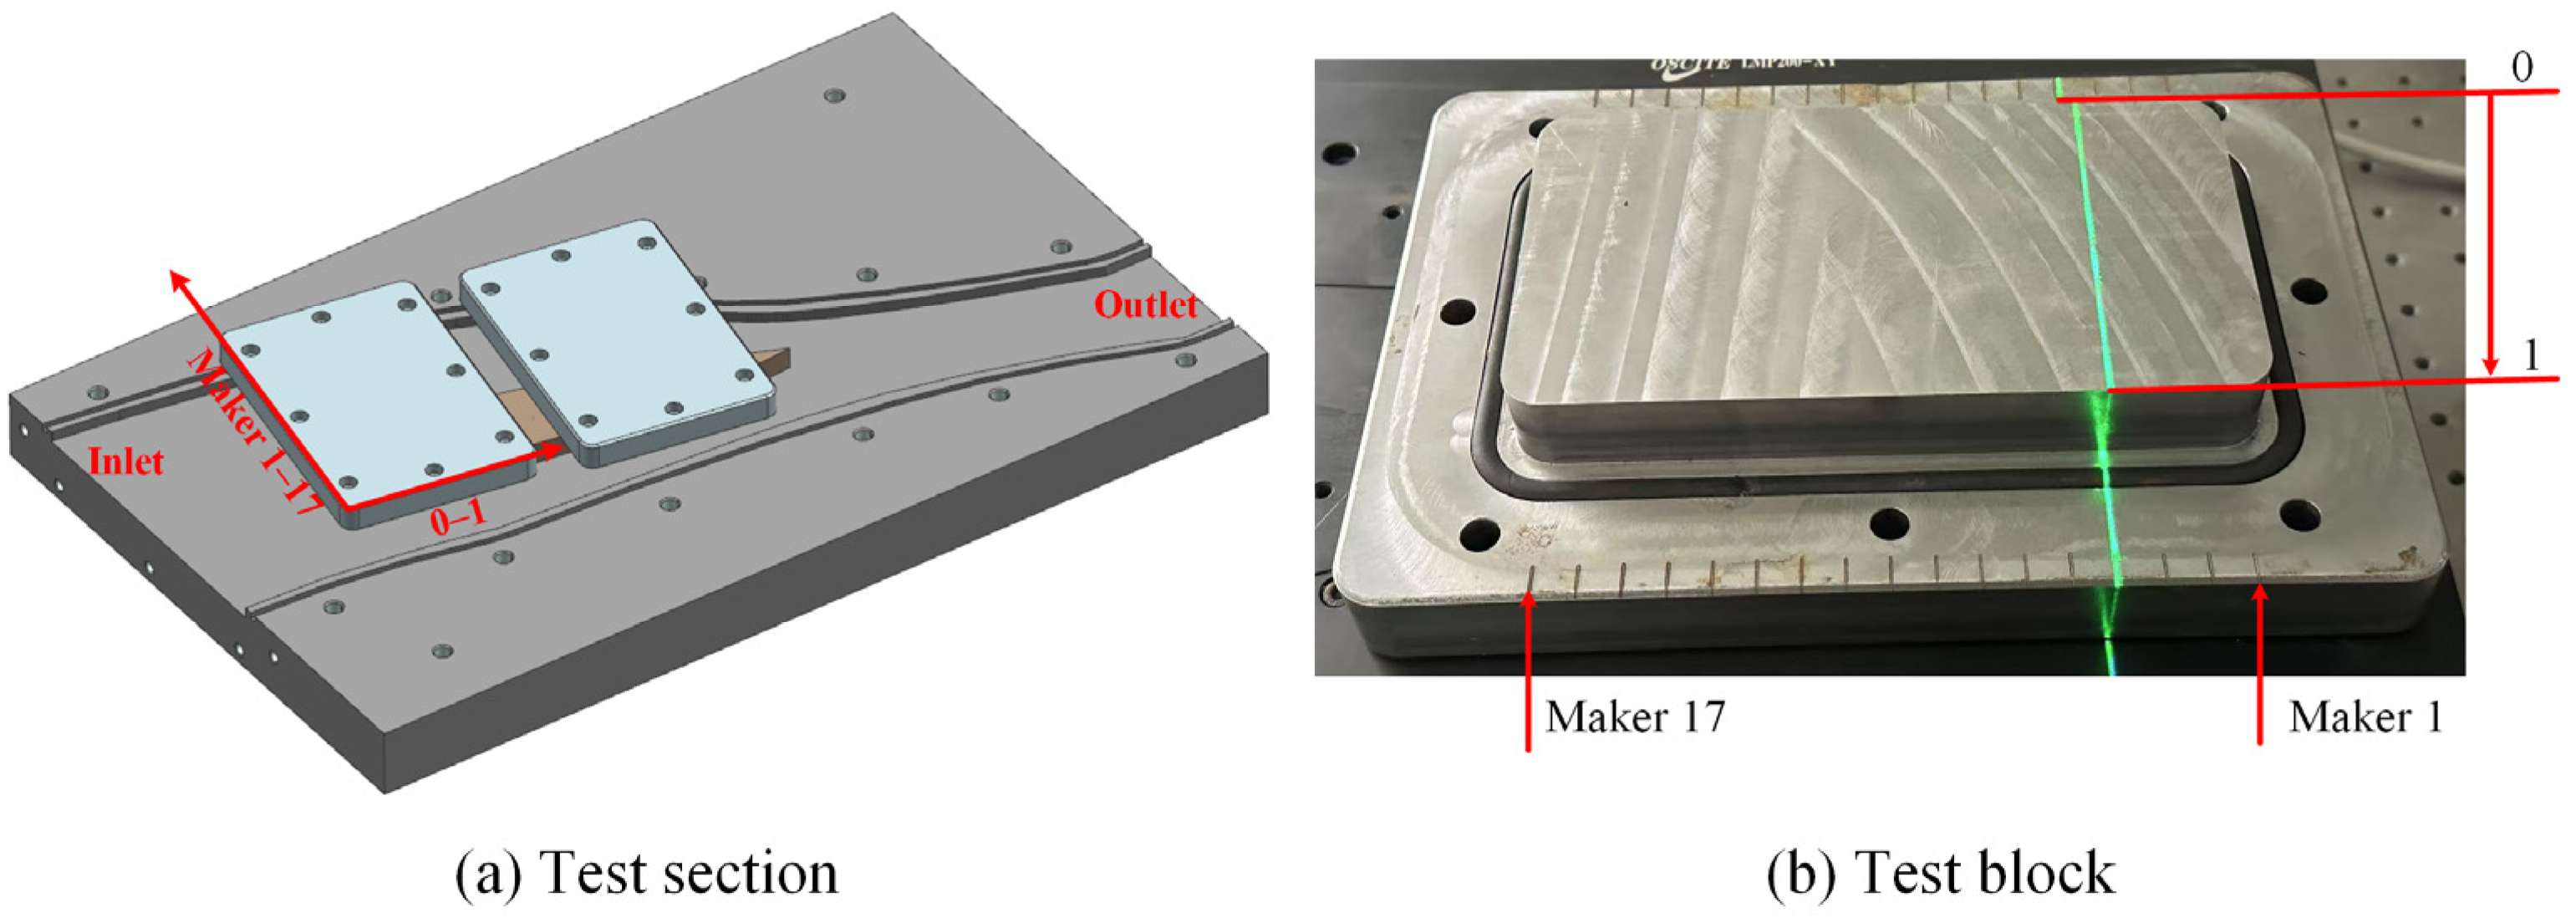
Multiple measurement lines were delineated on the non-test surface of the test block to function as reference benchmarks prior to and following the experiment. The non-test surface is impervious to silt erosion, maintaining its condition during the experiment, so assuring that measurements are conducted at the same sites before and after the test. The measurement’s initial point is designated as “0,” while the terminal position is labelled “1.”
Figure 18 illustrates the locations of the engraved lines and the measurement bounds.
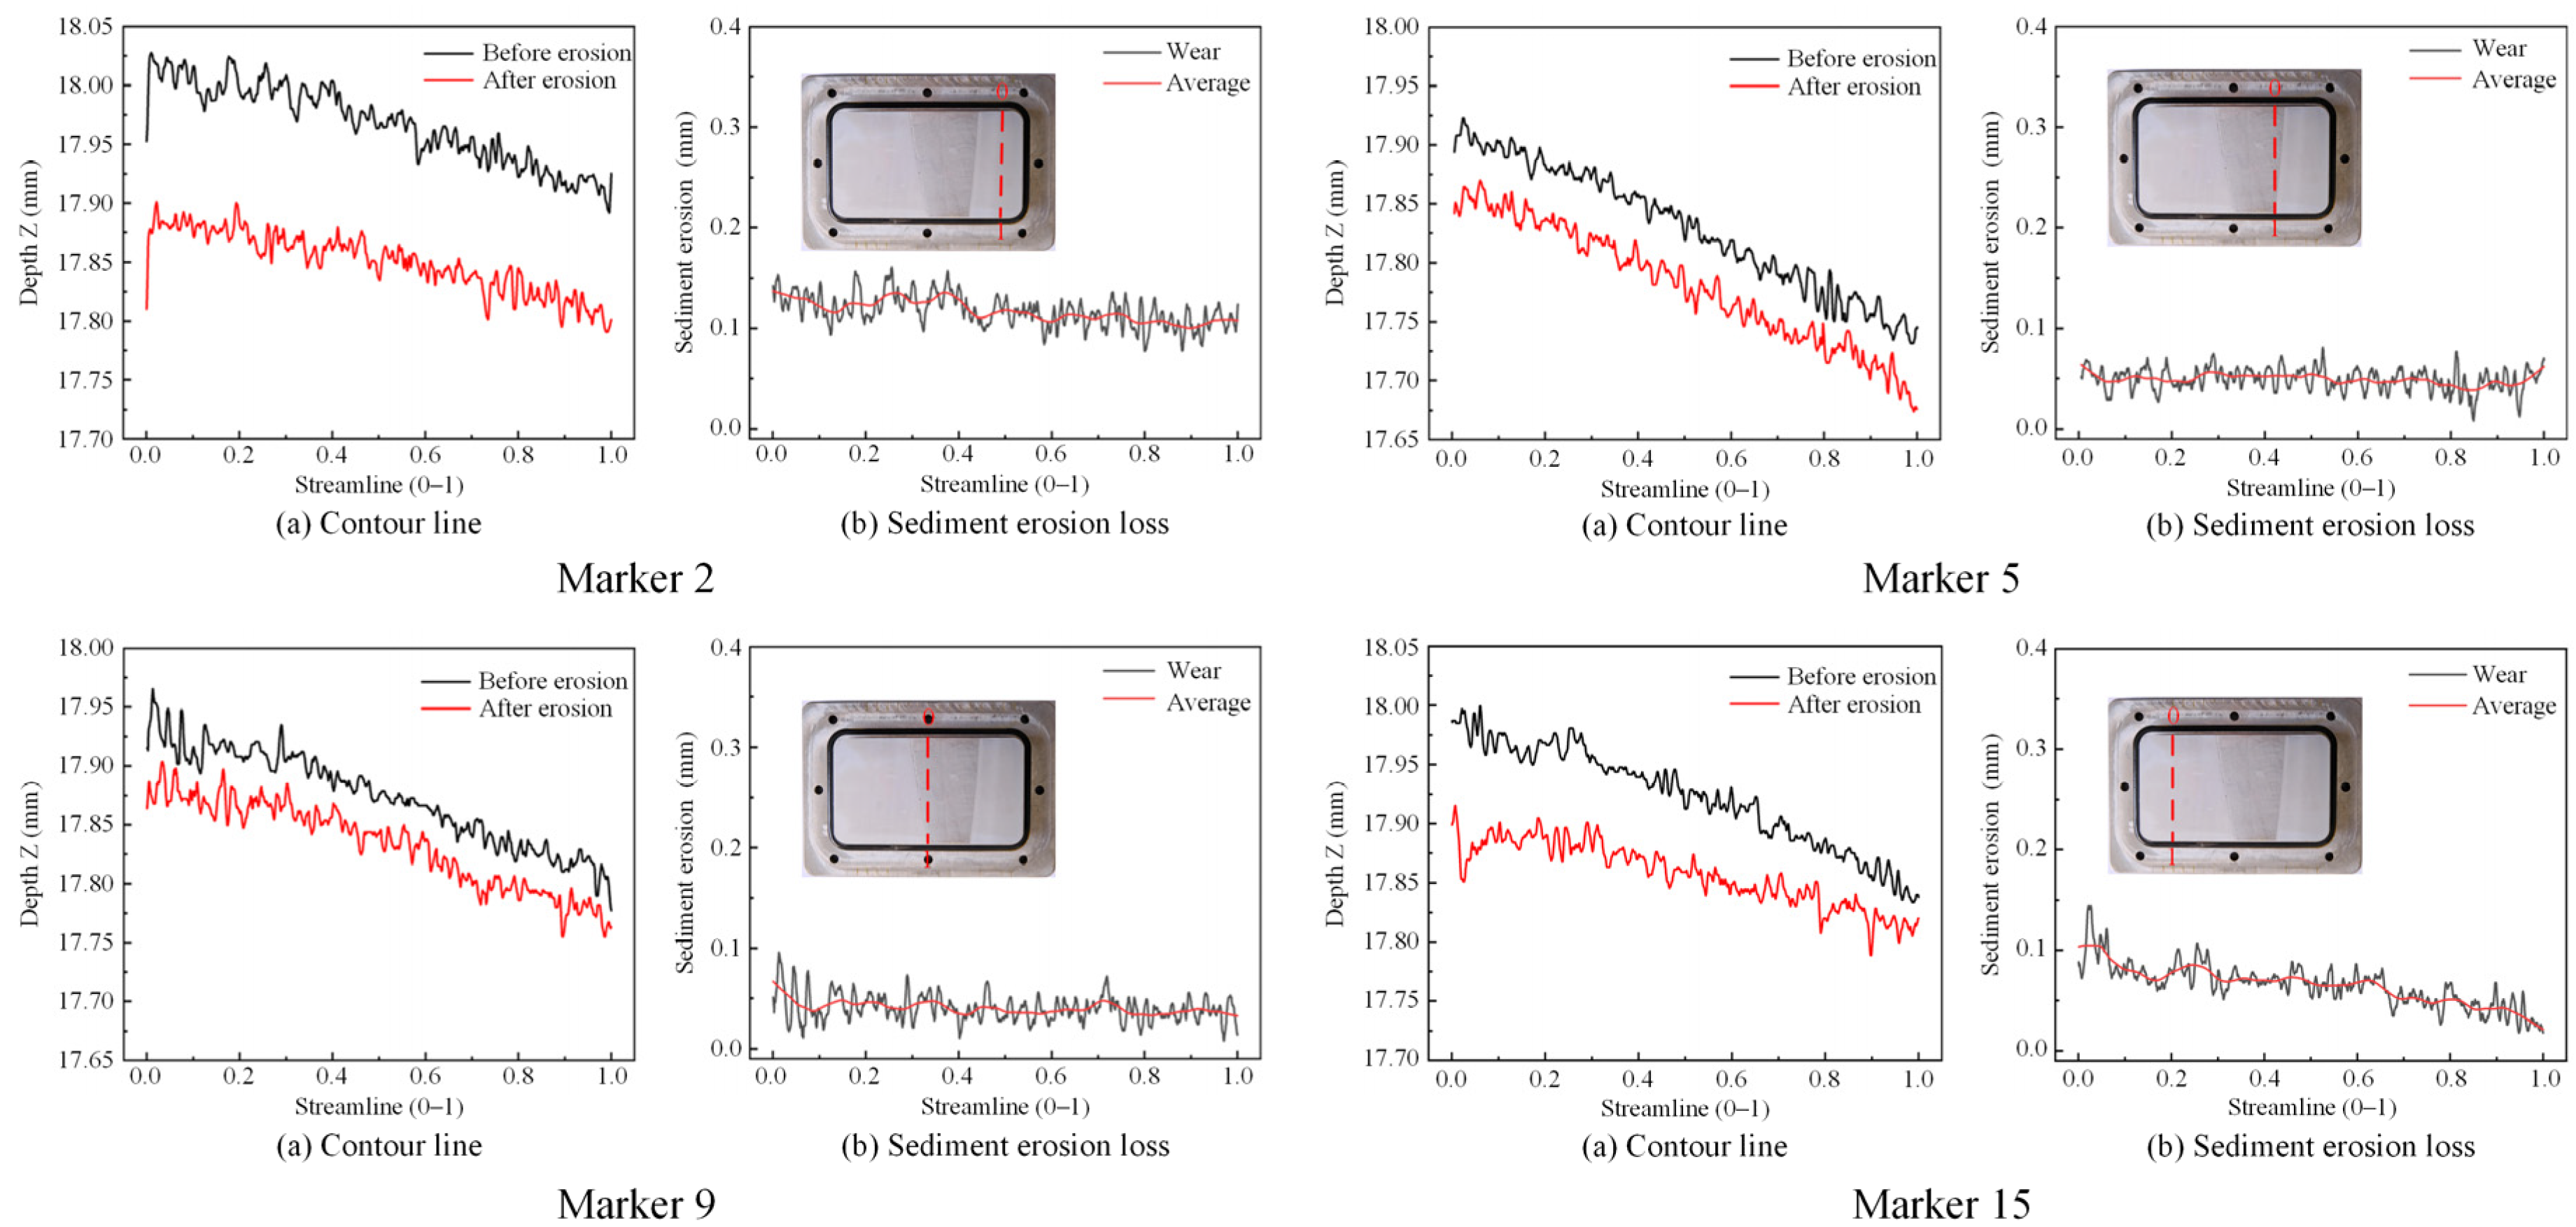
The recorded data illustrates the surface profile of the abraded test surface. By overlaying the pre- and post-test profiles within a unified coordinate system, the erosion depth at each location along the measurement line can be quantitatively assessed.
5. Conclusions
This study examined the impact of incrementally enlarging guide vane end clearances on internal flow and sediment-induced erosion in a Francis turbine at Genda Power Station under sediment-laden conditions, employing a hybrid methodology of numerical simulation and experimental testing. A sediment erosion model for pertinent materials was established using sediment erosion tests. The primary conclusions are as follows:
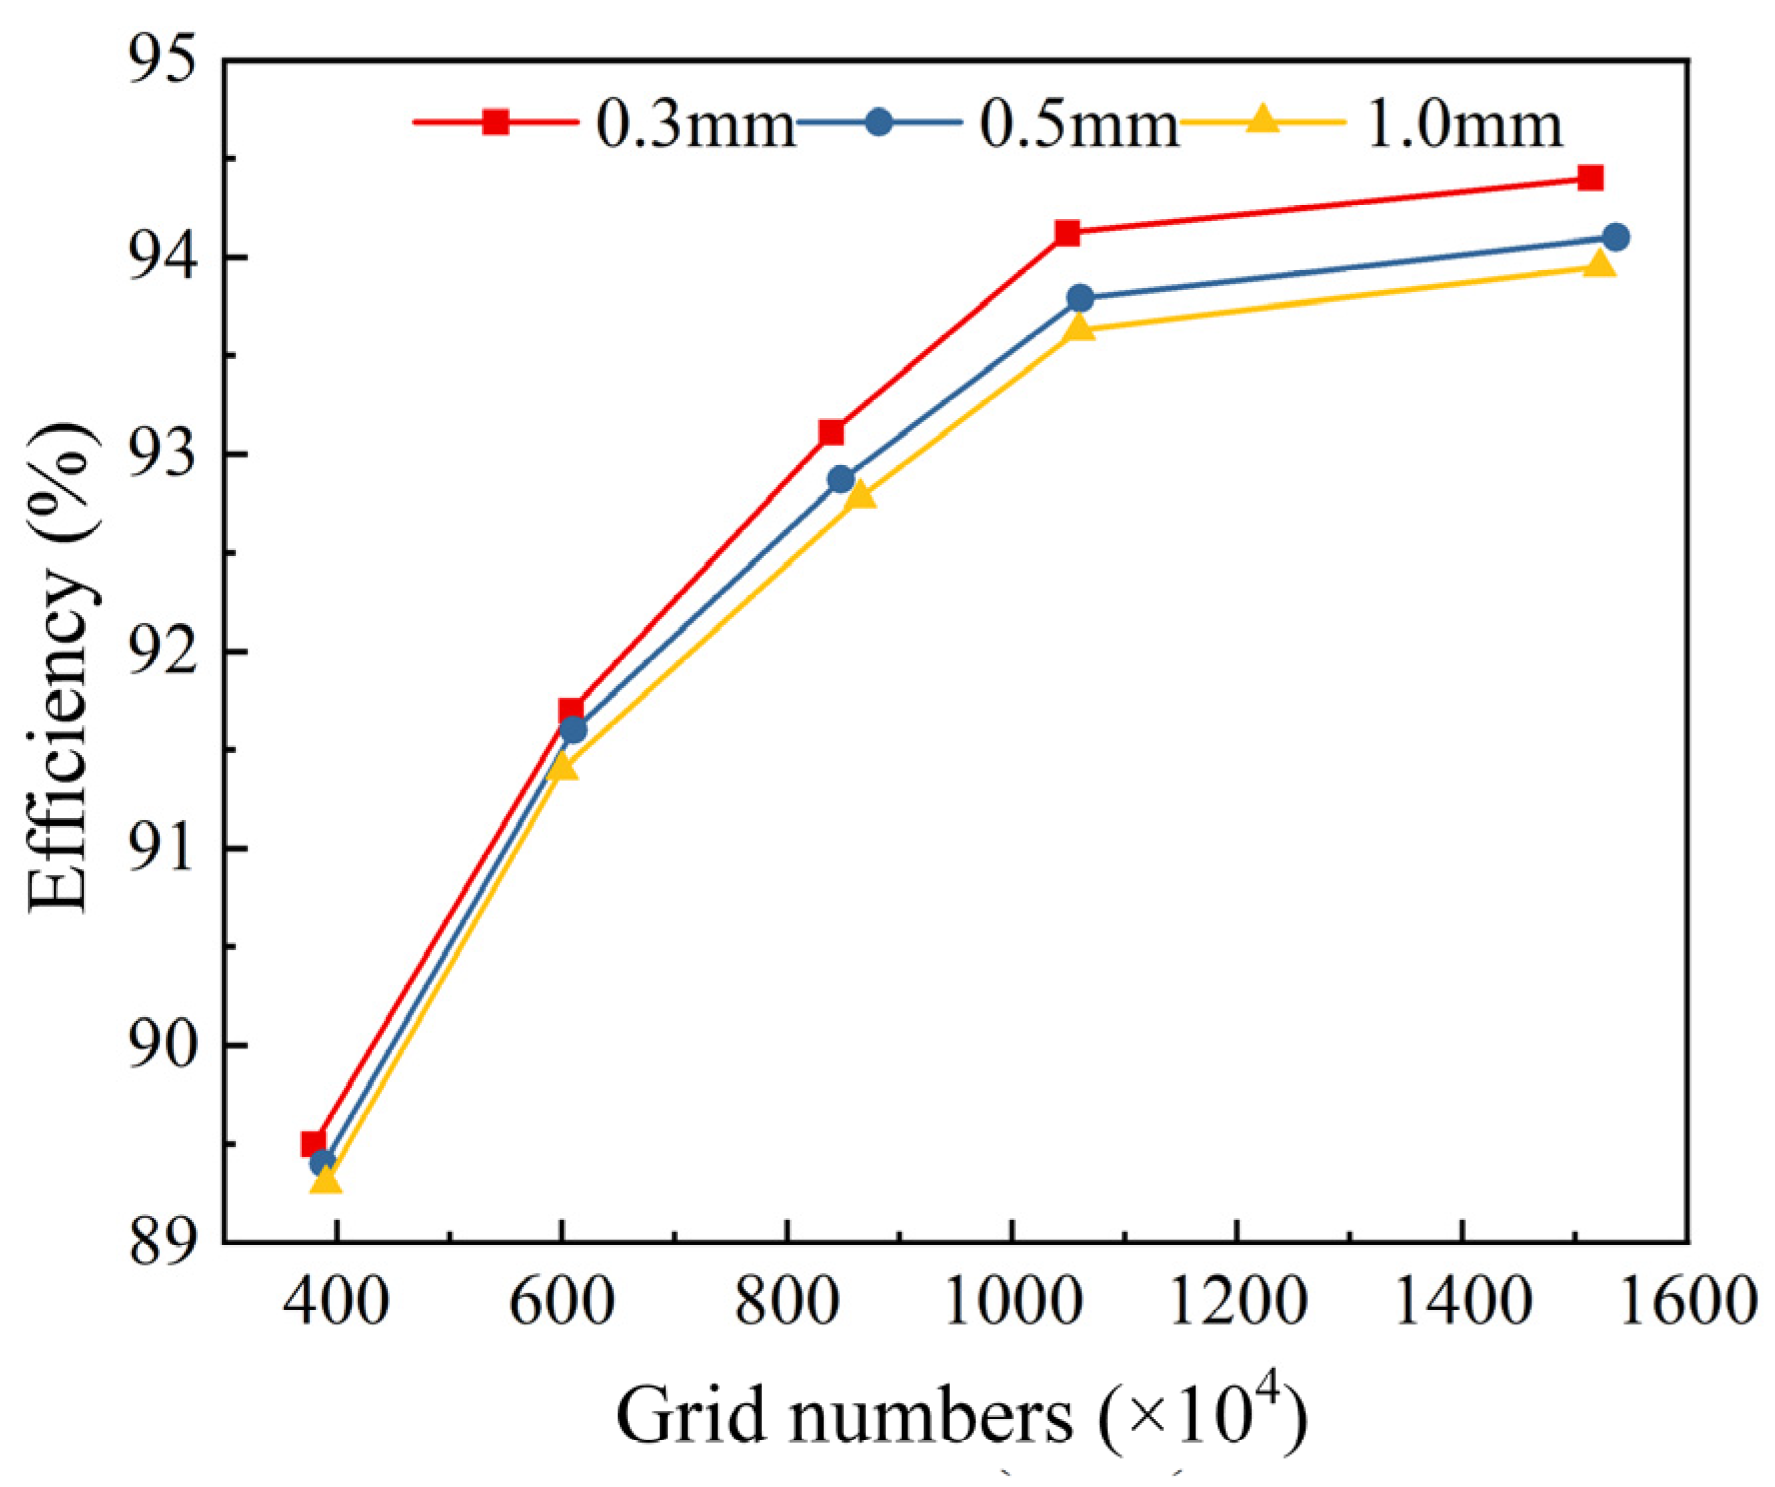
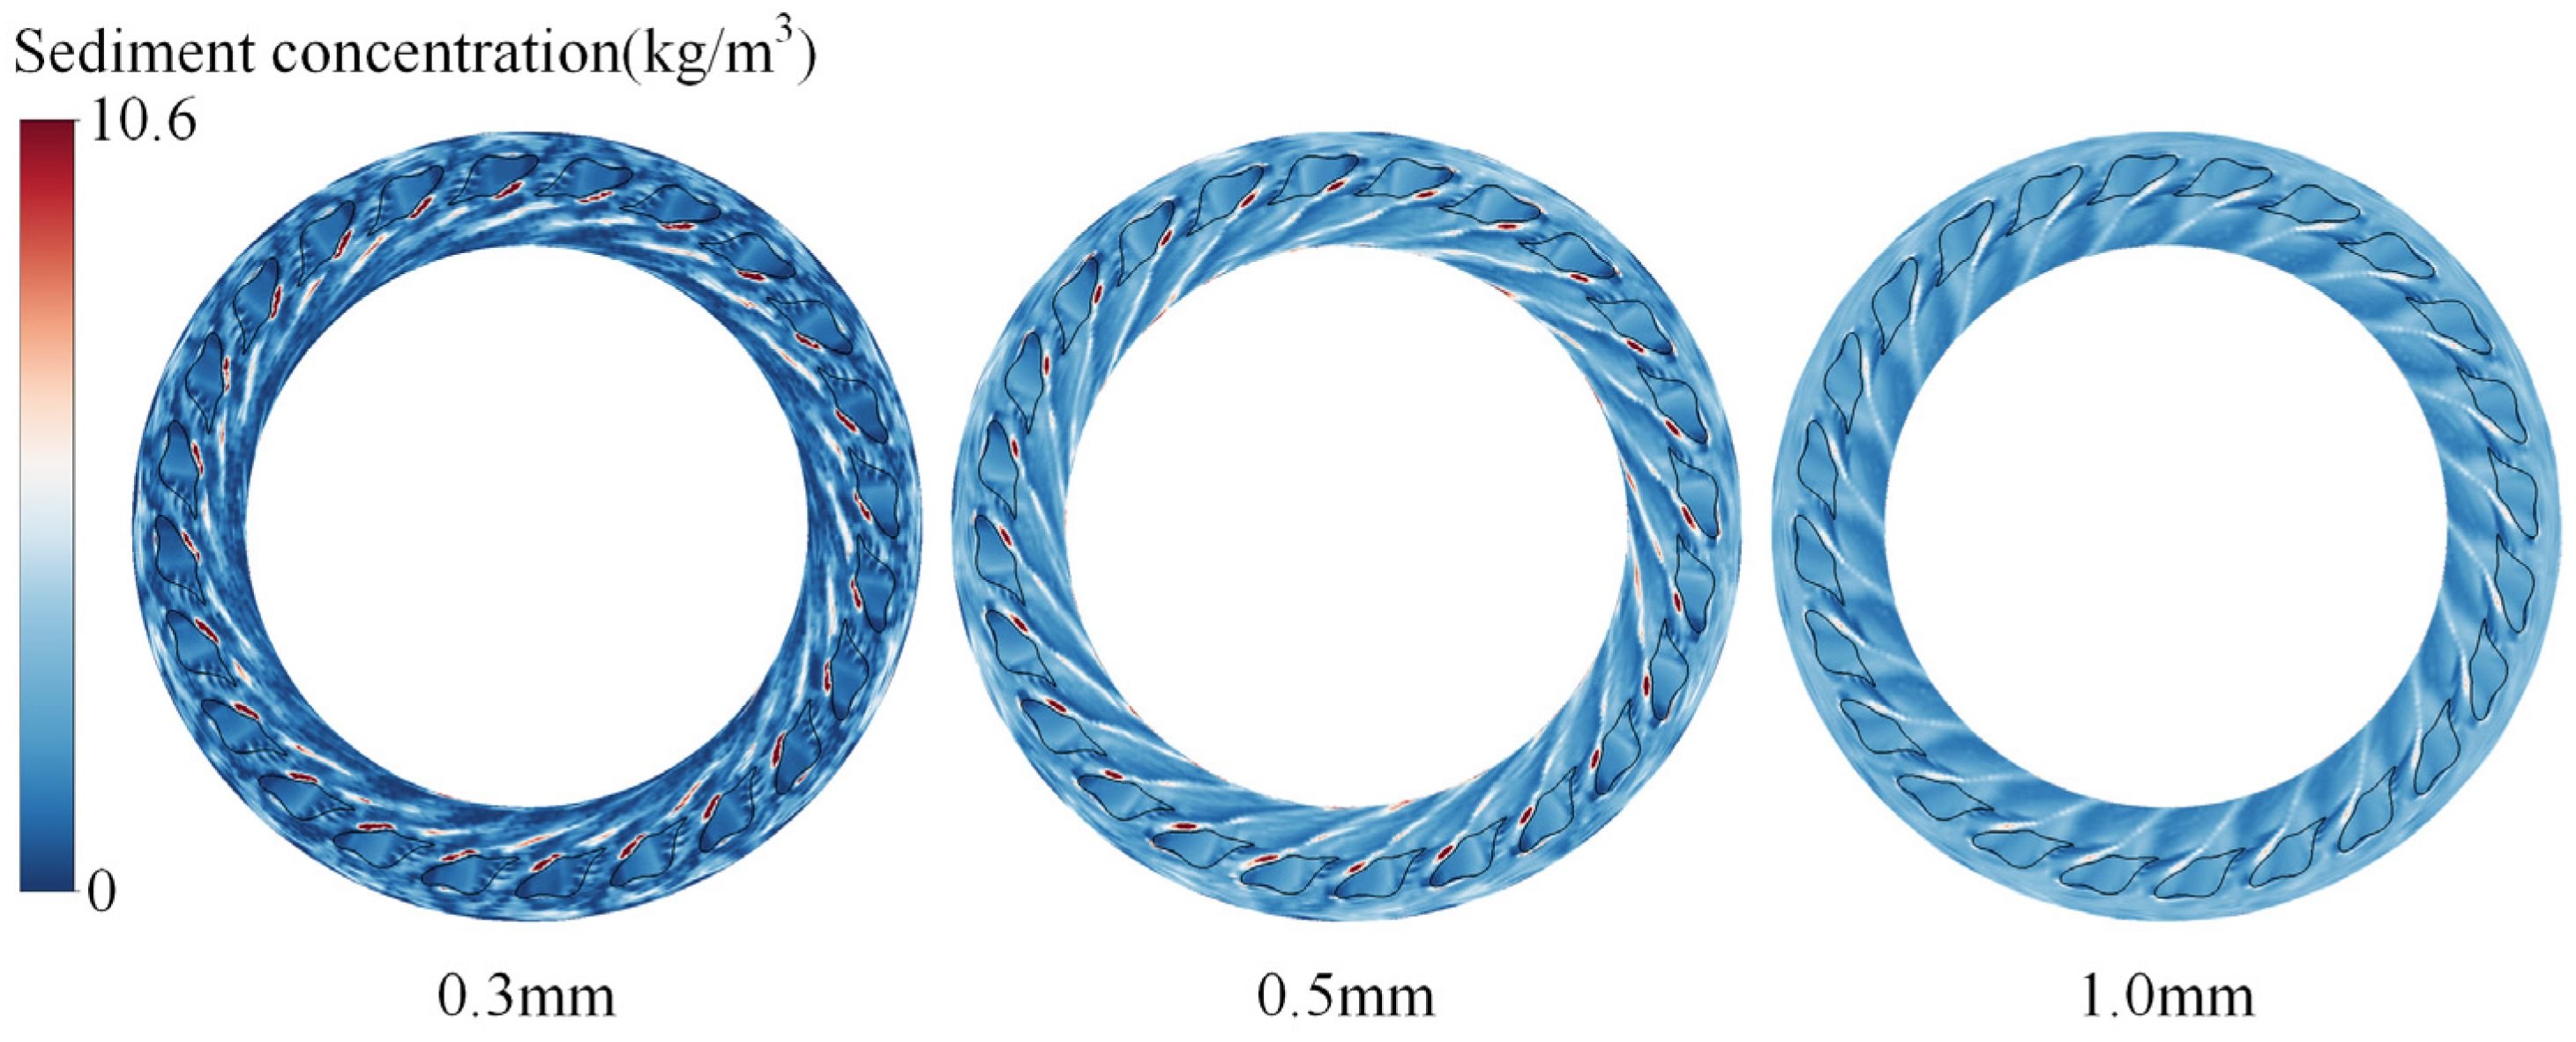
(1) As the guide vane end clearance grew from 0.3 mm to 1.0 mm, the leakage flow increased (flow rate +1.36%, torque +0.78%). Nonetheless, secondary flows generated by the leakage, which deplete turbulent kinetic energy, resulted in a decrease in efficiency from 94.12% to 93.63% (a decline of 0.49%). The augmented clearance resulted in an elevated sediment velocity gradient, enhancing particle kinetic energy and substantially increasing erosion hazards. Furthermore, silt concentration within the clearance augmented with wider gaps. Under the 1.0 mm clearance condition, the overall sediment concentration in the gap exceeded that of lesser clearance scenarios, hence intensifying sediment erosion.
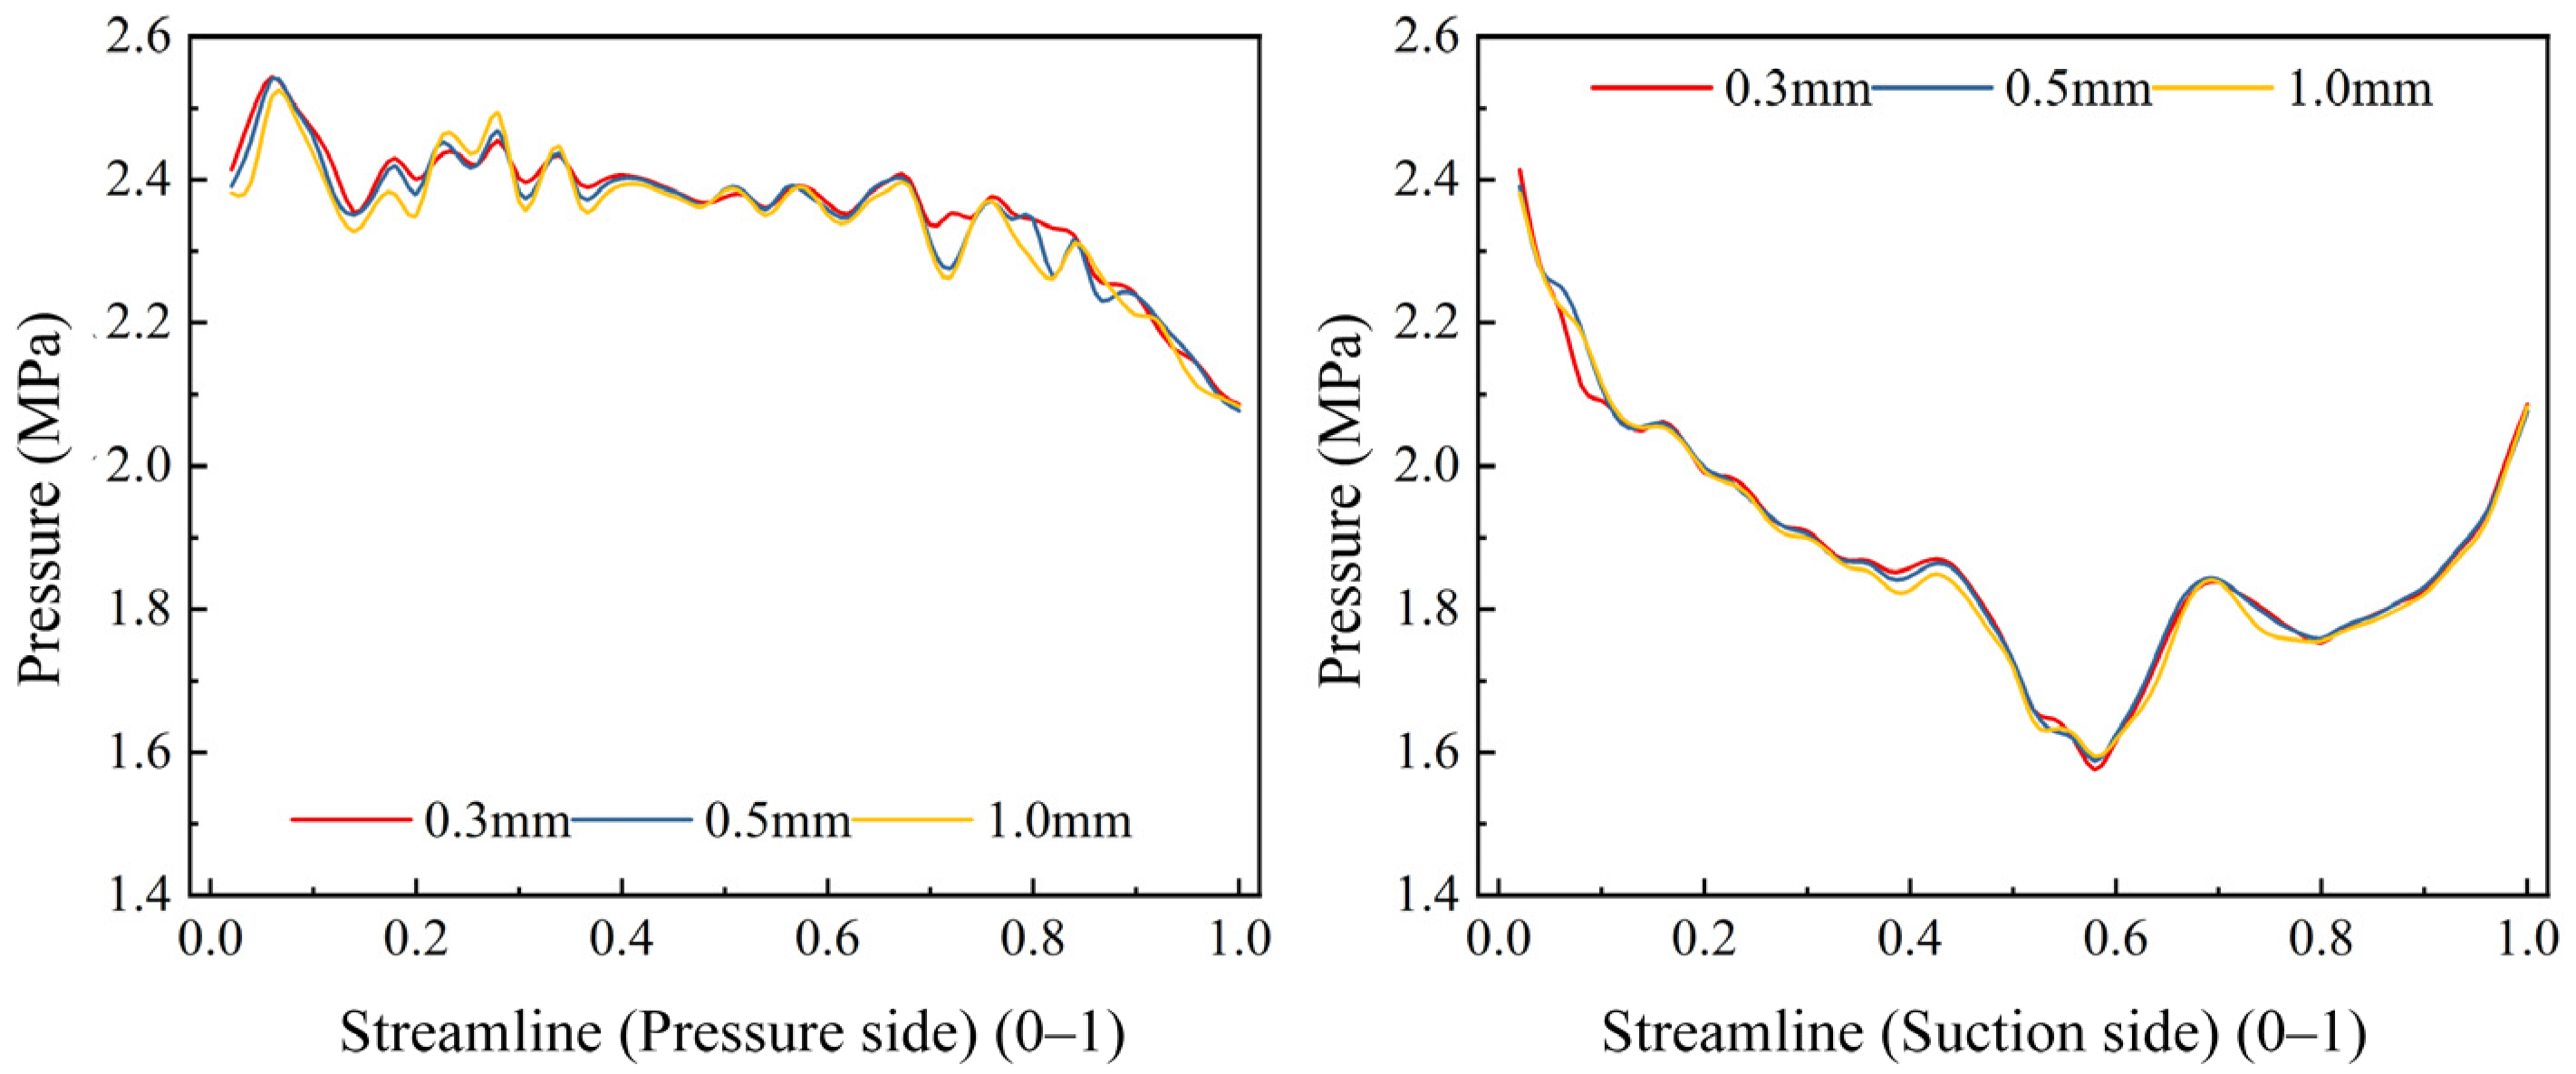
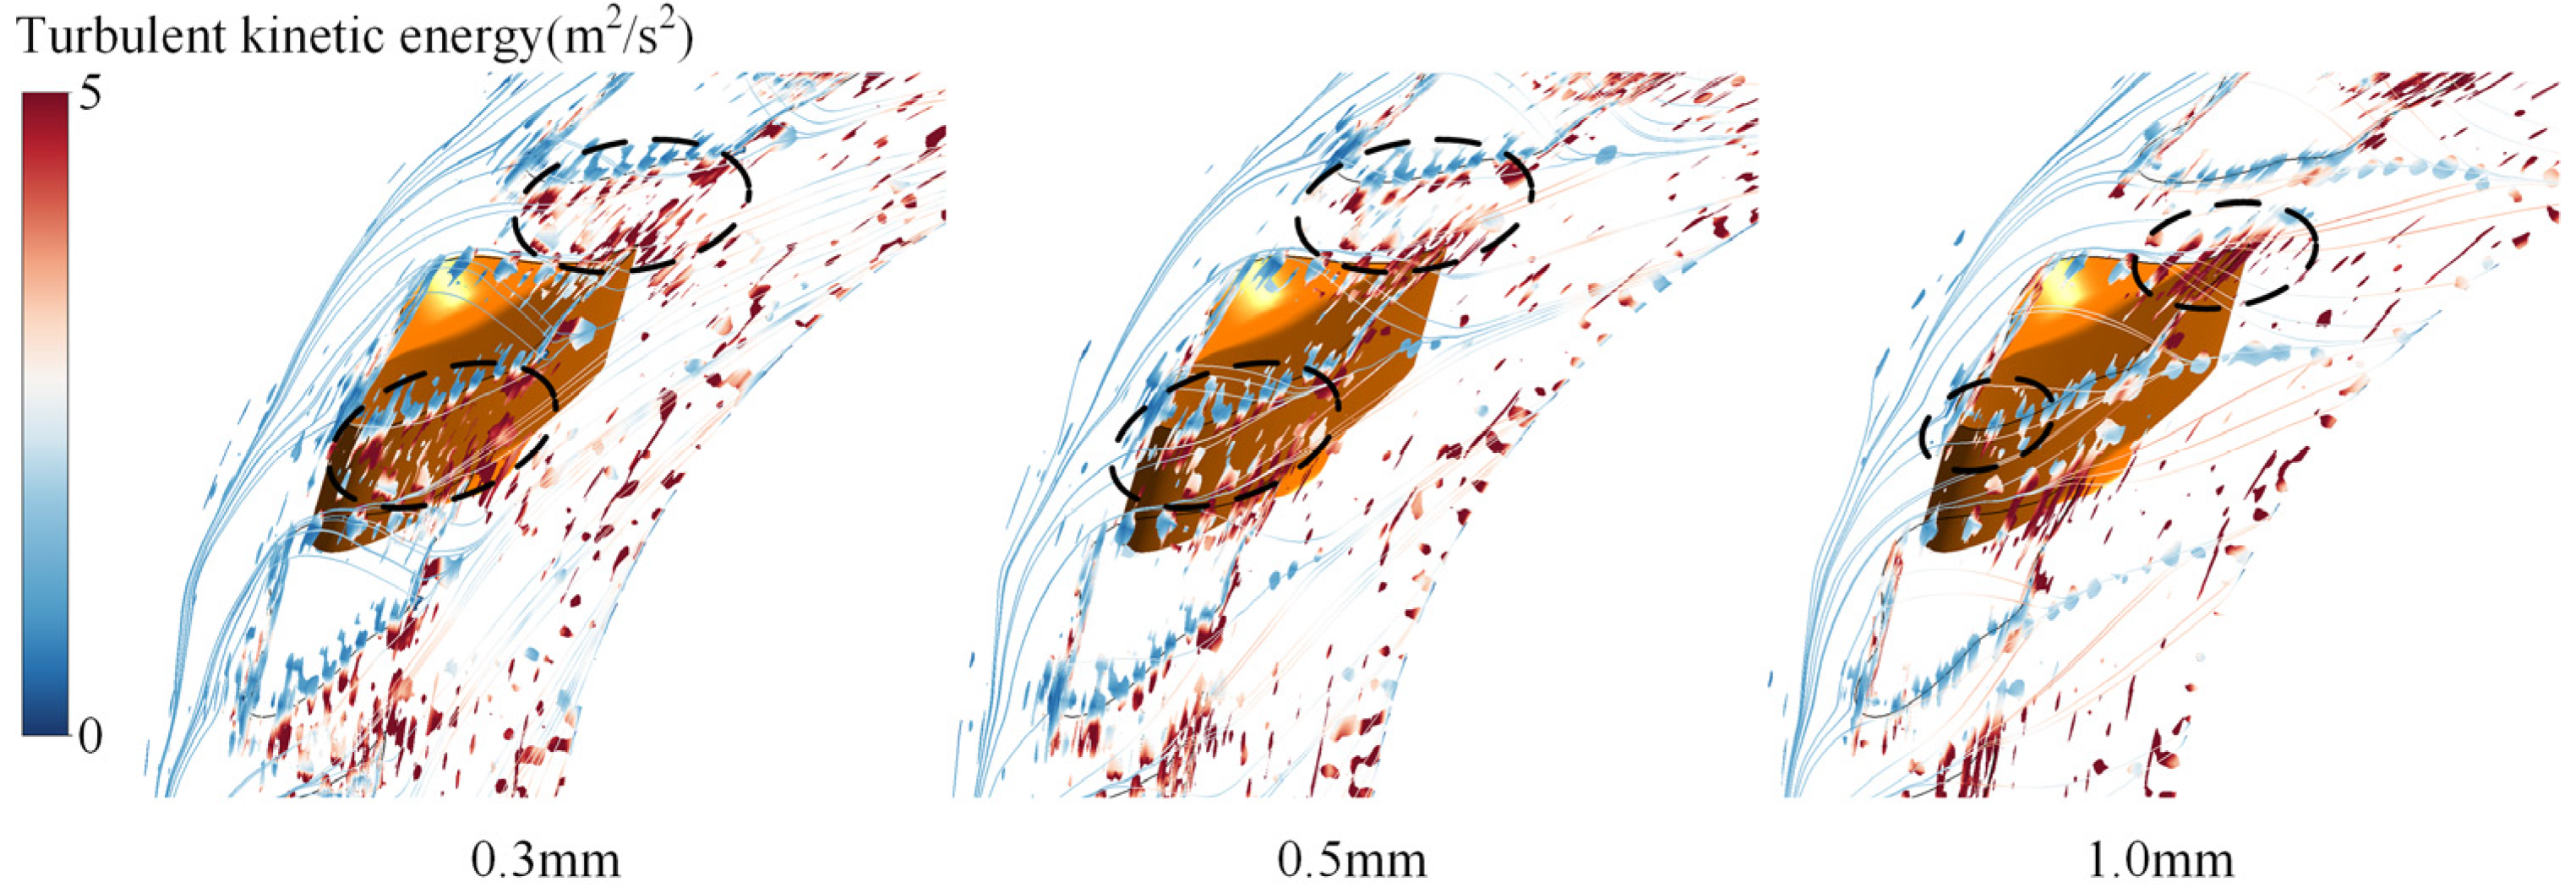
(2) The increase in guide vane end clearance resulted in a small reduction in the pressure differential across the gap. At a 0.3 mm clearance, streamlines conformed closely to the vane surface, exhibiting no notable flow separation. A 0.5 mm clearance resulted in a high-velocity jet with an impingement angle of roughly 30° at the gap exit, causing local flow separation. At a clearance of 1.0 mm, the augmented leakage flow affected the primary stream, leading to vortex formations and a marked rise in flow separation within the vaneless region. Increasing the clearance resulted in the high-turbulent-kinetic-energy region transitioning from a distribution across guide vanes to a concentration along the trailing edge, with more frequent vortex collapse exacerbating small-scale turbulence.
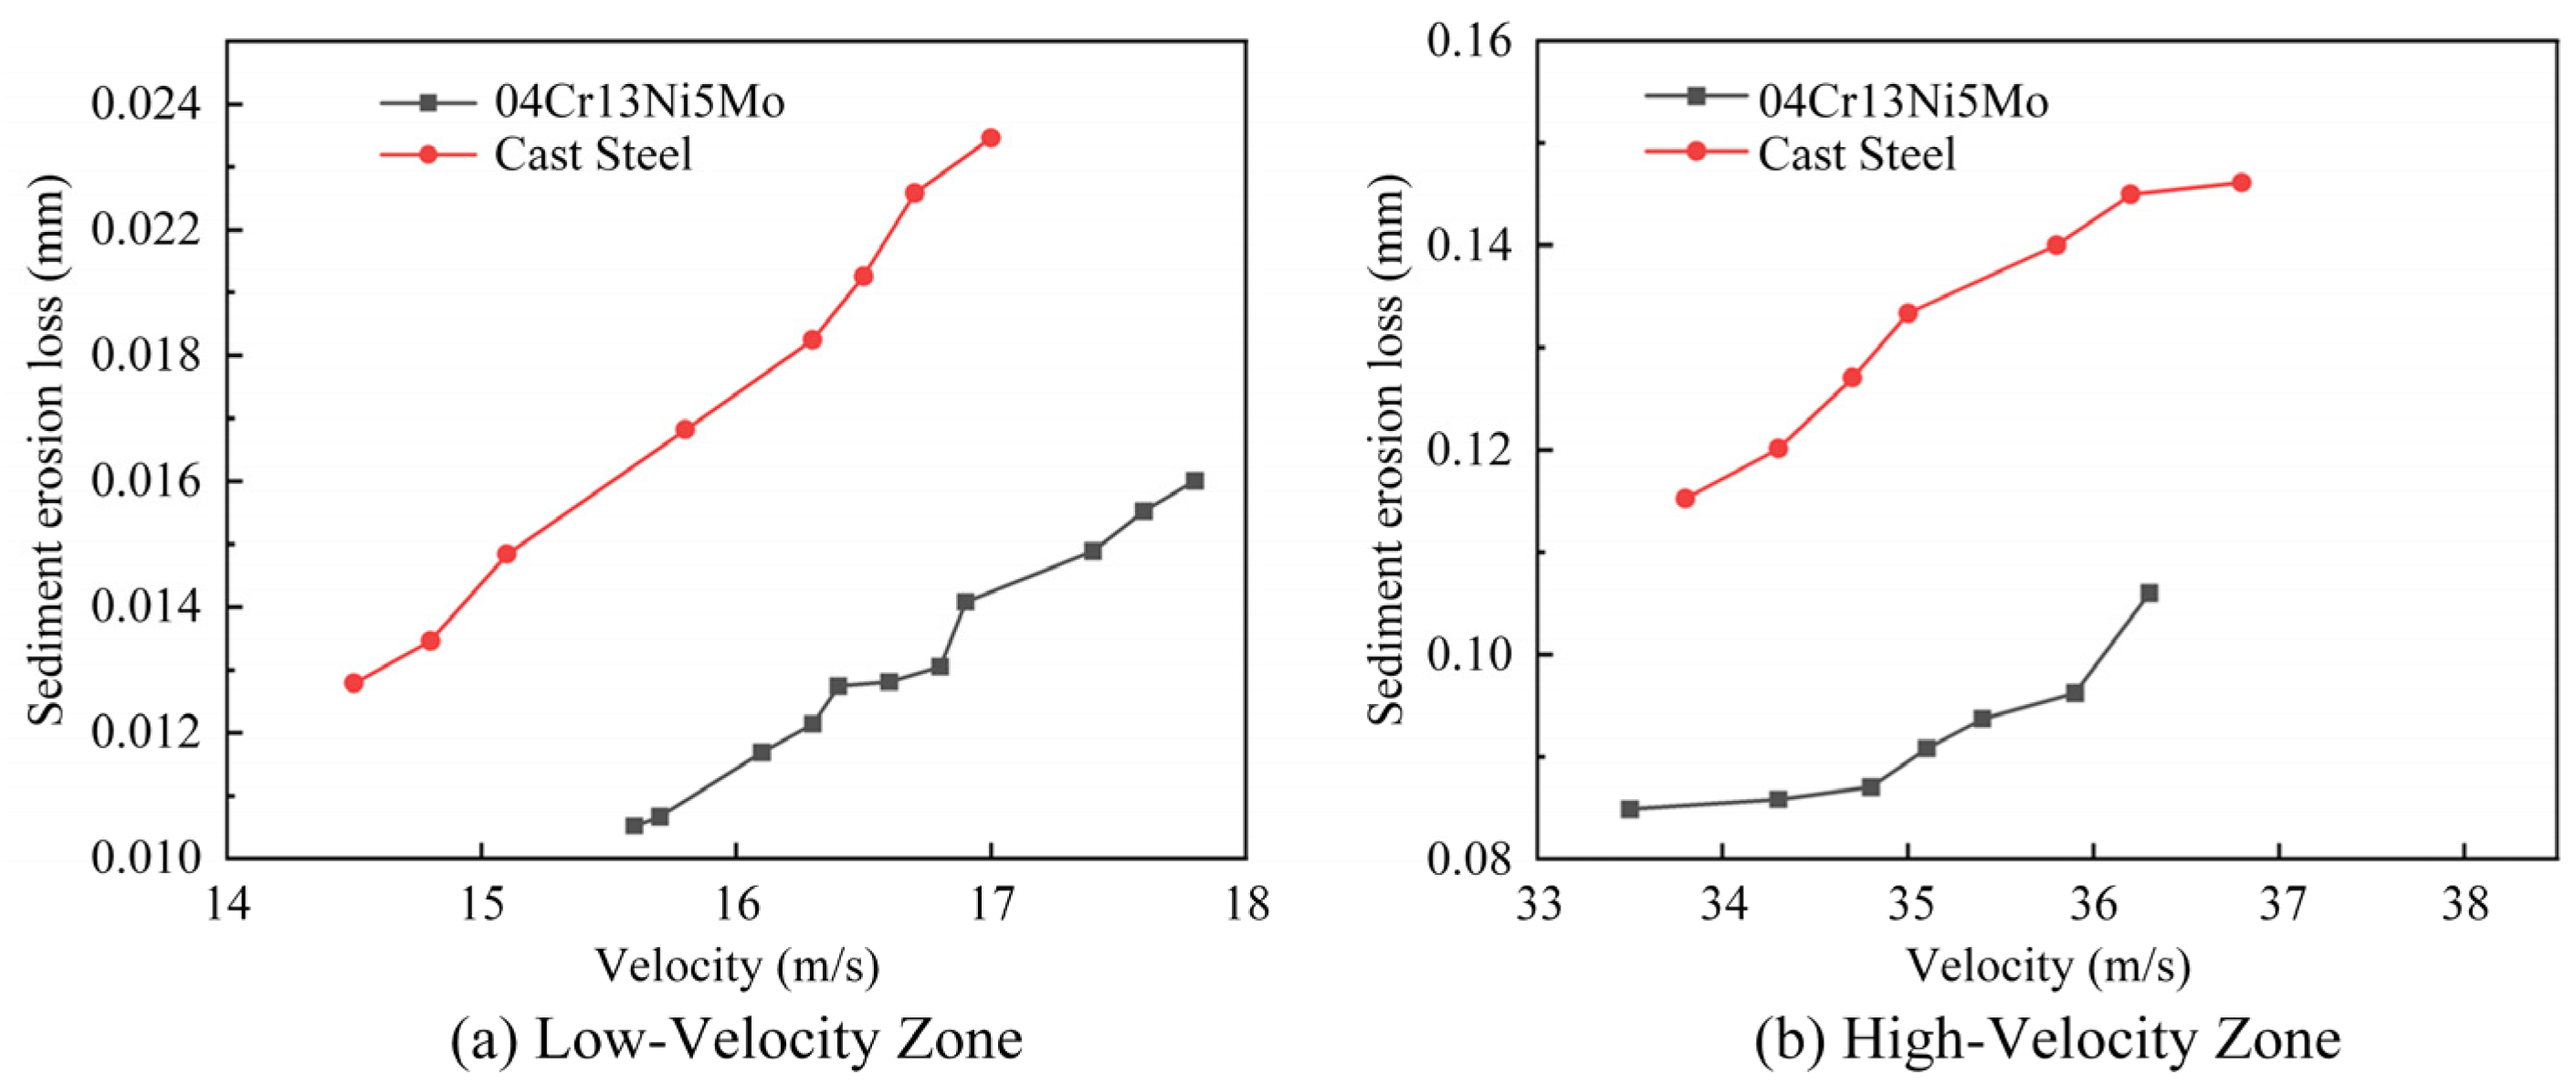
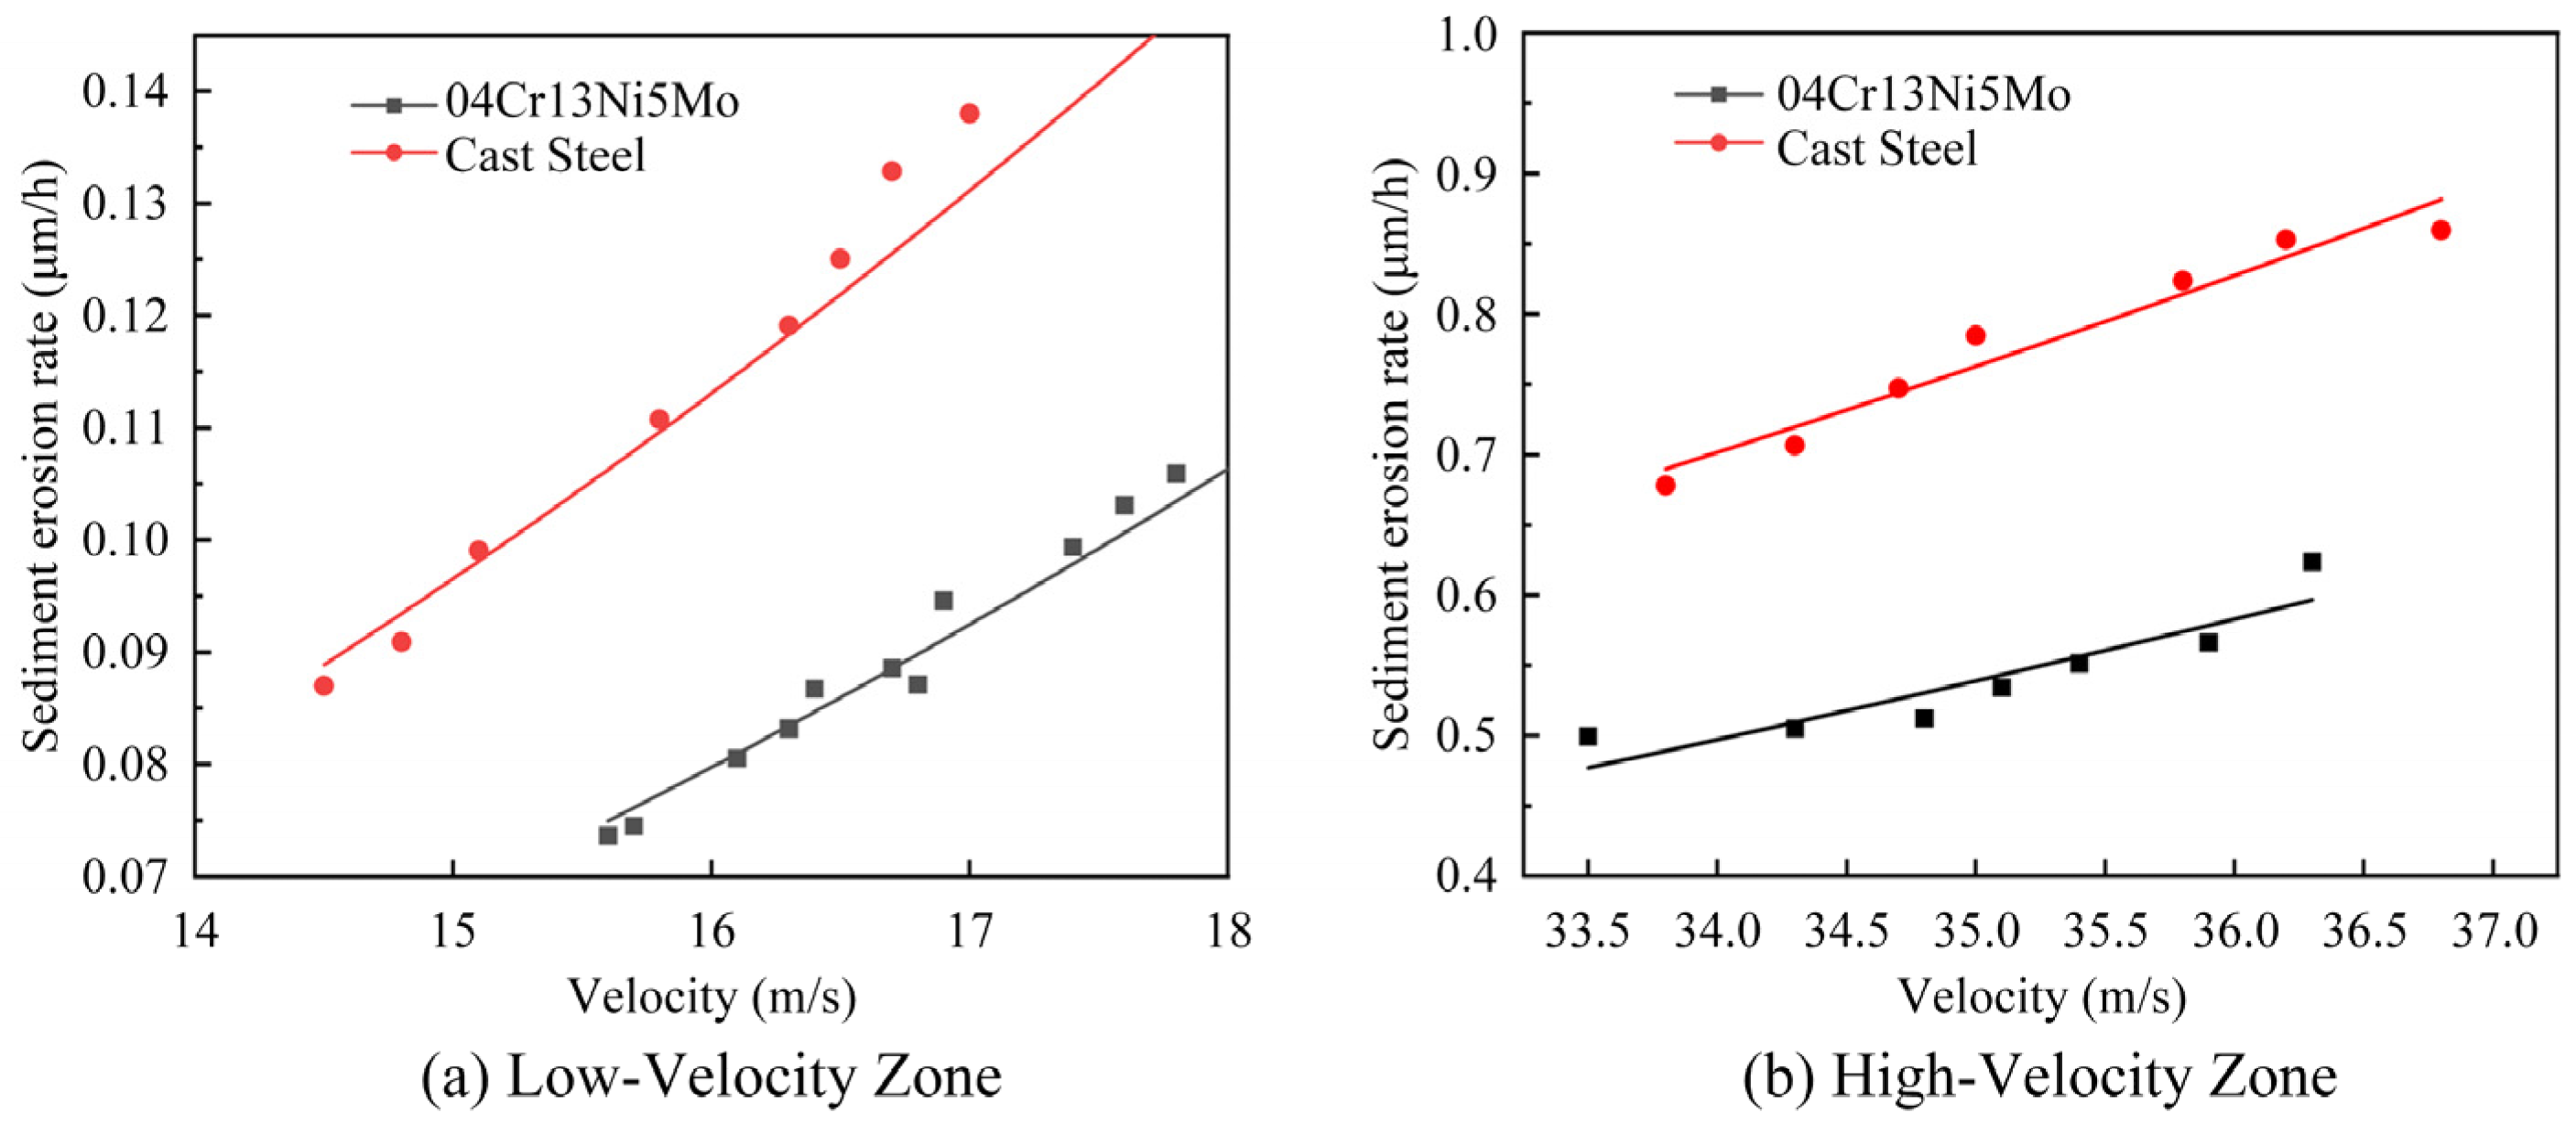
(3) The sediment erosion-resistant material (04Cr13Ni5Mo) exhibited markedly superior performance compared to the basis material (cast steel), especially in high-velocity areas. The sediment erosion rate demonstrated a power-function correlation with flow velocity. Models for sediment erosion rates were developed for various materials and regions: for the sediment erosion-resistant plate (04Cr13Ni5Mo), the erosion rate is expressed as E = 9.11 × 10⁻⁵W2.44, while for the base material (cast steel), it is E = 1.35 × 10⁻⁴W2.45. These models offer a mathematical foundation for anti-erosion design.
(4) It is recommended that the guide vane top cover clearance be strictly controlled at the lower design limit during maintenance to suppress leakage flow, reduce efficiency loss, and mitigate wear risk. For high-pressure and high-velocity regions, the application of 04Cr13Ni5Mo erosion-resistant steel plates is advised to replace the base cast steel, thereby significantly extending the maintenance interval. The established wear model can provide a quantitative reference for material selection and life prediction in similar power stations.
(5) This study has certain acknowledged limitations. The wear tests were performed under steady-state circumstances and consequently do not account for the influence of transient load fluctuations observed in real-world operation. Consequently, the applicability of the established wear model, which is calibrated to the specific sediment features and materials of the Gengda Power Station, may be limited, and its extrapolation requires careful study. Addressing these restrictions will be a significant focus of future development.
