Article

Structural Responses of the Net System of a Bottom-Mounted Aquaculture Farm in Waves and Currents

1
College of Shipbuilding Engineering, Harbin Engineering University, Harbin 150001, China
2
Yantai CIMC Blue Ocean Technology Co., Ltd., Yantai 264000, China
3
Yantai Research Institute, Harbin Engineering University, Yantai 264000, China
4
State Key Laboratory of Mariculture Biobreeding and Sustainable Goods, Yellow Sea Fisheries Research Institute, Chinese Academy of Fishery Sciences, Qingdao 266071, China
*
Author to whom correspondence should be addressed.
J. Mar. Sci. Eng. 2025, 13(10), 1900; https://doi.org/10.3390/jmse13101900
Submission received: 10 September 2025 / Revised: 21 September 2025 / Accepted: 27 September 2025 / Published: 3 October 2025
(This article belongs to the Special Issue Structural Analysis and Failure Prevention in Offshore Engineering)

Abstract

This study investigates the hydrodynamics of the net system of the bottom-mounted aquaculture farms located in the Bohai Sea, addressing the growing demand for high-quality aquatic products and the limitations of coastal aquaculture. Based on the validation part, the established lumped-mass method integrated with the finite element method ABAQUS/AQUA was employed to evaluate the structural responses of the net system with three arrangement schemes under diverse environmental loads. The hydrodynamic loads on net twines are modeled with Morison formulae. With the motivation of investigating the trade-offs between volume expansions, load distributions, and structural reliabilities, Scheme 1 refers to the baseline design enclosing the basic aquaculture volume, while Scheme 2 targets to increase the aquaculture volume and utilization rate and Scheme 3 seeks to optimize the load distributions instead. The results demonstrate that Scheme 1 provides the optimal balance of structural safety and functional efficiency. Specifically, under survival conditions, Scheme 1 reduces peak bottom tension rope loads by 14% compared to Scheme 2 and limits maximum netting displacement to 4.0 m. It is 21.3% lower than Scheme 3, of which the displacement is 5.08 m. It has been confirmed that Scheme 1 effectively minimizes collision risks, whereas the other schemes exhibit severe collisions. Scheme 1 trades off maximum volume expansion for optimal load management, minimal deformation, and the highest overall structural reliability, making it the recommended design. These findings offer valuable insights for the design and optimization of net systems in offshore aquaculture structures serviced in comparable offshore regions.

1. Introduction

Deep-sea aquaculture presents significant advantages, allowing for the production of cleaner and healthier aquatic products. It also helps reduce the occupancy of nearshore farming spaces and alleviates environmental pressures on coastal areas. As a result, deep-sea aquaculture has attracted substantial global interest, with countries such as Norway, Japan, and the United States leading in the development of technology and equipment for species like salmon and bluefin tuna [1,2,3]. In contrast, the nearshore aquaculture industries in China face numerous challenges. These include spatial saturation, water pollution, eutrophication, disease outbreaks, a suboptimal industrial layout, and reliance on low-end production methods. Most nearshore operations are located in shallow waters, typically less than 10 m depth, which not only leads to ecological damage but also increases vulnerability to disasters like typhoons [4]. These challenges highlight the urgent need for China to transform its marine fishery industry towards sustainable development. This transformation should focus on expanding deep-sea aquaculture and improving the associated facilities and equipment.
Developing deep-sea aquaculture facilities in China presents several critical challenges. First is the issue of mooring and positioning [5]. The Bohai Sea’s relatively shallow depths and gentle coastal slopes render conventional deep-sea mooring systems inadequate. This creates difficulties in achieving sufficient anchor holding capacity and stability, particularly under complex currents affecting positioning accuracy. The second challenge arises from the frequent typhoons in the region [6]. These storms require high structural strength, posing challenges related to the vulnerability of connection points and the process of emergency repairs. The third challenge involves the safety of net systems [6], a safety-critical and hydrodynamically complex component of large-scale cage platforms. The performance of these net systems directly affects structural integrity, fish containment, and operational resilience in harsh environmental conditions. Failures in net systems, as observed in nearshore operations, can lead to significant fish escapes, resulting in economic losses estimated in the millions of dollars per incident and causing disruptions to the ecosystem.
Numerous researchers focus on the hydrodynamics of net systems in offshore aquaculture structures, since the discrepancies of the structural stiffnesses between net twines and rigid steel trusses are considerable [7]. The subjected hydrodynamic loads and the resultant deformations are emphasized in relation to the affected factors [8,9]. Løland et al. [10,11] pioneered empirical formulas for velocity attenuation and drag coefficients related to netting solidity. Tang et al. [12] analyzed material and knotting effects, while Tsukrov et al. [13] measured lower resistance for copper-alloy nets. Lader et al. [14,15] and Song et al. [16] studied wave forces on plane netting. Sho et al. [17,18] examined oscillatory flow effects, and Balash et al. [19] combined experiments and lumped mass simulations. Swift et al. [20] measured loads on fouled nets in situ, attributing increased loads to elevated effective solidity, while Lader et al. [21] replicated hydroid fouling effects experimentally. The numerical methods have been pretty prevalent in the past decades due to the evolution of computational abilities. Tsukrov et al. [22] used finite element methods for netting systems, Lee et al. [23] employed mass-spring models, and Lader et al. [24] developed 3D models showing good agreement at low Reynolds numbers. Moe et al. [25] studied netting material tensile properties and resistance to damage (e.g., cod bites) [26]. The significant deformation of netting and mooring lines under environmental loads poses critical safety challenges, as evidenced by cage failures during typhoons. This highlights the need for enhanced safety design and analysis under extreme conditions.
The Bohai Sea poses significant challenges for bottom-mounted cage platforms [27]. With an average depth of 18 m, the sea experiences harsh conditions from October to March, including strong, persistent northwest winds, maximum wave heights exceeding 8 m, and current velocities of up to 1.5 m/s. During the summer, southeasterly winds prevail, and typhoons may impact the region in July and August. High seawater temperatures in the summer lead to severe biofouling on the netting. The tidal current is primarily semi-diurnal, with its strength peaking near the Laotieshan Channel, as illustrated in Figure 1. The combination of enormous waves, strong currents, and biofouling issues places considerable loads on structures, presenting substantial challenges for material properties and structural design configurations.
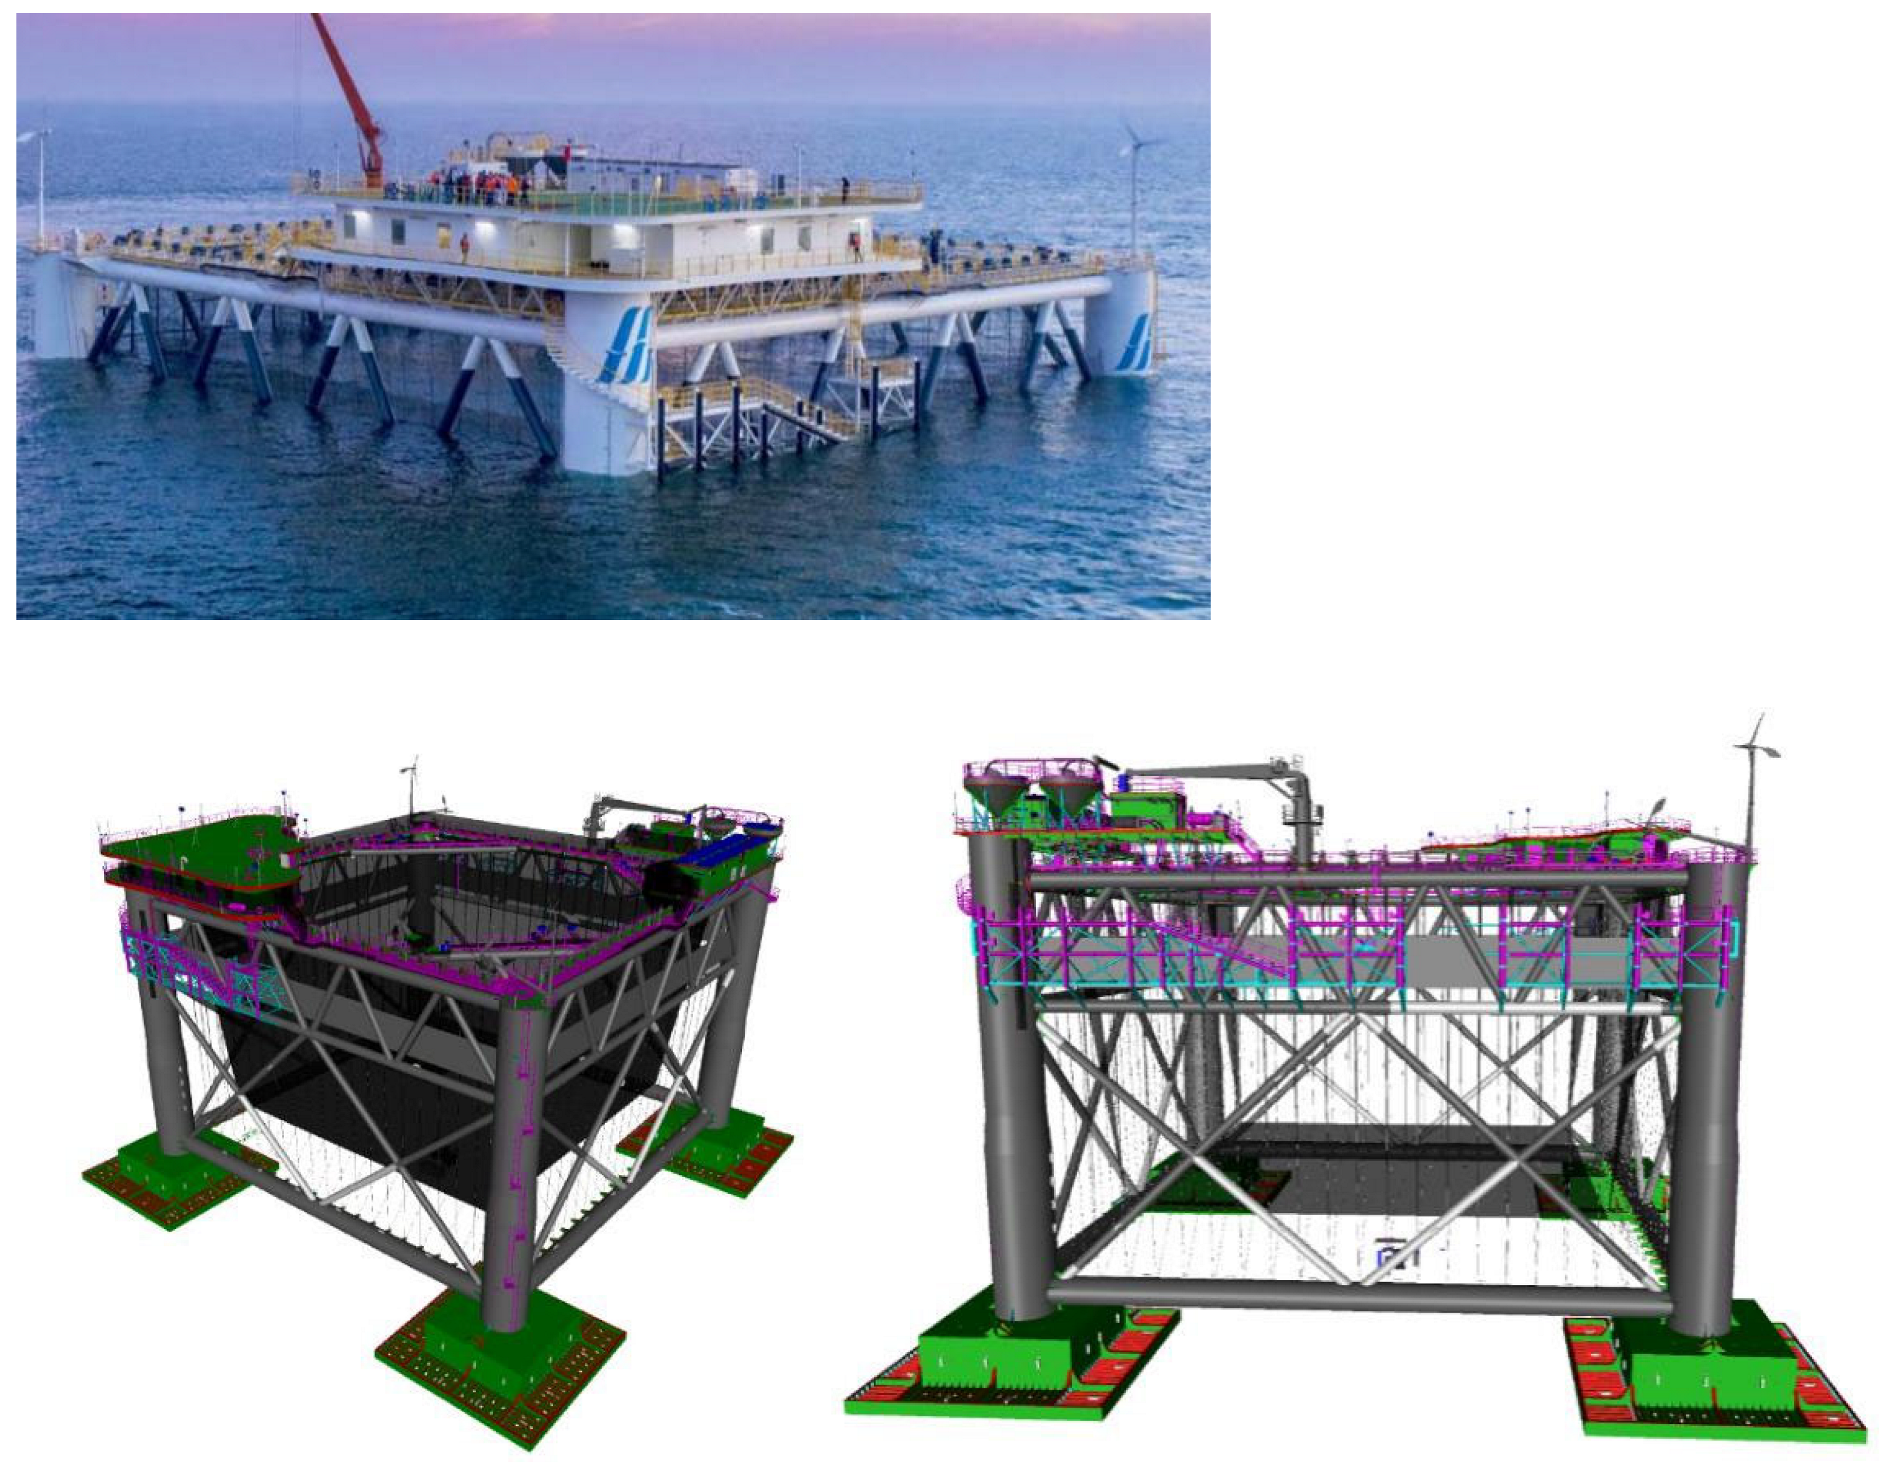
The most representative bottom-mounted aquaculture farm developed for the Bohai Sea, as depicted in Figure 2, is a novel structure primarily composed of large truss steel structures and complex netting systems. The platform is designed for deployment in suitable, deeper locations within the Bohai Sea, where water depths can accommodate the 30 m operating draft. As given in Figure 2, the platform structure consists of three main components; they are a large steel frame, a netting system, and a superstructure. With calculated dimensions of 68 m Í 68 m and a designed operating depth of 30 m, the netting components form a primary aquaculture module with an impressive capacity of 54,000 cubic meters. Thirty tension ropes are configured at the bottom to maintain the aquaculture space within the water depth of 30 m. The steel frame enhances overall stability and provides critical connection points for the netting system.
Due to the frequent typhoons that affect the Bohai Sea from July to August and the significant risks associated with biofouling, prioritizing structural survivability is essential over maximizing aquaculture volume, especially for the net systems. This study utilizes a validated finite element method and lumped mass method to assess the hydrodynamic characteristics of various net system designs. Focusing on the structural responses of three configurations of net systems, it offers initial insights into the configuration of net systems within large bottom-mounted cage platforms amidst the challenging conditions of the Bohai Sea. Additionally, the findings provide practical guidance for the future structural optimization of this unique net system. Section 2.1 gives the details of the numerical method, including the governing equations for the structural responses of nets and the formulations of hydrodynamic loads. Section 2.2 and Section 2.3 elaborate on the investigated net systems, the environmental conditions as well as all cases set up. Section 3.1 and Section 3.2 concentrate on the properties of the occurring loads and deformations amongst various schemes of net systems, while Section 3.3 focuses on the discussions regarding the comparisons and the design trade-offs to a deeper extent. Then, some conclusions are drawn in Section 4.

2. Material and Methods

2.1. Numerical Method

This section employs the lumped mass method to examine the structural responses of the net system under different configuration schemes. The effectiveness and accuracy of using the Morison force formula to model flexible and rigid net panels, fish cages, and fishing gear have been validated in previous studies [28,29,30,31]. The net structure is represented as a system of point masses connected by springs. Following Hooke’s law, which governs elastic behavior, the net twines are treated as individual spring elements. This formulation assumes that tension is transmitted purely axially along the twines, ignoring the effects of bending moments and transverse deformations. Hydrodynamic forces, calculated from the Morison equation, along with the inherent body forces of the net twines, are applied to adjacent nodal points. The detailed numerical framework is outlined below.

2.1.1. Governing Equations for the Structural Responses of Nets

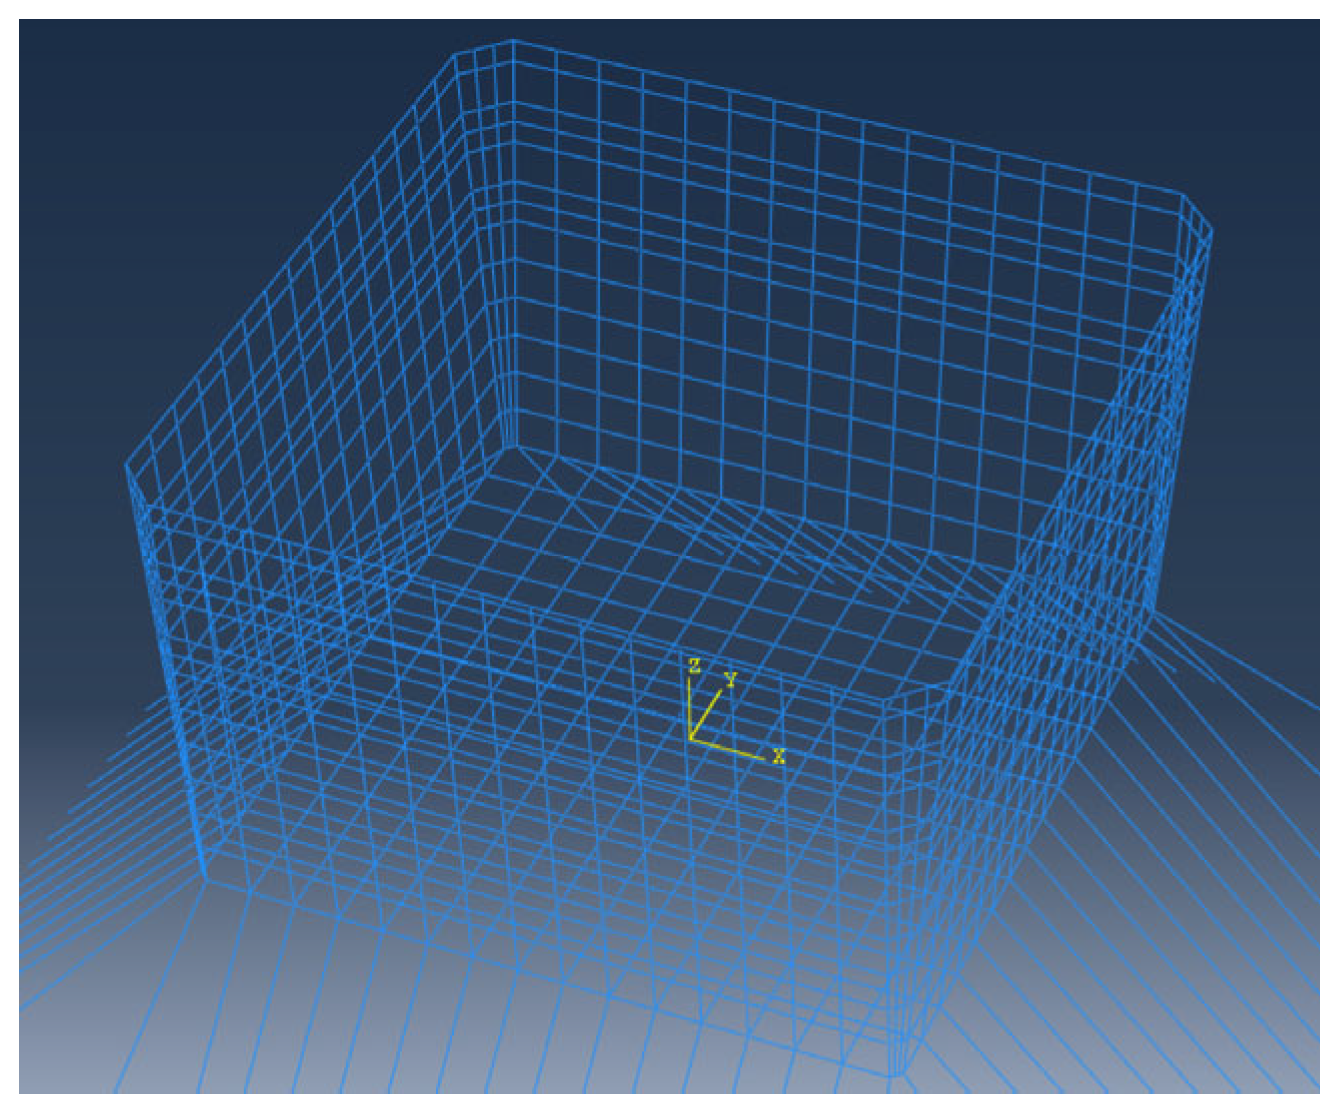
To facilitate the formulation of the structural responses of nets, a right-handed coordinate system is defined as follows. The coordinate system of the netting calculation model is shown in Figure 3. The coordinate origin is located at the center of the bottom netting, the XOY plane coincides with the bottom netting, and the Z-axis is perpendicular to the still water level and points upward.
Based on the lumped mass method, all the calculations are carried out using the ABAQUS/AQUA framework. The governing equation for describing the structural responses of nets, which technically models the displacement and the acceleration of each lumped-mass point, can be formulated as
[m]{} + [k]{x} = G + B + T + FH
where [m] and [k] denote the mass and stiffness matrices, respectively. The external forces acting on each lumped-mass point include gravity G, buoyancy B, hydrodynamic loads FH, including wave loads and current loads, and restoring tension force T of each bar. x and represent the displacement and acceleration of the lumped-mass points over the net, respectively. The numerical solution to Equation (1) lies in the Hilber–Hughes–Taylor implicit dynamic time advancement method, which is regarded as the upgraded version of the NewMark-β method and can be referred to in [32].

2.1.2. Hydrodynamic Loads on Nets: Morison Model

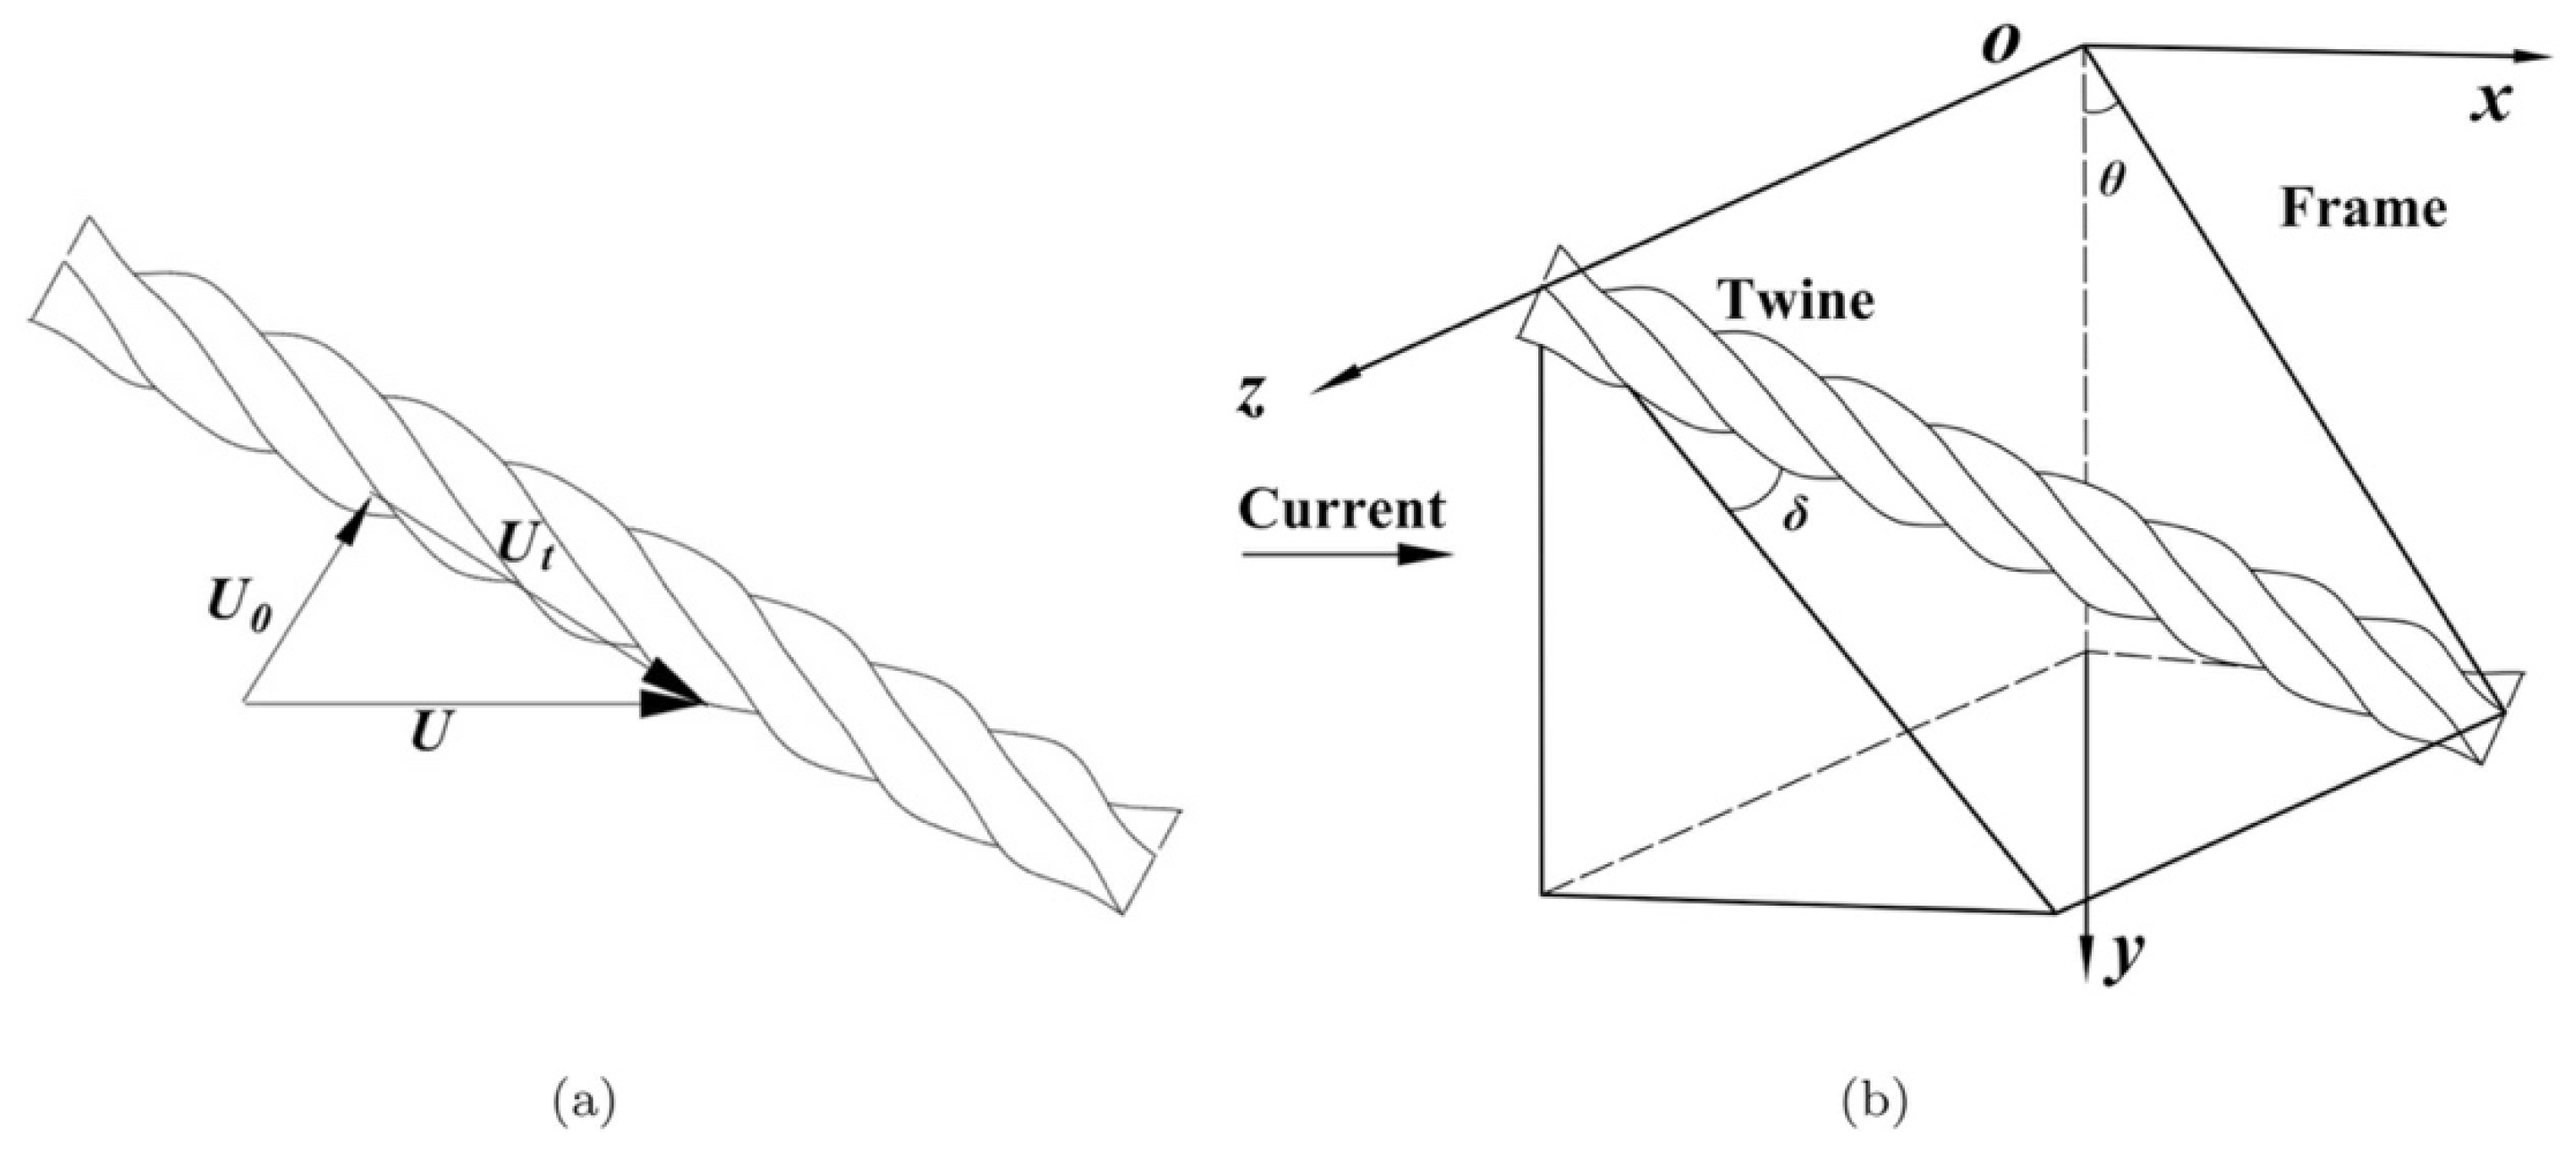
Evaluating the hydrodynamic load-bearing capacity of net systems in exposed regions is crucial for ensuring the safety of offshore aquaculture structures. The Morison hydrodynamic model, originally developed for analyzing moorings, pipelines, and circular monopiles in ocean engineering, has been adapted to assess the hydrodynamic loads on net twines used in aquaculture and fishing gear systems. There are three main reasons for choosing the Morison model over other options. First, it is straightforward and easy to implement in a finite element solver, as it is structured similarly to truss elements, as illustrated in Figure 4. This allows for a high-fidelity representation of the complex three-dimensional deformation of the large bag-shaped net structure under combined wave and current loads, which is a critical outcome of this study. Second, the compatibility of the framework ensures that the direct calculation of forces on individual elements within the Morison model integrates smoothly with the structural response solver in ABAQUS/AQUA. This integration provides a coupled hydrodynamic–structural solution that is essential for accurately predicting tensions in ropes and the deformation of the net system, capabilities that are less effectively handled by the integral nature of other net panel models.
Under the framework of the Morison model, the net is regarded as a series of hydrodynamically independent and non-interfering twines, which are divided into horizontal netting wires and vertical netting wires. The nodal influences can also be involved in the formulae of the Morison model [31]. In pure currents, the normal and tangential force Fn and Ft on a single net twine, relating to the diameter d and the length l, the velocity vector of the incoming flow U 0 and the velocity vector of the moving net twines V 0 , are defined as
F n = 1 2 C n ρ d l U 0 V 0 ( U 0 V 0 ) F t = 1 2 C t ρ d l U 0 V 0 ( U 0 V 0 )
As for the structural responses of net twines in the oscillatory flow, the Froude–Krylov term and the hydrodynamic mass term should be straightforwardly added to the F n , as
F n = ρ π 4 d 2 l U 0 ˙ + ρ C a π 4 d 2 l U 0 ˙ V ˙ 0 + 1 2 C n ρ d l U 0 V 0 U 0 V 0
where C a is the added mass coefficient for net twines, which can be referred to as 1.0 for cylindrical structures based on marine engineering practice. It should be noted that the hotspot for the load determination lies in the drag coefficients in the normal and tangential directions, Cn and Ct, respectively. The discussions about the determination of these coefficients remain open invariably, as the occurring loads are closely associated with net solidities, materials, and surface roughness, etc. Herein, the formulae to calculate Cn and Ct in the Morison model proposed by [33] and extended to a larger range of Re by [34] are extensively adopted for its applicability for fabric and rigid nets, which can be expressed as
C n = 8 π R e s 1 0.87 s 2 ,   0 < R e < 1 1.45 + 8.55 R e 0.90 , 1 < R e 30 1.1 + 4 R e 0.5 , 30 < R e 2.33 × 10 5 3.41 × 10 6 R e 5.78 × 10 5 , 2.33 × 10 5 < R e 4.92 × 10 5 0.401 1 e R e 5.99 × 10 5 , 4.92 × 10 5 < R e 10 7 C t = π μ ( 0.55 R e 1 / 2 + 0.084 R e 2 / 3 )
where μ is the dynamic viscosity of the viscous fluid, s = 0.077215655 + l n ( 8 / R e ) . It should be noted that Cn and Ct following the local coordinates of the net twine need to be transformed into the global axes using θ and δ in Figure 4. Cx, Cy, and Cz are given as follows and subsequently applied in ABAQUS/AQUA [28]
C x = C n 1 sin 2 θ cos 2 δ
C y = C n sin θ cos 2 θ cos 2 δ
C z = C n sin θ sin 2 δ cos δ 1 cos 2 θ cos 2 δ
In addition, the velocity reduction factor r is considered as the occurrence of the momentum loss of viscous fluids past a net panel. Then, the flow velocity at the front of the downstream net panels can be deduced as r U 0 . The value of r follows the recommendations of an experimental validation of the flexible gravity cage case in [29,35], which is determined as 0.8. In the published work [31], the current numerical framework integrated with ABAQUS/AQUA has been utilized to study the structural responses of both rigid metal and flexible fabric net panels, as well as the net cage and trawl fishing gear. The comparisons between the numerical results and experimental data show that the discrepancies in deformation specifications and loads remain below 15% on average. This indicates that the current numerical method is effective and yields satisfactory results, so there is no necessity of additional validation studies to be conducted in this paper.

2.2. Investigated Net Systems

This study proposes three net system designs based on the dimensions of the bottom-mounted cage platform. The type of twines in net systems is the ultrahigh molecular weight polyethylene (UHMWPE). The analyses of tensions on the netting ropes, tension ropes, and the deformation of the nets in various sea states confirmed that the most reasonable scheme is effective. The three netting arrangement schemes are referred to as Scheme 1, Scheme 2, and Scheme 3, as outlined in Table 1. Scheme 1 serves as the baseline design, enclosing the basic aquaculture water body with four side nets and one bottom net. It features a top rope measuring 51 × 51 m, a bottom rope measuring 42.75 × 42.75 m, and a net height of 30 m, with double-layer configurations at the corners and near the waterline. The nets have a vertical distance ranging from −2 m to 4 m, allowing for effective mitigation of marine debris damage. Scheme 2 aims to increase aquaculture volume and utilization by lowering the bottom of the netting by 2 m, increasing the netting height, reducing the inner netting angle from 4°, and increasing the vertical rope spacing by 0.5 m. Scheme 3 seeks to optimize load distribution while maintaining aquaculture volume through similar geometric adjustments: lowering the netting bottom by 2 m, increasing the netting height, raising the tension rope-netting bottom angle by 13°, and increasing the vertical rope spacing by 1 m. The vertical distance between the netting bottom and seabed is 11.08 m for Scheme 1 and 9.08 m for Scheme 2 and Scheme 3, with an average tidal depth of 32.5 m. These modifications were designed to explore the trade-offs between volume expansion, load distribution, and structural reliability.
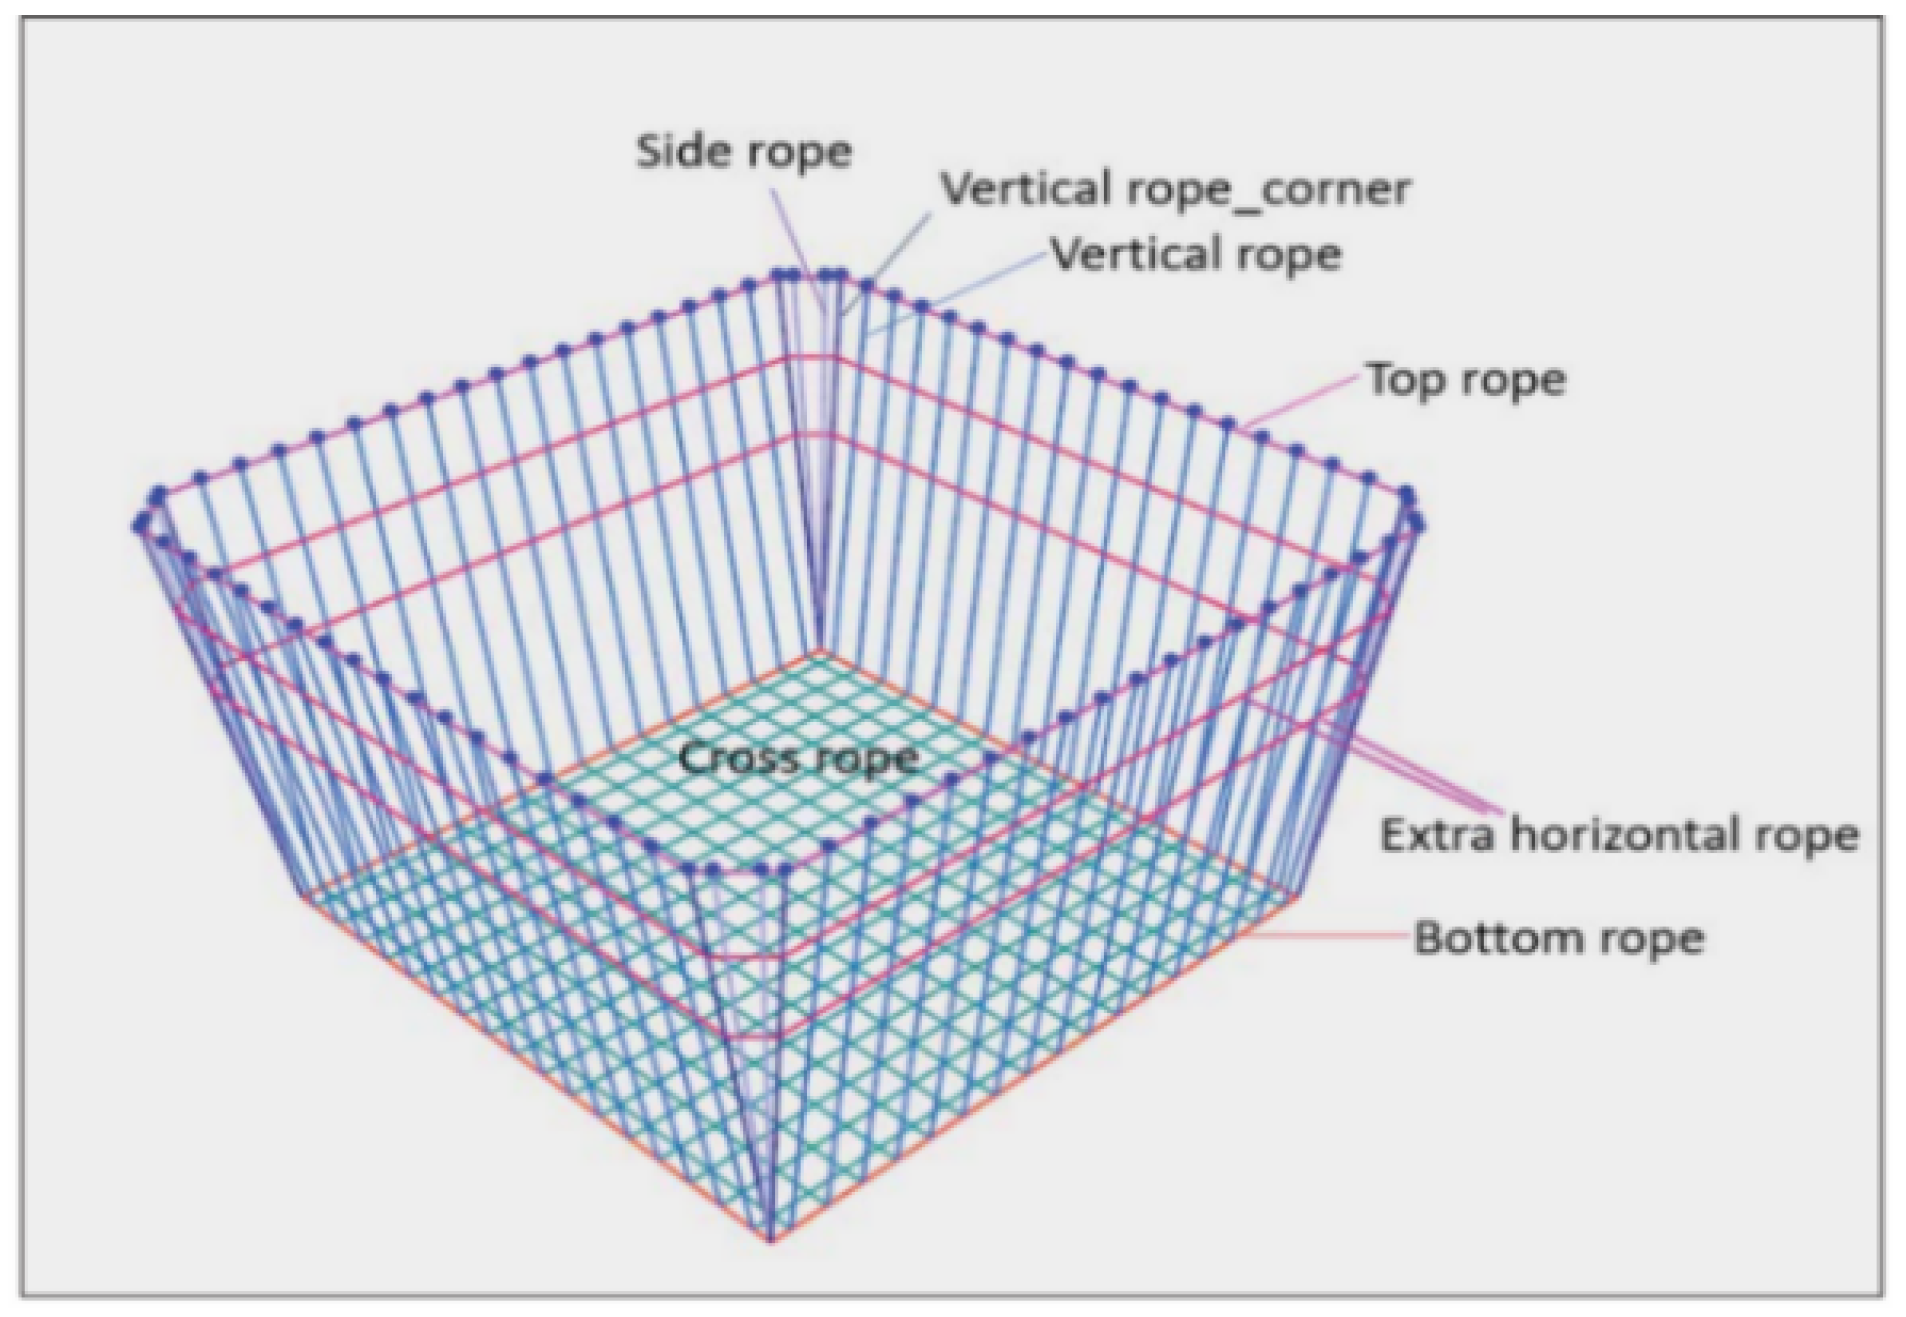
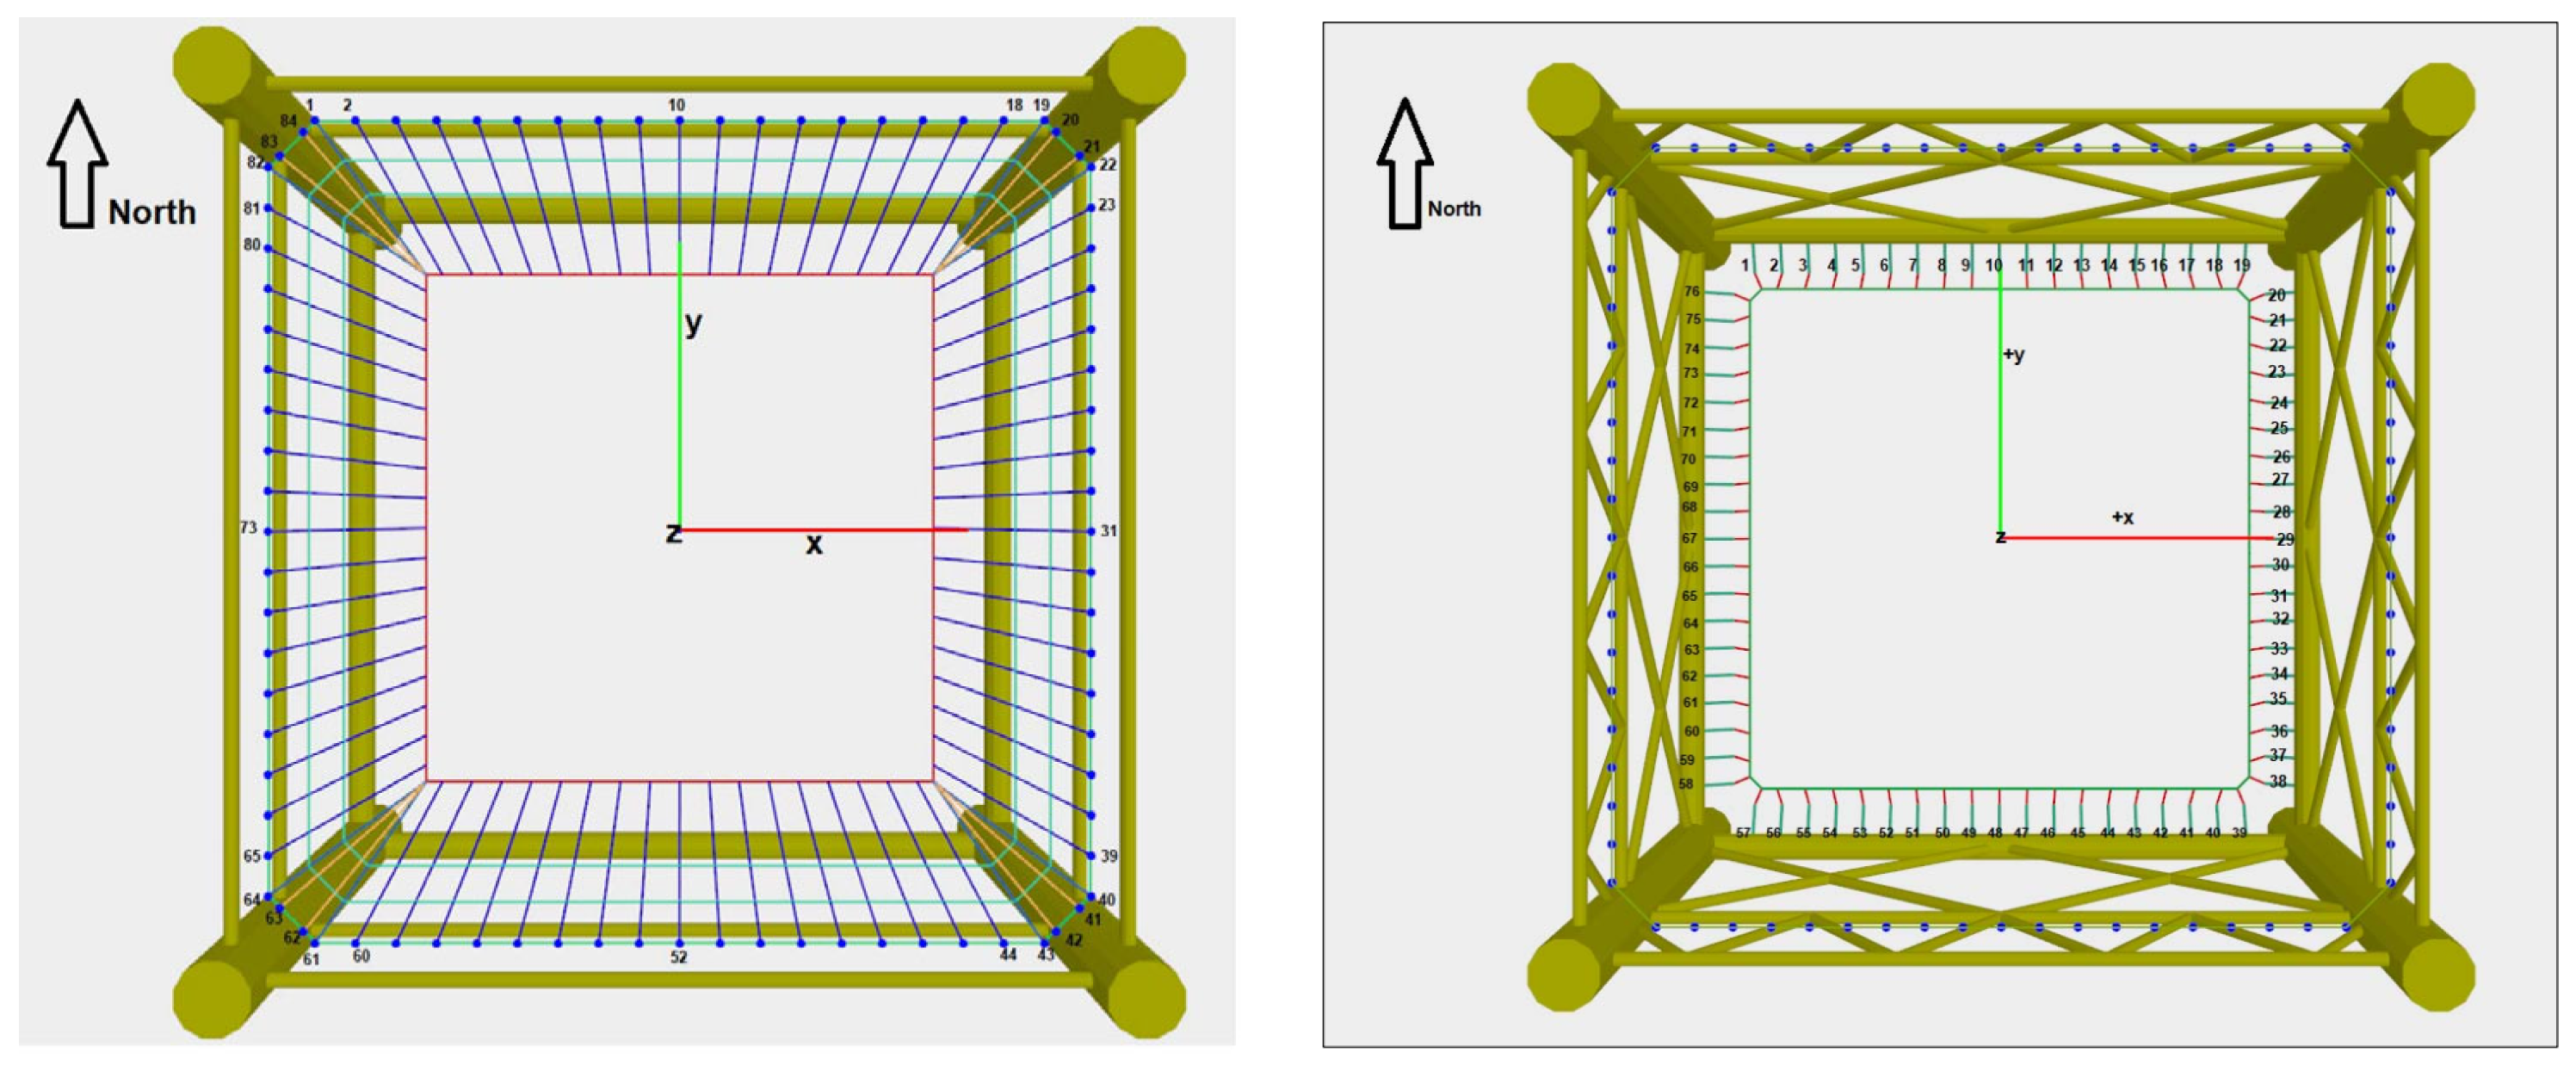
To clarify the description of the netting ropes at various positions within the netting, this study defines the arrangement and naming conventions as illustrated in Figure 5. Additionally, a standardized numbering system has been established for the netting ropes, which is consistently applied across all schemes. An example of this system can be seen in Figure 6 for Scheme 1.
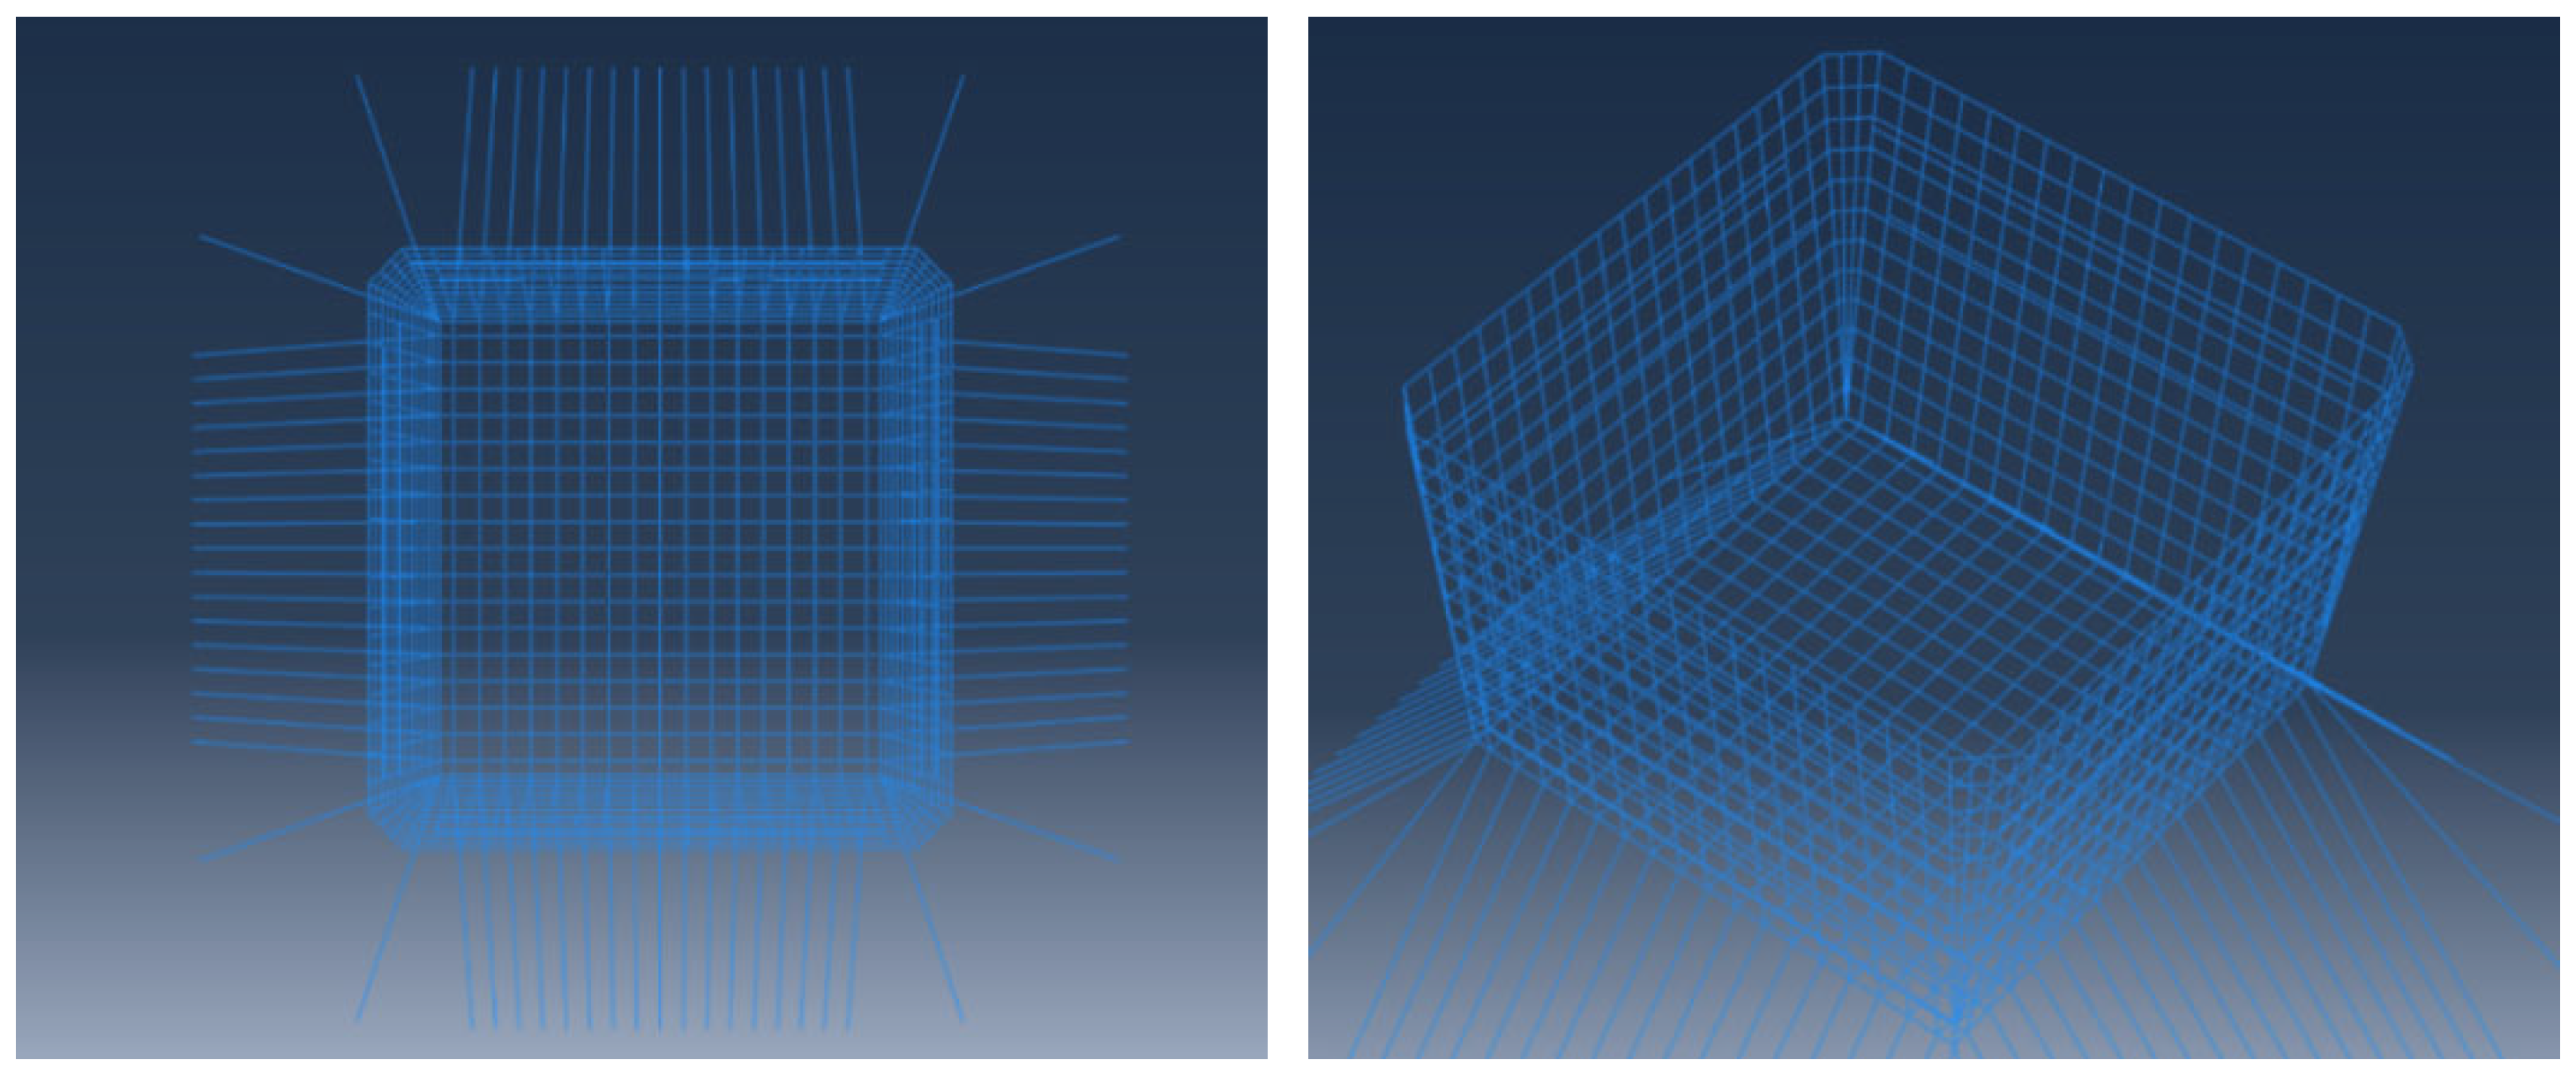
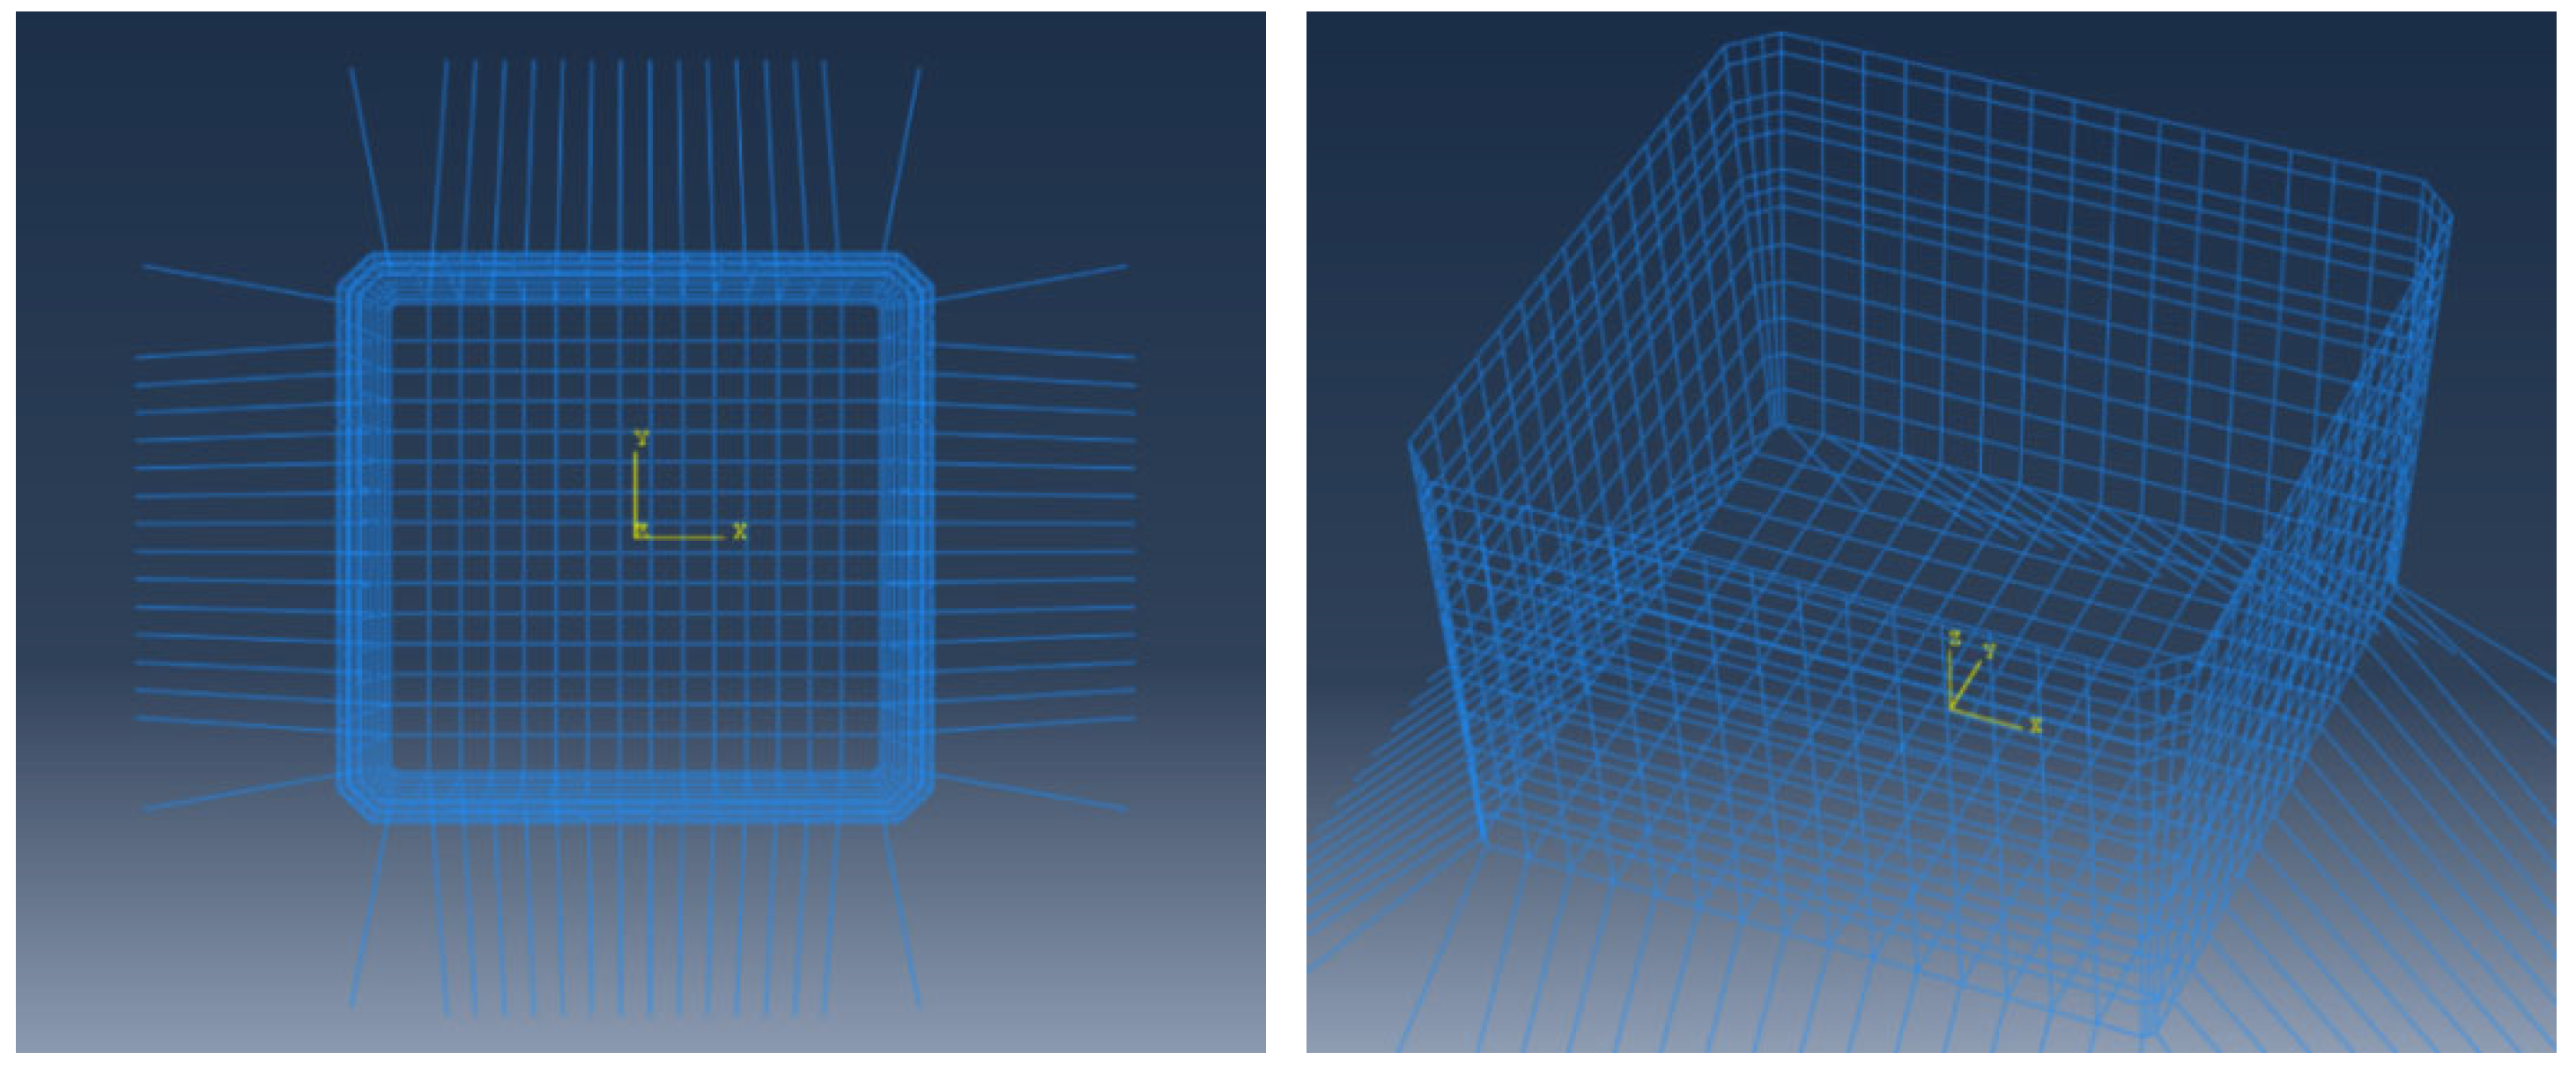
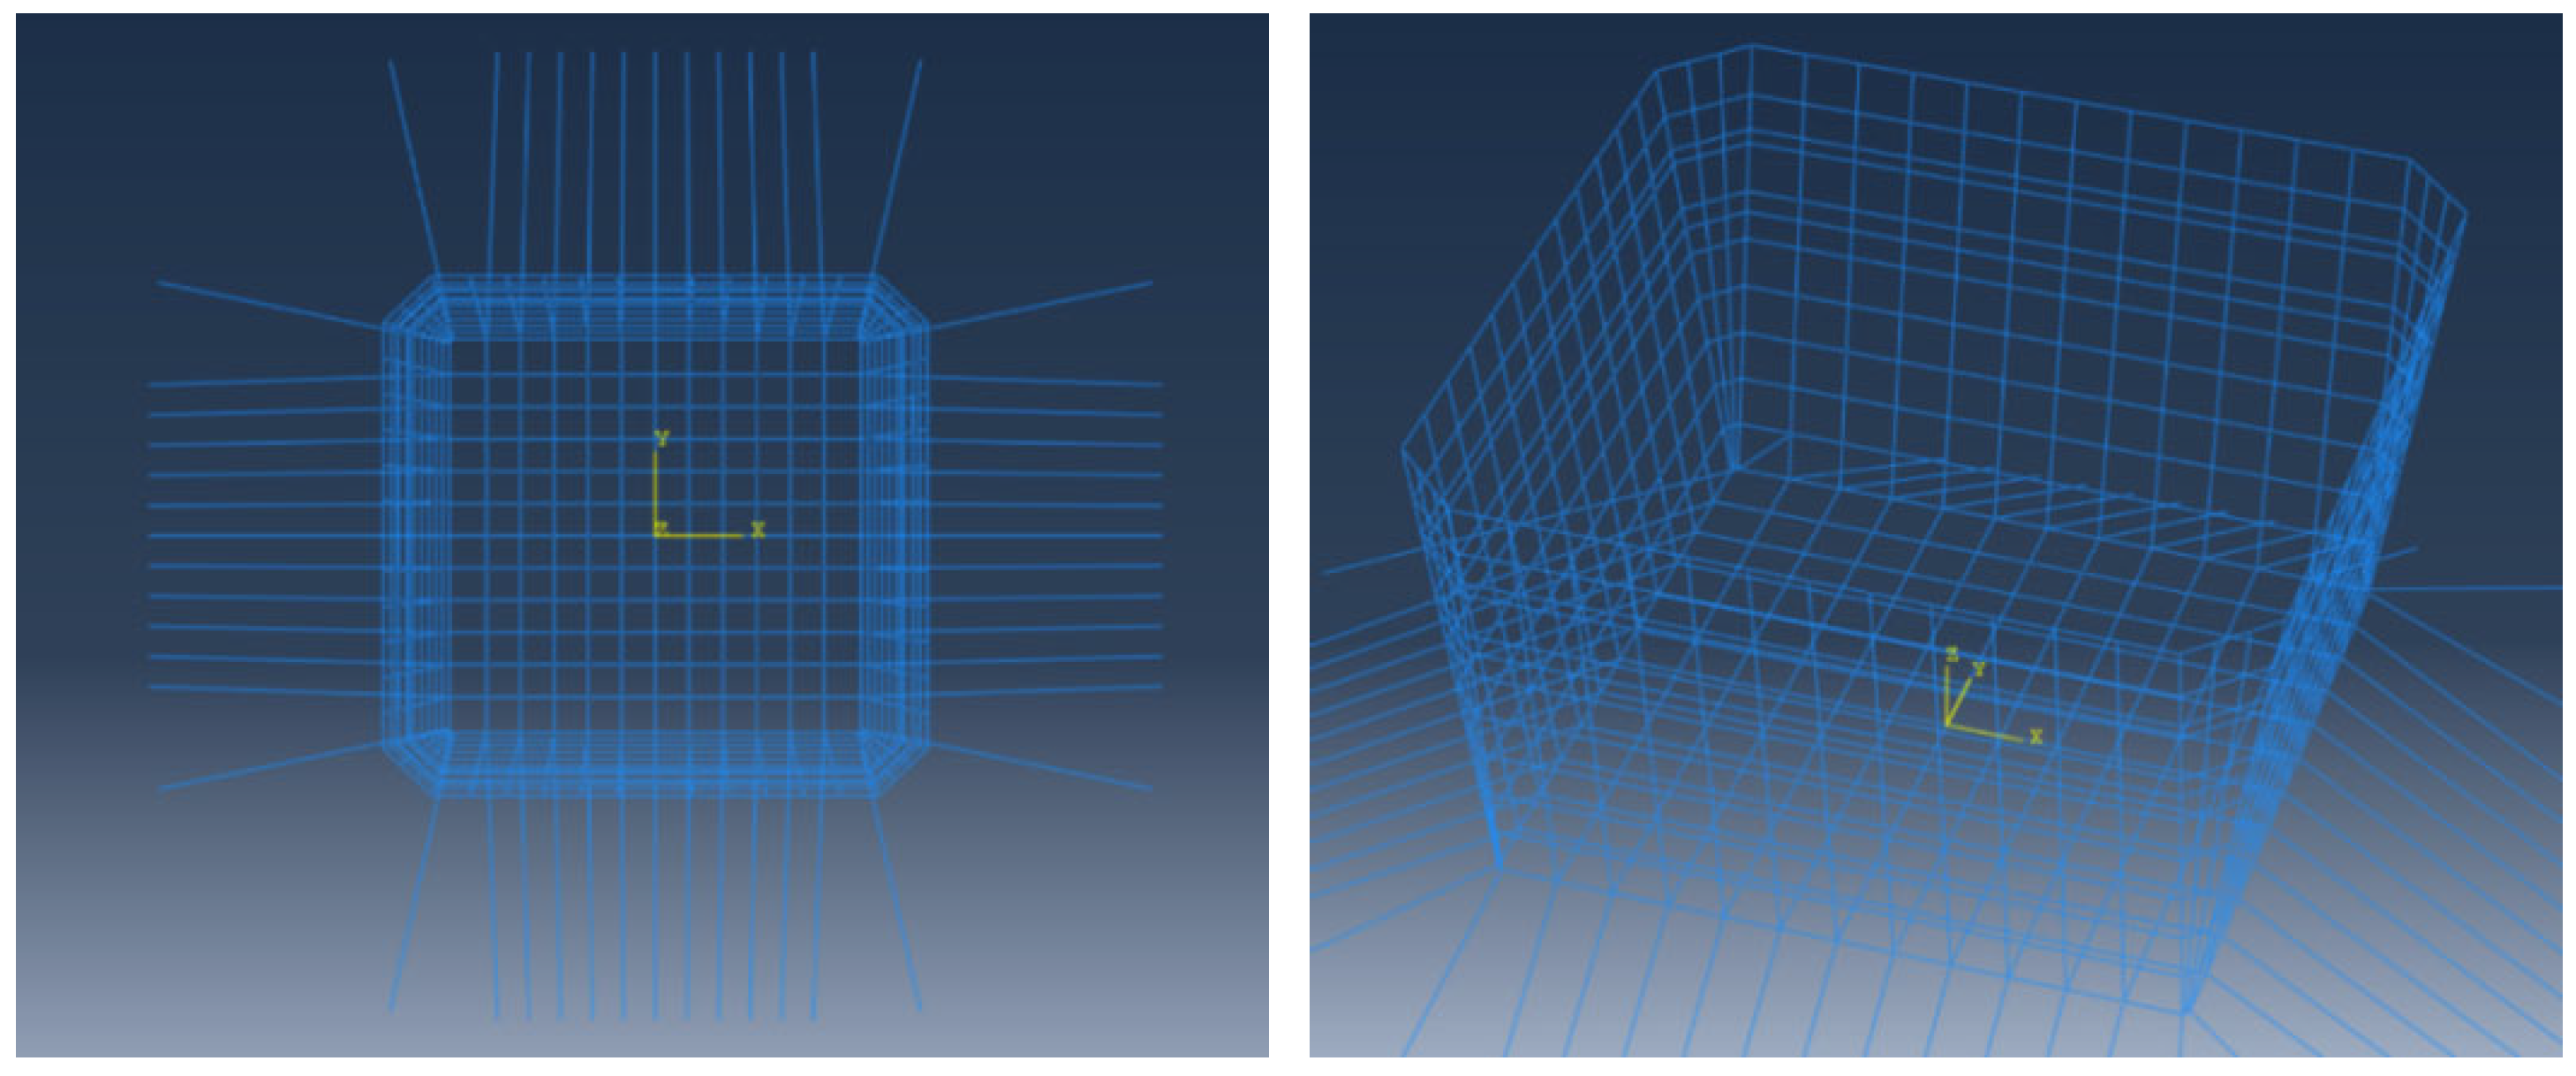
As previously outlined, Scheme 1 is based on the actual design of the cage structure, which consists of four side nets and one bottom net. This setup serves as the foundation for enclosing the aquaculture water body. To facilitate the netting tension process, a specific angle of inclination is designated for the side nets. Additionally, double-layer netting is implemented in the area close to the still water surface to mitigate the risk of collisions with floating objects. To prevent issues related to load concentration, the side netting joints are reinforced with cut surface netting, altering the overall shape of the netting system to an octagonal configuration composed of four large side nets and four smaller side nets. Scheme 2 builds on Scheme 1 by increasing the aquaculture water volume within the cage and enhancing the utilization rate. However, this adjustment requires a change in the inclination angle of the side netting, which in turn necessitates greater tension from the winches connected to the ropes to maintain the desired netting geometry. In Scheme 3, the objective is to further increase the aquaculture volume while keeping the inclination angle of the side netting unchanged. This means that, theoretically, the winches should not require any additional tension. However, the alteration in the angle between the tension ropes and the bottom netting may have unpredictable effects on its load-bearing characteristics. To analyze these schemes, numerical static models for Scheme 1, Scheme 2, and Scheme 3—without the influence of waves or currents—have been established, as illustrated in Figure 7, Figure 8 and Figure 9.

2.3. Environmental Loadings and Cases Set-Up

Most of the net system of the large bottom-mounted cage platform is situated below the free surface and is primarily subjected to hydrodynamic loads. Therefore, wind loads on the net systems are not considered in the subsequent main analysis. To accurately analyze the hydrodynamic loads and structural responses of the netting for the proposed netting arrangement scheme, the parameters for both the storm survival sea state and the normal operating sea state at this specific site are presented in Table 2.
Given the symmetrical arrangement of the net system inside the cage, this study takes into account the calculation of the force magnitudes on the netting ropes and tension ropes, as well as the deformation magnitudes of the netting at four angles of 0°, 15°, 30°, and 45° under the same direction of waves and currents. The linear Airy theory is then adopted to model the incoming waves in a simplified manner. The free surface exhibits simple harmonic motion with water particles undergoing harmonic oscillations at a fixed circular frequency, while the wave profile propagates forward at a specific phase velocity. The free surface elevation η and the velocity potential ϕ are described as
η = 1 2 H cos k x ω t ϕ = g H 2 ω cosh k z + d cosh k d sin k x ω t
where H is the wave height, k refers to the wave number, ω represents the circular frequency, g is the gravity acceleration, and d is the water depth. Then, the horizontal velocity and the acceleration of the water particle motions can be obtained by taking the first-order spatial derivative of ϕ and the time derivative of the horizontal velocity, respectively. It should be noticed that the structural responses of the net system are placed in a pivotal position aiming to provide the guidelines for designs and optimizations in the present study, thus the utilization of the linear Airy wave theory instead of other non-linear wave model is justified. The comparable load conditions are also referred to from [36].
The overview of the computational cases is shown in Table 3. Scheme 1 considers two water depths of 36.5 m and 34.5 m in the survival condition and two water depths of 34.5 m and 32.5 m in the operational condition. Scheme 2 and Scheme 3 are carried out with the water depth of 36.5 m in the survival condition and the water depth of 34.5 m in the operational condition, respectively.

3. Results and Discussions

3.1. Hydrodynamic Loads on the Net Systems

Statistical analysis was conducted on the force magnitude of vertical netting ropes in Scheme 1 under survival conditions, where the water depths are 36.5 m and 34.5 m, and operational conditions, where the water depths are 34.5 m and 32.5 m. Table 4 lists the maximum loads of side netting, vertical ropes, and corner vertical ropes under different working conditions.
From the table above, we can conclude that the maximum loads on the vertical ropes of the side netting and corner netting occur during the 15° sea condition. In Scheme 1, under survival conditions, the maximum load on the side netting vertical ropes is 26.3 tons, while the maximum load on the corner vertical ropes is 17.2 tons. Under operational conditions, the maximum load on the side netting vertical ropes is 20.1 tons, and the maximum load on the corner vertical ropes is 12.9 tons.
A statistical analysis was performed on the forces exerted by the bottom tension ropes of Scheme 1 under two sets of conditions: survival conditions at water depths of 36.5 m and 34.5 m, and operational conditions at water depths of 34.5 m and 32.5 m. Table 5 presents the maximum loads for the bottom corner tension ropes, as well as for the other bottom tension ropes.
The data presented in the table highlights that the maximum load on the bottom tension ropes occurs in a 15° sea condition. For Scheme 1, the maximum load on the tension ropes at the four bottom corners reaches 37.9 tons during survival conditions, while the load on the other bottom tension ropes is 36.4 tons. Under operational conditions, the maximum load at the four corners is 29.8 tons, and the load on the other bottom tension ropes is 28.5 tons. Scheme 1 demonstrates the peak loads at a wave–current direction of 15°, with maximum tension rope loads of 37.9 tons during survival and 29.8 tons during operation. This data indicates significant sensitivity to directional changes, emphasizing the need for reinforced anchor points at critical angles.
In a similar manner, a statistical analysis was conducted on the forces acting on the vertical netting ropes of Scheme 2 under two conditions: a survival condition with a water depth of 36.5 m and an operational condition with a water depth of 34.5 m. Table 6 presents the maximum loads for both the vertical side netting ropes and the vertical corner netting ropes under each working condition.
The table indicates that the maximum loads on the vertical side netting ropes and vertical corner netting ropes occur under 15° sea conditions across all working scenarios. In Scheme 2, the maximum load for the vertical side netting ropes is 31.7 tons, while the maximum load for the vertical corner netting ropes is 22.6 tons under survival conditions. Under operational conditions, the maximum load for the vertical side netting ropes is 24.3 tons, and the maximum load for the vertical corner netting ropes is 17.4 tons.
In addition, a statistical analysis was conducted on the forces exerted by the bottom tension ropes of Scheme 2 under two conditions: survival (with a water depth of 36.5 m) and operational (with a water depth of 34.5 m). Table 7 presents the maximum loads on the tension ropes at the four bottom corners, as well as the loads on other bottom tension ropes, for each working condition.
Based on the table provided, the maximum load experienced by the bottom tension ropes in each working condition occurs during the 15° sea condition. For Scheme 2, the maximum load of the tension ropes at the four bottom corners is 44.2 tons, while the maximum load for the other bottom tension ropes is 42.3 tons under survival conditions. Under operational conditions, the maximum load at the four corners is 34.9 tons, and the load for the other bottom tension ropes is 33.5 tons. In comparison to Scheme 1, Scheme 2 exhibits a tension rope load that is 18% higher; specifically, Scheme 2 has a maximum load of 44.2 tons compared to Scheme 1’s 37.9 tons under survival conditions. This increase can be attributed to the lowered netting bottom. Additionally, the greater aquaculture volume contributes to increased structural stress, particularly at oblique wave angles.
A statistical analysis was performed on the forces experienced by the vertical netting ropes of Scheme 3 under two conditions: a survival condition at a water depth of 36.5 m and an operational condition at a water depth of 34.5 m. Table 8 displays the maximum loads on the vertical side netting ropes and the vertical corner netting ropes for each working condition.
The table above indicates that the maximum load experienced by the vertical side netting ropes occurs under sea conditions of 15°, while the maximum load for the vertical corner netting ropes occurs under sea conditions of 45°. Specifically, for Scheme 3, the vertical side netting ropes reach a maximum load of 27.5 tons and the vertical corner netting ropes reach 22.3 tons during survival conditions. In contrast, under operational conditions, the maximum load of the vertical side netting ropes is 19.5 tons, while the maximum load of the vertical corner netting ropes is 16.8 tons.
A statistical analysis was conducted on the forces exerted by the bottom tension ropes of Scheme 3 under two conditions: survival, where the water depth is 36.5 m, and operational, where the water depth is 34.5 m. Table 9 outlines the maximum loads on the tension ropes at each of the four corners, as well as on other bottom tension ropes, for each working condition.
The analysis of the data reveals the following conclusions: In survival conditions, the maximum load of the bottom tension ropes occurs under 15° sea conditions, while in operational conditions, it occurs under 30° sea conditions. For Scheme 3, the maximum load of the tension ropes at the four bottom corners is 46.1 tons, and the maximum load of other bottom tension ropes is 44.3 tons under survival conditions. In operational conditions, the maximum load at the four corners is 35.0 tons, while the maximum load of the other bottom tension ropes is 33.7 tons. Even though the aquaculture volume has increased, Scheme 3 decreases vertical rope loads by 15% (27.5 tons compared to 31.7 tons) due to optimized tension rope angles. However, the bottom tension ropes experience higher loads at 46.1 tons, which shifts the stress concentration points.

3.2. Deformation of the Net Systems

This section focuses on deformation data, which is closely related to the operational efficiency of offshore aquaculture farms. First, a statistical analysis was performed on the netting deformation of Scheme 1 under two sets of conditions. The survival conditions were at water depths of 36.5 m and 34.5 m, while the operational conditions were at water depths of 34.5 m and 32.5 m. Table 10 displays the maximum values for the maximum displacements of the net system along the x-axis, as well as the minimum distance from the net to the diagonal brace.
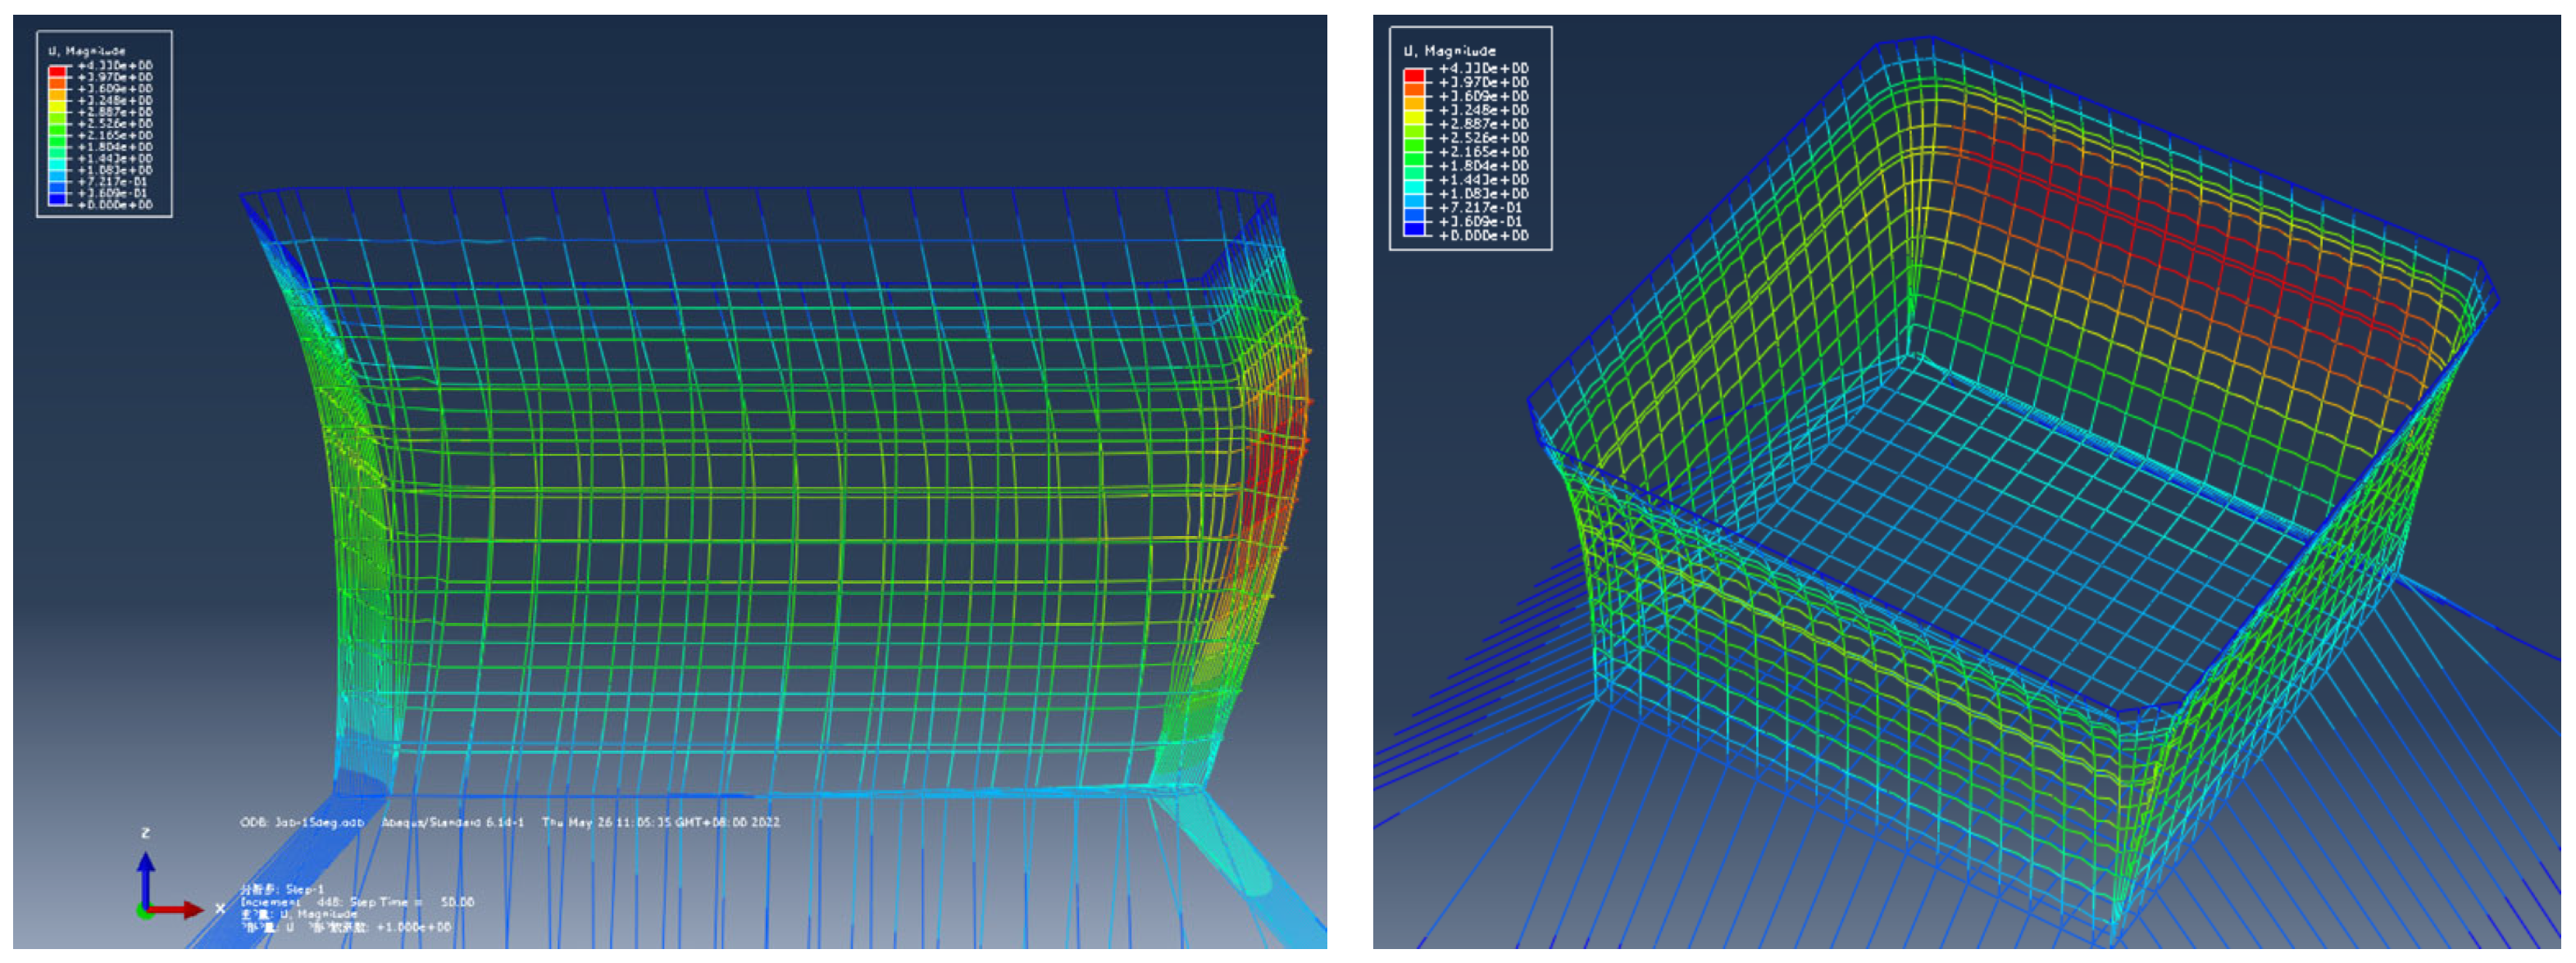
The table above indicates that under each working condition, the maximum offset distance of the nets and the minimum distance from the netting to the diagonal braces of the netting cage structure occur at a 15° sea condition. For Scheme 1, the maximum offset distance is 4.0 m, while the minimum distance from the netting to the diagonal braces is –0.46 m. This negative value suggests a collision between the netting and the diagonal braces under survival conditions. In contrast, under operational conditions, the maximum offset distance is 3.4 m, and the minimum distance from the netting to the diagonal braces is 0.2 m. Figure 10 and Figure 11 illustrate the deformation patterns of the net system in Scheme 1 during survival conditions at a water depth of 36.5 m and operational conditions at a water depth of 34.5 m, respectively, both under the 15° sea condition.
Netting collisions with diagonal braces occurred at a 15° angle, where the clearance is −0.46 m, highlighting structural vulnerability under oblique wave–current conditions. The maximum offset of 4.0 m suggests a need for enhanced constraint systems.
The deformations of the net in Scheme 2 are analyzed under two conditions: the survival condition with a water depth of 36.5 m and the operational condition with a water depth of 34.5 m. Table 11 presents the following information for each condition: the maximum offset distance of the netting, the position of the maximum netting offset along the x-axis, and the maximum value of the minimum distance between the netting and the diagonal brace.
The analysis of the table indicates that the maximum offset distance of the netting and the minimum distance from the netting to the diagonal braces of the cage structure occur in the 15° sea state. Under the survival conditions of Scheme 2, the maximum offset distance is 4.70 m, while the minimum distance from the netting to the diagonal braces is −1.66 m. This suggests that the netting collides with the diagonal braces of the cage. In operational conditions, the maximum offset distance is 4.06 m, and the minimum distance from the netting to the diagonal braces is −1.01 m, again indicating that the netting collides with the diagonal braces of the cage.
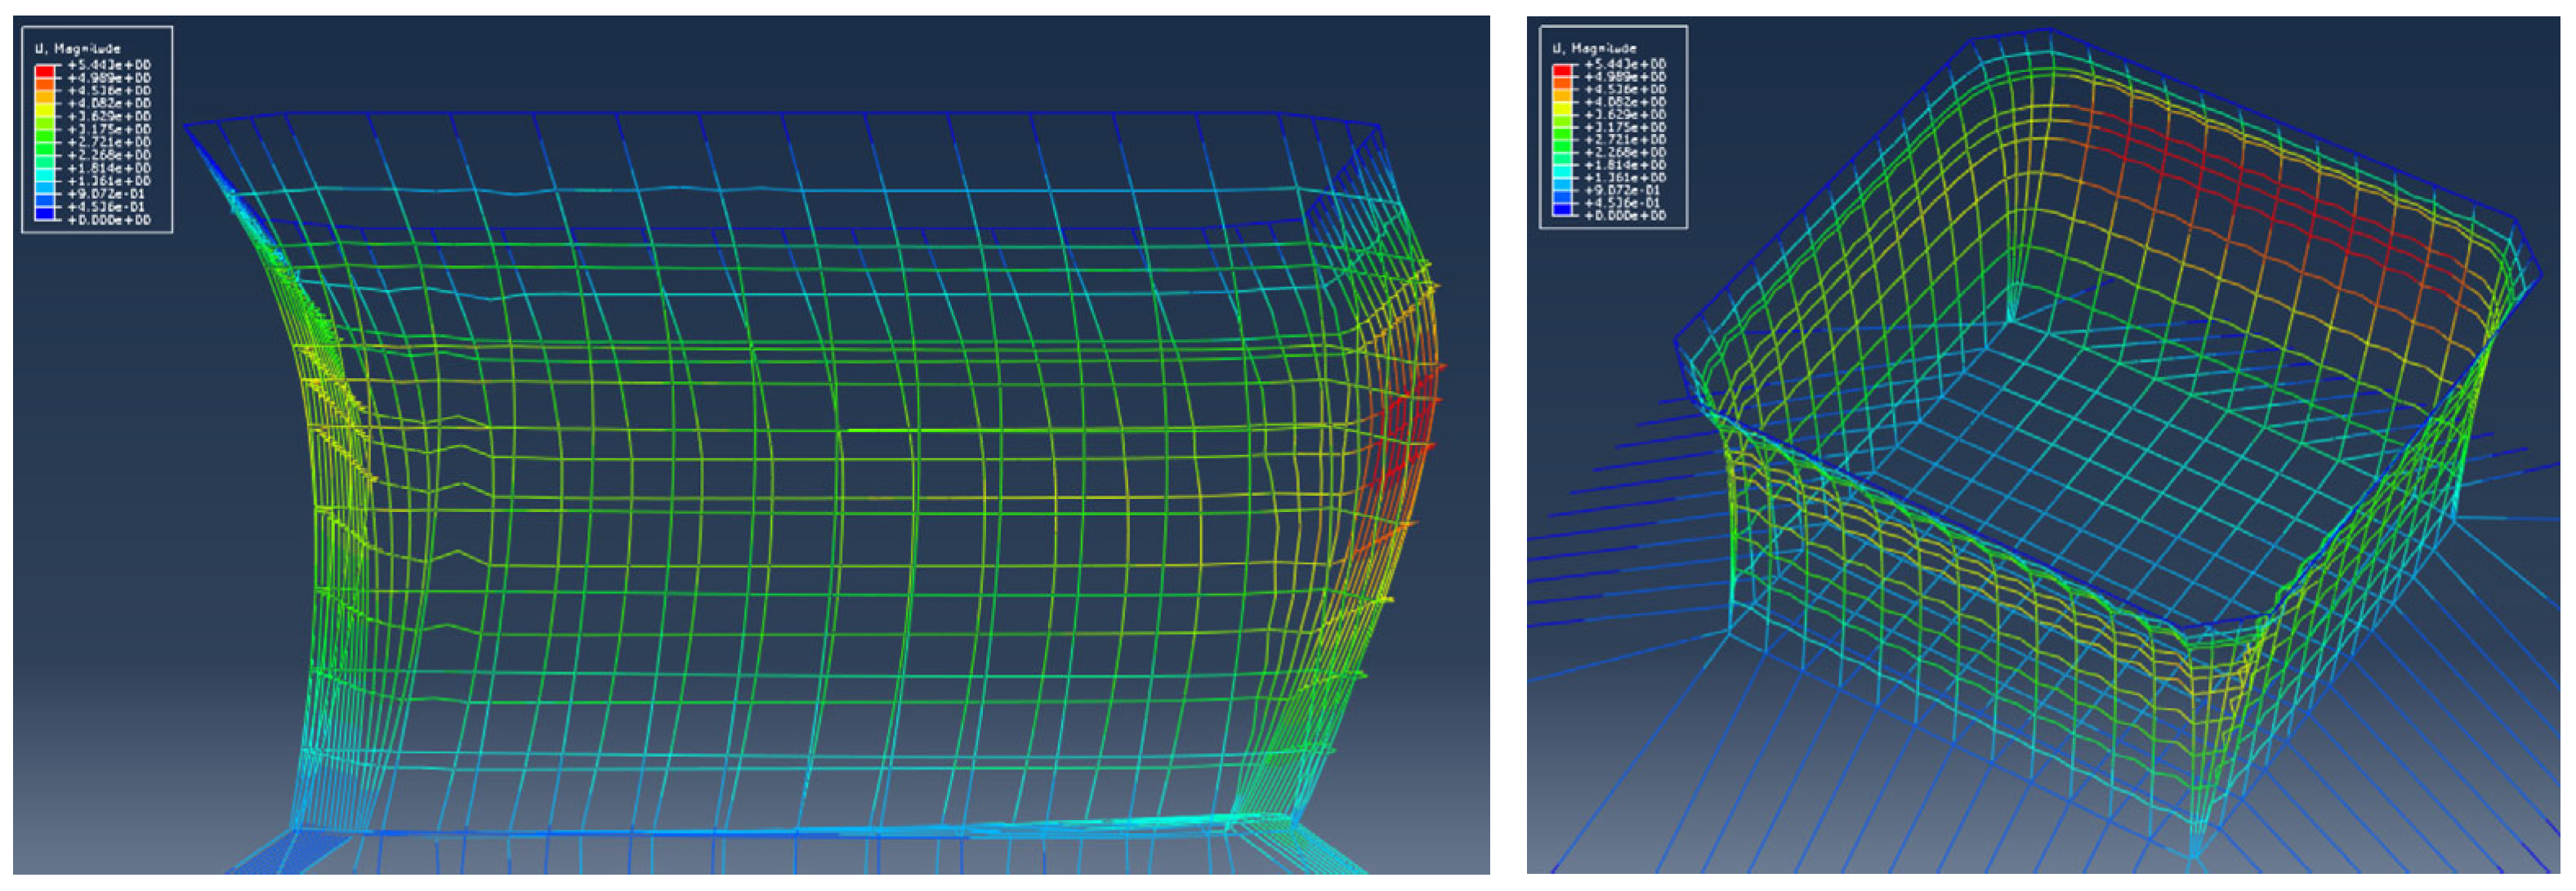
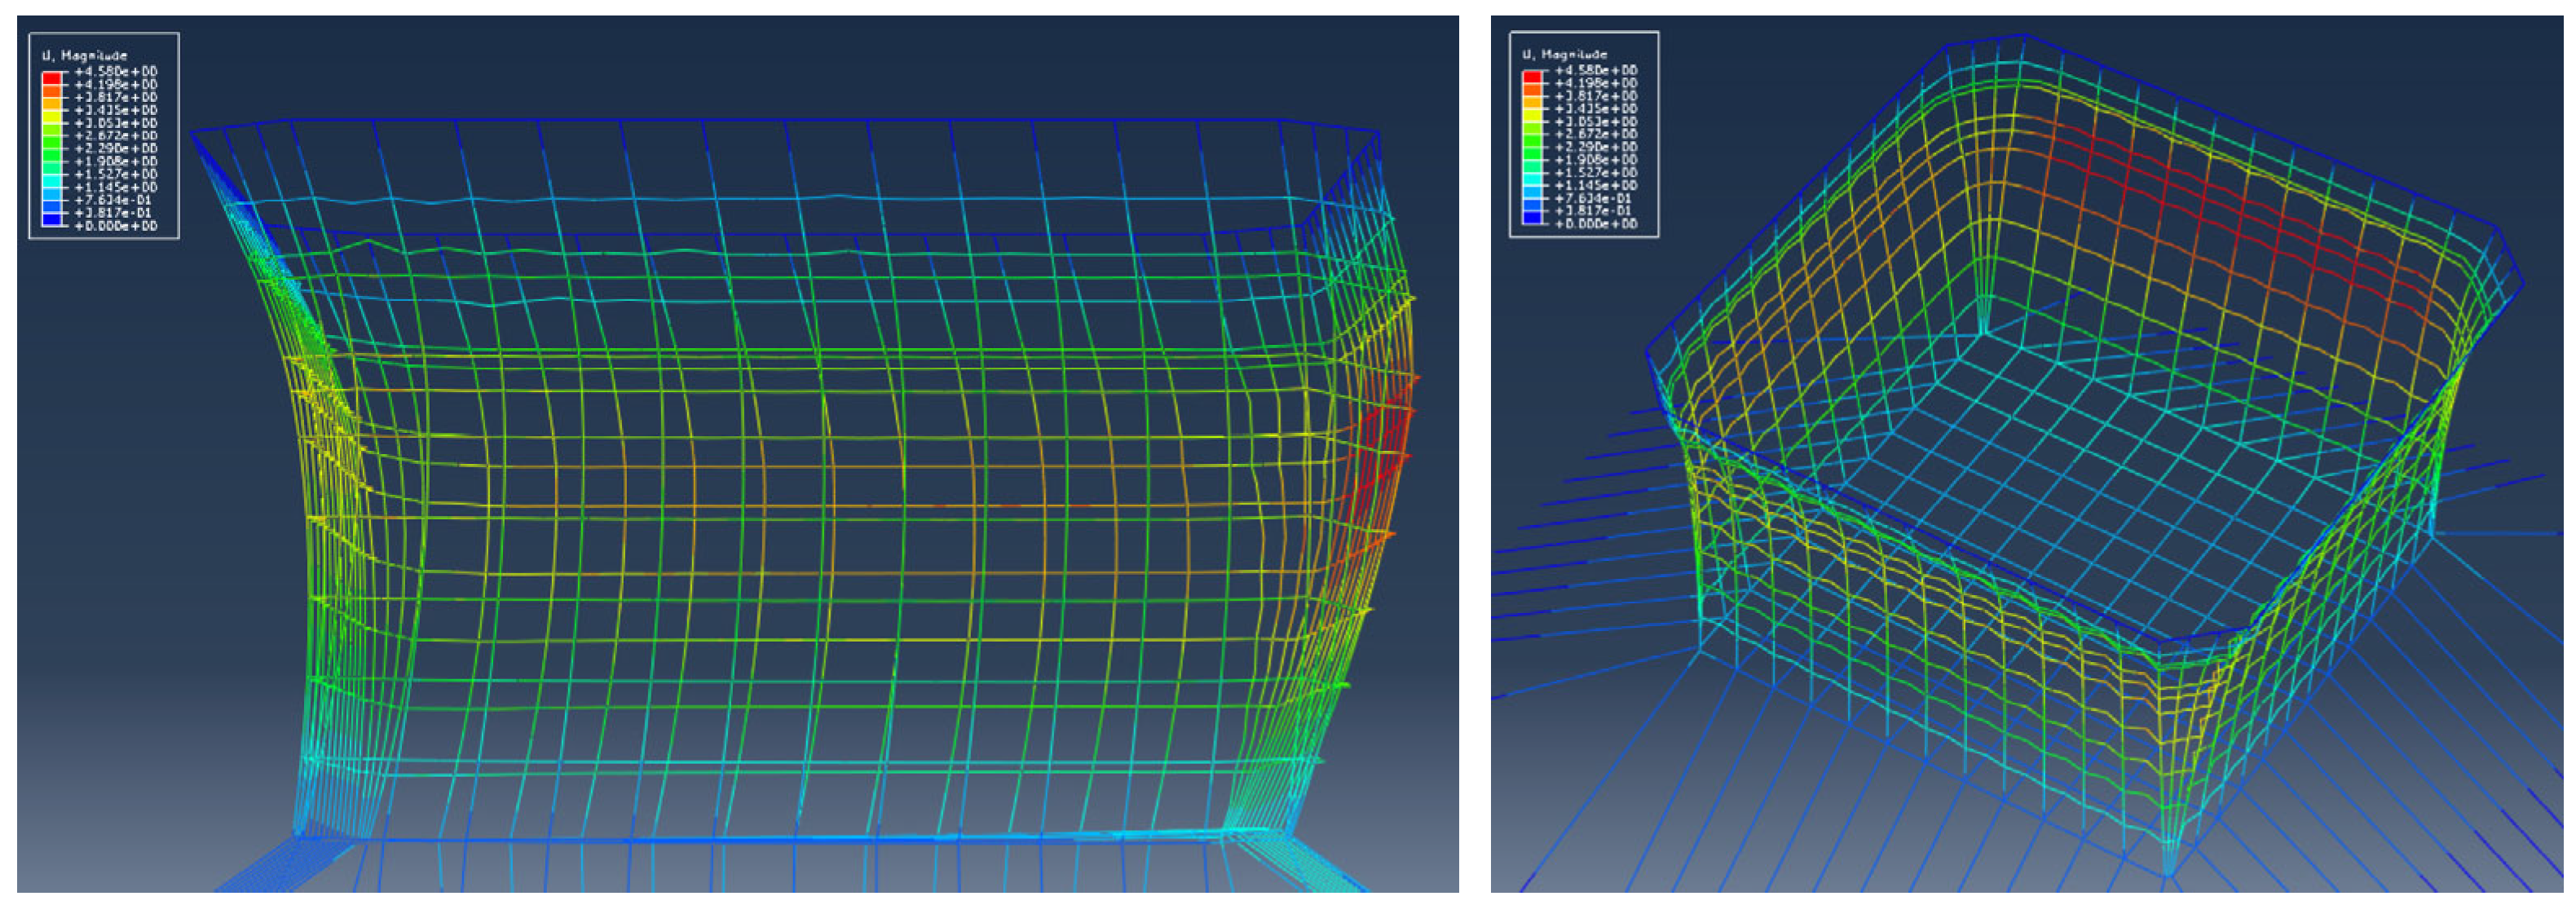
Figure 12 and Figure 13 illustrate the deformations of the net system in Scheme 2 under two different conditions. Figure 12 shows the deformations under survival conditions with a water depth of 36.5 m, while Figure 13 presents the deformations under operational conditions with a water depth of 34.5 m, both in a 15° sea state.
Scheme 2 experiences significant collisions, resulting in a clearance of −1.66 m and a netting deformation that is 17% greater than that of Scheme 1. In this context, Scheme 2 has a height of 4.70 m, whereas Scheme 1 stands at 4.0 m. The increased height and lowered bottom of Scheme 2 amplify the hydrodynamic forces, which ultimately compromises its resistance to deformation.
A statistical analysis was conducted on the netting deformation of Scheme 3 under two conditions: the survival condition, with a water depth of 36.5 m, and the operational condition, with a water depth of 34.5 m. Table 12 presents the maximum offset distance of the netting, the position of the maximum netting offset along the x-axis, and the highest value of the minimum distance from the netting to the diagonal brace.
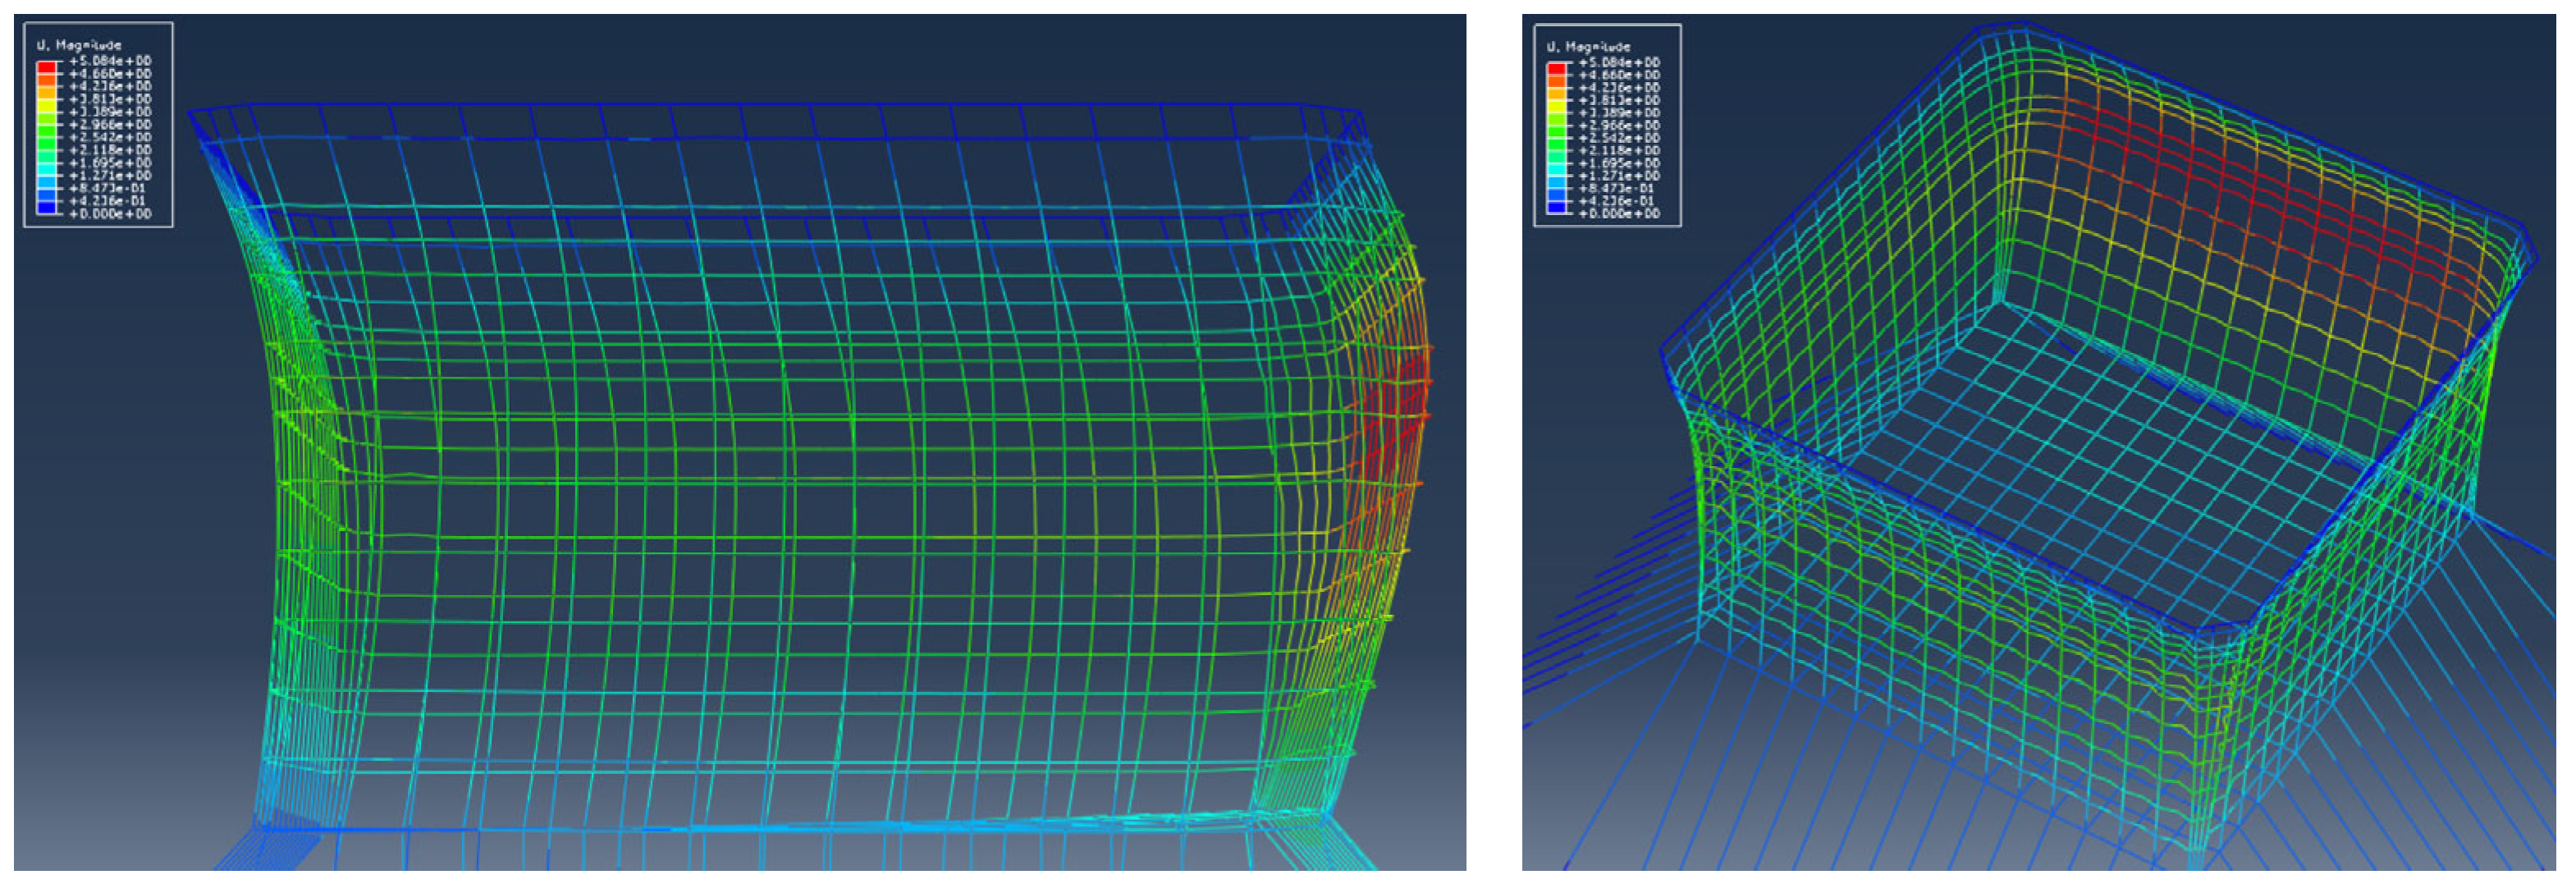
The data in the table indicates that the maximum offset distance of the netting and the minimum distance from the netting to the diagonal braces of the cage structure vary under different conditions. Specifically, under survival conditions, these measurements occur at a 15° case, while under operational conditions, they occur at a 30° case for Scheme 3. Under survival conditions, the maximum offset distance of the netting is 5.08 m, and the minimum distance from the netting to the diagonal braces is −1.63 m. This suggests that the netting collides with the diagonal braces of the cage. In contrast, under operational conditions, the maximum offset distance is 4.04 m, and the minimum distance from the netting to the diagonal braces is −0.58 m, indicating that the netting also collides with the diagonal braces in this scenario.
Figure 14 and Figure 15 illustrate the deformations of the net system in Scheme 3. Figure 14 represents the system under survival conditions with a water depth of 36.5 m, while Figure 15 shows the system under operational conditions with a water depth of 34.5 m in a 15° sea state.
Although the peak netting deformation reaches 5.08 m, Scheme 3 results in a 15% reduction in maximum offset distance when compared to Scheme 2 under operational conditions. The increased angle of the tension rope enhances load distribution, but it necessitates trade-offs in managing clearance.

3.3. Discussions on the Comparisons and the Design Trade-Offs of the Three Schemes

The numerical analysis of loads and deformations under survival and operational conditions provides vital insights into the performance of each scheme and the trade-offs associated with net system designs from the perspective of engineering practices.
Scheme 1 demonstrated the most balanced performance among the three schemes. It maintained the lowest tension rope load at 37.9 tons and recorded the smallest maximum netting displacement at 4.0 m under critical survival conditions. Although there was a minor collision risk with a wave–current direction of 15°, resulting in a clearance of −0.46 m, this risk was considered manageable compared to the other options. The design of Scheme 1 prioritizes structural integrity and safety, providing a strong foundation for the challenging conditions of the Bohai Sea environment.
Scheme 2 successfully increased the volume of aquaculture; however, this benefit came at a significant cost. The reduction in the inner netting angle and the lowering of the netting’s bottom resulted in an 18% increase in peak tension rope load—44.2 tons for Scheme 2 compared to 37.9 tons for Scheme 1. Additionally, there was a 17.5% larger maximum deformation of 4.70 m in Scheme 2, compared to 4.0 m in Scheme 1. The severe collision with the diagonal braces, measuring −1.66 m, highlights a critical design flaw. This volume expansion, without appropriate measures to manage the resulting increase in hydrodynamic loads and deformation, jeopardizes structural safety.
Scheme 3 aimed to optimize load distribution. The increased angle of the tension rope-netting at the bottom successfully reduced the loads on the vertical ropes by 15% compared to Scheme 2. However, this adjustment merely shifted the load concentration to the bottom tension ropes, which endured 46.1 tons—the highest load of all schemes. Additionally, it resulted in a netting deformation of 5.08 m, the largest recorded, indicating that the efforts to optimize load distribution inadvertently compromised deformation control. This led to the highest collision risk, alongside Scheme 2.
In Scheme 2 and Scheme 3, the increased netting height and lowered netting bottom depth both expand the net system’s volume and exposed area, leading to larger hydrodynamic forces and thus higher rope tensions and net deformations relative to Scheme 1. The reduced inner netting angle in Scheme 2 (making the side nets more vertical) enlarges the cage’s horizontal cross-section and thereby captures more wave and current force, contributing to the higher drag loads and the severe diagonal-brace collision observed in that scheme. Likewise, the wider vertical rope spacing (in Scheme 2 and Scheme 3) means fewer supporting ropes per panel, which allows greater net deflection under load and exacerbates overall deformation. Finally, raising the tension rope–netting bottom angle (as in Scheme 3) redistributes the force pathways by relieving some load from the vertical ropes (approximately a 15% reduction in vertical rope tension was observed) but concentrates more stress in the bottom tension ropes and permits increased net sag, resulting in Scheme 3’s largest recorded deformation and collision risk. Taken together, these parametric effects elucidate how each geometric modification influences the cage’s hydrodynamic performance and help explain the trade-offs observed among the three schemes.
The key design trade-off is clearly between the volume of aquaculture and the structural stability. Scheme 2 and Scheme 3 aimed to increase volume and redistribute load, respectively. Nevertheless, both approaches were unable to control deformation and reduce collision risks in extreme conditions. In contrast, Scheme 1, which prioritized structural integrity over maximizing volume, demonstrated superior overall performance.

4. Conclusions and Outlook

This study investigated the structural response of net systems of a bottom-mounted aquaculture farm by wave and current impacts in the Bohai Sea. Through the well-validated Morison model and the lumped-mass method embedded in the ABAQUS/AQUA, three distinct arrangement schemes for the net system were evaluated under survival and operational sea states. Comparative analyses of netting rope/tension rope loads and netting deformations were conducted across varying wave–current directions. The primary conclusions are drawn as follows.
  • It is demonstrated that Scheme 1 offers the best balance between the structural safety and functional efficiency for the deployments in the Bohai Sea, making it the recommended design. Scheme 1 trades off maximum volume expansion for optimal load management, minimal deformation, and the highest overall structural reliability.
  • Scheme 1 offers a critical safety advantage by significantly reducing the risk of collisions, with a minimum clearance of −0.46 m. In contrast, Scheme 2 and Scheme 3 exhibit much higher collision risks, with minimum clearances of −1.66 m and −1.63 m, respectively, under 100 year storm conditions. Additionally, the peak bottom tension rope load for Scheme 1 is 37.9 tons, which is 14% lower than Scheme 3 (46.1 tons) and 18% lower than Scheme 2 (44.2 tons). This demonstrates that Scheme 1 is more compatible with standard mooring systems and provides higher engineering safety margins.
  • Scheme 1 has shown the capacity of withstanding combined wave heights of 8.4 m and currents of 1.5 m/s at the critical angle of 15° between the wave and current directions. Its maximum displacement of 4.0 m is 21.3% lower than that of Scheme 3, which has a displacement of 5.08 m, providing a significant margin for deformation. The design of Scheme 1 offers sufficient safety margins to account for potential increases in load due to biofouling.
With the enhanced computational ability, it is anticipated that the structural responses of the net system can be carried out using the high-fidelity fluid–structure interacting modeling in the ongoing studies, thereby the more extreme waves in open oceans, such as plunging waves, can be introduced. The non-linear effects between the flexible nets and extreme waves can enrich the present numerical results further. In addition, the progress of the computational accuracies and efficiencies motivates the evolution of the digital twin of the net system from the perspective of hydrodynamics.

Author Contributions

Conceptualization, H.Z. and G.W.; Data curation, F.L., G.S., Y.Z. and Y.W.; Funding acquisition, F.L., H.Z. and G.W.; Investigation, F.L., G.S., Y.Z., Y.W. and G.W.; Methodology, H.Z. and G.W.; Supervision: H.Z.; Visualization, Y.Z.; Writing—original draft, F.L.; Writing—review and editing, F.L., H.Z., G.S., Y.Z., Y.W. and G.W. All authors have read and agreed to the published version of the manuscript.

Funding

This work was financially supported by the Key R&D Program of Shandong Province, China (2023TZXD050); National Natural Science Foundation of China (32303072, 52401403); Shandong Provincial Natural Science Foundation (Grant No. ZR2023QC005); Central Public-interest Scientific Institution Basal Research Fund, CAFS (20603022024021); Young Elite Scientists Sponsorship Program by CAST (2023QNRC001) and Taishan Industrial Experts Program.

Data Availability Statement

The raw data supporting the conclusions of this article will be made available by the authors on request.

Conflicts of Interest

Authors Fuxiang Liu, Guoqing Sun, and Yuqin Zhang are employed by Yantai CIMC Blue Ocean Technology Co., Ltd.; the rest of authors declare no conflict interests.

References

  1. Zhang, Y.; Ni, Q.; Liu, H.; Zhang, C. Status quo of industrialized aquaculture of Atlantic salmon in Norway and its implications for China. Trans. Chin. Soc. Agric. Eng. (Trans. CSAE) 2020, 36, 310–315, (In Chinese with English Abstract). [Google Scholar]
  2. Zhang, C.; Liu, H.; Xu, H.; Zhang, Y.; Miao, M. Status quo of industrialized aquaculture of tuna in Japan and the enlightenment to China. Fish. Mod. 2021, 48, 10–17, (In Chinese with English Abstract). [Google Scholar]
  3. Fredriksson, D.W.; Swift, M.R.; Irish, J.D.; Tsukrov, I.; Celikkol, B. Fish Cage and Mooring System Dynamics Using Physical and Numerical Models with Field Measurements. Aquac. Eng. 2003, 27, 117–146. [Google Scholar] [CrossRef]
  4. Li, X.; Li, J.; Wang, Y.; Fu, L.; Fu, Y.; Li, B.; Jiao, B. Aquaculture Industry in China: Current State, Challenges, and Outlook. Rev. Fish. Sci. 2011, 19, 187–200. [Google Scholar] [CrossRef]
  5. Yu, J.; Cheng, X.; Fan, Y.; Ni, X.; Chen, Y.; Ye, Y. Mooring Design of Offshore Aquaculture Platform and Its Dynamic Performance. Ocean. Eng. 2023, 275, 114146. [Google Scholar] [CrossRef]
  6. Chu, Y.I.; Wang, C.M.; Park, J.C.; Lader, P.F. Review of Cage and Containment Tank Designs for Offshore Fish Farming. Aquaculture 2020, 519, 734928. [Google Scholar] [CrossRef]
  7. Chen, C.; Wang, H.; Zhang, X.; Zhang, X. Hydrodynamic Interactions between the Cylinder and Nets of a Typical Offshore Aquaculture Structure in Steady Current: Numerical Investigation and Coupling Mechanism. Mar. Struct. 2024, 97, 103657. [Google Scholar] [CrossRef]
  8. Wang, G.; Martin, T.; Huang, L.; Bihs, H. Modelling the Flow around and Wake behind Net Panels Using Large Eddy Simulations. Ocean. Eng. 2021, 239, 109846. [Google Scholar] [CrossRef]
  9. Wang, G.; Martin, T.; Huang, L.; Bihs, H. An Improved Screen Force Model Based on CFD Simulations of the Hydrodynamic Loads on Knotless Net Panels. Appl. Ocean. Res. 2022, 118, 102965. [Google Scholar] [CrossRef]
  10. Loland, G. Current Forces on and Flow through Fish Farms. PhD Thesis, Norweigian University of Science and Technology, Trondheim, Norway, 1991. [Google Scholar]
  11. Loland, G. Current Forces on, and Water Flow through and around, Floating Fish Farms. Aquacult. Int. 1993, 1, 72–89. [Google Scholar] [CrossRef]
  12. Tang, H.; Hu, F.; Xu, L.; Dong, S.; Zhou, C.; Wang, X. Variations in Hydrodynamic Characteristics of Netting Panels with Various Twine Materials, Knot Types, and Weave Patterns at Small Attack Angles. Sci. Rep. 2019, 9, 1923. [Google Scholar] [CrossRef]
  13. Tsukrov, I.; Drach, A.; DeCew, J.; Robinson Swift, M.; Celikkol, B. Characterization of Geometry and Normal Drag Coefficients of Copper Nets. Ocean. Eng. 2011, 38, 1979–1988. [Google Scholar] [CrossRef]
  14. Lader, P.F.; Fredheim, A. Dynamic Properties of a Flexible Net Sheet in Waves and Current—A Numerical Approach. Aquac. Eng. 2006, 35, 228–238. [Google Scholar] [CrossRef]
  15. Lader, P.F.; Olsen, A.; Jensen, A.; Sveen, J.K.; Fredheim, A.; Enerhaug, B. Experimental Investigation of the Interaction between Waves and Net Structures—Damping Mechanism. Aquac. Eng. 2007, 37, 100–114. [Google Scholar] [CrossRef]
  16. Song, W.; Liang, Z.; Huang, L.; Lv, Y.; Chen, B. Hydrodynamic feature of fishing net under wave action in flume experiment. Oceanol. Limnol. Sin. 2007, 38, 15–21. [Google Scholar]
  17. Ito, S.; Kinoshita, T.; Kitazawa, D.; Bao, W.; Itakura, H.; Nishizawa, S. Experimental Investigation and Numerical Modeling of Hydrodynamic Force Characteristics of a Heaving Net. In Proceedings of the 29th International Conference on Ocean, Offshore and Arctic Engineering, Shanghai, China, 6–11 June 2010; ASMEDC: Shanghai, China, 2010; Volume 3, pp. 87–96. [Google Scholar]
  18. Ito, S.; Kinoshita, T.; Kitazawa, D.; Bao, W.; Itakura, H. Experimental Investigation and Numerical Modeling of Hydrodynamic Force Characteristics and Deformation of an Elastic Net. In Proceedings of the ASME 2011 30th International Conference on Ocean, Offshore and Arctic Engineering, Rotterdam, The Netherlands, 19–24 June 2011; ASMEDC: Rotterdam, The Netherlands, 2011; Volume 5: Ocean Space Utilization; Ocean Renewable Energy, pp. 23–33. [Google Scholar]
  19. Balash, C.; Colbourne, B.; Bose, N.; Raman-Nair, W. Aquaculture Net Drag Force and Added Mass. Aquac. Eng. 2009, 41, 14–21. [Google Scholar] [CrossRef]
  20. Swift, M.R.; Fredriksson, D.W.; Unrein, A.; Fullerton, B.; Patursson, O.; Baldwin, K. Drag Force Acting on Biofouled Net Panels. Aquac. Eng. 2006, 35, 292–299. [Google Scholar] [CrossRef]
  21. Lader, P.; Fredriksson, D.W.; Guenther, J.; Volent, Z.; Blocher, N.; Kristiansen, D.; Gansel, L.; Decew, J. Drag on Hydroid-Fouled Nets—An Experimental Approach. China Ocean Eng. 2015, 29, 369–389. [Google Scholar] [CrossRef]
  22. Tsukrov, I.; Eroshkin, O.; Fredriksson, D.; Swift, M.R.; Celikkol, B. Finite Element Modeling of Net Panels Using a Consistent Net Element. Ocean. Eng. 2003, 30, 251–270. [Google Scholar] [CrossRef]
  23. Lee, C.-W.; Kim, Y.-B.; Lee, G.-H.; Choe, M.-Y.; Lee, M.-K.; Koo, K.-Y. Dynamic Simulation of a Fish Cage System Subjected to Currents and Waves. Ocean. Eng. 2008, 35, 1521–1532. [Google Scholar] [CrossRef]
  24. Lader, P.F.; Enerhaug, B.; Fredheim, A.; Krokstad, J. Modelling of 3D Net Structures Exposed to Waves and Current. In Proceedings of the 3rd International Conference on Hydroelasticity in Marine Technology, Oxford, UK, 15–17 September 2003; Department of Engineering Science, The University of Oxford: Oxford, UK, 2003; pp. 19–26. [Google Scholar]
  25. Moe, H.; Olsen, A.; Hopperstad, O.S.; Jensen, Ø.; Fredheim, A. Tensile Properties for Netting Materials Used in Aquaculture Net Cages. Aquac. Eng. 2007, 37, 252–265. [Google Scholar] [CrossRef]
  26. Moe, H.; Dempster, T.; Sunde, L.M.; Winther, U.; Fredheim, A. Technological Solutions and Operational Measures to Prevent Escapes of Atlantic Cod (Gadus morhua) from Sea Cages. Aquac. Res. 2007, 38, 91–99. [Google Scholar] [CrossRef]
  27. Bian, C.; Jiang, W.; Pohlmann, T.; Sündermann, J. Hydrography-Physical Description of the Bohai Sea. J. Coast. Res. 2016, 74, 1–12. [Google Scholar] [CrossRef]
  28. Wan, R.; Huang, W.Q.; Song, X.F.; Hu, F.X.; Tokai, T. Statics of a Gillnet Placed in a Uniform Current. Ocean. Eng. 2004, 31, 1725–1740. [Google Scholar] [CrossRef]
  29. Zhao, Y.-P.; Li, Y.-C.; Dong, G.-H.; Gui, F.-K.; Teng, B. Numerical Simulation of the Effects of Structure Size Ratio and Mesh Type on Three-Dimensional Deformation of the Fishing-Net Gravity Cage in Current. Aquac. Eng. 2007, 36, 285–301. [Google Scholar] [CrossRef]
  30. Moe, H.; Fredheim, A.; Hopperstad, O.S. Structural Analysis of Aquaculture Net Cages in Current. J. Fluids Struct. 2010, 26, 503–516. [Google Scholar] [CrossRef]
  31. Huang, L.; Li, Y.; Wang, G.; Wang, Y.; Wu, Q.; Jia, M.; Wan, R. An Improved Morison Hydrodynamics Model for Knotless Nets Based on CFD and Metamodelling Methods. Aquac. Eng. 2022, 96, 102220. [Google Scholar] [CrossRef]
  32. Hilber, H.M.; Hughes, T.J.R. Collocation, Dissipation and [Overshoot] for Time Integration Schemes in Structural Dynamics. Earthq. Eng. Struct. Dyn. 1978, 6, 99–117. [Google Scholar] [CrossRef]
  33. Choc, Y.-I.; Casarell, M.J. Hydrodynamic Resistance of Towed Cables. J. Hydronautics 1971, 5, 126–131. [Google Scholar] [CrossRef]
  34. DeCew, J.; Tsukrov, I.; Risso, A.; Swift, M.R.; Celikkol, B. Modeling of Dynamic Behavior of a Single-Point Moored Submersible Fish Cage under Currents. Aquac. Eng. 2010, 43, 38–45. [Google Scholar] [CrossRef]
  35. Zhao, Y.-P.; Li, Y.-C.; Dong, G.-H.; Gui, F.-K.; Teng, B. A Numerical Study on Dynamic Properties of the Gravity Cage in Combined Wave-Current Flow. Ocean. Eng. 2007, 34, 2350–2363. [Google Scholar] [CrossRef]
  36. Li, N.; Li, X.; Shi, W.; Liu, C. Numerical simulation of hydrodynamic characteristics of the plane net under waves and current. J. Shanghai Ocean. Univ. 2024, 33, 509–519, (In Chinese with English Abstract). [Google Scholar]
Figure 1. Schematics of the distribution of tidal currents in the Bohai Sea.
Jmse 13 01900 g001
Figure 2. The most representative bottom-mounted aquaculture farm in the Bohai Sea and the structural details.
Jmse 13 01900 g002
Figure 3. Coordinate system of the net system.
Jmse 13 01900 g003
Figure 4. Schematics of the Morison hydrodynamics model for net twines, which is reprinted with permission from [31].
Jmse 13 01900 g004
Figure 5. Definition of the netting ropes.
Jmse 13 01900 g005
Figure 6. Diagram of vertical netting and bottom rope numbering.
Jmse 13 01900 g006
Figure 7. Numerical model of Scheme 1.
Jmse 13 01900 g007
Figure 8. Numerical model of Scheme 2.
Jmse 13 01900 g008
Figure 9. Numerical model of Scheme 3.
Jmse 13 01900 g009
Figure 10. Deformations of the net system of Scheme 1 (water depth 36.5 m and 15° of sea condition).
Jmse 13 01900 g010
Figure 11. Deformations of the net system of Scheme 1 (water depth 34.5 m and 15° of sea condition).
Jmse 13 01900 g011
Figure 12. Deformations of the net system of Scheme 2 (water depth 36.5 m and 15° sea condition).
Jmse 13 01900 g012
Figure 13. Deformations of the net system of Scheme 2 (water depth 34.5 m and 15° sea condition).
Jmse 13 01900 g013
Figure 14. Deformations of the net system of Scheme 3 (water depth 36.5 m and 15° sea condition).
Jmse 13 01900 g014
Figure 15. Deformations of the net system of Scheme 3 (water depth 34.5 m and 15° sea condition).
Jmse 13 01900 g015
Table 1. Quantitative modifications and objectives of Scheme 2 and Scheme 3 compared with Scheme 1.
SchemesDesign ObjectiveModifications Compared with Scheme 1
2Increase aquaculture volume and utilization rate
  • Netting bottom lowered by 2 m
  • Netting height increased
  • Inner netting angle reduced by 4°
  • Vertical rope spacing increased by 0.5 m
3Optimize load distribution while maintaining aquaculture volume
  • Netting bottom lowered by 2 m
  • Netting height increased
  • Tension rope-netting bottom angle increased by 13°
  • Vertical rope spacing increased by 1 m
Table 2. Sea state parameters table.
Environmental LoadSurvival Condition (100-Year Recurrence)Normal Operational Condition
(1-Year Recurrence)
Remarks
Ambient temperature (°C)−10.0–36.0Air temperature
Air humiditySummer humidity 70%/
Water depth (m)32.5Water depth at low tide
Tidal range (m)2/
Storm surge water level rise (m)2/
Wind speed (m/s)36.017.11 min average wind speed at 10 m above sea level
Maximum wave height (m)8.45.8/
Wave period (s)12.510.3/
Surface current velocity (m/s)1.51.5/
Bottom current velocity (m/s)1.01.0/
Ice formation riskNoNo/
Table 3. Computational cases. Note: the sea condition angle of 0° is along the positive direction of the x-axis, and 90° is along the positive direction of the y-axis.
Scheme No.Working Condition TypeCase No.Wave–Current Direction
(deg)
Water DepthWave Height
(m)
Wave Period
(T)
Current Velocity
(m/s)
Scheme 1 Survival conditioncase1-1036.58.412.51.5/1.0
case1-21536.58.412.51.5/1.0
case1-33036.58.412.51.5/1.0
case1-44536.58.412.51.5/1.0
Operational conditioncase1-5034.55.810.31.5/1.0
case1-61534.55.810.31.5/1.0
case1-73034.55.810.31.5/1.0
case1-84534.55.810.31.5/1.0
Survival conditioncase1-9034.58.412.51.5/1.0
case1-101534.58.412.51.5/1.0
case1-113034.58.412.51.5/1.0
case1-124534.58.412.51.5/1.0
Operational conditioncase1-13032.55.810.31.5/1.0
case1-141532.55.810.31.5/1.0
case1-153032.55.810.31.5/1.0
case1-164532.55.810.31.5/1.0
Scheme 2 Survival conditioncase2-1036.58.412.51.5/1.0
case2-21536.58.412.51.5/1.0
case2-33036.58.412.51.5/1.0
case2-44536.58.412.51.5/1.0
Operational conditioncase2-5034.55.810.31.5/1.0
case2-61534.55.810.31.5/1.0
case2-73034.55.810.31.5/1.0
case2-84534.55.810.31.5/1.0
Scheme 3 Survival conditioncase3-1036.58.412.51.5/1.0
case3-21536.58.412.51.5/1.0
case3-33036.58.412.51.5/1.0
case3-44536.58.412.51.5/1.0
Operational conditioncase3-5034.55.810.31.5/1.0
case3-61534.55.810.31.5/1.0
case3-73034.55.810.31.5/1.0
case3-84534.55.810.31.5/1.0
Table 4. Maximum loads on the side and corner vertical ropes under different cases in Scheme 1.
Working ConditionCase No.Wave and Current Direction (deg)Water Depth (m)Maximum Load of Side Netting Vertical Ropes (Tons)Maximum Load of Corner Vertical Ropes (Tons)
Survival conditioncase1-1036.520.315.3
case1-21536.526.317.2
case1-33036.524.416.0
case1-44536.521.814.0
Operational
condition
case1-5034.515.611.5
case1-61534.520.112.9
case1-73034.518.812.3
case1-84534.516.910.8
Survival conditioncase1-9034.519.114.3
case1-101534.525.016.1
case1-113034.523.315.2
case1-124534.520.813.4
Operational conditioncase1-13032.514.610.9
case1-141532.519.112.2
case1-153032.517.811.7
case1-164532.515.910.3
Table 5. Maximum loads on the bottom rope under different cases in Scheme 1.
Working ConditionCase No.Wave and Current Direction (deg)Water Depth (m)The maximum Load of the Tension Ropes at the Four Bottom Corners (Tons)The Maximum Load of Other Tension Ropes at the Bottom (Tons)
Survival conditioncase1-1036.530.327.8
case1-21536.537.936.4
case1-33036.536.535.3
case1-44536.530.731.7
Operational conditioncase1-5034.523.721.9
case1-61534.529.828.5
case1-73034.528.827.6
case1-84534.524.324.8
Survival conditioncase1-9034.529.726.9
case1-101534.537.435.7
case1-113034.535.934.5
case1-124534.530.131.0
Operational conditioncase1-13032.522.920.9
case1-141532.528.927.3
case1-153032.527.826.3
case1-164532.523.423.5
Table 6. Maximum loads on side and corner vertical netting ropes under different cases in Scheme 2.
Working ConditionCase No.Wave and Current Direction (deg)Water DepthMaximum Load of Side Netting Vertical Ropes (Tons)Maximum Load of Corner Vertical Ropes (Tons)
Survival conditioncase2-1036.524.519.5
case2-21536.531.722.6
case2-33036.529.221.2
case2-44536.525.917.8
Operational conditioncase2-5034.518.815.0
case2-61534.524.317.4
case2-73034.522.616.3
case2-84534.520.214.0
Table 7. Maximum loads on bottom rope under different cases in Scheme 2.
Working ConditionCase No.Wave and Current Direction (deg)Water Depth (m)The Maximum Load of the Tension Ropes at the Four Bottom Corners (Tons)The Maximum Load of Other Tension Ropes at the Bottom (Tons)
Survival conditioncase2-1036.536.432.6
case2-21536.544.242.3
case2-33036.542.240.1
case2-44536.534.435.6
Operational conditioncase2-5034.528.325.8
case2-61534.534.933.5
case2-73034.533.531.7
case2-84534.527.628.2
Table 8. Maximum loads on the side and corner vertical netting ropes with different cases of Scheme 3.
Working ConditionCase No.Wave and Current Direction (deg)Water DepthMaximum Load of Side Netting Vertical Ropes (Tons)Maximum Load of Corner Vertical Ropes (Tons)
Survival conditioncase3-1036.521.617.8
case3-21536.527.520.8
case3-33036.525.519.9
case3-44536.523.422.3
Operational conditioncase3-5034.516.813.6
case3-61534.519.514.4
case3-73034.519.515.0
case3-84534.518.216.8
Table 9. Maximum loads on the bottom rope with different cases of Scheme 3.
Working ConditionCase No.Wave and Current Direction (deg)Water Depth (m)The Maximum Load of the Tension Ropes at the Four Bottom Corners (Tons)The Maximum Load of Other Tension Ropes at the Bottom (Tons)
Survival conditioncase3-1036.537.734.7
case3-21536.546.144.3
case3-33036.543.942.3
case3-44536.542.739.8
Operational conditioncase3-5034.530.128.2
case3-61534.533.932.6
case3-73034.535.033.7
case3-84534.534.331.7
Table 10. Maximum displacement of the net system with different cases of Scheme 1.
Working ConditionCase No.Wave and Current Direction (deg)Water Depth (m)Maximum Netting Displacement (m)Peak x-Direction Displacement (m)Minimum Distance to Diagonal Brace (m)
Survival conditioncase1-1036.53.327.30.23
case1-21536.54.028.0−0.46
case1-33036.53.727.7−0.12
case1-44536.53.127.10.40
Operational conditioncase1-5034.52.726.70.84
case1-61534.53.427.30.21
case1-73034.53.127.00.52
case1-84534.52.626.60.97
Survival conditioncase1-9034.53.327.20.35
case1-101534.54.027.9−0.36
case1-113034.53.727.6−0.01
case1-124534.53.127.00.52
Operational conditioncase1-13032.52.626.51.06
case1-141532.53.327.10.41
case1-153032.53.026.80.73
case1-164532.52.526.41.17
Table 11. Maximum displacement of the net system with different cases of Scheme 2.
Working ConditionCase No.Wave and Current Direction (deg)Water Depth (m)Maximum Netting Displacement (m)Peak x-Direction Displacement (m)Minimum Distance to Diagonal Brace (m)
Survival conditioncase2-1036.53.9528.48−0.93
case2-21536.54.7029.21−1.66
case2-33036.54.2828.79−1.24
case2-44536.53.7128.23−0.68
Operational conditioncase2-5034.53.3627.87−0.32
case2-61534.54.0628.56−1.01
case2-73034.53.6728.17−0.62
case2-84534.53.1427.65−0.10
Table 12. Maximum displacement of the net system with different cases of Scheme 3.
Working ConditionCase No.Wave and Current Direction (deg)Water Depth (m)Maximum Netting Displacement (m)Peak x-Direction Displacement (m)Minimum Distance to Diagonal Brace (m)
Survival conditioncase3-1036.54.3628.49−0.94
case3-21536.55.0829.18−1.63
case3-33036.54.6628.78−1.23
case3-44536.53.9728.11−0.56
Operational conditioncase3-5034.53.9128.04−0.49
case3-61534.53.9328.06−0.51
case3-73034.54.0428.13−0.58
case3-84534.53.4127.520.03
Disclaimer/Publisher’s Note: The statements, opinions and data contained in all publications are solely those of the individual author(s) and contributor(s) and not of MDPI and/or the editor(s). MDPI and/or the editor(s) disclaim responsibility for any injury to people or property resulting from any ideas, methods, instructions or products referred to in the content.