Article

AquaVib: Enabling the Separate Evaluation of Effects Induced by Acoustic Pressure and Particle Motion on Aquatic Organisms

1
Laboratory of Applied Bioacoustics, Universitat Politècnica de Catalunya, BarcelonaTech (UPC), 08800 Vilanova i la Geltrú, Spain
2
Netherlands Organisation for Applied Scientific Research (TNO), 2597 AK The Hague, The Netherlands
*
Author to whom correspondence should be addressed.
J. Mar. Sci. Eng. 2025, 13(10), 1885; https://doi.org/10.3390/jmse13101885
Submission received: 23 July 2025 / Revised: 24 September 2025 / Accepted: 25 September 2025 / Published: 1 October 2025
(This article belongs to the Special Issue Recent Advances in Marine Bioacoustics)

Abstract

Scientific awareness is rising regarding fish and sea invertebrates’ sensitivity to the sound field’s particle motion component. The AquaVib, a distinctive laboratory setup, provides a practical methodology for controlled sound exposure experiments on small aquatic organisms, enabling a separate assessment of their acoustic pressure- and particle motion-elicited responses across a range of realistic scenarios. The chosen facility design permits the reproduction of realistic sound exposures at different kinetic-to-potential energy ratios, with characteristics similar to underwater-radiated noise from human activities such as shipping or offshore installations (<1 kHz). It provides a cost-efficient multimodal approach to investigate potential physiological, pathological, and ultrastructural effects on small aquatic organisms at any stage of maturity. This study details the vibroacoustic characterization of the AquaVib system, identifies key challenges, and outlines planned improvements. The ultimate goal of the presented approach is to contribute to the scientific community and competent authorities in covering the main gaps in current knowledge on the sensitivity of aquatic organisms to the particle motion component and to identify and quantify potential acute and long-term detrimental effects arising from human activities.

1. Introduction

Many aquatic organisms are largely dependent on their ability to interpret and exploit vibroacoustic cues, e.g., foraging, social communication, alertness, orientation, etc. How they interact with and to what extent they are negatively affected by anthropogenic noise is a matter of study that commonly employs the acoustic pressure sound field component as a unique baseline metric [1,2]. However, recent research consistently demonstrates that fish, marine invertebrates, and even flora are significantly more sensitive to the particle motion component of the sound field [3,4,5,6,7]. Although a growing number of field- [8,9], and lab-based [10,11,12,13,14] studies have investigated particle motion-elicited responses in aquatic organisms, there is still a substantial knowledge gap.
Recent literature [6,15,16,17,18,19] highlights the inherent difficulties for reliably measuring the particle motion component in both field- and lab-based studies. The absence of international standards on how to measure, interpret, and report particle motion measurements complicates the comparison between published results. Additionally, the tight relationship between the sound pressure and particle motion components makes it challenging for scientists to separately assess the responses of aquatic organisms associated with each of them.
Given the critical disruption that natural soundscapes are experiencing in this Anthropocene epoch due to an unprecedented introduction of sound sources, e.g., shipping, offshore wind farm construction [20], the scientific community is devoting its efforts to building up a global interdisciplinary collaboration effort [18]. One of the tasks in the EU Horizon 2020 research project SATURN: Solutions at Underwater Radiated Noise (https://www.saturnh2020.eu/, accessed on 24 September 2025) concerns studies to identify the most detrimental vibroacoustic cues in shipping sound to key species of fish and invertebrates, separately assessing the effects associated with both acoustic pressure and particle motion sound components.
The AquaVib system, inspired by the Larvaebrator [11], the HICI-FT [21,22], and the standing-wave acoustic tube developed by Sand and Karlsen [23], is presented here as a tool for laboratory sound exposure studies. It provides a practical methodology for achieving consistent and comparable data on the sensitivity of small aquatic organisms at any of their life stages to realistic vibroacoustic cues, assessing acoustic pressure and particle motion components across varying energy ratios. The compact water volume in which the organisms are exposed to sound is either compressed (acoustic pressure configuration) or shaken (particle motion configuration), creating a scenario in which the kinetic-to-potential energy ratio can be significantly altered. The aim of this paper is to provide a comprehensive account of the design and operation of AquaVib, an innovative instrument for laboratory-based sound exposure studies that enables independent evaluation of acoustic pressure and particle motion effects. We describe the characterization of the setup, presenting a validation of its current performance, and an exploration of the key challenges in establishing a high-standard technique for sound-controlled exposure experiments in the laboratory.

2. Materials and Methods

The AquaVib (Figure 1), housed in an artificially illuminated cabin, consists of an interchangeable rigid-walled, water-filled acoustic chamber (250 mm length × 152 mm internal diameter), with a 9 mm-thick borosilicate glass (2.7 g/cm3) wall, that holds the target organisms in 4.5 L of water. The chamber is driven at both ends by a pair of electrodynamic shakers. These can be configured and controlled so that the target organisms in the chamber can be exposed to different kinetic-to-potential energy ratios (Section 3.4), with controllable ambient and spectral characteristics. Furthermore, the behavioral response of the organisms can be observed through the transparent acoustic chamber wall, while their oxygen consumption is measured (Section 3.5).

2.1. Sound Field Metrics

The terms and definitions used follow those proposed by Nedelec et al. [18], also compatible with ISO 18405:2017 [24]. We describe here the most relevant conventions to ease the interpretation of results.
The sound pressure level (SPL), L p , in dB re 1 µPa2, is computed as the level of the time-average mean-square of the measured acoustic pressure.
The mean-square sound particle velocity level (PVL), L u , in dB re 1 (nm/s)2, is computed from the sound particle acceleration level (PAL), L a in dB re 1 (µm/s2)2, as
L u = L a 20   log 10 ( 2 π f / f 0 )   dB + 60   dB
where f 0 = 1   Hz , the reference value for frequency, and the 60 dB term accounts for the conversion between the reference values for sound particle acceleration and velocity.
The total energy carried by a sound wave is made up of the sum of its potential energy ( E p o t ), and its kinetic energy ( E k i n ), which are directly related to the compression and rarefaction of the medium and the motion of the particles that constitute the propagation medium, respectively. Thus, mean-square acoustic pressure p 2 ¯ , and sound particle velocity u 2 ¯ , are related to E p o t and E k i n as
E p o t = p 2 ¯ / 2 ρ c 2
E k i n = ρ u 2 ¯ / 2
where ρ (~1.03 g/cm3) is the density of seawater, and c (~1500 m/s) is the speed of sound in seawater.
This is translated into the dB scale as L E p o t and L E k i n , with reference units E o = 1   p J , u o = 1   n m / s and p 0 = 1   µ P a :
L E p o t = 10   log 10 p 2 ¯ / 2 ρ c 2 E 0   dB = L p + 10   log 10 p 0 2 / 2 ρ c 2 E 0   dB
L E k i n = 10   log 10 ρ u 2 ¯ / 2 E 0   dB = L u + 10   log 10 ρ u 0 2 / 2 E 0   dB
The energy ratio is then expressed as
L E p o t L E k i n = L p L u 10   log 10 ρ c 2 u 0 2 / p 0 2   dB L p L u 64   dB
In a plane wave in free-field conditions, i.e., far from sources and acoustic boundaries, the energy components of the sound field, E p o t and E k i n , are considered to be equal [25]. Therefore, from (6), it can be derived that under acoustic free-field conditions,
L p L u = 10   log 10 ρ c 2 u 0 2 / p 0 2   dB 64   dB
On the contrary, when the aforementioned conditions are not met, e.g., at the source’s near-field, in shallow waters, or close to acoustic boundaries, the potential and kinetic energies are theoretically not equal ( E k i n E p o t ) [6], and thus the approximation defined in Equation (7) is no longer valid. However, several authors have recently demonstrated that in many practical cases, except in the very near-field, potential and kinetic energies are equal within calibration uncertainty of ±1.5 dB, when computed in decidecade bands throughout a sufficiently large frequency range [25,26,27,28].

2.2. Sound Field Spectrum Computation

To compute the reported spectra along Section 3, we applied a 7th-order elliptic bandpass filter between 5 Hz and 1 kHz on non-overlapping 10 s segments in the time series. Subsequently, the filtered segments were windowed using a Tukey window with a 15% cosine taper before computing the FFT with a frequency resolution of 0.1 Hz, based on a sampling rate of 48 kHz.

2.3. Description of the System Setup

2.3.1. Target Organisms Caring

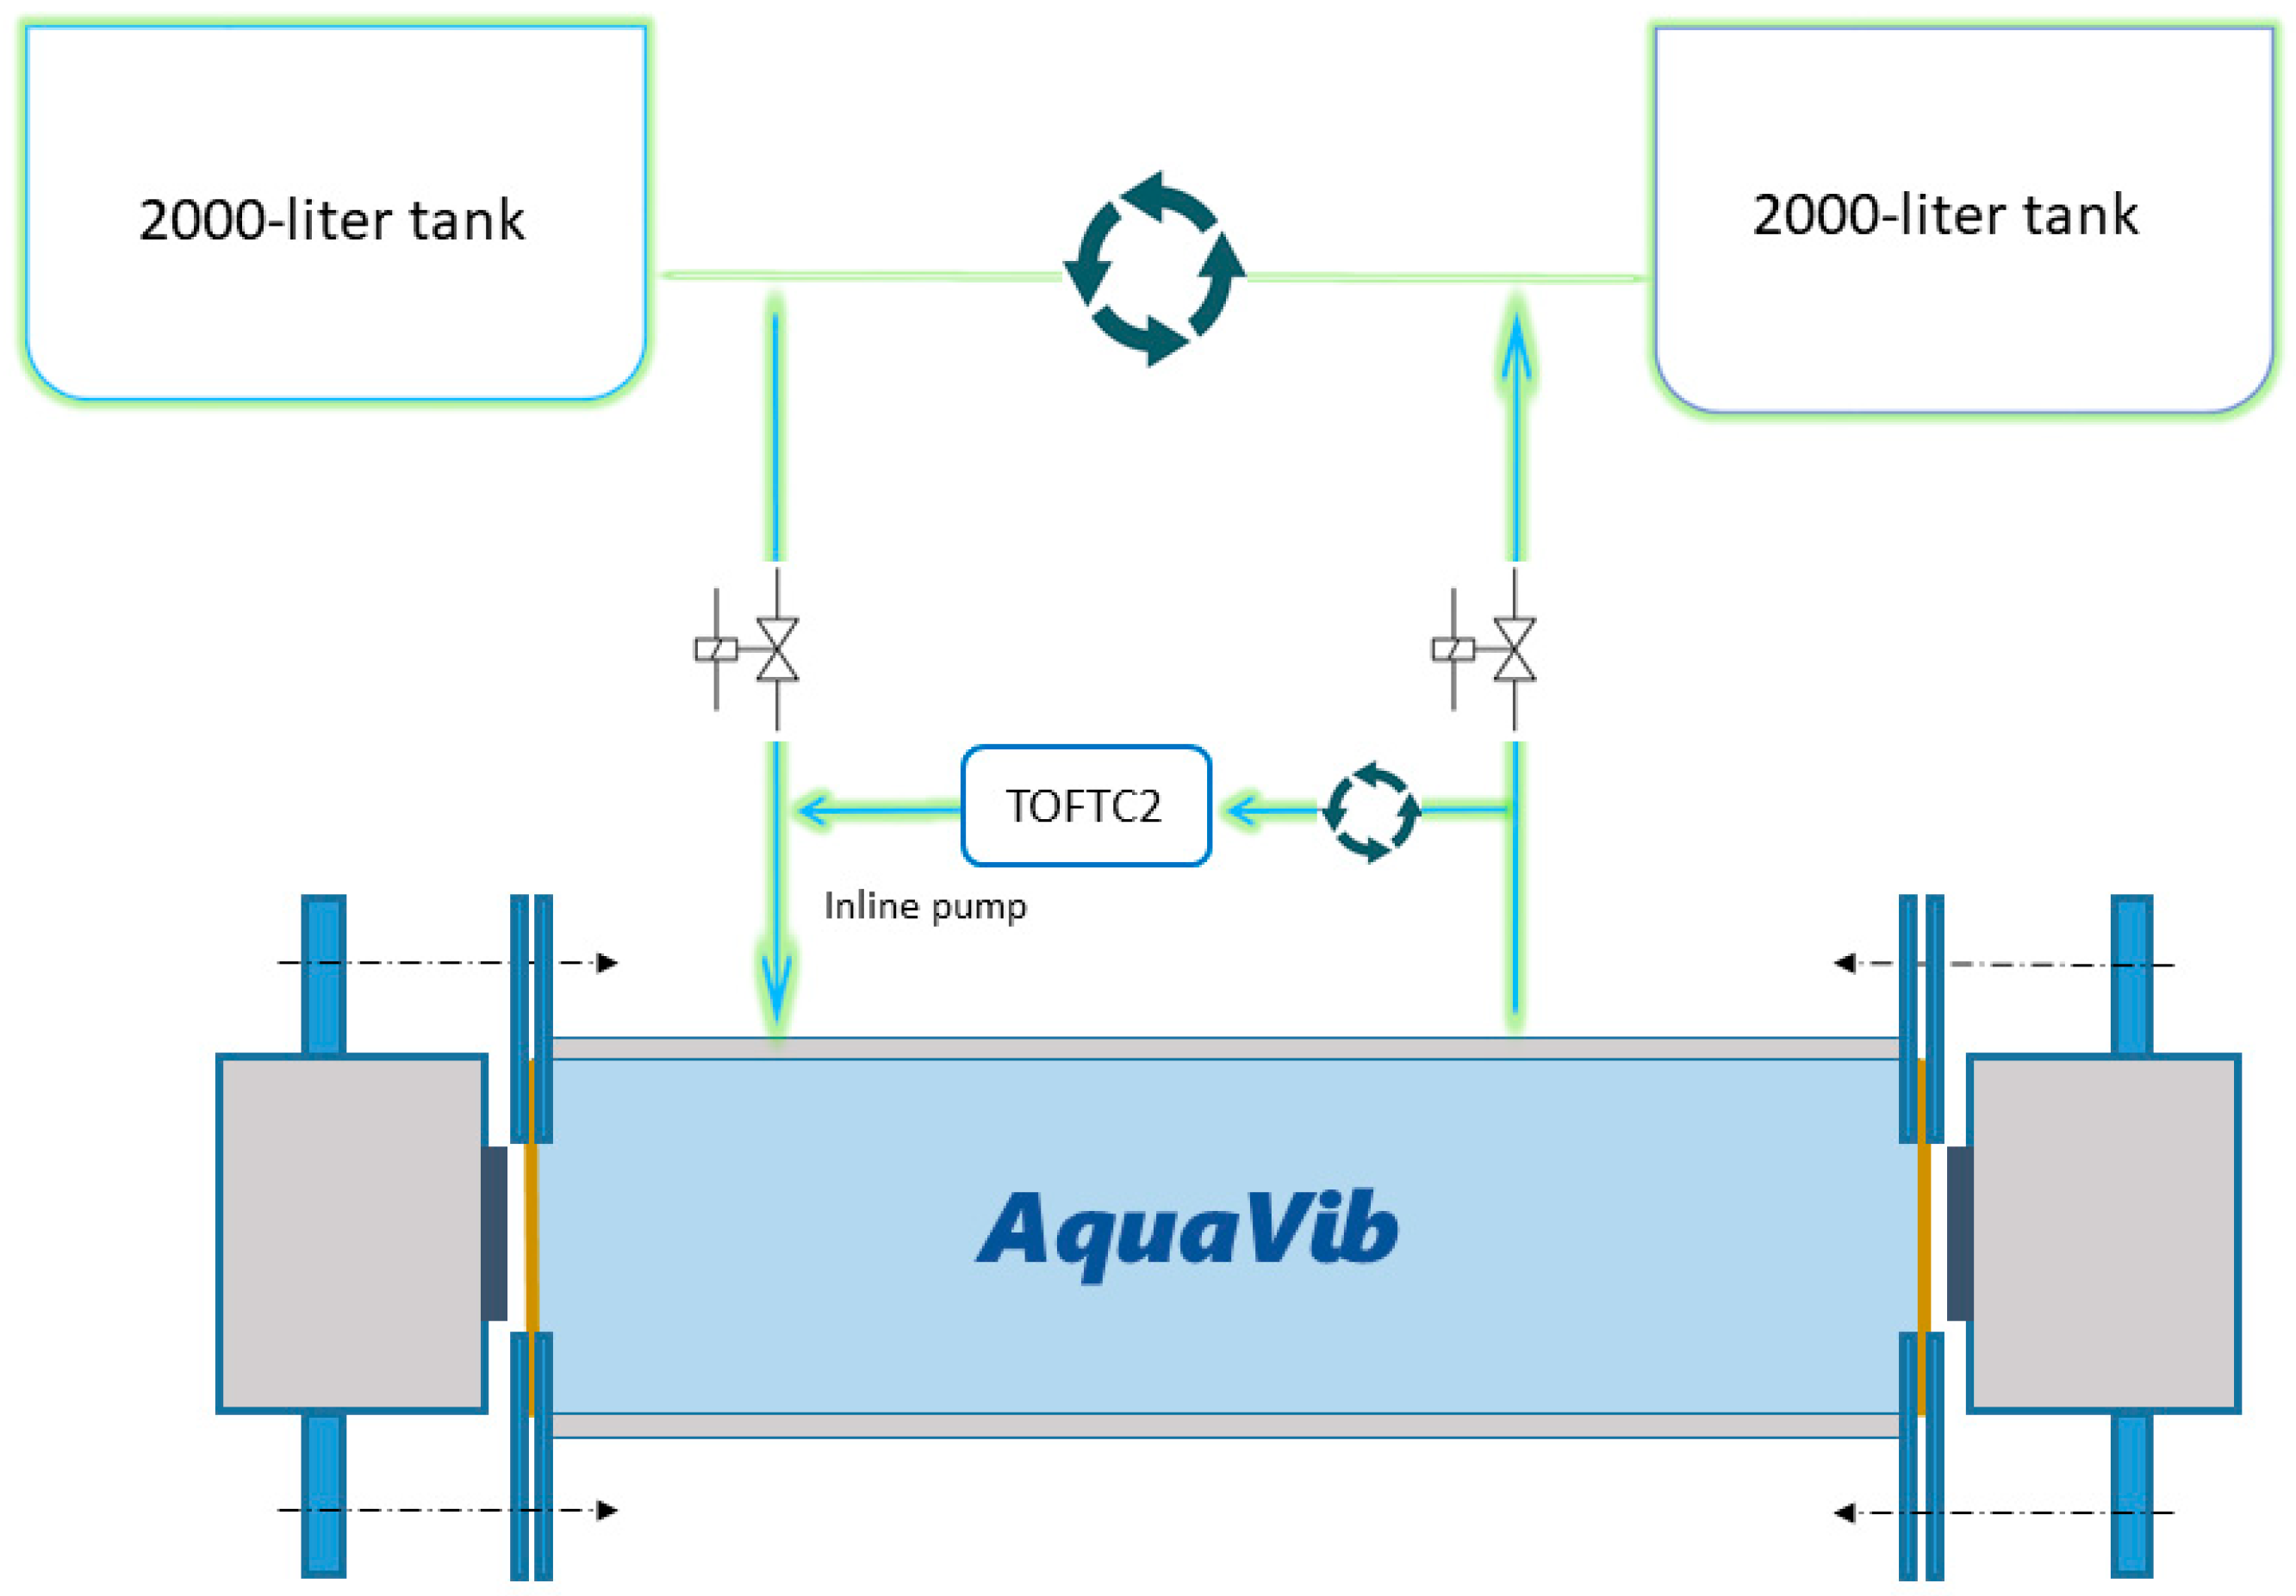
The AquaVib is connected to a system of two 2000 L maintenance tanks that recirculate filtered natural seawater at a preset temperature (pictures in Supplementary Materials, Section S10). This system maintains the target organisms under the same ambient conditions during the acclimatization, exposure, and post-exposure periods (Figure 2).
Automated maintenance of water temperature within the ±0.5 °C range and dissolved O2 above 90% of its initial content throughout the exposure prevents harm to target organisms due to significant changes in the ambient conditions, such as hypoxia or the accumulation of waste products in the exposure chamber.

2.3.2. Sound Exposure

Powered by a 4 kW stereo audio amplifier (ICE-4000, AudioLab, Huntingdon, UK), a horizontally oriented facing pair of 1 kN electrodynamic shakers (JZK-100, Sinocera Piezotronics Inc., Yangzhou, China) is used as vibroacoustic projectors. Sound particle acceleration is tracked at the rear face of their moving elements through a pair of 100 mV/g IEPE accelerometers (805-0050, TE Connectivity Ltd., Galway, Ireland). These are powered by a CCLD signal conditioner (Type 1704-A-001, Brüel & Kjær Sound & Vibration Measurement A/S DK-2850 Nærum, Denmark).
The pair of electrodynamic shakers caps both ends of the acoustic chamber. It is equipped with a pair of preamplified hydrophones (HTI-96-MIN/SSQ, High Tech, Inc., North Attleboro, MA, USA) with a sensitivity of −190 dB at 1 V/µPa, respectively, located at the longitudinal middle point (center hydrophone), and 5 cm away from one end of the acoustic chamber (end hydrophone; on the left in Figure 1), to monitor the pressure fluctuations in the water column.
The analog signals acquired by both pairs of sensors are digitized using a USB-1608G DAQ (Measurement Computing Corporation, Concord, NH, USA).
Two 2 mm-thick Ethylene Propylene Diene Monomer (EPDM) membranes are used as mechanical interfaces at both ends to enclose the water volume inside the acoustic chamber. These are directly driven by the Ø108 mm, 5 mm thick aluminum shakers’ moving heads.

2.3.3. System Control and Handling

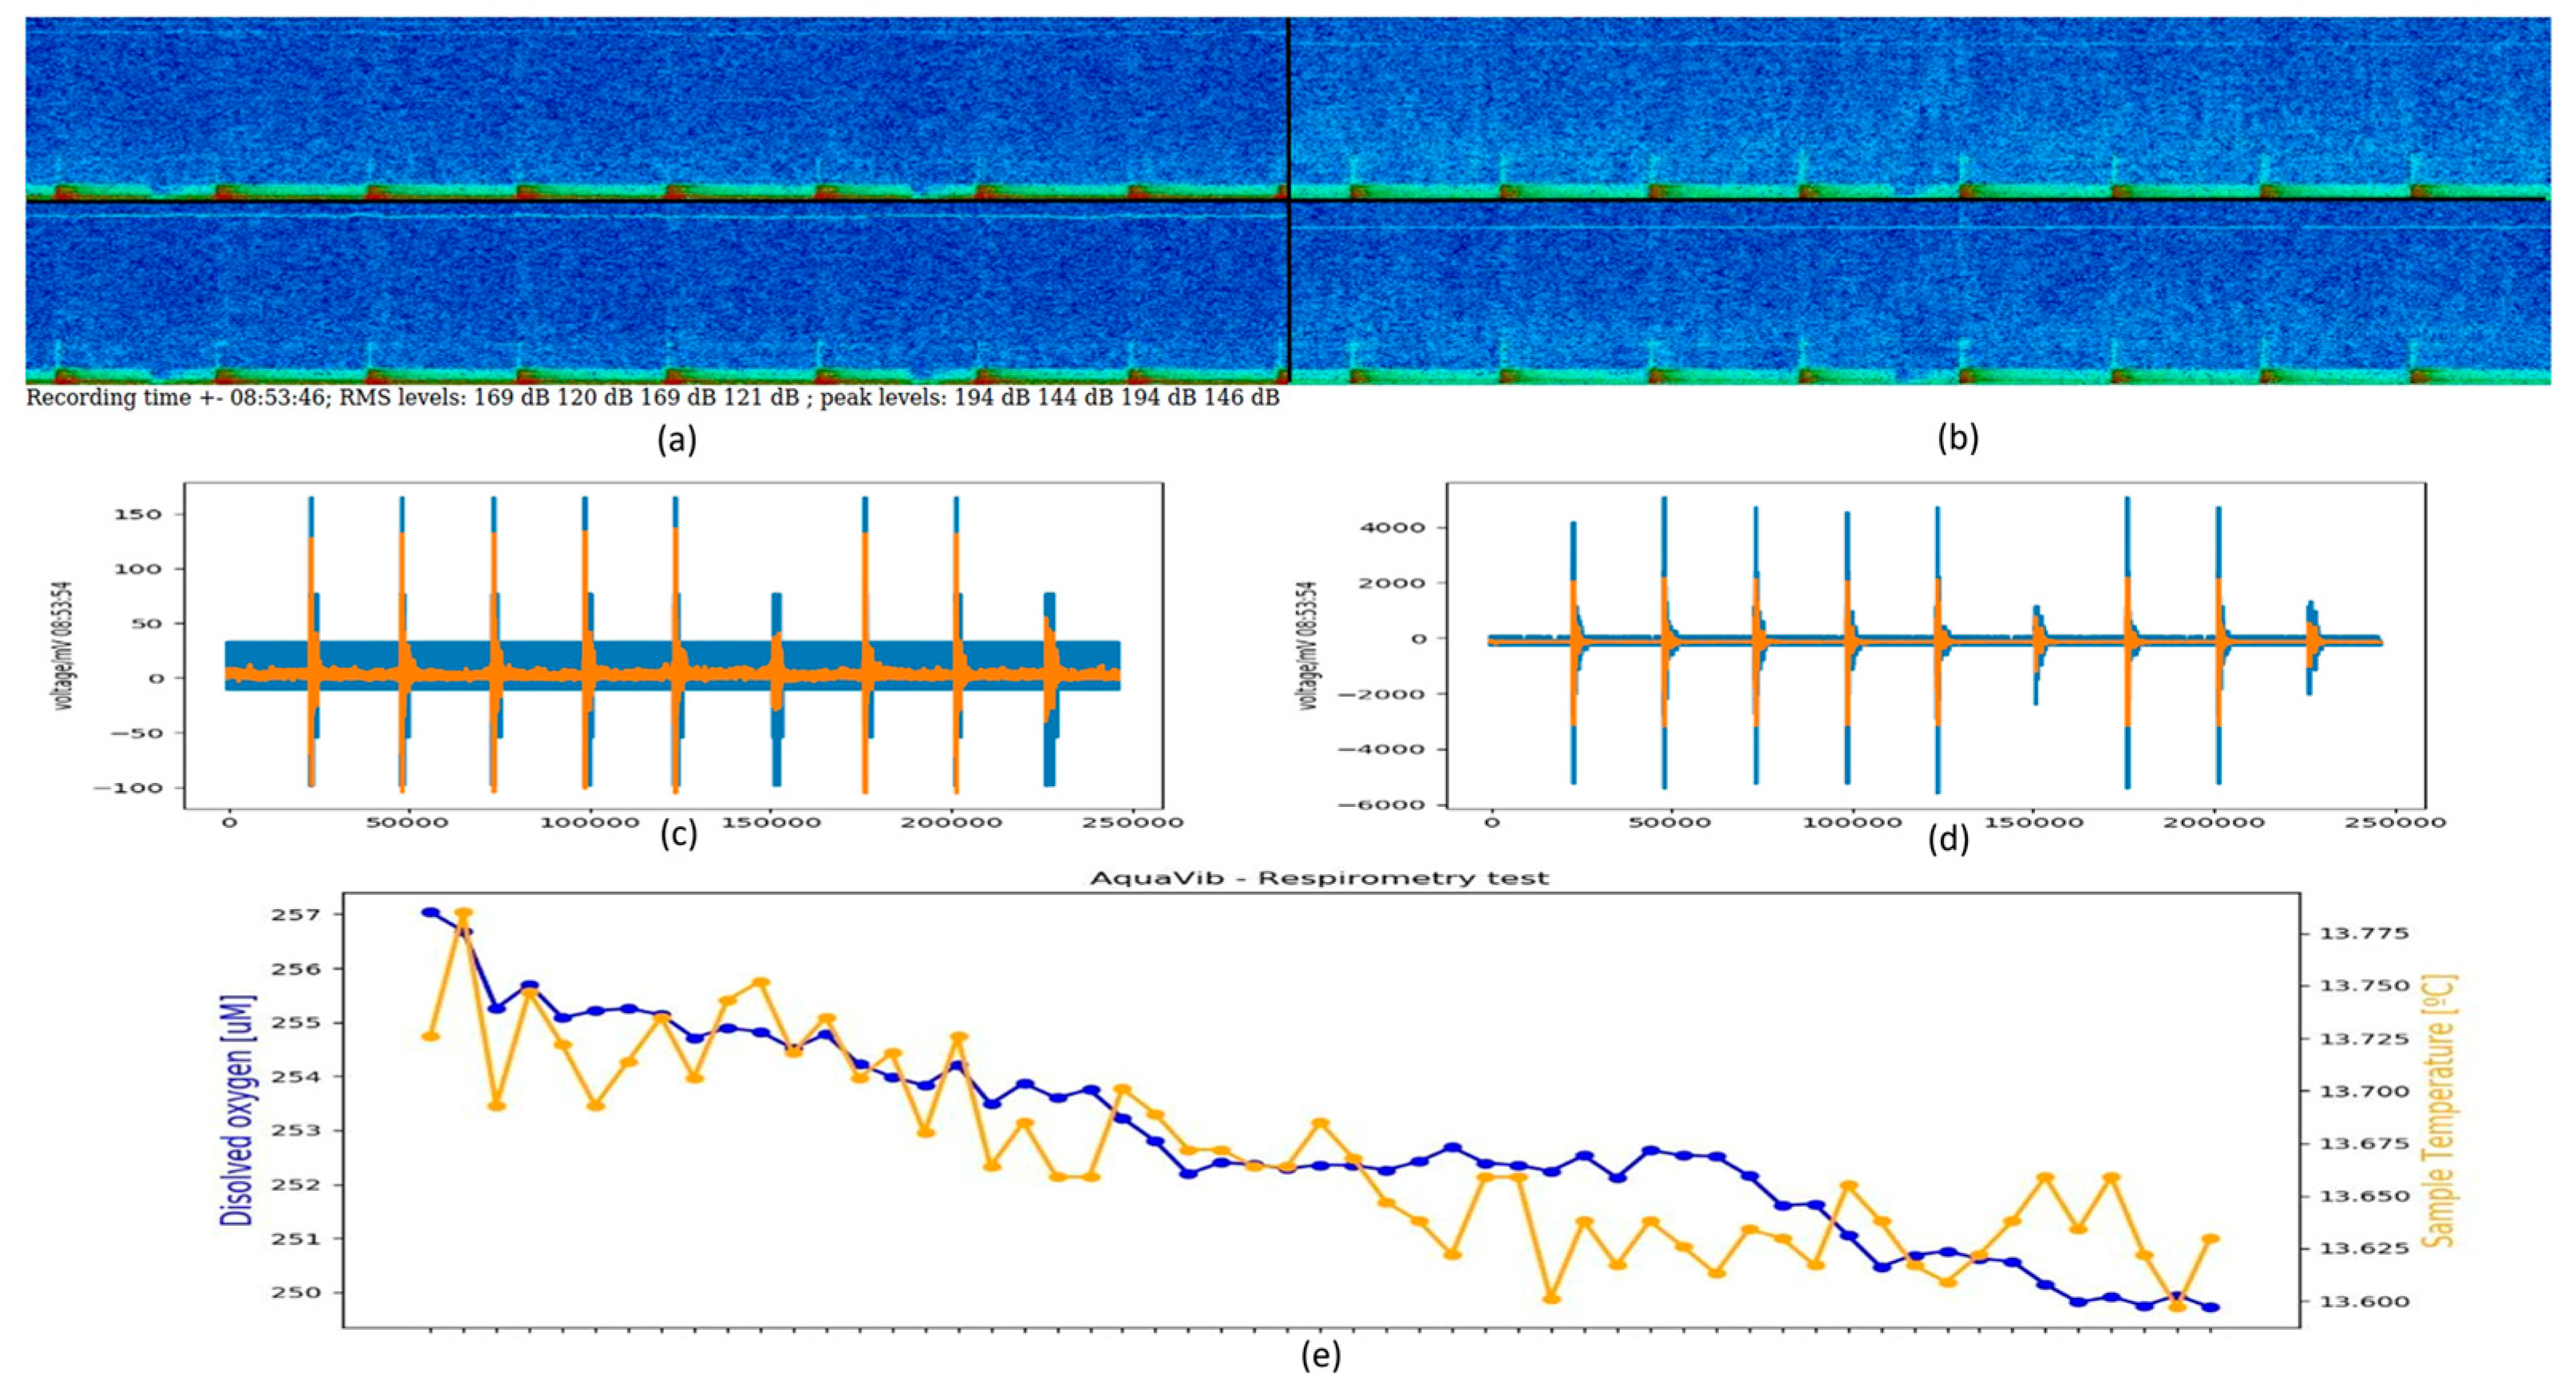
Based on the LIDO architecture [29], a Raspberry Pi 3B (Raspberry Pi Foundation, Cambridge, UK) is used for real-time data flow monitoring and remote control of sound field parameters and ambient conditions. Figure 3 illustrates an example of the dedicated real-time monitoring GUI, written in Python (version 3.11, Python Software Foundation, Fredericksburg, TX, USA), which tracks the main test’s parameters (see Supplementary Materials, Section S7). It aids in identifying unexpected events during the tests, e.g., acquisition failures, sudden changes in ambient conditions, etc.
Each shaker is set on top of a sliding platform to adjust its position relative to the mounted acoustic chamber, ensuring that its moving head is tightly coupled with the EPDM membranes.
The shaker-tube assembly is supported by a 5 mm thick steel structure, which in turn sits on four vibration-absorbing mixed-cell polyurethane elastomer blocks (Sylomer-TSR 450, AMC Mecanocaucho, Asteasu, Spain), over a 20 cm thick reinforced concrete platform, ensuring proper isolation from structural- and ground-borne vibrations of the water column (details in Supplementary Materials, Section S2).

2.3.4. Control of Kinetic-to-Potential Input Energy Ratio

A controllable exposure sound field at different kinetic-to-potential energy ratios can be generated within the water-filled acoustic chamber by the adjustment of the input power and the relative phase between the pair of shakers in two different configurations: acoustic pressure excitation at 0 degrees, and particle velocity excitation at 180 degrees, herein referred to as AP and PM configurations, respectively.
The concept under the AquaVib relies on two main theoretical assumptions:
  • A homogeneously distributed sound field is recreated if the largest dimension of the acoustic chamber (d) is significantly smaller than the shortest wavelength ( λ ) of the input excitation ( d λ / 6 ).
  • Through the pair of mechanical exciters placed at each end of the longitudinal section of the acoustic chamber, the whole bulk of the enclosed water can be compressed or shaken by playing with their relative phase in two configurations, i.e., 0 and 180 degrees, respectively. Thus, the kinetic-to-potential energy ratio can be significantly changed.

2.3.5. Physiological Assessment

Both dissolved oxygen and water temperature are autonomously measured by the FireSting®-O2 optical oxygen meter (PyroScience GmbH, Aachen, Deutschland), which controls a TOFTC2 sensor (temperature and oxygen flow through cell) and a TSUB21 (reference temperature) sensor, monitored through a dedicated Python library. These two sensors are connected to the acoustic chambers using a 4.0 × 6.0 mm PTFE-FEP tubing of low-O2 permeability (Bohlender GmbH, Grünsfeld, Germany). A low-power inline water pump (Syncra NANO, SICCE S.r.l., Pozzoleone, Italy) is used to continuously recirculate the water from the acoustic chamber to the TOFTC2 respirometer cell in an adjustable flow employing a threaded valve. Therefore, stratification inside the respirometer sensor is prevented [30] while ensuring the correct mixing of the water volume enclosed in the acoustic chamber [31] and maintaining the water flow rate within the range of the sensors to obtain reliable measures of both the water temperature and the dissolved oxygen content within the water-filled acoustic chamber.
The 4000 L of filtered and naturally oxygenated water held in the maintenance tank system is continuously pumped around in a closed circuit at a preset water temperature specific to each species. This maintains the target organisms in proper and stable ambient conditions, serving as a large, clean, and oxygenated water reservoir to rapidly refresh the water in the acoustic chamber during tests, thereby guaranteeing a return to normoxia after each flushing phase [31].
Additionally, the lighting is fully controlled, as the AquaVib system is installed inside a sealed and artificially illuminated cabin.

2.3.6. Behavioral Tracking of the Target Organisms

When there is interest in visual observation of the organisms being exposed, e.g., as part of behavioral studies, the transparent borosilicate–glass acoustic chamber and a GoPro HERO4 (GoPro Inc., San Mateo, CA, USA) enable for recording the experiment for post-analysis. A detailed behavioral test-specific protocol is out of the scope of the current text.

2.4. Exposure Protocol

The acoustic chamber is completely submerged in a 300 L basin located at the lower part of the support structure, where the temperature-controlled, fully oxygenated natural seawater is continuously recirculated to the maintenance tank system. The target organisms are carefully introduced into the chamber once the remaining air bubbles are completely released from the whole system. While the water recirculates, the acoustic chamber is closed at its top and placed between the shakers. Four steel rods are used to firmly pack the whole set together, squeezing the membranes against the moving heads of the shakers, ensuring direct excitation of the water volume in the chamber.
Once the exposure begins, the water recirculation to the maintenance tanks automatically halts, enabling ongoing monitoring of the temperature and the oxygen content within the acoustic chamber.
After the exposure test finishes, the initial process is reversed, and the organisms are carefully placed back into the maintenance tanks.
An input signal correction routine is performed before every exposure session to compensate for the response of the whole setup, striving to align the spectral characteristics of the generated sound field with those of interest, i.e., the target exposure (details in Supplementary Materials, Section S3).
To validate the capability of the AquaVib to investigate the sensitivity of organisms to each of the two components of the acoustic field, we evaluated the following characteristics based on various sets of measurements:
  • Background noise levels.
  • Accuracy of the corrected input signal to the target.
  • Particle motion measurement location.
  • Gain consistency of the system response between the acoustic pressure and particle motion components.
  • Reproducibility of the target exposure across different kinetic-to-potential energy ratios.
  • Accuracy in determining temperature and dissolved oxygen content inside the acoustic chamber.

3. Results and Discussion

3.1. Background Noise

The background noise levels should be low enough not to significantly contribute to the hydrophone or accelerometer measurements.
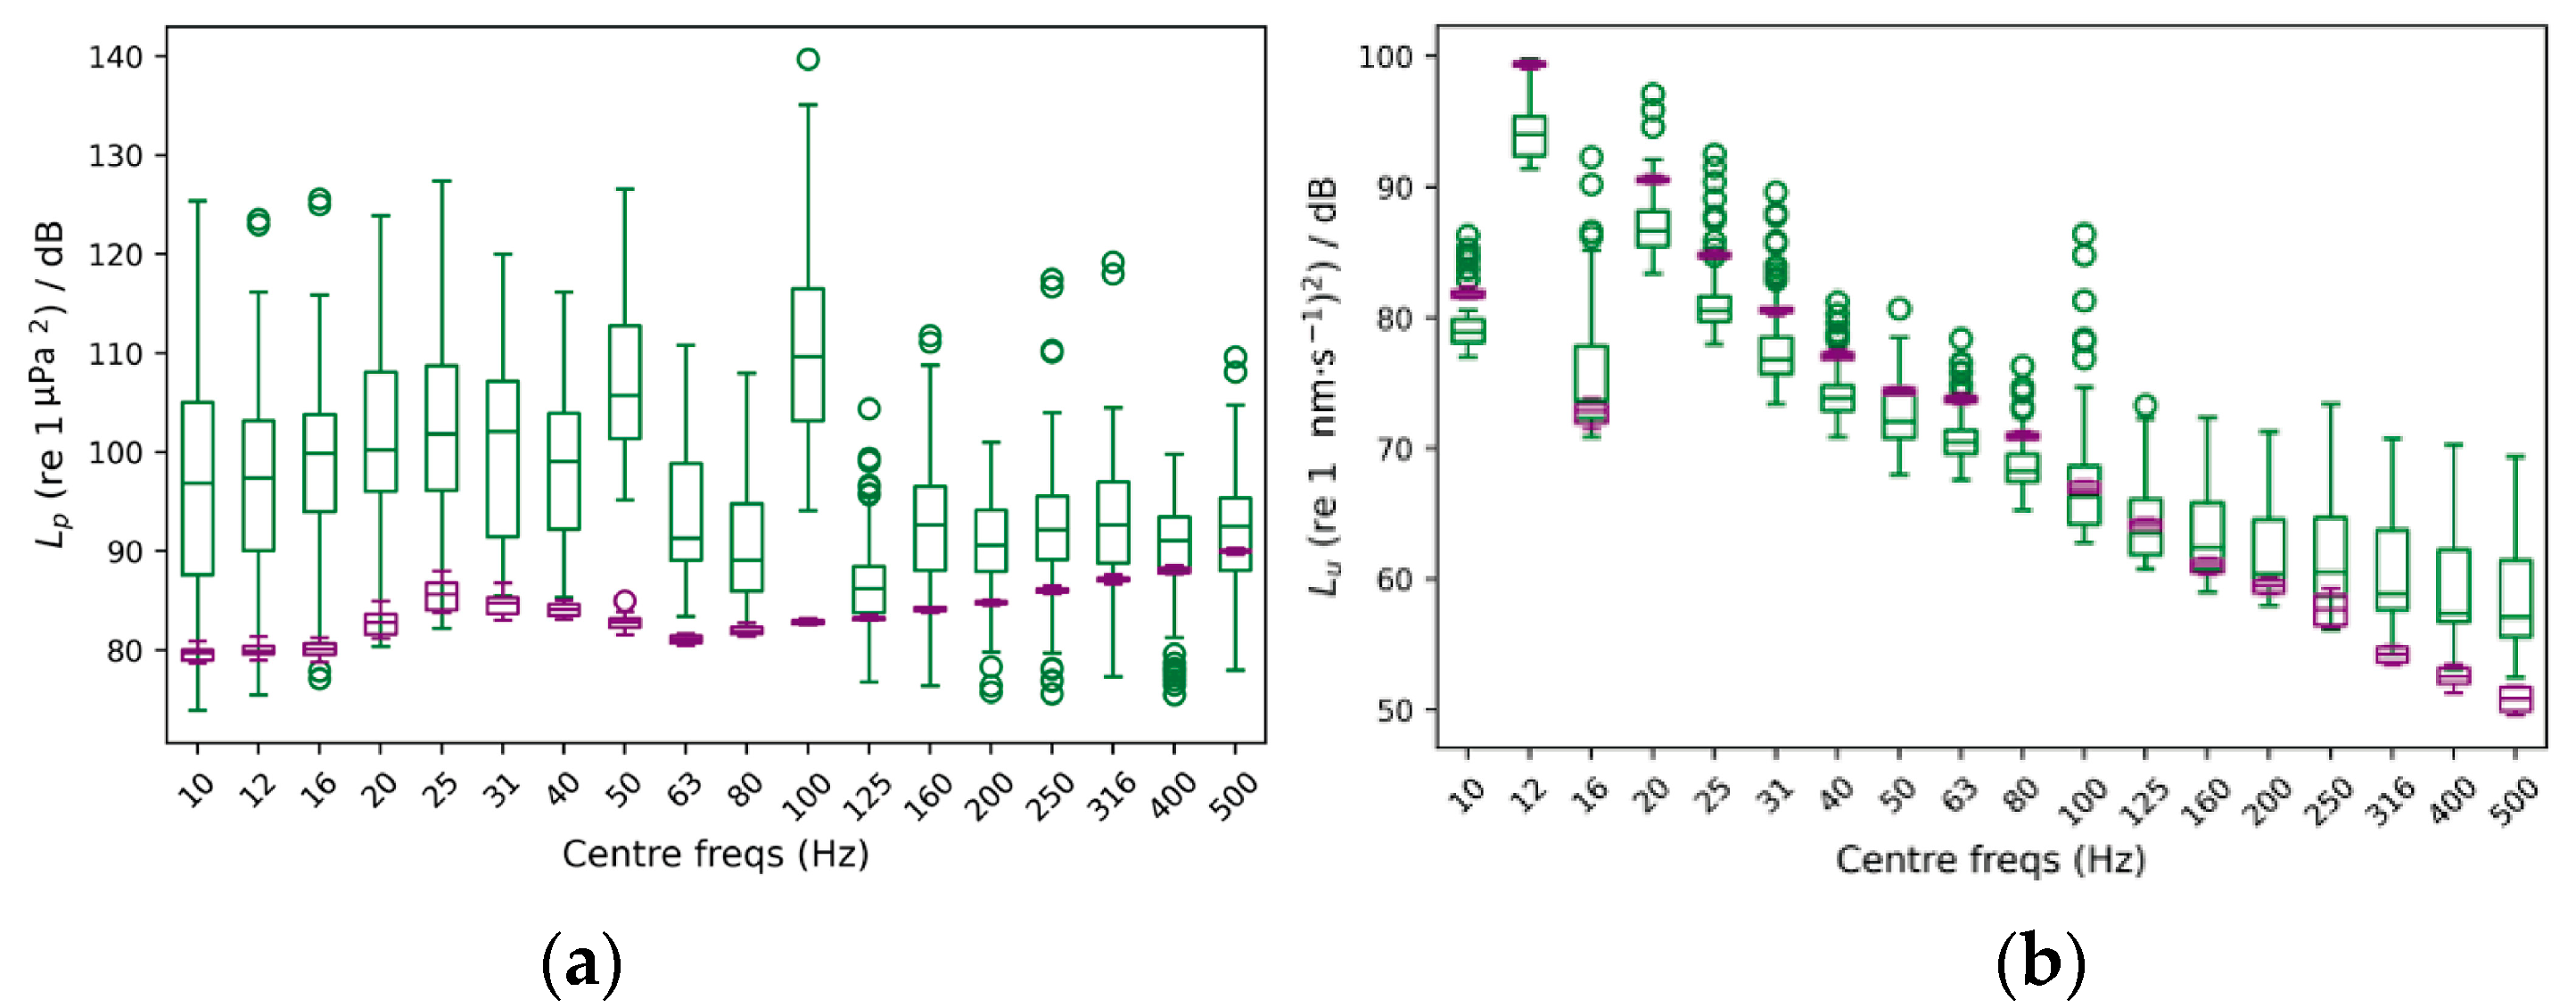
Figure 4 shows a boxplot of the measured background noise levels based on 33 independent replicates of a 20 min background bacteria respiration test, i.e., no sound was played (green bars), acquired from 20 December 2022, to 12 June 2023, within the EU-funded project SATURN: Developing Solutions at Underwater Radiated Noise (grant No. 101006443), following the same protocol as used in the exposure tests. On top of it, 4 independent 2 min long silent tests were taken, i.e., without running the water pump system (purple bars). The time-average pressure and particle velocity spectra were computed per decidecade (in 10 s intervals) for each replicate.
The water pump system of the maintenance tanks was identified as the main source of acoustic pressure background noise, causing a large variability in the measured spectra at relatively low pressure levels, i.e., below <100 dB SPL, re. 1 µPa2. Therefore, the current system design is limited in its ability to distinctly separate the biological responses of the exposed organisms to the target sound field from the effects induced by background noise.
A large peak and a strong minimum were detected, respectively, in the accelerometer measurements in the 12 Hz and 16 Hz bands with and without running the pumping system. This appeared to be caused by an electrical noise that leaked into the accelerometers’ acquisition chain.

3.2. Particle Motion Measurements Validation

Unlike other similar systems [11,22], the two accelerometers are located at the rear face of the shakers’ moving heads, therefore outside the water column [23].
A validation test of the accelerometer location was conducted by comparing the measured acceleration of the current accelerometers’ location with an epoxy-encapsulated accelerometer glued to the membrane face in direct contact with the water column. A uniform band-filtered (10–500 Hz) white noise was played for 60 s at 172 dB SPL (Lp re. 1 µPa2), averaged between the pair of hydrophones. A total of seven independent replicates were performed for both AP and PM configurations.
Results shown in Figure 5 validate the particle motion measurement location, assuming a maximum standard error in the in-water measurements of less than 1 dB and a maximum broadband PVL difference of less than 0.5 dB in both exposure configurations.

3.3. Gain’s Consistency Assessment

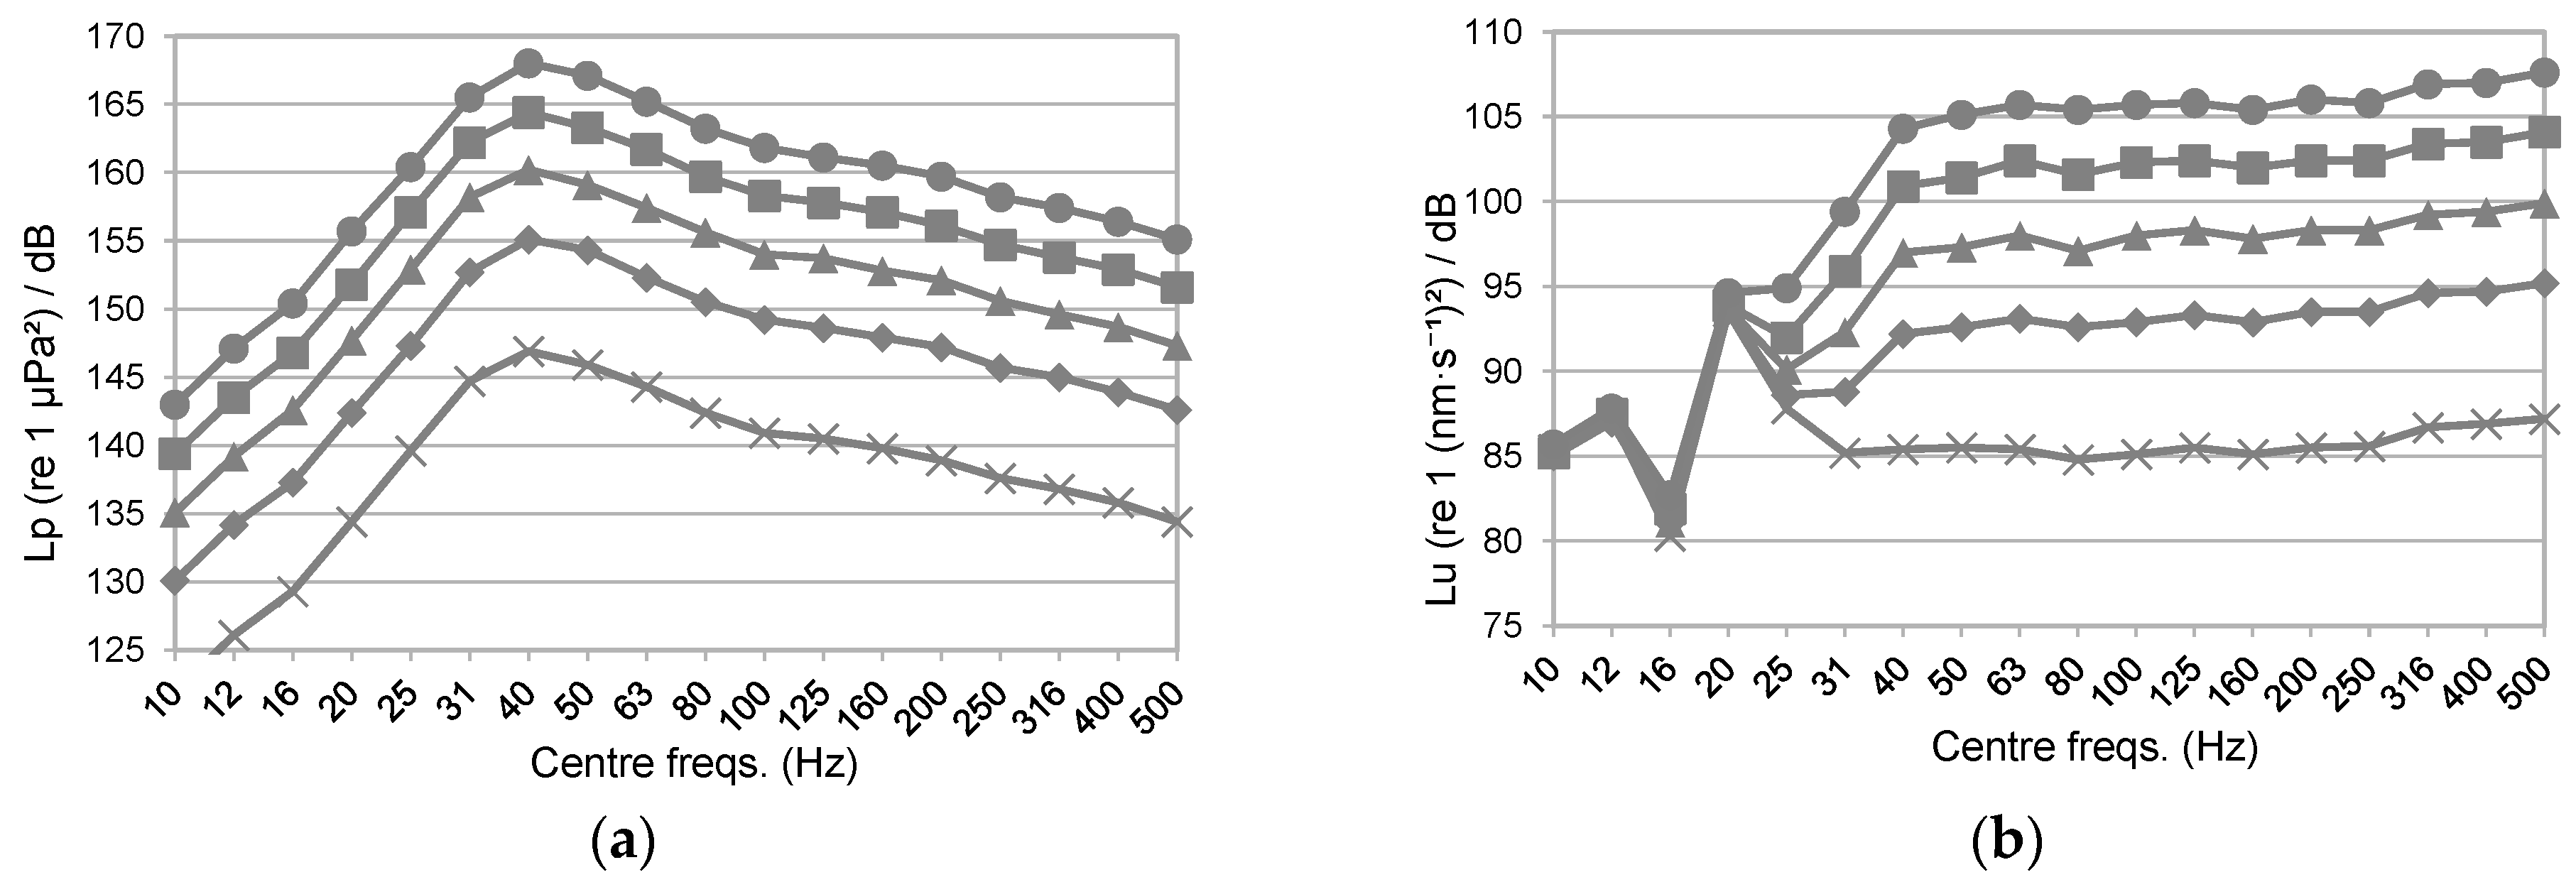
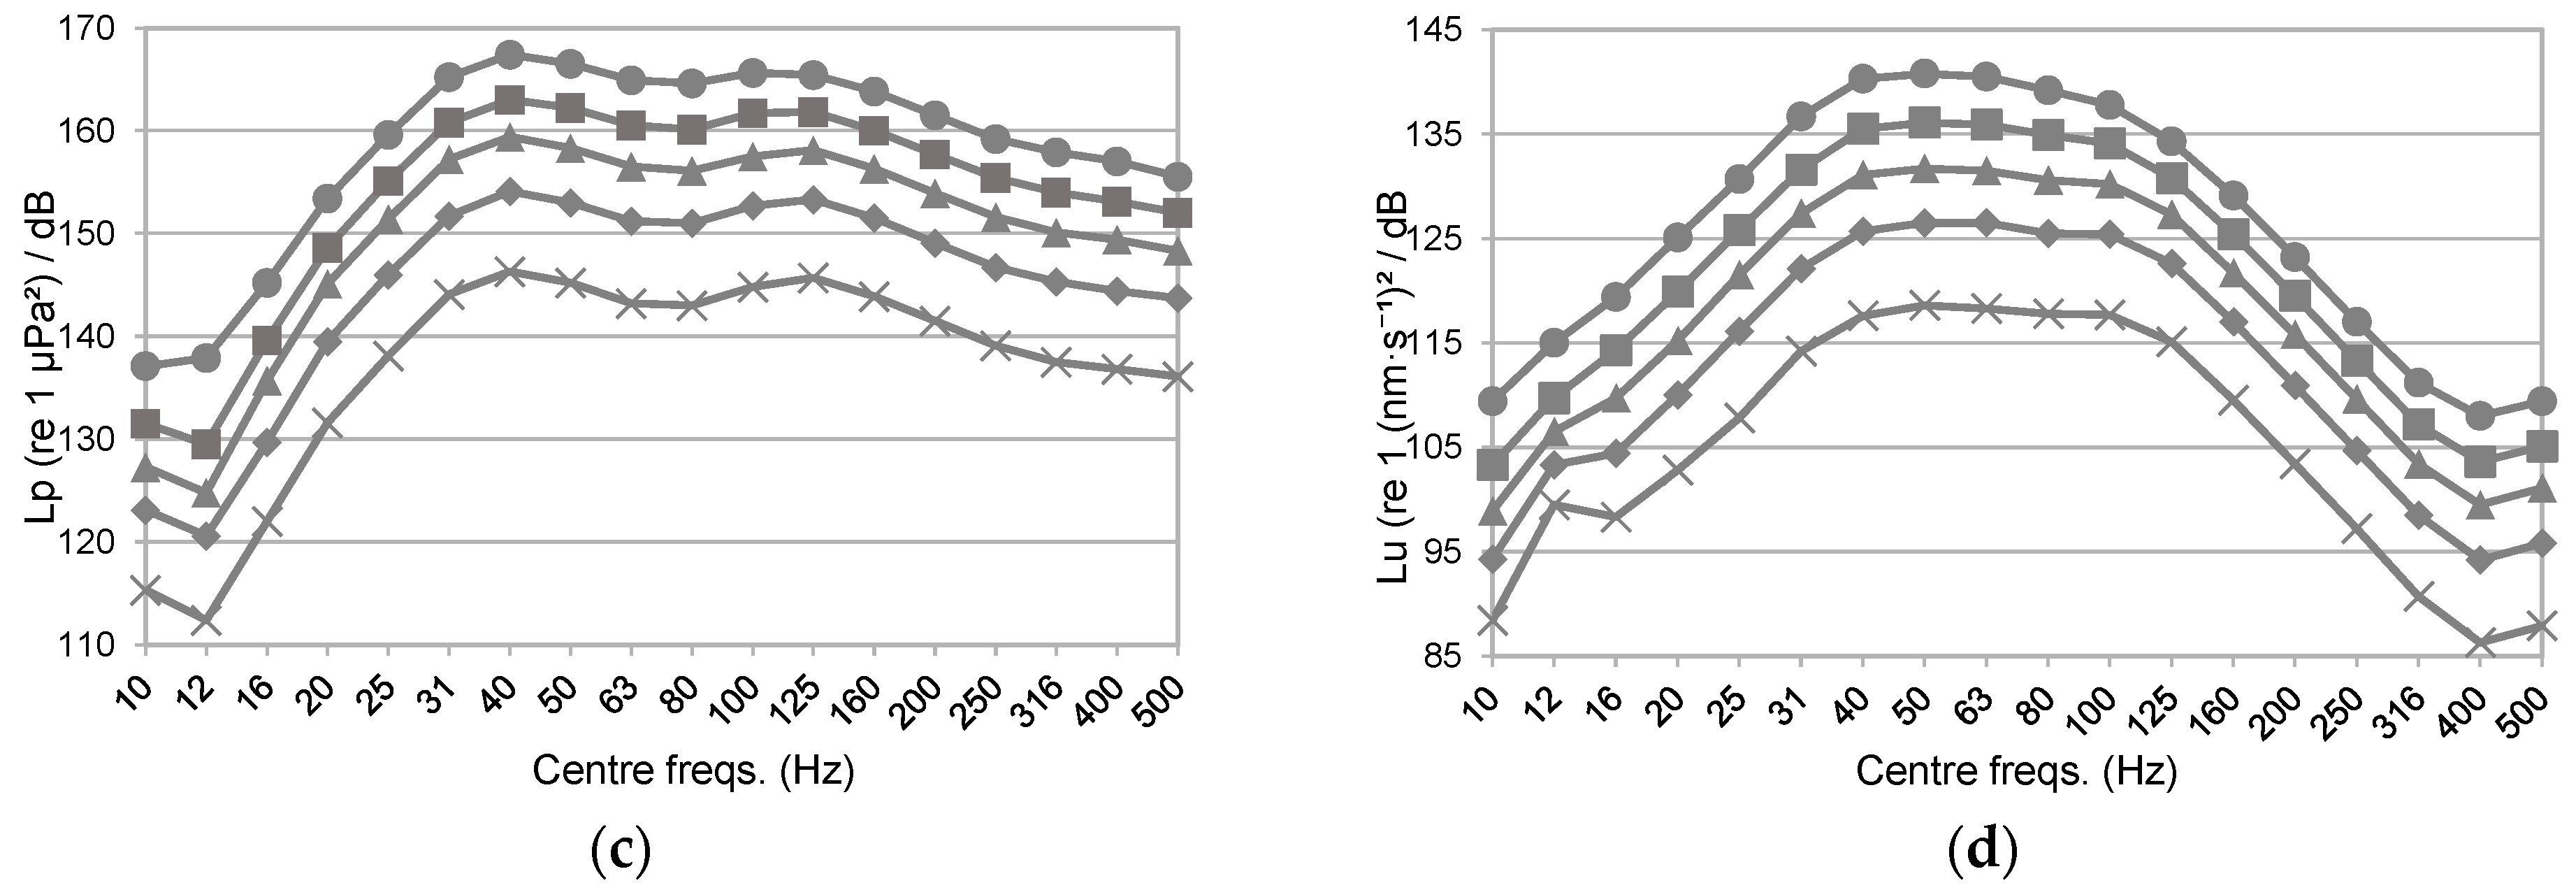
The gain relation between the two sound-field components, expressed in logarithmic scale, was assessed for both exposure configurations. A band-filtered (10–500 Hz) HYD-based corrected container ship’s underwater radiated noise (URN) [32] was used as the input signal at five different input levels. This employed the signals acquired by the pair of hydrophones during the input signal correction routine. For further details, refer to the Supplementary Materials, Section S3.
The AquaVib shows consistency in terms of gain between the acoustic pressure and particle motion components in both exposure configurations. Essentially, a variation of X-dB in the measured SPL is mirrored in the measured PVL. However, in the AP configuration, the particle motion component revealed a nonlinear response of the setup below the 32 Hz decidecade (Figure 6b) derived from the electrical noise introduced by the accelerometers, no longer perceptible at higher broadband PVL as those shown in the PM configuration. While this limitation could not be addressed within the scope of the Saturn project due to time constraints, it is intended to be explored in future work.

3.4. Addressing a Separate Evaluation of Acoustic Pressure- and Particle Motion-Elicited Responses on Aquatic Organisms

Given the current lack of a standardized methodology for establishing the dominance of either of the two sound field components over the other, we considered evaluating their relation in terms of energy. The selection of the two exposure configurations, i.e., AP and PM, and the adjustment of the input power allow us to create a sound field at either equal SPL or equal PVL within the water column, delivering different kinetic-to-potential energy ratios.
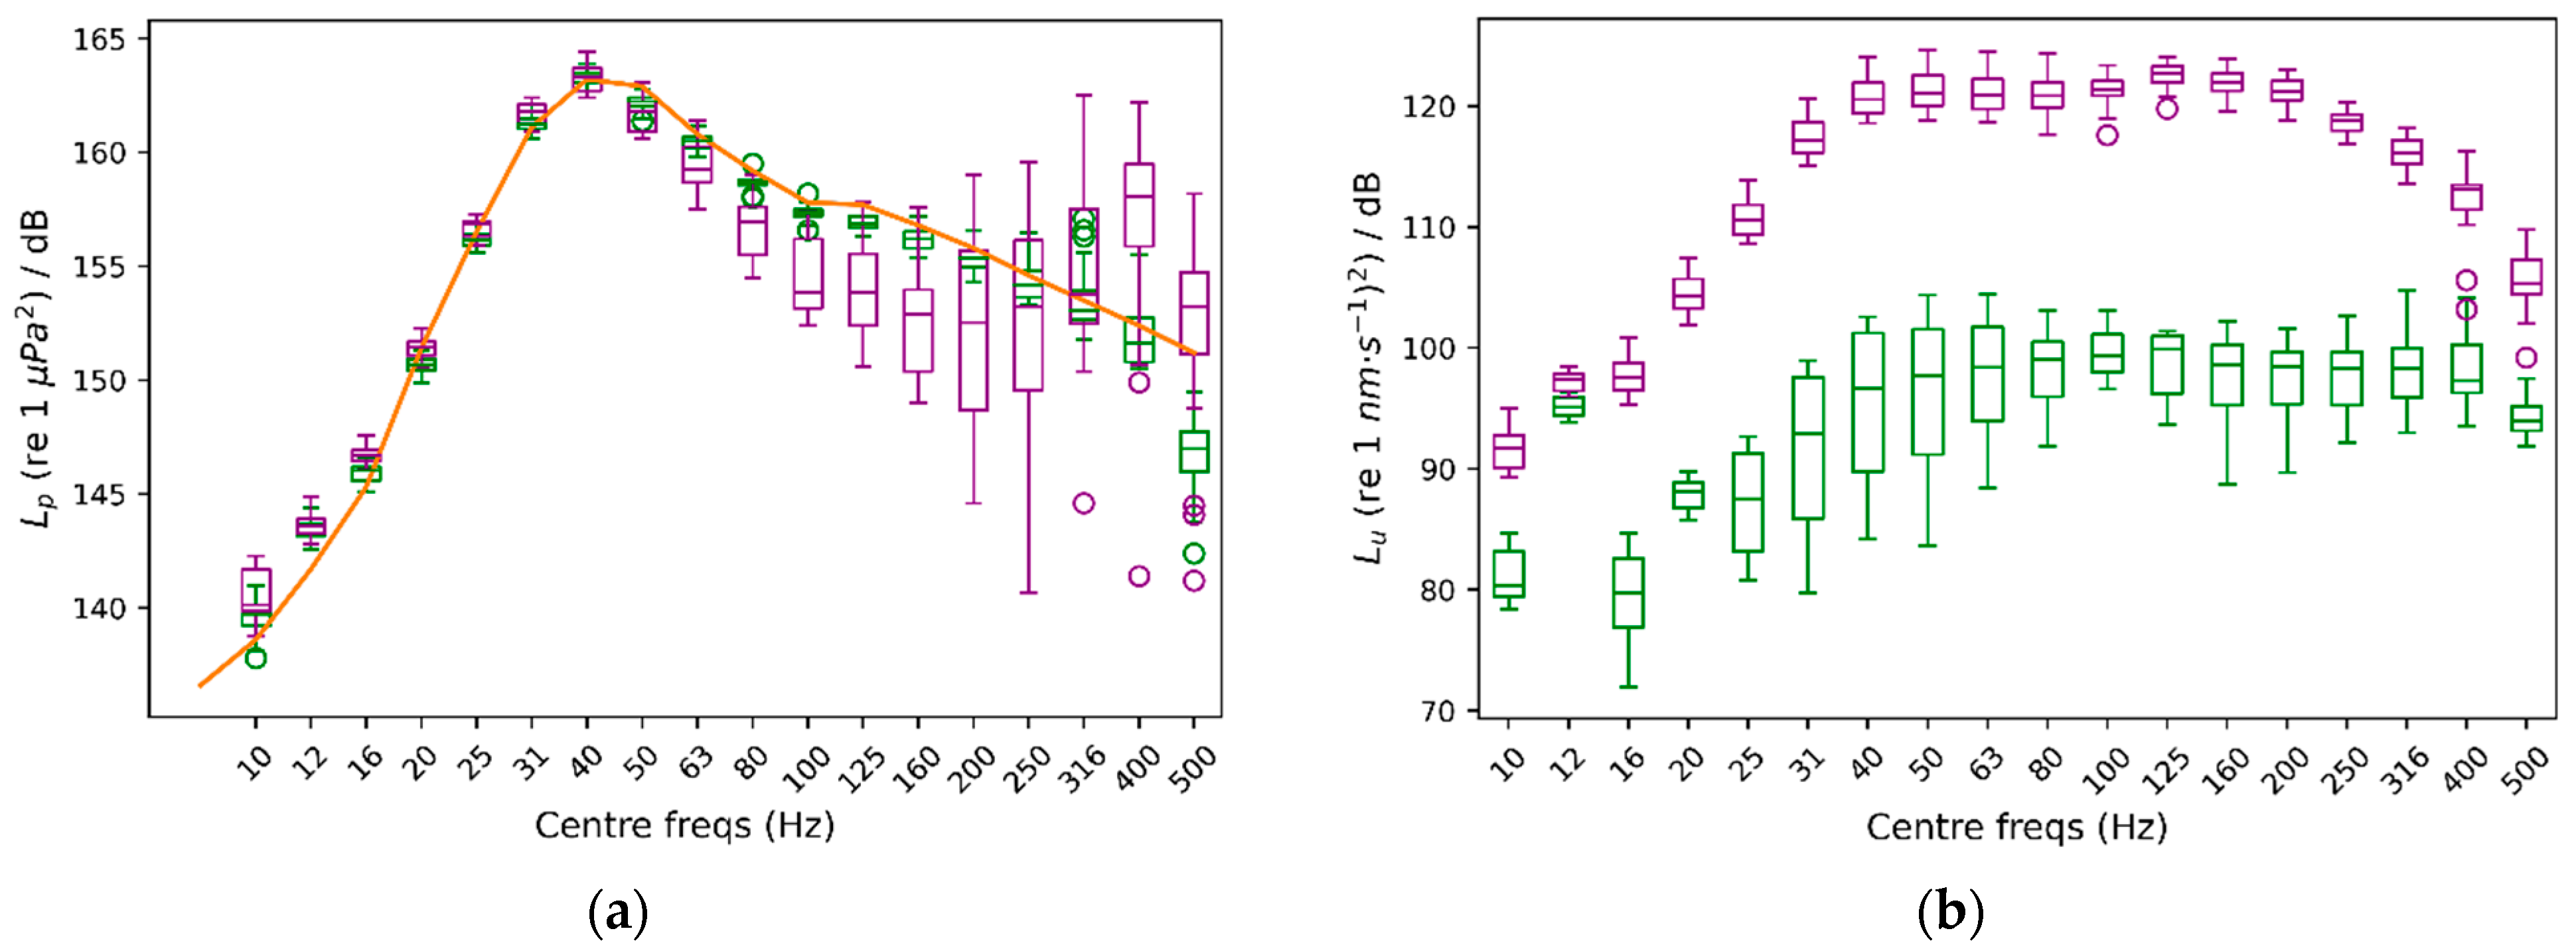
To illustrate this approach, Figure 7 presents a boxplot analysis of a dataset comprising 12 independent 20 min exposure tests, collected from 18 April to 13 May 2023, as a task within the SATURN project, using a HYD-based corrected artificially synthesized container ship URN as input signal [32]. The signals acquired from each pair of sensors were aggregated into a common data set for this analysis.
The exposures were at a mean broadband SPL—averaged over the two hydrophones—of 170.0 dB (SD = 0.3 dB) and 169.9 dB (SD = 0.9 dB), in the AP (green) and PM (purple) configurations, respectively.
The target signal (orange line, Figure 7a) is a broadband continuous sound with a peak frequency of 40 Hz and a −6 dB bandwidth spanning from the 25 to 125 Hz decidecade bands. The AquaVib response in that frequency range showed a mean difference to the target of −0.8 dB and −3.8 dB, and a standard deviation between the samples of that dataset of 0.3 dB and 1.9 dB in the AP and the PM configurations, respectively, at the 125 Hz decidecade band.
Under the PM configuration (purple boxes, Figure 7a), the higher the frequency, the more scattered the sound pressure field becomes, resulting in a larger difference between the measured SPL at the two hydrophone locations and, therefore, a larger variability within sound exposure replicates. Additionally, the current setup requires manual adjustment of the power amplifier input gain, introducing greater variability between replicates. Nonetheless, the current AquaVib setup allowed us to expose these animals virtually at the same broadband SPL, with a mean difference of 23.8 dB in the broadband PVL spectrum between both exposure configurations (Figure 7b), while keeping the SPL spectrum of the target signal.
Any indication of effect under either of the two exposure configurations can be further investigated at two different broadband SPL (Figure 8b), while maintaining a constant PVL spectrum between the two exposure groups (Figure 8a). In the absence of real exposure data at this stage to illustrate this scenario, we conducted a 2 min test in both exposure configurations without animals in the acoustic chamber using an ACC-based corrected artificially synthesized container ship URN as the input signal at a mean broadband PVL of 128.7 dB (SD = ±1.1, Figure 8). The input signal correction was based on accelerometer data; see Supplementary Materials, Section S3 for details.
A broadband difference of 12.4 dB in SPL was measured between the two exposure configurations, with at least a 7-dB difference per decidecade in the whole frequency range (Figure 8b).
The broadband kinetic-to-potential energy ratio for the AP group under the equal SPL scenario was 4 dB. In contrast, those exposed in the PM configuration under the equal SPL scenario, or at either the AP or the PM exposure configurations under the equal PVL scenario, received a much larger dose of kinetic-to-potential energy (25.4 dB, 17.8 dB, and 29.9 dB, respectively).
We are currently unable to create a potential energy-dominated sound field. The two water inlets in the acoustic chamber, the inline water pump, and all the flexible tubing used to recirculate the water introduce decompression spots into the water column, thus reducing the potential-to-kinetic ratio in the AP configuration, and potentially skewing the spatial distribution in the pressure spectrum under the PM configuration. Stiffer tubbing can mitigate this effect.
Nevertheless, at its current stage, the AquaVib system allows us to expose aquatic organisms to a broad range of kinetic-to-potential energy ratios, offering a deeper understanding of their sensitivity to these two sound components. These results can be subsequently translated to real-world scenarios, i.e., scenarios where E k i n E p o t [25,26,27], to infer the expected acoustic pressure dose–response curves on particle motion-sensitive species through standard pressure-based measurements, which are much simpler and widely applied.

3.5. Physiological Assessment Procedure

Highly accurate readings of both dissolved O2 (in µMol/L) and water temperature (in °C) are acquired every second. Looking ahead, an independent water circuit between the respirometry module and the acoustic chamber would be preferred to mitigate the influence of the incoming flow from the maintenance tank system during the flushing phase (see Supplementary Materials, Section S8).
Following the intermittent-flow respirometry methodology [31] (see Supplementary Materials, Section S6), we can evaluate the target organisms’ standard metabolic rates in the AquaVib based on a set of dissolved O2 depletion curves. This enables the identification of the factors involved in the dynamics of O2 uptake by the exposed organisms during the entire exposure period, i.e., initial handling stress, habituation to sound exposure, or circadian rhythms.

4. Conclusions

Aquatic organisms rely heavily on their ability to detect and interpret vibroacoustic cues. Sound from human activities within their ecosystems can severely disrupt this ability. Recent studies pointed to the particle motion component of the sound field as the main stressor for sea invertebrates, most species of fish, and even flora. Yet, there remains a notable knowledge gap compared to the acoustic pressure component.
Exciting an enclosed compact water volume employing a pair of self-facing electrodynamic shakers, the AquaVib allows us to recreate a controlled sound field at different kinetic-to-potential energy ratios while maintaining the most significant acoustic pressure spectral characteristics of the target signal. In addition, the use of a respirometry module, a transparent acoustic chamber, and a dedicated control over the ambient conditions extends the scope of this approach to simultaneously conduct physiological and behavioral analysis. Furthermore, these measures mitigate the risk of significant environmental changes adversely affecting the organisms during the whole test season.
Out-of-the-water particle motion measurements with standard accelerometers significantly reduce the associated expenses and complexity of in-water measurements while providing an accurate estimate of the kinetic energy dose received by the exposed organisms regardless of their position within the acoustic chamber.
Moreover, the AquaVib was designed to easily interchange the acoustic chamber with others of varying dimensions and materials. This enables experimenting with their mechanical properties to better align with the specific requirements of an exposure test.
Ongoing efforts are dedicated to expanding our understanding of the complexity inherent in the sound field generated by a pair of self-facing shakers within an incompressible volume of water, as well as the associated deviations to the target sound field. In particular, this includes the deviation of the particle motion component spectrum from the intended target acceleration and the spatial scattering of the acoustic pressure component observed in the PM configuration. Using more rigid water pipes can significantly mitigate the decompression effect identified in the acoustic pressure configuration. Additionally, implementing a real-time feedback loop from the sensors to control the power amplifier’s output per decidecade band would ensure consistent broadband exposure levels among replicates in identical sound field conditions.
The AquaVib system is presented here as a cost-efficient lab-based setup for controlled high-sound-level low-frequency exposures (<1 kHz) on small aquatic organisms at any of their life stages, where the associated effects of the acoustic pressure and the particle motion components can be separately assessed. Subsequently, the particle motion-elicited dose–response curves obtained under this setup can be applied to field-based studies to infer the associated acoustic pressure dose–response curves at which particle motion-sensitive organisms might show any sort of acute and/or long-term detrimental effects, without having to operate specific instrumentation to measure particle velocity.

Supplementary Materials

The following supporting information can be downloaded at: https://www.mdpi.com/article/10.3390/jmse13101885/s1, Figure S1: AquaVib system: the pair of electrodynamic shakers, sitting on each sliding platform, enclose the transparent acoustic chamber at both ends. The whole set is supported by a 5-mm-thick steel structure. A yellow electric hoist in the upper part of the support structure is used to maneuver the acoustic chamber. A 300-liter basin, located at the bottom of the structure, is used to fill up the acoustic chamber to avoid trapped air bubbles inside it and alleviate the stress on the specimens when introduced into the chamber; Figure S2: Sketch of the measurement locations (plan view). Jmse 13 01885 i001 Accelerometer at the current location for real exposures (i.e., rear face of the shaker’s moving head), used as a reference to be compared with the readings of the dummy accelerometer at six different measurement points Jmse 13 01885 i002: [Shell 1–3] 25, 100 and 125 mm away to the reference accelerometer respectively; at the [Rail] of the sliding platform where the shaker sits on; at the support [Structure] close to the reference shaker at the same excitation orientation; and at the [Ground] right below the reference shaker perpendicular to the excitation; Figure S3: Shell-, structural- and ground-transmitted PVL (Lu re. 1 (nm·s−1)2), measured at three locations in the shell of the acoustic chamber [Shell 1–3]; at the [Rail] of the sliding platform where the shaker sits on; at the support [Structure] close to the reference shaker at the same excitation orientation; and at the [Ground] right below the reference shaker perpendicular to the excitation. The [Ref Acc] corresponds to the measured PVL spectrum at the accelerometer mounted in the rear face of the reference shaker moving element (exposure tests’ current location); Figure S4: Top. Measured SPL (Lp, dB re 1 µPa2) (left) and PVL (Lu, dB re 1 (nm−1)2) (right) spectra from playing a hydrophone-based corrected (HYD, blue lines) and non-corrected (NO eQ WN, black lines) band-filtered white noise (10 Hz to 500 Hz) in the AP configuration. Bottom. Measured SPL (Lp, dB re 1 µPa2) (left) and PVL (Lu, dB re 1 (nm−1)2) (right) spectrums from playing an accelerometer-based corrected (ACC, orange lines) and non-corrected (NO eQ WN, black lines) band-filtered white noise (10 Hz to 500 Hz) in the PM configuration. The spectra of the measured signals and the target (x-crossed continuous line) were scaled to ease comparison.; Figure S5: Accelerometers’ response curves A1 (continuous) and A2 (epoxy-encapsulated, dashed). (▲) and (■) refers to the calibration exciter measurement at 159.15 Hz with A1 and A2, respectively; Figure S6: Temperature (in °C; red line) and dissolved O2 content (in µMol/L; blue line) measured during a 20-min-long real exposure test carried out on a batch of 20 adult M. edulis, on 3 October 2022, using a container ship URN at 170 dB SPL (Lp, re. 1 µPa2) as input signal during the whole test; Figure S7: AquaVib GUI main page. Four different tests can be configured. The input signal correction routine (EQUALIZATION), the water flushing cycle (SWITCH RELAY), and the stored data clearing (CLEAR DATA) are also handled from it; Figure S8: Example of Ship Noise Experiment page. A wav file is loaded, and automatically corrected either HYD- or ACC-based, for the current system response at any of the two exposure configurations (i.e., AP, PM). Main input sound file parameters are listed (SELECTED FEATURES). The duration of the test can be manually set (TIMER). Valid data is transferred to LAB’s servers at the end of the test; Figure S9: Sketch of the current water piping circuit. A pair of electro valves are used to open/close the water recirculation between the maintenance tanks system and the AquaVib. The TOFTC2 respirometry cell and the little inline pump are connected in parallel between them; Figure S10: Sketch of the alternative water piping circuit. The TOFTC2 respirometry cell and the little inline pump are connected to AquaVib’s acoustic chamber through an independent inlet-outlet pair. This way, the TOFTC2 readings reflect more accurately the dissolved O2 content in the acoustic chamber, being much less affected by the incoming completely oxygenated water from the maintenance tanks; Figure S11: Detailed view of the respirometry module: the TOFTC2 cell with the two black optic cables (red circle), and the TSUB21 reference temperature sensor (blue circle) plugged into the FireSting®-O2 Optical Oxygen Meter. A low-power inline water pump (green circle) is used to continuously recirculate the water between the TOFCT2 cell and the acoustic chamber, preventing the stratification inside the respirometer sensor and ensuring a correct mixing of the dissolved oxygen content in the enclosed water volume; Figure S12: LAB-owned maintenance tank system. A pair of 2000-liter fiberglass-reinforced plastic tanks are interconnected with the AquaVib through a pair of 50-mm pipes that go into the ground. A pair of inline water pumps recirculate clean naturally oxygenated water between the maintenance tanks and the AquaVib. A physicochemical self-filtration system with activated carbon and sand (Granada 500, Kripsol, Spain), is used to keep water’s quality. A pair of temperature-control systems (TK 5K, Teco s.r.l, Italy), allows for setting a constant water temperature within the 5 to 35 °C range. Table S1: Computed broadband SPL (Lp, dB re 1 µPa2) and PVL (Lu, dB re 1 (nm s−1)2) at five different input levels of a band-filtered (10–500 Hz) HYD-based corrected container ship URN played in both AP and PM configurations. The relative difference between consecutive levels is included. (*) Computed PVL rejecting the decidecade bands below 31 Hz. References [32,33] are cited in the Supplementary Materials.

Author Contributions

Conceptualization, P.P., M.v.d.S., M.S., and M.A.; data curation, P.P. and M.v.d.S.; formal analysis, P.P., C.A.F.d.J., and M.v.d.S.; funding acquisition, M.A.; investigation, P.P. and M.S.; methodology, P.P., M.v.d.S., and M.S.; project administrator, M.S. and M.A.; resources, M.v.d.S. and M.S.; software, P.P. and M.v.d.S.; supervision, C.A.F.d.J.; visualization, P.P.; writing—original draft, P.P.; writing—reviewing and editing, C.A.F.d.J., M.v.d.S., M.S., and M.A. All authors have read and agreed to the published version of the manuscript.

Funding

This study was funded as part of the EU Horizon 2020 research project SATURN: Solutions at Underwater Radiated Noise (see https://www.saturnh2020.eu/ accessed on 24 September 2025), under grant agreement No. 101006443.

Data Availability Statement

The original contributions presented in this study are included in the article/Supplementary Materials. Further inquiries can be directed to the corresponding author.

Acknowledgments

We would like to especially express our gratitude for the following people’s kind and dedicated support: Xavier Corbella, from Alava Ingenieros S. A., who assisted during the preliminary test sessions with a self-owned professional vibration setup; Albert Garcia Benadi, from the UPC, who assisted in understanding and correcting the accelerometers’ response curves; Alexandre Gràcia Calvo, from the UPC, who assisted in the design of the real-time monitoring GUI; Omar Alonso Melón, who assisted in the design and construction of the AquaVib’s facilities and support structure; Eduardo Vega Martín, who assisted in the design of the water recirculation system; and Roberto Yubero, from JASCO Applied Sciences, for his extensive review and insightful comments on the final revision of this manuscript.

Conflicts of Interest

The authors declare no competing interests. The authors declare that they have no known competing financial interests or personal relationships that could have appeared to influence the work reported in this paper.

Abbreviations

Abbreviations used in this manuscript:
ACCAccelerometer
EPDMEthylene Propylene Diene Monomer
GUIGraphical User Interface
HYDHydrophone
IEPEIntegrated Electronics Piezo-Electric
PTFE-FEPPolytetrafluoroethylene-Fluorinated Ethylene Propylene
PVLParticle Velocity Level
SPLSound Pressure Level
URNUnderwater Radiated Noise

References

  1. Day, R.D.; McCauley, R.D.; Fitzgibbon, Q.P.; Hartmann, K.; Semmens, J.M. Seismic air guns damage rock lobster mechanosensory organs and impair righting reflex. Proc. R. Soc. B 2019, 286, 20191424. [Google Scholar] [CrossRef]
  2. Solé, M.; Kaifu, K.; Mooney, T.A.; Nedelec, S.L.; Olivier, F.; Radford, A.N.; Vazzana, M.; Wale, M.A.; Semmens, J.M.; Simpson, S.D.; et al. Marine Invertebrates and Noise. Front. Mar. Sci. 2023, 10, 185. [Google Scholar] [CrossRef]
  3. Hu, M.Y.; Yan, H.Y.; Chung, W.S.; Shiao, J.C.; Hwang, P.P. Acoustically evoked potentials in two cephalopods inferred using the auditory brainstem response (ABR) approach. Comp. Biochem. Physiol. A Mol. Integr. Physiol. 2009, 153, 278–283. [Google Scholar] [CrossRef]
  4. Slabbekoorn, H.; Bouton, N.; van Opzeeland, I.; Coers, A.; ten Cate, C.; Popper, A.N. A noisy spring: The impact of globally rising underwater sound levels on fish. Trends Ecol. Evol. 2010, 25, 419–427. [Google Scholar] [CrossRef] [PubMed]
  5. Nedelec, S.L.; Campbell, J.; Radford, A.N.; Simpson, S.D.; Merchant, N.D. Particle motion: The missing link in underwater acoustic ecology. Methods Ecol. Evol. 2016, 7, 836–842. [Google Scholar] [CrossRef]
  6. Popper, A.N.; Hawkins, A.D. The importance of particle motion to fishes and invertebrates. J. Acoust. Soc. Am. 2018, 143, 470–488. [Google Scholar] [CrossRef] [PubMed]
  7. Solé, M.; Lenoir, M.; Durfort, M.; Fortuño, J.M.; van der Schaar, M.; De Vreese, S.; André, M. Seagrass Posidonia is impaired by human-generated noise. Commun. Biol. 2021, 4, 743. [Google Scholar] [CrossRef]
  8. McCauley, R.D.; Meekan, M.G.; Parsons, M.J.G. Acoustic Pressure, Particle Motion, and Induced Ground Motion Signals from a Commercial Seismic Survey Array and Potential Implications for Environmental Monitoring. J. Mar. Sci. Eng. 2021, 9, 571. [Google Scholar] [CrossRef]
  9. Jézéquel, Y.; Cones, S.; Jensen, F.H.; Brewer, H.; Collins, J.; Mooney, T.A. Pile driving repeatedly impacts the giant scallop (Placopecten magellanicus). Sci. Rep. 2022, 12, 15380. [Google Scholar] [CrossRef]
  10. Kaifu, K.; Akamatsu, T.; Segawa, S. Underwater sound detection by cephalopod statocyst. Fish. Sci. 2008, 74, 781–786. [Google Scholar] [CrossRef]
  11. Bolle, L.J.; De Jong, C.A.; Bierman, S.M.; Van Beek, P.J.; Van Keeken, O.A.; Wessels, P.W.; Van Damme, C.J.; Winter, H.V.; De Haan, D.; Dekeling, R.P. Common sole larvae survive high levels of pile-driving sound in controlled exposure experiments. PLoS ONE 2012, 7, e33052. [Google Scholar] [CrossRef]
  12. André, M.; Kaifu, K.; Solé, M.; van der Schaar, M.; Akamatsu, T.; Balastegui, A.; Sánchez, A.M.; Castell, J.V. Contribution to the understanding of particle motion perception in marine invertebrates. In The Effects of Noise on Aquatic Life II; Springer: Berlin/Heidelberg, Germany, 2016; pp. 47–55. [Google Scholar]
  13. Roberts, L.; Harding, H.R.; Voellmy, I.; Bruintjes, R.; Simpson, S.D.; Radford, A.N.; Breithaupt, T.; Elliott, M. Exposure of benthic invertebrates to sediment vibration: From laboratory experiments to outdoor simulated pile-driving. Proc. Meet. Acoust. 2016, 27, 010029. [Google Scholar] [CrossRef]
  14. Wale, M.A.; Briers, R.A.; Hartl, M.G.; Bryson, D.; Diele, K. From DNA to ecological performance: Effects of anthropogenic noise on a reef-building mussel. Sci. Total Environ. 2019, 689, 126–132. [Google Scholar] [CrossRef] [PubMed]
  15. Campbell, J.; Shafiei Sabet, S.; Slabbekoorn, H. Particle motion and sound pressure in fish tanks: A behavioural exploration of acoustic sensitivity in the zebrafish. Behav. Processes 2019, 164, 38–47. [Google Scholar] [CrossRef]
  16. Guan, S.; Popper, A.N.; Haxel, J.; Martin, J.; Miller, J.H.; Nedelec, S.; Potty, G.; Roberts, L.; Sisneros, J.A.; Dangerfield, A. Research Methodologies to Study Behavioral and Physiological Effects on Fishes and Aquatic Invertebrates from Particle Motion and Substrate-Borne Vibration Exposure: Study and Workshop; U.S. Department of the Interior, Bureau of Ocean Energy Management: Washington, DC, USA, 2024; p. 102. Available online: https://www.researchgate.net/publication/383525697_Research_Methodologies_to_Study_Behavioral_and_Physiological_Effects_on_Fishes_and_Aquatic_Invertebrates_from_Particle_Motion_and_Substrate-Borne_Vibration_Exposure_Study_and_Workshop (accessed on 24 September 2025).
  17. Akamatsu, T.; Okumura, T.; Novarini, N.; Yan, H.Y. Empirical refinements applicable to the recording of fish sounds in small tanks. J. Acoust. Soc. Am. 2002, 112, 3073–3082. [Google Scholar] [CrossRef]
  18. Nedelec, S.L.; Ainslie, M.A.; Andersson, M.; Cheong, S.; Halvorsen, M.; Linné, M.; Martin, B.; Nöjd, A.; Robinson, S.; Simpson, S.; et al. Best Practice Guide for Underwater Particle Motion Measurement for Biological Applications 2021. Available online: https://repository.oceanbestpractices.org/handle/11329/1884?show=full (accessed on 24 September 2025).
  19. Jézéquel, Y.; Bonnel, J.; Aoki, N.; Mooney, T.A. Tank acoustics substantially distort broadband sounds produced by marine crustaceans. J. Acoust. Soc. Am. 2022, 152, 3747–3755. [Google Scholar] [CrossRef]
  20. Duarte, C.M.; Chapuis, L.; Collin, S.P.; Costa, D.P.; Devassy, R.P.; Eguiluz, V.M.; Erbe, C.; Gordon, T.A.C.; Halpern, B.S.; Harding, H.R.; et al. The soundscape of the Anthropocene ocean. Science 2021, 371, eaba4658. [Google Scholar] [CrossRef]
  21. Halvorsen, M.B.; Carlson, T.J.; Popper, A.N. Hydroacoustic Impacts on Fish from Pile Installation; Transportation Research Board: Washington, DC, USA, 2011; Volume 363. [Google Scholar]
  22. Halvorsen, M.B.; Casper, B.M.; Woodley, C.M.; Carlson, T.J.; Popper, A.N. Threshold for Onset of Injury in Chinook Salmon from Exposure to Impulsive Pile Driving Sounds. PLoS ONE 2012, 7, e38968. [Google Scholar] [CrossRef]
  23. Sand, O.; Karlsen, H.E. Detection of infrasound by the Atlantic cod. J. Exp. Biol. 1986, 125, 197–204. [Google Scholar] [CrossRef]
  24. ISO 18405:2017; Underwater Acoustics—Terminology. International Organization for Standardization: Geneva, Switzerland, 2017. Available online: https://www.iso.org/standard/62406.html (accessed on 24 September 2025).
  25. Flamant, J.; Bonnel, J. Broadband properties of potential and kinetic energies in an oceanic waveguide. J. Acoust. Soc. Am. 2023, 153, 3012. [Google Scholar] [CrossRef]
  26. Dahl, P.H.; MacGillivray, A.; Racca, R. Vector acoustic properties of underwater noise from impact pile driving measured within the water column. Front. Mar. Sci. 2023, 10, 1146095. [Google Scholar] [CrossRef]
  27. Dahl, P.H.; Dall’Osto, D.R. Potential and kinetic energy of underwater noise measured below a passing ship and response to sub-bottom layering. J. Acoust. Soc. Am. 2022, 152, 3648–3658. [Google Scholar] [CrossRef]
  28. Oppeneer, V.O.; de Jong, C.A.; Binnerts, B.; Wood, M.A.; Ainslie, M.A. Modelling sound particle motion in shallow water. J. Acoust. Soc. Am. 2023, 154, 4004–4015. [Google Scholar] [CrossRef]
  29. André, M.; Van Der Schaar, M.; Zaugg, S.; Houégnigan, L.; Sánchez, A.; Castell, J. Listening to the deep: Live monitoring of ocean noise and cetacean acoustic signals. Mar. Pollut. Bull. 2011, 63, 18–26. [Google Scholar] [CrossRef]
  30. Rodgers, G.; Tenzing, P.; Clark, T. Experimental methods in aquatic respirometry: The importance of mixing devices and accounting for background respiration. J. Fish. Biol. 2016, 88, 65–80. [Google Scholar] [CrossRef] [PubMed]
  31. Killen, S.S.; Christensen, E.A.F.; Cortese, D.; Závorka, L.; Norin, T.; Cotgrove, L.; Crespel, A.; Munson, A.; Nati, J.J.H.; Papatheodoulou, M.; et al. Guidelines for reporting methods to estimate metabolic rates by aquatic intermittent-flow respirometry. J. Exp. Biol. 2021, 224, jeb242522. [Google Scholar] [CrossRef] [PubMed]
  32. De Jong, C.A.F. Harmonized Shipping Sound Test Signals to Assess Effects on Aquatic Animals. In The Effects of Noise on Aquatic Life; Springer: Cham, Switzerland, 2023; Available online: https://link.springer.com/referenceworkentry/10.1007/978-3-031-10417-6_38-1#citeas (accessed on 24 September 2025).
  33. Solé, M.; Lenoir, M.; Durfort, M.; López-Bejar, M.; Lombarte, A.; Van Der Schaar, M.; André, M. Does exposure to noise from human activities compromise sensory information from cephalopod statocysts? Deep Sea Res. Part II Top Stud. Oceanogr. 2013, 95, 160–181. [Google Scholar] [CrossRef]
Figure 1. Detailed view of the AquaVib system. The pair of 1 kN electrodynamic shakers sits on sliding platforms to tightly adjust their moving heads against the Ethylene Propylene Diene Monomer (EPDM) membranes, which hold the water inside the transparent exposure chamber. An Integrated Electronics Piezo-Electric (IEPE) accelerometer is mounted at the rear face of each shaker’s moving head. The pair of hydrophones is completely submerged in the water volume. A respirometry cell and the reference temperature sensor are interconnected between the water inlet and outlet.
Jmse 13 01885 g001
Figure 2. Sketch of the current water piping circuit. A pair of electro valves is used to open/close the water recirculation between the maintenance tanks system and the AquaVib. The TOFTC2 respirometry cell and the little inline pump are connected in parallel.
Jmse 13 01885 g002
Figure 3. Screen snapshot of the dedicated real-time monitoring GUI. Recorded (a) hydrophones, and (b) accelerometers signals; electric signals from (c) the pair of accelerometers, and (d) the power amp stereo output (recorded with a pair of 2-channel digital oscilloscopes); (e) temperature (in °C; yellow line) and dissolved O2 content (in µMol/L; blue line) recorded with the built-in respirometry module. Each panel displays time on the x-axis (units: seconds in (a,b,e); milliseconds in (c,d)).
Jmse 13 01885 g003
Figure 4. Boxplot of the statistics of measured background noise in the acoustic chamber based on 33 independent replicates of 20 min tests in which no sound was played back (green bars), against 4 independent silent tests, i.e., without running the water pump system (purple bars). Computed (a) SPL, and (b) PVL in decidecade bands. The bottom and top of each box are the 25th and 75th percentiles, respectively. The line in the middle of each box is the median. The whiskers are lines extending to the furthest observations, to a maximum of 1.5 times the interquartile range away from the bottom or top of the box. Observations beyond the whisker length are marked as outliers (circle).
Jmse 13 01885 g004
Figure 5. Boxplot of the relative difference measured between the reference (Lu, out) and the epoxy-encapsulated (Lu, in) accelerometers (n = 7) at both (a) AP and (b) PM exposure configurations. A uniform band-filtered (10–500 Hz) white noise was played for 60 s at an average SPL between the pair of hydrophones of 172 dB SPL (Lp re. 1 µPa2). Interpretation of the boxes is shown in Figure 4.
Jmse 13 01885 g005
Figure 6. Measured SPL (Lp, dB re 1 µPa2) (a,c) and PVL (Lu, dB re 1 (nm s−1)2) (b,d) spectrums at five different input levels (represented by different markers) of a band-filtered (10–500 Hz) HYD-based corrected container ship URN played in both AP (a,b) and PM (c,d) configurations.
Jmse 13 01885 g006aJmse 13 01885 g006b
Figure 7. Boxplot analysis in decidecade bands: (a), received SPL (Lp, dB re 1 µPa2); (b), received PVL (Lu, dB re 1 (nm s−1)2) of 12 independent 20 min exposure tests (6 under the AP configuration, green boxes; 6 under the PM configuration, purple boxes). An artificially synthesized container ship URN (orange line, scaled to its peak at 40 Hz for comparison to the received acoustic pressure spectra) was HYD-corrected. Interpretation of the boxes is shown in Figure 4.
Jmse 13 01885 g007
Figure 8. Received PVL (Lu, dB re 1 (nm s−1)2) (a) and SPL (Lp, dB re 1 µPa2) (b) in decidecade bands at the left (continuous) and right (dashed) accelerometers, and the end (continuous) and center (dashed) hydrophones, respectively, in the two exposure configurations (AP, solid; PM, hollow), using an ACC-based corrected artificially synthesized container ship URN as the input signal. In orange, the target signal was scaled at its peak (40 Hz) to facilitate comparison to the received pressure spectra in both configurations.
Jmse 13 01885 g008
Disclaimer/Publisher’s Note: The statements, opinions and data contained in all publications are solely those of the individual author(s) and contributor(s) and not of MDPI and/or the editor(s). MDPI and/or the editor(s) disclaim responsibility for any injury to people or property resulting from any ideas, methods, instructions or products referred to in the content.