Article

Integrated Scheduling of Handling and Spraying Operations in Smart Coal Ports: A MAPPO-Driven Adaptive Micro-Evolutionary Algorithm Framework

School of Traffic and Transportation, Beijing Jiaotong University, Beijing 100044, China
*
Author to whom correspondence should be addressed.
J. Mar. Sci. Eng. 2025, 13(10), 1840; https://doi.org/10.3390/jmse13101840
Submission received: 1 September 2025 / Revised: 21 September 2025 / Accepted: 22 September 2025 / Published: 23 September 2025
(This article belongs to the Special Issue Sustainable and Efficient Maritime Operations)

Abstract

This study explores the integrated scheduling optimization of coal port operations, addressing the dual challenges of handling efficiency and resource conservation by coordinating equipment scheduling with stockyard spraying operations. Through a systematic analysis of operational processes in coal ports, a mixed-integer linear programming (MILP) model is developed to achieve global optimization while explicitly quantifying water and electricity consumption in spraying operations. To address this complex problem, we propose a novel hybrid algorithm that integrates a micro-evolutionary algorithm (MEA) framework with multi-agent proximal policy optimization (MAPPO), enabling adaptive decision-making for large-scale real-time scheduling. Three specialized agents for crossover, mutation, and neighborhood search achieve collaborative optimization by observing population features as states, selecting evolutionary operators as actions, and receiving composite rewards based on both population improvement and individual contributions. This strategy facilitates adaptive operator selection and optimal evolutionary direction derivation, collectively guiding population evolution toward high-quality solutions. Extensive experiments on ten scaled instances of a real-world coal port confirm the proposed algorithm’s superior performance. Compared with four other standard algorithms, it consistently yields higher hypervolume (HV) values and lower inverted generational distance (IGD) metrics, which collectively demonstrate stronger convergence capability and higher solution quality.

1. Introduction

In recent years, the global energy trade has been highly dynamic, with coal resources, a key pillar of the global energy system, experiencing unprecedented levels of demand [1]. As a critical node in the coal supply chain and a key hub in rail-water intermodal transportation, coal ports primarily handle the transfer of coal between trains and ships. Against the backdrop of rising coal demand and the gradual improvement of integrated transportation systems, port operational efficiency directly impacts the transportation efficiency and costs of coal within the multimodal framework. The workflow at coal ports connected to heavy-haul railway stations can be described as follows: trains arrive for unloading, coal is transferred through unloading, conveying, and storage equipment to the designated stockyard, and upon ship berthing, the reclaimer and ship loader transfer the coal onto vessels, which then depart once loading is completed. The formulation and execution of overall port operation plans involve collaboration among multiple departments. Traditionally, ports have relied heavily on manual expertise for equipment control and scheduling, where limited resources, complex constraints, and high operational demands make the process highly challenging.
With the deepening integration of automation and intelligent technologies, the construction of smart ports, combining intelligent scheduling and equipment management, has become a key direction for modern port transformation. Simultaneously, the development of sustainable port ecosystems has garnered significant attention from port operators, necessitating further advancements in environmental management at coal ports [2]. The stockyard, as the central area for coal transfer and storage, plays a vital role in ensuring efficient unloading and loading operations. However, dust emissions generated during coal handling operations in stockyards remain a major challenge for port environmental management. Precise spraying operations serve as an effective technical approach for suppressing dust, as they control the moisture content of coal to minimize dust generation. However, current spraying operations consume substantial amounts of water and electricity, creating conflict between environmental protection and resource conservation. Therefore, optimizing intelligent spraying systems in stockyards while effectively balancing resource consumption is critical for promoting green development in coal ports.
Existing research on bulk port operations has primarily focused on operational procedures or specific equipment [3]. Such isolated optimization of equipment scheduling or stockyard allocation leads to singular objectives and deficient systemic coordination. Additionally, current studies have not comprehensively addressed resource consumption in coal ports operations, especially in relation to resource metrics within scheduling models [4]. These limitations make existing optimization solutions inadequate for meeting the operational demands of smart ports in terms of efficiency and resource conservation. Modern port operations encounter the challenge of integrating green scheduling within an intelligent equipment management framework, requiring the balanced coordination of equipment scheduling and operational line allocation while simultaneously considering dust suppression and resource consumption in spraying operations. Therefore, the integrated scheduling model for coal ports handling and spraying operations proposed in this study is essential for achieving the dual objectives of operational efficiency and resource conservation, supporting the port’s green and intelligent transformation.
Specifically, the main contributions of this paper are as follows:
(1)
This study achieves a comprehensive analysis of coal ports’ operational processes, integrating train splitting, handling equipment scheduling, stockyard allocation, and dust suppression spraying operations. Focusing on the resource consumption characteristics of spraying operations, it quantifies water and electricity consumption by combining environmental factors with intrinsic coal properties like moisture content and coal type and incorporates these quantitative results into the optimization objectives. Specifically, the established mixed-integer linear programming model takes minimizing the total operating time of trains and ships and reducing resource consumption costs as dual goals, breaking through the limitations of traditional segmented optimization that separates equipment scheduling from spraying operations and realizing the overall optimization of efficiency and resource conservation.
(2)
A novel hybrid optimization algorithm is developed, which combines the global search capability of the micro-evolutionary algorithm (MEA) framework with the adaptive decision-making ability of multi-agent proximal policy optimization (MAPPO). The algorithm adopts a two-layer chromosome encoding structure to capture key decision variables such as unloading and loading line selection, ass well as operation sequence, ensuring comprehensive coverage of the solution space while reducing encoding complexity. The dominance recording matrix (DRM) dynamically extracts and records dominant gene structures from elite individuals, providing directional guidance for evolution operations. Three specialized agents for crossover, mutation, and neighborhood search perceive population states and environmental feedback, collaboratively adjust evolutionary operators in real time, and balance exploration and exploitation through adaptive strategy adjustment, enabling an efficient solution of large-scale multi-objective scheduling problems.
(3)
The effectiveness and applicability of the proposed algorithm are verified through in-depth case studies and multi-scale comparative experiments. In the case study of a major Chinese coal port, two typical solutions on the Pareto front, namely the efficiency-maximizing solution and the optimal compromise solution, are analyzed in detail, and the trade-off relationship between their operational time and resource consumption is quantified, which reflects the algorithm’s ability to balance dual objectives. Moreover, comparative experiments with four benchmark algorithms on ten different scale instances show that the proposed algorithm has obvious advantages in hypervolume (HV) and inverted generational distance (IGD), which confirms its strong convergence and high solution quality in different operation scales, and fully demonstrates its practical application value.
The remainder of this paper is organized as follows: Section 2 presents a review of the relevant literature. Section 3 describes the studied problem, followed by the mathematical model. Section 4 presents the hybrid algorithm framework and technical details. Section 5 conducts numerical experiments. Section 6 concludes the paper.

2. Literature Review

The optimization of port loading and unloading operations is a core issue in port operations management and has long been a subject of extensive academic inquiry, generating a substantial body of research in this field [5]. This paper reviews prior research from three perspectives: intelligent scheduling, green strategies, and reinforcement learning in port operations.

2.1. Intelligent Scheduling in Port Operations

In the field of port intelligent scheduling research, container terminals have been a focus of early studies due to their high operational standardization and clear equipment coordination demands. These studies have now established foundational methodologies for optimizing equipment scheduling and resource allocation. Golias et al. [6] introduced a robust berth scheduling method that minimizes total service time under uncertainty. Gambardella et al. [7] proposed a hierarchical optimization framework for intermodal terminals, combining resource allocation with discrete-event simulation to reduce crane conflicts. Chen et al. [8] formulated container terminal operations as a hybrid flow shop scheduling problem and proposed a tabu search algorithm, achieving improvements in the makespan for ship handling tasks. The integration of hybrid algorithms has become a key trend in addressing complex port scheduling challenges [9]. Zeng and Yang [10] integrated genetic algorithms with neural network surrogate models for container loading operations, reducing simulation runtime while maintaining solution accuracy.
As the automation level of container terminals continues to improve, automated guided vehicles (AGVs) serve as key equipment connecting various operational links. They have gradually emerged as a focal point in research on automated container terminals, and their scheduling and path planning directly impact port operational efficiency and cost control [11,12,13]. Chen et al. [14] proposed an artificial potential field and twin delayed deep deterministic policy gradient model for AGV path optimization, reducing path lengths while improving safety. Liang et al. [15] proposed a three-stage scheduling algorithm integrating genetic algorithms and simulation modeling to reduce the AGV locking situation. Recent research on sea-rail automated container terminals has demonstrated that integrated scheduling of port and railway operations is critical for improving logistics efficiency [16]. Chen et al. [17] demonstrated through MILP models that synchronous operations reduced crane task completion time. Munuzuri et al. [18] applied heuristic method to optimize integrated scheduling of vessel, crane and train operations.
Beyond container terminals, research on intelligent scheduling for dry bulk ports has also achieved several notable advances. De Andrade and Menezes [19] proposed a column generation-based heuristic that effectively solved the complex integrated planning problem of yard and berth allocation, showing superior performance over commercial solvers for large terminals. For iron ore port, Tang et al. [20] optimized storage allocation considering ore-mixing requirements. Ouhaman et al. [21] presented a practical heuristic method specifically designed for export bulk terminals, enabling efficient scenario testing and yard planning. Van Vianen et al. [22] proposed a simulation approach to optimize stacker-reclaimer scheduling, effectively reducing port time of trains while preserving ship service level. Xin et al. [23] formulated a predictive control strategy based on a mixed logical dynamical model to maximize profit in dry bulk terminal storage allocation. Bouzekri et al. [24] developed an integer programming model for the integrated laycan and berth allocation problem in bulk ports, incorporating practical constraints including conveyor routing, ship stability, and maintenance activities, and validated its computational efficiency through case studies from the port of Jorf Lasfar in Morocco. Babu et al. [25] employed two heuristic greedy construct algorithms to minimize ship delays through the simultaneous optimization of ship, stockyard, and train scheduling, validating the model’s efficacy using operational data from a port on India’s east coast.
To summarize, existing studies on container terminal intelligent scheduling have covered berth allocation, crane coordination, and AGV collaborative optimization, forming relatively mature technical frameworks especially in hybrid algorithm integration and multi-equipment conflict avoidance. These achievements are mostly tailored to the standardized operations of container terminals though, and their applicability to bulk terminals with more complex material flow and diverse storage requirements remains limited. Similarly, existing research on dry bulk ports has primarily focused on segmental optimization such as yard-berth coordination or stacker-reclaimer scheduling for general bulk cargo. Coal ports however have unique operational characteristics including heavy-haul train splitting, multi-type coal storage constraints and tight coupling between unloading-loading processes and stockyard operations. The complexity of multi-equipment, multi-process coordinated scheduling in coal terminals, especially the integration of handling operations with environmental protection processes, has not been sufficiently explored.

2.2. Green Strategies in Port Operations

Extant literature on green port operations demonstrates that achieving sustainable development requires addressing both conventional equipment coordination challenges and emerging environmental considerations [26]. Zheng et al. [27] proposed a genetic algorithm integrating quay crane and yard truck scheduling, achieving carbon emission reductions through three-dimensional chromosome representation and heuristic mutation operators. Peng et al. [28] quantified through simulation that strategic yard crane deployment could reduce emissions, though with diminishing returns beyond optimal equipment numbers. Niu et al. [29] introduced a Monte Carlo tree search algorithm for U-shaped terminals that achieved energy savings while resolving equipment conflicts. For specialized terminal layouts, Peng et al. [30] developed an improved multi-objective particle swarm optimization algorithm, yielding 11.72% energy efficiency improvements through conflict-free spatiotemporal path planning.
Several studies have specifically targeted energy consumption optimization in handling equipment. He et al. [31] proposed a hybrid algorithm for yard crane scheduling formulated as a vehicle routing problem with soft time windows, successfully balancing efficiency and energy consumption. Lu et al. [32] applied particle swarm optimization-genetic algorithm to reduce carbon emissions by 15.3% in container terminals.
In bulk cargo port operations, Jiang et al. [33] proposed a multi-objective genetic algorithm for the integrated scheduling of channels, berths, and yards, demonstrating emission reductions while maintaining throughput. Notably, Wang et al. [34] made significant progress by incorporating spraying operation optimization into stockyard allocation models, achieving 30% reductions in water consumption.
Existing green port research mainly focuses on container terminals, with optimization centered on equipment energy efficiency and layout-based emission reduction. These studies provide effective paths for container terminal carbon reduction, but their focus on resource conservation often stays at overall energy reduction. For bulk ports, while some studies explore emission reduction in core handling links, few have quantitatively modeled the resource consumption of key environmental protection processes or established dynamic correlations between such consumption and real-time operational conditions. This gap limits green scheduling precision for coal ports, where spraying is critical for dust suppression and incurs non-negligible water and electricity costs. Thus, intelligent spraying and its integration into overall port scheduling still need in-depth research.

2.3. Reinforcement Learning in Port Operations

Reinforcement learning (RL) has been extensively applied to the optimization of port operations scheduling, particularly in complex decision-making scenarios such as equipment dispatching, path planning, and energy consumption management. By interacting with dynamic environments, RL effectively handles scheduling uncertainties, improves efficiency, and promotes energy sustainability, emerging as a key method for intelligent port optimization [35]. Yue and Fan [36] combined Dijkstra’s algorithm with Q-learning for dynamic AGV path planning, reducing the transportation cost of AGVs under the constraint of laytime. Similarly, Zeng et al. [37] introduced a Q-learning and simulation integration method to minimize container terminal operation time.
The advancement of deep reinforcement learning (DRL) methods has enhanced the precision and efficiency of port scheduling operations [38]. Che et al. [39] proposed a MAPPO framework with graph neural networks, demonstrating superior performance in handling charging station constraints compared to traditional heuristics. Tang et al. [40] developed a Double Deep Q-Network (DDQN) framework for U-shaped automated terminals, optimizing twin cantilever rail crane operations to simultaneously improve efficiency and energy savings. Zhu et al. [41] introduced multi-attention DRL for unmanned vessel scheduling, achieving costs reductions while ensuring conflict-free paths. At the strategic level, Li et al. [42] demonstrated that Dueling Double DQN could enhance multi-terminal berth allocation, reducing total dwelling time by 3.7% compared to conventional algorithms. Bulk cargo terminals have also benefited from specialized DRL implementations. Li et al. [43] adapted DDQN with an improved ε-greedy strategy for conveyor path scheduling, achieving faster loading processes in coal terminals. Ai et al. [44] employed Softmax-based Dueling Double DQN, which reduced berth allocation costs in bulk ports while eliminating manual scheduling errors.

3. Problem Description and Model Formulation

Focusing on the intelligent scheduling of port equipment and the optimization of operational resources, this section analyzes the coal handling process and investigates the influencing factors of stockyard spraying operations, along with their interaction with scheduling tasks. An integrated scheduling model is developed to balance coal ports handling efficiency and resource consumption.

3.1. Problem Description

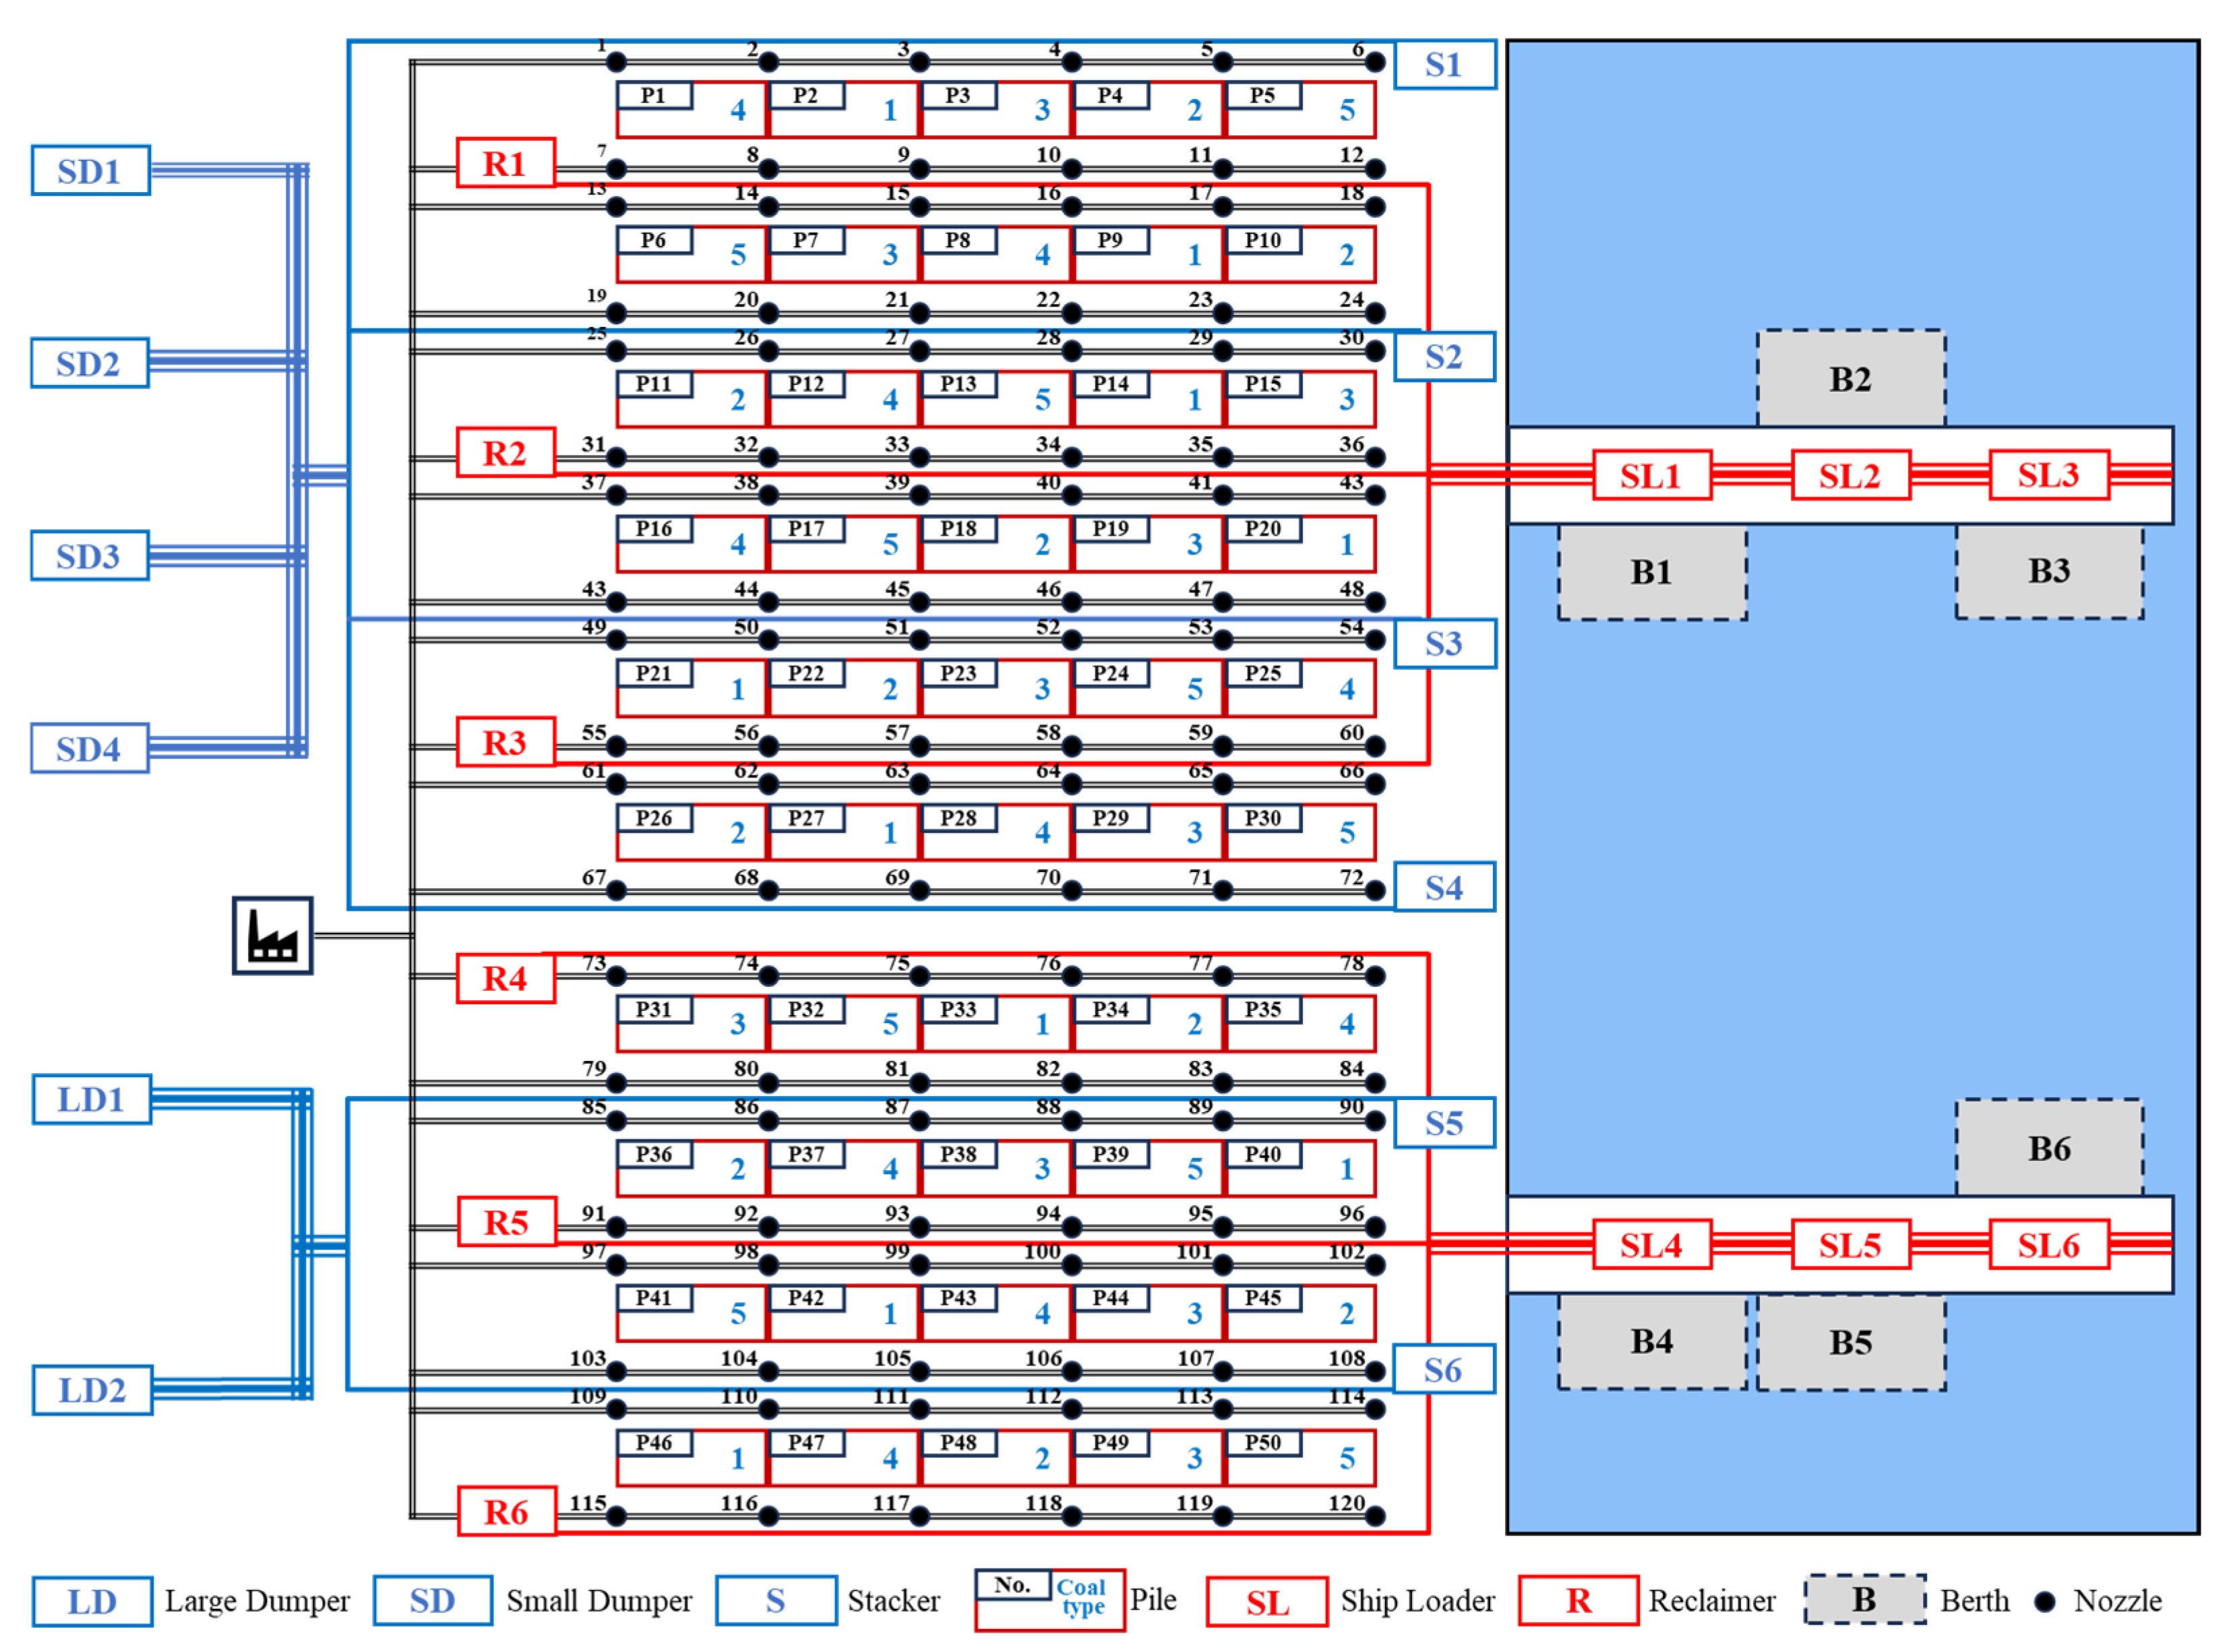
The study examines a coal rail-water intermodal transportation port in China, analyzing equipment scheduling and the end-to-end coal handling process from unloading to ship loading. The operational workflow and stockyard layout are illustrated in Figure 1. The coal transfer operations involve multiple procedures, including train arrival and splitting, unloading, storage, and ship loading. These processes encompass train splitting plans, berth allocation plans, unloading-stacking operation plans, stockyard spraying plans and reclaiming-loading operation plans, all interconnected through spatiotemporal resource constraints to form a complex dynamic decision-making problem.
Upon arrival at the port, heavy-haul trains undergo technical inspection before being split into unit trains (5 kt or 10 kt) to match the capacity of the unloading systems. Notably, each inbound train carries coal of a single uniform type. Different train formations correspond to different splitting plans, as detailed in Table 1. Ports typically deploy two capacity classes of dumpers: large dumpers (LD) for 10 kt unit trains and small dumpers (SD) for 5 kt unit trains. The varying unloading efficiencies of these systems mean unbalanced train splitting may lead to idle equipment. Therefore, refined train splitting plans and unloading sequences are required to balance the workload between the two dumper systems, making rational splitting and unloading plans essential for efficient coal transfer.
Following splitting operations, dispatchers formulate coal unloading plans based on current production conditions, specifying the dumper and sequence for unloading operations along with candidate stockyard piles, generating the unloading-stacking operation plan. To facilitate subsequent model construction, this paper defines the complete set of equipment and their interconnections involved in this process as an unloading operational line, illustrated in Figure 1 as: SD1-stacker (S1)-pile (#1). During unloading operations, several critical constraints must be considered, including coal type matching, pile capacity limits, and stacker capability and accessibility. Coal type matching means the coal type of the inbound train must match that of the target pile, as each pile exclusively stores one coal type. Stacker capability and accessibility reflect that stackers are restricted to operating within corresponding piles by physical constraints. These constraints collectively influence the scheduling decisions for unloading operational line equipment selection.
The coal is transferred to the stockyard following the completion of unloading operations. Under stockyard operations, the fundamental challenge lies in maintaining adequate coal inventory for loading demands while optimizing handling schedules and piles allocation strategies to minimize spraying resource consumption in stockyard and reduce environmental impacts during unfavorable operating conditions. The spraying system in stockyard consists of three components: a pumping station, an array of high-pressure nozzles positioned at each pile’s four corners, and a pipeline network connecting them. When spraying is activated for a target pile, the pumping station extracts water and delivers it through the pipeline network to the designated nozzles, which convert the water into mist and spray it onto the pile surface to increase the moisture content of the surface layer. The amount of water consumed in spraying operations on piles depends on two key variables: the current amount of stored coal in the pile and a dynamically adjusted spraying coefficient. This coefficient varies in response to external environmental factors, such as ambient temperature, relative humidity, and wind speed, as well as intrinsic coal properties, including existing moisture content and coal type. Through real-time monitoring of these parameters, the port’s intelligent spraying system dynamically calibrates operational parameters. The water consumption calculation per nozzle operation, as shown in Formula (1):
σ d t G t φ d t = θ h d t B , h H , d D h 3 , t T 2
In the Formula,  σ d t  represents the amount of stored coal in pile  d  at time  t . The coefficient of external environmental factors affecting the stockyard’s water consumption at time  t  is denoted by  G t , while  φ d t  indicates the coefficient of intrinsic coal properties influencing the spraying requirement for pile  d  at time  t . The variable  θ h d t  stands for the water consumption by nozzle  h  for pile  d  at time  t , and  B  refers to the number of nozzles allocated to each pile.
To meet spraying operation requirements, the pumping station consumes electricity to convert it into mechanical energy for water delivery. During operations, the electricity consumption of the pumping station is proportional to the water delivery distance. Therefore, the stockyard allocation strategy has a direct impact on resource consumption throughout all operational procedures, necessitating a dynamic balance between spraying resource consumption and loading efficiency to achieve optimal overall operational costs.
During the ship loading procedure, ship information and coal loading requirements, including maximum load capacity, coal type and quantity per cabin, and loading sequence specifications, are provided prior to arrival. Based on these requirements and current stockyard conditions, dispatchers develop loading plans for each cabin, generating reclaiming-loading operation plans. This paper defines the complete set of equipment and their interconnections involved in this process as a loading operational line, illustrated in Figure 1 as: pile (#7)-reclaimer (R1)-ship loader (SL1). Loading tasks must follow specified sequences while adhering to equipment capability and accessibility constraints for both reclaimers and ship loaders. Through this process, the coal is ultimately loaded onto the ship, marking the completion of the entire operational procedure.
The systematic analysis of the integrated coal ports handling and spraying operations clearly demonstrates the multidimensional constraints and complex interactions characteristics of the operational processes. To address these challenges, this study establishes two primary objectives: first, minimizing total dwell and operating time of trains and ships to enhance throughput capacity and operational efficiency; second, minimizing resource consumption, including water and electricity costs in stockyard spraying operations as well as electricity costs in unloading and loading operational lines. The second objective aims to reduce operational costs while supporting green and sustainable port development.
In summary, the integrated scheduling problem for coal ports handling and spraying operations studied in this paper can be summarized as follows: the research provides information such as train and ship arrival schedules, equipment layouts and capacities, stockyard configurations, and storage limits, with optimization objectives focusing on minimizing both operating time costs and resource consumption costs to produce scheduling solutions that align with smart and green port requirements.

3.2. Model Formulation

A MILP model is developed based on the above problem description, incorporating the following foundational assumptions:
(1)
Each piece of equipment serves only one operational line at any given time without interruption.
(2)
Equipment productivity remains constant, with synchronized start and stop times for all equipment within the same operational line.
(3)
Each pile is dedicated to storing a single coal type exclusively.
(4)
Handling duration is determined by both operation volume and pile location.
(5)
Every berth is equipped with its corresponding ship loader.
The model employs the sets and parameters detailed in Table 2, with variables specified in Table 3.
As mentioned in Section 3.1, our objective function consists of two parts. The first part represents the operating time for trains and ships.
min   i I , m M i a i m ( t i m 1 c i m t i m 0 ) + i I , m M i , l L i m a i m ϕ i m l t i m l + u U A u ( t u w u 0 2 t u 0 ) + u U , p P u w u 0 A u η u w u 0 p t u w u 0 p
The second part accounts for the resource consumption costs.
min   h H , t T 2 ( κ 1 ξ h + κ 2 ) θ h t + i I , m M i , l L i m κ i m l 3 ϕ i m l + u U , w W u , p P u w κ u w p 4 η u w p
There are three fundamental categories of constraints.
(1)
Train splitting and unloading-stacking constraints
j J i δ i j = 1 , i I
δ i j c i m , i I , j J i , m M i j
m M i c i m a i m = n i , i I
l L i m ϕ i m l = c i m , i I , m M i
t i m 1 t i m 0 c i m , i I , m M i
t i m 1 N c i m , i I , m M i
x i m f = l L f ϕ i m l , i I , m M i , f F i m
ε i m i m f 1 + ε i m i m f 1 x i m f + x i m f 1 , i I , i I , m M i , m M i , f F i m F i m , i i m m
t i m 1 + l L i m t i m l ϕ i m l t i m 1 N ( 3 ε i m i m f 1 x i m f x i m f ) , i I , i I , m M i , m M i , f F i m F i m , i i m m
y i m k = l L k ϕ i m l , i I , m M i , k K i m
ε i m i m k 2 + ε i m i m k 2 y i m k + y i m k 1 , i I , i I , m M i , m M i , k K i m K i m , i i m m
t i m 1 + l L i m t i m l ϕ i m l t i m 1 N ( 3 ε i m i m k 2 y i m k y i m k ) , i I , i I , m M i , m M i , k K i m K i m , i i m m
z i m d = l L d ϕ i m l , i I , m M i , d D i m 1
ε i m i m d 3 + ε i m i m d 3 z i m d + z i m d 1 , i I , i I , m M i , m M i , d D i m 1 D i m 1 , i i m m
t i m 1 + l L i m t i m l ϕ i m l t i m 1 N ( 3 ε i m i m d 3 z i m d z i m d ) , i I , i I , m M i , m M i , d D i m 1 D i m 1 , i i m m
Formula (4) requires each inbound train to follow a single splitting plan. Formulas (5) and (6) guarantee that the formation of unit trains exactly corresponds to the formations of the respective inbound trains, while Formula (7) assigns each unit train to a specific unloading line. Formulas (8) and (9) specify the earliest possible start times for unloading operations. Formula (10) ensures the association between dumpers and unloading lines. Formulas (11) and (12) prevent scheduling conflicts between dumpers. Formula (13) aligns stackers with their assigned operational lines. Formulas (14) and (15) coordinate the scheduling of stackers to avoid conflicts. Formula (16) defines the mapping between piles and unloading lines, while Formulas (17) and (18) ensure non-overlapping stacking sequences at the same piles.
(2)
Reclaiming-loading constraints
v V u μ u v = 1 , u U
p P u w η u w p = 1 , u U , w W u
t u w 2 t u 0 , u U , w = 1
t u w 2 + t u w p η u w p t u w + 1 2 , u U , w W u \ { w u 0 } , p P u w
g u w d = p P d η u w p , u U , w W u , d D u w 2
λ u w u w d 1 + λ u w u w d 1 g u w d + g u w d 1 , u U , u U , w W u , w W u , d D u w 2 D u w 2 , u u w w
t u w 2 + p P u w t u w p η u w p t u w 2 N ( 3 λ u w u w d 1 g u w d g u w d ) , u U , u U , w W u , w W u , d D u w 2 D u w 2 , u u w w
e u w q = p P q η u w p , u U , w W u , q Q u w
λ u w u w q 2 + λ u w u w q 2 e u w q + e u w q 1 , u U , u U , w W u , w W u , q Q u w Q u w , u u w w
t u w 2 + p P u w t u w p η u w p t u w 2 N ( 3 λ u w u w q 2 e u w q e u w q ) , u U , u U , w W u , w W u , q Q u w Q u w , u u w w
b u w s η u w p , u U , w W u , p P u w , s = s p
b u w s = μ u v , u U , v V u , w W u , s = s v
λ u u v 3 + λ u u v 3 μ u v + μ u v 1 , u U , u U , v V u V u , u u
t u w 2 + p P u w t u w p η u w p t u w 2 N ( 3 λ u u v 3 μ u v μ u v ) , u U , u U , v V u V u , u u , w = w u 0 , w = 1
t i m 1 + l L i m t i m l ϕ i m l t u w 2 N ( 3 λ i m u w d 4 z i m d g u w d ) , i I , m M i , u U , w W u , d D i m 1 D u w 2
t u w 2 + p P u w t u w p η u w p t i m 1 N ( 2 + λ i m u w d 4 z i m d g u w d ) , i I , m M i , u U , w W u , d D i m 1 D u w 2
Formula (19) assigns each ship to a unique berth, while Formula (20) allocates loading operations to specific loading operational lines. Formulas (21) and (22) maintain a sequential order of loading operations for each ship. Formula (23) ensures that pile selections align with the corresponding loading operational lines. Formulas (24) and (25) prevent conflicts in pile reclaiming, and Formula (26) ensures that reclaimer selections are consistent with the loading operational lines. Formulas (27) and (28) avoid conflicts on the same reclaimer by sequential execution of reclaiming operations. Formulas (29) and (30) guarantee consistency among the selected ship loader, its associated loading operational line, and the assigned berth. Formulas (31) and (32) regulate the sequence of berth occupancy, while Formulas (33) and (34) prohibit simultaneous stacking and reclaiming operations at any pile.
(3)
Spraying operation constraints
t T 1 o i m d t 1 = z i m d , i I , m M i , d D i m 1
t T 1 , d D i m 1 o i m d t 1 t = t i m 1 , i I , m M i
t T 1 o u w d t 2 = g u w d , u U , w W u , d D u w 2
t T 1 , d D u w 2 o u w d t 2 t = t u w 2 , u U , w W u
σ d t = A d 0 , d D , t = 1
σ d t = σ d t 1 + i I , m M i o i m d t 1 A i m u U , w W u o u w d t 2 A u w , d D , t T 1 / { 1 }
σ d t 0 , d D , t T 1
σ d t A d 1 , d D , t T 1
θ h t = d D h θ h d t , h H , t T 2
δ i j , c i m , ϕ i m l , x i m f , ε i m i m f 1 , y i m k , ε i m i m k 2 , z i m d , ε i m i m d 3 , μ u v , η u w p , g u w d , λ u w u w d 1 , e u w q , λ u w u w q 2 , b u w s , λ u u v 3 , o i m d t 1 , o u w d t 2 , λ i m u w d 4 { 0 , 1 }
Formulas (35) and (36) and (37) and (38) define the conversion constraints between decision variables and temporal variables for stacking and reclaiming operations at the piles, respectively. Formulas (39) and (40) dynamically track changes in coal inventory. Formulas (41) and (42) ensure the capacity limit of piles, while Formulas (1) and (43) calculate water spraying volumes of each nozzle by coal quantities with spraying coefficients. Formula (44) ensures that the decision variables are binary.

4. Algorithm Design

The integrated scheduling of coal ports operations, involving equipment coordination and stockyard allocation with spraying operations, presents an NP-hard problem that balances operating time costs and resource consumption costs under spatiotemporal constraints. As the research horizon expands and the number of inbound trains and ships increases, the complexity of global scheduling decisions increases significantly. Extensive research has demonstrated the advantage of heuristic algorithms in solving large-scale combinatorial optimization problems, significantly accelerating the discovery of feasible solutions [45]. Concurrently, DRL has seen increasingly profound and widespread application in scheduling domains, particularly for sequential decision-making problems in recent years.
Therefore, this paper proposes a scheduling optimization algorithm based on the MEA framework, incorporating a MAPPO-driven adaptive evolutionary strategy. This algorithm deeply integrates the global search capability of the MEA with the dynamic decision-making capability of MAPPO. On the one hand, dominant gene structures serve to guide the search direction. On the other hand, specialized agents, specifically a crossover agent, a mutation agent, and a neighborhood search agent, are designed. These agents dynamically and collaboratively adapt evolutionary strategies, such as operator selection, in response to the current state of the population and environmental reward feedback. This adaptive mechanism enables precise optimization of the population’s evolutionary direction, facilitating a dynamic balance between handling efficiency and resource consumption.

4.1. Encoding and Gene Structure

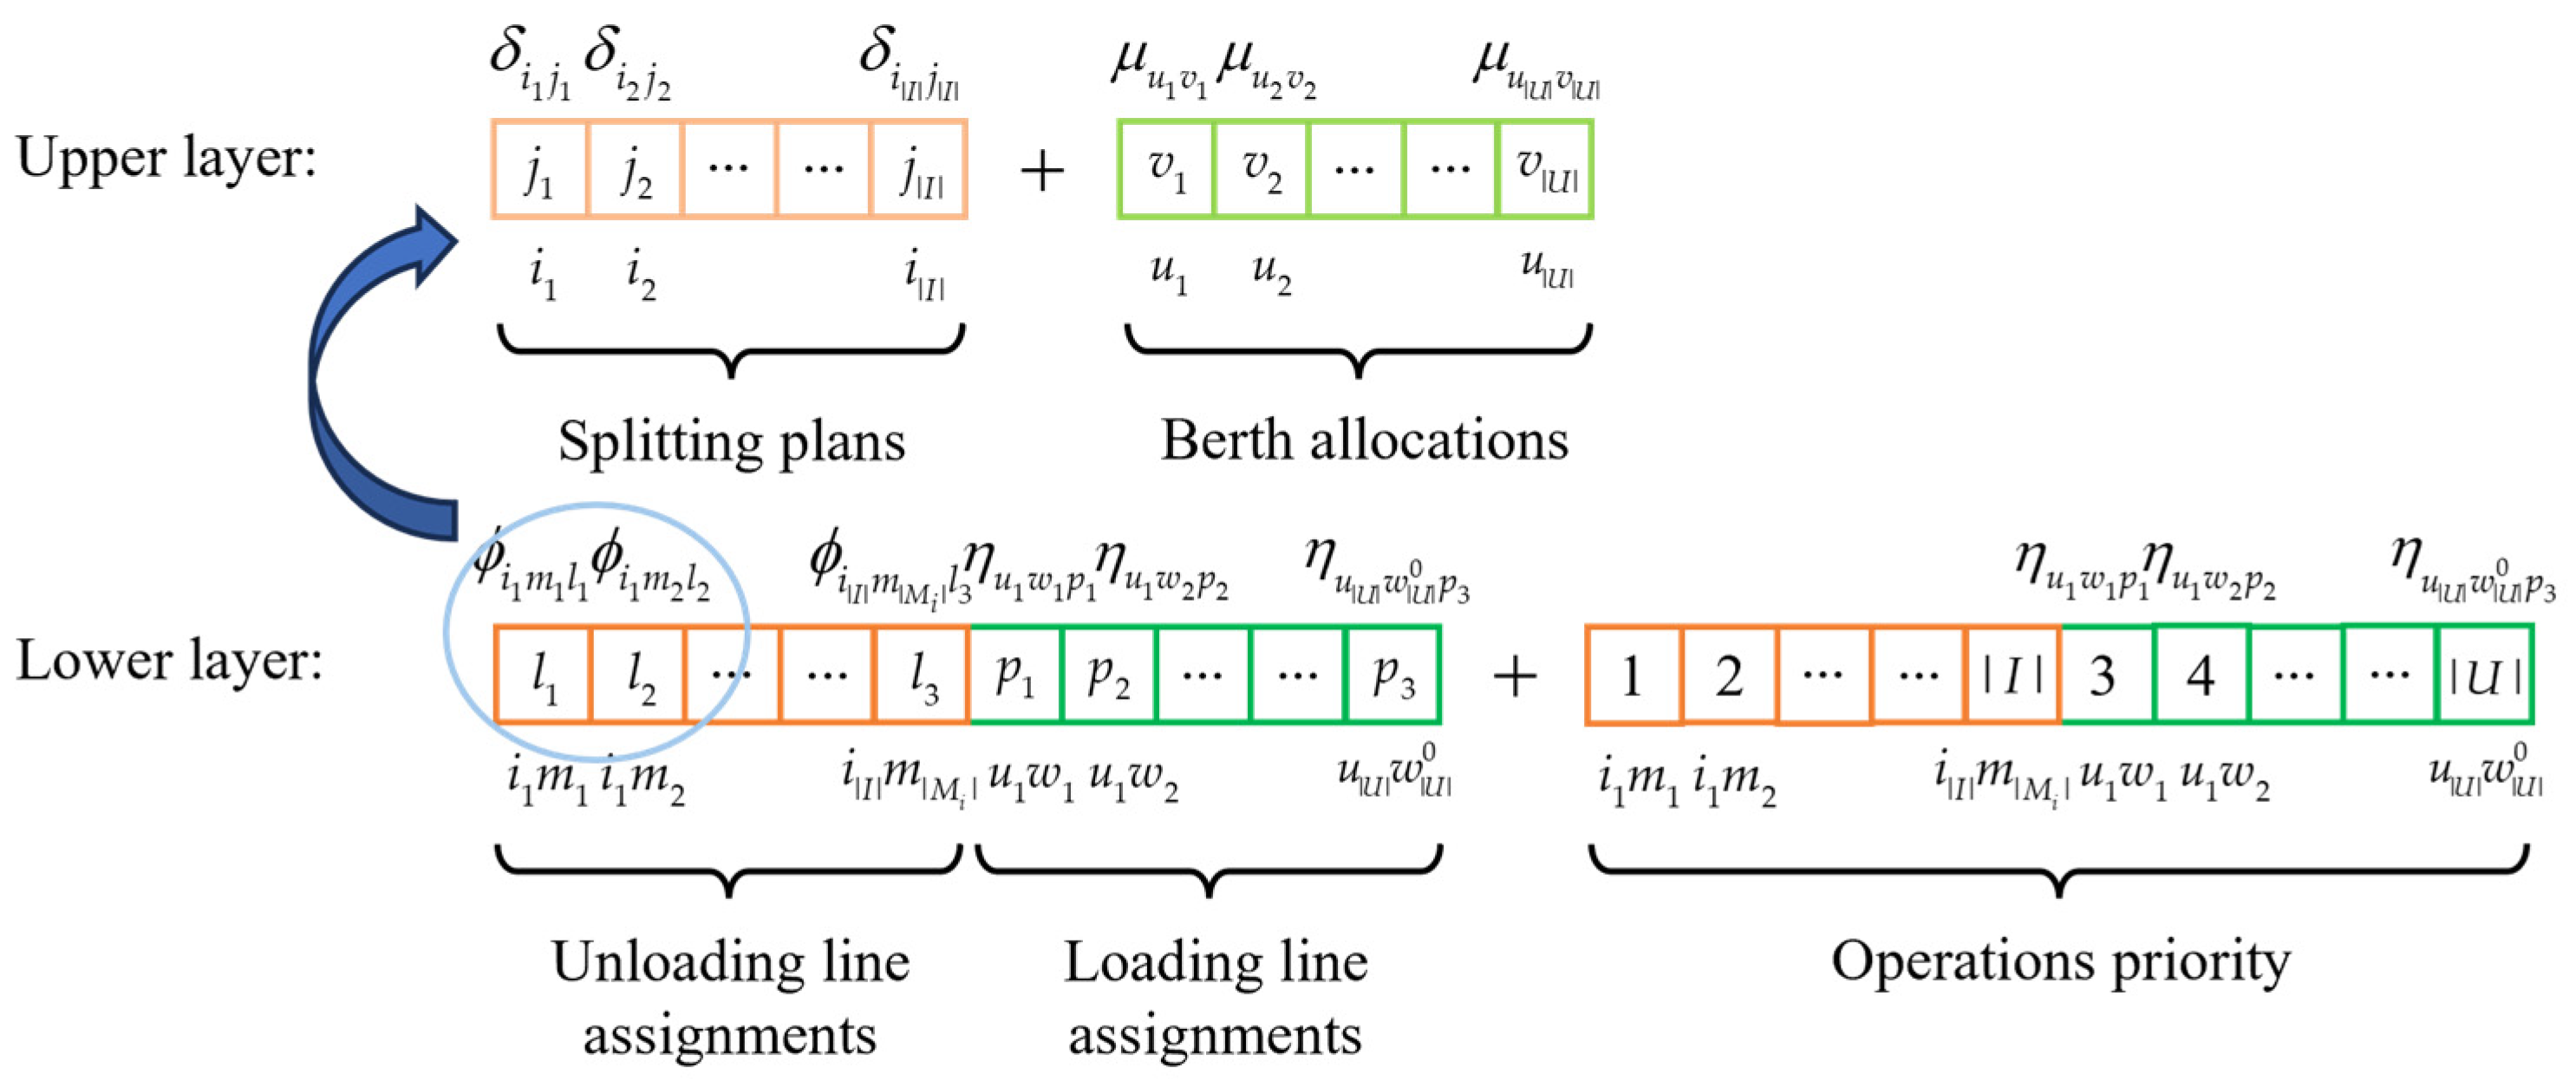
Encoding design is a critical component of the algorithm, requiring a comprehensive representation of all decision variables and the solution space within the port scheduling problem. Interdependencies exist among these decision variables. For example, the splitting plan determines subsequent selection of unloading lines, while berth allocation influences loading lines selection. To reduce encoding complexity, we employ a hierarchical encoding strategy. The lower layer constructs a complete scheduling code using a two-segment chromosome structure: operational line assignment and operational priority sequencing. The upper layer utilizes a gene structure to record the splitting plan for each train and the berth allocation for each ship. A schematic diagram of this dual-layer chromosome and gene structure encoding is presented in Figure 2.
The first segment of the chromosome encodes the selection of unloading lines and loading lines. Each unit train generated from the splitting of inbound trains is assigned a specific genetic locus. The value at this locus represents the selected unloading line. During chromosome generation, unloading line assignments must ensure the uniqueness of the train splitting plan and that the coal type corresponds to the designated piles. Correspondingly, each ship’s loading operation occupies a genetic locus where its value denotes the chosen loading line, subject to berth allocation constraints and equipment accessibility. The second chromosome segment handles the operational sequence encoding. This study combines the priority sequence with the earliest available scheduling principle for decoding. Specifically, in each scheduling iteration, operations are selected based on their encoded priority sequence. The start time of an operation is determined by the completion time of its immediately preceding operation and the earliest available time of the assigned operational line, while simultaneously ensuring that no equipment usage conflicts occur and that pile capacity constraints are satisfied. By repeating this process, a complete feasible schedule is constructed. During initial population generation, values are randomly selected from the set of candidate operational lines for each genetic locus, and operational sequences are randomly generated, ensuring population diversity.
Splitting plans and berth allocations are not directly encoded in the lower-layer chromosome structure, they are represented as part of the upper-layer gene information. To ensure an effective mapping between the gene structure and the chromosome, the splitting plan gene structure assigns one locus for each inbound train, where the locus value indicates its corresponding splitting strategy. Similarly, the berth allocation gene structure assigns one locus for each ship, with the locus value indicating the allocated berth. The values of these upper-layer genes are indirectly determined by analyzing the unloading and loading line selections encoded in the chromosome. This dual-layer chromosome encoding and gene structure strategy comprehensively captures the interdependencies among decision variables and ensures full exploration of the solution space.

4.2. Dominance Recording Matrix

The DRM serves as the core mechanism that guides the high-quality evolution of the population. It dynamically records the distribution probabilities of gene structures among elite individuals in the population, capturing the values of dominant gene structures. This captured information subsequently guides the population toward evolving into more optimal regions of the solution space.
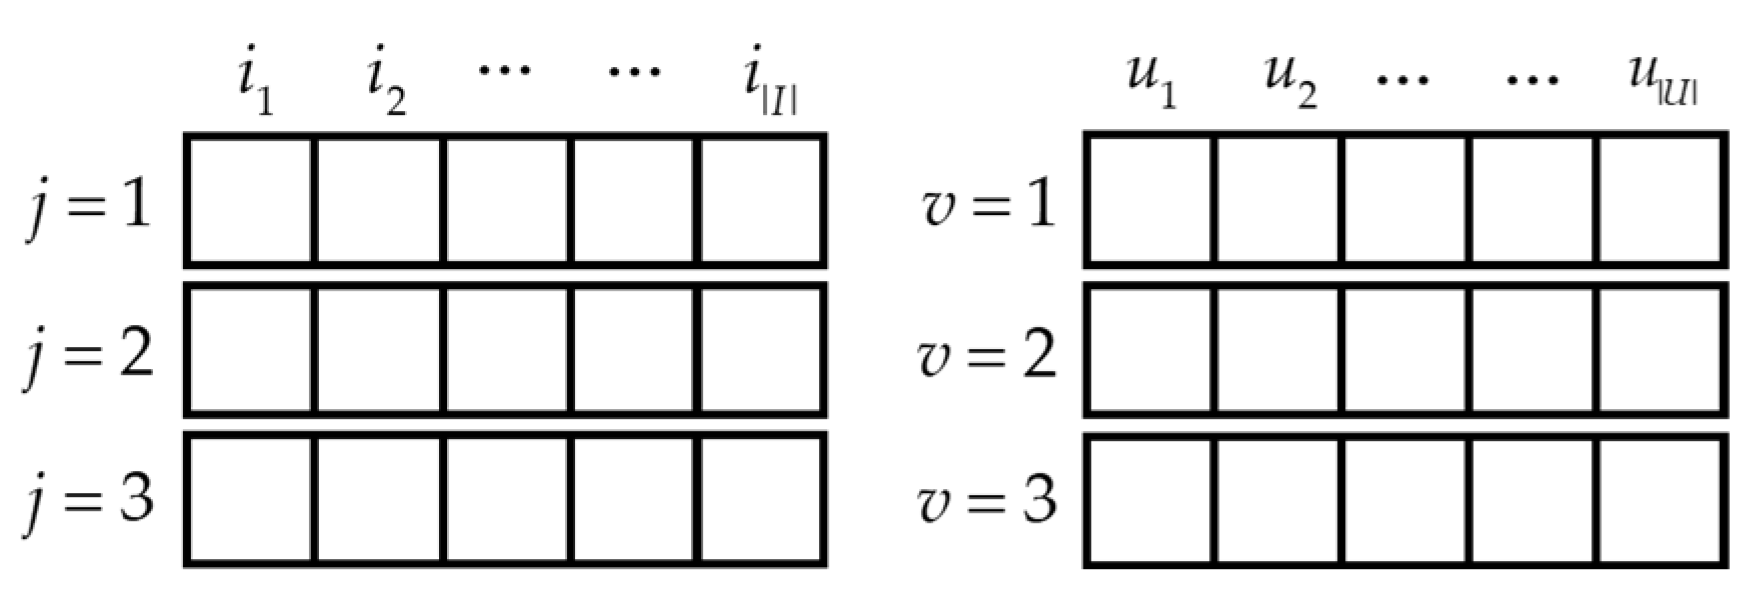
The DRM is constructed by extracting and statistically analyzing the splitting plan and berth allocation gene structures from the top  μ %  of elite individuals located on the Pareto front. As depicted in Figure 3, the matrix element value represents the frequency of occurrence of the corresponding decision option within the elite individuals. By analyzing these frequency distributions, the DRM identifies the decisions that currently dominate the population. Genes associated with decisions exhibiting a frequency exceeding 80% are defined as high-frequency dominant gene structures. To prevent premature convergence of the population, the DRM undergoes periodic updates every few generations, ensuring its dynamic adaptability to the evolving search environment.

4.3. MAPPO-Based Adaptive Evolutionary Strategy

To enhance algorithm performance and overcome the limitations of fixed parameter settings and random strategies inherent in traditional evolutionary operations, this study introduces an adaptive evolutionary strategy framework based on MAPPO. Within this MAPPO-driven framework, agents perceive the population state and receive environmental feedback, enabling them to dynamically learn and optimize their respective evolutionary strategies. These optimized strategies subsequently guide the evolutionary direction of the population. This adaptive strategy adjustment mechanism enables the algorithm to effectively drive the population toward rapid convergence to high-quality solutions while simultaneously maintaining population diversity.

4.3.1. State Representation

The construction of the state space must balance the global evolutionary characteristics of the population with the local correlations of individual gene structures. Therefore, we primarily extract key features relevant to each agent’s responsibilities from dimensions such as population evolution dynamics and the distribution of dominant gene structures, forming their local observation state. Simultaneously, representative indicators reflecting the population’s global characteristics are incorporated as public features. This results in a complete state vector for each agent by combining local key features with public features.
Public features need to reflect the current population quality and evolutionary state. Consequently, we select the average values all individuals on two objectives, denoted as  F ¯ 1 F ¯ 2  and their variances  V a r ( F 1 ) V a r ( F 2 ) , along with the proportion of Pareto front solutions within the population, denoted as  γ p a , as public population features. Their calculations are as follows:
F ¯ k = 1 N n = 1 N f k n       k = 1 , 2
V a r ( F k ) = 1 N n = 1 N ( f k n F ¯ k ) 2       k = 1 , 2
γ p a = N p a N
where  f k n  is the value of the  n - th  individual for objective  k  (operating time:  k = 1 ; resource consumption:  k = 2 ),  N  is the population size, and  N p a  is the count of Pareto front solutions. The public state vector at generation  t  is  o s t = [ F ¯ 1 , F ¯ 2 , V a r ( F 1 ) , V a r ( F 2 ) , γ p a ] .
The state observation for the crossover agent needs to reflect the current structural diversity and genetic potential of the population. The diversity of the population’s gene structure is quantified by the average entropy value per locus:
E a v g = 1 L i = 1 L ( j = 1 K i p i j log p i j )
where  L  is the chromosome length,  K i  is the number of possible values at the  i - th  locus, and  p i j  is the frequency of value  j  occurring at that locus. Secondly, we introduce the proportion of dominant gene structures  η h i g h :
η h i g h = 1 L 1 i = 1 L 1 D R M h i g h ( i ) D R M h i g h ( i ) =   1   if   max (   D R M [ i ]   )   >   0.8   0   otherwise
where  L 1  is the length of the gene structures encoding, and  D R M h i g h ( i )  is an indicator function equaling 1 if the  i - th  locus is a high-frequency dominant gene structure. The features extracted above are concatenated with the public features to form the crossover agent’s state vector:  o c x t = [ o s t , E a v g , η h i g h ] .
The mutation agent is responsible for seeking a balance between exploration and exploitation, preventing premature convergence. It focuses on the dynamic changes in the Pareto front and the effects of mutation. For this purpose, we introduce the average objective value change in solutions on the Pareto front  Δ F ¯ k p a , which measures the improvement rate of high-quality solutions during population evolution. It is calculated as follows:
Δ F ¯ k p a = 1 N t p a n = 1 N t p a f k n 1 N t 1 p a n = 1 N t 1 p a f k n k = 1 , 2
where  N t p a  and  N t 1 p a  are the number of individuals on the Pareto front in the current generation  t  and the previous generation  t 1 , respectively. Therefore, the mutation agent’s state vector is  o m u t = [ o s t , Δ F ¯ 1 p a , Δ F ¯ 2 p a ] .
The neighborhood search agent, however, needs to focus on scheduling operation characteristics. The features it extracts include the average waiting time of trains and ships  t ¯ w a i t p a  and the average idle time of equipment  t ¯ i d l e p a  among solutions on the Pareto front, resulting in its state vector is  o n s t = [ o s t , t ¯ w a i t p a , t ¯ i d l e p a ] . The state vectors of each agent serve as input to their respective actor networks, enabling them to make rational action selections.

4.3.2. Action Space

The design of the action space aims to provide the three agents with executable instruction sets for dynamically and precisely controlling key parameters and strategies during the population evolution process. By integrating optimization capabilities of reinforcement learning into traditional evolutionary operations, it drives the population towards efficient convergence to the Pareto optimal front.
The crossover agent’s actions  a c x t  are primarily responsible for strategically guiding the crossover operation at a global level, ensuring the generation of high-quality offspring while promoting effective exploration of the solution space. Its actions encompass parent selection, the choice of crossover operator, and the setting of the crossover probability. The parent selection mechanism includes two strategies: selecting elite individuals from the top 30% based on non-dominated rank or utilizing tournament selection. The choice of crossover operator determines the diversity and quality of offspring gene combinations. Guided by statistical information from the DRM, the crossover operator preferentially preserves dominant parental gene structures, thereby biasing offspring toward proven high-quality regions. Therefore, two crossover operators are proposed based on the dominant gene structure: a combined crossover operator and a uniform crossover operator. The former compares and retains the better gene structures from both parents to form a new individual. The latter only preserves the high-frequency dominant gene structures from the parents, while the remaining parts are determined through uniform crossover. To balance exploration and exploitation capabilities, the crossover probability should also be dynamically adjusted based on the population state.
The mutation agent’s actions  a m u t  focus on determining the mutation location, mutation operator type, and mutation probability to maintain population diversity and promote local optimization. The mutation point selection strategy differentially processes individuals: for elite individuals, target loci with low-frequency dominance; for inferior-front individuals, preferentially select loci carrying high-frequency dominant genes. The mutation operators should embody strategies of local adjustment and structural perturbation, including reassigning operational lines at specific locus, such as swapping operational lines accessing proximal versus distal stockyard piles, and readjusting gene structures such as optimizing splitting plans or berth allocations. The mutation probability is adaptively selected from a predefined set based on the population’s convergence state.
The neighborhood search agent’s actions  a n s t  are designed for conducting refined local search on the sequence encoding to enhance the quality of solutions on the Pareto front. Its actions include selecting individuals, determining the neighborhood structure, and regulating the search depth. Individuals subjected to neighborhood search are selected from those on the current Pareto front. The neighborhood operators comprise three types: swap neighborhood, which involves exchanging the sequence of operations associated with the same equipment or the same pile; insertion neighborhood and reversal neighborhood, which perform local adjustments on the operation sequence corresponding to loci identified as high-frequency and low-frequency, respectively. The search depth is dynamically controlled by adapting the iteration count of neighborhood operations in response to Pareto front characteristics and local search effectiveness.
The action space for each agent is composed of the combinations of decisions across its different dimensions. Therefore, at each timestep, each agent outputs a composite strategy to guide the evolution of the current population.

4.3.3. Reward Function

The core purpose of the reward function is to quantify improvements in the Pareto front during population evolution and to effectively guide agents in adjusting their strategies. To precisely evaluate the differentiated contributions of the three agents during evolution, this paper designs a composite reward function. The hypervolume change  Δ H V t  is utilized as the shared reward  r s . Simultaneously, the proportion of offspring generated by each agent itself that enter the current Pareto front is assigned as its local additional reward. The reward for each agent is calculated as follows:
r s t = Δ H V t = H V t H V t 1
r z t = r s t + N z N p a z { c x , m u , n s }
where  z  denotes the agent index,  N z  is the number of offspring generated by agent  z  that enter the current Pareto front. This reward design provides feedback on the impact of each agent’s actions on solution quality enhancement, enabling them to adjust their policies accordingly.

4.4. Algorithm Framework

The proposed algorithm employs a MEA as the external optimization framework, which internally integrates three specialized agents with advantage actor-critic (A2C) networks for crossover, mutation and neighborhood search operations, achieving collaborative evolutionary optimization. The strategy updates are implemented using PPO mechanism. The overall framework of the algorithm is illustrated in Figure 4.
First, within the current generation population, each of the three agents, based on its respective observation  o z t  and its old actor network  π θ z o l d = ( a z t | o z t )  (where  θ z o l d  represents the parameters of the old actor network), executes its corresponding evolutionary operation to generate its own offspring. The offspring from all agents are merged to form a new population. This new population undergoes non-dominated sorting to update the Pareto front solution set. The individual rewards  r z t  are then calculated for each agent, with experience tuples  ( o z t , a z t , r z t , o z t + 1 )  stored in the replay buffer. The DRM is periodically updated by statistically analyzing gene structures of elite Pareto solutions.
When the number of tuples in the replay buffer reaches the threshold  N , the network training process begins. After sampling a minibatch of data  B , the critic network parameters  ϕ z  are updated. The state for each agent  s b  is formed by combining their respective local states into a global state representation. By sharing this global state information, the policies of the individual agents are collaboratively optimized. Specifically, the critic loss function is minimized:
L ( ϕ z ) = 1 2 B b = 1 B [ ν ϕ z ( s b ) ( A z b + ν ϕ z o l d ( s b ) ) ] 2
The advantage function  A z b  is computed using the old critic network  ϕ z o l d . The critic network parameters are updated via stochastic gradient descent with learning rate  α ϕ ϕ z ϕ z α ϕ ϕ z L ( ϕ z ) . Secondly, the actor loss function is computed:
J ( θ z ) = 1 B b = 1 B [ min ( r b ( θ z ) A z b , c l i p ( r b ( θ z ) , 1 ε , 1 + ε ) A z b ) ]
r b ( θ z ) = π θ z ( a z b | o z b ) π θ z o l d ( a z b | o z b )
where  r b ( θ z )  is the importance sampling ratio and  ε  is the clipping range. The actor network parameters are then updated via stochastic gradient descent with learning rate  α θ θ z θ z α θ θ z L ( θ z ) . Finally, the trained parameters  ϕ z  and  θ z  are assigned to  ϕ z o l d  and  θ z o l d , respectively, and the replay buffer is cleared. This iterative process of evolution and training continues until the maximum predefined number of generations is reached, at which point the algorithm terminates.

5. Case Study

5.1. Case Introduction

This section presents a case to verify the effectiveness of the proposed algorithm, based on the actual layout and operational data of coal rail-water intermodal ports in northern China, as illustrated in Figure 5. For the unloading operation, the large dumper and small dumper can unload 8400 t and 4200 t of coal per operation, taking 80 min and 60 min, respectively, to unload to the nearest pile. For the loading operation, the ship loader takes 90 min to load coal from the nearest pile to the ship. The maximum storage capacity of each pile is limited to 30,000 t. Berths B3 and B6 have a maximum capacity of 35,000 deadweight tons, while others accommodate up to 50,000 deadweight tons.
The case study period was selected from 10:00 to 22:00 on a specific day. During this period, 15 heavy-haul trains arrived and were numbered in the order of their arrival. The arrival times, formulation, and the coal type carried by each train are summarized in Table 4. In addition, loading operations for six ships had to be completed, with the arrival time and loading requirements of each ship specified in Table 5.
The algorithm parameters were rigorously configured through empirical validation: the population size was set to 500, the number of iteration episodes was set to 10,000, the network learning rate was set to 0.0001, and the clipping parameter was set to 0.15. All experiments were executed on an Intel Core i7-11800H 2.3 GHz CPU with 16 GB of RAM (Intel Corporation, Santa Clara, CA, USA).

5.2. Results Analysis

5.2.1. Computational Results

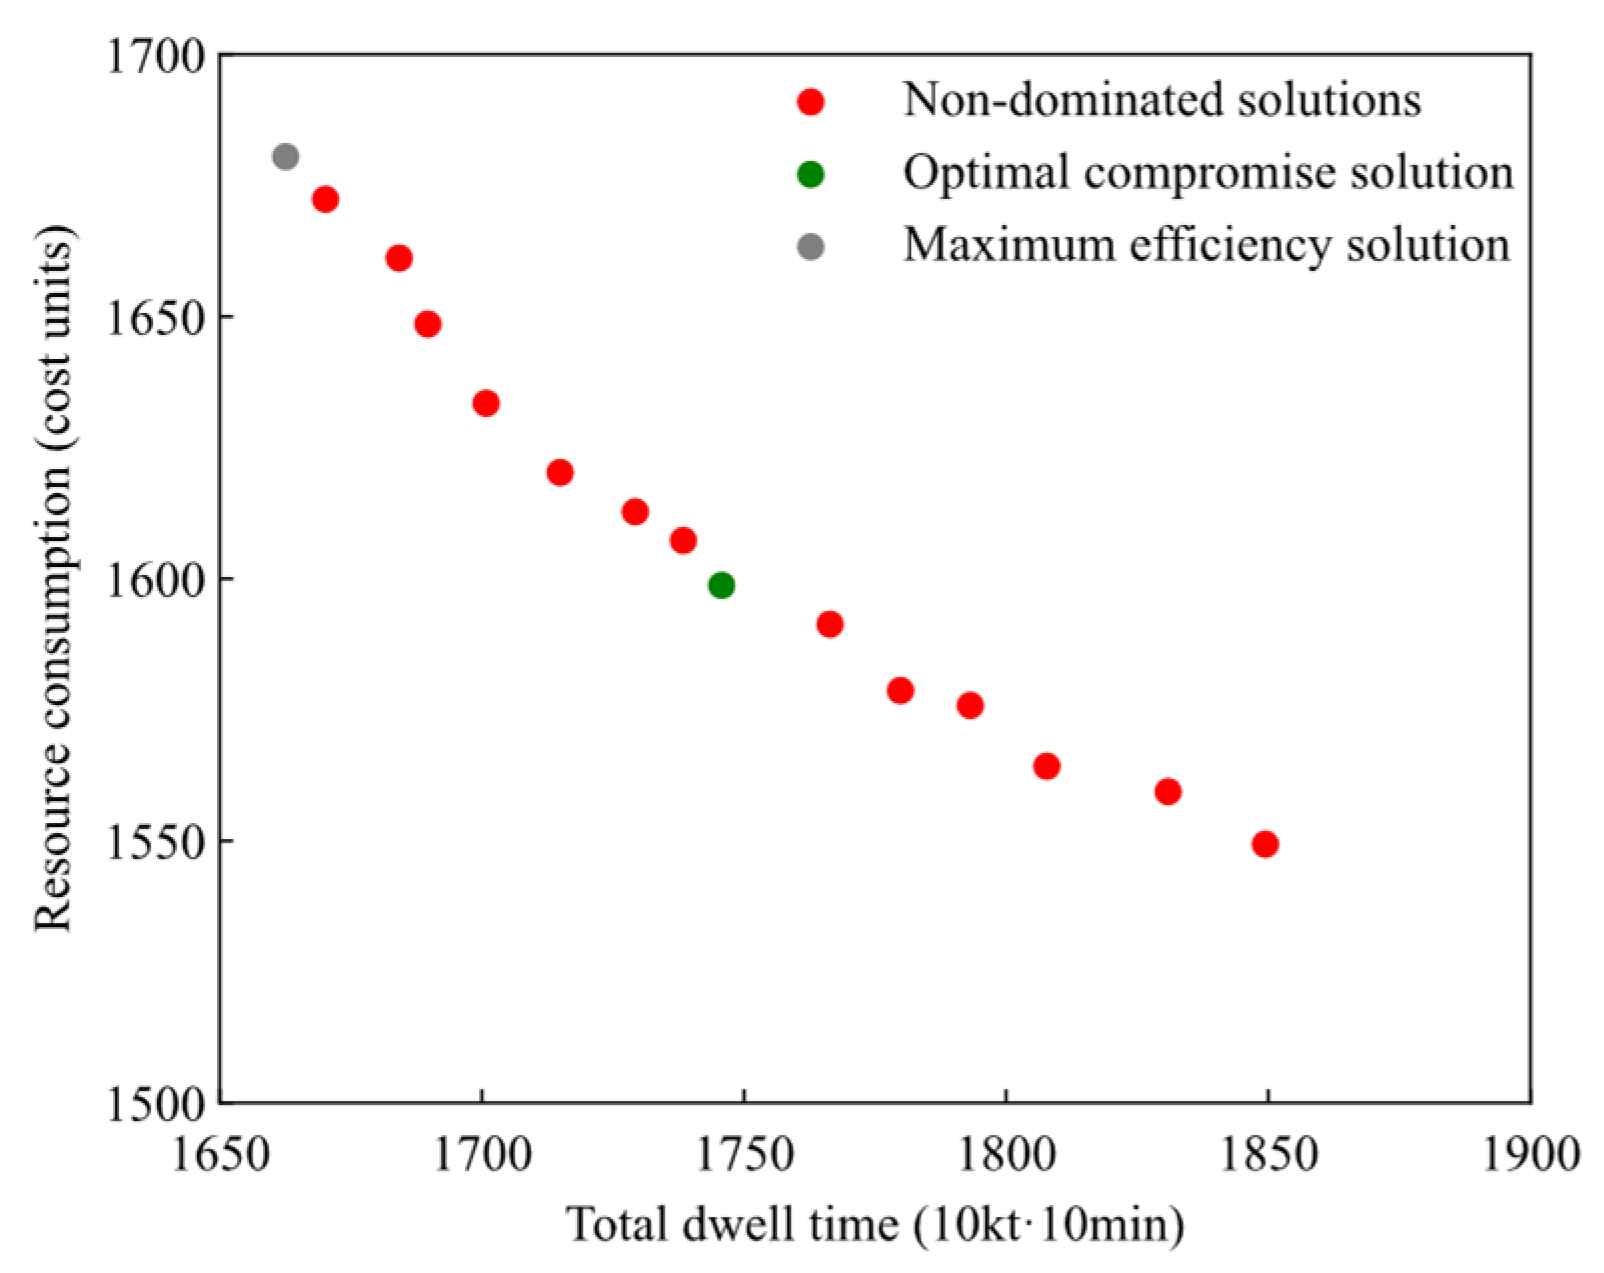
By employing the proposed algorithm, we obtained the Pareto front solutions, as illustrated in Figure 6.
The Pareto front provides a quantitative decision-making framework for navigating the trade-off between efficiency and resource conservation in port operations. As visualized in Figure 6, the Pareto front shows a distinct negative correlation: a reduction in total operational time is generally accompanied by an increase in resource consumption, embodying the inherent balance between the two objectives.
To screen out the optimal compromise solution (OC solution) that balances these dual goals from the Pareto front, we require an equitable evaluation basis. Given the significant scale disparities between the two objectives, this basis can be established through normalization. Therefore, we adopt min-max normalization, which maps both objectives to the unified interval [0, 1], to ensure their equitable contribution to the OC solution identification. The min-max normalization formula applied is:
f ¯ k n = f k n f k , min f k , max f k , min
where  f ¯ k n  is the normalized value of the  n - th  individual for objective  k , and  f k , min , f k , max  are the minimum and maximum value of the objective  k  across all non-dominated solutions. After normalization, we calculate the Euclidean distance from each solution to the ideal point (0, 0) in the normalized objective space. The green node in Figure 6, which exhibits the minimum Euclidean distance, is selected as the OC solution. Subsequently, we select the operation plan that maximizes the loading and unloading efficiency from the Pareto front, which is the gray node in Figure 6 (ME solution).
The ME solution requires 25.75 Mt·min for train unloading operations and 140.50 Mt·min for ship loading operations, with total resource consumption reaching 1680.49 cost units. Comparatively, the OC solution demonstrates balanced scheduling performance: train unloading requires 30.85 Mt·min, ship operations require 143.72 Mt·min, while resource costs are reduced to 1598.71 cost units. This represents a strategic trade-off, in which a 4.87% reduction in resource consumption results in a 5.00% increase in operational time, thereby improving port sustainability. The following comparative analysis will examine the two solutions in terms of equipment scheduling for loading and unloading operations, stockyard allocation, and resource utilization.
(1)
Analysis of unloading operations
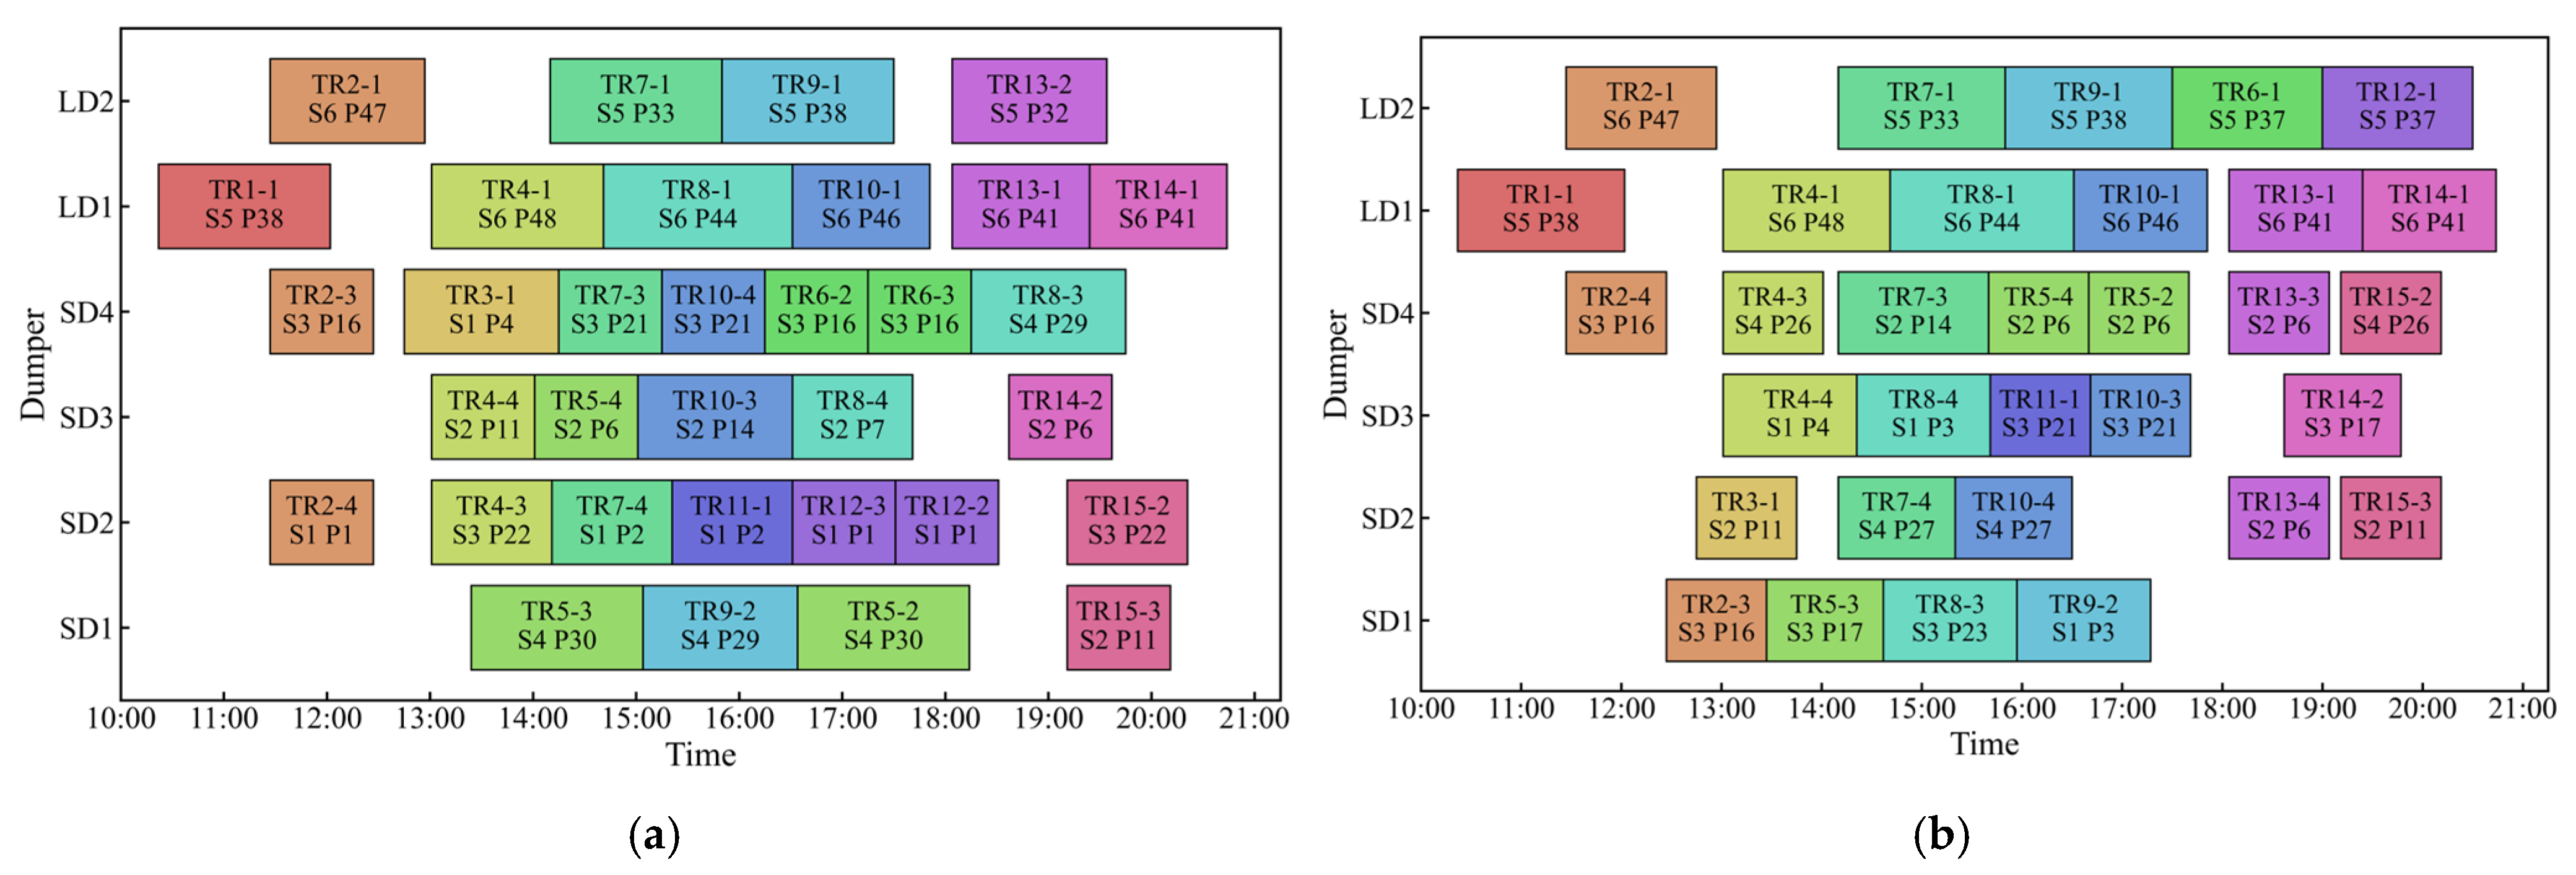
The unloading-stacking operational plans for both the ME solution and OC solution are presented in Figure 7. The two solutions effectively balance the workloads between the two stockyards at the port, ensuring that neither of them is overloaded. By distributing unloading operations between the two stockyards based on the equipment capacity, they avoid bottlenecks in dumper and stacker usage. This is a prerequisite for generating an efficient and reasonable operation plan. The unloading operation lines and sequence should also be arranged reasonably to ensure non-conflicting equipment use in each process, minimize waiting times, and reduce train dwell time at the station.
As shown in the comparison between Figure 7a,b, the analysis reveals that both solutions have adjusted the unloading sequence of the train to prioritize turnover efficiency of different types of coal. During the research period, coal type 1 and coal type 3 are relatively scarce, while the reserve of coal type 5 is relatively abundant. To ensure that the loading operations are completed on time, the unloading operations of the train carrying the abundant coal type will be moderately postponed, and the unloading operation of the scarce coal type will be given priority. For example, the unloading operation of TR5, which carries coal type 5, is postponed to prioritize the unloading operations of TR7 carrying coal type 1 and TR8 carrying coal type 3.
During the unloading-stacking process, the resource consumption of the spraying operation is jointly affected by both environmental conditions during coal handling and the position of the pile. Severe external environmental factors can substantially increase the amount of dust suppression spray required per unit of coal. For the ME solution, it prioritizes matching the train arrival with the unloading equipment capacity to maintain the operation continuity, which may cause higher resource consumption. In contrast, the OC solution schedules unloading operations to reduce the duration of coal storage under unfavorable external environmental conditions by selecting appropriate operation times, thereby lowering overall resource consumption.
In terms of the allocation of piles, the ME solution prioritizes operational efficiency over the impact of pile location on resource consumption. As a result, piles located near the loading-side are preferentially selected, such as P30 is used for unloading coal from TR5-2 and TR5-3 to streamline loading operations. However, supplying water to these distant piles requires extra electrical energy. Additionally, coal type 5 has a high inventory level and slow turnover rate, leading to extended storage duration and increased resource consumption. The OC solution, by comparison, carefully considers pile locations and inventory levels. Coal types with abundant inventory are allocated to piles near the unloading-side close to the pumping station in order to take advantage of the lower resource consumption of these piles. For instance, the coal of the unit train TR5-2 and TR5-4 is unloaded at P6.
(2)
Analysis of loading operations
The reclaiming-loading operational plans for both the ME solution and OC solution are presented in Figure 8. The results of the two plans show that the berth allocation aligns with stockyard capacity, ensuring that the loading operation at each berth is compatible with the coal supply capacity of the corresponding stockyard, thus preventing bottlenecks caused by mismatched loads.
The loading operations are restricted by the allocation of the piles and the initial coal inventory level of each pile. The longer the coal is stored in piles, the greater the negative impact on operational efficiency and resource consumption. The ME solution prioritizes seamless coordination between reclaimers and ship loaders. Therefore, except for the necessary time to wait for the replenishment of the scarce coal types, the loading operations at all berths are arranged continuously and efficiently. This focus on efficiency is evident in its pile selection, where loading-side piles are preferred to reduce loading time. For example, SP1’s fifth loading operation reclaims coal from P15 instead of P3 to accelerate the process. While the OC solution maintains reasonable loading efficiency, it integrates resource consumption into its decision-making. It adjusts pile selection to balance speed and resource usage, such as choosing P3, which is located in the middle of stockyard, for SP1’s fifth loading operation. Though this extends loading time slightly, it reduces the consumption of spraying resources.
Both solutions prioritize piles with sufficient inventory to avoid delays. The ME solution reduces reclaimers’ and ship loaders’ idle time through precise scheduling. While the OC solution avoids excessive delays and allows minor operational gaps to utilize low-consumption piles, ensuring conflict-free equipment use and alignment with long-term resource goals.
(3)
Analysis of stockyard allocation and resource consumption
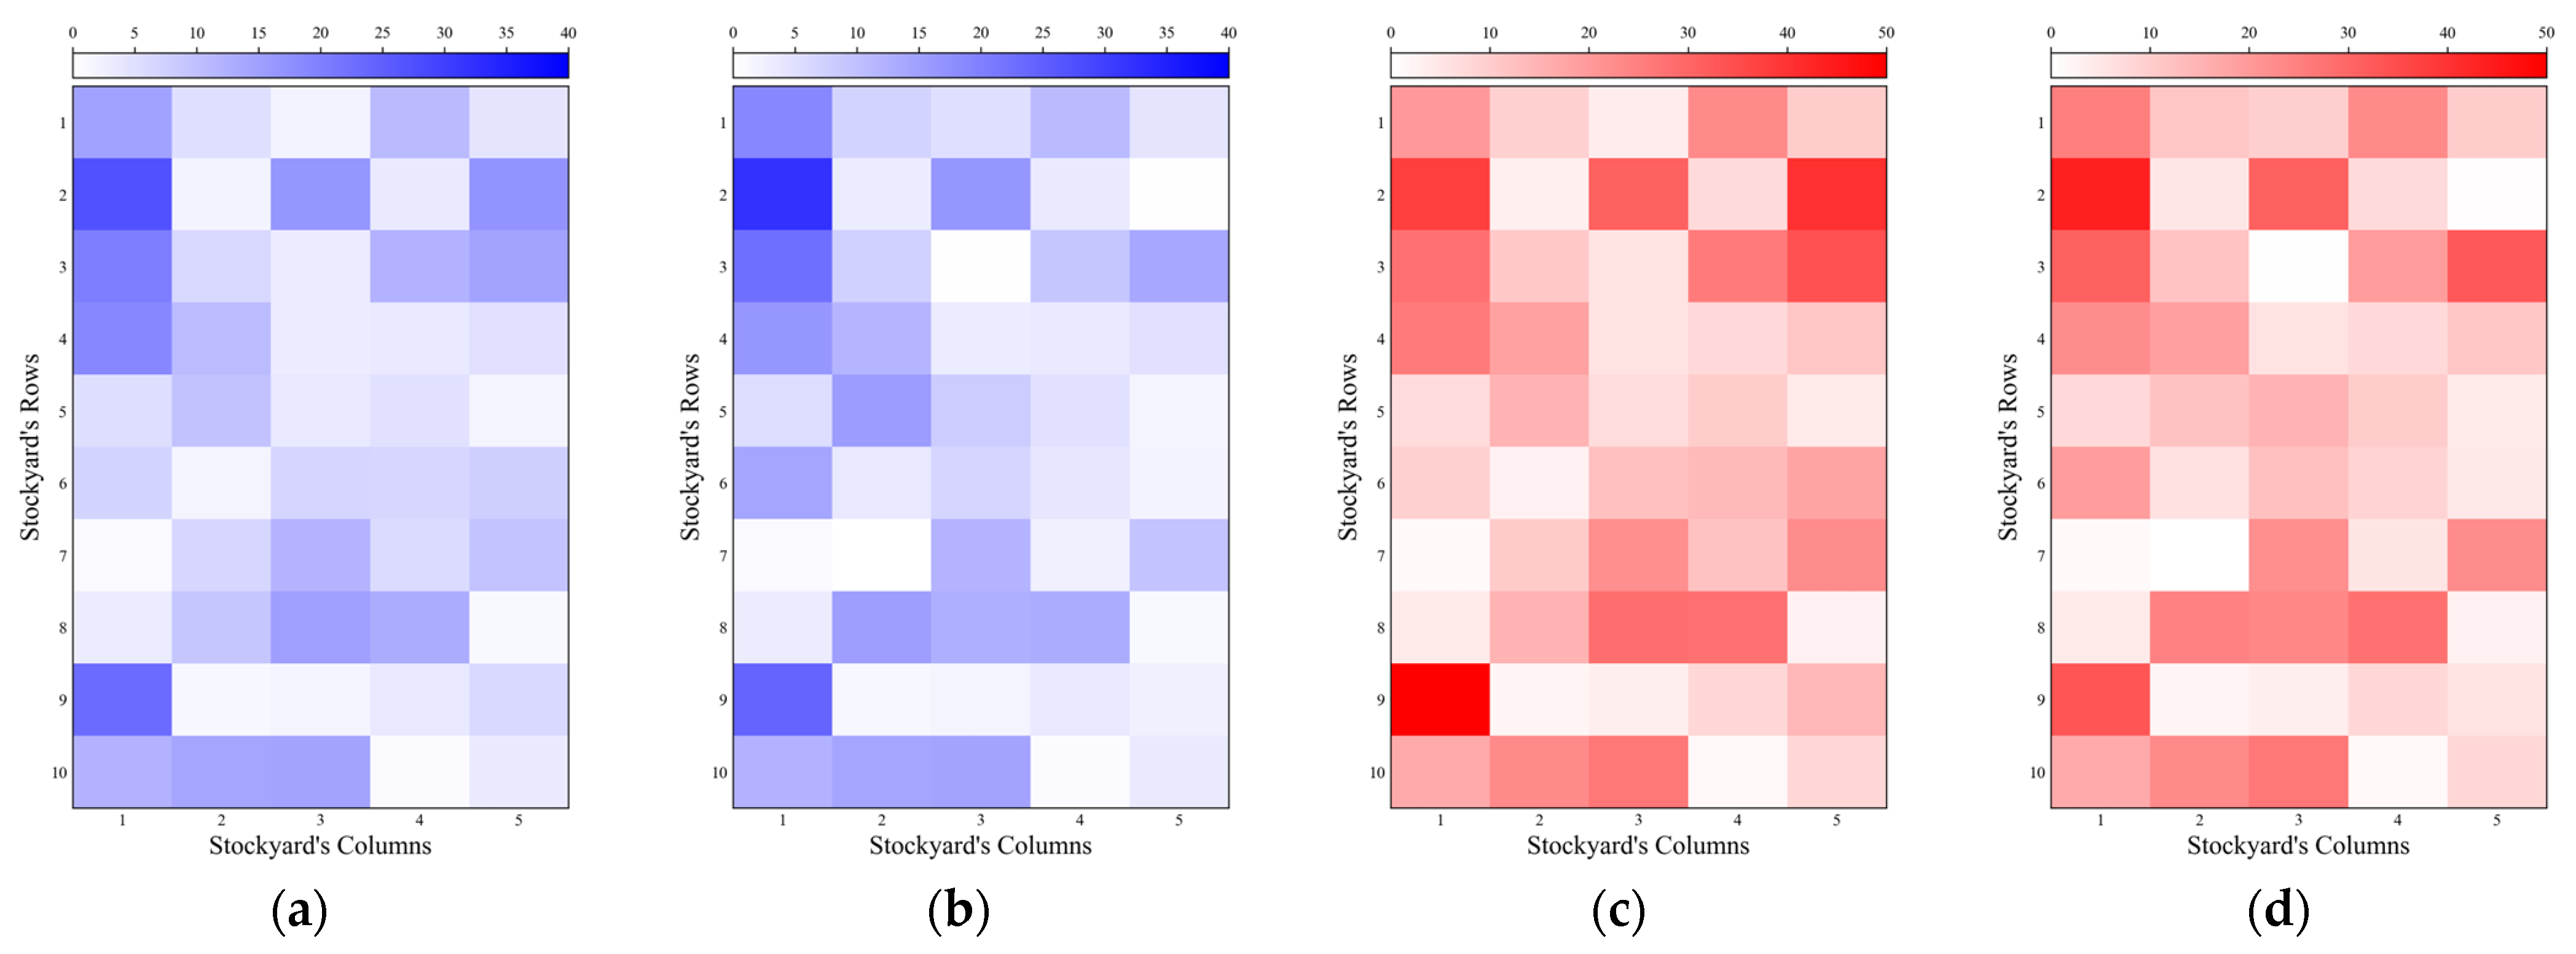
Based on the changes in the coal inventory of piles, 10 representative piles are selected from the ME solution and the OC solution, and the changes in their coal inventory over time are plotted, as shown in Figure 9. In addition, to visually display the resources, especially water and electricity, consumed by the spraying operation in each pile under the two plans, four heat maps are shown in Figure 10.
Under the ME solution, Figure 9a reveals pronounced inventory fluctuations across key piles such as P14 and P44, indicating concentrated stacking and reclaiming operations at shared locations. This operational clustering enhances equipment coordination but elevates average pile inventory levels, particularly in loading-side piles distant from pumping stations. Consequently, extended coal exposure duration intensifies spraying demands during peak operational periods, as reflected in the deeper hues across the ME solution’s heat map in Figure 10a,c. While this strategy boosts short-term port throughput, it heavily relies on high resource consumption areas, which may raise long-term resource costs.
As shown in Figure 9b, the OC solution adopts a more balanced allocation strategy, with average inventory adjustments at each pile, keeping most inventory levels low by the end of the period. This strategy reduces spraying intensity by avoiding prolonged coal storage in intensive zones, especially in piles with high spraying demand near loading berths. The corresponding heatmap in Figure 10b,d visually confirms this advantage through uniformly lighter resource consumption patterns, especially in central piles accessible to both unloading and loading zones.
The fundamental divergence in stockyard allocation strategies manifests through distinct operational plans. Heat maps in Figure 10 provide empirical validation of these strategic foundations. The ME solution prioritizes handling immediacy by concentrating activities on loading-side piles, intentionally accepting elevated resource costs to minimize operational time. This plan prefers loading-side locations despite extended water transmission distances. However, the OC solution implements spatial equilibrium coordination by optimizing coal handling flows across two operational dimensions: the unloading-stacking path and the reclaiming-loading path. This integrated scheduling dynamically leverages applicable piles to balance equipment deployment efficiency. Through strategic sequencing of stacker and reclaimer operations, the solution minimizes localized resource pressure while maintaining throughput efficiency.
In summary, the two obtained solutions fully satisfy the dispatching requirements under various conditions in actual operational organization, and port dispatchers can select the most appropriate operational plan based on real-time demands.

5.2.2. Algorithm Performance

To verify the effectiveness and applicability of the proposed algorithm, test instances of varying scales are generated based on the number of arriving trains and ship operations. Comparative analyses are conducted against four benchmark algorithms: NSGA-II, IDQN, MAA2C, and MAPPO. An approximate Pareto optimal front is constructed by merging and filtering the non-dominated solution sets generated by each algorithm. HV and IGD are selected as evaluation metrics to assess solution set quality, with the calculated results presented in Table 6.
The results demonstrate that the proposed algorithm achieves optimal overall performance across all test instances. The HV metric directly reflects the combined performance of solution set convergence and diversity in the objective space. The HV values of the proposed algorithm are significantly superior to those of NSGA-II and IDQN. This advantage originates from the design of the hybrid framework, which integrates the multi-agent dynamic policy optimization concept into the adaptive operator selection process within the MEA. Agents can adaptively adjust their evolutionary strategies based on their respective observed state information. This mechanism transforms conventional random search during evolutionary operations into an optimized strategy guided by proven superior genetic information, effectively accelerating training efficiency and convergence speed. Furthermore, the proposed algorithm utilizes the hypervolume change per generation as a shared reward. By feeding back to the agents in a combined form incorporating global optimization information and local rewards, it enhances the quality of the agents’ collaborative strategies for guiding population evolution. Consequently, the search efficiency and convergence precision within the solution space are optimized.
The IGD metric measures the proximity and coverage of the solution set relative to the true Pareto front. The proposed algorithm also demonstrates superior performance in terms of IGD. Its core advantage lies in the structured evolutionary mechanism guided by the DRM, which provides agents with structured prior knowledge for decision-making. In contrast, the MAA2C and MAPPO frameworks lack the integration of micro evolution principles. Their insufficient global search capability and difficulty in effectively balancing exploration and exploitation during training lead to uneven distribution of solution sets. Regarding the proposed algorithm, the DRM is periodically updated by extracting dominant gene structures from elite individuals, ensuring dynamic adaptation to population evolution trends. When agents execute decisions, the guidance based on the DRM ensures that historically validated efficient decision patterns are directionally transmitted to offspring, while retaining a degree of randomness in operator execution to avoid premature convergence.
The advantages of the proposed algorithm in solution quality and performance become more pronounced as the problem scale increases. This is attributed to the collaborative mechanism among the agents. In terms of state observation, agents dynamically adjust evolutionary operators based on real-time population states and Pareto front changes. Moreover, during the training process, agents share observed state information to construct a global state representation, enhancing the accuracy of the critic network in evaluating strategy value.
The action space and operator selection of each agent are designed with distinct focuses, thereby maintaining the diversity and convergence of the population. Specifically, during crossover operations, agents combine dominant gene structures, making new individuals more likely to inherit characteristics of high-quality solutions. For mutation operations, the mechanism selectively adjusts gene structures based on DRM, thereby effectively preventing the algorithm from converging to local optima. The neighborhood search agent performs targeted optimization on sparsely distributed regions of the Pareto front. The various operator combination strategies under adaptive selection can effectively balance exploration and exploitation, thereby improving the efficiency and quality of population evolution. With regard to reward assignment for each agent, while focusing on the improvement of HV, the local reward is determined by the proportion of each agent’s contribution to the Pareto front. Through such division of labor, agents collaboratively optimize evolutionary strategies, effectively driving the population towards global optimality and ensuring effective search of the solution space even for large-scale problems.
In summary, the MEA integrated with MAPPO significantly enhances the efficiency of multi objective optimization and the quality of the final solutions through its adaptive parameter adjustment mechanism. The resulting Pareto front exhibits marked improvements in both convergence and diversity.

6. Conclusions

This paper investigates the integrated optimization of handling equipment scheduling and stockyard spraying operations in coal ports, addressing the complex trade-off between operational efficiency and resource conservation by systematically modeling the end-to-end operational process, which encompasses train splitting plans, berth allocation, handling operations, stockyard allocation, and spraying operations. On this basis, we formulate a MILP model aimed at minimizing the total operating time for trains and ships, as well as reducing resource consumption costs, particularly those associated with water and electricity usage during spraying operations. This model captures the intricate interdependencies between equipment coordination, stockyard allocation, and environmental constraints, overcoming the limitations of fragmented optimization in traditional approaches.
To solve this NP-hard problem, we develop a novel hybrid algorithm that combines the global search strengths of the MEA framework with the adaptive decision-making capabilities of the MAPPO. The two-layer chromosome encoding structure maintains full coverage of the solution space: the lower layer encodes selection and sequencing of unloading and loading lines, while the upper layer captures the gene structures related to train splitting and berth allocation decisions. Through the establishment of three cooperative agents for crossover, mutation, and neighborhood search, a collaborative optimization strategy is formed to jointly guide the evolution of the population. The state representation combines the individual observational features of each agent with public population-level features, allowing agents to perceive both the local and global dynamics of the evolutionary process. During the training of the policy network, a global state is adopted to ensure coordinated decision-making across agents. The action space controls the selection of parents and operators, as well as the adjustment of probabilities, while the DRM provides statistical guidance to preserve or perturb gene structures in offspring. The composite reward mechanism couples global HV improvement with the local contributions of each agent, ensuring that exploration and exploitation are balanced during evolution. This MAPPO-driven collaborative adaptation enables the evolutionary operators to effectively steer the population toward globally optimal solutions while maintaining diversity.
Extensive computational experiments on a real-world coal port case validate the effectiveness of the proposed algorithm. A detailed comparison of two representative solutions on the Pareto front highlights the essential trade-off between efficiency and resource conservation. The case study shows that the OC solution achieves a 4.87% reduction in resource consumption with a 5.00% increase in total operating time compared to the ME solution, thereby demonstrating the algorithm’s ability to balance dual objectives. Operational analyses further reveal that the ME solution prioritizes speed through concentrated loading-side operations, whereas the OC solution emphasizes long-term sustainability by means of balanced stockyard workloads and strategic stockyard allocation. This flexibility provides dispatchers with informed options that can be aligned with real-time priorities of either efficiency or sustainability. Beyond the case study, comparative analyses across ten instance scales consistently confirm the superiority of the proposed MEA-MAPPO algorithm, which outperforms NSGA-II, IDQN, MA-A2C, and MAPPO in both hypervolume and inverted generational distance, thereby validating its stronger convergence performance and enhanced solution diversity.
Future research could extend this study by incorporating uncertainties such as stochastic arrivals, fluctuating coal demand, and variations in operational capabilities caused by external factors into the scheduling model and by integrating more granular equipment coordination to enhance the practicality of the framework. Additionally, scaling the algorithm to multi-port scenarios could further advance its applicability in complex logistics networks. Overall, this study provides a theoretical and methodological foundation for smart and green port operations, contributing to the balance between efficiency and sustainability in bulk cargo handling.

Author Contributions

Conceptualization, Y.W. and S.H.; methodology, Y.W. and S.H.; software, Y.W. and Z.L.; validation, Y.W. and H.T.; formal analysis, H.T. and A.X.; investigation, S.H.; resources, Y.W.; data curation, Z.L. and A.X.; writing—original draft preparation, Y.W., and H.T.; writing—review and editing, Y.W. and S.H.; visualization, H.T.; supervision, S.H. and A.X.; project administration, Y.W. and S.H.; funding acquisition, S.H. All authors have read and agreed to the published version of the manuscript.

Funding

This research was funded by the Fundamental Research Funds for the Central Universities of Ministry of Education of China (2024JBZX038).

Data Availability Statement

Data are contained within the article.

Conflicts of Interest

The authors declare no conflicts of interest.

References

  1. International Energy Agency. Coal 2024: Analysis and Forecast to 2026. Available online: https://www.iea.org/reports/coal-2024/executive-summary (accessed on 26 July 2025).
  2. Liu, J.; Lyu, Y.; Wu, J.; Wang, J. Adoption Strategies of Carbon Abatement Technologies in the Maritime Supply Chain: Impact of Demand Information Sharing. Int. J. Logist.-Res. Appl. 2025, 28, 70–97. [Google Scholar] [CrossRef]
  3. Lv, Y.; Zou, M.; Li, J.; Liu, J. Dynamic Berth Allocation under Uncertainties Based on Deep Reinforcement Learning towards Resilient Ports. Ocean Coast. Manag. 2024, 252, 107113. [Google Scholar] [CrossRef]
  4. Xia, Z.; Guo, Z.; Wang, W.; Jiang, Y. Joint Optimization of Ship Scheduling and Speed Reduction: A New Strategy Considering High Transport Efficiency and Low Carbon of Ships in Port. Ocean Eng. 2021, 233, 109224. [Google Scholar] [CrossRef]
  5. Li, H.; Zhao, J.; Jia, P.; Ou, H.; Zhao, W. Optimization of Bulk Cargo Terminal Unloading and Outbound Operations Based on a Deep Reinforcement Learning Framework. J. Mar. Sci. Eng. 2025, 13, 105. [Google Scholar] [CrossRef]
  6. Golias, M.; Portal, I.; Konur, D.; Kaisar, E.; Kolomvos, G. Robust Berth Scheduling at Marine Container Terminals via Hierarchical Optimization. Comput. Oper. Res. 2014, 41, 412–422. [Google Scholar] [CrossRef]
  7. Gambardella, L.M.; Mastrolilli, M.; Rizzoli, A.E.; Zaffalon, M. An Optimization Methodology for Intermodal Terminal Management. J. Intell. Manuf. 2001, 12, 521–534. [Google Scholar] [CrossRef]
  8. Chen, L.; Bostel, N.; Dejax, P.; Cai, J.; Xi, L. A Tabu Search Algorithm for the Integrated Scheduling Problem of Container Handling Systems in a Maritime Terminal. Eur. J. Oper. Res. 2007, 181, 40–58. [Google Scholar] [CrossRef]
  9. Hsu, H.-P.; Tai, H.-H.; Wang, C.-N.; Chou, C.-C. Scheduling of Collaborative Operations of Yard Cranes and Yard Trucks for Export Containers Using Hybrid Approaches. Adv. Eng. Inform. 2021, 48, 101292. [Google Scholar] [CrossRef]
  10. Zeng, Q.; Yang, Z. Integrating Simulation and Optimization to Schedule Loading Operations in Container Terminals. Comput. Oper. Res. 2009, 36, 1935–1944. [Google Scholar] [CrossRef]
  11. Cao, Y.; Yang, A.; Liu, Y.; Zeng, Q.; Chen, Q. AGV Dispatching and Bidirectional Conflict-Free Routing Problem in Automated Container Terminal. Comput. Ind. Eng. 2023, 184, 109611. [Google Scholar] [CrossRef]
  12. Li, L.; Li, Y.; Liu, R.; Zhou, Y.; Pan, E. A Two-Stage Stochastic Programming for AGV Scheduling with Random Tasks and Battery Swapping in Automated Container Terminals. Transp. Res. Part E-Logist. Transp. Rev. 2023, 174, 103110. [Google Scholar] [CrossRef]
  13. Homayouni, S.M.; Tang, S.H.; Ismail, N.; Ariffin, M.K.A.M.; Samin, R. A Hybrid Genetic-Heuristic Algorithm for Scheduling of Automated Guided Vehicles and Quay Cranes in Automated Container Terminals. In Proceedings of the CIE: 2009 International Conference on Computers and Industrial Engineering, Troyes, France, 6–9 July 2009; Volume 1–3, pp. 96–101. [Google Scholar]
  14. Chen, X.; Liu, S.; Zhao, J.; Wu, H.; Xian, J.; Montewka, J. Autonomous Port Management Based AGV Path Planning and Optimization via an Ensemble Reinforcement Learning Framework. OCEAN Coast. Manag. 2024, 251, 107087. [Google Scholar] [CrossRef]
  15. Liang, C.; Zhang, Y.; Dong, L. A Three Stage Optimal Scheduling Algorithm for AGV Route Planning Considering Collision Avoidance under Speed Control Strategy. Mathematics 2023, 11, 138. [Google Scholar] [CrossRef]
  16. Yang, Y.; Sun, S.; He, S.; Jiang, Y.; Wang, X.; Yin, H.; Zhu, J. Research on the Multi-Equipment Cooperative Scheduling Method of Sea-Rail Automated Container Terminals under the Loading and Unloading Mode. J. Mar. Sci. Eng. 2023, 11, 1975. [Google Scholar] [CrossRef]
  17. Chen, H.; Liu, W.; Oldache, M.; Pervez, A. Research on Train Loading and Unloading Mode and Scheduling Optimization in Automated Container Terminals. J. Mar. Sci. Eng. 2024, 12, 1415. [Google Scholar] [CrossRef]
  18. Munuzuri, J.; Lorenzo-Espejo, A.; Pegado-Bardayo, A.; Escudero-Santana, A. Integrated Scheduling of Vessels, Cranes and Trains to Minimize Delays in a Seaport Container Terminal. J. Mar. Sci. Eng. 2022, 10, 1506. [Google Scholar] [CrossRef]
  19. de Andrade, J.L.M.; Menezes, G.C. A Column Generation-Based Heuristic to Solve the Integrated Planning, Scheduling, Yard Allocation and Berth Allocation Problem in Bulk Ports. J. Heuristics 2023, 29, 39–76. [Google Scholar] [CrossRef]
  20. Tang, X.; Jin, J.G.; Shi, X. Stockyard Storage Space Allocation in Large Iron Ore Terminals. Comput. Ind. Eng. 2022, 164, 107911. [Google Scholar] [CrossRef]
  21. Ouhaman, A.A.; Benjelloun, K.; Kenne, J.P.; Najid, N. The Storage Space Allocation Problem in a Dry Bulk Terminal: A Heuristic Solution. IFAC Pap. 2020, 53, 10822–10827. [Google Scholar] [CrossRef]
  22. van Vianen, T.; Ottjes, J.; Lodewijks, G. Simulation-Based Rescheduling of the Stacker-Reclaimer Operation. J. Comput. Sci. 2015, 10, 149–154. [Google Scholar] [CrossRef]
  23. Xin, J.; Negenborn, R.R.; van Vianen, T. A Hybrid Dynamical Approach for Allocating Materials in a Dry Bulk Terminal. IEEE Trans. Autom. Sci. Eng. 2018, 15, 1326–1336. [Google Scholar] [CrossRef]
  24. Bouzekri, H.; Alpan, G.; Giard, V. Integrated Laycan and Berth Allocation Problem with Ship Stability and Conveyor Routing Constraints in Bulk Ports. Comput. Ind. Eng. 2023, 181, 109341. [Google Scholar] [CrossRef]
  25. Babu, S.A.K.I.; Pratap, S.; Lahoti, G.; Fernandes, K.J.; Tiwari, M.K.; Mount, M.; Xiong, Y. Minimizing Delay of Ships in Bulk Terminals by Simultaneous Ship Scheduling, Stockyard Planning and Train Scheduling. Marit. Econ. Logist. 2015, 17, 464–492. [Google Scholar] [CrossRef]
  26. Fereidoonian, F.; Sadjadi, S.J.; Heydari, M.; Mirzapour Al-e-Hashem, S.M.J. A Timely Efficient and Emissions-Aware Multiobjective Truck-Sharing Integrated Scheduling Model in Container Terminals. Proc. Inst. Mech. Eng. Part M-J. Eng. Marit. Environ. 2024, 238, 982–1008. [Google Scholar] [CrossRef]
  27. Zheng, Y.; Xu, M.; Wang, Z.; Xiao, Y. A Genetic Algorithm for Integrated Scheduling of Container Handing Systems at Container Terminals from a Low-Carbon Operations Perspective. Sustainability 2023, 15, 6035. [Google Scholar] [CrossRef]
  28. Peng, Y.; Wang, W.; Liu, K.; Li, X.; Tian, Q. The Impact of the Allocation of Facilities on Reducing Carbon Emissions from a Green Container Terminal Perspective. Sustainability 2018, 10, 1813. [Google Scholar] [CrossRef]
  29. Niu, Y.; Yu, F.; Yao, H.; Yang, Y. Multi-Equipment Coordinated Scheduling Strategy of U-Shaped Automated Container Terminal Considering Energy Consumption. Comput. Ind. Eng. 2022, 174, 108804. [Google Scholar] [CrossRef]
  30. Peng, W.; Wang, D.; Qiu, H.; Chu, F.; Yin, Y. Integrated Optimization on Double-Side Cantilever Yard Crane Scheduling and Green Vehicle Path Planning at U-Shaped Yard. IEEE Trans. Intell. Transp. Syst. 2025, 26, 3684–3699. [Google Scholar] [CrossRef]
  31. He, J.; Huang, Y.; Yan, W. Yard Crane Scheduling in a Container Terminal for the Trade-off between Efficiency and Energy Consumption. Adv. Eng. Inform. 2015, 29, 59–75. [Google Scholar] [CrossRef]
  32. Lu, H.; Lu, X. Joint Optimization of Berths and Quay Cranes Considering Carbon Emissions: A Case Study of a Container Terminal in China. J. Mar. Sci. Eng. 2025, 13, 148. [Google Scholar] [CrossRef]
  33. Jiang, X.; Zhong, M.; Shi, J.; Li, W. Optimization of Integrated Scheduling of Restricted Channels, Berths, and Yards in Bulk Cargo Ports Considering Carbon Emissions. Expert Syst. Appl. 2024, 255, 124604. [Google Scholar] [CrossRef]
  34. Wang, W.; Guo, J.; Tian, Q.; Peng, Y.; Cao, Z.; Liu, K.; Peng, S. Stockyard Allocation in Dry Bulk Ports Considering Resource Consumption Reduction of Spraying Operations. Transp. Res. Part E-Logist. Transp. Rev. 2025, 193, 103816. [Google Scholar] [CrossRef]
  35. Gong, L.; Huang, Z.; Xiang, X.; Liu, X. Real-Time AGV Scheduling Optimisation Method with Deep Reinforcement Learning for Energy-Efficiency in the Container Terminal Yard. Int. J. Prod. Res. 2024, 62, 7722–7742. [Google Scholar] [CrossRef]
  36. Yue, L.; Fan, H. Dynamic Scheduling and Path Planning of Automated Guided Vehicles in Automatic Container Terminal. IEEE-CAA J. Autom. Sin. 2022, 9, 2005–2019. [Google Scholar] [CrossRef]
  37. Zeng, Q.; Yang, Z.; Hu, X. A Method Integrating Simulation and Reinforcement Learning for Operation Scheduling in Container Terminals. Transport 2011, 26, 383–393. [Google Scholar] [CrossRef]
  38. Zhong, R.; Wen, K.; Fang, C.; Liang, E. Real-Time Multi-Resource Jointed Scheduling of Container Terminals with Uncertainties Using a Reinforcement Learning Approach. In Proceedings of the 2022 13th Asian Control Conference, ASCC, Jeju, Republic of Korea, 4–7 May 2022; pp. 110–115. [Google Scholar]
  39. Che, A.; Wang, Z.; Zhou, C. Multi-Agent Deep Reinforcement Learning for Recharging-Considered Vehicle Scheduling Problem in Container Terminals. IEEE Trans. Intell. Transp. Syst. 2024, 25, 16855–16868. [Google Scholar] [CrossRef]
  40. Tang, G.; Guo, Y.; Qi, Y.; Fang, Z.; Zhao, Z.; Li, M.; Zhen, Z. Real-Time Twin Automated Double Cantilever Rail Crane Scheduling Problem for the U-Shaped Automated Container Terminal Using Deep Reinforcement Learning. Adv. Eng. Inform. 2025, 65, 103193. [Google Scholar] [CrossRef]
  41. Zhu, J.; Zhang, W.; Yu, L.; Guo, X. A Novel Multi-Attention Reinforcement Learning for the Scheduling of Unmanned Shipment Vessels (USV) in Automated Container Terminals. OMEGA-Int. J. Manag. Sci. 2024, 129, 103152. [Google Scholar] [CrossRef]
  42. Li, B.; Yang, C.; Yang, Z. Multiple Container Terminal Berth Allocation and Joint Operation Based on Dueling Double Deep Q-Network. J. Mar. Sci. Eng. 2023, 11, 2240. [Google Scholar] [CrossRef]
  43. Li, C.; Wu, S.; Li, Z.; Zhang, Y.; Zhang, L.; Gomes, L. Intelligent Scheduling Method for Bulk Cargo Terminal Loading Process Based on Deep Reinforcement Learning. Electronics 2022, 11, 1390. [Google Scholar] [CrossRef]
  44. Ai, T.; Huang, L.; Song, R.J.; Huang, H.F.; Jiao, F.; Ma, W.G. An Improved Deep Reinforcement Learning Approach: A Case Study for Optimisation of Berth and Yard Scheduling for Bulk Cargo Terminal. Adv. Prod. Eng. Manag. 2023, 18, 303–316. [Google Scholar] [CrossRef]
  45. Cui, Y.; Geng, Z.; Zhu, Q.; Han, Y. Review: Multi-Objective Optimization Methods and Application in Energy Saving. Energy 2017, 125, 681–704. [Google Scholar] [CrossRef]
Figure 1. Layout of coal port.
Jmse 13 01840 g001
Figure 2. Schematic diagram of the dual-layer encoding.
Jmse 13 01840 g002
Figure 3. Illustration of dominance recording matrix.
Jmse 13 01840 g003
Figure 4. Overall framework of the algorithm.
Jmse 13 01840 g004
Figure 5. Port layout. This figure shows the layout of the port’s loading and unloading equipment and the configuration of the stockyard. There are two stockyards in the port, one is in the shape of 6 rows and 5 columns, and the other is in the shape of 4 rows and 5 columns. The number in the upper left corner of each pile is its number, and the number in the middle indicates the type of coal that can be stored in it. There is a nozzle at each of the four vertices of each pile.
Jmse 13 01840 g005
Figure 6. Pareto front. The horizontal axis represents the total time of loading and unloading operations, and the vertical axis represents the total unit cost of resource consumption.
Jmse 13 01840 g006
Figure 7. Gantt chart of unloading-stacking operational plans. Among them, (a) is the ME solution, and (b) is the OC solution. The labels within each rectangle denote the unloading and stacking plans for unit trains. For instance, train TR2 of ME solution is split into TR2-1 (10 kt unit train), TR2-3 (5 kt unit train) and TR2-4 (5 kt unit train); TR2-1 completes unloading at LD2, after which the coal is transferred and stacked at P47 via S6.
Jmse 13 01840 g007
Figure 8. Gantt chart of reclaiming-loading operational plans. Among them, (a) is the ME solution, and (b) is the OC solution. The labels within each rectangle denote the reclaiming and loading plans for ships. For instance, ship SP3 of ME solution has been designated for loading operations with SL6 and the coal required for the first loading operation is reclaimed at P44 via R5.
Jmse 13 01840 g008
Figure 9. Curve graph depicting changes in coal volume at piles. Specifically, (a) is the ME solution, and (b) is the OC solution.
Jmse 13 01840 g009
Figure 10. Heat maps illustrating resource consumption of spraying operations. Specifically, (a) and (b) depict the water resource consumption associated with the ME solution and the OC solution. Similarly, (c,d) represent the electricity consumption for the ME solution and the OC solution.
Jmse 13 01840 g010
Table 1. Formation and splitting plan of heavy-haul train.
Heavy-Haul TrainSplitting Plan
5000 t① 5 kt
10,000 t① 10 kt
② 5 kt + 5 kt
15,000 t① 10 kt + 5 kt
② 5 kt + 5 kt + 5 kt
20,000 t① 10 kt + 10 kt
② 10 kt + 5 kt + 5 kt
③ 5 kt + 5 kt + 5 kt + 5 kt
Table 2. Definitions of sets, indices, and parameters.
NotationDefinition
  I Set of inbound trains, indexed by  i , i I .
  J i Set of splitting plans for inbound train  i , indexed by  j J i .
  M i Set of all potential unit trains for inbound train  i , indexed by  m , m M i .
  M i j Set of all potential unit trains for inbound train  i  in splitting plan  j , indexed by  m M i j .
  L i m Set of candidate unloading operational lines for unit train  m  of inbound train  i , indexed by  l L i m .
  F i m Set of candidate dumpers for unit train  m  of inbound train  i , indexed by  f F i m .
  L f Set of all unloading operational lines corresponding to dumper  f , indexed by  l L f .
  K i m Set of candidate stackers for unit train  m  of inbound train  i , indexed by  k K i m .
  L k Set of all unloading operational lines corresponding to stacker  k , indexed by  l L k .
  D i m 1 Set of candidate piles for unit train  m  of inbound train  i , indexed by  d D i m 1 .
  L d Set of all unloading operational lines corresponding to pile  d , indexed by  l L d .
  U Set of arriving ships, indexed by  u , u U .
  V u Set of candidate berths for ship  u , indexed by  v V u .
  W u Set of loading operations for ship  u , indexed by  w , w W u = { 1 , 2 , , w u 0 } .
  P u w Set of candidate loading operational lines for loading operation  w  of ship  u , indexed by  p P u w .
  P d Set of all loading operational lines corresponding to pile  d , indexed by  p P d .
  D u w 2 Set of candidate piles for loading operation  w  of ship  u , indexed by  d D u w 2 .
  Q u w Set of candidate reclaimers for loading operation  w  of ship  u , indexed by  q Q u w .
  P q Set of all loading operational lines corresponding to reclaimer  q , indexed by  q P q .
  S Set of ship loaders, indexed by  s S .
  H Set of nozzles, indexed by  h H .
  D h 3 Set of piles corresponding to nozzle  h , indexed by  d D h 3 .
  T 1 Set of time within the scheduling period, indexed by  t T 1 = { 1 , 2 , , | T 1 | } .
  T 2 Set of spraying operation time within the scheduling period, indexed by  t T 2 .
  a i m Formation type of unit train  m  of inbound train  i a i m { 0.5 , 1 } .
  n i Formation type of heavy-haul train  i n i { 0.5 , 1 , 1.5 , 2 } .
  s p Ship loader corresponding to loading operational line  p .
  s v Ship loader corresponding to berth  p .
  t i m 0 Earliest unloading start time for unit train  m  of inbound train  i .
  t i m l Unloading-stacking time for unit train  m  of inbound train  i  on unloading operational line  l .
  t u 0 Arrival time for ship  u .
  t u w p Reclaiming-loading time for loading operation  w  of ship  u  on loading operational line  p .
  w u 0 The last loading operation of ship  u .
  A d 0 Initial coal amount in pile  d .
  A d 1 Maximum storage capacity of pile  d .
  A i m Unloading coal volume for unit train  m  of inbound train  i .
  A u Deadweight tonnage of ship  u .
  A u w Loading coal volume for loading operation  w  of ship  u .
  B Number of nozzles corresponding to each pile.
  G t Spraying coefficient per unit coal at time  t .
  φ d t Intrinsic coal characteristic coefficient of pile  d  at time  t .
  ξ h Electricity consumption coefficient per unit water for nozzle  h .
  κ 1 Unit electricity cost.
  κ 2 Unit water cost.
  κ i m l 3 Cost for unit train  m  of inbound train  i  on unloading operational line  l .
  κ u w p 4 Cost for loading operation  w  of ship  u  on loading operational line  p .
  N A large enough positive number.
Table 3. Definitions of variables.
VariableDefinition
  δ i j Decision binary variable equals 1 if inbound train  i  selects splitting plan  j ; 0 otherwise.
  c i m Decision binary variable equals 1 if inbound train  i  splits into unit train  m ; 0 otherwise.
  ϕ i m l Decision binary variable equals 1 if unit train  m  of inbound train  i  selects unloading operational line  l ; 0 otherwise.
  x i m f Binary variable equals 1 if unit train  m  of inbound train  i  selects dumper  f  for unloading; 0 otherwise.
  ε i m i m f 1 Binary variable equals 1 if unit train  m  of inbound train  i  unloads before unit train  m  of inbound train  i  at dumper  f ; 0 otherwise.
  t i m 1 Start time of unloading-stacking operation for unit train  m  of inbound train  i .
  y i m k Binary variable equals 1 if coal from unit train  m  of inbound train  i  selects stacker  k ; 0 otherwise.
  ε i m i m k 2 Binary variable equals 1 if coal from unit train  m  of inbound train  i  is stacked before coal from unit train  m  of inbound train  i  at stacker  k ; 0 otherwise.
  z i m d Binary variable equals 1 if coal from unit train  m  of inbound train  i  is stored in pile  d ; 0 otherwise.
  ε i m i m d 3 Binary variable equals 1 if coal from unit train  m  of inbound train  i  is stacked before coal from unit train  m  of inbound train  i  in pile  d ; 0 otherwise.
  μ u v Decision binary variable equals 1 if ship  u  selects berth  v ; 0 otherwise.
  η u w p Decision binary variable equals 1 if loading operation  w  of ship  u  selects loading operational line  p ; 0 otherwise.
  t u w 2 Start time of reclaiming-loading operation for loading operation  w  of ship  u .
  g u w d Binary variable equals 1 if loading operation  w  of ship  u  reclaims from pile  d ; 0 otherwise.
  λ u w u w d 1 Binary variable equals 1 if loading operation  w  of ship  u  before loading operation  w  of ship  u  from pile  d ; 0 otherwise.
  e u w q Binary variable equals 1 if loading operation  w  of ship  u  selects reclaimer  q ; 0 otherwise.
  λ u w u w q 2 Binary variable equals 1 if loading operation  w  of ship  u  before loading operation  w  of ship  u  at reclaimer  q ; 0 otherwise.
  b u w s Binary variable equals 1 if loading operation  w  of ship  u  selects ship loader  s ; 0 otherwise.
  λ u u v 3 Binary variable equals 1 if ship  u  arrives before ship  u  at berth  v ; 0 otherwise.
  o i m d t 1 Binary variable equals 1 if unit train  m  of inbound train  i  stacks coal in pile  d  at time  t ; 0 otherwise.
  o u w d t 2 Binary variable equals 1 if loading operation  w  of ship  u  reclaims from pile  d  at time  t ; 0 otherwise.
  λ i m u w d 4 Binary variable equals 1 if unit train  m  of inbound train  i  operates on pile  d  before loading operation  w  of ship  u ; 0 otherwise.
  σ d t Amount of stored coal in pile  d  at time  t .
  θ h d t The amount of water consumed by nozzle  h  in pile  d  at time  t .
  θ h t The amount of water consumed by nozzle  h  at time  t .
Table 4. Train data.
No.TimeFormulationCoal TypeNo.TimeFormulationCoal TypeNo.TimeFormulationCoal Type
TR110:1210 kt3TR613:5210 kt4TR1115:135 kt1
TR211:2720 kt4TR714:1020 kt1TR1216:0810 kt4
TR312:455 kt2TR814:1920 kt3TR1318:0420 kt5
TR413:0120 kt2TR914:3315 kt3TR1418:3715 kt5
TR513:2415 kt5TR1014:5020 kt1TR1519:1110 kt2
Table 5. Ship data.
Table 5. Ship data.
No.TimeLoading Operation
SP110:06#1: 2/8500 t, #2: 1/8800 t, #3: 4/9400 t, #4: 1/8900 t, #5: 3/8500 t
SP210:20#1: 3/8300 t, #2: 5/8500 t, #3: 3/9200 t, #4: 2/8700 t, #5: 4/8400 t
SP310:22#1: 3/9000 t, #2: 4/9700 t, #3: 3/9200 t
SP410:27#1: 4/9500 t, #2: 5/9800 t, #3: 1/8700 t, #4: 5/9200 t, #5: 3/9300 t
SP510:43#1: 4/9000 t, #2: 4/9500 t, #3: 1/8900 t
SP611:17#1: 2/9200 t, #2: 2/8800 t, #3: 1/9500 t, #4: 5/9000 t, #5: 3/8500 t
For instance, “#1:2/8500 t” indicates that the first loading operation of SP1 requires 8500 tons of coal type 2.
Table 6. Performance comparison of different algorithms.
Istance
(Train, Ship)
HVIGD
MEA-MAPPONSGA-IIIDQNMA-A2CMA-PPOMEA-MAPPONSGA-IIIDQNMA-A2CMA-PPO
I1 (15, 6)1.05730.87680.83020.91260.90530.03650.14930.20640.08920.0921
I2 (16, 6)1.14830.76390.82520.85830.92050.03390.29040.21280.19760.1082
I3 (17, 7)1.08850.80220.68160.74750.77940.09520.18660.32710.27930.2365
I4 (18, 7)1.20620.93030.65730.84340.72520.02630.14370.40650.20700.3527
I5 (19, 7)1.17040.81450.89570.86080.90320.01760.26720.19730.21640.1793
I6 (20, 8)1.09480.69960.84890.73130.81770.03830.39740.20650.33250.2204
I7 (21, 8)1.15010.66200.90370.71580.86400.04090.40830.18180.35780.2419
I8 (23, 9)1.09490.74130.68010.91950.75180.03360.30560.35490.16910.2878
I9 (24, 9)1.26200.81740.73420.78100.83930.01270.27220.37800.33090.2442
I10 (26, 10)1.13630.72210.61280.82900.84240.02310.38740.46690.25470.2165
Disclaimer/Publisher’s Note: The statements, opinions and data contained in all publications are solely those of the individual author(s) and contributor(s) and not of MDPI and/or the editor(s). MDPI and/or the editor(s) disclaim responsibility for any injury to people or property resulting from any ideas, methods, instructions or products referred to in the content.