Abstract
The United Kingdom (UK) shipping industry is facing calls to set out more robust decarbonisation plans. In light of the economic challenges facing the country, including the cost-of-living crisis and energy security considerations, the UK government has outlined plans to spearhead several ‘green’ developments. It is of paramount importance to understand how best to integrate the domestic maritime sector into this process by promoting the adoption of low-carbon marine fuels such as hydrogen and ammonia. However, there is a limited understanding of what are the most suitable locations for the early adoption of such fuels in the UK. The sustainability transitions literature offers interesting insights into how marine fuel transitions can unfold, by combining the study of market factors with various non-market socio-technical forces. Previous academic work has shown the importance of location and proximity in facilitating alternative marine fuel transitions. This paper builds onto that work by applying a socio-technical transitions framework to develop a set of indicators to ascertain the suitability of potential locations for the early adoption of hydrogen and ammonia as marine fuels in the UK. This paper explores these dynamics by combining evidence from documentary sources, a UK ship voyages database, and interviews with key stakeholders. Furthermore, three specific case studies are analysed in detail to outline key drivers for the adoption of hydrogen and ammonia. The findings show that there is a significant difference across the UK in regional viability for the early adoption of hydrogen and ammonia, with some of the best suited sites being in the north of Scotland (Orkney), south of England (the Solent-Isle of Wight), and east of England (Felixstowe-Harwich).
1. Introduction
The United Kingdom (UK) government’s ‘Industrial Strategy’ highlights that 40% of UK energy use comes from transport [1], whilst research commissioned by the UK Department for Transport identified hydrogen and ammonia amongst options for zero carbon marine fuels [2]. Furthermore, the UK ‘Clean Maritime Plan’ has set an ambition to ‘drive the transition to zero emission shipping’ with the aim that all vessels put into operation from 2025 onwards are designed with a zero emission propulsion capacity [3]. Many of these reports highlight the role of ‘clusters’ and emphasise the creation of ‘decarbonisation pathways’. The UK ‘Industrial Decarbonisation Strategy’ also commits to a 2050 net zero target and the creation of ‘at least four low-carbon clusters by 2030′ [4]. The new UK government is likely to continue along a similar path, as is evident in its desire to decarbonise the electricity grid and deliver ‘clean power’ by 2030 [5]. These various commitments, when combined with a sense of urgency created by the ongoing climate crisis, highlight the importance of a detailed study into understanding low-carbon transition pathways for all UK economic sectors, including shipping. When it comes to shipping, the role of suitable locations for early low-carbon shipping niches can be paramount in creating successful transition pathways for low-carbon marine fuels [6].
This paper aims to explore what are the most suitable geographic locations for the early adoption of green and blue hydrogen and ammonia as marine fuels which can be scaled in the medium to long term (up to 2050) (for the purposes of this study, ‘green’ hydrogen and ammonia are defined as those produced by using renewable electricity to create hydrogen through the electrolysis of water, ‘grey’ as those produced from the steam-methane reformation of natural gas, and ‘blue’ as fuels produced via the ‘grey’ production pathway but with carbon capture and storage). The study presents the initial findings from establishing a set of key indicators that can be used to ascertain the suitability and success of marine fuel transitions in UK ports. The indicators are created through insights from the ‘sustainability transitions’ and ‘economic geography’ literature and are specifically designed to identify sites for the early adoption of hydrogen and ammonia as marine fuels in the UK. Hydrogen and ammonia are chosen since they have so far been discussed as the two most promising options for shipping decarbonisation [2,7]. However, the hope is that these indicators can be generalised and applied to other marine fuels and regions in the future. The indicators are also used to inform the sites for three ‘case studies’, which are then researched in more detail. These cases offer valuable insights regarding local challenges and opportunities facing hydrogen and ammonia adoption in the UK.
2. Literature Review
Understanding regional factors and how they affect fuel adoption has been an area of growing academic interest. The focus of this research study is to better understand the following:
- How can regional factors impact the viability of the early adoption of hydrogen and ammonia as marine fuels in the UK?
From a research topic perspective, the study can be broken down into two areas of relevance when it comes to understanding the potential literature gaps:
- The research gap relating to the development of regional indicators for the adoption of alternative fuels and/or technologies.
- The research gap relating to the understanding of hydrogen and ammonia adoption dynamics, particularly in the UK.
Regarding the first research gap, multiple studies have been carried out to understand regional factors affecting maritime decarbonisation, wider mobility sustainability transition challenges, and the adoption of hydrogen-derived fuels. In terms of studies beyond transport, economic geography has been used to understand diffusion dynamics for renewable energy and hydrogen-derived fuels. Most studies focused on the social/market aspect of diffusion, with some applying a household [8], community [9], or market lens [10]. However, these do not offer a deeper understanding of the socio-technical challenges and system factors necessary to fully appreciate how the diffusion of a new fuel can go from the first pilot to a functional niche market. Studies which offer a deeper market lens usually focus on sustainable development or market performance [11,12].
In terms of indicators for low-carbon transitions which take a wider socio-technical lens, several studies have also been undertaken [13,14]. Williams and Robinson [13] outlined a set of such indicators anchored within the Science and Technology Studies (STS) literature. Other studies have provided a more in-depth look into policy and longitudinal developments, but mostly remained driven by market and policy indicators and have not been specific to the maritime sector [15]. Similarly, Walz and Kohler [14] discuss using the Multilevel Perspective (MLP) (A conceptual framework developed by Frank Geels and others within the socio-technical transitions literature to provide a way of evaluating socio-technical transitions [16,17,18,19]. The framework looks at transitions via three mutually interacting levels through which transitions take place, these being the ‘niche’ where radical innovations can be shielded and nurtured, the established ‘regime’ of routines and ways of working, and the exogenous ‘landscape’ which exerts long-term changes on the regime) to provide interesting insights for the development of market-led indicators to assess sustainability transitions and offer indicators for ‘actors’ and ‘complementary sectors’. However, even though eco-innovations and alternative fuel adoption are related, they are not equivalent processes. Consequently, care should be taken when adapting such approaches to hydrogen and ammonia, since a fuel transition has a more pronounced focus in areas beyond innovation. Some such insights relating to actors and networks are areas where frameworks such as work on the internal dynamics of ‘protective spaces’ [20] and the geography of sustainability transitions [21] can complement the MLP. Other frameworks such as the Maritime Sustainability Transitions Framework (MarSTF) (The MarSTF framework is based on the idea that the MLP is a useful heuristic to study socio-technical transitions in shipping, but in order to offer a deeper appreciation of how such transitions can unfold, the framework is expanded with notions of spatial and non-spatial proximity [22] and insights from the behaviour of niche actors [6]) [6,23] further highlight the deeper appreciation of the role of geography and actors in a fuel transition.
Several studies have outlined the role of local conditions for the successful adoption of radical innovations in transport [24,25,26]. These studies highlight the relevance of complex sets of regional factors in mobility system innovation dynamics. Some of these studies consider wider social norms and provide research frameworks which include qualitative data-gathering through interviews [24,26], but none give the deeper socio-technical analysis that is necessary to provide a better understanding of long-term diffusion processes. Within the maritime sector, multiple studies have emphasised the role of spatial factors in terms of their impact on radical technology diffusion [27,28,29], but no specific study has looked at these issues in-depth through a comparison of factors which can make certain localities favourable. This lack of analysis is also evident in empirical studies focusing on the UK.
Regarding the second research gap concerning the adoption of hydrogen and ammonia as energy vectors in the UK, most studies undertaken apply a technical or economic perspective to ascertain the suitability of ammonia [30,31,32] or hydrogen [33,34] in a certain locality or under specific criteria. According to most research into economic and market aspects, such a transition is in the form of reports [2,7,35,36], with significantly less in the form of academic papers [37,38,39,40]. The main area of focus tends to be policy and economic factors, with only a few studies exploring socio-technical factors relevant for a hydrogen/ammonia transition [37,38,40]. With regards to the work on shipping, Lloyd’s Register (LR) and UMAS [7] outlined possible transition pathways in shipping, including some initial insights on hydrogen and ammonia, but the study does not offer UK-specific insights. Similarly, the Royal Society [35] provides interesting insights on the development of policy options and general conditions for ammonia adoption in the UK but does not offer a detailed analysis of the maritime sector.
Hansson et al. [37] offer some more systems-based insights regarding hydrogen and ammonia adoption as marine fuels, but do not focus on geography, or the UK, and provide only limited insights on the role of actors. From the perspective of geography and identifying the most suitable sites for ammonia and hydrogen adoption in the UK, E4tech and UMAS [2] provide the most detailed analysis of ‘clusters’ for the adoption of such fuels in the maritime sector. However, the study lacks granularity in analysing specific local factors (e.g., local endowments) and has a principal focus on technical and market drivers. Consequently, it can be concluded that there is a lack of insights into socio-technical factors that can be used to identify the most suitable sites for the adoption of hydrogen and ammonia as marine fuels in the UK.
3. Methods
The indicators presented in this paper are informed by previous work on transition indicators. To develop the indicators used for this study, several relevant academic sources within the sustainability transitions academic tradition related to energy transitions were compiled (Table 1). The compiled work was used as a starting point for the creation of a heuristic conceptual framework based on the MLP [18]. Each of the outlined approaches was mapped according to established MLP categories to identify potential guidelines for the creation of relevant indicators. Care was taken to identify relevant empirical and theory-building MLP work, with a focus on the specific areas of policy and actor/network interactions [41].
Table 1.
Comparison of relevant conceptual heuristics for indicator development.
The development process was informed by work on eco-innovation indicators by Walz and Kohler [14], as well as the broader understanding of the ‘geography of sustainability transitions’ [21]. The ‘regime’ level dynamics were further explored at the ‘niche’ or ‘protective space’ level by applying insights from Smith and Raven [20] to understand what possible local actor/network interactions might additionally facilitate successful hydrogen/ammonia adoption. In addition, the MarSTF framework, a heuristic developed from the MLP and previously empirically applied to the study of fuel transitions in shipping, was used to gather empirical insights on marine indicator application [23].
The compiled approaches from Table 1 were compared, and through a process of elimination and iteration with emphasis on the relevance of hydrogen/ammonia adoption, the approaches were reduced to a heuristic conceptual framework outlined in Figure 1. The developed MLP approach emphasises the role that actors, networks, and their relative proximity to various resource endowments (e.g., renewable energy, innovation clusters, energy producers, etc.) can play in the creation of viable niche markets for a novel fuel.
Figure 1.
Factors influencing adoption of hydrogen and ammonia in a MLP perspective.
The indicators are focused on a combination of national, regional, and international scales to ascertain various relevant aspects for a certain area to be suitable for the early adoption of hydrogen and ammonia as marine fuels. The developed framework was applied to the top 50 key international and domestic ports in the UK based on their ranking in 2019, in connection to combined sales of heavy fuel oil (HFO) and marine diesel oil (MDO) fuels (The information on sales is gathered from AIS data and various databases). Fuel sale data were used to give a broad estimate of the key ports responsible for most UK energy demand. The ranked ports were grouped into respective ‘clusters’ based on their relative proximity to each other (i.e., if they are in a 50 km radius they are part of a single cluster (the 50 km radius is applied as the measure of proximity with ports to consider them part of a single cluster. The justification is that within such a distance (i.e., 50 km radius or 100 km diameter), it is possible for actors to realistically interact in-person on a daily basis)).
The analysis resulted in 16 clusters (a list of all respective ports and clusters is available in Table A2 of the Appendix A). For each port and cluster, a detailed analysis of various drivers responsible for hydrogen/ammonia adoption on a local, regional, and national levels was carried out to produce a set of detailed sub-indicators for respective clusters based on the following broad guidelines:
- Infrastructure—presence of hydrogen and ammonia bunkering infrastructure.
- Policies—presence of policies to support the adoption of hydrogen and ammonia.
- Actors/networks—presence of key actors and networks facilitating the adoption of hydrogen and ammonia.
- Local energy demand—existence of other energy demand sources for hydrogen/ammonia.
- Shipping niches—existence of shipping niches for the adoption of hydrogen and ammonia.
For each of these indicator groups, detailed sub-groups of indicators were developed to provide the necessary granularity for indicator values for each cluster (a detailed list of all indicator values per cluster and per indicator type are available in Table A1 of the Appendix A). The detailed outline of the different criteria used for each indicator are available in Table A3. The data used to add the numbering values to the indicators are based on a combined qualitative and quantitative analysis.
The quantitative analysis mostly concentrated on automatic identification system (AIS) maritime traffic and port fuel sale data for UK ports and ships calling at a particular port, which was then used to approximate the level of port activity. The data on port calls are used to approximate domestic and international shipping traffic. The data are based on the port calls by ships at UK ports in 2019, which are broken down by the number of port calls, fuel demand, and the mapping of vessel types. The aim of this step in the process is to identify the key UK port clusters by energy demand and to separate these by the types of vessels calling at those ports (In addition, the data were used to rank the UK ports by port HFO sales. The top 100 ports by HFO sales were identified and the top 50 were grouped into specific ‘clusters’ as outlined in the results. Ports which were within the top 100 but not top 50 were also added to already defined clusters). Further quantification was undertaken later in the preparation of the indicators (Table A3). For example, several indicators for ‘shipping niches’ are based on volumes of HFO sales within that port cluster in order to ascertain the possible volume of local energy demand, which could translate to hydrogen and ammonia demand in the future. In addition, multiple sources of statistical data were used to develop sub-indicator groups outlined in Table A3 (e.g., Office for National Statistics, International Energy Agency (IEA), National Grid, etc.).
The qualitative data used in the analysis are based on a documentary analysis of existing policy documents, annual reports, and news articles relating to the adoption of hydrogen and ammonia as marine fuels in the UK and around broader relevant decarbonisation strategies. These data were triangulated with semi-structured interviews with key actors who had first-hand knowledge of developments pertaining to hydrogen and ammonia in the UK. The interviews were used to collect qualitative data to explore in-depth the usefulness of indicators in three case studies. The interview approach was based on insights from Creswell [42], and the preliminary research was used to initiate a snowball sampling method [43,44]. This approach is in line with a principal aim of process-tracing, which is to identify key actors who had the most involvement in ‘processes of interest’ [44]. The results were scored on the relevance of specific issues for the adoption of hydrogen and ammonia. Based on this review, the indicators were modified to better reflect stakeholder concerns and were then used by the authors to score the clusters. The scoring process included an internal review by the authors. The scoring algorithms are given in the Appendix A (Table A3). This study can be considered a first step in the development of socio-technical indicators for marine alternative fuel adoption. Further studies in this field could benefit from the application of the Delphi method [45] or other similar approaches to increase analytical depth.
4. Results
The key findings from the indicators analysis are given in Figure 2 and Figure 3. Figure 2 shows the geographic location of the 16 clusters as well as that of the combined top 50 ports. As can be seen from Figure 2, the clusters and ports are relatively evenly distributed through the UK, showing that all constituent nations and large regions of the UK have the potential to be early adopters of hydrogen and ammonia as marine fuels, but some have a higher potential based on scoring. It is interesting to note that most ports do form clusters, with only a small number of (i.e., less than five) top ports falling outside of a cluster.
Figure 2.
Map of all clusters for hydrogen/ammonia adoption in UK with associated accumulated indicator values.
Figure 3.
Breakdown of key hydrogen/ammonia indicators by port cluster.
4.1. Narrative Results—Case Studies and Interviews
4.1.1. Case Choice
To study indicators in more depth and review the preliminary indicator findings, three qualitative case studies were developed. The case studies apply documentary evidence in combination with interview findings. The interview data are analysed through a process-tracing approach [46,47]. The case studies were chosen based on the scores obtained in the preliminary indicator analysis. In addition, special consideration was given to ensure broad geographic distribution and diversity [6], whilst favouring cases which can provide more ‘generalized inferences’ [48] and provide in-depth focus, which can represent the broader cluster population [49]. The chosen cases can be considered ‘maximum variation cases’ [48] due to their geographic diversity, type of port traffic, and local socio-economic features. As can be seen from Table 2, the cases offer a significant level of variability based on local characteristics across indicators, but also offer significant overlap to allow for more generalized inferences.
Table 2.
Comparison of 3 case studies—maturity of indicator group developments.
4.1.2. Case 1—Orkney Isles
Description: The case study is focused on the Orkney archipelago in the northeast of Scotland. The case scored very highly in the initial rankings, especially with respect to actors, networks, and energy. The geographic position in the northern end of Scotland provides a unique example of where, under the right policy conditions, green hydrogen usage could become competitive [50]. In addition, evidence suggests that the relatively remote and decentralised local regime has created unique local conditions for hydrogen adoption [51].
Infrastructure: Several hydrogen projects have been planned on Orkney or are already producing green hydrogen. The first of these was the Orkney 0.5 MW ‘Surf ‘n’ Turf’ project on Eday [52], with the first hydrogen from tidal energy and community wind power produced in 2017 [53]. Since this initial demonstration project, at least six additional projects have been under development or are already producing hydrogen (based on cross-referencing information provided by the ‘Orkney Hydrogen Strategy’ [52], with other sources). Orkney has no previous existing grey hydrogen or ammonia infrastructure, and all current projects and project plans are for green hydrogen. In addition, several types of storage facilities for hydrogen have been under development, with the first ones becoming operational in 2017 [52]. The islands are well known for their perceived small-scale domestic wind and tidal power [54] endowments. Furthermore, local perceptions of solar power usage are also well established. However, the Orkney electricity grid has limited potential for the export of tidal power to mainland Britain [54]. This limitation has been linked to the desire for the exploration of possible local uses, in line with local policy [52] and highlighted as ‘over production of energy’ [55]. Concerning ammonia, there has been less traction; in 2021, a proposed ammonia plant was under the early stages of planning/development [56].
Policies and finance: most relevant policies relate to national and devolved government level policies. Local actors played an important role in informal developments through facilitation [52]. In 2019, the Orkney Islands Council adopted the ‘Orkney Hydrogen Strategy’ [52], highlighting the promotion of the production and development of green hydrogen usage on the islands [57]. On a devolved level, there are several relevant policies/guidelines such as the ‘Local energy policy statement’ and the related ‘The future of energy in Scotland: Scottish Energy Strategy’ [58], including other UK and Scottish national strategy and policies (Examples: ‘Clean Growth Strategy’ [59], ‘Industrial Strategy’ [1], ‘Clean Air Strategy’ [60], ‘25 Year Environmental Plan’ [61]). It is interesting to note that future marine targets have also been highlighted by the Islands Council [52] and outlined as possible market opportunities.
Actors/networks: The interviewees expressed the importance of local actors in the transition. However, little distinction seems to have been made between actors and networks, with interviewees generally describing the two interchangeably. The Orkney Islands Council (OIC) has supported several projects as a partner, including the ReFLEX project in 2019 [55], the Surf ‘n’ Turf project in 2017 [62], and others. The European Energy Marine Centre (EMEC) played a vital role for Orkney in facilitating local developments related to hydrogen infrastructure by identifying potential developmental opportunities, setting developmental expectations, and facilitating pilot projects, with Surf ‘n’ Turf being the primary example. Additionally, the local community in Orkney seems to be perceived as significantly attentive to climate change and to the related utilisation of local renewable energy resources. There is a local uptake of over 500 domestic scale wind turbines [63]. The creation and vocal presence of organisations such as the Orkney Renewable Energy Forum (OREF) [63] further supports this. In addition, from an energy perspective, companies such as Orkney Hydrogen Trading (OHT) and the shareholder ITM Power, are also present in Orkney [64].
Energy demand/local characteristics: It seems that most current demand for renewables is met locally to power homes and local businesses. There is potential for Orkney to use hydrogen for district heating [65]; this has been piloted on Shapinsay island through the ‘Big Hit’ project [66]. Some potential suggestions concerning the usage of renewable energy for powering farming equipment and fishing vessels have also been suggested. However, the combination of a large potential for renewable energy production and a weak grid connection to mainland Scotland seems to be a key driver in developing hydrogen as a means of energy storage and the consequent use of hydrogen locally. Hydrogen ferries have also been considered as a solution for Orkney.
Shipping niches and other: The key niche is the regular ferry connections between the Scottish mainland and the Orkney isles. This liner route, due to the relatively small energy demand and regular service requirements, was outlined as a potential key example of a possible hydrogen-fuelled ferry connection. However, it was never fully realised, due to regulatory obstacles and functions through development in the ‘HySeas III’ project; it is currently used as an electric ferry connection, where hydrogen is used for shore-side electricity storage [67].
4.1.3. Case 2—Dover
Description: The case is centred on the Port of Dover and on traffic emanating from the port. Unlike the other cases, the key element of this case is the heavy reliance on international shipping, in particular the Dover–Calais ferry route. Additionally, the case is in relatively close proximity to the Greater London conurbation and in theory could benefit from hydrogen supply developments in the Greater London area.
Infrastructure: Infrastructure developments are least developed when compared to the other two cases, with no significant development of hydrogen and ammonia within the cluster. The most significant hydrogen developments are several pilot fuel cell buses within Greater London [68]. In Dover, challenges were identified in relation to the limited local availability of hydrogen for future maritime use.
Policies and finance: Within Dover, the existence of the Calais–Dover liner ferry route is the key potential area for hydrogen and hydrogen-derived fuel usage. Policies which can facilitate this development are currently not significantly established. Additionally, it has been mentioned in interviews that investment for bunkering infrastructure and a supply of hydrogen would be key to create such opportunities. Most of the policies in place are at the national level and there exist concerns regarding differences between UK and EU regulations, and regarding how this might affect future bunkering procedures.
Actors/networks: The council and county authorities in Dover do not seem to be significantly involved in promoting hydrogen usage. However, the presence of some of the largest ferry operators in Europe within the port creates interesting opportunities for knowledge diffusion and the future adoption of alternatives such as hydrogen and ammonia.
Energy demand/local characteristics: The case study reveals that there is a sizeable energy demand from significant population centres around Greater London and Kent, and there are potential land-based synergies with public transport, heavy goods vehicles (HGVs), and district heating. The Isle of Grain generates 1326 MW annually from natural gas [69], supporting industry and domestic electricity demand. From 2019 to 2020, a feasibility study for the usage of the facility to produce ‘decarbonised hydrogen’ for supply to London and southeastern England was undertaken [70]. Additionally, a limitation on the local electric grid in Dover could open other avenues for hydrogen uptake.
Shipping niches and other: The case study reveals that there is a significant energy demand from liner ferry routes in Dover. The unique geographic position of Dover offers opportunities to become a hydrogen and ammonia fuel-bunkering hub for various vessels passing from the English Channel to the North Sea and vice versa, including containerships and cruise ships. The main challenge for the route is the international nature of the Dover–Calais route, which poses some regulatory challenges for a transition to hydrogen and ammonia.
4.1.4. Case 3—Solent-Isle of Wight
Description: The case is in many ways the most developed in terms of maritime infrastructure and includes elements of the other two cases, as well as unique local conditions. Similar to Orkney, the case includes the Isle of Wight with its local communities; here, there is renewable energy potential through solar energy and liner shipping short sea routes to mainland Britain. Like Dover, it includes liner shipping routes to France and Spain from Portsmouth. In addition, the Port of Southampton includes significant container and chemical tanker traffic as well as significant local oil and gas refining due to the presence of the Fawley Refinery [71,72].
Infrastructure: In many ways, this case area has the most developed infrastructure out of all three case study areas, which includes the Fawley Hydrogen Plant [71,72], the solar plant on the Isle of Wight [73], and high renewable energy endowments. These developments are complemented with an existing refining capacity around Southampton and large international ports in Southampton and Portsmouth. However, perceptions persist amongst some that the local production of hydrogen might not meet the necessary demand and that long-term supply remains uncertain.
Policies and finance: Locally, there have been moves within Portsmouth, Southampton, and on the Isle of Wight to create climate policies and net-zero plans in all localities. In this respect, the case study has been more progressive towards climate change issues compared to the Dover case study, but it seems that these plans did not translate to the same mobilisation of resources and actions towards hydrogen and ammonia, as was the case for Orkney, apart from some utilisation of government grants such as the ‘Zebra Fund’ for electric buses [74]. Similarly, uncertainties remain surrounding financing the required infrastructure and associated developments for hydrogen and ammonia.
Actors/networks: Compared to the other case studies, the Solent has the largest concentration of various relevant actors due to the large shipping clusters in Southampton and Portsmouth, in addition to the international shipping routes, and liner ferry shipping routes to the Isle of Wight. Shipowners and small-scale operators have played a key role in facilitating new technology uptake, whilst some promotion of hydrogen also came from the Isle of Wight Council, with some perceptions showing MCA approval process issues as contributing to the slow-down of hydrogen adoption, with some associations (i.e., EMEC) and local universities supporting local research and development.
Energy demand/local characteristics: There is also a perception amongst some that the electricity grid provisions on the Isle of Wight are limited and that such limited provisions make the electrification of the local ferry industry difficult; this is further compounded by the electrification issues identified when using electric buses on local rural roads. However, there is significant local solar potential. Similarly, there are perceived limitations to onshore wind from perceived local opposition.
Shipping niches and other: The usage of hydrogen might pose benefits compared to electricity from a technical and bunkering perspective. In addition, the local ferry routes between the mainland and the Isle of Wight provide an interesting niche for the usage of hydrogen and ammonia ferries. Other potential niches which could be explored include the substantial cruise industry in the Solent and cruise ferries operating internationally to the French coast.
4.1.5. Case Comparison and Conclusions
The three cases can be considered quite different and when looked at in detail, they provide an interesting overview of the situation regarding hydrogen and ammonia production, demand, and possible usage within the UK (Table 3). All three cases show a general tendency towards the development of more usage of hydrogen as a marine fuel and indicate that using hydrogen and ammonia as fuels is a potentially viable option. As can be seen from Table 4, the cases implied the relevance of local actors in developing the right conditions for hydrogen, which in combination with local renewable energy potential, played a key role in developments. Similarly, the cases implied that the existing grey infrastructure for hydrogen and ammonia might potentially be less relevant for developments than general decarbonisation plans and renewable energy potentials. In all cases, as was outlined by several interviewees, the role of the regulators, in this case the MCA, was shown to play a significant role in stifling development. In particular, regulators could significantly hinder developments by showing opposition to the adoption of hydrogen and ammonia due to perceived safety issues [75].
Table 3.
Key attributes of the 3 case studies.
Table 4.
Key changes to indicators based on case study findings.
The findings from the narrative approach were utilised to further refine the findings from the quantitative results (Table 4). Based on these insights, the actors group and networks group were combined due to the findings showing a lack of any perceived difference in relevance between the two concepts. In addition, several local metrics such as the importance of the electricity grids, population density, and air quality issues were also identified by interviewees and consequently integrated in the indicator sub-groups.
4.2. Quantitative Results
The narrative findings were used to further refine the information used to develop the indicators. The quantitative results, as outlined in Figure 2, show the overall combined numerical indicator values for the adoption of such fuels in the UK. As can be seen, the clusters are evenly distributed through the UK with large coastal port clusters in many areas such as Harwich/Felixstowe, Southampton/Portsmouth, Humber, Glasgow also corresponding to large maritime clusters for the adoption of hydrogen and ammonia. However, other areas such as Orkney and Shetland also feature prominently, even though they do not have large industrial clusters; they are prominent due to their diverse local renewable energy potential, groupings of actors (i.e., Orkney), and a developed local maritime niche.
Three clusters, these being ‘A’, ‘K’, and ‘O’, can be considered as having the largest potential for the early adoption of hydrogen and ammonia (i.e., cumulative indicator value of over 15) (For each indicator category, cumulative figures are given without additional weighing. Specific weighing was performed implicitly in the sub-indicators for each category (Table A3) based on the discussion between actors and the assessment of information from the collected interviews and documentary data). These clusters are very diverse; whereas ‘A’ is mostly characterised by fishing and local ferry connections, ‘K’ and ‘O’ are large international clusters with significant container traffic, but also international ferry routes. Cluster ‘O’ is in many ways the most diverse, as it has container traffic, chemical tankers, ammonia production, hydrogen production, as well as local domestic ferry connections (i.e., to the Isle of Wight) and a cruise terminal.
As can be seen from Figure 3, there is significant diversity in overall indicator values for different clusters, but also in the proportion of certain indicators being strongly present in certain clusters. Some clusters such as ‘H’ have a high ‘infrastructure’ ranking due to the significant presence of existing hydrogen and ammonia production facilities but rank quite low in the actors and networks category. Other clusters such as ‘A’ score quite highly in the actors the networks category; even though they have relatively low shipping traffic and a significantly smaller industrial base, they have many hydrogen/ammonia actors present. The evidence given is based on indicator scoring undertaken at the cluster level; as can be seen from Figure 4, the indicator values tend to be lower for clusters with less ports if the scoring is performed at a port level. This is to be expected, since such scoring rewards clusters with more ports. However, due to the close proximity of ports in a cluster and the assumed close developmental co-dependence of hydrogen/ammonia infrastructure, this study gives preference to cluster-level scoring.
Figure 4.
Scoring at cluster level vs at port level—ranked by number of ports.
5. Conclusions
The previous section outlined key qualitative and quantitative findings of this paper. What these results seem to imply is that socio-technical transitions can be used to offer valuable novel insights into ascertaining the viability of various geographic sites for the early adoption of hydrogen and ammonia as marine fuels. The qualitative findings show that rich narratives obtained from interviewees can help to highlight unique local circumstances, which make certain sites attractive for the adoption of alternative fuels and can consequently be used to better outline quantitative indicators. The combined indicators used in this paper are loosely based on the MLP and apply it as a heuristic to guide the analysis; however, only certain aspects of sustainability transitions theory which are applicable in this specific context are utilized.
When looking back at the research question raised in this paper, the indicators overall show the heterogeneity of sites for the adoption of hydrogen and ammonia across the UK. In addition, the richness of local attributes in a great many sites was observed, and some areas of lower industrial density offer unique local opportunities, such as domestic ferries and fishing vessels, whilst also allowing for the utilisation of renewable energy resources. Future analyses should consider the interaction between UK sites with those overseas, especially in neighbouring countries such as Ireland, France, Netherlands, and Spain. With the growing pressure on decarbonisation and the need for more freight and passengers to be moved around by land compared to air, such routes potentially offer interesting new possibilities for decarbonisation. Finally, in the longer term, understanding how these indicators can be linked with transition pathways for shipping, made more granular, and potentially more accurate remains an area for further study.
Author Contributions
Conceptualization, D.B. and T.S.; Validation, N.R.; Formal analysis, D.B.; Investigation, D.B.; Resources, D.B.; Writing—original draft, D.B.; Writing—review & editing, D.B. and N.R.; Project administration, N.R.; Funding acquisition, N.R. and T.S. All authors have read and agreed to the published version of the manuscript.
Funding
The authors would like to express their gratitude to the Centre for Research into Energy Demand Solutions (CREDS) for the funding that allowed for this research. Award reference: 178953.
Institutional Review Board Statement
The study was conducted in accordance with relevant data protection legislation, and approved by the Ethics Committee of UCL (approval date 2020.08.18).
Informed Consent Statement
Informed consent was obtained from all subjects involved in the study.
Data Availability Statement
The datasets presented in this article are not readily available because the data are part of an ongoing study. Requests to access the datasets should be directed to domagoj.baresic@ucl.ac.uk.
Conflicts of Interest
The authors declare no conflict of interest.
Abbreviations
| Abbreviation | Meaning |
| AIS | Automatic identification system |
| CREDS | Centre for Research into Energy Demand Solutions |
| DFDS | Det Forenede Dampskibs-Selskab |
| EIR | Emissions Intensity Ratio |
| EMEC | European Marine Energy Centre |
| EU | European Union |
| H2 | Hydrogen |
| HFO | Heavy Fuel Oil |
| HGV | Heavy Goods Vehicle |
| HSSMI | High Speed Sustainable Manufacturing Institute |
| IEA | International Energy Agency |
| IMO | International Maritime Organisation |
| km | kilometre |
| kV | kilovolt |
| LR | Lloyd’s Register |
| MarSTF | Maritime Sustainability Transitions Framework |
| MCA | Maritime and Coastguard Agency |
| MDO | Marine Diesel Oil |
| MLP | Multilevel Perspective |
| MW | Megawatt |
| NH3 | ammonia |
| OHT | Orkney Hydrogen Trading |
| OIC | Orkney Islands Council |
| OREF | Orkney Renewable Energy Forum |
| R&D | Research and Development |
| RE | Renewable Energy |
| ro-ro | Roll-on/roll-off |
| SGN | Scotia Gas Networks |
| SHFCA | Scottish Hydrogen and Fuel Cell Association |
| STS | Science and Technology Studies |
| SOx | Sulphur Oxides |
| t | tonne |
| UK | United Kingdom |
Appendix A
Table A1.
List of all indicator values for each cluster, broken down by indicator group at cluster level.
Table A1.
List of all indicator values for each cluster, broken down by indicator group at cluster level.
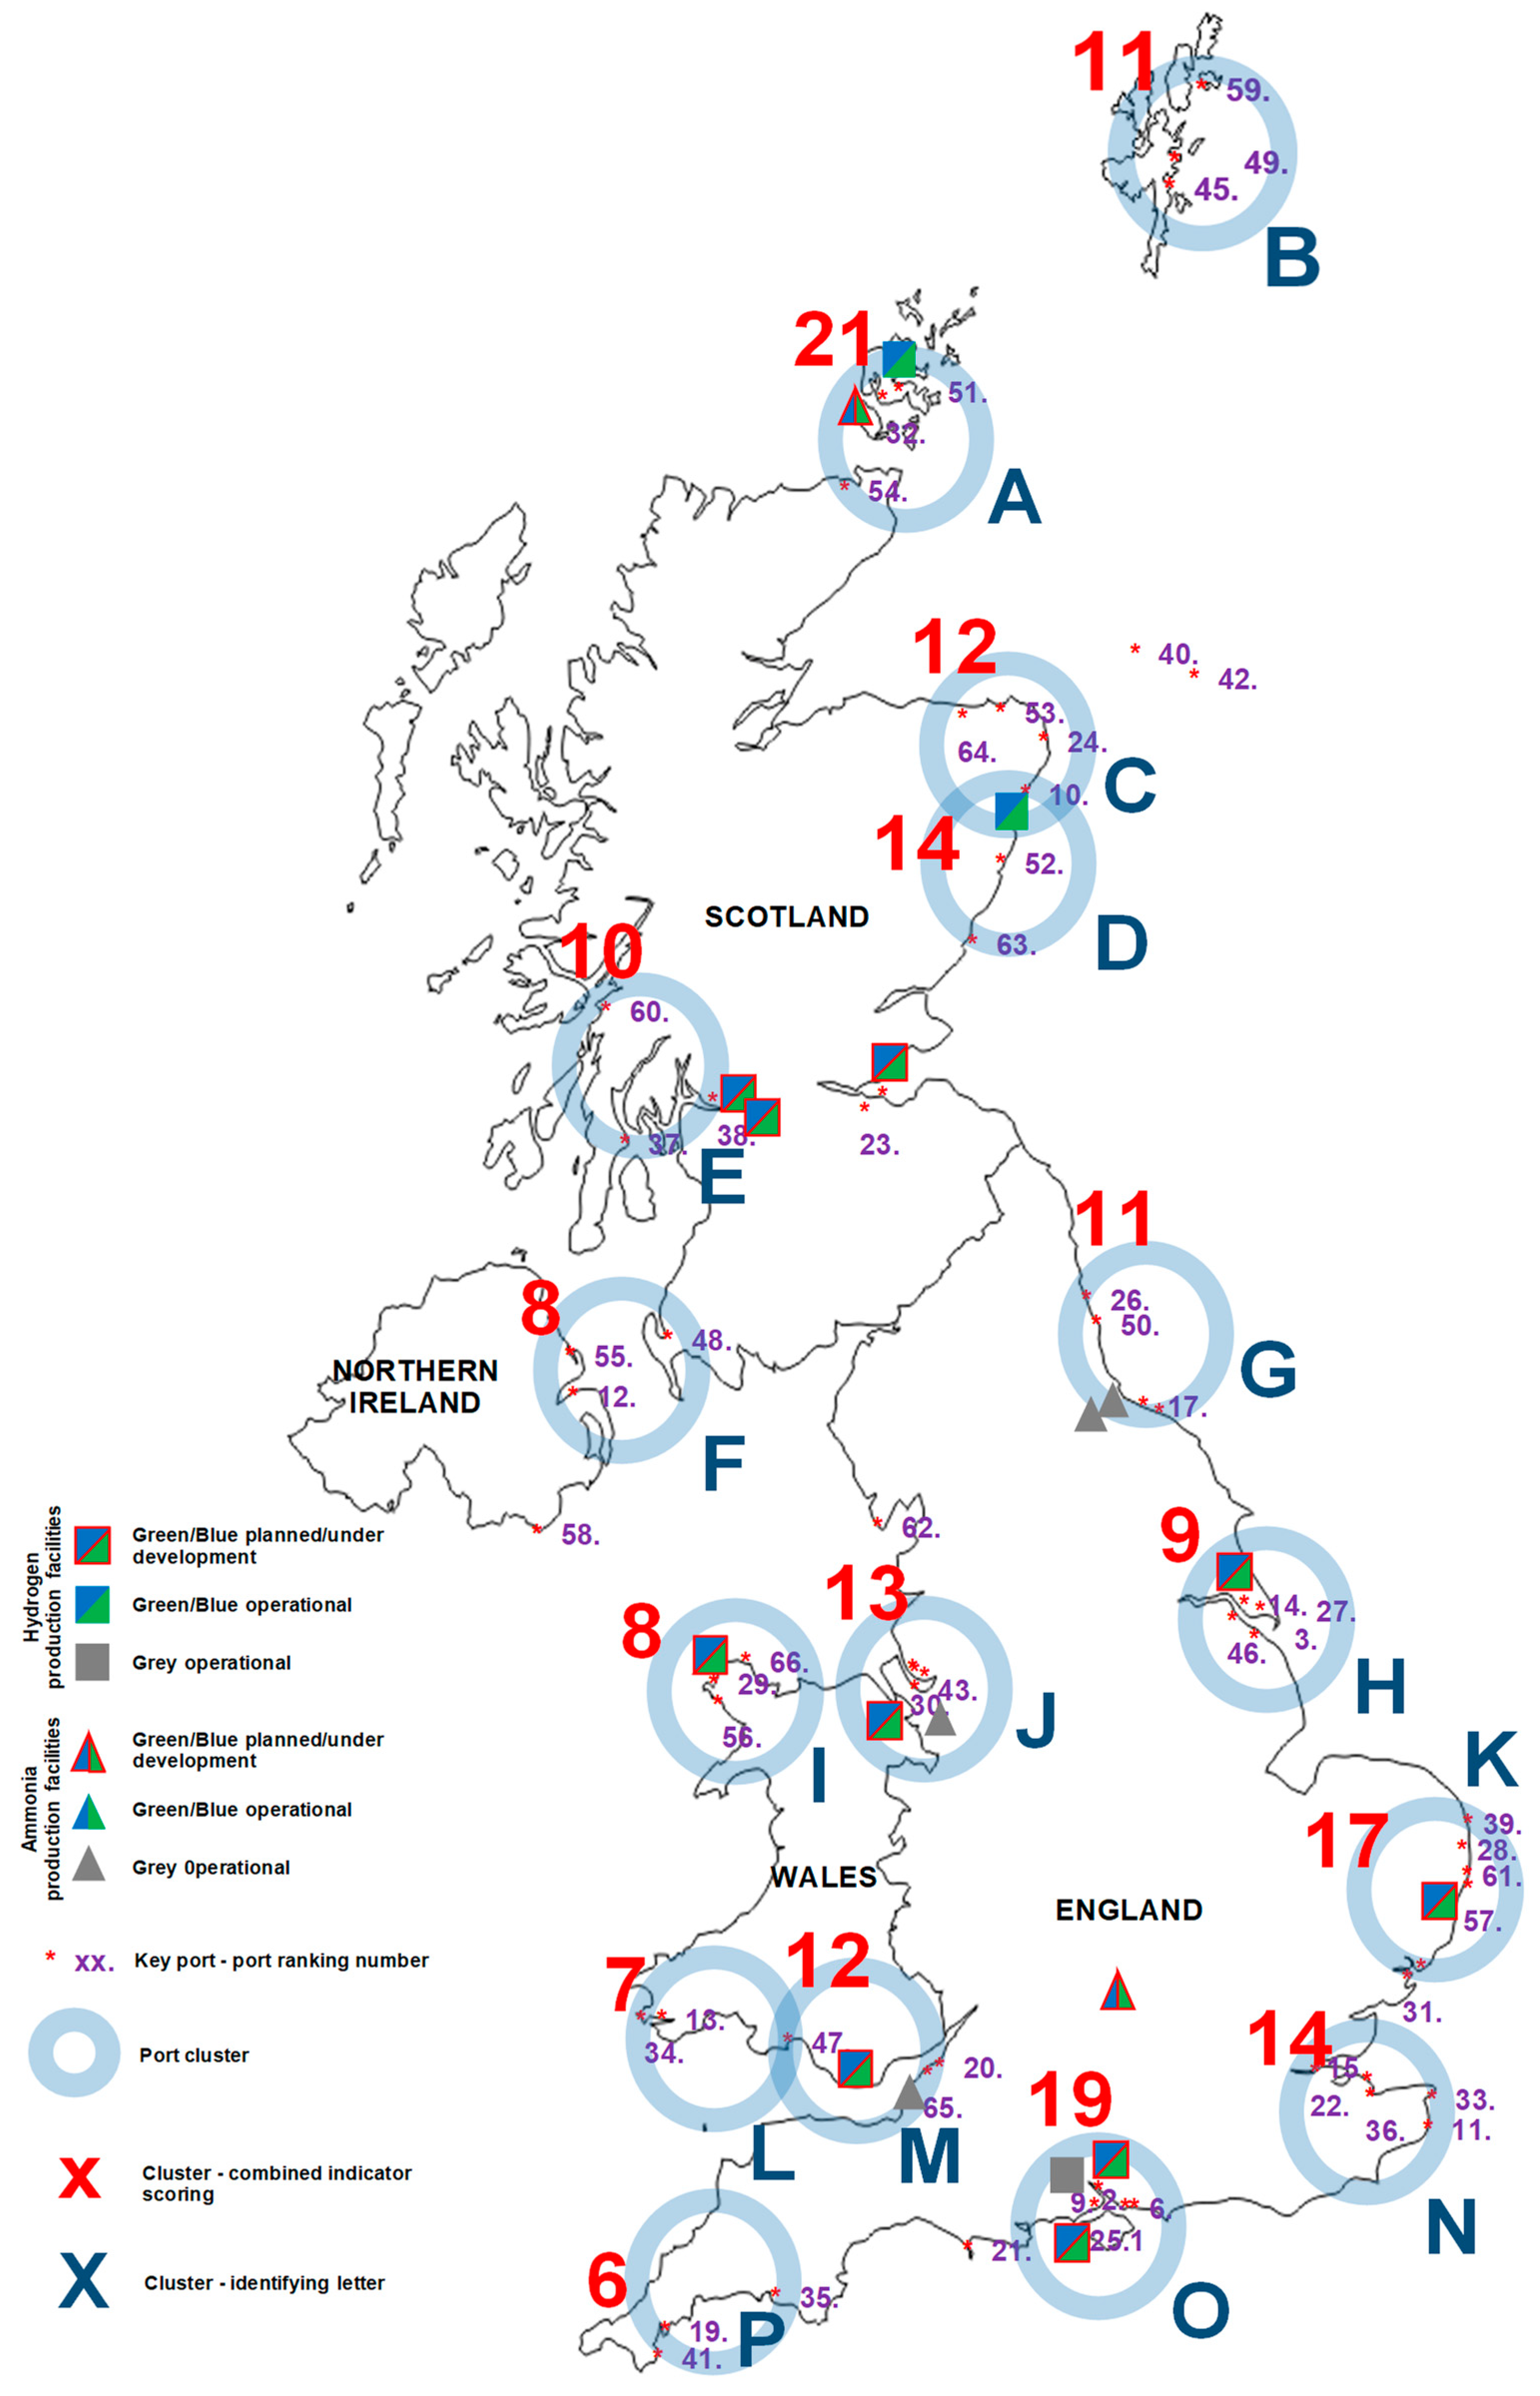
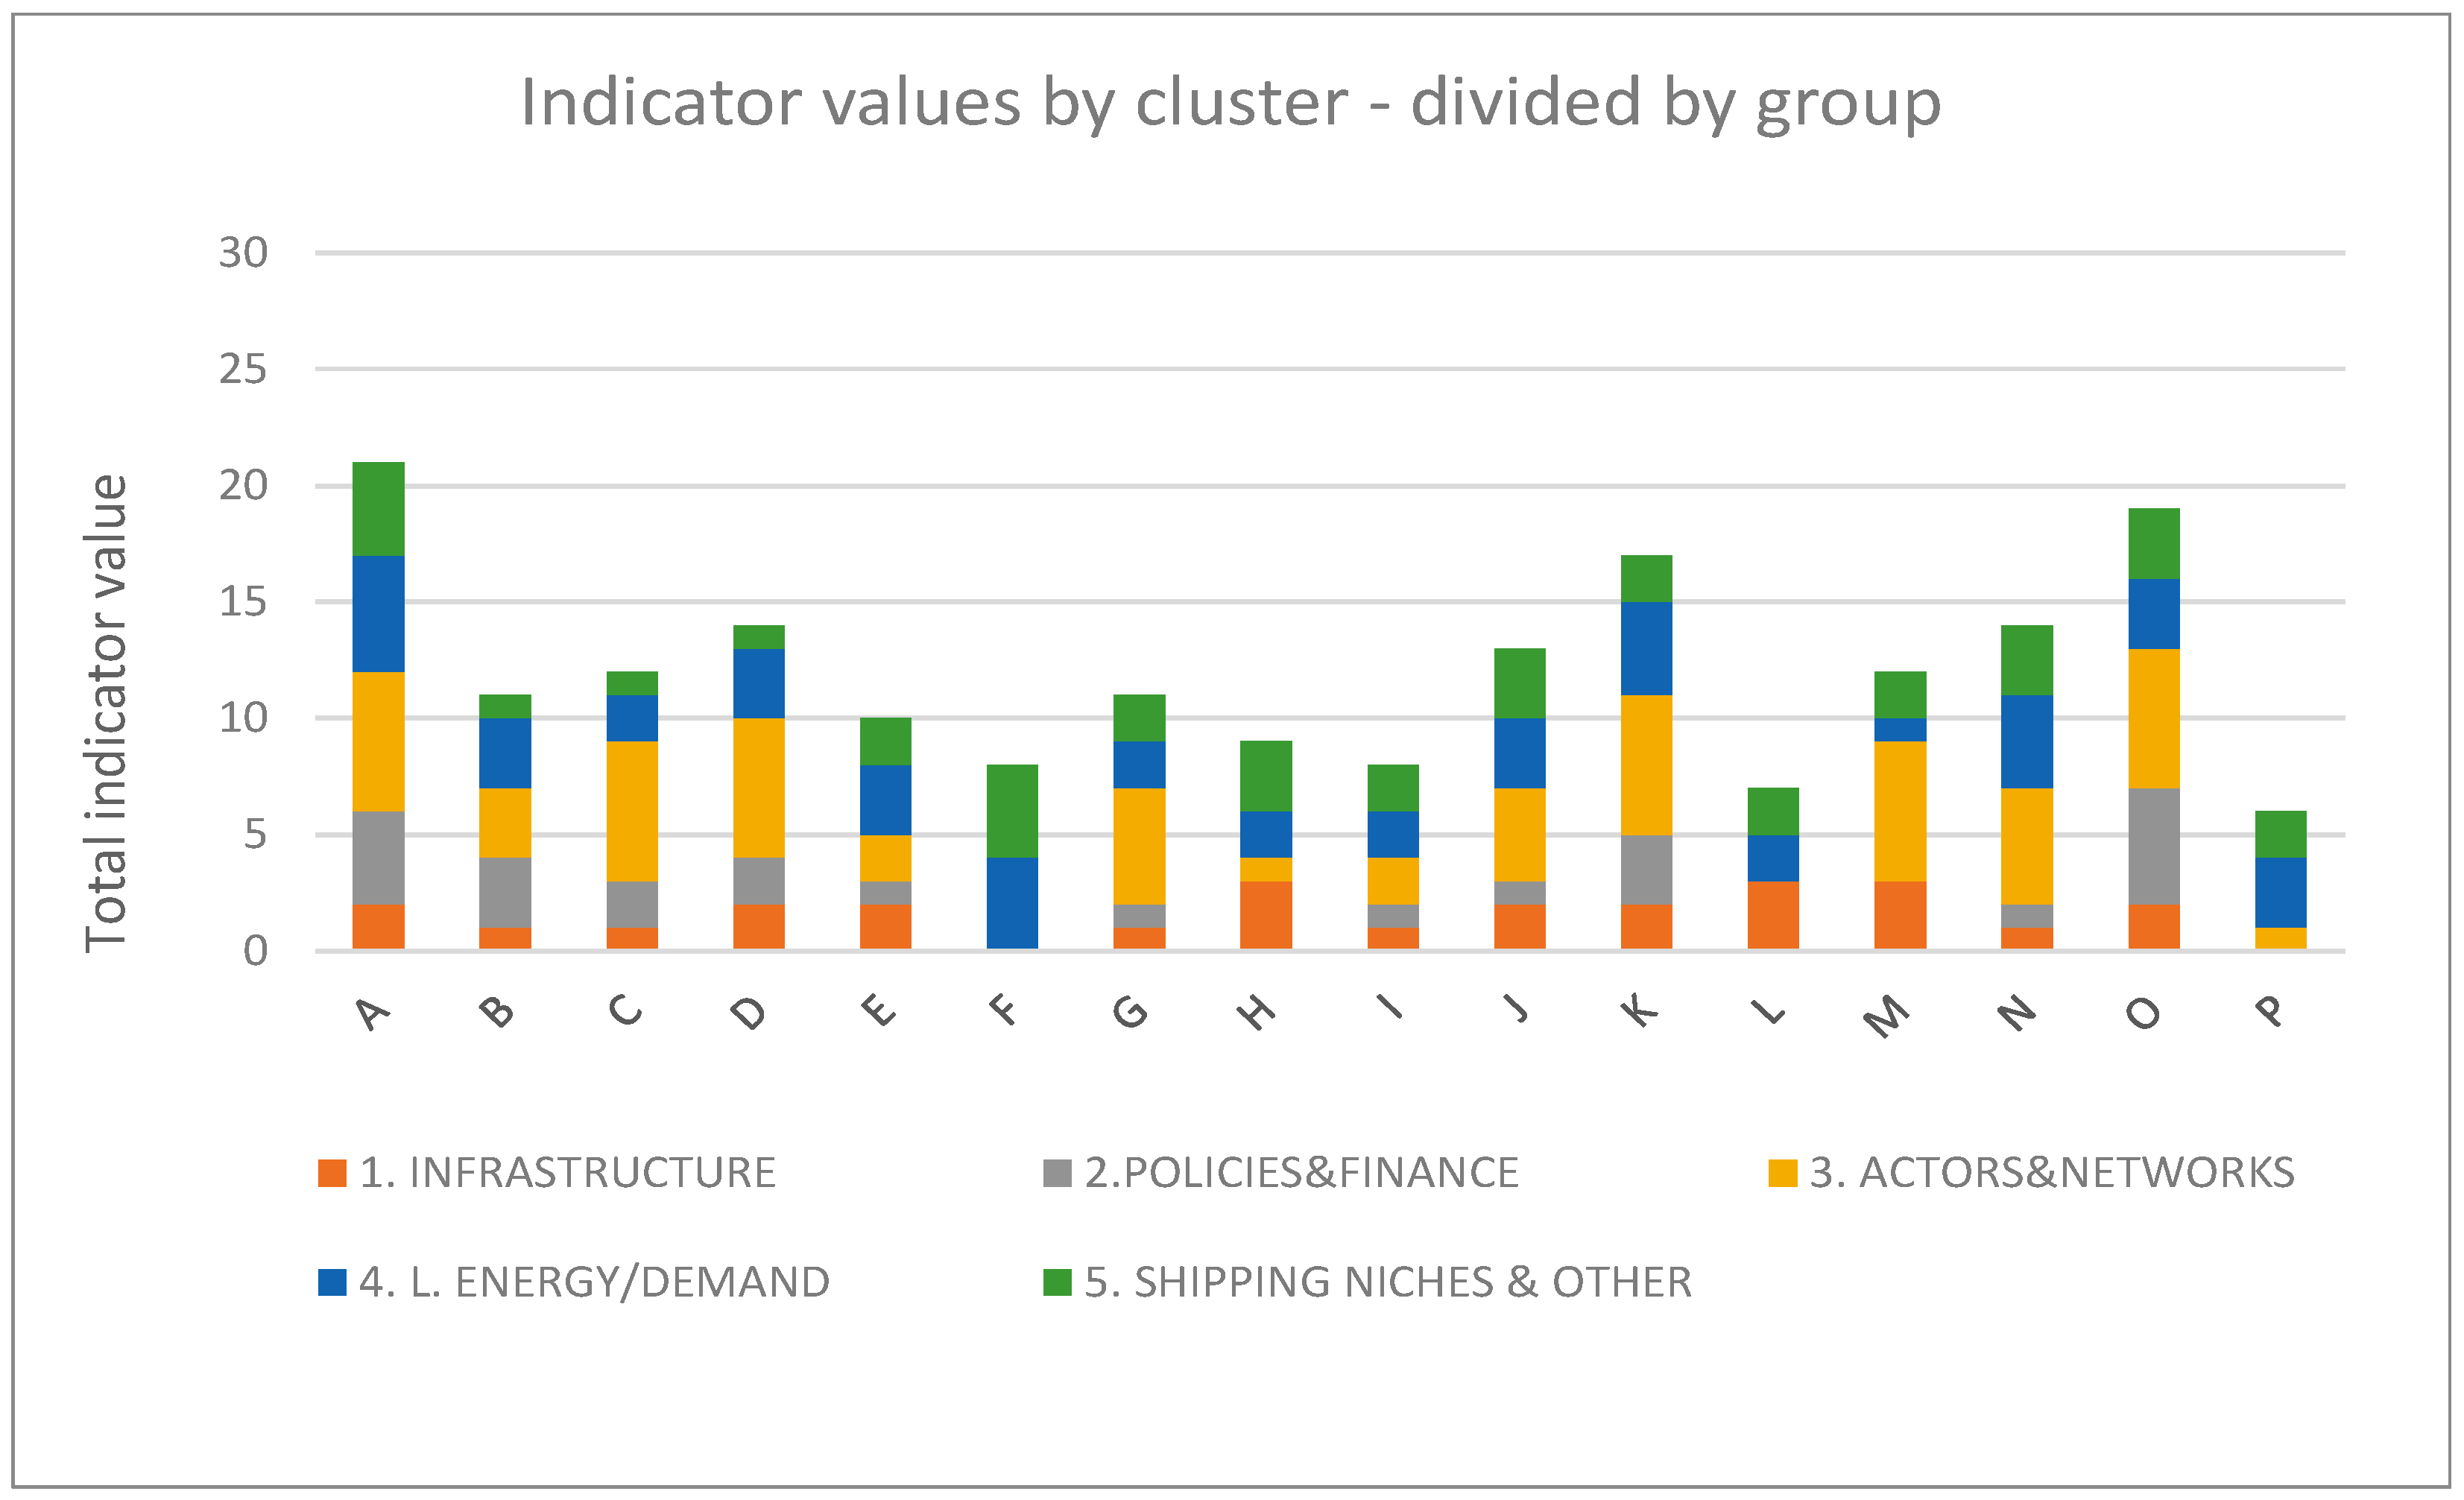
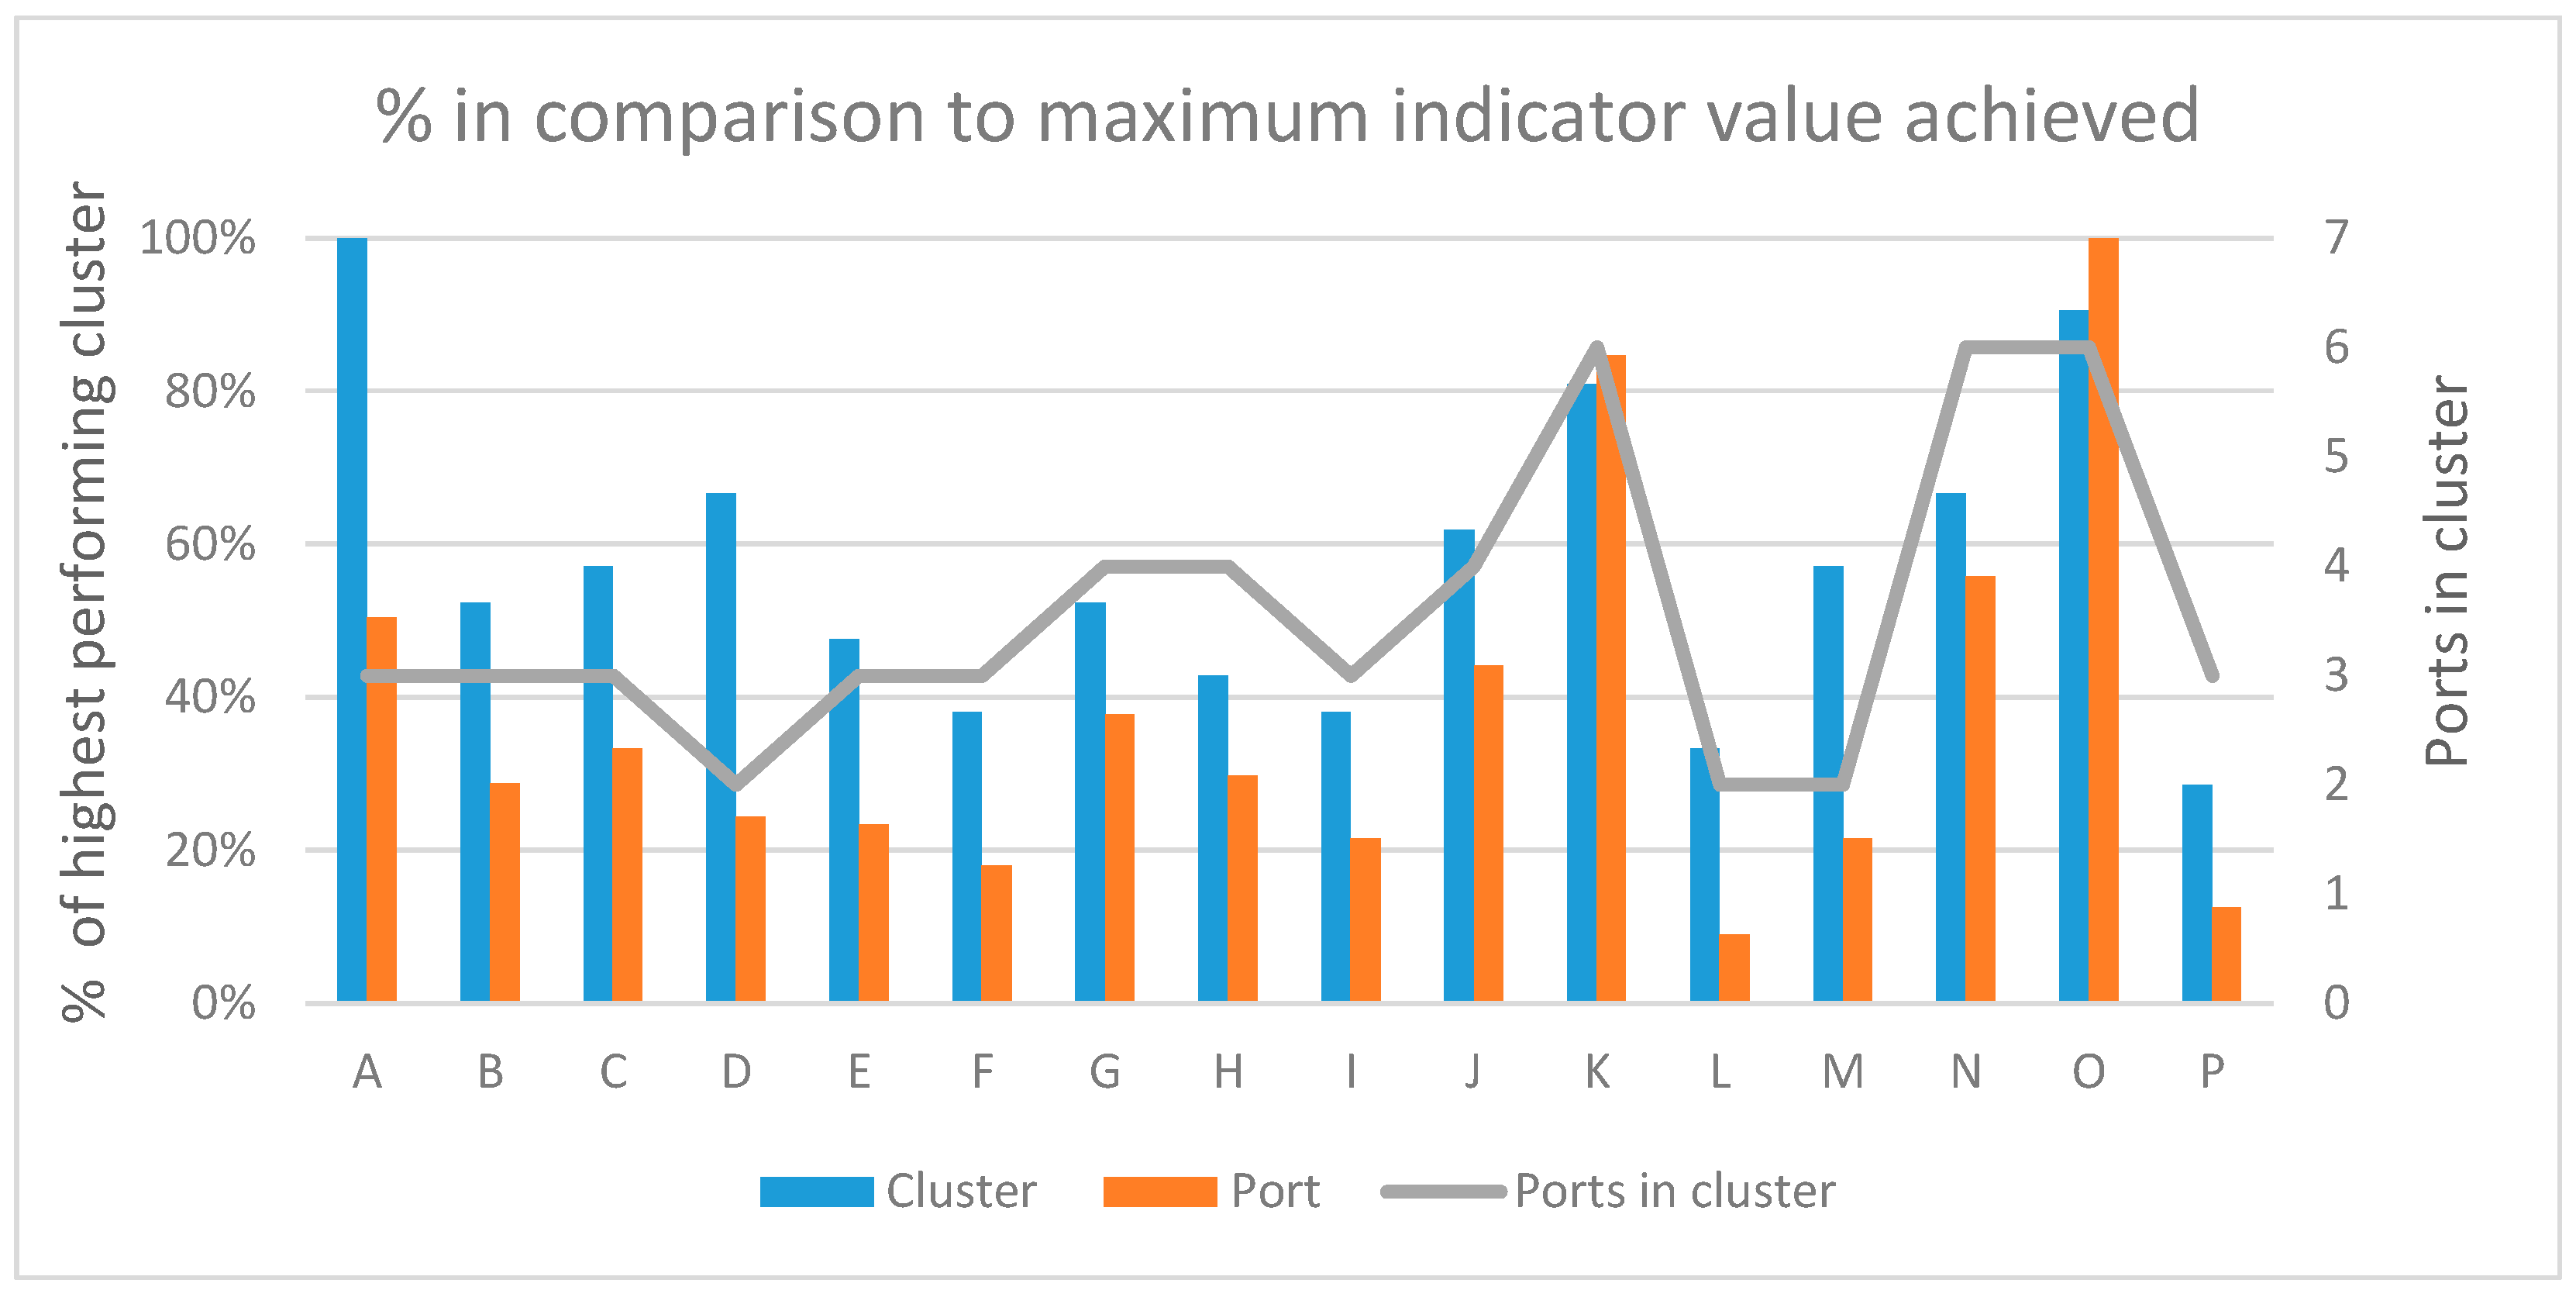
| Cluster | Combined Indicator Scoring—Cluster Level | 1. Infrastructure | 2. Policies | 3. Actors and Networks | 4. Local Energy Demand | 5. Shipping Niches |
|---|---|---|---|---|---|---|
| A | 21 | 2 | 4 | 6 | 5 | 4 |
| B | 11 | 1 | 3 | 3 | 3 | 1 |
| C | 12 | 1 | 2 | 6 | 2 | 1 |
| D | 14 | 2 | 2 | 6 | 3 | 1 |
| E | 10 | 2 | 1 | 2 | 3 | 2 |
| F | 8 | 0 | 0 | 0 | 4 | 4 |
| G | 11 | 1 | 1 | 5 | 2 | 2 |
| H | 9 | 3 | 0 | 1 | 2 | 3 |
| I | 8 | 1 | 1 | 2 | 2 | 2 |
| J | 13 | 2 | 1 | 4 | 3 | 3 |
| K | 17 | 2 | 3 | 6 | 4 | 2 |
| L | 7 | 3 | 0 | 0 | 2 | 2 |
| M | 12 | 3 | 0 | 6 | 1 | 2 |
| N | 14 | 1 | 1 | 5 | 4 | 3 |
| O | 19 | 2 | 5 | 6 | 3 | 3 |
| P | 6 | 0 | 0 | 1 | 3 | 2 |
Table A2.
List of key ports analysed for indicators.
Table A2.
List of key ports analysed for indicators.
| Cluster: | Port Ranking: | Name: |
|---|---|---|
| K | 1 | Felixstowe |
| O | 2 | Itchen |
| H | 3 | Immingham |
| N | 4 | Thames |
| J | 5 | Liverpool |
| O | 6 | Southampton |
| O | 7 | Eling |
| NONE | 8 | Hound Point Terminal |
| O | 9 | Fawley |
| C-D | 10 | Aberdeen |
| N | 11 | Dover |
| F | 12 | Belfast |
| L | 13 | Steynton |
| H | 14 | Hull |
| N | 15 | Tilbury |
| O | 16 | Portsmouth |
| G | 17 | Teesport |
| G | 18 | Tees |
| P | 19 | Flushing |
| M | 20 | Portbury |
| NONE | 21 | Portland Uk |
| N | 22 | Purfleet |
| NONE | 23 | Grangemouth |
| C | 24 | Peterhead |
| O | 25 | Marchwood |
| G | 26 | White Hill Point |
| H | 27 | Withernsea |
| K | 28 | North Cove |
| I | 29 | Holyhead |
| J | 30 | Tranmere |
| K | 31 | Harwich |
| A | 32 | Scapa Bay |
| N | 33 | Broadstairs |
| L | 34 | Milford Haven |
| P | 35 | Plymouth |
| N | 36 | Sheerness |
| E | 37 | Claonaig |
| E | 38 | Greenock |
| K | 39 | Great Yarmouth |
| NONE | 40 | Buchan |
| P | 41 | Porthoustock |
| NONE | 42 | Etrick Field |
| J | 43 | Eastham |
| J | 44 | Heysham |
| B | 45 | Lerwick |
| H | 46 | Grimsby |
| L-M | 47 | Port Talbot |
| F | 48 | Cairnryan |
| B | 49 | Maryfield, Bressay |
| G | 50 | Howdon |
| A | 51 | Hatston |
| D | 52 | Catterline |
| C | 53 | Fraserburgh |
| A | 54 | Scrabster |
| F | 55 | Larne |
| I | 56 | Loch Ryan Pt |
| K | 57 | Orford |
| NONE | 58 | Warrenpoint |
| B | 59 | Bruray Out Skerries |
| E | 60 | Oban |
| K | 61 | Lowestoft |
| NONE | 62 | Barrow-In-Furness |
| D | 63 | Montrose |
| C | 64 | Rosehearty |
| M | 65 | Avonmouth |
| I | 66 | Dulas Bay |
Table A3.
In most cases 50 km is applied as the measure of proximity. This is taken as a rule of thumb and is based on a combination of the fact that within such a distance (i.e., 50 km radius, or 100 km diameter) it is possible for actors to realistically interact in-person on a daily basis due to road and public transport distances involved. Each 50 km radius cluster is taken as the basis for the scoring being undertaken, so more than one port within each cluster may have some of the indicator values. Description of developed indicator groups and sub-groups.
| Indicator Group: | Indicator Sub-Group: | Definition of Sub-Group: | Scoring Algorithm for Each Sub-Group Indicator | Scoring Algorithm at Cluster Level (Cumulative Score for Indicator Group) |
|---|---|---|---|---|
| A | Presence of grey/brown hydrogen/ammonia storage facilities within 50 km radius | YES/NO (0/1/2 *) * counts hydrogen/ammonia separately | 0 = none 1 = ≥1 in 1 sub-group 2 = ≥1 in 2 sub-groups 3 = ≥1 in 3 sub-groups 4 = 1 in 4 sub-groups 5 = 1 in 3 sub-groups, 2 in 1 sub-group 6 = 2 in 2 sub-groups, ≥1 in 2 sub-groups |
| B | Presence of grey/brown hydrogen/ammonia plants within 50 km radius | YES/NO (0/1/2 *) * counts hydrogen/ammonia separately | ||
| C | Presence of green/blue hydrogen/ammonia plants in operation, or development within 50 km radius | YES/NO (0/1/2 *) * counts hydrogen/ ammonia separately | ||
| D | Presence of renewable energy endowments which can be used for small scale green hydrogen/ammonia production within 50 km radius—large wind power plants or tidal (over 100 MW of capacity in intermittent sources within 50 km radius) | YES/NO (0/1/2 *) * counts up to 2 types of renewable energy endowments | ||
| A | Local government policies with commitment to decarbonisation | YES/NO (0/1/2 *) * counts up to two types of policies | 0 = none 1 = ≥1 in 1 sub-group 2 = ≥1 in 2 sub-groups 3 = ≥1 in 3 sub-groups 4 = 1 in 2 sub-groups, 2 in 1 sub-group 5 = 2 in 2 sub-groups, 1 in 1 sub-group 6 = 2 in 3 sub-groups |
| B | National/devolved government policies which can uniquely favour decarbonisation in a local area | YES/NO (0/1/2 *) * counts up to two types of policies | ||
| C | Any policies which make a local area particularly favourable for hydrogen/ammonia adoption | YES/NO (0/1/2 *) * counts up to two types of policies | ||
| A | Presence of public actors with strong commitment to decarbonisation (non-shipping): policy, government, local government—within 50 km radius | YES/NO (0/1/2 *) * counts up to two actors | 0 = none 1 = ≥1 in 1 sub-group 2 = ≥1 in 2 sub-groups 3 = ≥1 in 3 sub-groups 4 = 1 in 4 sub-groups 5 = 1 in 5 sub-groups or 1 in 4 sub-groups, 2 in 1 sub-group 6 = ≥1 in 2 sub-groups, and 2 in 2 sub-groups; or ≥1 in 4 sub-groups, and 2 in 1 sub-groups; or ≥1 in 6 sub-groups |
| B | Presence of shipping actors linked to decarbonisation: ship-owners, ship charterers, bunkering suppliers, port authority, shipbuilders—within 50 km radius | YES/NO (0/1/2 *) * counts up to two actors | ||
| C | Presence of R&D actors linked to decarbonisation: engine manufacturers, research institutes, etc.—within 50 km radius | YES/NO (0/1/2 *) * counts up to two actors | ||
| D | Presence of existing hydrogen/ammonia actors—within 50 km radius | YES/NO (0/1/2 *) * counts up to two actors | ||
| E | Local shipping actors and key non-shipping actors (e.g., local government, energy, transport) involved in formal networks linked to decarbonisation—within 50 km radius | YES/NO (0/1/2 *) * counts up to two actors | ||
| F | Formal decarbonisation networks around hydrogen/ammonia—within 50 km radius | YES/NO (0/1/2 *) * counts up to two networks | ||
| A | Local demand—district heating, industry, fertilisers, large local town (i.e., public transport potential—town/city over 100,000) which can be used for any type of hydrogen/ammonia—within 50 km radius | YES/NO (0/1/2 *) * counts up to two types of demand | 0 = none 1 = ≥1 in 1 sub-group 2 = ≥1 in 2 sub-groups 3 = ≥1 in 3 sub-groups 4 = 1 in 4 sub-groups 5 = ≥1 in 4 sub-groups and 2 in sub-groups A or B; or ≥1 in 5 sub-groups 6 = ≥1 in 4 sub-groups and 2 in sub-groups A and B; or ≥1 in 5 sub-groups and 2 in sub-groups A or B; or ≥1 in 6 sub-groups |
| B | Local demand for low-carbon hydrogen ammonia in particular—within 50 km radius | YES/NO (0/1/2 *) * counts up to two types of demand | ||
| C | No gas grid in area | YES/NO (0/1) | ||
| D | Regular ferry connection within 50 km radius | YES/NO (0/1) | ||
| E | Electric grid connection of at least electricity transmission system within 5 km which has 132 kV current | YES/NO (0/1) | ||
| F | Population density— VERY HIGH (above 7 deciles, safety considerations amplified, score 0), VERY LOW (below 3 deciles, limited demand, score 0) MIDDLE density (between 3 and 7 deciles, optimal, score 1) | YES/NO (0/1) | ||
| A | Local ro-ro/ferry traffic accounting for over 20,000 t HFO+MDO sales annually (It should be noted that indicator 4D is aimed at understanding the relevance of the presence of a possible niche for the early adoption of hydrogen and ammonia through use on a possible pilot project, whereas indicator 5A aims to address the possibility of longer-term demand growth in areas where there could be scalable energy demand for the usage of hydrogen and ammonia.) | YES/NO (0/1) | 0 = none 1 = ≥1 in 1 sub-group 2 = ≥1 in 2 sub-groups 3 = ≥1 in 3 sub-groups 4 = ≥1 in 4 sub-groups 5 = ≥1 in 5 sub-groups 6 = ≥1 in 6 sub-groups |
| B | Local chemical tanker accounting for over 20,000 t HFO+MDO sales annually | YES/NO (0/1) | ||
| C | At least 20,000 t HFO+MDO sales where ships go to from same port as end port in UK | YES/NO (0/1) | ||
| D | Local cruise demand of at least 20,000 t HFO+MDO amount | YES/NO (0/1) | ||
| E | At least 20,000 t HFO+MDO sales from fishing | YES/NO (0/1) | ||
| F | Existing or previous hydrogen/ammonia vessel project (within 50 km radius) | YES/NO (0/1) |
Table A4.
List of interviewees.
Table A4.
List of interviewees.
| Interviewee | Description | Interviewee Relevance | |||
|---|---|---|---|---|---|
| Case 1 | Case 2 | Case 3 | National | ||
| Interviewee 1 | Senior port safety official | NO | YES | NO | YES |
| Interviewee 2 | Senior hydrogen representative | YES | NO | NO | YES |
| Interviewee 3 | Senior transport official | NO | NO | YES | NO |
| Interviewee 4 | Senior hydrogen technical official | YES | NO | YES | YES |
| Interviewee 5 | Senior hydrogen representative | YES | YES | YES | YES |
| Interviewee 6 | Senior port decarbonisation official | NO | YES | NO | YES |
| Interviewee 7 | Senior maritime decarbonisation official | YES | NO | NO | YES |
| Interviewee 8 | Senior shipowner representative | NO | YES | NO | NO |
| Interviewee 9 | Senior hydrogen policy official | YES | NO | NO | YES |
| Interviewee 10 | Senior shipowner representative | NO | NO | YES | NO |
| Interviewee 11 | Senior maritime civil service official | YES | YES | YES | YES |
References
- UK Government Industrial Strategy: Building a Britain Fit for the Future; UK Government; London, UK. 2018. Available online: https://www.gov.uk/government/publications/industrial-strategy-building-a-britain-fit-for-the-future (accessed on 1 August 2024).
- E4tech. UMAS Clean Maritime Clusters Research Study; E4tech: London, UK, 2020. [Google Scholar]
- Department for Transport. Department for Transport Clean Maritime Plan; Department for Transport: London, UK, 2019.
- BEIS Industrial Decarbonisation Strategy; UK Government; London, UK. 2021. Available online: https://assets.publishing.service.gov.uk/media/6051cd04e90e07527f645f1e/Industrial_Decarbonisation_Strategy_March_2021.pdf (accessed on 1 August 2024).
- Department for Energy Security and Net Zero Chris Stark to Lead Mission Control to Deliver Clean Power by 2030. Available online: https://www.gov.uk/government/news/chris-stark-to-lead-mission-control-to-deliver-clean-power-by-2030 (accessed on 29 July 2024).
- Baresic, D. Sustainability Transitions in the Maritime Transport Industry: The Case of LNG in Northern Europe; UCL: London, UK, 2020. [Google Scholar]
- Lloyd’s Register. UMAS Zero-Emission Vessels: Transition Pathways; Lloyd’s Register: London, UK, 2019. [Google Scholar]
- Robinson, C.; Bouzarovski, S.; Lindley, S. ‘Getting the Measure of Fuel Poverty’: The Geography of Fuel Poverty Indicators in England. Energy Res. Soc. Sci. 2018, 36, 79–93. [Google Scholar] [CrossRef]
- Shaw, S.; Mazzucchelli, P. Evaluating the Perspectives for Hydrogen Energy Uptake in Communities: Success Criteria and Their Application. Energy Policy 2010, 38, 5359–5371. [Google Scholar] [CrossRef]
- Johnson, C.; Hettinger, D. Geography of Existing and Potential Alternative Fuel Markets in the United States; National Renewable Energy Lab: Golden, CO, USA, 2014. [Google Scholar]
- United Nations Indicators of Sustainable Development: Guidelines and Methodologies. 2007. Available online: https://sustainabledevelopment.un.org/content/documents/guidelines.pdf (accessed on 1 August 2024).
- Zhou, P.; Ang, B.W. Indicators for Assessing Sustainability Performance. In Handbook of Performability Engineering; Springer Science & Business Media: Berlin/Heidelberg, Germany, 2008. [Google Scholar]
- Williams, S.; Robinson, J. Measuring Sustainability: An Evaluation Framework for Sustainability Transition Experiments. Environ. Sci. Policy 2020, 103, 58–66. [Google Scholar] [CrossRef]
- Walz, R.; Köhler, J. Using Lead Market Factors to Assess the Potential for a Sustainability Transition. Environ. Innov. Soc. Transit. 2014, 10, 20–41. [Google Scholar] [CrossRef]
- Fadly, D.; Fontes, F. Geographical Proximity and Renewable Energy Diffusion: An Empirical Approach. Energy Policy 2019, 129, 422–435. [Google Scholar] [CrossRef]
- Rip, A.; Kemp, R. Technological Change—Human Choice and Climate Change Vol. II, Resources and Technology. In International Encyclopedia of Human Geography; Elsevier: Amsterdam, The Netherlands, 1998. [Google Scholar]
- Geels, F.W. Technological Transitions as Evolutionary Reconfiguration Processes: A Multi-Level Perspective and a Case-Study. Res. Policy 2002, 31, 1257–1274. [Google Scholar] [CrossRef]
- Geels, F.W. The Multi-Level Perspective on Sustainability Transitions: Responses to Seven Criticisms. Environ. Innov. Soc. Transit. 2011, 1, 24–40. [Google Scholar] [CrossRef]
- Geels, F.W. Processes and Patterns in Transitions and System Innovations: Refining the Co-Evolutionary Multi-Level Perspective. Technol. Forecast. Soc. Change 2005, 72, 681–696. [Google Scholar] [CrossRef]
- Smith, A.; Raven, R. What Is Protective Space? Reconsidering Niches in Transitions to Sustainability. Res. Policy 2012, 41, 1025–1036. [Google Scholar] [CrossRef]
- Hansen, T.; Coenen, L. The Geography of Sustainability Transitions: Review, Synthesis and Reflections on an Emergent Research Field. Environ. Innov. Soc. Transit. 2015, 17, 92–109. [Google Scholar] [CrossRef]
- Boschma, R.A. Proximity and Innovation: A Critical Assessment. Reg. Stud. 2005, 39, 61–74. [Google Scholar] [CrossRef]
- Baresic, D.; Palmer, K. Climate Actions in Shipping: Progress towards Shipping’s 2030 Breakthrough; UMAS: New York, NY, USA, 2022. [Google Scholar]
- Zhang, Q.; Chen, J.; Ihara, T. Assessing Regional Variations in Hydrogen Fuel Cell Vehicle Adoption: An Integrative Approach Using Real-World Data and Analytic Hierarchy Process in Tokyo. Appl. Energy 2024, 363, 123014. [Google Scholar] [CrossRef]
- Yeh, S. An Empirical Analysis on the Adoption of Alternative Fuel Vehicles: The Case of Natural Gas Vehicles. Energy Policy 2007, 35, 5865–5875. [Google Scholar] [CrossRef]
- Petschnig, M.; Heidenreich, S.; Spieth, P. Innovative Alternatives Take Action—Investigating Determinants of Alternative Fuel Vehicle Adoption. Transp. Res. Part A Policy Pract. 2014, 61, 68–83. [Google Scholar] [CrossRef]
- Wang, Y.; Wright, L.A. A Comparative Review of Alternative Fuels for the Maritime Sector: Economic, Technology, and Policy Challenges for Clean Energy Implementation. World 2021, 2, 456–481. [Google Scholar] [CrossRef]
- Karountzos, O.; Kagkelis, G.; Kepaptsoglou, K. A Decision Support GIS Framework for Establishing Zero-Emission Maritime Networks: The Case of the Greek Coastal Shipping Network. J. Geovisualization Spat. Anal. 2023, 7, 16. [Google Scholar] [CrossRef]
- Grzelakowski, A.S.; Herdzik, J.; Skiba, S. Maritime Shipping Decarbonization: Roadmap to Meet Zero-Emission Target in Shipping as a Link in the Global Supply Chains. Energies 2022, 15, 6150. [Google Scholar] [CrossRef]
- Afif, A.; Radenahmad, N.; Cheok, Q.; Shams, S.; Kim, J.H.; Azad, A.K. Ammonia-Fed Fuel Cells: A Comprehensive Review. Renew. Sustain. Energy Rev. 2016, 60, 822–835. [Google Scholar] [CrossRef]
- Baldi, F.; Azzi, A.; Maréchal, F. From Renewable Energy to Ship Fuel: Ammonia as an Energy Vector and Mean for Energy Storage. In Computer Aided Chemical Engineering; Elsevier: Amsterdam, The Netherlands, 2019; Volume 46. [Google Scholar]
- Kim, K.; Roh, G.; Kim, W.; Chun, K. A Preliminary Study on an Alternative Ship Propulsion System Fueled by Ammonia: Environmental and Economic Assessments. J. Mar. Sci. Eng. 2020, 8, 183. [Google Scholar] [CrossRef]
- Atilhan, S.; Park, S.; El-Halwagi, M.M.; Atilhan, M.; Moore, M.; Nielsen, R.B. Green Hydrogen as an Alternative Fuel for the Shipping Industry. Curr. Opin. Chem. Eng. 2021, 31, 100668. [Google Scholar] [CrossRef]
- Van Hoecke, L.; Laffineur, L.; Campe, R.; Perreault, P.; Verbruggen, S.W.; Lenaerts, S. Challenges in the Use of Hydrogen for Maritime Applications. Energy Environ. Sci. 2021, 14, 815–843. [Google Scholar] [CrossRef]
- The Royal Society. The Royal Society Ammonia: Zero-Carbon Fertiliser, Fuel and Energy Store; The Royal Society: London, UK, 2020. [Google Scholar]
- Jackson, C.; Fothergill, K.; Gray, P.; Haroon, F.; Davenne, T.; Greenwood, S.; Huddart, A.; Makepeace, J.; Wood, T.; David, B.; et al. Ammonia to Green Hydrogen Project Feasibility Study; UK Government: London, UK, 2020.
- Hansson, J.; Brynolf, S.; Fridell, E.; Lehtveer, M. The Potential Role of Ammonia as Marine Fuel—Based on Energy Systems Modeling and Multi-Criteria Decision Analysis. Sustainability 2020, 12, 3265. [Google Scholar] [CrossRef]
- Kovač, A.; Paranos, M.; Marciuš, D. Hydrogen in Energy Transition: A Review. Int. J. Hydrogen Energy 2021, 46, 10016–10035. [Google Scholar] [CrossRef]
- Valera-Medina, A.; Xiao, H.; Owen-Jones, M.; David, W.I.F.; Bowen, P.J. Ammonia for Power. Prog. Energy Combust. Sci. 2018, 69, 63–102. [Google Scholar] [CrossRef]
- Valera-Medina, A.; Amer-Hatem, F.; Azad, A.K.; Dedoussi, I.C.; De Joannon, M.; Fernandes, R.X.; Glarborg, P.; Hashemi, H.; He, X.; Mashruk, S.; et al. Review on Ammonia as a Potential Fuel: From Synthesis to Economics. Energy Fuels 2021, 35, 6964–7029. [Google Scholar] [CrossRef]
- Kern, F. Using the Multi-Level Perspective on Socio-Technical Transitions to Assess Innovation Policy. Technol. Forecast. Soc. Change 2012, 79, 298–310. [Google Scholar] [CrossRef]
- Creswell, J.W.; Creswell, J.D. Research Design: Qualitative, Quantitative, and Mixed Methods Approaches. SAGE Publications: Los Angeles, CA, USA, 2018. [Google Scholar]
- Arksey, H.; Knight, P. Interviewing for Social Scientists; SAGE Publications: Thousand Oaks, CA, USA, 1999. [Google Scholar]
- Tansey, O. Process Tracing and Elite Interviewing: A Case for Non-probability Sampling. PS Politi-Sci. Politi 2007, 40, 765–772. [Google Scholar] [CrossRef]
- Dalkey, N.; Helmer, O. An Experimental Application of the DELPHI Method to the Use of Experts. Manag. Sci. 1963, 9, 458–467. [Google Scholar] [CrossRef]
- Pettigrew, A.M. Longitudinal Field Research on Change: Theory and Practice. Organ. Sci. 1990, 1, 267–292. [Google Scholar] [CrossRef]
- Feigenbaum, K. Case Study Research: Design and Methods. Gastroenterol. Nurs. 1995, 18, 54–56. [Google Scholar] [CrossRef]
- Flyvbjerg, B. Five Misunderstandings About Case-Study Research. Qual. Inq. 2006, 12, 219–245. [Google Scholar] [CrossRef]
- Gerring, J.; Cojocaru, L. Case-Selection: A Diversity of Methods and Criteria. Sociol. Methods Res. 2016, 45, 392–423. [Google Scholar] [CrossRef]
- Zhao, G.; Nielsen, E.R.; Troncoso, E.; Hyde, K.; Romeo, J.S.; Diderich, M. Life Cycle Cost Analysis: A Case Study of Hydrogen Energy Application on the Orkney Islands. Int. J. Hydrogen Energy 2019, 44, 9517–9528. [Google Scholar] [CrossRef]
- Westrom, M. Winds of Change: Legitimacy, Withdrawal, and Interdependency from a Decentralized Wind-to-Hydrogen Regime in Orkney, Scotland. Energy Res. Soc. Sci. 2020, 60, 101332. [Google Scholar] [CrossRef]
- Orkney Renewable Energy Forum (OREF). OREF Orkney Hydrogen Strategy, The Hydrogen Islands 2019–2025. Orkney Renewable Energy Forum (OREF): Kirkwall, UK, 2019. [Google Scholar]
- The Maritime Executive. Vero Beach 13 September 2017; The Maritime Executive: Vero Beach, FL, USA, 2017. [Google Scholar]
- Sustainable Development Commission. Sustainable Development Commission Turning the Tide, Tidal Power in the UK; Sustainable Development Commission: London, UK, 2007. [Google Scholar]
- Orkney Islands Council £28.5m ReFLEX Orkney Project to Create a ‘smart Energy Island’. Available online: https://www.orkney.gov.uk/latest-news/285m-reflex-orkney-project-to-create-a-smart-energy-island/ (accessed on 29 August 2024).
- Hammars Hill Energy Hammars Hill and Eneus Energy confirms Orkney Islands for first Green Ammonia Project. Available online: https://hammarshillenergy.co.uk/type-news/press-release/ (accessed on 29 August 2024).
- Orkney Islands Council. The Orkney Hydrogen Economic Strategy; Orkney Islands Council: Kirkwall, UK, 2019.
- Scottish Government Local Energy Policy Statement. Available online: https://www.gov.scot/publications/local-energy-policy-statement/ (accessed on 30 July 2024).
- UK Government. Clean Growth Strategy; UK Government: London, UK, 2017.
- UK Government Clean Air Strategy; UK Government: London, UK. 2019. Available online: https://assets.publishing.service.gov.uk/media/5c3b9debe5274a70c19d905c/clean-air-strategy-2019.pdf (accessed on 1 August 2024).
- DEFRA. A Green Future: Our 25 Year Plan to Improve the Environment; DEFRA: London, UK, 2018. [Google Scholar]
- Community Energy Scotland Surf “n” Turf. Available online: https://communityenergyscotland.org.uk/projects/surf-n-turf/ (accessed on 29 July 2024).
- OREF Wind. Available online: https://www.oref.co.uk/orkneys-energy-1/wind/ (accessed on 29 July 2024).
- Companies House Orkney Hydrogen Trading LTD. Available online: https://find-and-update.company-information.service.gov.uk/company/SC516545 (accessed on 29 July 2024).
- Department for Business, Energy & Industrial Strategy. Opportunity Areas for District Heating Networks in the UK, National Comprehensive Assessment of the Potential for Efficient Heating and Cooling; Department for Business, Energy & Industrial Strategy: London, UK, 2021.
- Orkney Islands Council Big Hit. Available online: https://www.orkney.gov.uk/Service-Directory/Renewable/big-hit.htm (accessed on 29 July 2024).
- HySeas III The Project. Available online: https://www.hyseas3.eu/the-project/ (accessed on 29 July 2024).
- Mayor of London Cleaner Buses. Available online: https://www.london.gov.uk/programmes-and-strategies/environment-and-climate-change/pollution-and-air-quality/cleaner-buses (accessed on 29 July 2024).
- UNIPER Grain. Available online: https://www.uniper.energy/united-kingdom/power-plants-in-the-united-kingdom/grain (accessed on 29 July 2024).
- National Gas Transmission Project Cavendish, NIA_NGGT0143. Available online: https://smarter.energynetworks.org/projects/nia_nggt0143 (accessed on 29 July 2024).
- ExxonMobil Fawley Refinery and Petrochemical Plant. Available online: https://www.exxonmobil-fawley.co.uk/epub2/files/basic-html/page6.html (accessed on 29 July 2024).
- ExxonMobil Fawley Complex. Available online: https://www.exxonmobil.co.uk/community-engagement/key-locations/fawley-operations (accessed on 29 July 2024).
- Ridge Clean Energy Sunny Oaks Renewable Energy Park. Available online: https://www.ridgecleanenergy.com/project/sunny-oaks-renewable-energy-park/ (accessed on 29 July 2024).
- Department for Transport ZEBRA. Available online: https://www.gov.uk/government/publications/zero-emission-bus-regional-areas-zebra-scheme-funding-amounts#:~:text=Funding%20amounts%20for%20local%20transport,emission%20buses%20and%20associated%20infrastructure (accessed on 30 July 2024).
- H2 View. The approval issue facing hydrogen in maritime. Available online: https://www.h2-view.com/story/the-approval-issue-facing-hydrogen-in-maritime/ (accessed on 29 August 2024).
Disclaimer/Publisher’s Note: The statements, opinions and data contained in all publications are solely those of the individual author(s) and contributor(s) and not of MDPI and/or the editor(s). MDPI and/or the editor(s) disclaim responsibility for any injury to people or property resulting from any ideas, methods, instructions or products referred to in the content. |
© 2024 by the authors. Licensee MDPI, Basel, Switzerland. This article is an open access article distributed under the terms and conditions of the Creative Commons Attribution (CC BY) license (https://creativecommons.org/licenses/by/4.0/).